Article

The Physical Characterization and Terminal Velocities of Aluminium, Iron and Plastic Bottle Caps in a Water Environment

by
Alexander A. Nikolaev
Department of Mineral Processing and Technogenic Raw Materials, National University of Science and Technology “MISiS”, 4 Leninsky Prospect, 119991 Moscow, Russia
Recycling 2022, 7(3), 28; https://doi.org/10.3390/recycling7030028
Submission received: 24 March 2022 / Revised: 18 April 2022 / Accepted: 19 April 2022 / Published: 22 April 2022
(This article belongs to the Special Issue Feature Papers in Recycling 2021)

Abstract

:
Aluminium, iron and plastic are materials which are extensively used at both industry and individual levels. However, significant amounts of aluminium, iron and plastic end up in the environment. Specifically, bottle caps made of these materials are often thrown away, with or without bottles, and appear among the common plastic debris entering the world’s oceans and beaches. More than 20 million bottle caps and lids have been identified during beach-cleaning campaigns over the last 30 years. To recover bottle caps from the shores, conventional technologies can be used. In this paper, the physical properties of used metal and plastic bottle caps were examined and related to the settling and rising velocities of the caps, as well as their drag coefficients and hydrodynamic modes in water environments, with respect to gravity separation. The sample contained aluminium, iron, high-density polyethylene (HDPE), low-density polyethylene (LDPE), and polypropylene (PP) bottle caps. The findings revealed that the density differences between the bottle caps resulted in the terminal settling velocities of aluminium and iron particles, which were significantly higher than the rising velocities of the plastic caps. The results allowed us to design a flowsheet for bottle cap recovery from beach coasts in order to reduce environmental impact and produce add-on plastic and metal products.

1. Introduction

Aluminium, iron and plastic are materials which are extensively used at both industry and individual levels [1,2]. Although iron and aluminium are known as metals for alloy production with a variety of applications (construction, electronics, transportation, etc.), they appear with plastic in a number of consumer goods. In particular, the materials are used to produce bottle caps, which seal glass or plastic bottles filled with either drinking liquids (soft drinks, beverages) or nondrinking liquids (water, oil, medical liquids, cosmetics, process fluids, etc.). Globally, a substantial increase in demand for bottled goods has resulted in a significant growth in bottle production rates and the consumption of aluminium, steel and plastics [3,4].
Meanwhile, there is a lack of primary aluminium and iron production due to the exhaustion of mineral deposits and a reduced amount of metals available from ores, which increases production costs. Furthermore, the world demand for aluminium, iron and plastic exceeds their production rates, resulting in a shortage of these materials across the world which could potentially lead to a deficit of these materials in the future [5]. Therefore, the production of aluminium, iron and plastic from secondary raw materials is a positive sustainable development option. The process is beneficial from both an economic and environmental point of view [6,7,8,9,10,11].
Despite this, a significant amount of aluminium, iron and plastic end up in landfills, waste-water streams, and the environment. For example, the bottle caps made of these materials are often thrown away with or without bottles, appearing in mixed garbage, seawater, and on beaches. This is due to insufficient waste management and processing technologies. Specifically, Jiang et al. [12] underline that bottle cap recycling rates vary significantly from 20% (USA) and 40% (Europe) to around 90% (Japan). Low rates of bottle cap recycling lead to water pollution with waste. Globally, more than 20 million bottle caps and lids have been identified during beach-cleaning campaigns over the last 30 years. However, the precise number of caps entering oceans and washing up on shore is hard to estimate [13]. Bottle caps are among common plastic debris entering the oceans and beaches [14,15,16,17]. The annual increase in plastic cap marine debris ranges from 1800–4800 t in 2020 to an estimated 2900–8100 t in 2025 [14]. Thus, bottle cap recovery is desperately required.
Typically, the extraction of plastic and metals from mixed waste begins with the sorting and separation of the particles of interest before melting scrap or extruding the used plastic [18,19,20,21].
Gravity concentration and optical sorting are essential technologies in the processing of secondary raw materials [22,23,24,25,26,27]. However, optic sorting is a complex process requiring sophisticated and precise industrial apparatus, which are rather expensive. This process requires feed preparation and waste material pre-treatment (washing, cleaning the surface, dewatering). Moreover, metal and plastic caps with clean surfaces can be coloured similarly and marked with similar company labels during their production, leading to difficulties in optical sorting.
Apart from optical sorting, gravity concentration is characterized by its simple, highly efficient and eco-friendly nature. It requires relatively basic equipment of high productivity. Gravity concentration is commonly used in a variety of processes (mineral processing, waste recycling, construction, food production), as it utilizes differences in the physical properties of separated particles (density, size, etc.) [23,25,26,27]. These properties affect the behaviour, trajectories and velocities of the particles immersed in the medium, which in most cases is water. In general, if the density of the particle is higher than that of the water, the particle sinks to the bottom; otherwise, the particle floats to the water–air interface at the top of the sink–float separator.
The shape of the particles also affects their settling velocities and drag coefficients. Recently, a number of studies have been introduced to investigate particles settling in liquids of interest for spherical [28,29,30,31,32,33,34,35] and non-spherical [34,36,37,38,39,40,41,42,43,44] particles.
Although the rising velocities of bubbles and liquid drops have been thoroughly examined [45,46,47,48,49], there is a scarcity of data regarding solid particle rising in liquids. Moreover, there is no information on the drag coefficients of the bottle caps settling or rising in the water. Hence, the reasons for insufficient effectiveness of gravity separation of the particles are still addressed. Measuring the settling and rising velocities of particles in a water environment is important to achieve high separation efficiency. Moreover, research should be undertaken to analyse the physical properties of bottle caps and relate them to the drag coefficients and velocities.
In this paper, the physical properties of metal and plastic bottle caps were examined against their settling and rising velocities, as well as their drag coefficients and hydrodynamic modes in relation to their gravity separation from sand shores.

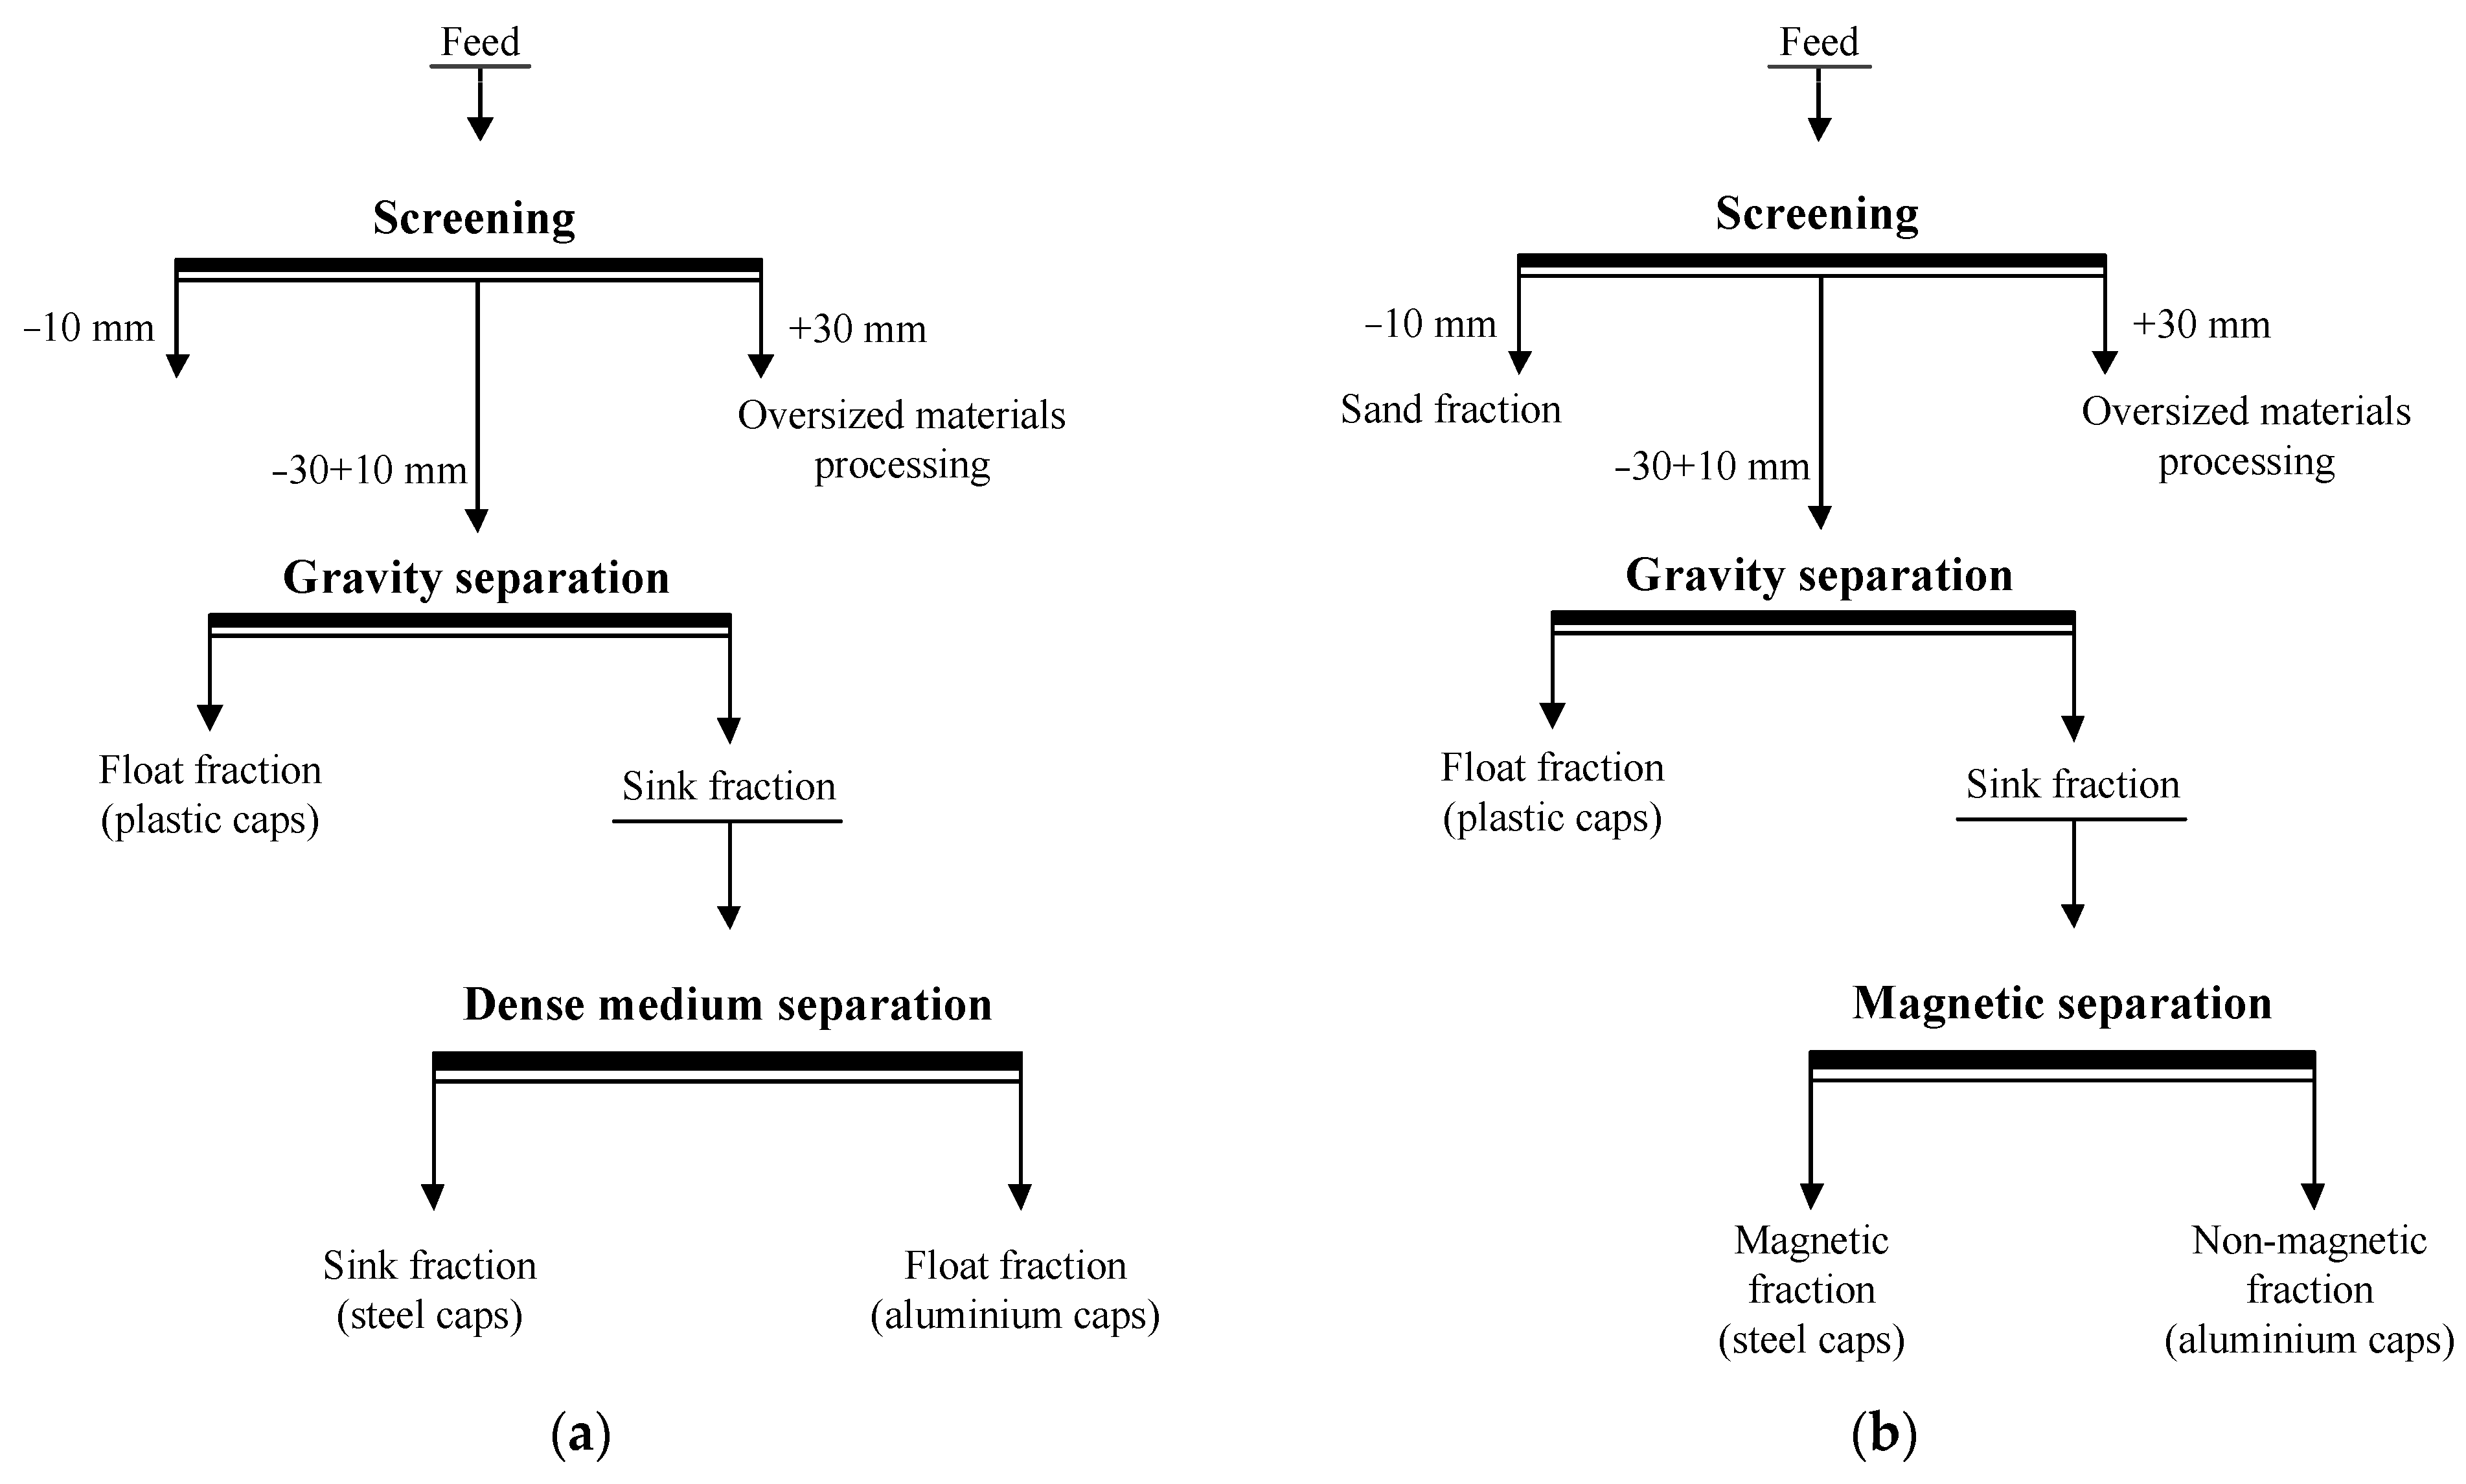
2. Materials and Methods

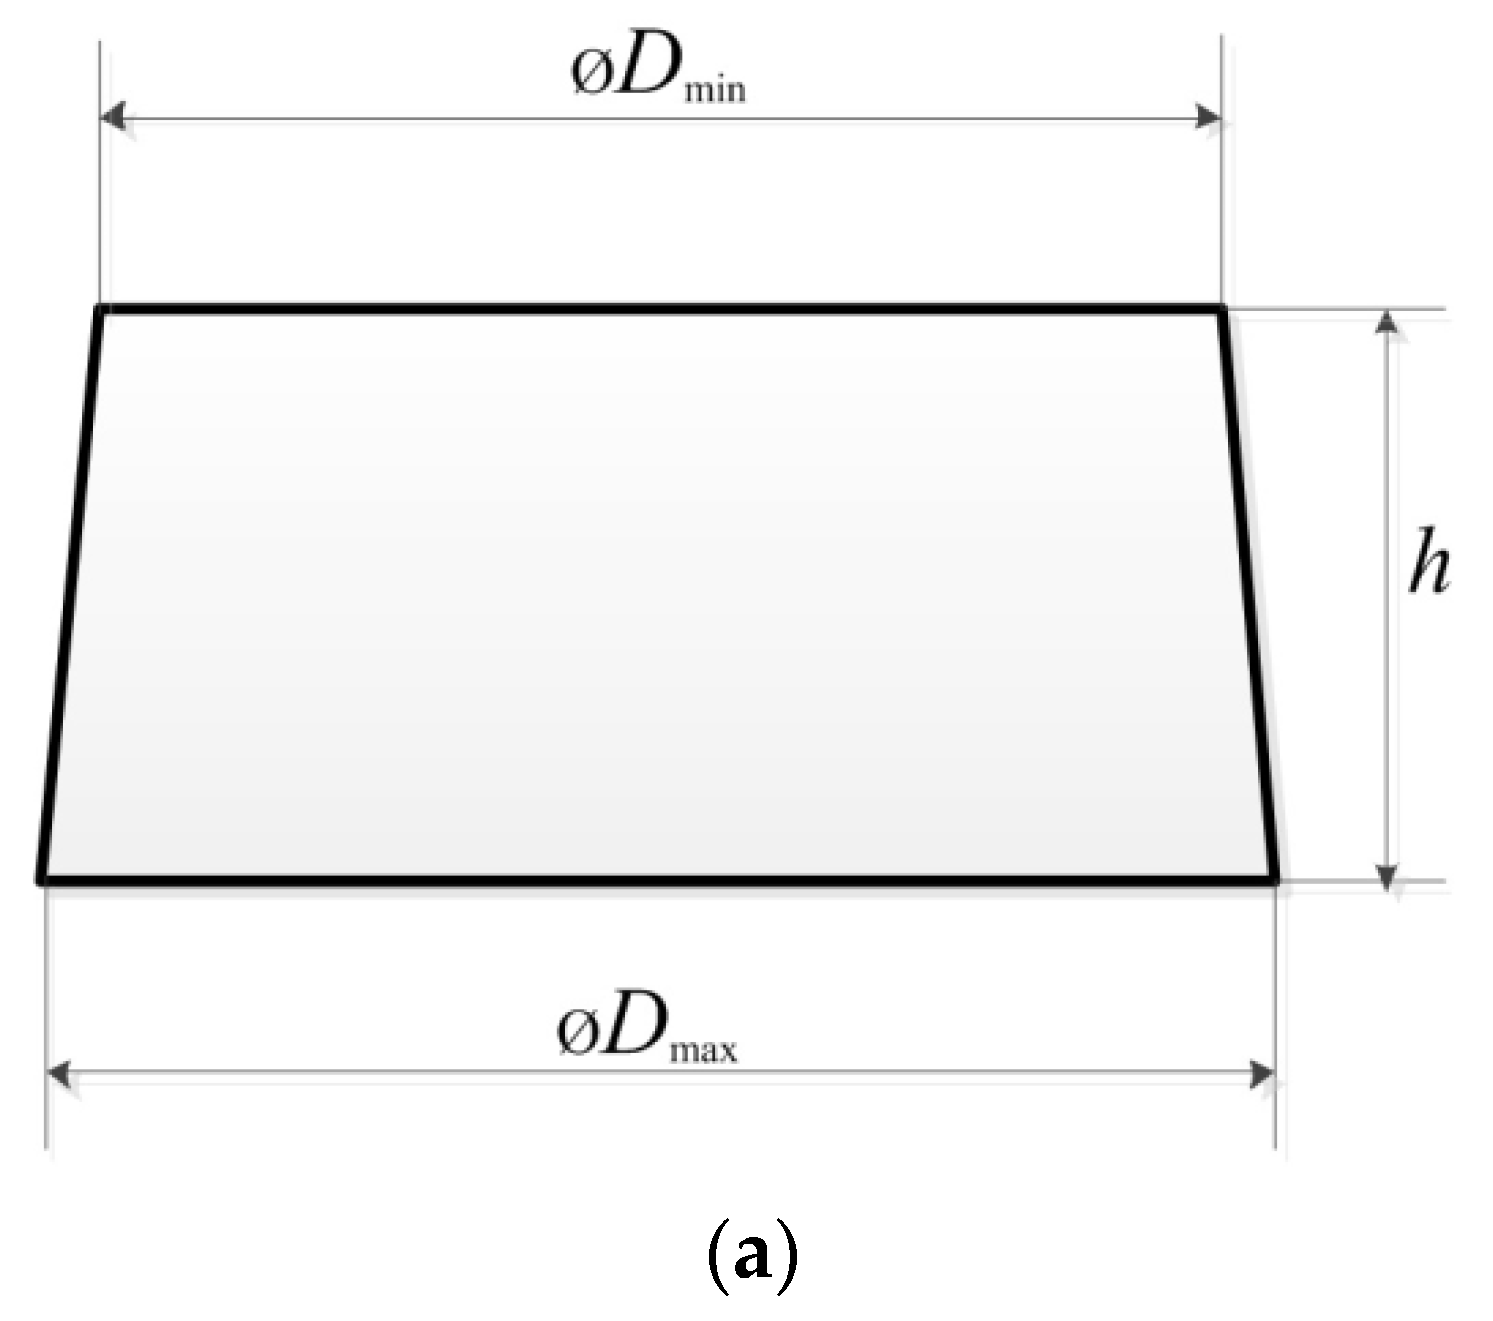
2.1. Physical Properties Measurements Techniques

Metal and plastic screw bottle caps were investigated, as these are commonly used by industries and individuals. Prior to the study, all the caps were manually measured to obtain their diameters and heights.
Archimedes’ principle was used to measure the density of each bottle cap (particle) by means of analytical balance with ViBRA AF 225DRCE (Shinco Denshi Co. Ltd., Tokyo Japan) [50,51]. The particle was sequentially weighed in air and water with an accuracy of 0.1 mg, and then the density of the particle was calculated as follows [50,51]:
ρ p = W a W a W w ρ w ,
where Wa is the weight of the particle in the air, Ww is the weight of the particle in the water, and ρw is the density of the water. For the particles whose densities were less than water, the additional weight loads were added to achieve plunging the particles into the water to the bottom of the cell, and to make it possible to measure the volume and calculate the density of the particle.

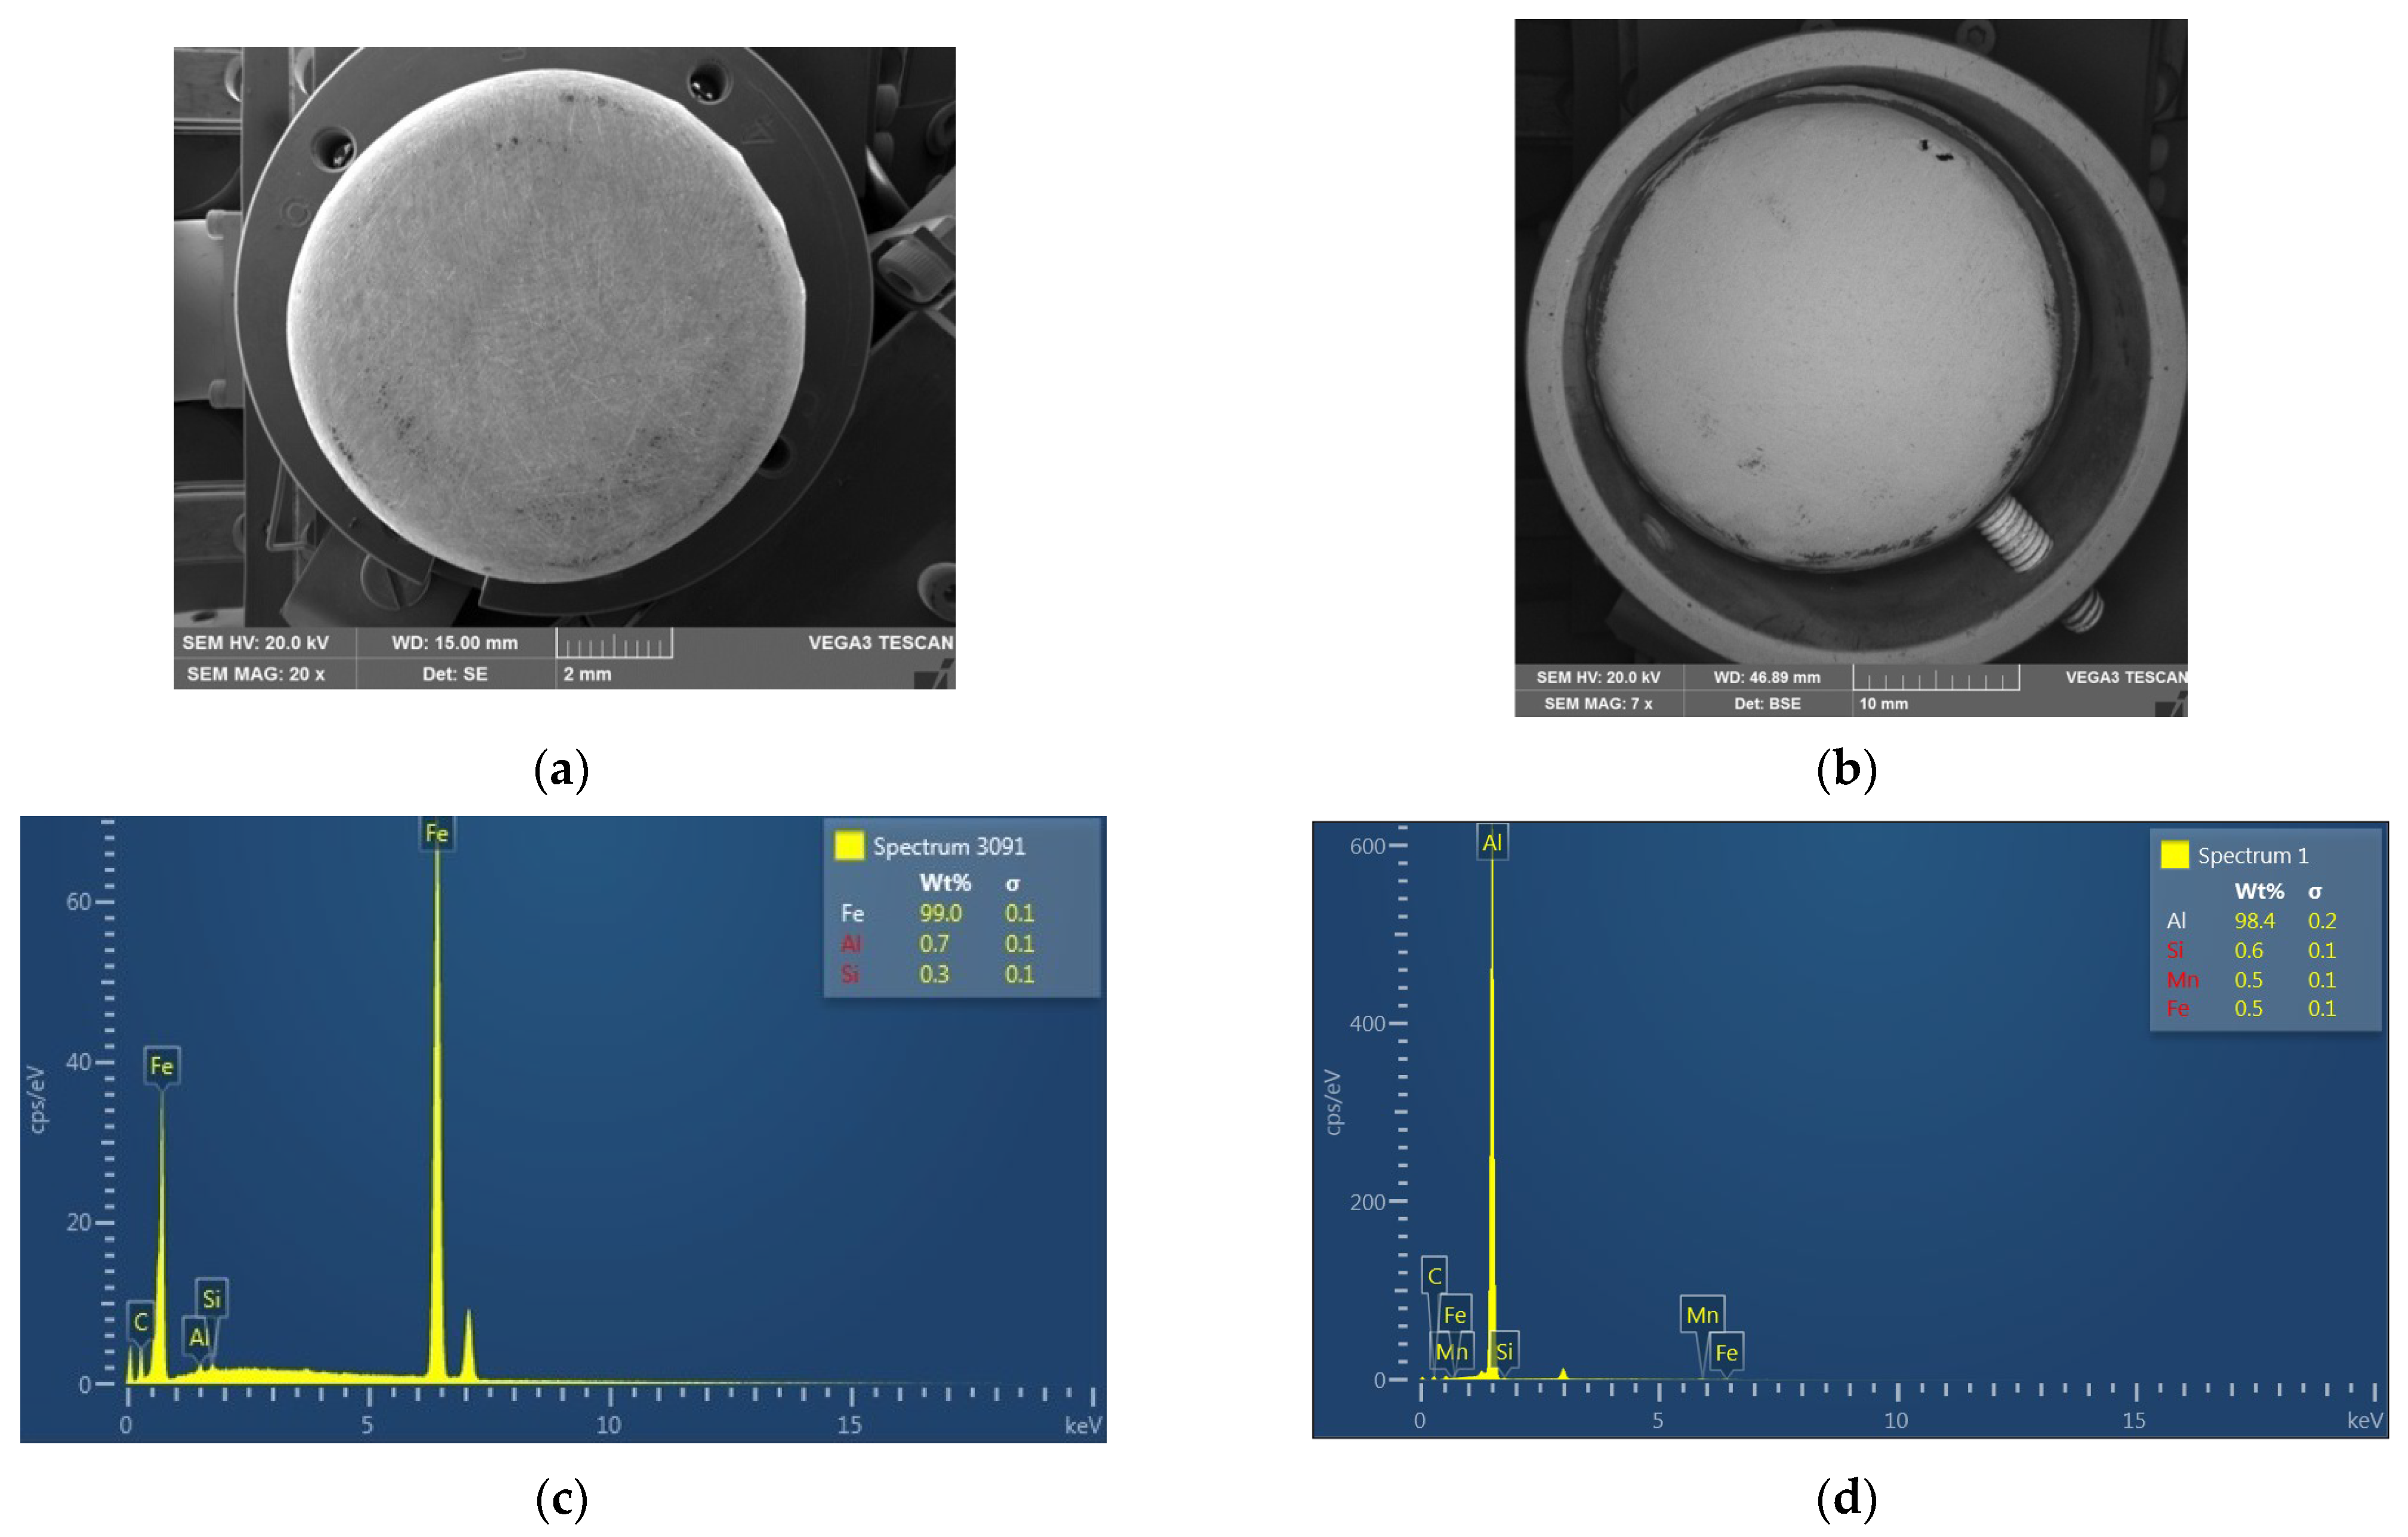
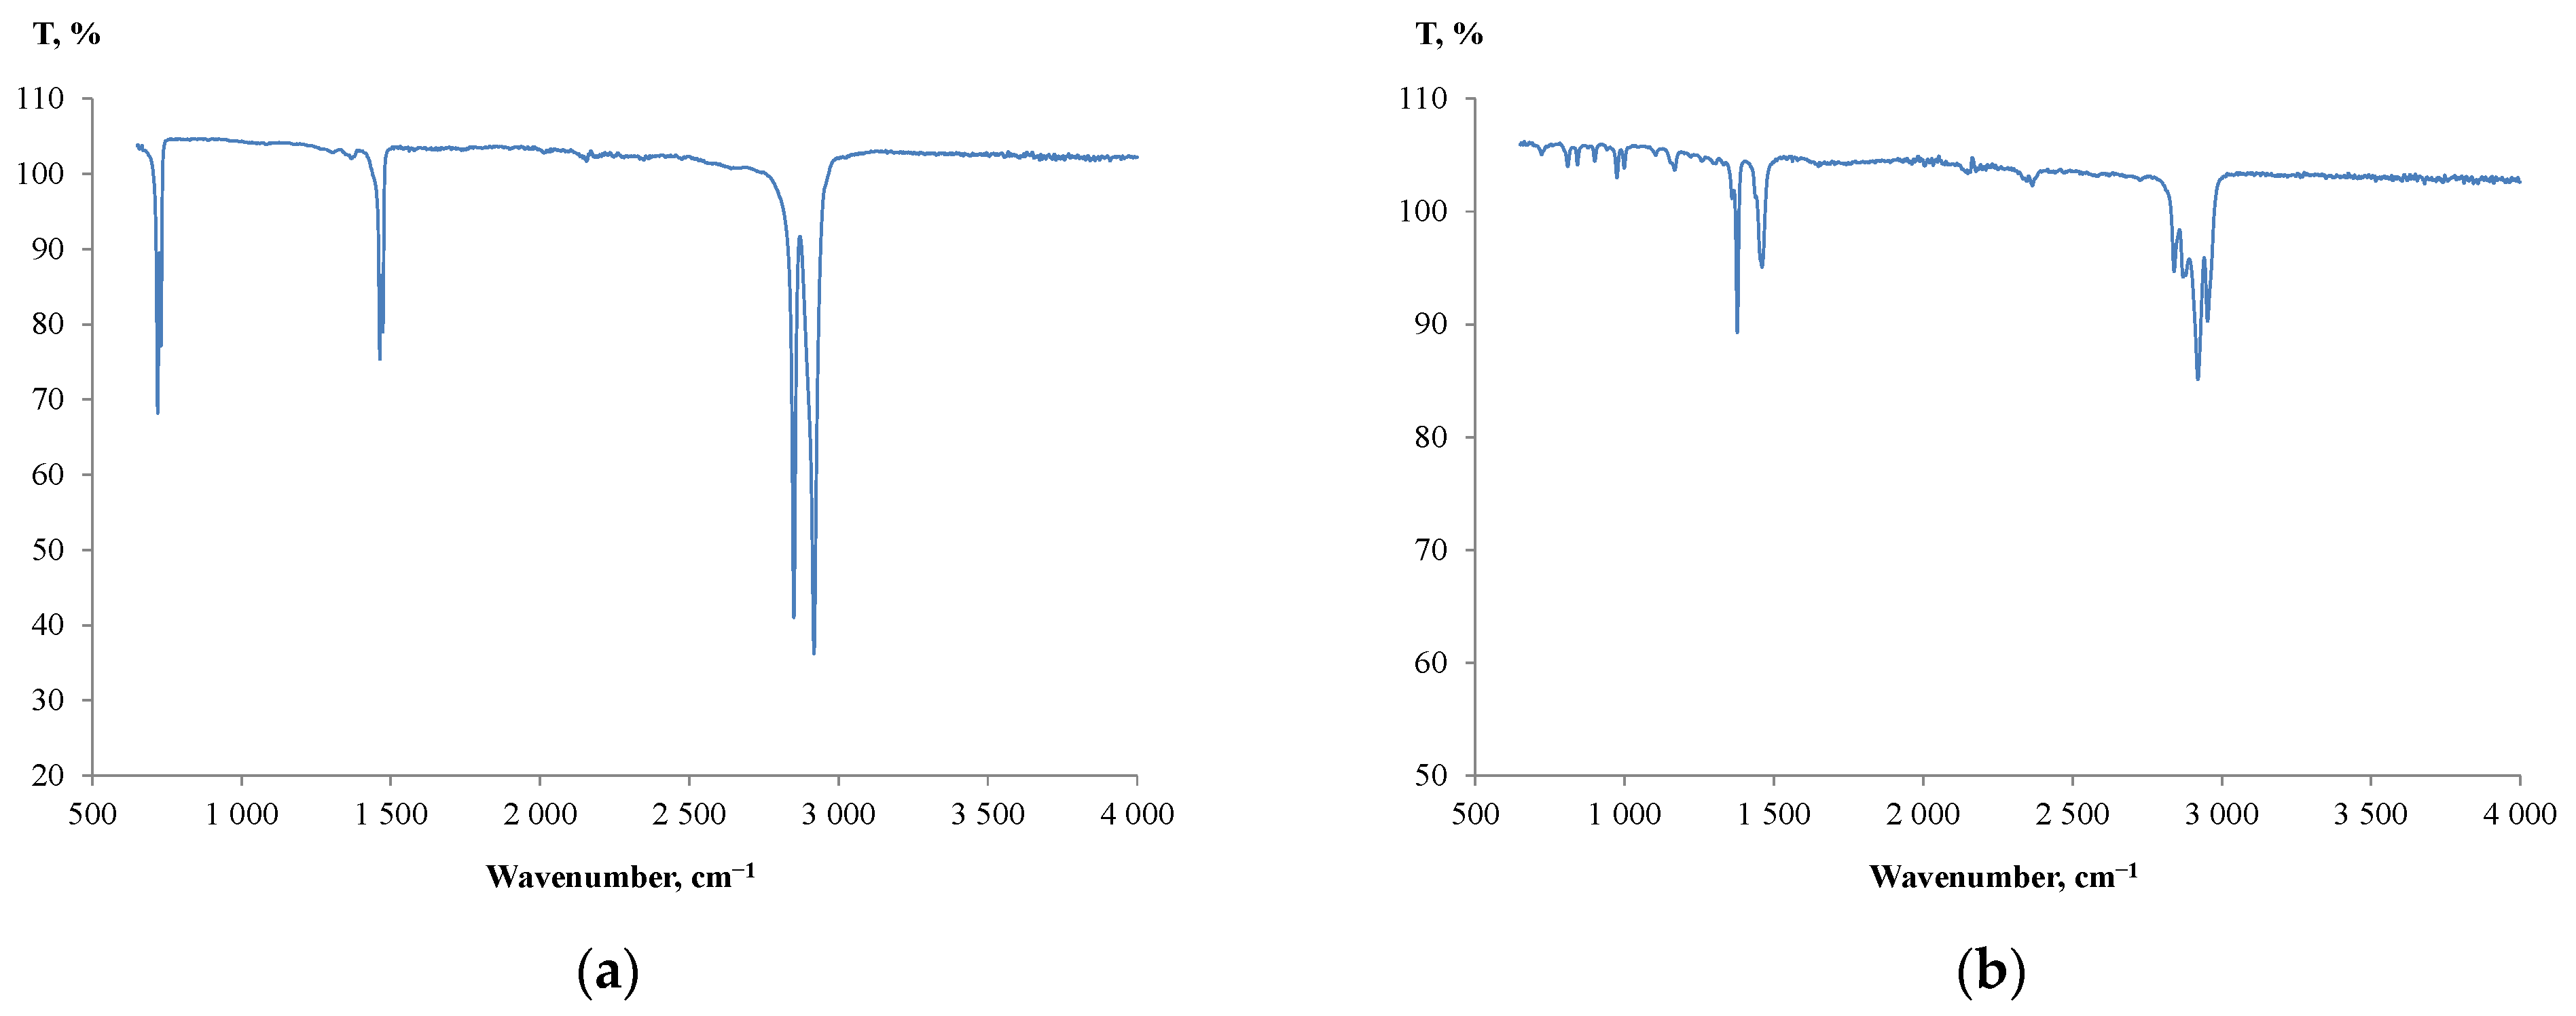
2.2. SEM Analysis and FTIR Spectroscopy

An elemental composition of metal particles was analysed by means of a scanning electron microscope (SEM) VEGA3 (TESCAN, Brno, Czech Republic) [52,53]. Prior to SEM analysis, the metal particles were treated with sandpaper to remove any paint and plastic coatings from the surface of the particles.
Fourier transform infrared spectroscopy (FTIR) was used to identify the type of plastic particles used [54]. The particles were ground and then the powder samples were analysed by means of a FTIR spectrometer Nicolet 380 (Thermo Fisher Scientific Inc., Waltham, MA, USA).

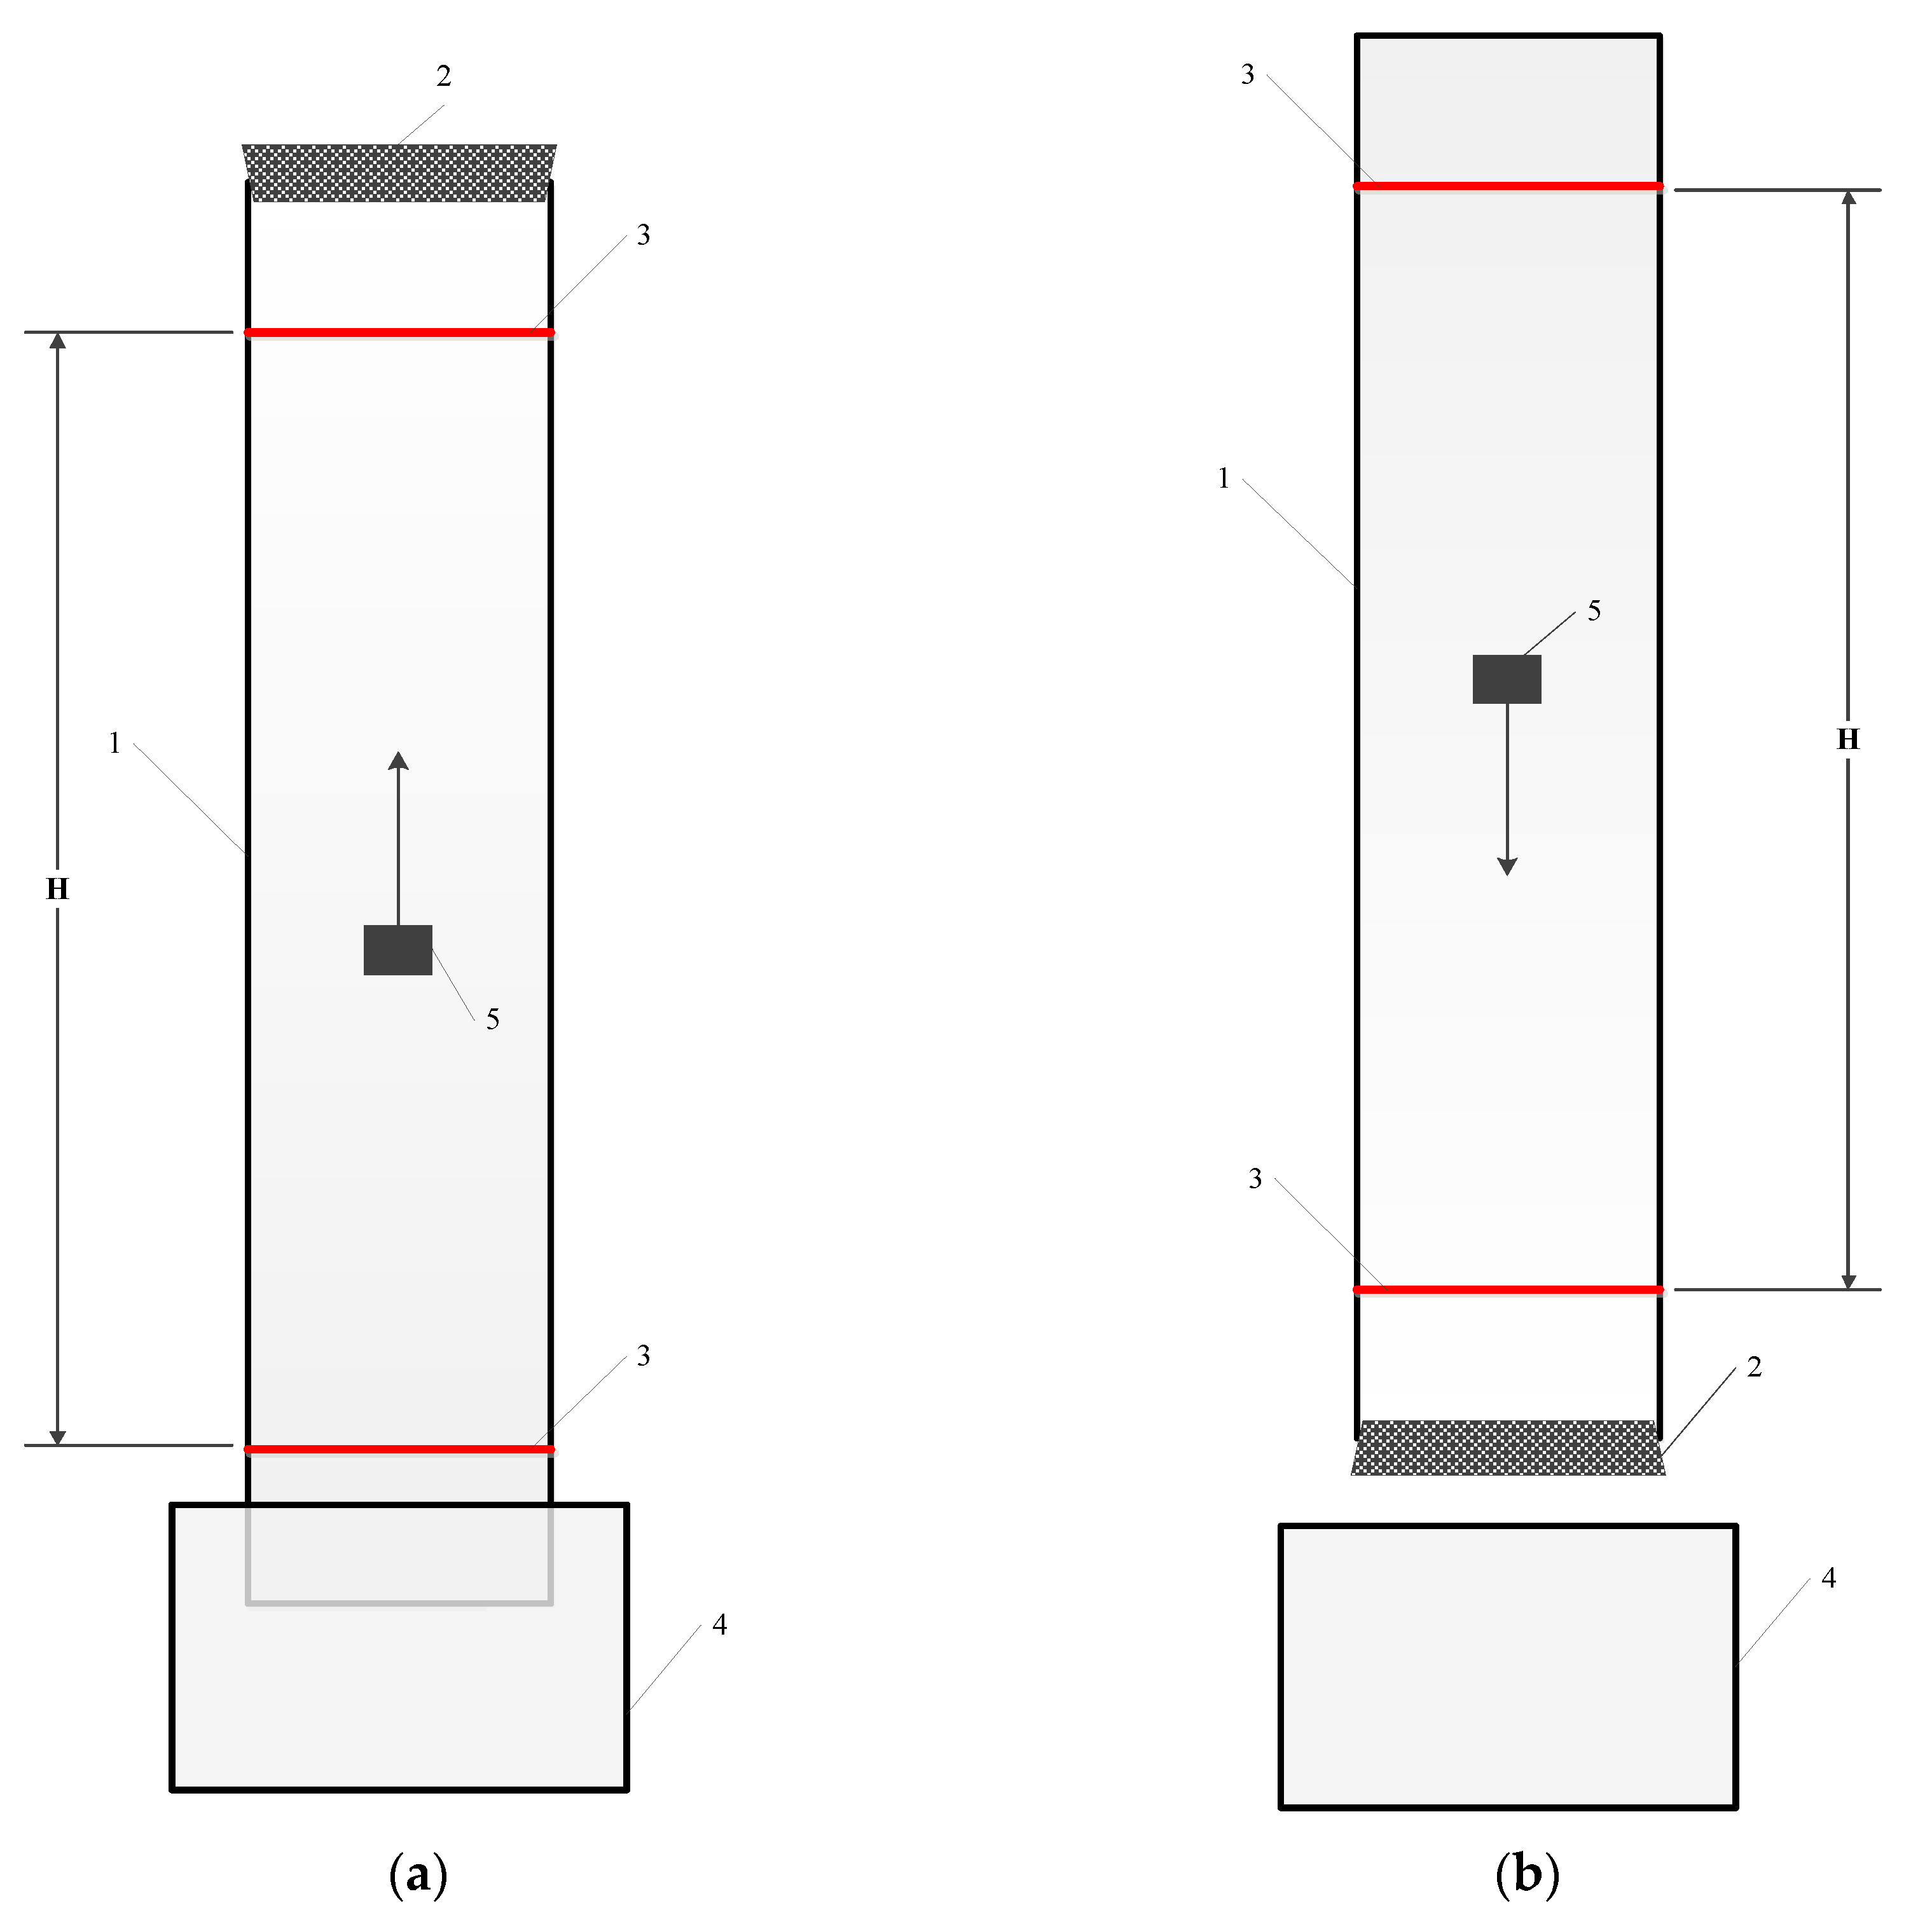
2.3. Settling and Rising Tests

Particle settling and rising tests were performed in a cylindrical glass column which was installed vertically. Figure 1 shows a sketch of the glass column.
The inner diameter of the column was 5.5 cm. Two horizontal stripes were marked on the outside of the column, with one on the top end and the other one on the bottom side of the column to monitor the settling/rising points at the beginning and end of each test. The procedure for the particle settling tests was as follows: the lower end of the column was plugged with a rubber stopper, and then water was poured into the column to the upper edge of the column. The particle was immersed in the water from the upside of the column, and then allowed to settle due to gravity. Settling time was measured as the time required for the particle to settle from the upper to the lower stripe. The technique for the particle rising tests was similar; however, the upper end of the column was plugged with the stopper, while the lower end of the column was immersed in the tank filled with water. The particle was introduced through the lower end of the column and then the free rising of the particle was studied. Particle rising time was measured as the time required for the particle to ascent from the lower to the upper stripe. In each test, the particle was soaked in water for 5 min to achieve sufficient contact of the particle with the water, and then placed in the centre of the lower or upper part of the column. Following this, the particle moved along the central line of the column to prevent particle and wall contact, the so-called “wall effect”.

3. Results and Discussion

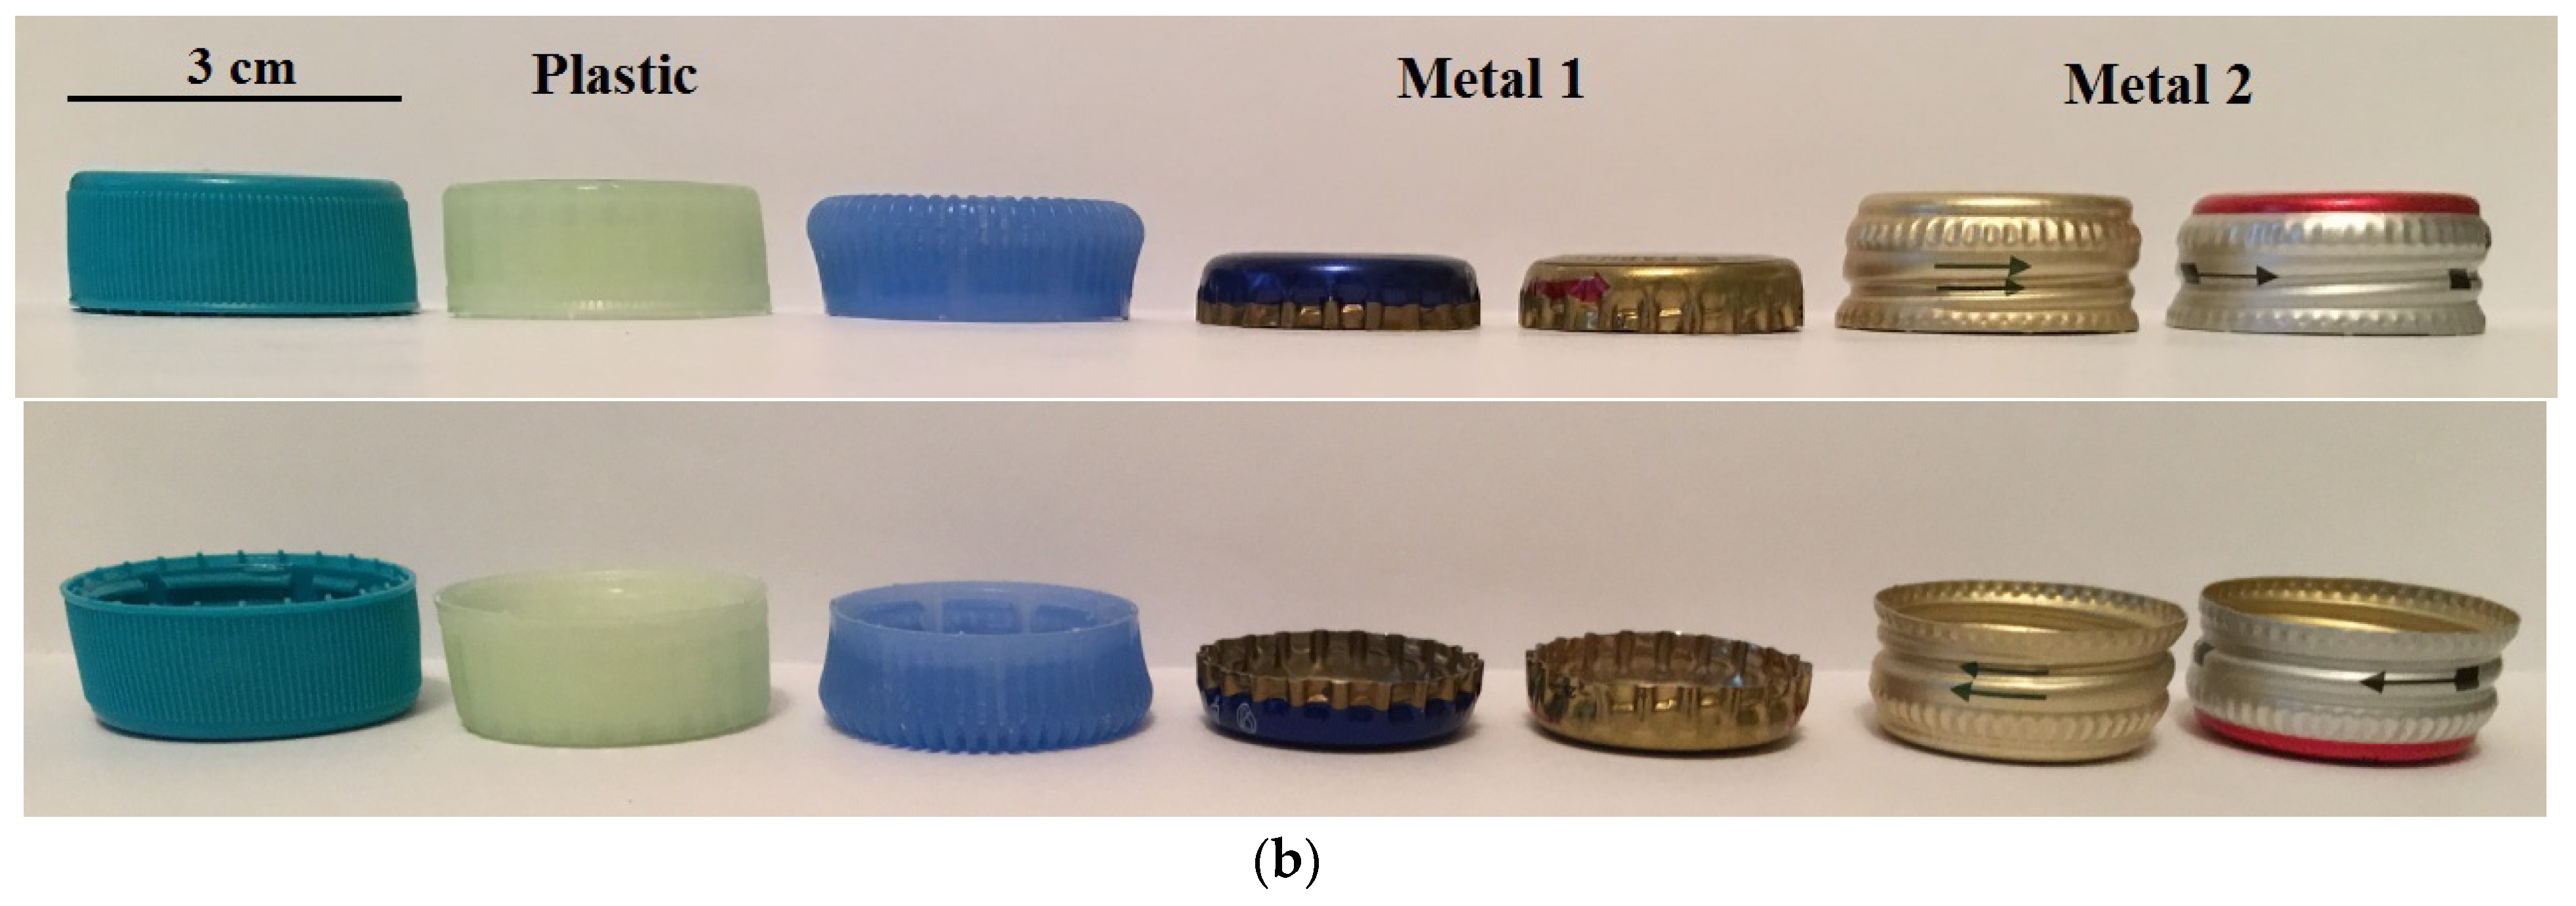
3.1. Physical Characteristics of the Particles

Figure 2 displays a simplified sketch of the side view of a particle, with examples of the particles used in this study.
Our observations revealed that the plastic and metal particles had appearances as shown in Figure 2a. However, some plastic particles had an untypical shape, as shown in Figure 2b (third from the left). In order to assess the particle size and shape, the mean diameter of each particle (dm) and the diameter to height ratio (r) were calculated as follows:
d m = D min + D max + h 3 ,
where Dmin and Dmax are the minimum and maximum diameters of each particle, and h is the height of the particle. The aspect ratio of each particle was calculated as the maximum diameter of the particle divided by its height:
r = D max h ,
The physical characteristics of the particles are summarized in Table 1.
In general, the mean diameters of the plastic and metal particles were similar and within the range of 1.9–2.43 cm. The maximum diameter of the plastic particles was between 2.3 cm and 3.1 cm, while for the particles of Metal 1 and 2 this value was about 2.8 cm and 2.5 cm, respectively. Meanwhile, there was a difference in the aspect ratio of the particles. For the plastic particles, the aspect ratio was between 1.8 and 2.8; for Metal 1 particles this increased to 4.7, which was significantly higher than for Metal 2 and plastic particles. Moreover, the plastic particles and the particles of Metal 2 exhibited predominant cylindrical shapes with rare stripes, and had a similar aspect ratio.
The findings revealed a non-sphericity of the metal and plastic particles. Recent studies have introduced a number of factors describing the non-sphericity of particles and methods to estimate their size [34,36,37]. Among these, the equivalent diameter (de) is commonly used to characterize the size of non-spherical particles. The equivalent diameter is determined as the diameter of a sphere of the same volume as the particle of interest:
d e = ( 6 V π ) 1 3 ,
where V is the volume of the particle, which can be measured experimentally or calculated as the mass of the particle divided by its density. The masses and densities of the particles were measured experimentally, as stated in Section 2.1.
Further calculations of equivalent diameters were made based on experimentally measured volumes of plastic and metal particles. The equivalent diameters of plastic particles were in the range of 1.29–1.75 cm, while Metal 1 and 2 particles exhibited de values of about 1.0 and 1.03–1.14 cm. Hence, the equivalent diameters of the plastic particles were higher than the metal particles.
Moreover, the studies showed differences between the equivalent and mean diameter values. In general, the mean diameters of the particles were higher than the equivalent diameters. More specifically, the mean diameters of plastic particles were 1.3–1.6 times higher compared to the equivalent diameters. A slight increase in dm/de ratio was observed for the metal particles, which ranged from 1.9 to 2.1.
Our observations showed that the density of the plastic particles was between 0.61 and 0.95 g/cm3, while Metal 1 particles demonstrated a density up to 4.43 g/cm3, which was 4.6 and 7.2 times higher than that of the plastic particles. The density of Metal 2 particles was 1.67–1.97 g/cm3, which was more than two times less than the Metal 1 particles, and double the plastic particles.
To further understand the reasons for the differences in the densities of the metal particles, SEM analysis was carried out. Figure 3 demonstrates the SEM images and the elemental compositions of the metal particles.
The elemental composition of the metal particles revealed two types of metals. Metal 1 particles were made of iron (99.0%) with slight additives of aluminium (0.7%) and silicon (0.3%), while Metal 2 particles were composed of aluminium (98.4%), silicon (0.6%), manganese (0.5%), and iron (0.5%). Apparently, the identification of Si in the caps can be attributed to the treatment of the caps with sandpaper. The results were consistent with the previously measured densities of the metal particles. However, the metal caps had inside plastic coatings, which reduced the densities of the particles as compared to those of pure aluminium (2.7 g/cm3) and iron (5.0 g/cm3).
As for the plastic particles, a predominant number of them used in the study were marked with a ‘2’ universal recycling symbol. This means that they were produced of high-density polyethylene (HDPE). Moreover, for unmarked particles, further FTIR analysis was carried out to identify the particle composition. Figure 4 shows the IR spectra produced from the unmarked particles.
A small absorption band at 1377 cm−1 (Figure 4a) indicated that a majority of unmarked particles were produced from low-density polyethylene (LDPE) [54,55], and a few were made of polypropylene (PP) (Figure 4b). The results of plastic identification and the measured densities of the particles were consistent with the literature data for HDPE (0.940–0.970 g/cm3), LDPE (0.910–0.940 g/cm3) and PP (0.89–0.92 g/cm3) [56].
To summarise, the bottle caps were of irregular shape with differences in density. The densities of the plastic particles were lower than water (1.0 g/cm3), while the densities of the iron and aluminium particles were significantly higher than that of water. Following the physical characteristics of the particles, the plastic particles can float in a water environment, while the metal ones settle. Moreover, having three different types of particle (plastic, aluminium and iron) enabled us to evaluate the role of different particle characteristics such as density, size and shape. Hence, further studies are required to analyse the behaviour of particles in media and to measure the velocities of particles rising or settling in a water environment.

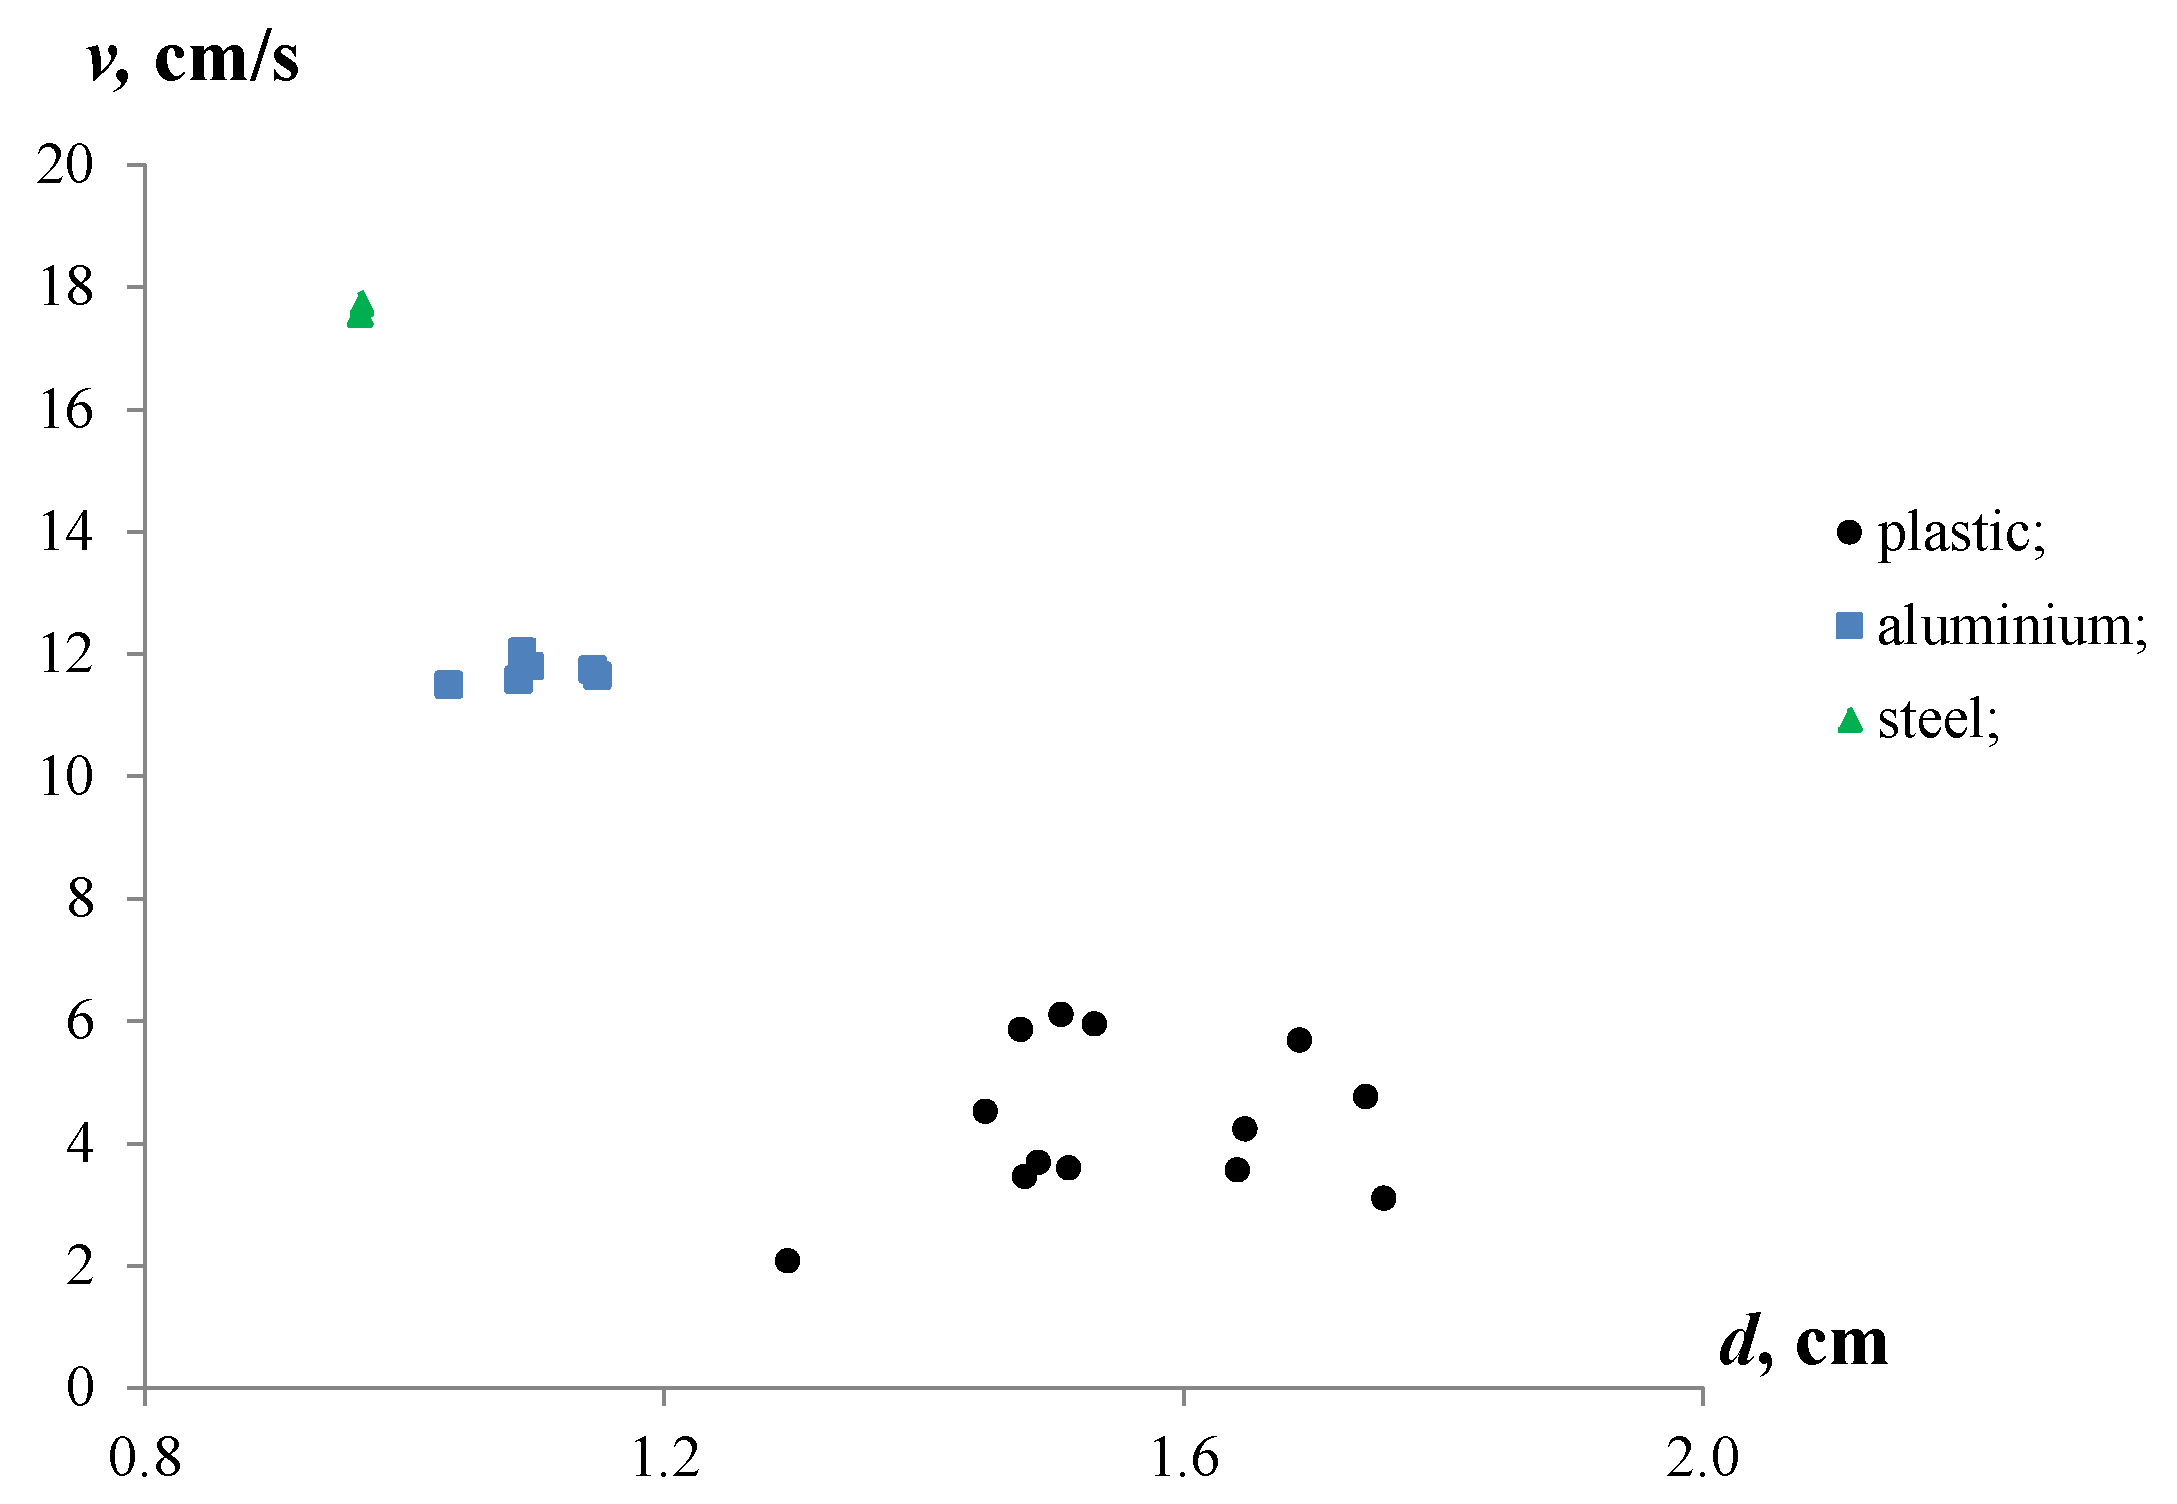
3.2. Particle Settling Velocity

The downward force of gravity acting on a particle is defined as follows:
F G = m g = ρ p V g = π d e 3 6 ρ p g ,
where m and V are the mass and the volume of the particle; g is the gravity acceleration; and ρp is the density of the particle.
The particle is also affected by the upward buoyancy force of Archimedes:
F A r = ρ l V g = π d e 3 6 ρ l g ,
where ρl is the density of the liquid in which the particle is immersed.
Furthermore, the settling particle experiences a drag force from the liquid due to the viscosity and pressure gradient [57]:
F D = ψ v 2 d e 2 ρ l ,
where ψ is the drag coefficient.
The force balance for the settling particle implies that:
F G F A r F D = π d e 3 6 ( ρ p ρ l ) g ψ v 2 d e 2 ρ l = 0 ,
A particle immersed in stagnant water is expected [38,57] to fall with a particular acceleration for a short period of time to reach a constant velocity, which is called the terminal settling velocity of the particle. Rearranging Equation (8) gives the expression for the terminal settling velocity of the particle:
v = ( π d e ( ρ p ρ l ) g 6 ψ ρ l ) 0.5 ,
However, the drag coefficient of non-spherical particles is typically unknown. Therefore, from an experimental point of view, the drag coefficient can be calculated based on the measurements of the settling velocities of the particles of interest:
ψ = π d e ( ρ p ρ l ) g 6 v 2 ρ l ,

3.3. Particle Rising Velocity

Different from the metals, the plastic particles were characterized by a rising motion in the water consistent with the measured densities of the plastic particles shown in Table 1. Similarly to particle settling, the force balance for the plastic particles rising in water is expressed as follows:
F A r F G F D = 0 ,
From Equation (11), the drag coefficient of the rising plastic particle can be expressed as:
ψ = π d e ( ρ l ρ p ) g 6 v 2 ρ l ,
where v is the rising velocity of the particle.
Moreover, for the particles rising or settling in the liquid, the Reynolds number (Re) was calculated to assess the hydrodynamic regime:
Re = v d e ρ l μ ,
where v is the particle velocity and μ is the viscosity of the medium.
Particles moving in the liquid were generally accepted to move in the following hydrodynamic regimes: laminar (Re < 1), turbulent (Re > 1000), and transitional (Re = 1–1000) [57,58].
Froude number is commonly used to estimate the effects from the inertia force of gravity, and can be calculated as follows [58]:
Fr = v ( g d e ) 0.5 ,
Equations (10) and (12)–(14) were used to calculate the ψ, Re and Fr values for the plastic, aluminium and iron particles used in this study.

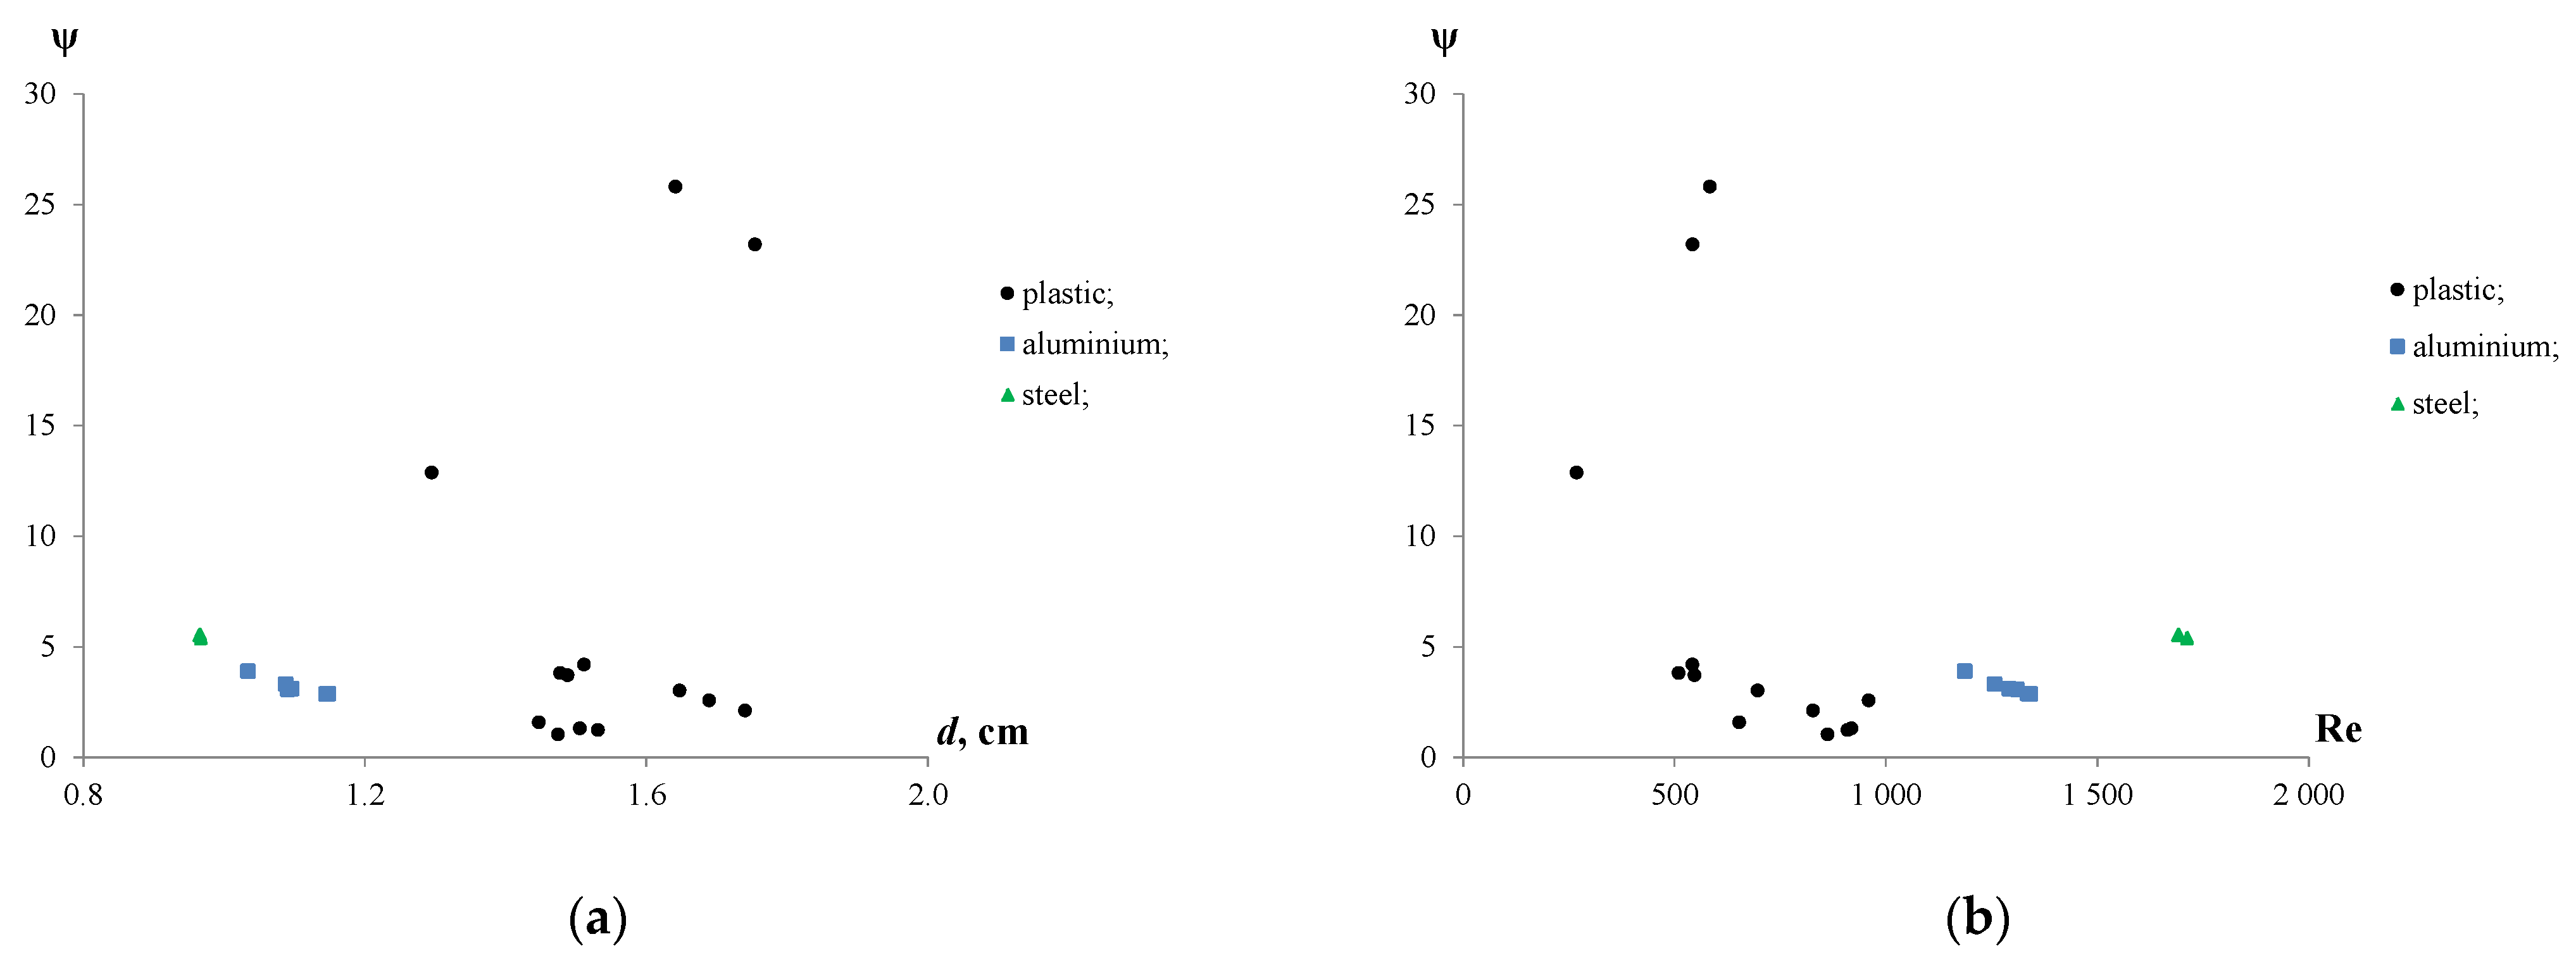
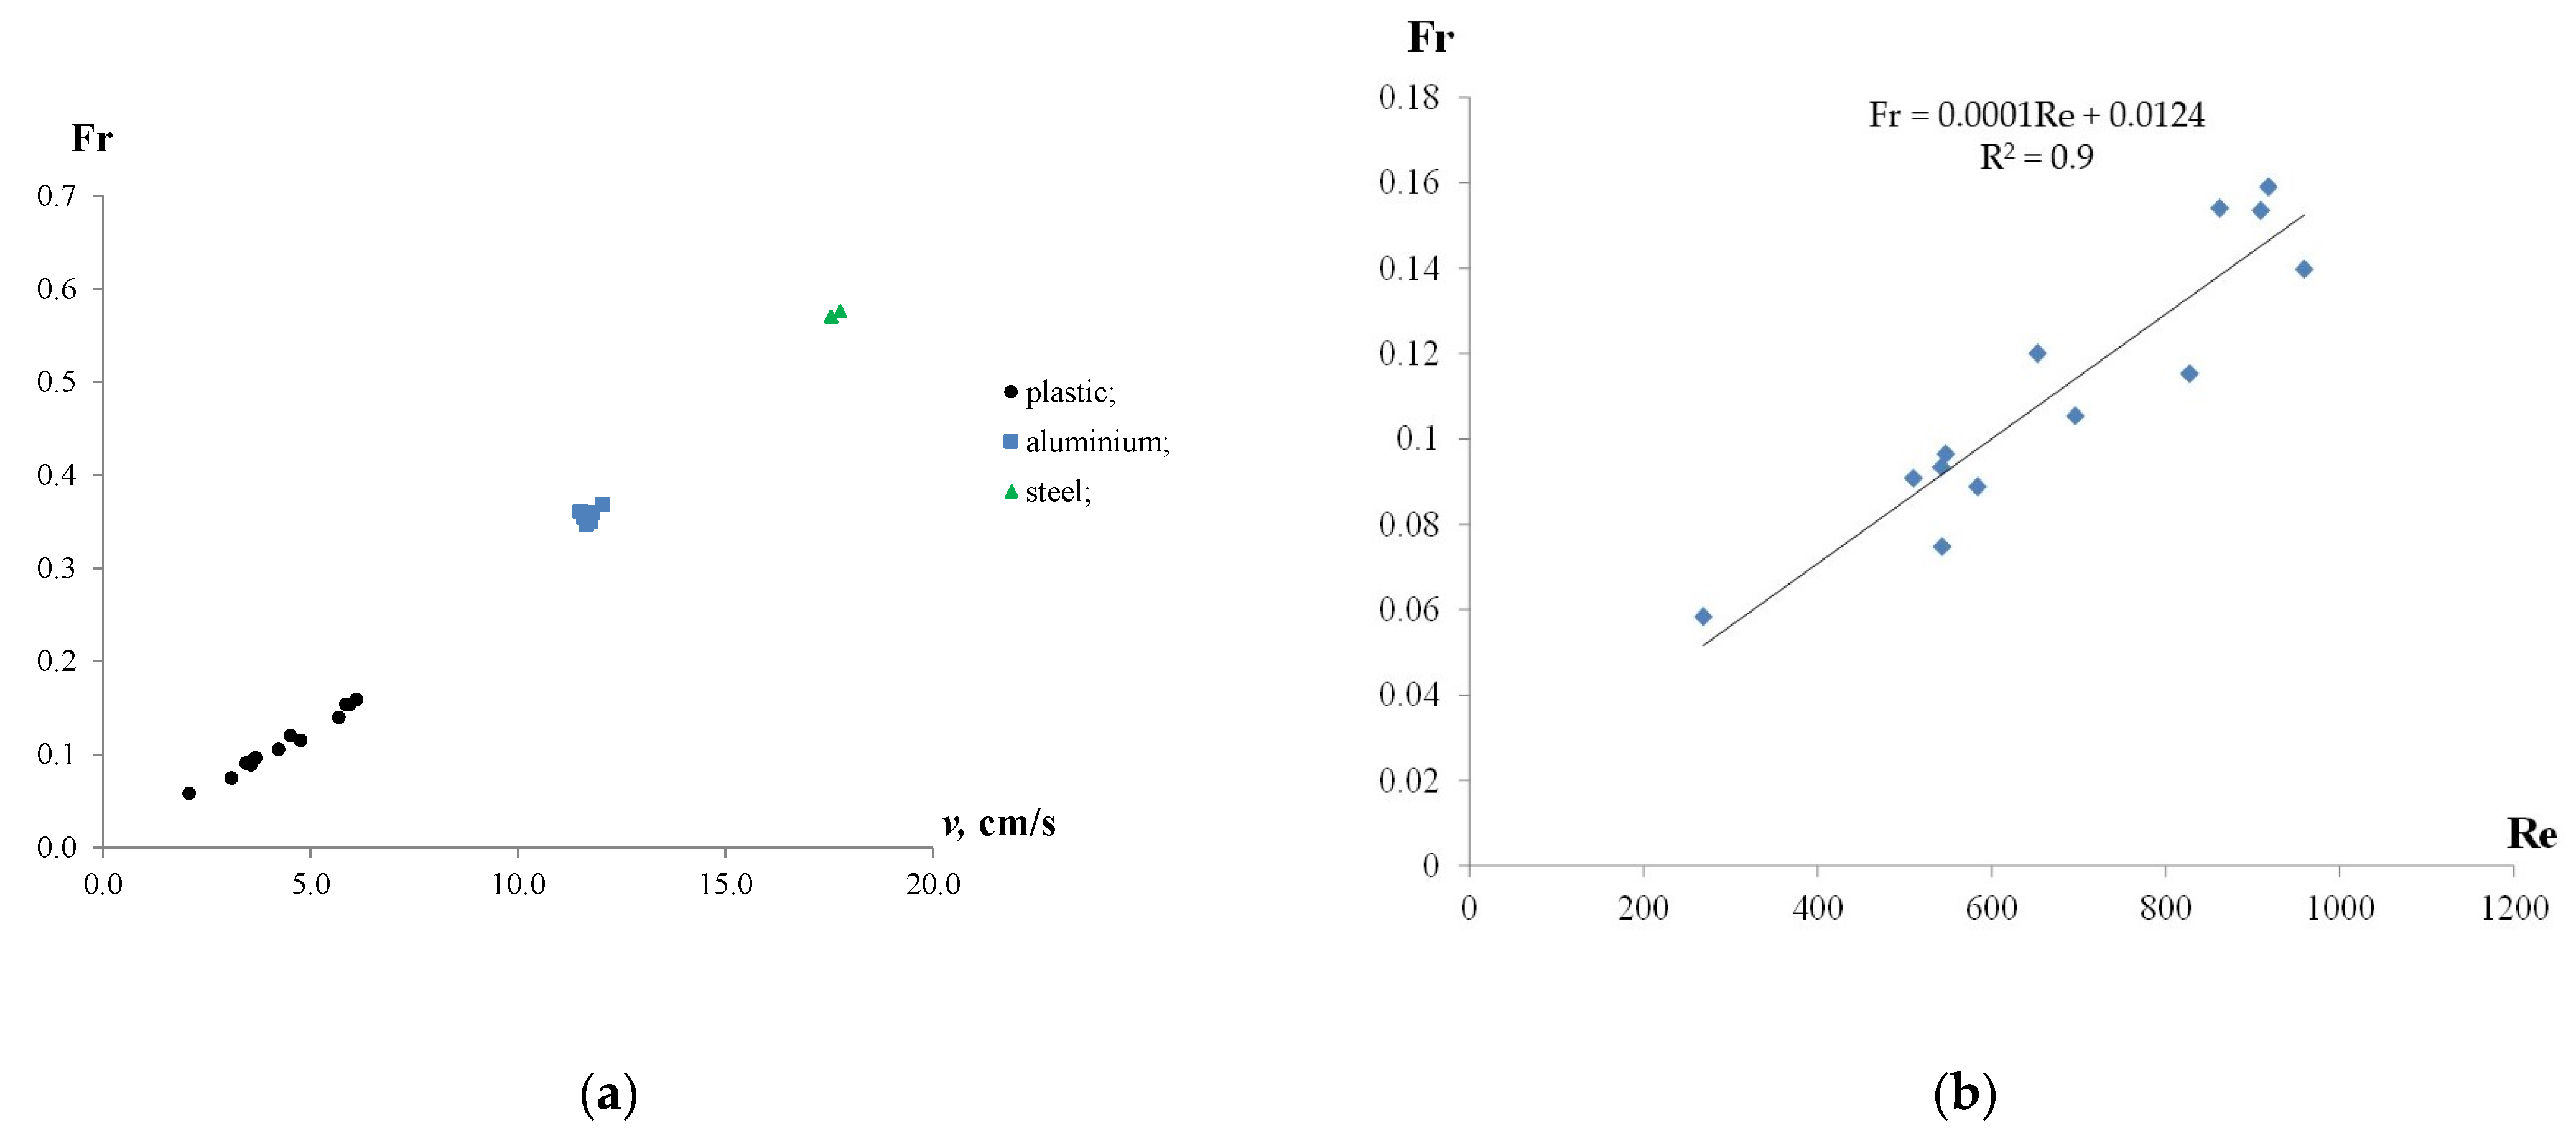
3.4. Analysis of the Results of Particles Settling and Rising in Water

Figure 5 shows the experimental results of the settling velocities for the aluminium and iron particles, and the rising velocities for the plastic particles in stagnant water.
The observations revealed differences in the velocities of the particles immersed in water. The iron particles showed the maximum velocities (17.6–17.7 cm/s), while the settling velocities of the aluminium particles were about 11.5–12.0 cm/s. For the plastic particles, the rising velocities ranged from 2.1 to 6.1 cm/s. Moreover, the settling velocities of the iron and aluminium particles were 2.9–8.4 and 2.0–5.5 times higher than the rising velocities of the plastic particles. This significant contrast in the velocities of the metal and plastic particles can be attributed to the differences in their densities and equivalent diameters.
The equivalent diameters of the plastic particles were between 1.29 and 1.75 cm with a mean equivalent diameter of 1.55 cm. The equivalent diameters of the aluminium and iron particles were less than the plastic ones, and ranged from 0.97 to 1.15 cm with mean values of 1.1 cm and 1.0 cm, respectively. Moreover, the sample of plastic particles was characterized by a high discrepancy of de.
The results were consistent with the further calculations of the drag coefficients. Figure 6a shows the drag coefficients which were calculated for plastic, iron and aluminium particles moving in the water. Figure 6b demonstrates the effect of the Reynolds number on ψ.
The findings showed that the drag coefficients ranged from 1.0 to 4.2 for plastic, from 2.9 to 3.9 for aluminium, and from 5.4 to 5.5 for iron particles, with an exception observed for three plastic particles with a ψ of 12.9, 23.2 and 25.8. The high values of the drag coefficients for a few plastic particles can be attributed to their irregular shapes and having a larger surface exposed to the water compared with the other particles. Although the equivalent diameters of iron and aluminium particles were similar (de~1.0) cm, the drag coefficients of the iron particles were 1.4–1.8 times higher than those of the aluminium ones. This can be due to differences in the aspect ratio, shape and density of the particles.
It follows from the Reynolds numbers that the rising plastic particles in water were characterized by a transitional hydrodynamic mode with Re values varying from 269 to 959. Meanwhile, high Reynolds numbers of the iron (Re = 1692–1711) and aluminium (Re = 1186–1342) particles showed that they were settled under turbulent conditions. Moreover, increasing Re resulted in the decrease in drag coefficients from 12.9 to 2.6 for plastic and from 3.9 to 2.9 for aluminium particles. The effect of Re on the ψ of the iron particles was insignificant.
Figure 7 shows the Froude number plotted against the velocity of the particles and the Reynolds number.
In general, increasing the velocity of the particles resulted in the growth of the Froude number, as shown in Figure 7a. The highest Fr values were observed at the maximum settling and rising velocities of the particles. However, the Froude number values were less than 1.0, indicating the subcritical mode of the particles moving in the water, in which the effects of gravity dominated over inertia. In particular, for the plastic particles, an increase in rising velocity from 2.1 to 6.1 cm/s resulted in the growth of the Froude number from 0.06 to 0.16 (2.7 times). The aluminium and iron particles were characterized by relatively stable Froude number values (FrAl = 0.36 and FrIron = 0.57) at settling velocities of 12 cm/s and 18 cm/s, respectively. Moreover, the FrAl/Frplastic ratio was in the range of 2.6–6.2, while FrIron/Frplastic was between 3.9 and 10.2. Although the study showed a linear dependency between Fr and Re, there was an insignificant scatter for plastic particles, as shown in Figure 7b.
The results of study are summarized in Table 2.
The study revealed density and velocity differences between the plastic and metal caps, and hence, a gravity separation can be applied [32]. Based on the results of the physical characterization of the particles and their settling and rising velocities in water, a simplified process flowsheet for the separation of caps from sand shores is proposed (Figure 8). The proposed procedure is as follows.
Sand shores, containing aluminium, iron and plastic caps are screened to obtain undersized products of −10(5) mm (sand fraction) and −30 + 10(5) mm. The latter is then separated by gravity concentration using the sink–float process and conventional gravity separators or classifiers [23]. To prevent the adverse effects of bottle cap contamination with dirt and sand on separation efficiency, a washing operation can be implemented before gravity separation (e.g., a screening operation). An overflow element of the sink–float separation retains the plastic caps, while the aluminium and iron ones are concentrated in the underflow product. The sink fraction is then subjected to a dense medium separation (DMS). The appropriate density of separation medium (ρm) is considered to be between 2 and 4 g/cm3. Under these conditions, aluminium particles will float, while iron particles will sink. The ratio of the settling to rising velocities of the particles can be expressed as follows:
k = v S t v A l = ( d e ( S t ) ( ρ S t ρ m ) d e ( A l ) ( ρ m ρ A l ) ) 0.5 ,
where vSt is the settling velocity of iron particles and vAl is the rising velocity of aluminium particles. Moreover, the calculations show that, if ρm = 3.0–3.1 g/cm3 (k = 1), then aluminium particles will rise at the same velocity as the iron particles will settle. Alternatively, a magnetic separation can be used instead of DMS.
Finally, three products are generated, namely, sand fraction, plastic caps, iron caps, and aluminium caps.
The proposed flowsheet has the following advantages: it incorporates the recovery of sand fraction in the beginning of the process; it involves environmentally friendly processes and conventional gravity separation equipment; and, finally, high productivity and throughout capacity can be achieved.

4. Conclusions

1. The physical characteristics of plastic and metal bottle caps were measured, and the composition of the particles was analysed. SEM analysis showed that there were two types of metal caps: aluminium and iron. The results of FTIR spectroscopy indicated that plastic particles were mainly represented by HDPE and LDPE, while a few particles were made of PP. Although the particles showed comparable equivalent diameters—1.29–1.75 cm (plastic), 1.03–1.15 cm (aluminium) and 0.97–1.1 cm (iron)—the aspect ratio of the iron particles was significantly higher compared to the aluminium and plastic particles;
2. The study exhibited differences in the densities of the particles. The densities of the plastic particles ranged between 0.752 and 0.956 g/cm3, while aluminium and iron particles observed significantly higher densities of 1.66–1.97 g/cm3 and 4.43 g/cm3, respectively. A slight reduction in the densities of the metal particles can be attributed to the inside plastic coatings of these particles;
3. The differences in physical characteristics resulted in plastic particles floating and metal particles sinking in a water environment. The experimental tests obtained terminal settling velocities for the aluminium (12 cm/s) and iron (18 cm/s) particles, which were significantly higher than the rising velocities of the plastic particles (2.1 to 6.1 cm/s). The results made it possible to obtain new data regarding the drag coefficients of aluminium, iron and plastic particles moving in water;
4. Based on the results of the physical characterization of the particles and their settling and rising velocities in water, a simplified process flowsheet for the recovery of plastic and metal bottle caps from sand coasts was proposed. In addition to solving the significant problem of sea-shore cleaning and reducing environmental impact, the flowsheet allows the user to obtain three valuable products for further processing: the concentrate (plastic particles), the middlings (iron particles), and the tailings (aluminium particles).
Further studies should focus on large sample investigation and the management of other materials streams containing bottle caps.

Funding

This research received no external funding.

Institutional Review Board Statement

Not applicable.

Data Availability Statement

Not applicable.

Conflicts of Interest

The author declares no conflict of interest.

References

  1. Grumezescu, A.M.; Holban, A.M. Bottled and packaged water. In Science of Beverages; Woodhead Publishing: Thorston, UK, 2019; Volume 4, p. 488. [Google Scholar]
  2. World Steel Association. Steel Statistical Yearbook. 2018. Available online: https://www.worldsteel.org/en/dam/jcr:e5a8eda5-4b46-4892-856b-00908b5ab492/SSY_2018.pdf (accessed on 8 May 2021).
  3. Non-Alcoholic Beverage Market Size, Share & Trends Analysis Report By Product (CSD, Fruit Beverages, Bottled Water, Functional Beverages, Sports Drinks), By Distribution Channel, And Segment Forecasts, 2018–2025. Available online: https://www.grandviewresearch.com/industry-analysis/nonalcoholic-beverage-market (accessed on 8 May 2021).
  4. Bleich, S.N.; Wang, Y.C.; Wang, Y.; Gortmaker, S.L. Increasing consumption of sugar-sweetened beverages among US adults: 1988–1994 to 1999–2001. Am. J. Clin. Nutr. 2009, 89, 372–381. [Google Scholar] [CrossRef] [PubMed] [Green Version]
  5. Henckens, M.L.C.M.; van Ierland, E.C.; Driessen, P.P.J.; Worrell, E. Mineral resources: Geological scarcity, market price trends, and future generations. Resour. Policy 2016, 49, 102–111. [Google Scholar] [CrossRef] [Green Version]
  6. The Global Aluminium Recycling Committee. International Aluminum Institute Global Aluminium Recycling: A Cornerstone of Sustainable Development; International Aluminium Institute: London, UK, 2009. [Google Scholar]
  7. Paraskevas, D.; Kellens, K.; Dewulf, W.; Duflou, J.R. Environmental modelling of aluminium recycling: A Life Cycle Assessment tool for sustainable metal management. J. Clean. Prod. 2015, 105, 357–370. [Google Scholar] [CrossRef]
  8. Jacobsen, R.; Willeghems, G.; Gellynck, X.; Buysse, J. Increasing the quantity of separated post-consumer plastics for reducing combustible household waste: The case of rigid plastics in Flanders. Waste Manag. 2018, 78, 708–716. [Google Scholar] [CrossRef]
  9. Agarski, B.; Vukelic, D.; Micunovic, M.I.; Budak, I. Evaluation of the environmental impact of plastic cap production, packaging, and disposal. J. Environ. Manag. 2019, 245, 55–65. [Google Scholar] [CrossRef]
  10. Gu, F.; Guo, J.; Zhang, W.; Summers, P.A.; Hall, P. From waste plastics to industrial raw materials: A life cycle assessment of mechanical plastic recycling practice based on a real-world case study. Sci. Total Environ. 2017, 601–602, 1192–1207. [Google Scholar] [CrossRef]
  11. Jambeck, J.R.; Geyer, R.; Wilcox, C.; Siegler, T.R.; Perryman, M.; Andrady, A.; Narayan, R.; Law, K.L. Plastic waste inputs from land into the ocean. Science 2015, 347, 768–771. [Google Scholar] [CrossRef]
  12. Jiang, Q.; Izumi, T.; Yoshida, H.; Dilixiati, D.; Leeabai, N.; Suzuki, S.; Takahashi, F. The effect of recycling bin design on PET bottle collection performance. Waste Manag. 2019, 95, 32–42. [Google Scholar] [CrossRef]
  13. Boonstra, M.; van Hest, F. The Plastic Bottle Cap Report. Findings of the First Survey into Plastic Bottle Cap Pollution on Beaches in The Netherlands. 2017. Available online: https://www.bottlebill.org/images/PDF/Dutch%20study%20on%20caps_Doppenrapport_EN_2017_DEF_small.pdf (accessed on 8 May 2021).
  14. De Frond, H.L.; Van Sebille, E.; Parnis, J.M.; Diamond, M.L.; Mallos, N.; Kingsbury, T.; Rochman, C.M. Estimating the Mass of Chemicals Associated with Ocean Plastic Pollution to Inform Mitigation Efforts. Integr. Environ. Assess. Manag. 2019, 15, 596–606. [Google Scholar] [CrossRef]
  15. Abelouah, M.R.; Ben-Haddad, M.; Alla, A.A.; Rangel-Buitrago, N. Marine litter in the central Atlantic coast of Morocco. Ocean Coast. Manag. 2021, 214, 105940. [Google Scholar] [CrossRef]
  16. Simeonova, A.; Chuturkova, R. Marine litter accumulation along the Bulgarian Black Sea coast: Categories and predominance. Waste Manag. 2019, 84, 182–193. [Google Scholar] [CrossRef] [PubMed]
  17. Gall, M.; Schweighuber, A.; Buchberger, W.; Lang, R.W. Plastic Bottle Cap Recycling—Characterization of Recyclate Composition and Opportunities for Design for Circularity. Sustainability 2020, 12, 10378. [Google Scholar] [CrossRef]
  18. Kaya, M. Recovery of metals and nonmetals from electronic waste by physical and chemical recycling processes. Waste Manag. 2016, 57, 64–90. [Google Scholar] [CrossRef] [PubMed]
  19. Ziouzios, D.; Baras, N.; Balafas, V.; Dasygenis, M.; Stimoniaris, A. Intelligent and Real-Time Detection and Classification Algorithm for Recycled Materials Using Convolutional Neural Networks. Recycling 2022, 7, 9. [Google Scholar] [CrossRef]
  20. Martey, S.; Hendren, K.; Farfaras, N.; Kelly, J.C.; Newsome, M.; Ciesielska-Wrobel, I.; Sobkowicz, M.J.; Chen, W.-T. Recycling of Pretreated Polyolefin-Based Ocean-Bound Plastic Waste by Incorporating Clay and Rubber. Recycling 2022, 7, 25. [Google Scholar] [CrossRef]
  21. Lubongo, C.; Alexandridis, P. Assessment of Performance and Challenges in Use of Commercial Automated Sorting Technology for Plastic Waste. Recycling 2022, 7, 11. [Google Scholar] [CrossRef]
  22. Balakrishnan, P.; Sreekala, M.S. Recycling of Plastics. In Recycling of Polymers: Methods, Characterization and Applications; Wiley-VCH: Weinheim, Germany, 2016. [Google Scholar]
  23. Wills, B.A.; Finch, J.A. Gravity Concentration. In Wills’ Mineral Processing Technology; Butterworth-Heinemann: Oxford, UK, 2016. [Google Scholar]
  24. Ruj, B.; Pandey, V.; Jash, P.; Srivastava, V.K. Sorting of plastic waste for effective recycling. Int. J. Appl. Sci. Eng. Res. 2015, 4, 564–571. [Google Scholar] [CrossRef]
  25. Kumar, A.; Holuszko, M.E.; Janke, T. Assessing the Applicability of Gravity Separation for Recycling of Non-Metal Fraction from Waste Printed Circuit Boards. Adv. Sustain. Syst. 2022, 6, 2000231. [Google Scholar] [CrossRef]
  26. Lowes, C.; Zhou, J.; McGrath, T.; Eksteen, J.; Galvin, K. Characterisation and Modelling of Gravity Pre-Concentration Amenability Using LST Fluidisation in a REFLUX™ classifier. Minerals 2020, 10, 545. [Google Scholar] [CrossRef]
  27. Whitworth, A.J.; Forbes, E.; Verster, I.; Jokovic, V.; Awatey, B.; Parbhakar-Fox, A. Review on advances in mineral processing technologies suitable for critical metal recovery from mining and processing wastes. Clean. Eng. Technol. 2022, 7, 100451. [Google Scholar] [CrossRef]
  28. Flemmer, R.L.C.; Banks, C.L. On the drag coefficient of a sphere. Powder Technol. 1986, 48, 217–221. [Google Scholar] [CrossRef]
  29. Brown, P.P.; Lawler, D.F. Sphere Drag and Settling Velocity Revisited. J. Environ. Eng. 2003, 129, 222–231. [Google Scholar] [CrossRef]
  30. Cheng, N.-S. Comparison of formulas for drag coefficient and settling velocity of spherical particles. Powder Technol. 2009, 189, 395–398. [Google Scholar] [CrossRef]
  31. Terfous, A.; Hazzab, A.; Ghenaim, A. Predicting the drag coefficient and settling velocity of spherical particles. Powder Technol. 2013, 239, 12–20. [Google Scholar] [CrossRef]
  32. Mikhailov, M.D.; Freire, A.P.S. The drag coefficient of a sphere: An approximation using Shanks transform. Powder Technol. 2013, 237, 432–435. [Google Scholar] [CrossRef]
  33. Barati, R.; Neyshabouri, S.A.A.S.; Ahmadi, G. Development of empirical models with high accuracy for estimation of drag coefficient of flow around a smooth sphere: An evolutionary approach. Powder Technol. 2014, 257, 11–19. [Google Scholar] [CrossRef]
  34. Song, X.; Xu, Z.; Li, G.; Pang, Z.; Zhu, Z. A new model for predicting drag coefficient and settling velocity of spherical and non-spherical particle in Newtonian fluid. Powder Technol. 2017, 321, 242–250. [Google Scholar] [CrossRef]
  35. Goossens, W.R.A. Review of the empirical correlations for the drag coefficient of rigid spheres. Powder Technol. 2019, 352, 350–359. [Google Scholar] [CrossRef]
  36. Tran-Cong, S.; Gay, M.; Michaelides, E.E. Drag coefficients of irregularly shaped particles. Powder Technol. 2004, 139, 21–32. [Google Scholar] [CrossRef]
  37. Loth, E. Drag of non-spherical solid particles of regular and irregular shape. Powder Technol. 2008, 182, 342–353. [Google Scholar] [CrossRef]
  38. Gabitto, J.; Tsouris, C. Drag coefficient and settling velocity for particles of cylindrical shape. Powder Technol. 2008, 183, 314–322. [Google Scholar] [CrossRef]
  39. Bagheri, G.H.; Bonadonna, C.; Manzella, I.; Vonlanthen, P. On the characterization of size and shape of irregular particles. Powder Technol. 2015, 270, 141–153. [Google Scholar] [CrossRef]
  40. Bagheri, G.; Bonadonna, C. On the drag of freely falling non-spherical particles. Powder Technol. 2016, 301, 526–544. [Google Scholar] [CrossRef] [Green Version]
  41. Zhu, X.; Zeng, Y.H.; Huai, W.X. Settling velocity of non-spherical hydrochorous seeds. Adv. Water Resour. 2017, 103, 99–107. [Google Scholar] [CrossRef]
  42. Breakey, D.E.S.; Vaezi, G.F.; Masliyah, J.H.; Sanders, R.S. Side-view-only determination of drag coefficient and settling velocity for non-spherical particles. Powder Technol. 2018, 339, 182–191. [Google Scholar] [CrossRef]
  43. Gerhardter, H.; Prieler, R.; Mayr, B.; Knoll, M.; Mühlböck, M.; Tomazic, P.; Hochenauer, C. Evaluation of drag models for particles and powders with non-uniform size and shape. Powder Technol. 2018, 330, 152–163. [Google Scholar] [CrossRef]
  44. Esteban, L.B.; Shrimpton, J.; Ganapathisubramani, B. Study of the circularity effect on drag of disk-like particles. Int. J. Multiph. Flow 2019, 110, 189–197. [Google Scholar] [CrossRef] [Green Version]
  45. Hayashi, K.; Tomiyama, A. A drag correlation of fluid particles rising through stagnant liquids in vertical pipes at intermediate Reynolds numbers. Chem. Eng. Sci. 2009, 64, 3019–3028. [Google Scholar] [CrossRef]
  46. Zhang, J.; Wang, Y.; Stevens, G.W.; Fei, W. An experimental study on single drop rising in a low interfacial tension liquid–liquid system. Chem. Eng. Res. Des. 2019, 148, 349–360. [Google Scholar] [CrossRef]
  47. Yan, X.; Jia, Y.; Wang, L.; Cao, Y. Drag coefficient fluctuation prediction of a single bubble rising in water. Chem. Eng. J. 2017, 316, 553–562. [Google Scholar] [CrossRef]
  48. Liu, L.; Tang, H.; Quan, S. Shapes and terminal velocities of a drop rising in stagnant liquids. Comput. Fluids 2013, 81, 17–25. [Google Scholar] [CrossRef]
  49. van Hout, R.; Gulitski, A.; Barnea, D.; Shemer, L. Experimental investigation of the velocity field induced by a Taylor bubble rising in stagnant water. Int. J. Multiph. Flow 2002, 28, 579–596. [Google Scholar] [CrossRef] [Green Version]
  50. Churyumov, A.V.; Bazlov, A.I.; Zadorozhnyy, V.Y.; Solonin, A.N.; Caron, A.; Louzguine-Luzgin, D.V. Phase transformations in Zr-based bulk metallic glass cyclically loaded before plastic yielding. Mater. Sci. Eng. A 2012, 550, 358–362. [Google Scholar] [CrossRef]
  51. Pozdniakov, A.V.; Lotfy, A.; Qadir, A.; Shalaby, E.; Khomutov, M.G.; Churyumov, A.Y.; Zolotorevskiy, V.S. Development of Al-5Cu/B4C composites with low coefficient of thermal expansion for automotive application. Mater. Sci. Eng. A 2017, 688, 1–8. [Google Scholar] [CrossRef]
  52. Amelinckx, S.; Van Dyck, D.; Van Landuyt, J.; Van Tendeloo, G. Electron Microscopy: Principles and Fundamentals; Wiley: Weinheim, Germany, 2007; ISBN 9783527614561. [Google Scholar]
  53. Khvan, A.V.; Dinsdale, A.T.; Cheverikin, V.V.; Kudashov, D.; Stepanov, P.P.; Watson, A.; Kondratiev, A. Oxide formation during electric resistance welding of low carbon steels. Mater. Sci. Technol. 2016, 32, 556–567. [Google Scholar] [CrossRef]
  54. Jung, M.R.; Horgen, F.D.; Orski, S.V.; Rodriguez, C.V.; Beers, K.L.; Balazs, G.H.; Jones, T.T.; Work, T.M.; Brignac, K.C.; Royer, S.-J.; et al. Validation of ATR FT-IR to identify polymers of plastic marine debris, including those ingested by marine organisms. Mar. Pollut. Bull. 2018, 127, 704–716. [Google Scholar] [CrossRef] [PubMed]
  55. Asensio, R.C.; San Andrés Moya, M.; De La Roja, J.M.; Gómez, M. Analytical characterization of polymers used in conservation and restoration by ATR-FTIR spectroscopy. Anal. Bioanal. Chem. 2009, 395, 2081–2096. [Google Scholar] [CrossRef]
  56. Kim, Y.T.; Min, B.; Kim, K.W. General Characteristics of Packaging Materials for Food System. In Innovations in Food Packaging, 2nd ed.; Academic Press: Cambridge, MA, USA, 2014; ISBN 9780123946010. [Google Scholar] [CrossRef]
  57. Shokhin, V.N.; Lopatin, A.G. Gravitatsionnye Metody Obogashcheniya; Nauka: Moskva, Russia, 1980. [Google Scholar]
  58. White, F.M. Fluid Mechanics; McGraw-Hill: New York, NY, USA, 1991. [Google Scholar]
Figure 1. A sketch of apparatus used in rising (a) and settling (b) tests. 1—glass column; 2—rubber plug; 3—stripe; 4—water tank; 5—particle.
Recycling 07 00028 g001
Figure 2. A simplified sketch (a) of a side view of a particle, demonstrating the shape and size. Examples of the particles (b) used in the study.
Recycling 07 00028 g002aRecycling 07 00028 g002b
Figure 3. SEM images (a,b) and elemental compositions (c,d) of the Metal 1 (a,c) and Metal 2 (b,d) particles.
Recycling 07 00028 g003
Figure 4. IR spectra produced from the unmarked plastic particles: (a) LDPE; (b) PP.
Recycling 07 00028 g004
Figure 5. Settling and rising velocities of aluminium, iron and plastic particles with various equivalent diameters in stagnant water.
Recycling 07 00028 g005
Figure 6. Drag coefficient for plastic, iron and aluminium particles with various de (a) and Reynolds numbers (b).
Recycling 07 00028 g006
Figure 7. Froude number as a function of velocity of the particles (a) and Reynolds number (b).
Recycling 07 00028 g007
Figure 8. A simplified flowsheet for cap separation from sand shores using dense medium (a) and magnetic (b) separation in the final stage of the process operation.
Recycling 07 00028 g008
Table 1. Physical characteristics of the particles.
ParticleMaterialDmin, cmDmax, cmh, cmrdm, cmV1, cm3ρp, g/cm3de, cm
Particle 1Plastic2.83.01.22.52.331.690.941.48
Particle 2Plastic2.83.11.22.62.372.520.9041.69
Particle 3Plastic2.73.11.52.12.432.760.9461.74
Particle 4Plastic2.83.11.12.82.332.340.9361.65
Particle 5Plastic2.62.71.22.32.172.320.6111.64
Particle 6Plastic2.83.11.22.62.371.810.9301.51
Particle 7Plastic3.23.01.12.72.432.830.7521.75
Particle 8Plastic2.83.01.12.72.301.730.9341.49
Particle 9Plastic2.12.41.31.81.931.590.9561.45
Particle 10Plastic2.22.51.31.92.001.880.9441.53
Particle 11Plastic2.32.31.21.91.931.670.9531.47
Particle 12Plastic2.42.51.22.12.031.130.9161.29
Particle 13Plastic2.02.41.31.81.901.790.9371.51
Particle 14Metal 12.62.80.64.72.000.484.430.97
Particle 15Metal 12.62.80.64.72.000.484.430.97
Particle 16Metal 12.62.80.64.72.000.484.430.97
Particle 17Metal 12.62.80.64.72.000.484.430.97
Particle 18Metal 12.62.80.64.72.000.484.430.97
Particle 19Metal 12.62.80.64.72.000.484.430.97
Particle 20Metal 12.62.80.64.72.000.484.430.97
Particle 21Metal 22.52.91.32.22.230.691.771.10
Particle 22Metal 22.52.91.32.22.230.671.801.09
Particle 23Metal 22.52.91.32.22.230.681.801.09
Particle 24Metal 22.52.91.32.22.230.791.661.15
Particle 25Metal 22.52.91.32.22.230.781.671.14
Particle 26Metal 22.52.91.22.42.200.581.971.03
1 V is the volume of the particle.
Table 2. The summarized results of the plastic, aluminium and iron particles in the settling/rising tests.
Particlesρp, g/cm3de, cmv, cm/sψReFr
RisingSettling
Plastic0.752–0.9561.29–1.752.1–6.11.0–4.2 1543–9590.06–0.16
Aluminium1.66–1.971.03–1.1511.5–12.02.9–3.91186–13420.35–0.37
Iron4.430.97–1.117.6–17.75.4–5.51692–17110.57–0.58
1 Exclusions are 12.9, 23.2, 25.8.
Publisher’s Note: MDPI stays neutral with regard to jurisdictional claims in published maps and institutional affiliations.

