Article

Sustainable Upcycling of Spent Battery Graphite into High-Performance PEG Anodes via Flash Joule Heating

National Engineering Laboratory for Reducing Emissions from Coal Combustion, Engineering Research Center of Environmental Thermal Technology of Ministry of Education, Shandong Key Laboratory of Green Thermal Power and Carbon Reduction, School of Nuclear Science, Energy and Power Engineering, Shandong University, Jinan 250061, China
*
Authors to whom correspondence should be addressed.
Recycling 2025, 10(5), 171; https://doi.org/10.3390/recycling10050171
Submission received: 22 July 2025 / Revised: 22 August 2025 / Accepted: 28 August 2025 / Published: 2 September 2025
(This article belongs to the Special Issue Lithium-Ion and Next-Generation Batteries Recycling)

Abstract

The upcycling of spent lithium-ion battery graphite constitutes an essential pathway for mitigating manufacturing expenditures and alleviating ecological burdens. This study proposes an integrated strategy to upcycle spent graphite into high-performance porous expanded graphite (PEG) anodes, leveraging flash Joule heating (FJH) as a core technique for efficient decontamination, interlayer expansion, and active etching. Results show that the binders and impurities are efficiently removed by FJH treatment, and the graphite interlayer spacing is expanded. The iron oxide, which acts as an etching reagent, can then be easily intercalated and laid into the decontaminated graphite for subsequent etching. A subsequent FJH treatment simultaneously releases oxidized intercalants and triggers in-situ metal oxide etching, yielding PEG with a rich porous architecture and enhanced specific surface area. This method successfully prepared high-performance porous expanded graphite anode material with a mesoporous structure. The resulting anode delivers a remarkable capacity retention of 419 mAh·g−1 after 600 cycles at 2C, outperforming the performance of commercial graphite anodes. This innovative approach offers a promising route for sustainable graphite reclamation.

1. Introduction

In response to environmental pollution and the energy crisis, electric vehicles (EVs) are rapidly becoming widespread, and lithium-ion batteries (LIBs) are becoming increasingly prevalent [1]. Given their limited service life (typically 3–10 years [2,3,4]), a surge in spent LIBs is projected over the next 15 years. Improper disposal of spent LIBs likely leads to environmental and safety hazards since mechanical damage may trigger fires or explosions via thermal runaway [5,6] with toxic gases, i.e., phosphorous oxyfluoride (POF3), hydrofluoric acid (HF) gases, and particulate matter being released during thermal processes [7,8]. Additionally, the leakage of heavy metals (Ni, Co, Mn) and organic electrolytes from discarded LIBs may cause soil and water contamination [9]. As a special waste with abundant strategic metals (i.e., Co and Ni) and valuable graphite, the improper disposal means a waste of valuable resources. Consequently, advanced recycling is imperative not only to mitigate hazards but also to establish closed-loop sustainability for LIBs.
Current recycling paradigms prioritize cathode metal recovery (e.g., Co, Ni) while undervaluing graphite—a critical anode material requiring energy-intensive production (cost USD 8000–13,000/ton [10]). Graphite constitutes 12–21 wt.% of LIB, representing 10% to 15% of total battery production costs. It is projected that global volumes will reach 7.5 million tons by 2037, and the global graphite market is projected to attain a valuation of tens of billions of USD [11,12]. However, most spent graphite is currently either landfilled or downcycled as reducing agents [13,14]. This significant economic value, compounded by potential environmental hazards, underscores the urgency for efficient graphite reclamation technologies.
The recycling of spent graphite (SG) primarily proceeds via three technical pathways: decontamination-regeneration, high-value conversion, and structural modification. The decontamination-regeneration approach focuses on direct anode reuse by eliminating solid electrolyte interphase (SEI) residues and metallic impurities (e.g., Cu, Al) through acid leaching or high-temperature calcination treatment. Yu et al. [15] implemented ultra-high-temperature calcination (3000 °C, 6 h, N2 atmosphere) for lattice reconstruction; the obtained regenerated graphite has an initial charge capacity of 352.5 mAh·g−1 at a current density of 0.1 A·g−1 and a capacity retention rate of 93.52% after 500 cycles. Zhang et al. [16] proposed an environmentally friendly and economical modification method based on sulfate roasting, using sodium fluoride as an auxiliary additive. By low-temperature roasting at 250 °C to recycle waste graphite, graphite with a purity as high as 99.55% can be obtained, with an initial charge capacity of 333.9 mAh·g−1, and a capacity retention rate of 91.2% after 400 cycles. Gao et al. [17] used low-temperature sulfation roasting followed by acid leaching to produce recovered graphite (RG) with a purity of 99.13%. This RG exhibited an initial irreversible capacity of 353.4 mAh·g−1 at 0.1C. While effective, these methods incur prohibitive energy/reagent consumption, require complex infrastructure, and their recycled graphite underperforms commercial graphite, failing to match its electrochemical properties.
High-value conversion routes transform SG into advanced materials like graphene, typically using modified Hummers’ methods. For instance, Xie et al. [18] used an improved Hummers method to prepare graphene from SG. They optimized the ratio of SG to oxidizing agent (KMnO4) and found the best mass ratio to be 1:3. They oxidized SG with the most appropriate proportion and thermally reduced the resulting graphene oxide, successfully producing reduced graphene oxide with a disordered few-layer structure. Zhang et al. [19] treated the lithiated graphite of spent LIBs under the conditions of a controlled flow mixture gas of H2O/Ar and then extracted lithium by the dissolution–vapor method. After that, holey graphene was prepared using the common Hummer’s method. Although value-added graphene was ultimately produced, these processes remain fundamentally hampered by inefficient exfoliation. Furthermore, the exfoliated graphene tends to restack due to strong π-π interactions and van der Waals forces between adjacent nanosheets [20,21,22], significantly limiting its practical applications and industrial scalability.
Structural modification strategies represent compromise solutions that enhance anode performance through microstructural regulation via surface coating [23] or elemental doping (e.g., N-doping) [24] or interlayer expansion [25] and pore engineering. Xiao et al. [23] used an effective graphite modification approach involving liquid-phase impregnation of asphalt onto spent graphite surfaces, followed by carbonization treatment to form a uniform amorphous carbon coating layer. The modified graphite anode achieved a high initial specific capacity of 403 mAh g−1 at 0.1C, demonstrating a cycling stability with 97.8% capacity retention after 110 cycles. Xu et al. [24] successfully induced g-C3N4 between the layers of acid-treated graphite through physically mixing SG and urea thoroughly, followed by a two-stage thermal treatment (550 °C, 3 h, and 800 °C, 1 h) in an argon atmosphere, in which urea served as a nitrogen source and was completely pyrolyzed to form g-C3N4. The novel regenerated graphite (N-RG) with nitrogen doping and enlarged interlayer spacing anode delivered a capacity of 465.8 mAh g−1 at 0.1 A g−1 after 200 cycles. Gong et al. [25] regenerated SG into high-performance expanded graphite anode material through oxidation intercalation. This approach enhances ion transport by expanding interlayer spacings to 0.392 nm (vs. 0.338 nm in SG) and generating hierarchical pore networks, effectively improving the performance of the regenerated anode. These structural modification strategies demonstrate viable pathways for enhancing anode kinetics, with capacity achievements approaching 370 mA g−1 after 1000 cycles at 1C. Obviously, expanded graphite, due to its larger interlayer spacing, is conducive to ion transmission, effectively improving the performance of the regenerated anode.
Building upon the aforementioned work, a pivotal concept can be established: skipping energy-intensive exfoliation to focus solely on layer expansion and pore engineering sufficiently enhances ion diffusion kinetics while preserving structural integrity. This approach can not only improve the electrochemical performance of recycled graphite materials but also significantly reduce production costs. Different from graphite, the SG contains impurities, which hinder the intercalation. To address these issues and overcome existing challenges—including constrained electrochemical improvements and marginal economic returns from regeneration, and graphene’s inherent energy-intensive exfoliation requirements and restacking tendency—we propose an innovative approach to integrate the decontamination and structure modification through Flashed Joule heating (FJH) to achieve simultaneous purification and structural engineering with ultrafast processing and a minimized ecological footprint. Flashed Joule heating (FJH), which is characterized by instant thermal shocks (>2000 K, <100 ms pulse), can eliminate impurities and engineer structures through thermal shock-induced volatilization, layer expansion, and defect-mediated pore formation. Capitalizing on these dual functionalities, we propose a three-stage upcycling protocol. Firstly, primary FJH decontamination yields purified graphite; secondly, the purified graphite is subjected to oxidation intercalation with in situ metal oxide deposition to achieve chemical functionalization; lastly, controlled expansion/etching was triggered by a secondary FJH to fabricate porous expanded graphite (PEG). The efficacy of this SG upcycling method for fabricating high-value PEG and its potential as a battery material in enhancing electrochemical performance was comprehensively evaluated by galvanostatic charge–discharge cycling, electrochemical impedance spectroscopy (EIS), and cyclic voltammetry (CV) with a target to establish a pioneering SG recovery paradigm.

2. Results and Discussion

2.1. Characterization of Materials

Figure 1 shows the SEM images of the key step products. Figure 1a delineates the pristine morphology of SG, revealing a pronounced agglomeration of particulate constituents interwoven with lamellar frameworks, where layered architectures are substantially obscured by pervasive adherent flocculent contaminants. These surface impurities, primarily comprising organic polymeric binders, fragmented graphite debris, electrolyte decomposition byproducts, and residual solid electrolyte interphase (SEI) films, collectively establish tortuous diffusion barriers that disrupt lithium-ion (Li+) transport pathways. Such microstructural heterogeneity directly contributes to irreversible capacity loss and Columbic efficiency deterioration, as extensively documented in electrochemical degradation studies [26].
In order to decontaminate SG, HTT and FJH treatments were, respectively, applied to SG. At the processing temperatures of HTT and FJH, the high temperature induces rapid decomposition of the binder, while the metal elements (mainly lithium compounds) will be evaporated. Furthermore, Dong et al. found the conductive agent (i.e., super P) will react with the decomposition products of the binder to form graphene [27]. Crucially, distinct morphological differentiation emerges between treatment modalities: FJH induces conspicuous edge curling and localized delamination (Figure 1b), while high-temperature treatment maintains predominantly planar layer configurations with preserved basal plane integrity (Figure 1c). The FJH treatment induces obvious edge curling and local peeling, forming a microstructure distinct from SG and HTT samples; this morphology is more conducive to the ingress of intercalants and oxidants into graphite layers during subsequent GO preparation. The XRD test results also confirm this point, as shown in Figure S1 [28], the (002) reflection of FJH-80 undergoes progressive displacement toward lower diffraction angles relative to SG, while HTT-1200 exhibits systematic migration toward higher angular positions. These directional shifts indicate significantly different interlayer reconfigurations: expansive dilation in FJH-80 compared with compressive contraction in HTT-1200, as rigorously supported by Bragg’s law [29] computations detailed in Table S1.
In order to achieve the expansion and layering of the SG and etching in the second FJH, the oxidation intercalation and the hydrothermal deposition of active metal oxides on the SG were carried out after decontamination. Figure 1d,e and Figure S2 show graphite oxide (GO) synthesized by the modified Hummers’ method. This morphology demonstrates a high degree of graphite exfoliation. GO-FJH displays a prominent (001) reflection with substantially greater integrated intensity than GO-HTT in XRD images (Figure S2). Comparative assessment of iron oxide nanocomposites (Figure 1f–i) reveals significant nanoscale particle size differentiation governed by precursor chemistry: hydrothermal treatment by iron (III) acetate precursors yields coarser, irregular iron oxide nanoparticles, contrasting markedly with the finer, more homogeneous crystallites generated from hydrothermal treatment by iron (II) acetate. This valence-dependent nucleation behavior is further corroborated by intensified Fe and O elemental signatures and spatial distribution gradients in corresponding EDS mappings, reflecting distinct growth kinetics during composite formation.
Subsequently, the second FJH was used to achieve the release of intercalated substances and the etching of graphite layers. Structural transformations following flash etching (Figure 1j–m) exhibit substantial layer exfoliation and incipient pore network development, mechanistically attributed to rapid decomposition of intercalated reagents and CO2 and CO venting during redox reactions between iron oxides and carbon matrices under ultrafast thermal activation. The violent gas evolution generates internal stresses that forcibly separate graphite layers, creating interconnected void spaces essential for enhanced ionic accessibility [24].
Through the structural analysis of the four PEG materials, FF70-3, FF90-3, HF70-3, and HF90-3 (Figure 2a–d), voltage-dependent cavity formation dynamics is further elucidated: 90V treatment generates larger porous structures (0.1–5 μm) with branched channel structures, while 70V processing establishes smaller porous structures (4–500 nm) exhibiting higher areal density. Figure 2e–h show the pore size distribution diagrams of FF70-3, FF90-3, HF70-3, and HF90-3, respectively. The size distribution data of the aperture was collected and analyzed by Nano Measurer 1.2 software, while the porosity was statistically calculated by Fiji ImageJ 1.54p software. It is not difficult to observe that the GO composites treated by FJH formed a hierarchical pore structure. Pores produced by 90 V flash evaporation etching are exclusively macropores (>50 nm). In contrast, pores formed at 70 V show a broader distribution, with nearly half concentrated below 50 nm. Thanks to the existence of the dual lithium storage mechanism, this synergistic structural optimization established abundant lithium-ion adsorption sites and shortened the length of the diffusion path [23,30].
According to the area proportion of pore structure on the graphite layer in Figure 2i, FF70-3 and FF90-3 are much larger than HF70-3 and HF90-3, respectively, indicating that the proportion of pore area of the materials prepared from FJH decontamination is generally greater than that of HTT decontamination. This is attributed to the higher oxidation degree of GO-FJH, which has more oxidation functional groups to facilitate the deposition of metal oxides [31,32]. The increase in the amount of deposited metal oxides resulted in more holes formed during the subsequent etching process and a larger proportion of combined hole area. Moreover, within the same decontamination method, the etching degree of 90 V is larger than that of 70 V. This is because a higher etching voltage brings a higher etching temperature, which leads to a larger etching range, thereby resulting in a larger proportion of pore area. Therefore, the higher oxidation degree, combined with higher flash etching temperature, results in more etching pores and a larger proportion of pore area in the later stage.
Figure 3 presents some TEM images of more microscopic structures to complement the deficiencies of the SEM images. Comparative examination of Figure 3a–d reveals distinct iron oxide nucleation patterns dictated by precursor chemistry. Iron (III) acetate-assisted hydrothermal treatment (Figure 3a,b) promotes the conspicuous formation of nano-scaled iron oxide particulates uniformly dispersed across graphene lamellae, exhibiting well-defined crystalline interfaces with carbon matrices. In contrast, iron (II) acetate systems (Figure 3c,d) generate significantly refined nanoparticles, with EG-Fe2+-FJH and EG-Fe2+-HTT measuring approximately 1.3 nm and 1.8 nm, respectively—dimensions approaching quantum-confined regimes. As shown in Figure S3, iron (II) acetate composites (EG-Fe2+-FJH/HTT) present featureless diffraction patterns despite confirmed nanoparticle existence via TEM characterization. This apparent paradox arises from nanoscale confinement effects: critically diminished crystalline domains induce extensive peak broadening that obscures discrete Bragg reflections, causing diffraction signatures to dissipate into the amorphous background continuum [33]. It is found that, whether iron (II) acetate or iron (III) acetate is used as the iron source, the attachment density of metal oxides on the graphite layers is greater when using GO-FJH as the hydrothermal raw material in comparison to GO-HTT. Combined with the previous analysis in the SEM section, this further verifies from another side that the oxidation degree of GO-FJH is higher.
Post-etching microstructures (Figure 3e,f) exhibit two observable characteristics: well-defined nanopores generated through metal oxide-catalyzed gasification and preserved graphitic domain integrity. This structure conclusively validates the efficacy of FJH for precision etching, which targets decomposition of metal oxide–graphene interfaces while maintaining structural coherence in adjacent carbon frameworks. The simultaneous presence of edge-located pores and in-plane defects establishes complementary ion-diffusion pathways, synergistically enhancing electrochemical kinetics as quantified in subsequent performance evaluations.
Nitrogen adsorption–desorption isotherms of the PEG materials exhibit two different characteristics. FF70-3, FF90-3, HF70-3, and HF90-3 (Figure 4a,b) consistently exhibit characteristic Type IV profiles with well-defined hysteresis loops, confirming mesoporous dominance across these materials. Comparative assessment reveals significantly intensified hysteresis behavior in FF70-3 and HF70-3 relative to FF90-3 and HF90-3, indicative of greater mesopore volume fractions in the former materials. This structural difference has profound electrochemical implications: mesoporous architectures effectively mitigate ionic diffusion resistance while enhancing electrolyte wettability, which are critical factors governing electrode kinetics [34]. In marked contrast, FF70-2 and HF70-2 display prototypical Type II isotherms diagnostic of microporous frameworks. In addition, all the PEG samples have macropores, and accelerated adsorption at elevated relative pressures (P/P0 > 0.9) occurs for all samples, providing compelling evidence for coexisting macropores within these micro-mesoporous matrices [35]. Pore size distribution analysis further demonstrates better microstructural uniformity in FF70-2 compared with HF70-2, which is manifested through sharper micropore distribution peaks. This enhanced homogeneity aligns precisely with prior TEM observations of more orderly iron oxide nanoparticle distributions on EG-Fe2+-FJH precursors, establishing methodological consistency across complementary characterization techniques.
Specific surface area quantification (Table S2) documents 166.831 m2 g−1 for FF70-2 and 140.473 m2 g−1 for HF70-2, stemming from micropore structure, indicating more active sites for lithium storage. In contrast, FF70-3/HF70-3 demonstrates a more mesoporous structure (Figure 4c,d), expanding ion-accessible interfacial domains that can facilitate rapid charge transfer as well as reduce ionic diffusion path lengths through interconnected pore networks. Crucially, FF70-3 and HF70-3 exhibit substantially greater specific areas and mesopore volumes than those of FF90-3/HF90-3, indicating larger electrochemically active surface areas and enhanced site availability for lithium storage. Owing to excessive etching of the graphite layers to generate macropores, the specific surface area and active sites of the FF90-3/HF90-3was remarkably reduced, thereby limiting the lithium storage performance.

2.2. Electrochemical Characterization

Long-cycle tests under two C-rate regimes (0.1C and 2C, 1C = 600 mAh g−1) were conducted to evaluate the electrochemical performance of the prepared PEG. As demonstrated in Figure 5a, in accordance with the porous architectures derived from FJH-assisted expansion and etching, the PEG exhibited distinct outstanding specific capacities of 550.8 mAh g−1 (FF90-3), 633.9 mAh g−1 (FF70-3) and 751.5 mAh g−1 (FF70-2), in comparison to the 243.7 mAh g−1 (FJH-80), indicating the porous structure can greatly enhance the electrochemical performance. This excellent performance of FF70-2 reveals a significant enhancement in lithium storage capability for composites synthesized via hydrothermal processing with iron (II) acetate precursors compared with those incorporating iron (III) acetate under low-rate discharge conditions (0.1C). This is primarily attributed to the large specific surface area of FF70-2, which provides more active sites for lithium storage. It is worth noting that in Figure S4, the apparent “activation” behavior is observed for FF70-2 at 0.1C in long cycling. This is attributed to gradual electrolyte infiltration and wetting in the predominantly microporous FF70-2. This effect can increase the accessible active surface over the first tens of cycles. The sharp decline in capacity around the 90th cycle might be due to a collapse in the material structure, resulting in a sudden reduction in specific surface area and ion transport channels [36].
Under high-rate discharge conditions (2C), as shown in Figure 5b, the specific capacities exhibit significant variation, exhibiting 237 mAh g−1 for FF90-3, 419 mAh g−1 for FF70-3, 181.9 mAh g−1 for FF70-2, and 98.1 mAh g−1 for FJH-80. Compared with FF70-2 treated with iron (II) acetate, FF70-3 treated with iron (III) acetate exhibits better performance, which is primarily attributed to the rich mesoporous structure of FF70-3. While sub-2 nm pores enhance low-rate capacity through increased surface adsorption, the promotion of ion transmission is limited. In contrast, the mesoporous structure is more conducive to the transmission of lithium ions, especially under high-rate conditions. As shown in Figure S5, during the testing process, the performance of FF70-3 exhibited a fluctuating state. The fluctuations were modest and consistent with stochastic wetting in porous carbons.
It can be observed from Figure 5c that the initial decontamination method plays an important role in the electrochemical performance of the final PEG. Overall, the PEG prepared from FJH-decontaminated graphite exhibits higher specific capacity than that of HTT-decontaminated graphite, regardless of whether the subsequent FJH for layer expansion and etching occurs at 70 V or 90 V. This increased capacity is mainly attributed to the greater layer spacing produced by FJH to facilitate the introduction of oxygen-containing functional groups in the graphite oxidation process, which will further induce a higher attachment of iron oxide particles and finally result in an increased number of pores within the porous material during the subsequent FJH treatment. Furthermore, for both types of PEG prepared from FJH and HTT decontamination, the subsequent FJH at 70 V exhibits higher specific capacity than that at 90 V. This phenomenon can be explained by the fact that higher voltage leads to higher FJH temperatures, and as a result, the pore structure becomes large in size and more interconnected, leading to a reduction in the number of active sites.
Comprehensive rate capability assessment (Figure 5d) reveals that FF70-3 delivers exceptional electrochemical performance. FF70-3 achieves specific capacities of 653.8 mAh g−1 at 0.2C, 503.3 mAh g−1 at 0.4C, 388.5 mAh g−1 at 1C, 324 mAh g−1 at 2C, and 266.4 mAh g−1 at 4C. By comparing the performance of FF70-3 with that of commercial graphite measured in our previous work, it can be concluded that the performance of FF70-3 is far superior to that of commercial graphite [37]. Significantly, FF70-3 exhibits an exceptional capacity recovery fidelity of 99.54% during rate cycling transitions, maintaining near-complete capacity restoration upon reverting from high-rate (4C) to low-rate (0.2C) operation. The distinct rate-dependent performance profiles elucidate a critical pore architecture-function interdependence: iron (II) acetate-derived composites (e.g., FF70-2) achieve enhanced low-rate capacities due to optimized nanoscale porosity maximizing interfacial contact area, whereas iron (III) acetate-derived FF70-3 exhibits better electrochemical performance at high rates owing to its hierarchical mesoporous network facilitating rapid ion diffusion. This performance bifurcation conclusively validates the previously postulated mechanism wherein micropore dimensions induce transport limitations during high-current operation through geometric confinement phenomena. In contrast, the mesoporous structure formed in FF70-3 can not only remarkably promote ion diffusion but also accommodate repetitive lithium intercalation/extraction without causing irreversible deformation. This synergistic integration of rapid ion transport capability and mechanical stability establishes a foundational paradigm for advanced energy storage materials.
Electrode reaction kinetics were rigorously interrogated through electrochemical impedance spectroscopy (EIS), revealing fundamental correlations between pore architecture and charge transfer dynamics. As shown in Figure 6a, the composite designated FF70-3 exhibits minimal interfacial charge transfer resistance (Rct). It signifies optimized reaction kinetics at the electrode-electrolyte interface. These enhancements originate in the material’s hierarchical mesoporous architecture, which establishes efficient ionic percolation pathways that dramatically reduce lithium-ion diffusion lengths while preserving structural continuity of the conductive network. Through the fitting and analysis of ZView3 software, comparative analysis identifies FF70-2 exhibits intermediate impedance characteristics, with an Rct of 141.6 Ω. While its ultra-high specific surface area derived from nanoscale porosity provides abundant lithium adsorption sites, the diffusion pathways are constrained to impede lithium-ion penetration into graphitic interlayers [38]. The most pronounced impedance occurs in FF90-3, with an Rct of 177.4 Ω, where 90V FJH triggers destructive structural evolution. Excessive thermal energy input during high-voltage etching probably induces carbon lattice fragmentation, generating macropores that disrupt the intrinsic conductive network through graphene sheet disconnection. This irreversible damage creates electron transport bottlenecks, particularly evident in the middle-frequency semicircle expansion. The compromised electrical percolation pathway fundamentally limits charge transfer efficiency.
Figure 6b shows the EIS plots of the three materials after 600 cycles at 2C. The Rsei and Rct after cycling are presented in Table S3. It is obvious that a distinct semi-circle corresponding to Rsei can be observed in the high-frequency region for all three samples, which indicates the formation of the SEI layer during the cycling process. Among them, FF70-2 has the largest Rsei, which is attributed to its larger specific surface area that generates a thicker SEI layer, resulting in a high resistance in this part. Meanwhile, a relatively large slope in the low-frequency region can be observed for FF70-2, which may be due to the formation of the SEI film blocking the microporous structure and hindering the transport of lithium ions. In contrast, the slopes in the low-frequency region of FF70-3 and FF90-3 are close to the ideal 45°. FF70-3 also shows an almost ideal diffusion state and the smallest Rct, which demonstrates the better electrochemical performance of FF70-3 under high-rate conditions.
Galvanostatic charge–discharge profiles (Figure 6c) corroborate these observations, revealing FF70-2’s distinctive voltage plateau depression and premature capacity fade. This performance deterioration stems from compromised structural integrity: the ultrahigh porosity fraction undermines mechanical coherence, inducing localized framework collapse during initial lithium insertion cycles. The resultant loss of percolation pathways and active material isolation creates irreversible capacity loss mechanisms that manifest as abrupt voltage drops during subsequent cycling (Figure 5a). The voltage-specific capacity diagrams of the first cycle for the FJH series and HTT series are shown in Figure 6c,d. It can be observed from the figures that the larger the specific surface area, the smaller the initial coulombic efficiency (ICE). This is because a larger specific surface area consumes more lithium ions when forming the SEI layer in the first cycle, resulting in a lower ICE. The ICE, initial specific capacity, and specific capacity after 600 cycles under 2C conditions for the two groups of eight samples are shown in Table S4.
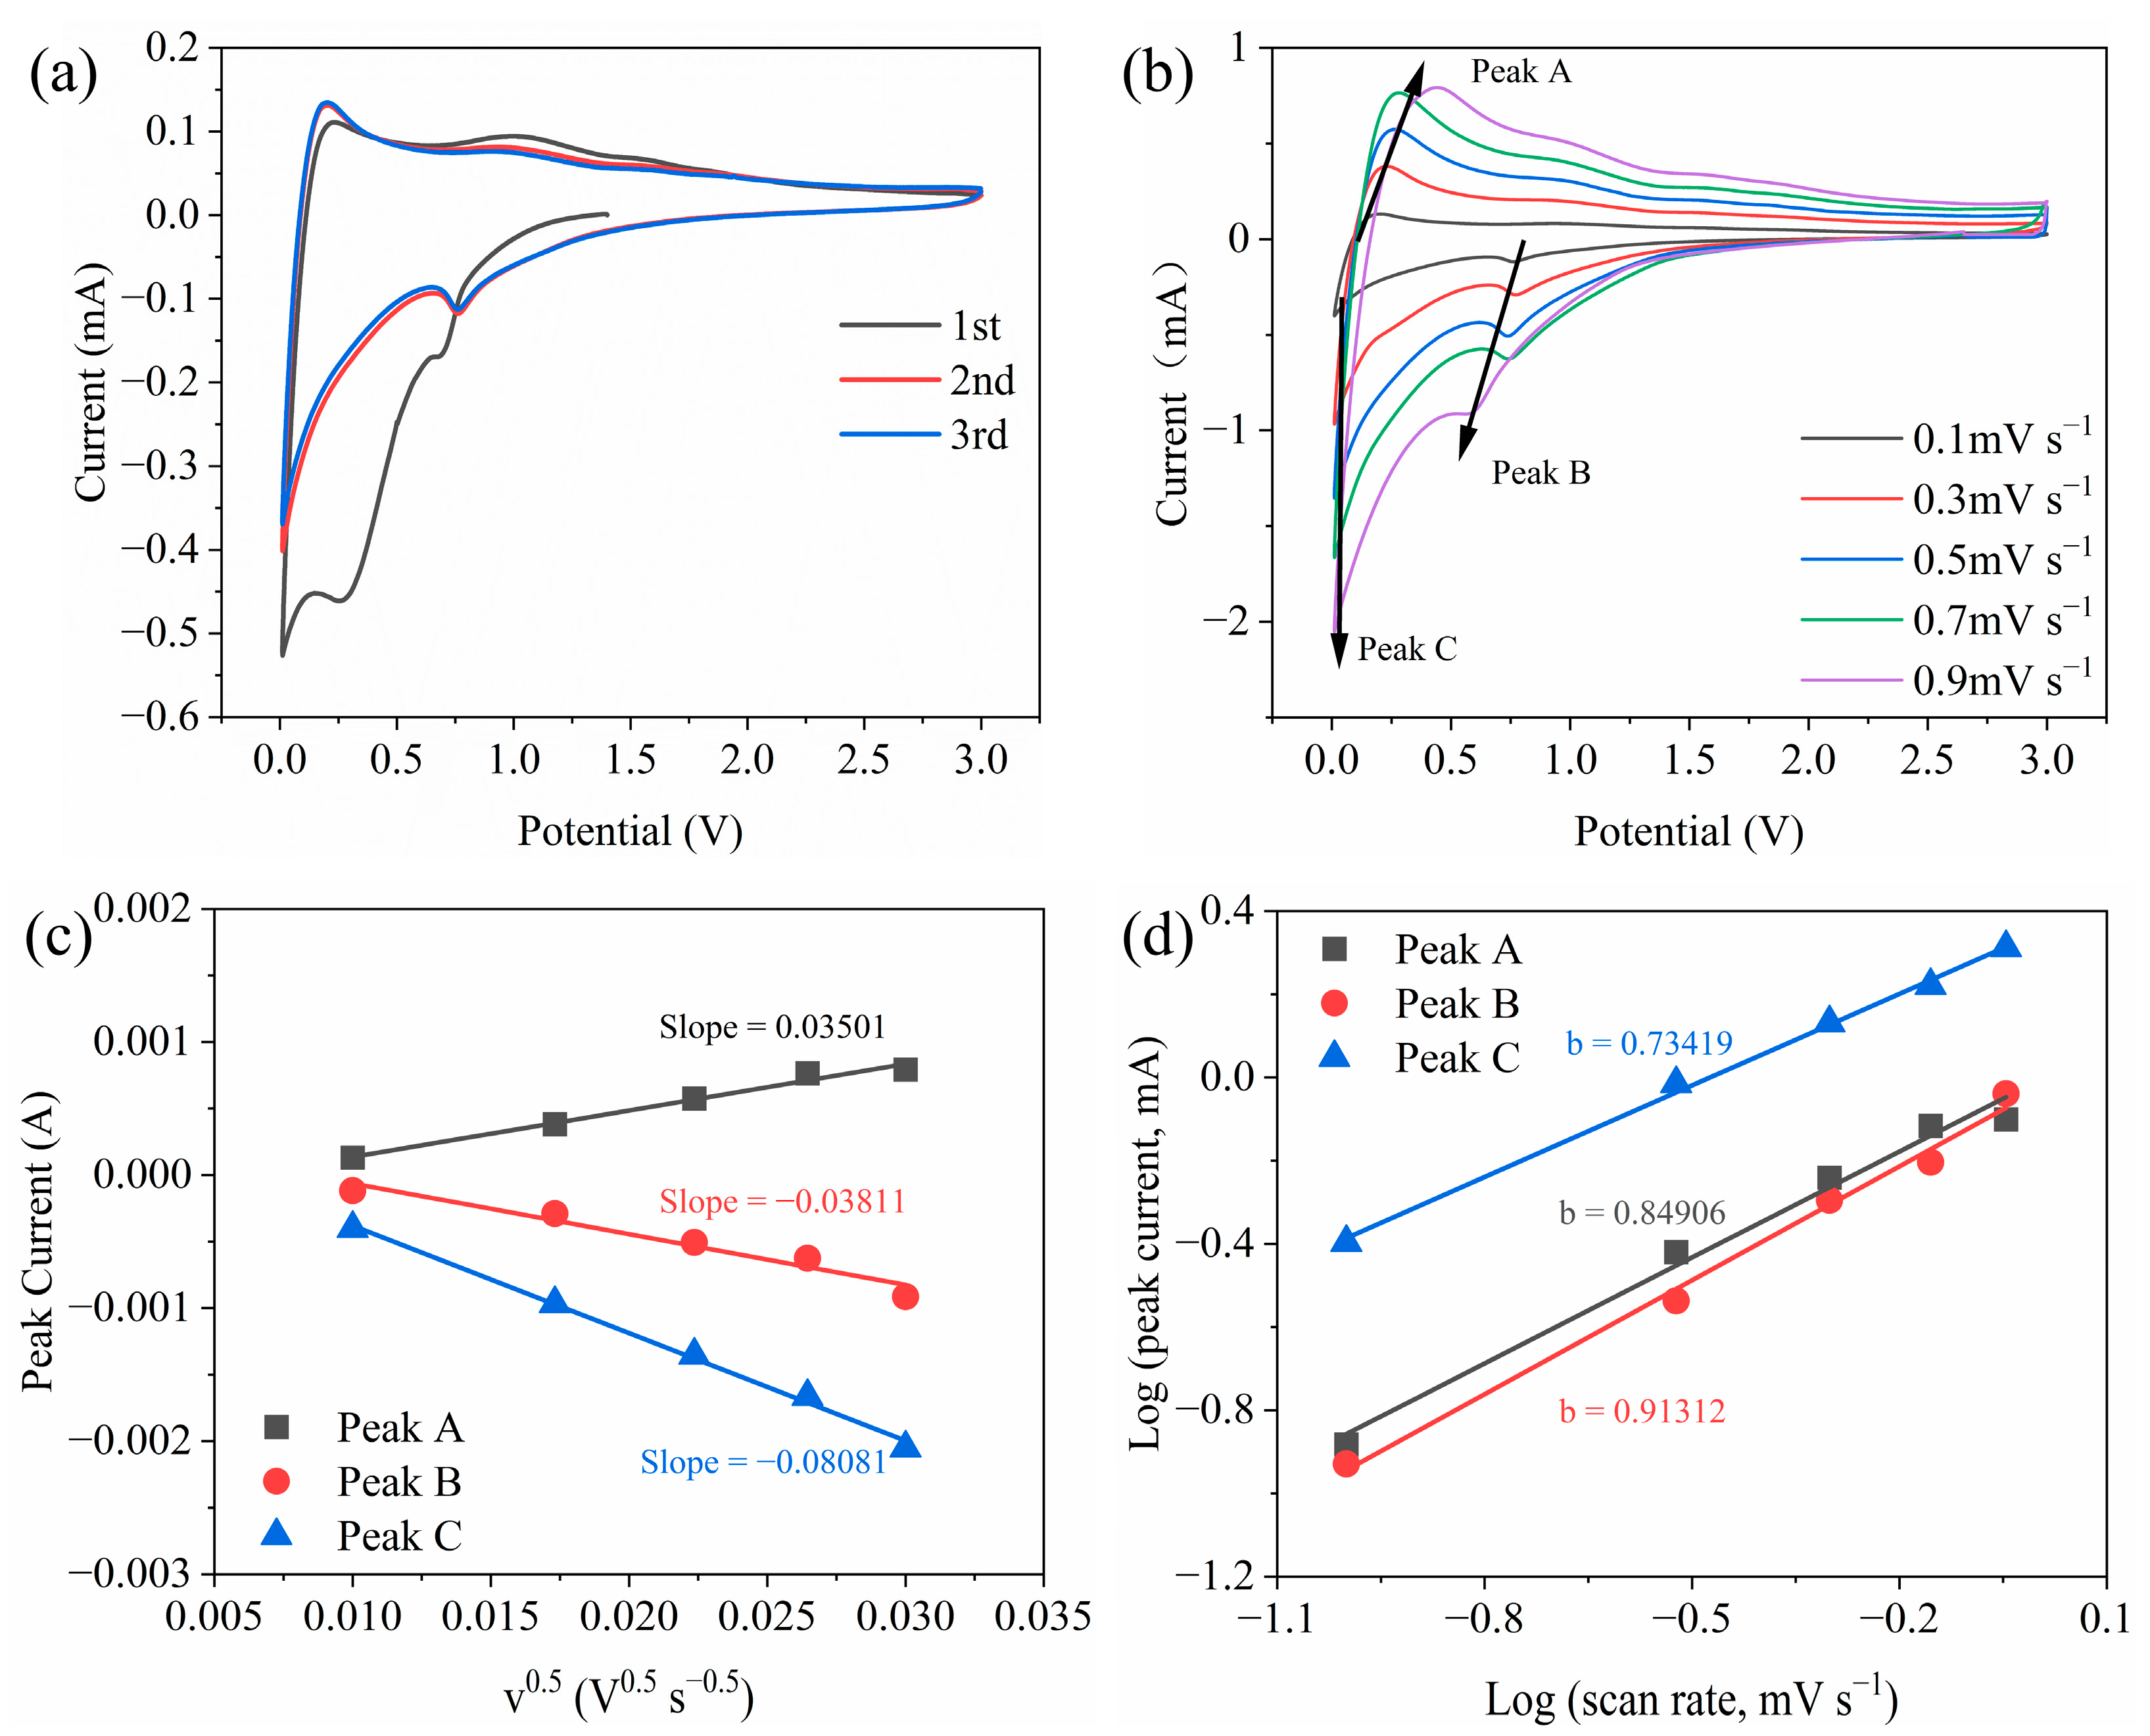
Cyclic voltametric profiling at 0.1 mV s−1 provides complementary kinetic insights (Figure 7a). All samples exhibit characteristic electrochemical signatures: an irreversible reduction peak between 0.5 and 0.75 V during initial cycling corresponds to electrolyte reduction and concomitant SEI formation, while reversible redox pairs below 0.5 V signify lithium intercalation/deintercalation within graphitic domains. The near-perfect superimposition of second and third cycle voltammograms confirms good electrochemical reversibility in FF90-3, FF70-3, and FJH-80.
Cyclic voltammetry (CV) analysis spanning scan rates from 0.1 to 0.9 mV s−1 (Figure 7b) probes the lithiation–delithiation kinetics. Well-defined redox peaks emerge at characteristic potentials of 0.1 V (corresponding to LiC6 formation during discharge) and 0.2 V (associated with LiC6 decomposition during charge), demonstrating highly reversible phase transformation behavior. Progressive CV curve broadening with increasing scan rates signifies good electrochemical stability; at the same time, ΔEp is also gradually increasing (Table S5). Crucially, Figure S6 quantitatively validates that FF70-3’s charge storage capacity and cycling durability consistently surpass alternative regenerated graphite materials documented in prior studies [15,16,19,24,39,40,41], establishing its performance superiority.
By fitting the peak currents of the three redox peaks and the square roots of their corresponding voltages at different scan rates, three straight lines can be obtained. The slopes of these lines are related to the diffusion coefficient of lithium ions, and the diffusion coefficient can be calculated through the Randles–Ševčík equation.
I P = 269 , 000 n 1.5 A C D 0.5 ν 0.5
here, ν is the scan rate set in CV, with units of V/s; D is the diffusion coefficient, with units of cm2 s−1; C is the ion concentration, with units of mol/cm3; A is the electrode area, with units of cm2, which can generally be considered as the geometric area of the electrode sheet; and n is the number of electrons transferred in the redox reaction, with n = 1 for a single-electron reaction. I P ν 0.5 is the slope in Figure 7c. Through calculation, it can be obtained that the diffusion coefficient of FF70-3 is in the range of 10−7 to 10−8 cm2 s−1, which is much higher than that of commercial graphite at 10−10 cm2 s−1, proving that its mesoporous structure can effectively enhance the ion transport capacity. As shown in the Figure 7d, by calculating the b values corresponding to the three redox peaks, it can be found that all the b values are between 0.5 and 1.0 and are closer to 1.0. This indicates that the reaction is less limited by ion diffusion kinetics, further demonstrating the impact of the porous structure on improving performance.

3. Materials and Methods

3.1. Materials

Spent LIBs were bought from Shandong Jiuli Electronic Technology Co., Ltd., Jinan, China. Iron (II) acetate tetrahydrate (C4H6O4Fe, 95%, Fe 21% min), iron (III) acetate polyhydrate (C4H7FeO5·nH2O, AR), and ethylene glycol (C2H6O2, AR, 98%) were purchased from Shanghai McLean Biochemical Co., Ltd., Shanghai, China. Potassium permanganate (KMnO4, AR, 99%), sulfuric acid (H2SO4, AR), nitric acid (HNO3, AR), and hydrogen peroxide (H2O2, AR, 30%) were purchased from Sinopharm Chemical Reagent Co., Ltd., Shanghai, China.

3.2. Acquisition of Spent Graphite

The spent LIBs were subjected to a deep discharge process, followed by disassembly. Spent LIBs refer to those that have lost their value for continued use. The batteries used in this experiment were originally used in EVs. The copper foil, which had the anode material attached, was immersed in a 1 mol/L KOH solution to facilitate the separation of the anode material from the copper foil. Subsequently, the resulting material was washed with acid and deionized water until its pH reached approximately 7. The powder was then dried to yield SG. Electrochemical tests were conducted on SG, revealing its electrochemical performance is bad, as illustrated in Figure S7.

3.3. Preparation of Materials

The SG was sieved through a 350-mesh sieve and processed via two distinct routes: flash Joule heating at 80 V (denoted as FJH-80) and high-temperature treatment (HTT) ≥ 1200 °C (denoted as HTT-1200). These pretreated materials were converted to graphite oxide (GO) using a modified Hummers’ method [42]. The GO prepared by using FJH-80 and HTT-1200 was, respectively, denoted as GO-FJH and GO-HTT. Specific methods are detailed in the Supplementary Materials.
For the synthesis of composites, 0.4 g of iron (III) acetate polyhydrate (Fe(CH3COO)3·nH2O) or iron (II) acetate tetrahydrate (Fe(CH3COO)2·4H2O) was dissolved in 60 mL of ethylene glycol using ultrasonication for 1 h at 100 W in an ice bath. Simultaneously, 0.5 g of GO-FJH or GO-HTT was dispersed in 100 mL of EG under the same conditions to create 5 mg/mL suspensions. The iron (III) or iron (II) acetate solutions were gradually added to the GO dispersions, followed by 2 h of magnetic stirring. The resulting mixtures were transferred to autoclaves for hydrothermal treatment at 180 °C for 8 h. After cooling, the products were filtered, washed with water, and vacuum-dried at 70 °C for 8 h to yield four composites: EG-Fe3+-FJH, EG-Fe3+-HTT, EG-Fe2+-FJH, and EG-Fe2+-HTT.
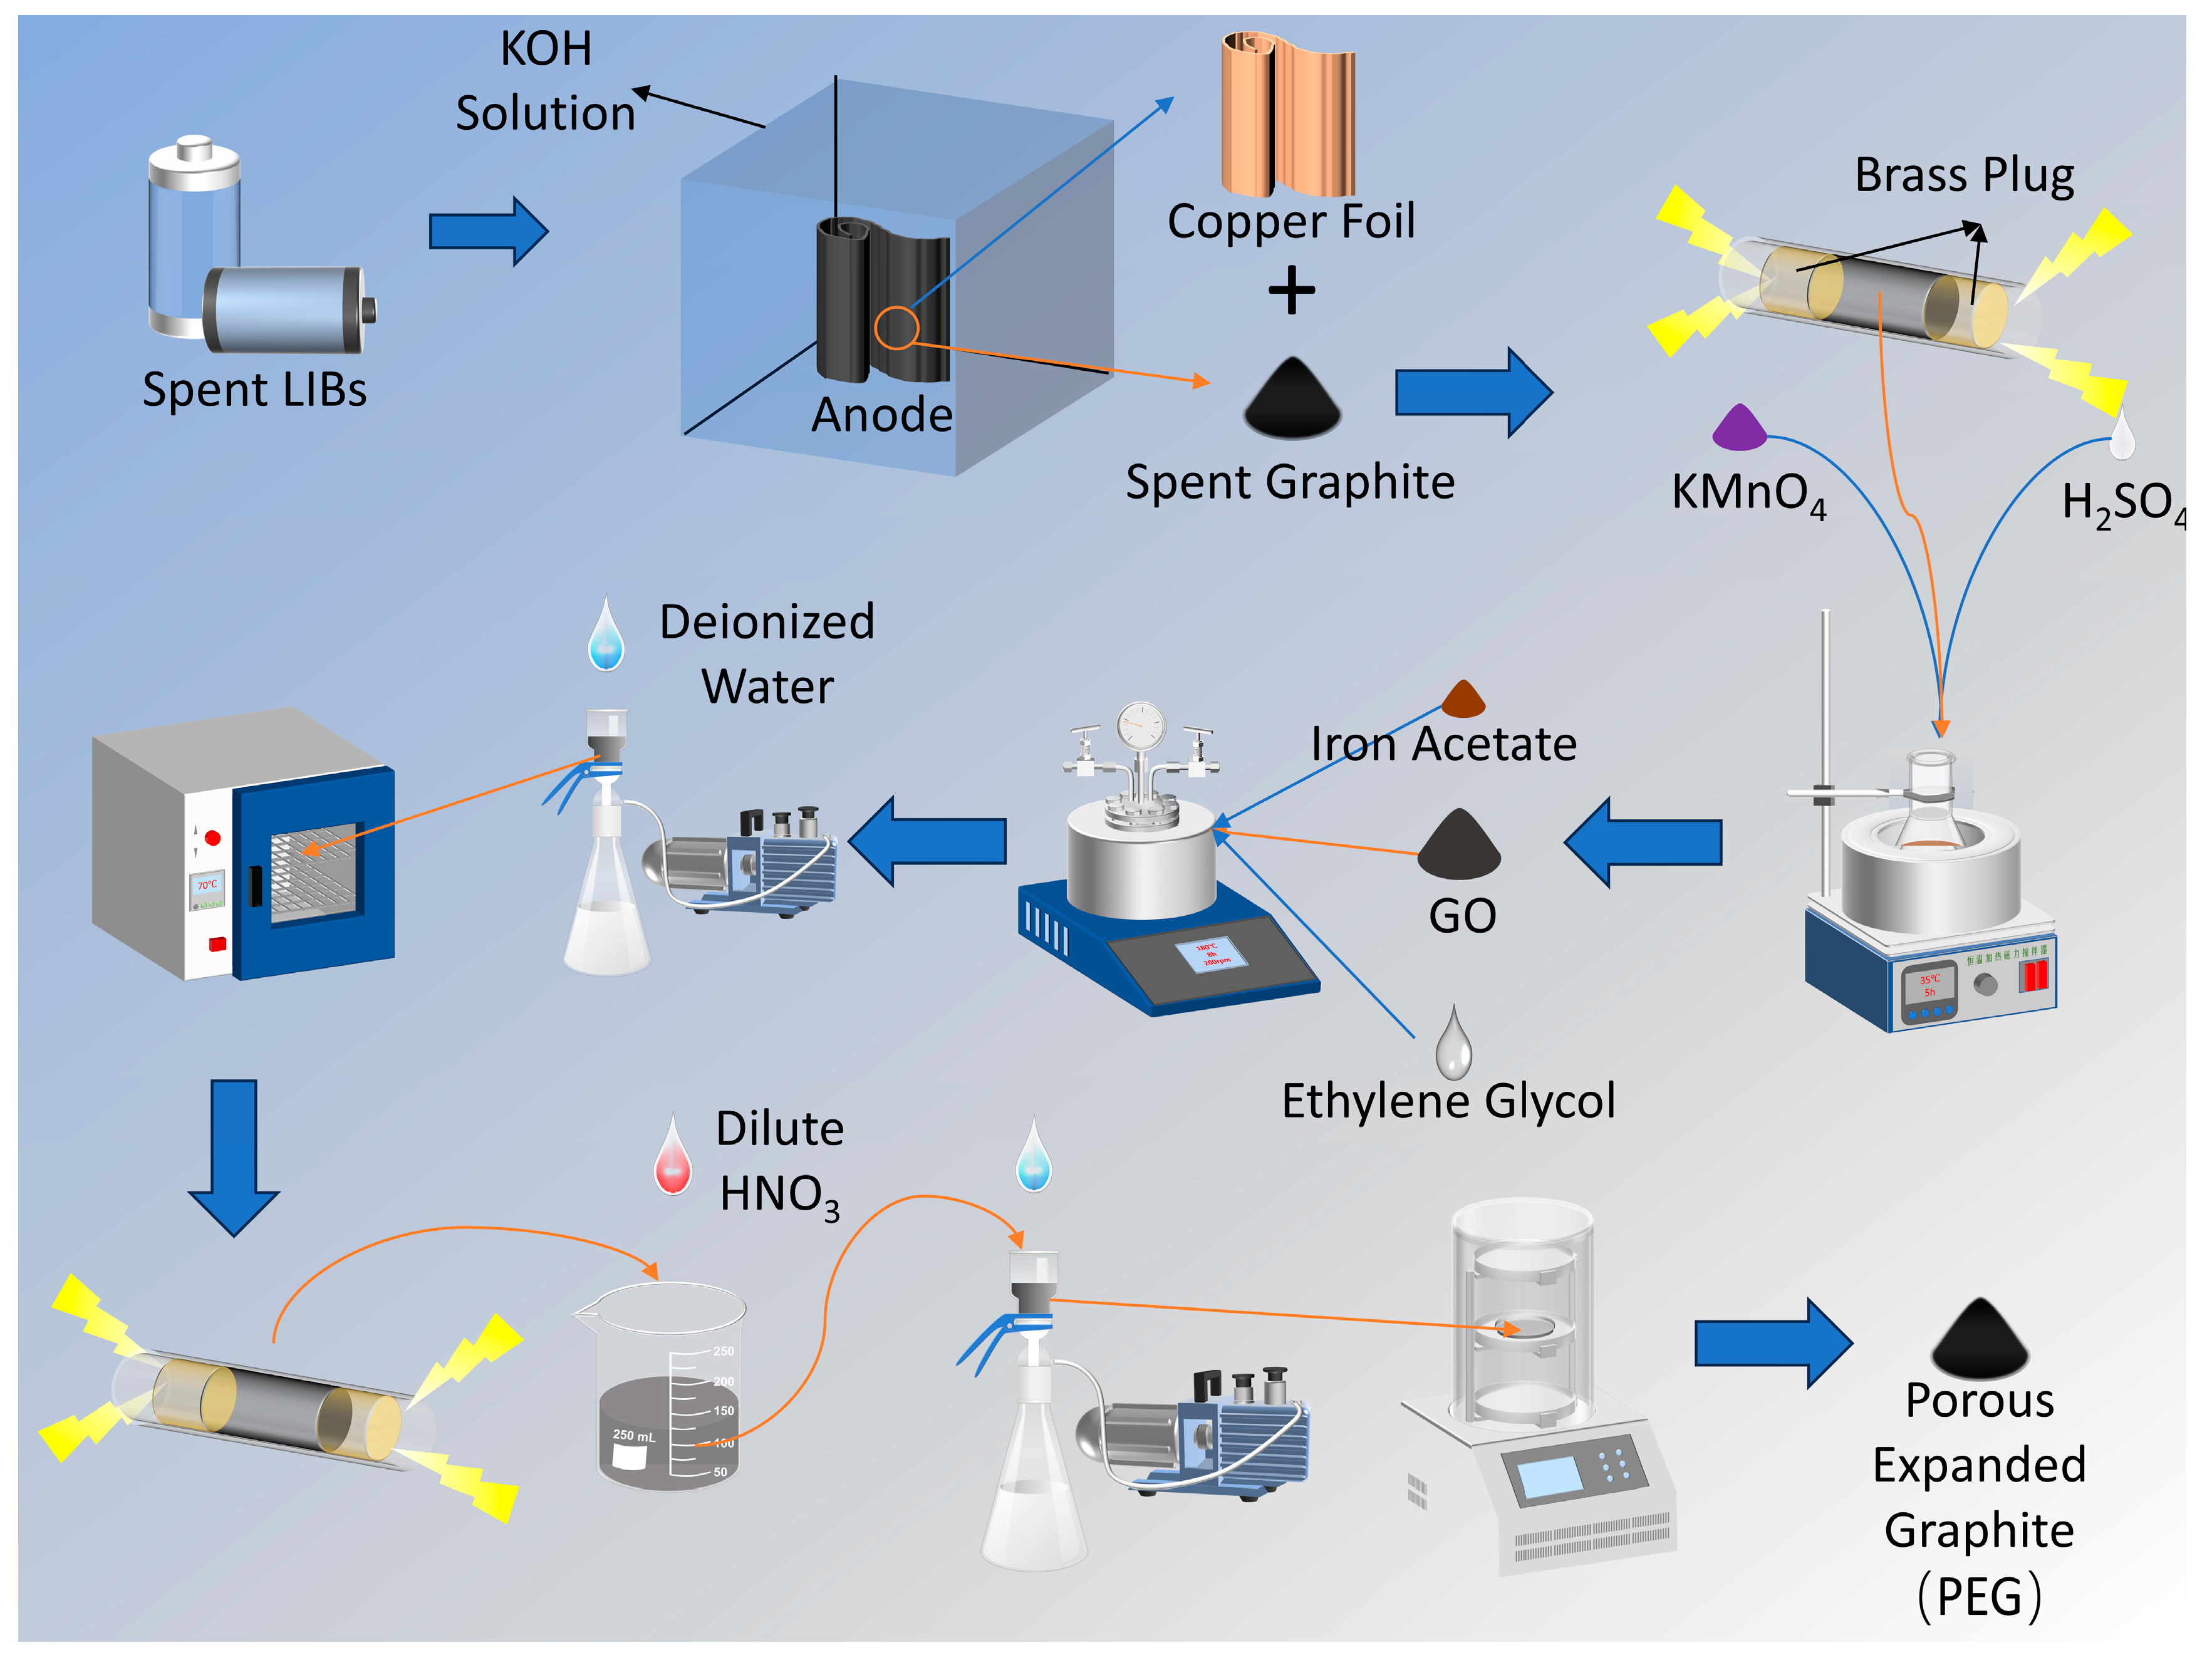
Each composite (0.18 g) underwent FJH in an inert atmosphere. The EG-Fe3+-FJH composite also received 15 pulses at 70 V and 90 V, yielding FF70-Fe3+ and FF90-Fe3+. The EG-Fe3+-HTT composite received 15 pulses at 70 V and 90 V, resulting in the formation of HF70-Fe3+ and HF90-Fe3+. Both the EG-Fe2+-FJH and EG-Fe2+-HTT composites were subjected to 15 pulses at 70 V, producing FF70-Fe2+ and HF70-Fe2+, respectively. Following this, the materials were acid-washed with 5 mol/L HNO3 using magnetic stirring for 2 h. They were then rinsed to neutrality and freeze-dried to obtain porous expanded graphite, designated as FF70-3, FF90-3, HF70-3, HF90-3, FF70-2, and HF70-2. Here, the first “H” or “F” refers to the graphite treated with HTT or FJH for impurity removal, the second “F70” or “F90” indicates the etching voltage of FJH being 70 V or 90 V, and the last “2” or “3” represents the valence state of iron in iron acetate during the loading process. The complete preparation process is shown in Figure 8.

3.4. Characterization and Electrochemical Performance

Surface morphology and microstructure of the graphite specimens were imaged using scanning electron microscopy (SEM; Zeiss SUPRATM55, Oberkochen, Germany) and transmission electron microscopy (TEM; HITACHI HT7700, Tokyo, Japan). Elemental composition across sample surfaces was routinely determined through X-ray energy-dispersive spectroscopy (EDS) integrated with the SEM platform. Crystalline structure properties were characterized by X-ray diffraction (XRD; Rigaku Miniflex600, Tokyo, Japan) employing Cu Kα radiation at a scanning rate of 5°/min over the 2θ range of 10° to 80°. Surface area and pore size distribution were modeled from N2; adsorption–desorption isotherms (Quanta Chrome Instruments Co., Ltd., Boynton Beach, FL, USA).
Electrochemical assessments employed CR2025 coin cells fabricated in an argon-filled glove box (H2O and O2 < 0.1 ppm). Electrode slurries were prepared by blending sodium carboxymethyl cellulose (CMC), Super P carbon, and active material at a 1:2:7 mass ratio. After thorough mixing, homogeneous slurry coatings were applied onto copper foils, followed by vacuum drying (70 °C, 10 h). The resulting electrodes displayed ∼20 μm coating thickness with active material loadings of 0.56–0.84 mg. Lithium foil counter electrodes and Celgard 2400 polypropylene separators were utilized. The electrolyte contained 1.0 M LiPF6 in ethylene carbonate/dimethyl carbonate (EC:DMC = 3:7, v/v). Assembled cells underwent 10-h stabilization before testing. Galvanostatic charge–discharge cycling was performed at ambient temperature using a LAND tester (CT3001A, Wuhan Lanhe, Wuhan, China) within 0.01–3.0 V. Cyclic voltammetry (CV) measurements employed CHI 660e electrochemical workstation (Shanghai Chenhua, Shanghai, China) with 0.01–3.0 V (vs. Li+/Li) sweeps at 0.1–0.9 mV s−1 scan rates. Electrochemical impedance spectroscopy (EIS) was subsequently conducted on the same instrument with 10 mV AC amplitude over 100 kHz to 0.01 Hz frequencies.

4. Conclusions

In summary, this research successfully achieves high-value recovery and resource utilization of graphite from spent lithium-ion battery anodes through the innovative integration of flash Joule heating technology with precision structural engineering. The experimental framework systematically examines the influences of three critical processing variables: decontamination methodologies (comparing flash Joule heating with high-temperature treatment), transition metal valence states in acetate precursors (iron (II) versus iron (III)), and etching voltages (70 V versus 90 V). The characterization results show that FJH has a better effect than HTT for SG decontamination and induces a larger interlayer spacing. The GO-FJH prepared in this way has a higher degree of oxidation and can load more iron oxides during the loading process. The iron oxide nanoparticles formed on the graphite layer by the combination of hydrothermal treatment and iron (II) acetate are significantly smaller than those formed by iron (III) acetate. Under the flash etching condition of 70 V, the composites synthesized via hydrothermal processing with iron (III) mainly form meso-macropores. Thanks to the hierarchical structure of mesopores and macropores formed during the process, this structure provides more lithium-ion transmission channels, greatly promoting the transmission of ions and enhancing the long-cycle performance of FF70-3. In the electrochemical test, the capacity of FF70-3 remains as high as 419 mAh g−1 after 600 cycles at a high rate of 2C, with a capacity retention rate of 70.18%. This investigation establishes a scientifically grounded and technologically viable pathway for transforming waste graphite into high-performance anodes, providing substantial guidance for sustainable energy material development with promising application prospects.

Supplementary Materials

The following supporting information can be downloaded at https://www.mdpi.com/article/10.3390/recycling10050171/s1, Figure S1: XRD of SG, FJH-80, and HTT-1200; Figure S2: XRD of GO-FJH and GO-HTT; Figure S3: XRD of EG-Fe2+-FJH, EG-Fe2+-HTT, EG-Fe3+-FJH, and EG-Fe3+-HTT; Figure S4: Voltage-specific capacity diagram in the 1st, 10th, 30th, 50th, and 100th cycle of FF70-2 at 0.1C; Figure S5: Voltage-specific capacity diagram in the 1st, 50th, 150th, 300th, and 600th cycle of FF70-3 at 2C; Figure S6: Comparison with previous work performance; Figure S7: Electrochemical performance of SG at 2C; Table S1: SG, FJH-80, HTT-1200 corresponding to the glancing angle and (002) crystal plane spacing; Table S2: Specific surface area of (a) micropore, (b) meso- and macropore, (c) micropore volume, and (d) total pore volume; Table S3: Rsei and Rct values after 600 cycles under 2C conditions for FF70-3, FF90-3, and FF70-2; Table S4: The initial coulombic efficiency, initial specific capacity, and specific capacity after 600 cycles of all products mentioned in this article are based on 2C; Table S5: The relationship between scan rate and ΔEp.

Author Contributions

Conceptualization, Y.L. and J.S.; methodology, Y.L.; validation, Y.L., W.C. and S.L.; formal analysis, Y.L.; investigation, Y.L.; data curation, Y.L.; writing—original draft preparation, Y.L.; writing—review and editing, J.S. and Z.W.; supervision, J.S.; project administration, J.S.; funding acquisition, J.S. and Z.W. All authors have read and agreed to the published version of the manuscript.

Funding

This research was supported by National Natural Science Foundation of China (No. 52370140), and Shandong Province Excellent Youth Science Fund Project (2023HWYQ-022).

Data Availability Statement

The original contributions presented in this study are included in the article. Further inquiries can be directed to the first/corresponding author.

Conflicts of Interest

The authors declare no conflict of interest.

References

  1. Wang, W. Green energy and resources: Advancing green and low-carbon development. Green Energy Resour. 2023, 1, 100009. [Google Scholar] [CrossRef]
  2. Nguyen-Tien, V.; Zhang, C.; Strobl, E.; Elliott, R.J.R. The closing longevity gap between battery electric vehicles and internal combustion vehicles in Great Britain. Nat. Energy 2025, 10, 354–364. [Google Scholar] [CrossRef]
  3. Li, X.; Deng, C.; Liu, M.; Xiong, J.; Zhang, X.; Yan, Q.; Lin, J.; Chen, C.; Wu, F.; Zhao, Y.; et al. Reutilization and upcycling of spent graphite for sustainable lithium-ion batteries: Progress and perspectives. eScience 2025, 5, 100394. [Google Scholar] [CrossRef]
  4. Xiao, J.; Li, J.; Xu, Z. Challenges to Future Development of Spent Lithium Ion Batteries Recovery from Environmental and Technological Perspectives. Environ. Sci. Technol. 2020, 54, 9–25. [Google Scholar] [CrossRef] [PubMed]
  5. Lecocq, A.; Eshetu, G.G.; Grugeon, S.; Martin, N.; Laruelle, S.; Marlair, G. Scenario-based prediction of Li-ion batteries fire-induced toxicity. J. Power Sources 2016, 316, 197–206. [Google Scholar] [CrossRef]
  6. Wang, Q.; Mao, B.; Stoliarov, S.I.; Sun, J. A review of lithium ion battery failure mechanisms and fire prevention strategies. Progress. Energy Combust. Sci. 2019, 73, 95–131. [Google Scholar] [CrossRef]
  7. Iturrondobeitia, M.; Vallejo, C.; Berroci, M.; Akizu-Gardoki, O.; Minguez, R.; Lizundia, E. Environmental Impact Assessment of LiNi1/3Mn1/3Co1/3O2 Hydrometallurgical Cathode Recycling from Spent Lithium-Ion Batteries. ACS Sustain. Chem. Eng. 2022, 10, 9798–9810. [Google Scholar] [CrossRef]
  8. Natarajan, S.; Aravindan, V. An Urgent Call to Spent LIB Recycling: Whys and Wherefores for Graphite Recovery. Adv. Energy Mater. 2020, 10, 2002238. [Google Scholar] [CrossRef]
  9. Yi, C.; Zhou, L.; Wu, X.; Sun, W.; Yi, L.; Yang, Y. Technology for recycling and regenerating graphite from spent lithium-ion batteries. Chin. J. Chem. Eng. 2021, 39, 37–50. [Google Scholar] [CrossRef]
  10. Li, Z.; Li, J.; Wang, L. Renewed graphite for high-performance lithium-ion batteries: Catalytic graphitization approach. J. Mater. Sci. Mater. Electron. 2024, 35, 599. [Google Scholar] [CrossRef]
  11. Shang, Z.; Yu, W.; Zhou, J.; Zhou, X.; Zeng, Z.; Tursun, R.; Liu, X.; Xu, S. Recycling of spent lithium-ion batteries in view of graphite recovery: A review. eTransportation 2024, 20, 100320. [Google Scholar] [CrossRef]
  12. Yu, W.; Guo, Y.; Xu, S.; Yang, Y.; Zhao, Y.; Zhang, J. Comprehensive recycling of lithium-ion batteries: Fundamentals, pretreatment, and perspectives. Energy Storage Mater. 2023, 54, 172–220. [Google Scholar] [CrossRef]
  13. Zhang, Y.; Wang, W.; Fang, Q.; Xu, S. Improved recovery of valuable metals from spent lithium-ion batteries by efficient reduction roasting and facile acid leaching. Waste Manag. 2020, 102, 847–855. [Google Scholar] [CrossRef]
  14. Zhang, Y.; Wang, W.; Hu, J.; Zhang, T.; Xu, S. Stepwise Recovery of Valuable Metals from Spent Lithium Ion Batteries by Controllable Reduction and Selective Leaching and Precipitation. ACS Sustain. Chem. Eng. 2020, 8, 15496–15506. [Google Scholar] [CrossRef]
  15. Yu, H.; Dai, H.; Zhu, Y.; Hu, H.; Zhao, R.; Wu, B.; Chen, D. Mechanistic insights into the lattice reconfiguration of the anode graphite recycled from spent high-power lithium-ion batteries. J. Power Sources 2021, 481, 229159. [Google Scholar] [CrossRef]
  16. Zhang, Z.; Zhu, X.; Hou, H.; Tang, L.; Xiao, J.; Zhong, Q. Regeneration and utilization of graphite from the spent lithium-ion batteries by modified low-temperature sulfuric acid roasting. Waste Manag. 2022, 150, 30–38. [Google Scholar] [CrossRef] [PubMed]
  17. Gao, Y.; Zhang, J.; Chen, Y.; Wang, L.; Wang, C. Graphite regenerating from retired (LFP) lithium-ion battery: Phase transformation mechanism of impurities in low-temperature sulfation roasting process. Renew. Energy 2023, 204, 290–299. [Google Scholar] [CrossRef]
  18. Xie, X.; Zhang, J.; Chen, Y.; Wang, C. A method for the preparation of graphene from spent graphite of retired lithium-ion batteries. J. Power Sources 2024, 594, 234023. [Google Scholar] [CrossRef]
  19. Zhang, J.; Lei, Y.; Lin, Z.; Xie, P.; Lu, H.; Xu, J. A novel approach to recovery of lithium element and production of holey graphene based on the lithiated graphite of spent lithium ion batteries. Chem. Eng. J. 2022, 436, 135011. [Google Scholar] [CrossRef]
  20. Xiao, F.; Chen, X.; Zhang, J.; Huang, C.; Hu, T.; Hong, B.; Xu, J. Large-scale production of holey graphite as high-rate anode for lithium ion batteries. J. Energy Chem. 2020, 48, 122–127. [Google Scholar] [CrossRef]
  21. Ma, X.; Li, S.; Tang, W.; Liu, R.; Fu, Z.; Wang, S. Laser-Induced Coal-Based Porous Graphene as Anode Toward Advanced Lithium-Ion Battery. Adv. Sci. 2025, 12, e2504592. [Google Scholar] [CrossRef] [PubMed]
  22. Ma, C.; Zhao, Y.; Li, Y. A facile solution-free etching preparation of porous graphene nanosheets with high performances for lithium storage. Chem. Eng. J. 2017, 320, 283–289. [Google Scholar] [CrossRef]
  23. Xiao, Y.; Li, J.; Huang, W.; Wang, L.; Luo, J. Green & efficient regeneration of graphite anode from spent lithium ion batteries enabled by asphalt coating. J. Mater. Sci. Mater. Electron. 2022, 33, 16740–16752. [Google Scholar] [CrossRef]
  24. Xu, C.; Ma, G.; Yang, W.; Che, S.; Li, Y.; Jia, Y.; Liu, H.; Chen, F.; Zhang, G.; Liu, H.; et al. One-step reconstruction of acid treated spent graphite for high capacity and fast charging lithium-ion batteries. Electrochim. Acta 2022, 415, 140198. [Google Scholar] [CrossRef]
  25. Gong, H.; Xiao, H.; Ye, L.; Ou, X. High-performance expanded graphite regenerated from spent lithium-ion batteries by integrated oxidation and purification method. Waste Manag. 2023, 171, 292–302. [Google Scholar] [CrossRef] [PubMed]
  26. Zhu, W.; Liu, G.; Hu, J.; Su, G.; Liu, M.; Li, X.; Xu, B. Low-temperature molten salt ion regeneration strategy towards green and efficient spent graphite recycling. Green. Chem. 2025, 27, 6145–6155. [Google Scholar] [CrossRef]
  27. Dong, S.; Song, Y.; Ye, K.; Yan, J.; Wang, G.; Zhu, K.; Cao, D. Ultra-fast, low-cost, and green regeneration of graphite anode using flash joule heating method. EcoMat 2022, 4, e12212. [Google Scholar] [CrossRef]
  28. Yi, C.; Ge, P.; Wu, X.; Sun, W.; Yang, Y. Tailoring carbon chains for repairing graphite from spent lithium-ion battery toward closed-circuit recycling. J. Energy Chem. 2022, 72, 97–107. [Google Scholar] [CrossRef]
  29. Yang, J.-L.; Zhao, X.-X.; Li, W.-H.; Liang, H.-J.; Gu, Z.-Y.; Liu, Y.; Du, M.; Wu, X.-L. Advanced cathode for dual-ion batteries: Waste-to-wealth reuse of spent graphite from lithium-ion batteries. eScience 2022, 2, 95–101. [Google Scholar] [CrossRef]
  30. Li, L.; Ruan, M.; Tian, D.; Zhang, X.; Hou, X.; Zhong, K.; Cheng, F.; Tong, Y.; Fang, Z. Dual regulation mechanism of MoS2/MoO3 heterostructure for polysulfide and volume effect enables stable and durable lithium storage. Appl. Surf. Sci. 2024, 646, 158949. [Google Scholar] [CrossRef]
  31. Fan, J.; Yang, J.; Li, H.; Tian, J.; Wang, M.; Zhao, Y. Cryogenic mechanical properties of graphene oxide/epoxy nanocomposites: Influence of graphene oxide with different oxidation degrees. Polym. Test. 2021, 96, 107074. [Google Scholar] [CrossRef]
  32. Zhang, W.; Xu, H.; Xie, F.; Ma, X.; Niu, B.; Chen, M.; Zhang, H.; Zhang, Y.; Long, D. General synthesis of ultrafine metal oxide/reduced graphene oxide nanocomposites for ultrahigh-flux nanofiltration membrane. Nat. Commun. 2022, 13, 471. [Google Scholar] [CrossRef]
  33. Al-Tabbakh, A.A.; Karatepe, N.; Al-Zubaidi, A.B.; Benchaabane, A.; Mahmood, N.B. Crystallite size and lattice strain of lithiated spinel material for rechargeable battery by X-ray diffraction peak-broadening analysis. Int. J. Energy Res. 2019, 43, 1903–1911. [Google Scholar] [CrossRef]
  34. Sun, N.; Li, Z.; Zhang, X.; Qin, W.; Zhao, C.; Zhang, H.; Ng, D.H.L.; Kang, S.; Zhao, H.; Wang, G. Hierarchical Porous Carbon Materials Derived from Kelp for Superior Capacitive Applications. ACS Sustain. Chem. Eng. 2019, 7, 8735–8743. [Google Scholar] [CrossRef]
  35. Zhao, Y.; Zhang, X. In situ activation graphitization to fabricate hierarchical porous graphitic carbon for supercapacitor. Sci. Rep. 2021, 11, 6825. [Google Scholar] [CrossRef]
  36. Zhang, X.; Wang, Q.; Li, Y.; Sun, G.; Yu, X.; Li, H. Crack-induced abrupt capacity degradation in commercial LiNi(0.8)Co(0.1)Mn(0.1)O(2) (NCM811)/SiO (x) -graphite pouch batteries. RSC Adv. 2024, 14, 19116–19123. [Google Scholar] [CrossRef] [PubMed]
  37. Jia, P.; Sun, J.; Li, S.; Wang, W.; Song, Z.; Zhao, X.; Mao, Y. A feasible recycling route for spent graphite: Microwave-assisted puffing with Fe2O3 loading to construct high-performance anode for lithium-ion batteries. Mater. Today Sustain. 2024, 25, 100620. [Google Scholar] [CrossRef]
  38. Rahman, M.A.; Wong, Y.C.; Song, G.; Wen, C. A review on porous negative electrodes for high performance lithium-ion batteries. J. Porous Mater. 2015, 22, 1313–1343. [Google Scholar] [CrossRef]
  39. Xu, Y.-J.; Song, X.-H.; Chang, Q.; Hou, X.-L.; Sun, Y.; Feng, X.-Y.; Wang, X.-R.; Zhan, M.; Xiang, H.-F.; Yu, Y. The regeneration of graphite anode from spent lithium-ion batteries by washing with a nitric acid/ethanol solution. New Carbon. Mater. 2022, 37, 1011–1020. [Google Scholar] [CrossRef]
  40. Fan, W.; Zhang, J.; Ma, R.; Chen, Y.; Wang, C. Regeneration of graphite anode from spent lithium-ion batteries via microwave calcination. J. Electroanal. Chem. 2022, 908, 116087. [Google Scholar] [CrossRef]
  41. Lai, Y.; Zhu, X.; Li, J.; Gou, Q.; Li, M.; Xia, A.; Huang, Y.; Zhu, X.; Liao, Q. Recovery and regeneration of anode graphite from spent lithium-ion batteries through deep eutectic solvent treatment: Structural characteristics, electrochemical performance and regeneration mechanism. Chem. Eng. J. 2023, 457, 141196. [Google Scholar] [CrossRef]
  42. Kim, J.; Eum, J.H.; Kang, J.; Kwon, O.; Kim, H.; Kim, D.W. Tuning the hierarchical pore structure of graphene oxide through dual thermal activation for high-performance supercapacitor. Sci. Rep. 2021, 11, 2063. [Google Scholar] [CrossRef] [PubMed]
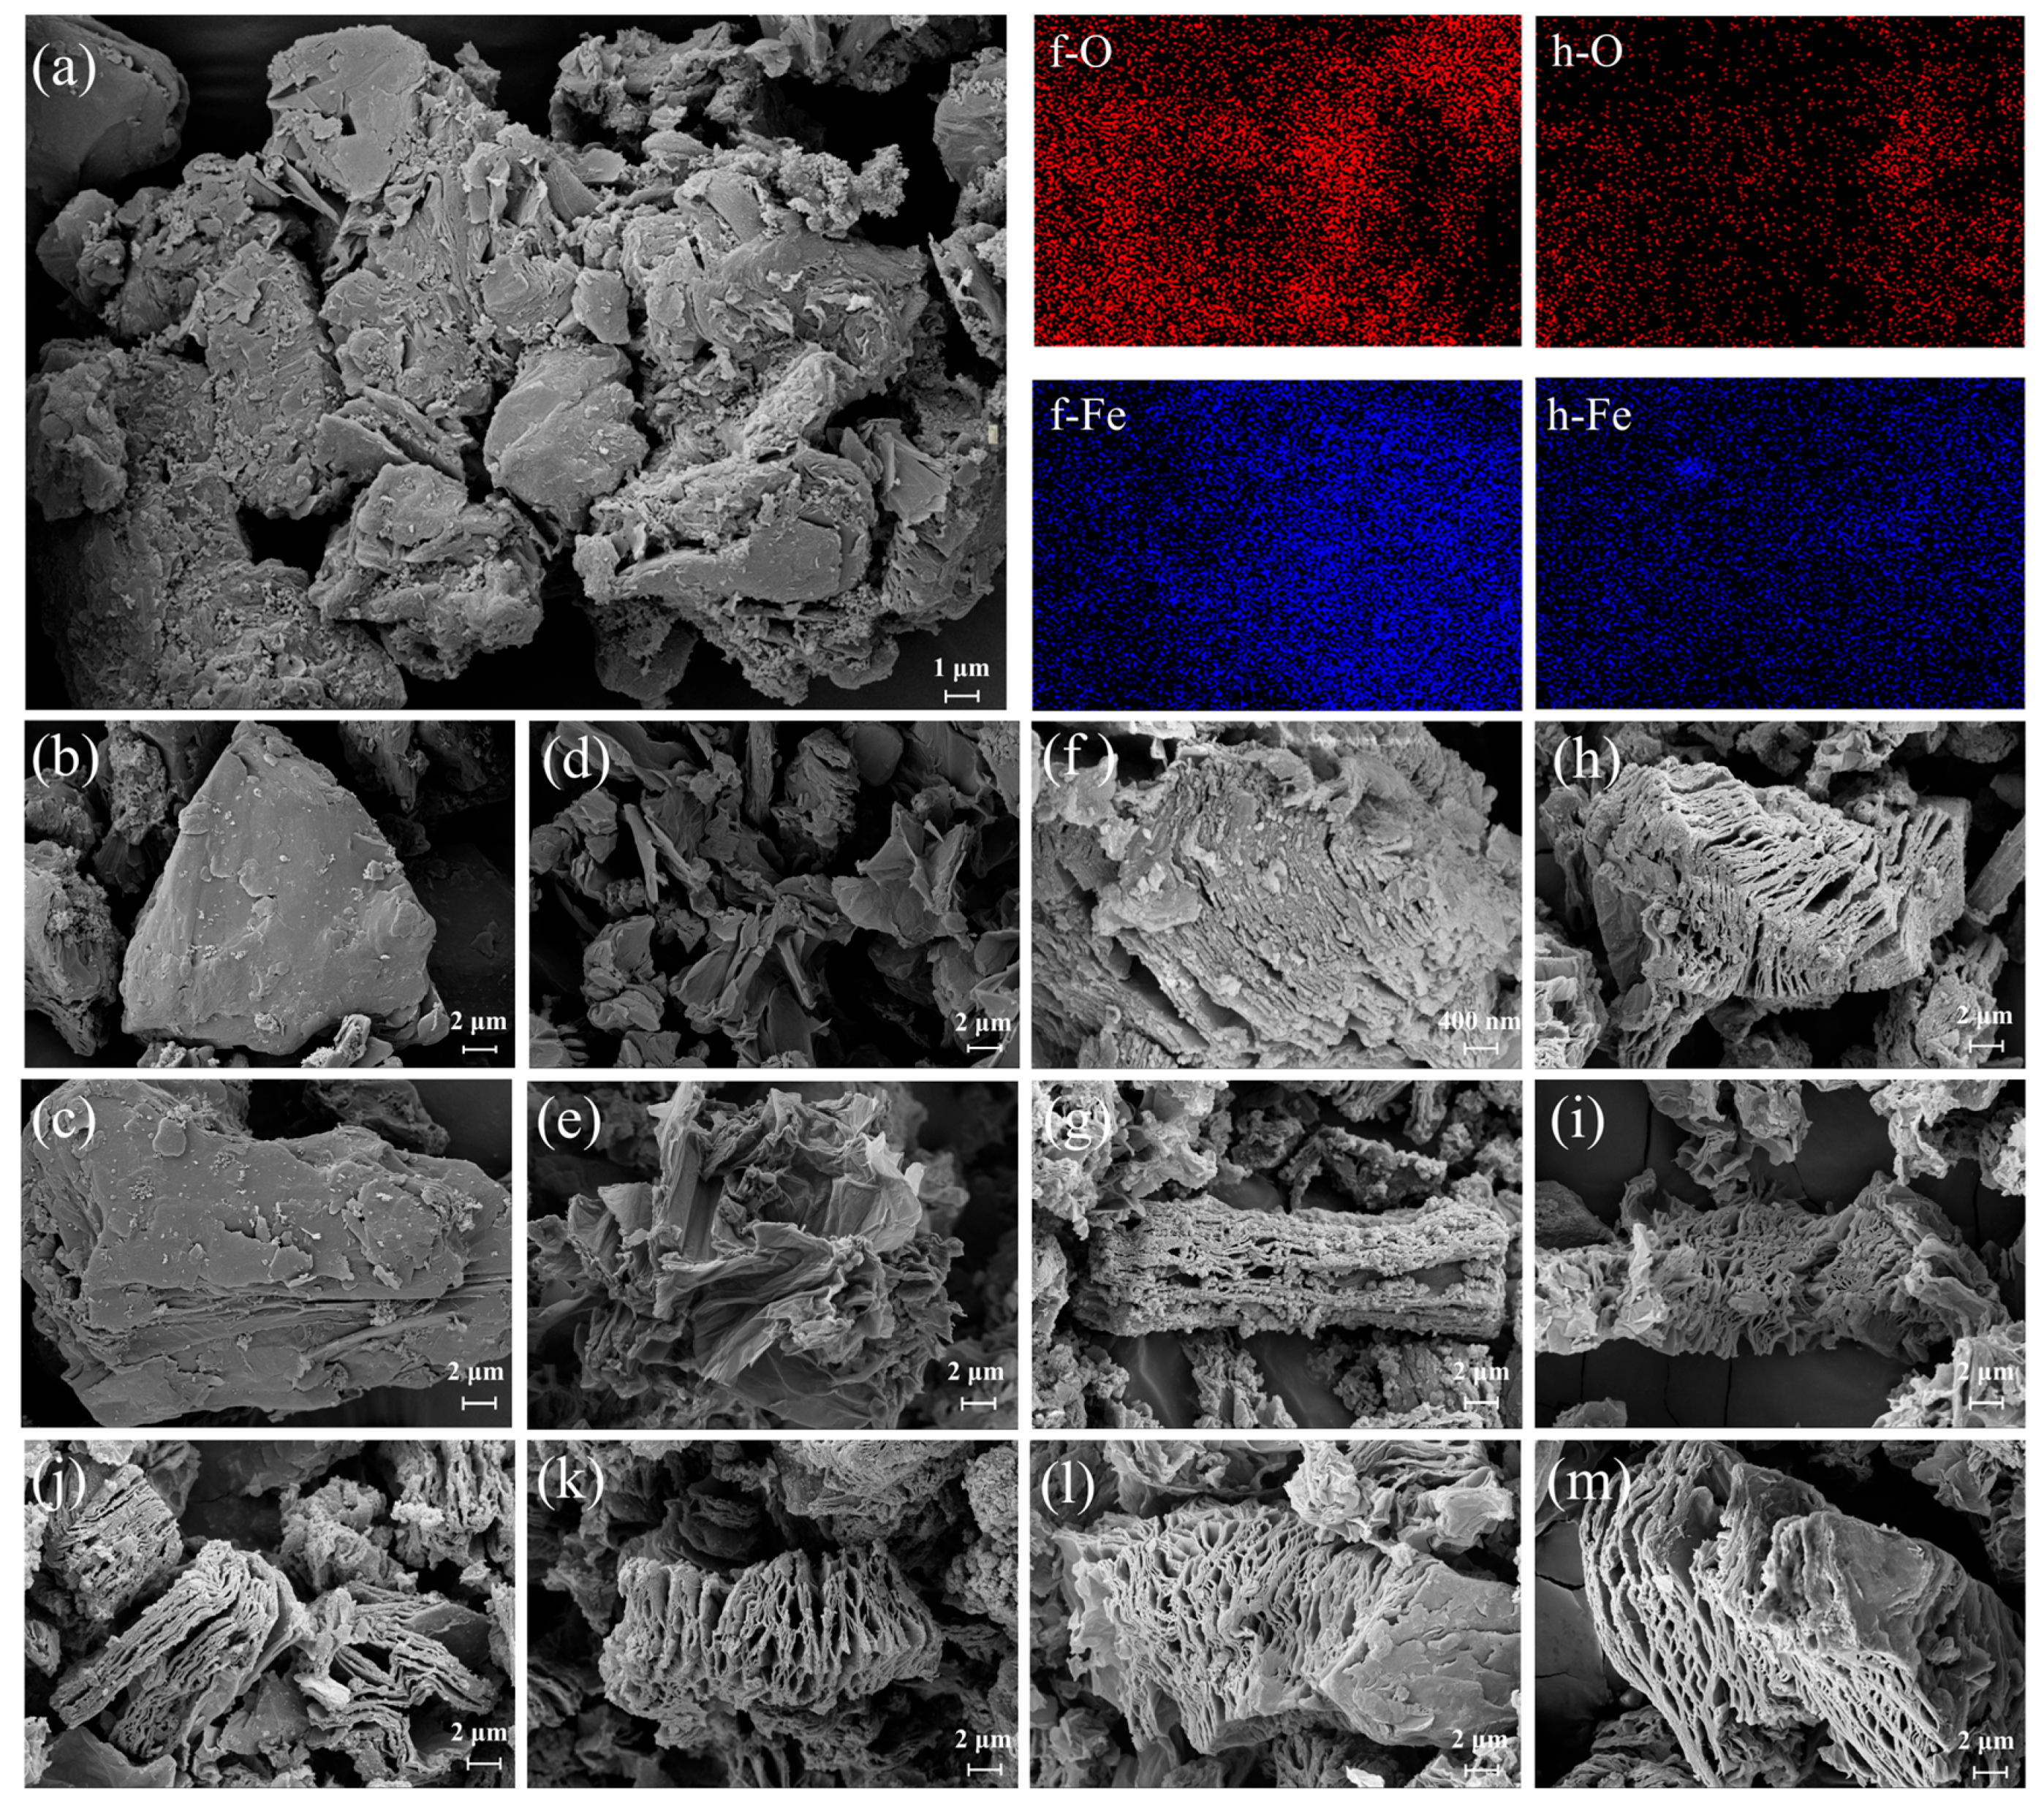
Figure 1. SEM of (a) SG, (b) FJH-80, (c) HTT-1200, (d) GO-FJH, (e) GO-HTT, (f) EG-Fe3+-FJH, (g) EG-Fe3+-HTT, (h) EG-Fe2+-FJH, (i) EG-Fe2+-HTT, (j) FF70-Fe3+, (k) FF90-Fe3+, (l) HF70-Fe3+, (m) HF90-Fe3+.
Recycling 10 00171 g001
Figure 2. SEM of (a) FF70-3, (b) FF90-3’s local morphology (and overall morphology in the red box), (c) HF70-3, (d) HF90-3’s local morphology (and overall morphology in the red box). Pore size distribution plots for the following four samples: (e) FF70-3, (f) FF90-3, (g) HF70-3, (h) HF90-3, (i) the ratio of the holes in the four samples of FF70-3, FF90-3, HF70-3, and HF90-3 to the surface area of the graphite flake layer, and the number of samples N = 5.
Recycling 10 00171 g002
Figure 3. TEM of (a) EG-Fe3+-FJH, (b) EG-Fe3+-HTT, (c) EG-Fe2+-FJH, (d) EG-Fe2+-HTT, (e) FF70-Fe3+, and (f) HF70-Fe3+.
Recycling 10 00171 g003
Figure 4. Isothermal adsorption and desorption curves of (a) flash Joule heating series: FF70-3, FF90-3, FF70-2, and FJH-80, (b) High-temperature treatment: HF70-3, HF90-3, HF70-2, and HTT-1200. DFT Pore size distribution of (c) flash Joule heating series: FF70-3, FF90-3, FF70-2, and FJH-80, (d) High-temperature treatment: HF70-3, HF90-3, HF70-2, and HTT-1200.
Recycling 10 00171 g004
Figure 5. Electrochemical performance of different expanded porous graphite anode materials (The black arrow indicates the corresponding Y-coordinate of the curve.): (a) Specific capacity of flash Joule heating series at 0.1C. (b) Specific capacity of flash Joule heating series at 2C. (c) Specific capacity of 4 groups mixed with iron (III) acetate by hydrothermal method, FJH-80, and HTT-1200 at 2C. (d) Specific capacity of 4 groups treated with 70 V Flash Joule Heating etching at various rates.
Recycling 10 00171 g005
Figure 6. Nyquist plots of flash Joule heating series (a) before cycling and (b) after 600 cycles at 2C. Voltage-specific capacity diagram in the first complete cycle of (c) FJH series and (d) HTT series.
Recycling 10 00171 g006
Figure 7. CV curves of (a) the first three cycles at 0.1 mV s−1 scan rate for FF70-3 and (b) FF70-3 at 0.1, 0.3, 0.5, 0.7, 0.9 mV s−1 scan rates. (c) The fitting curves based on ν1/2 and peak current from CV results at different sweep rates. (d) Log(i) versus log(v) at peak A, peak B, and peak C.
Recycling 10 00171 g007
Figure 8. Experimental procedure diagram.
Recycling 10 00171 g008
Disclaimer/Publisher’s Note: The statements, opinions and data contained in all publications are solely those of the individual author(s) and contributor(s) and not of MDPI and/or the editor(s). MDPI and/or the editor(s) disclaim responsibility for any injury to people or property resulting from any ideas, methods, instructions or products referred to in the content.