Article

Global Supply of Secondary Lithium from Lithium-Ion Battery Recycling

1
German Mineral Resources Agency (DERA), Federal Institute for Geosciences and Natural Resources (BGR), 13593 Berlin, Germany
2
Helmholtz-Zentrum Dresden-Rossendorf, Helmholtz-Institute Freiberg for Resource Technology, 09599 Freiberg, Germany
*
Author to whom correspondence should be addressed.
Recycling 2025, 10(4), 122; https://doi.org/10.3390/recycling10040122
Submission received: 28 April 2025 / Revised: 11 June 2025 / Accepted: 14 June 2025 / Published: 20 June 2025
(This article belongs to the Special Issue Lithium-Ion and Next-Generation Batteries Recycling)

Abstract

:
The recycling of lithium-ion batteries is picking up rather slowly, although recent rapid growth in consumption and increasing prevalence of battery electric vehicles have increased the quantity of recoverable material from past years of production. Yet, the diversity of different product types i.e., chemistries and product life spans complicates the recovery of raw materials. At present, large-scale industrial recycling of lithium-ion batteries employs (1) pyrometallurgy, with downstream hydrometallurgy for recovery of refined metals/salts; and (2) hydrometallurgy, requiring upstream mechanical shredding of cells and/or modules. Regulatory requirements, especially in Europe, and the high industry concentration along the lithium-ion battery value chain drive recycling efforts forward. The present study aims to quantify the potential contribution of 2nd lithium from recycling to battery production on a global and European scale up to 2050. The overall recycling output of lithium in any given year depends on the interactions between several different factors, including past production, battery lifetime distributions, and recovery rates, all of which are uncertain. The simplest way to propagate input uncertainties to the final results is to use Monte Carlo-type simulations. Calculations were done separately for EVs and portable batteries. The overall supply of lithium from recycling is the sum of the contributions from EVs and portable electronics from both the EU and the RoW in each battery production scenario. Results show a total global supply of recycled lithium below 20% in each scenario until 2050. On the EU level, the contribution of recycled lithium may reach up to 50% due to the high collection and recovery rate targets.

1. Introduction

Lithium-ion batteries (LIBs) are currently the most important commercially available battery type for applications such as consumer electronics, e-mobility, and energy storage [1,2]. According to the EU’s Green Deal, LIB production will increase and needs to be optimised in terms of production scrap rates, materials used, and design for recycling [3]. However, most battery raw materials such as lithium, cobalt, nickel, graphite, and manganese currently come from primary resources characterised by a considerable CO2 footprint [4]. An increase in the recycled content of the raw materials used for battery production could improve the CO2 footprint of the batteries [5]. However, recycling LIBs not only faces issues regarding collection and return rates of End-of-Life (EoL) material but is also a technically complex process combined with safety issues [6]. The ramp-up of e-mobility and the resulting increase in demand for battery raw materials have made the recycling of LIBs not only ecologically necessary but also increasingly economically attractive in recent years [5].
According to Circular Energy Storage [7], current global production figures for battery cells are approximately 800 GWh. European production accounts for approximately a quarter, with 200 GWh for 2023. Forecasts for global battery cell production put the figure up to 20,000 GWh in 2050 to achieve the Net Zero Pathway [8]. In Europe, LIB cell production capacity could increase to around 1000 GWh by 2030. At the same time, global new scrap volumes (production scrap) of about 141 GWh are expected by 2030, including about 45 GWh in Europe (Figure 1) [7]. Leaps and bounds in recycling capacities in China, the USA and Europe show the growing trend in this sector.
Despite the rapid growth in consumption and increasing market penetration rates of battery electric vehicles, there are tight limits to recycling, as the volume of material available for recycling does not depend on the current annual battery production, but on past production years, product types, i.e., chemistries, and product lifetime.
Current global return volumes of LIBs available for recycling are about 74 GWh (Figure 1A), and approx. seven GWh at the European level (Figure 1B). Expected volumes in 2030 are about 188 GWh global, or 20 GWh in Europe, which is a considerable increase (Figure 1A,B) [7]. As the number of battery cell production facilities is growing rapidly, production scrap will account for the larger share of materials to be recycled in terms of volume compared to EoL material until 2030 (in Europe). From a global perspective, the EoL volume will already account for the largest share in 2030 due to the Chinese EoL volumes and due to the fact that production scrap, especially in China is already zeroing out. The increased EoL battery volumes are also expected from 2030 onwards in Europe [7]. Considering the volumes of EoL batteries and production scrap, there is currently an overcapacity of recycling facilities on a global scale (combined pre- and post-treatment). However, increased battery cell production and projected recycling capacities point to a large gap in 2030 globally, which implies not enough capacities to process the material available for recycling. In Europe, we might see the opposite in terms of overcapacities and less material availability because of unregulated exports of EoL material as well as recycled spent batteries in the form of black mass. Numerous announcements for new recycling facilities are being published on a weekly basis, which makes it difficult to keep track of recycling capacities, globally and in Europe, in the mid- to long-term. In contrast, however, there are also many cancellations and postponements for recycling plants now.
The aim of the present study is to quantify the potential contribution of secondary lithium from lithium-ion battery recycling to battery production on a global scale up to 2050. Available estimates for the supply of secondary lithium from current studies consider either regional estimations on a country level [9,10,11,12] or scenarios based on the recycling potential from EoL-EV batteries only [13,14]. In addition, those studies do not consider uncertainties on all the input parameters relevant to the outputs.
To further refine those estimates, the authors of this study gathered detailed global data on lithium, from EVs and portable electronics as well as production scrap, to enable better estimates of the future production of cathode material for battery cells, based on secondary lithium supply. A key novelty of this paper is the detailed incorporation of uncertainties into the estimation procedure to account for major current knowledge gaps. This requires consideration of the main factors impacting the availability of secondary resources: (1) LIB types and chemical material compositions, (2) recycling technologies and new developments in this research area, (3) battery lifetime and usage profiles, (4) collection and recovery rates, and (5) governmental/regulatory factors (registration, evaluation, authorisation and restriction of chemicals). Furthermore, additional factors such as new cathode and anode material developments, the development of new recycling technologies, as well as the extension of recycling capacities worldwide will also affect secondary supply in the long term and will be discussed.

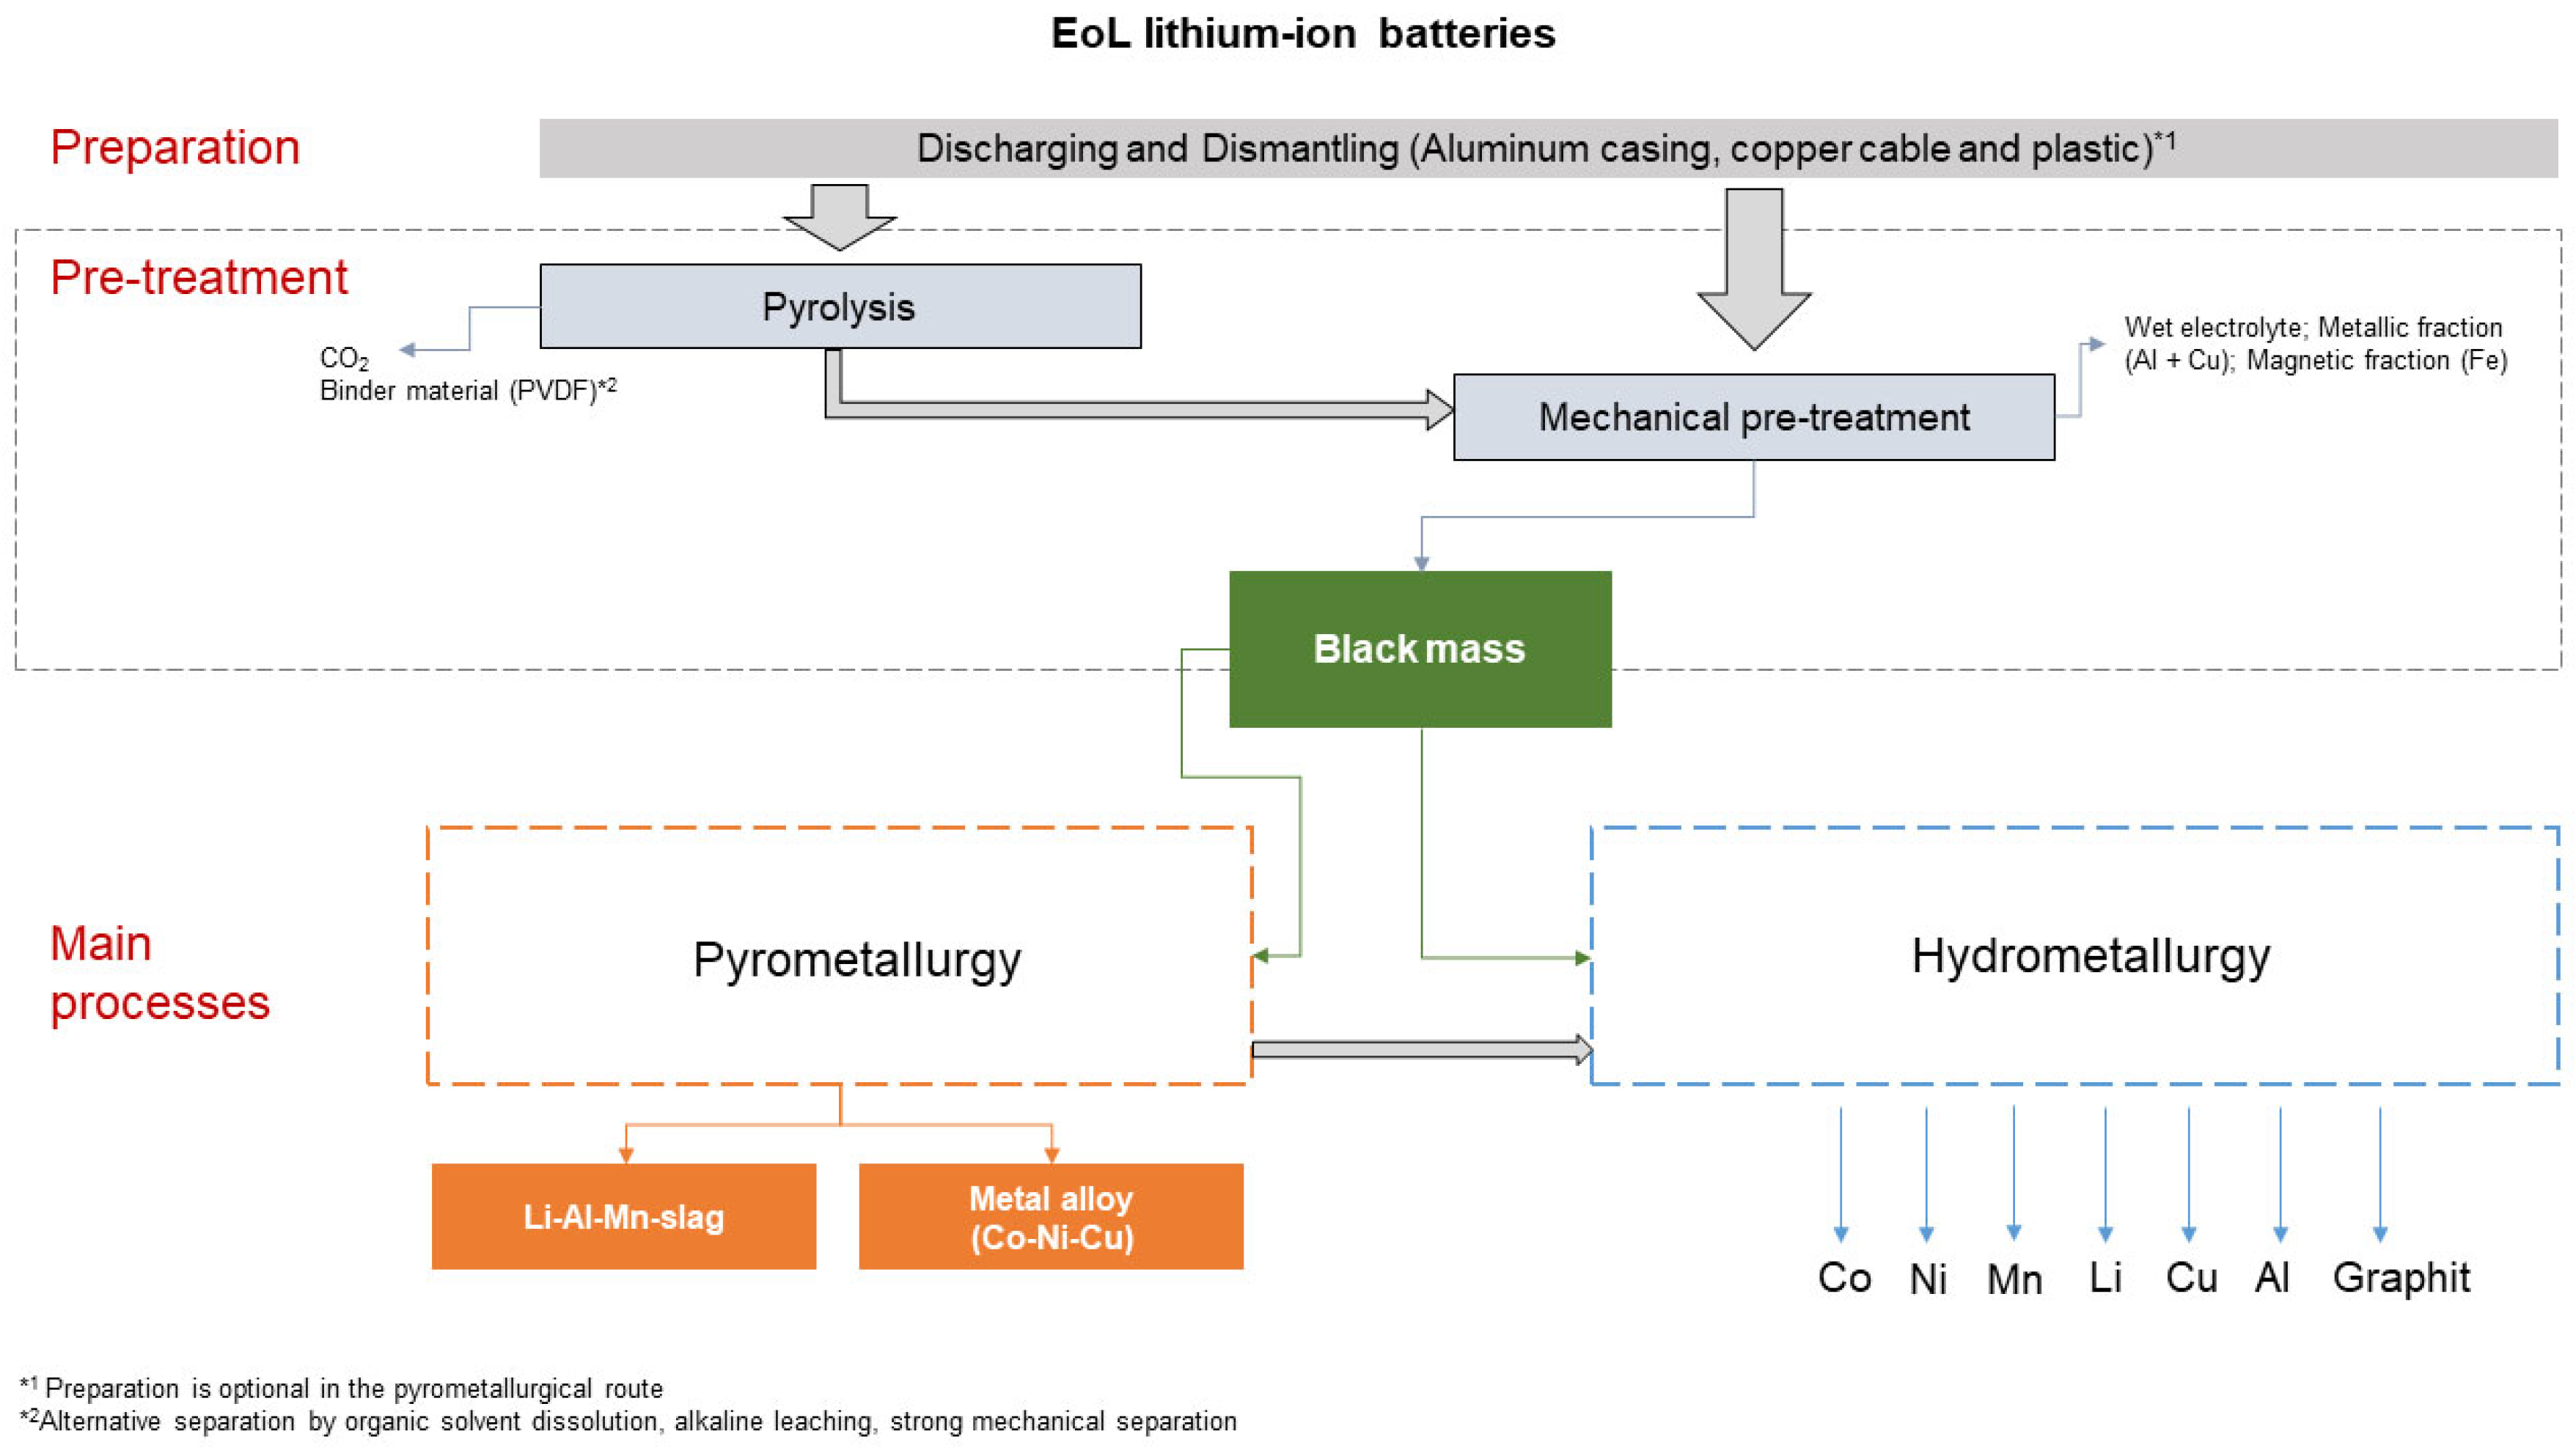
2. Current Recycling Routes

Recycling routes for lithium-ion batteries have been summarised and reviewed frequently by many authors and are briefly addressed below [15,16,17,18,19,20,21]. After the collection and registration of EoL LIBs from either consumer electronics or EVs, the general process for the recycling of LIBs comprises the following steps (Figure 2):
  • Preparation: sorting, disassembly, discharging (optional)
  • Thermal and/or mechanical pre-treatment (optional)
  • Main processes: pyro- and/or hydrometallurgy; direct recycling
After preparation, the aluminium casing, copper cables, and plastic are recycled and returned to the general production cycle. Physical processes typically involve pre-treatment including disassembly, crushing, screening, magnetic separation, washing, and heat treatment. Chemical processes are grouped into pyro- and hydrometallurgical processes, which usually require leaching, separation, extraction and chemical/electrochemical precipitation [22].
Pyrometallurgy uses high-temperature processes usually above 1400 °C [23] with the addition of slag formers to convert waste battery materials (i.e., entire battery systems; dismantling at the cell level is not necessary) into metal alloy containing cobalt, nickel, and some of the original manganese and copper. This metal alloy can then be processed by hydrometallurgy, whereby cobalt, nickel, and manganese sulphates are obtained and subsequently used for new batteries or other products. During pyrometallurgical processing, lithium, manganese, aluminium, and if present oxidized iron, are transferred to the slag, whereas graphite serves as a reducing agent and burns off. Manganese and lithium can be recovered by hydrometallurgy from the slag. Aluminium and iron can currently not be recovered economically. The lithium content of the slag is generally comparable to the lithium content of spodumene concentrates with approx. 2.79% lithium [15].
The purely hydrometallurgical route uses an initial thermal and mechanical pre-treatment of the LIBs. Thermal pre-treatment serves to remove bonding material, which typically consists of polyvinylidene fluoride (PVDF) or polytetrafluoroethylene (PTFE). In the next step, the battery modules are mechanically crushed (shredded) under a protective atmosphere and turned into a wet mass by the released liquid electrolyte. Further fractions with high product contents, which can be recovered mechanically as well, are copper and aluminium concentrate (from the anode and cathode foils of the LIB cells) and the steel/casing fractions. Yield and purity of individual recycled products can be increased by suitable measures (e.g., avoidance of overgrinding). Through drying, sieving, and magnetic separation, the shredded material becomes finer. Finally, the so-called “black mass” is produced, which consists mostly of fine particles of mixed cathode and anode materials, thus containing lithium, manganese, cobalt, nickel, and graphite. Contents of valuable materials, particularly cobalt, nickel, and graphite are highly variable, as the composition of LIBs differs significantly depending on the manufacturer. Black mass is then separated into its components using various dissolution processes (including solvent extraction). Theoretically, graphite could be recovered, but this is currently not done on an industrial scale and in a reusable form [24,25].

3. Materials and Methods

The following subsections initially describe the general estimation approach. They then deal with the input data, their sources and uncertainties, and any assumptions that were made in order to compile the final estimates.

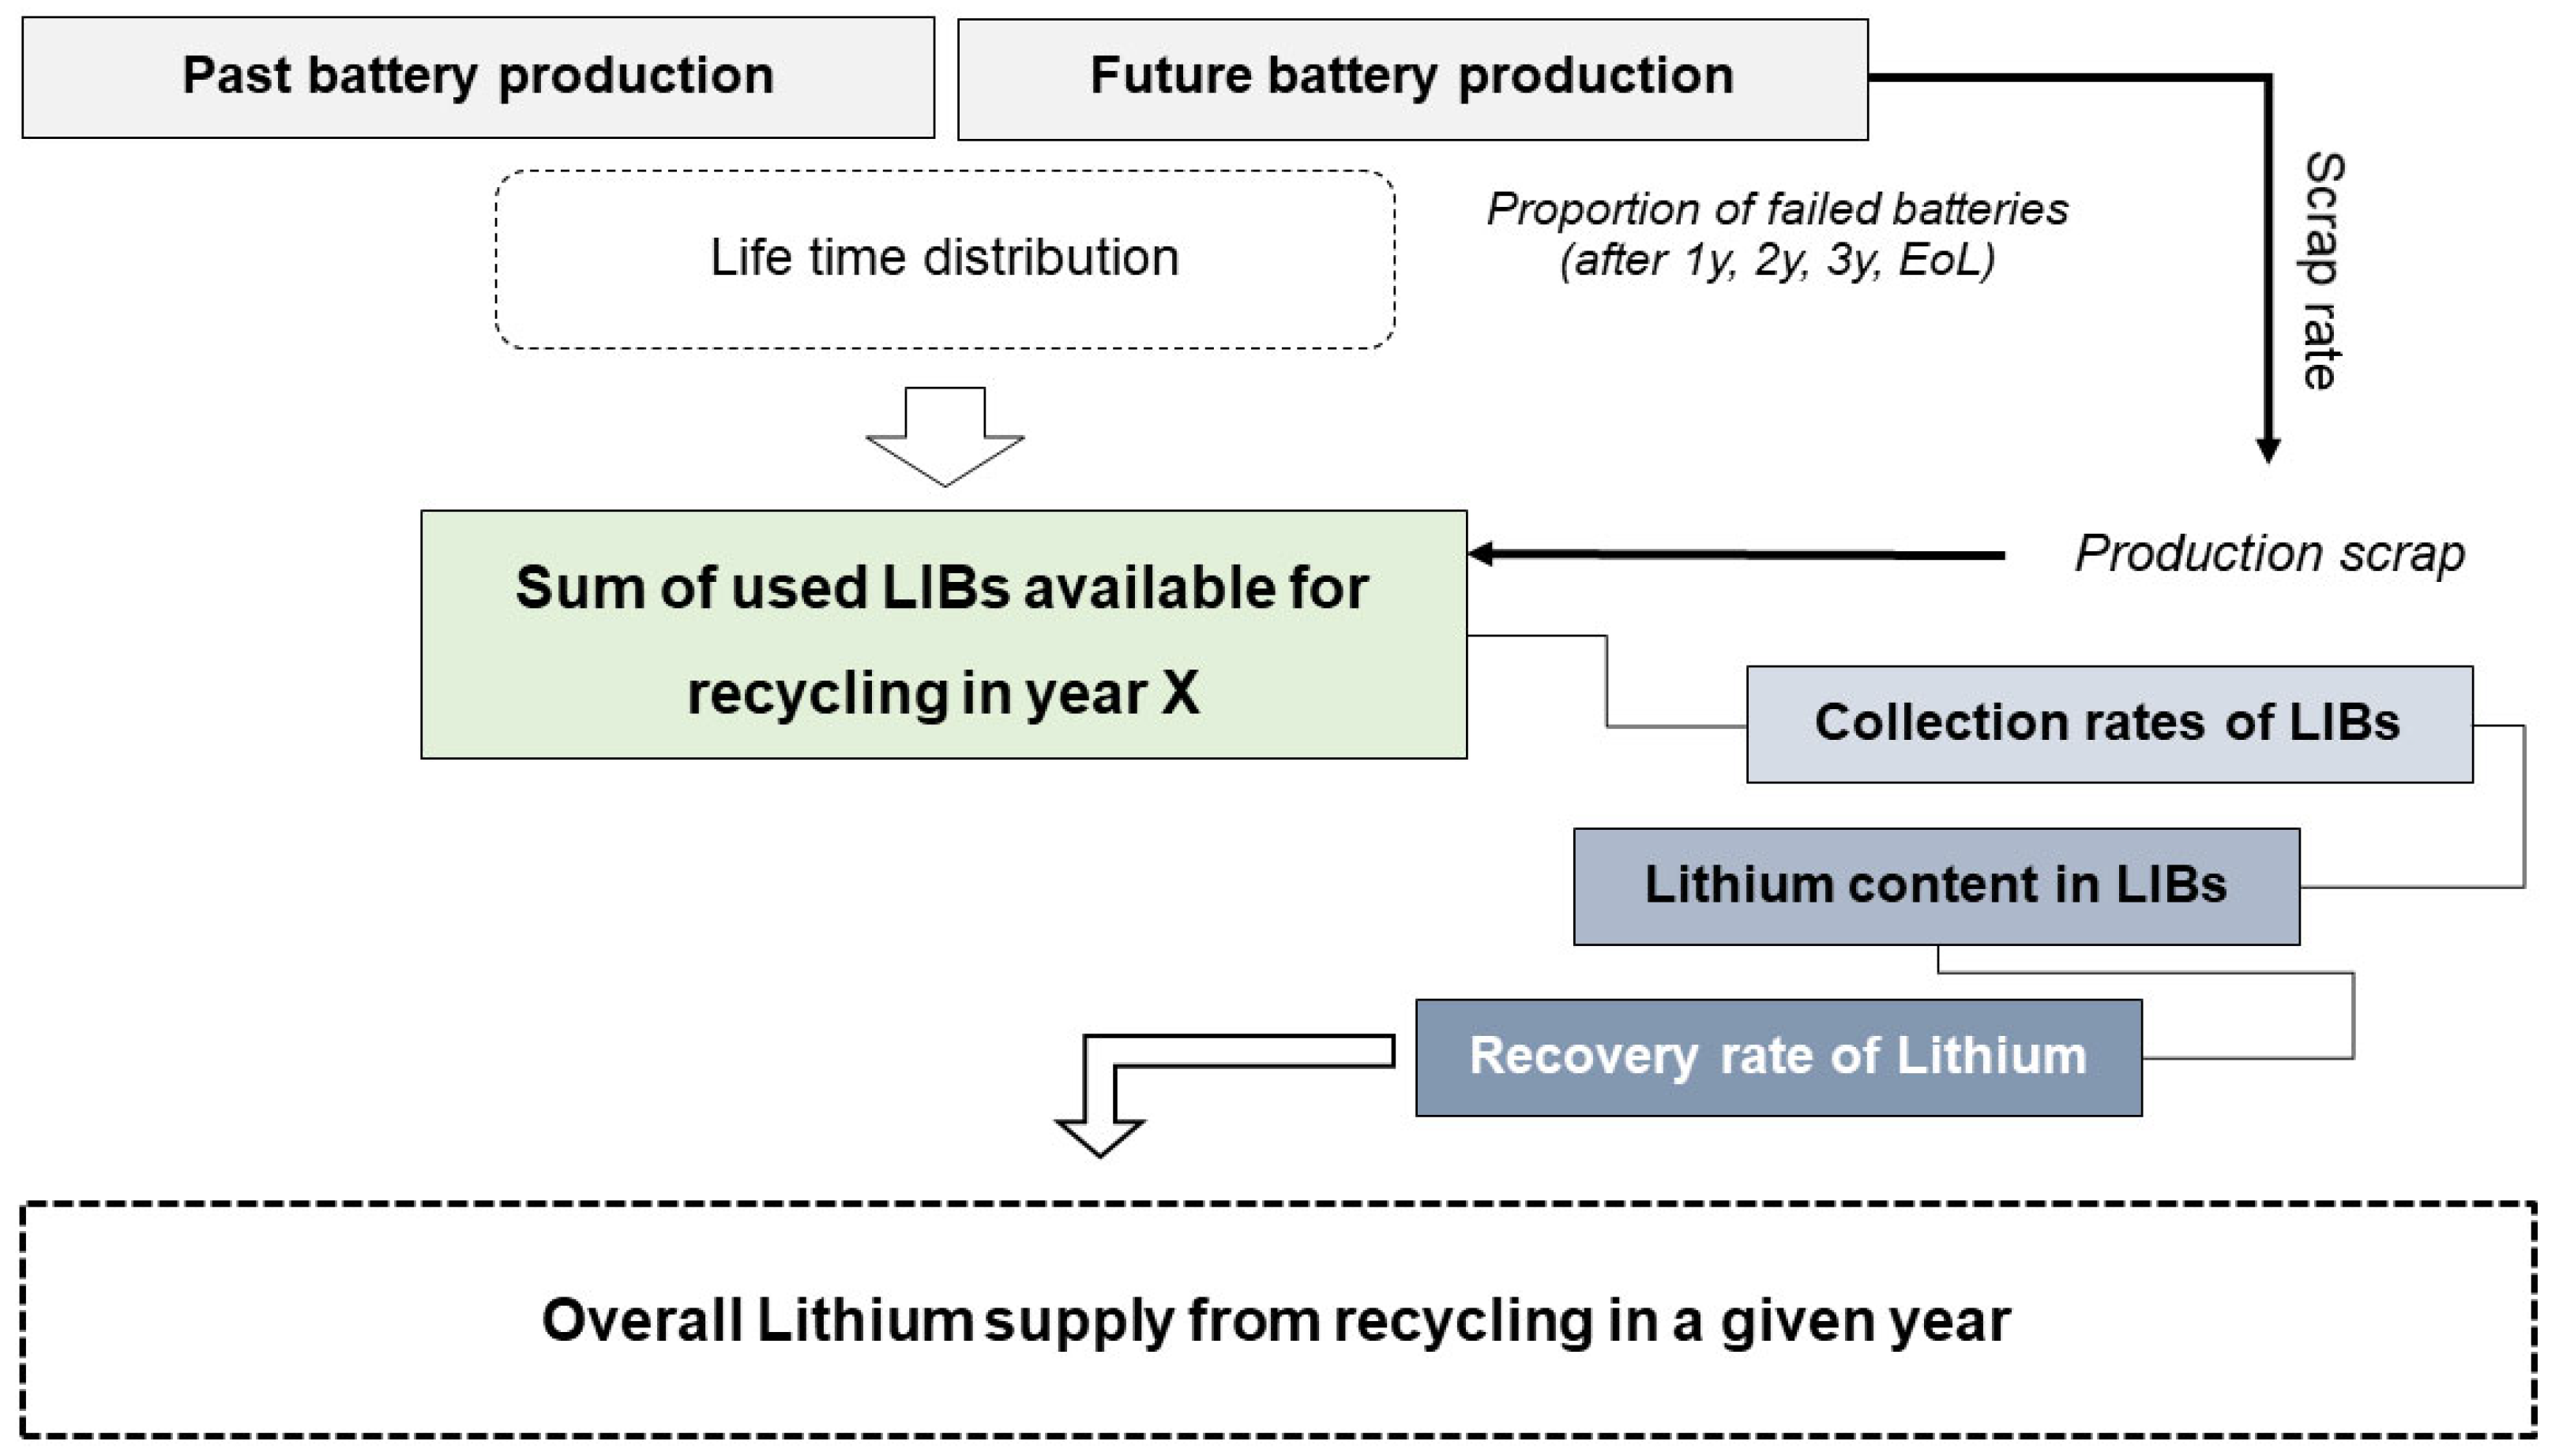
3.1. General Approach

Since the overall recycling output of lithium, in any given year, depends on the interactions between a number of different factors, including past production, battery lifetime distributions, collection rates, and recovery rates, the simplest way to propagate input uncertainties to the final results is to use Monte Carlo-type simulations. Monte Carlo simulations serve as the methodological basis for the solution approach pursued in the present study. These simulations are a widely used tool in the natural sciences, as they allow the modelling of the dynamics of complex systems by means of the composition of relatively simple individual components. One of the most important applications in current research is the quantitative analysis of probabilistic systems, which are relevant in a wide range of areas from solid-state physics to climate research. Monte Carlo simulations are an extremely versatile tool and, due to their great flexibility, are particularly suitable for the task to be solved in the present study. Two specific components are required as input here: firstly, a concrete simulation structure and secondly, probability density distributions for the input variables to be considered.
Monte Carlo simulation allows for the specification of all input data in terms of known or assumed probability distributions reflecting their inherent uncertainties. The outputs are then numerically generated probability distributions of the desired quantities. Similar strategies were previously used to estimate the likely availabilities of by-products such as Ga, Ge, In, and Te from global raw material streams [26,27].
To show the effect of future market growth on the likely supply of secondary lithium in a more simplified way, three separate estimates corresponding to low, medium, and high future production scenarios were made, instead of simulating a continuous distribution of production scenarios. For each of the three scenarios, 1000 simulations were run, using input parameters drawn randomly from distributions described in the following subsections.
Simulated input parameters were then fed through a calculation procedure to quantify lithium recycling flows. Figure 3 schematically shows the overall structure of this procedure. The total amount of EoL batteries available each year (in GWh/yr) is estimated from past production figures and a specified battery lifetime distribution as:
B E o L T = i = 1 N P T i F t T i t = i F t T i ( t = i 1 )
where T is the year, for which the amount of EoL batteries is calculated, P T i is the battery production in year T i , F t T i t = i is the cumulative failure rate of the batteries produced in year T i at i   years after their production (from lifetime distribution), and N is the number of years into the past, to which the sum is evaluated. In the present case, N = 20   y e a r s was used, since it is expected that most batteries will have failed after this time given current and likely future lifetime distributions (see below).
In addition, production scraps were considered as a fixed percentage of the production, denoted by the scrap rate S R , in each year:
S c r a p T = P T S R T
The quantity B E o L T is then multiplied with the corresponding collection rate, C o l l T , added to S c r a p , and the total multiplied by the lithium content in the batteries, C L i , and the recovery rate of lithium for year T , R e c T , to calculate overall lithium supply from recycling in a given year in each simulation:
L i r e c y c l i n g T = B E o L T C o l l T + S c r a p T C L i R e c T
The overall recycling contribution of lithium to battery production is then equal to:
L i r e c y c l p p t n T = L i r e c y c l i n g T ( P T C L i 1 + S R T )
These calculations were done separately for EV and portable batteries, and also for the EU as well as the rest of the world. These separations were made, since lifetime distributions for EV and portable batteries are expected to be different, and also because EU collection and recovery rates were used as upper limits in the models, with the rest of the world either having lower or similar rates. The underlying assumptions are described further below. Finally, the overall supply of lithium from recycling is the sum of the contributions from EVs and portable electronics from both the EU and the rest of the world.

3.2. Past and Future Battery Production

Past production numbers for both EV and portable batteries are based on reports by Circular Energy Storage [7] for Europe and the rest of the world, and go back until the year 2000. The three scenarios that were used for future production are based on an evaluation of the literature studies presented in Table 1 and are included in Supplementary Materials, Table S1.
For portable batteries, only one forecast of future production numbers was used, assuming moderate growth rates of ~1.5% per year until 2050. This is loosely based on the forecasts by Circular Energy Storage [7] up to 2030, and the assumption that the portable electronics market is a relatively mature market already. Since the expected contributions of portable batteries to the future market growth are so low, uncertainties on these forecasts are negligible for the present study.
The main differences between the three production scenarios arise from the forecasts for EV battery production. In the low-production scenario, a combination of the scenarios put forward by Öko Institut [28] and Avicenne Energy [29] was used, as well as the low-demand scenario of Moores [30], with global production at ~1500 GWh/a in 2030, ~4000 GWh/a in 2040, and ~5000 GWh/a in 2050. For the high-production scenario, reference points of ~6000 GWh/a in 2030, ~10,000 GWh/a in 2040, and ~20,000 GWh/a in 2050 were used, based mostly on the high-production scenario of Benchmark Minerals [8] Finally, 50% of the high-production scenario values were used for the medium-production case. In order to interpolate smoothly between current production and these future figures, third-order polynomial fits as shown in Figure 4 were used.
For the proportions of EV and portable batteries consumed in Europe, estimates by Circular Energy Storage [7] were used for past production. For future years, the assumption was made that the proportions of EV and portable batteries used in Europe as a fraction of global demand would be constant with time and fall somewhere between 20 and 30% of the world market. A uniform distribution between 20 and 30% was used to include this uncertainty in the simulations.
Table 1. Summary table of the literature studies showing annual lithium-ion battery production capacities until 2050 in GWh globally.
Data Source20162020202220232025202720292030203520402050
Rho Motion (EVs) [31]-154473698113216012236265145686786-
S. Moores [30]-501--2492--3010-39005000
Benchmark Minerals [8]-501--2492--6700 (NET Zero Pathway) 11,800 (NET Zero Pathway)20,000 (Net Zero Pathway)
S&P Global Mobility (EVs) [32,33]-45596612462800--5900---
Avicenne Energy [29]94232350-609--1300---
IEA, Global EV Outlook (EVs) [34]---1500---5500-6500-
Öko Institut (B2DS Szenario-“Unter 2 Grad Szenario”) (EVs) [28]>100------1500--6600
Circular Energy Storage [7] 1202655887211059155823332900---

3.3. Lithium Contents in Batteries

Lithium contents in different battery types were compiled from the literature and are summarized in Table 2. Most of the values range between 0.08 and 0.12 kg/kWh. To convert estimates of recycled LIBs capacity to lithium contents, an average value of 0.10 kg/kWh was applied. Uncertainties for lithium contents in our estimates were not explicitly included. Rather, all calculations were done in terms of battery capacities (GWh) and results were subsequently converted to million tons of lithium carbonate equivalent (LCE).
This approach is equivalent to assuming that lithium contents in batteries are constant over time. In this case, the overall lithium contents do not matter, since the proportions of recycled versus consumed lithium in any given year will remain the same as recycled vs. consumed battery capacities in GWh. Only if lithium contents increased or decreased systematically over time, differences in the results should be expected. While this may happen in the future, it is hard to predict in which direction the variation will tend. If more LFP batteries are used, then somewhat lower future lithium contents would be expected. If solid-state batteries gain importance, lithium contents in future batteries might be higher, between 0.26 and 0.52 kg/kWh [36]. There are no data available for the lithium content in Li-sulfur batteries, but [36] assume a lithium content of 1.2 kg/kWh, based on data for high cathode metal demand values for LIBs [37].
Decreasing future lithium contents in batteries would mean a faster growth of potential recycling contributions to overall supply than in our simulations while increasing lithium contents would mean slower growth of the recycling contributions. However, since these effects are expected to be small as long as LIBs are the main battery type (≤10% relative variation), this was not included in our estimation. Other sources of uncertainty, such as battery lifetimes and recycling and collection rates are much more important.

3.4. Battery Lifetimes

Distributions of battery lifetimes are one of the most critical inputs into the simulations since they are an important determinant for the amount of EoL batteries available each year for recycling (cf. Equation (1)). Unfortunately, very little primary information is available on the lifetime distributions for batteries actually used in vehicles and portable electronics. This is probably because lifetime distributions are classified as confidential information by individual companies.
Due to the lack of information, available data points and a set of assumptions were used to estimate the likely shape of battery lifetime distributions for EVs and portable electronics. Available data points are warranty periods offered by manufacturers for their products and a selection is listed in Table 3. Assumptions concern the likely properties of the engineered lifetime distributions compatible with these warranty periods.
For EV batteries, most manufacturers currently offer eight-year warranty periods (Table 3). Offering such a long warranty period can only be economical if the vast majority of batteries are expected to survive for at least this amount of time. Therefore, it was assumed that the likely survival rate of current EV battery packs ranges between 80–95% for the first eight years. On the other hand, manufacturers cannot be assumed to have an interest in producing battery packs that last substantially longer than the warranty period. This is because battery exchanges are expected to be a major source of revenue. Therefore, we assumed that median lifetimes (50% cumulative failure) are around two years longer than the warranty period, i.e., 10 years at present.
Using these constraints and assuming a simple two-parameter probability distribution model, it is possible to estimate the corresponding sets of distribution parameters: one for an 80% survival rate at eight years, the other for a 95% survival rate at eight years; and both with a 50% survival rate at 10 years. A two-parameter Weibull distribution was used here with estimated α (=shape) and β (=scale) parameters for both cases. The results are shown graphically in Figure 5A,B. Random linear mixing of the two-parameter sets according to a uniform distribution was then used to generate the specific parameters for the distributions used in each simulation.
Uncertainties with respect to the present shape of battery lifetime distributions are not the only relevant uncertainties for the present paper. Uncertainties also exist for the past and future evolution of these distributions. For the past, a slow increase in a lifetime from a warranty-relevant period of five years in 2007 to eight years in 2020 (at an 80–95% survival rate) was assumed. Ranges for the distribution parameters α and β for the batteries produced in these years were estimated under similar assumptions as above, assuming failure rates of 80–95% at the end of the warranty-relevant period, and 50% two years after. For the future development of EV batteries, two end-member cases were assumed: (a) that EV battery lifetimes would not improve further, i.e., that the current distributions apply in the future, and (b) that battery lifetimes keep increasing until 2030, reaching a value of 15 years for the warranty-relevant period in 2030, and then remain constant. Distribution parameters for the future were estimated as linear mixtures between these two endmember cases, using a uniform distribution (0–1) to simulate the proportion of mixing. Therefore, average battery lifetimes in the simulations increase over time, reaching about ~11 years in 2030 (at the 80–95% failure rate).
For portable electronics, the derivation of lifetime distribution parameters and their uncertainties followed a similar logic as for the EV batteries above. However, warranty periods of two years [43] were used (at 80–95% failure rate), assuming 50% of failures to occur after three years. This was assumed to improve slightly to three years for the warranty-relevant period by 2035, and 4.5 years for the 50% cumulative failure rate. Table 1 in the electronic supplement summarizes the parameter sets used to describe the past and future trends in EVs and portable batteries.

3.5. Production Scrap Rate

As already noted in Equations (2)–(4) the potential contribution of production scraps to total lithium production was also considered. By definition, these are faulty products (e.g., battery packs, cell banks, individual cells), which never enter the market, rather than wastes of cathode or anode materials. These products must be treated in the same way as EoL batteries to recover the contained materials since they are already assembled. It is therefore essential to consider these wastes together with EoL batteries as a source of secondary lithium supply. In addition, scrap rates also affect lithium demand since their production uses up lithium that should normally have gone into finished products (Equation (4)). Therefore, the actual use of lithium for batteries must be higher than the demand for finished batteries by the scrap rate, and thus lithium production was adjusted accordingly in each simulation.
Since current rates of scrap production are unknown, a uniform distribution between two end-member scenarios was used and applied to all battery types: (1) a current scrap rate of 10%, decreasing to 5% in 2035, and (2) a current scrap rate of 5% now, decreasing to 3% in 2035. Values were assumed to be comparatively low, i.e., generally <10% because there are strong economic incentives to minimize them. The assumed decreases over time are intended to reflect the expected maturation of the production technology with increases in volume, and associated reductions in scrap rates. After 2035, production scrap rates are assumed to remain constant.

3.6. Collection Rates

Once batteries reach the end of their service life, they must be collected in order to become available for recycling. This process is generally not perfectly efficient, i.e., collection rates are typically lower than 100%. It is assumed in this paper that collection rates differ by battery type, with EV batteries being more likely to be collected.
In the simulations, current EU collection rates for EV batteries are assumed to be at 90% [44] with a gradual increase to 100% by 2050 in all cases. This is an optimistic scenario, but very high collection rates of >90% are probable since manufacturers are likely to develop their own collection systems. Besides the batteries and their material contents represent a major contribution to the material costs of electric vehicles, which is likely to continue into the future.
For portable batteries, collection rates in the EU are assumed to rise rather linearly from 47.4% in 2018 [45] to 63% in 2027 and then 73% in 2030, following EU targets. After this, portable battery collection rates in the EU are considered to remain approximately constant at the proposed 2030 level.
EU collection rates constitute a best-case scenario since the EU is currently implementing measures and regulations to support a circular economy. For the rest of the world, this is not generally the case [46], and lower collection rates for both EV and portable batteries are therefore probable. However, the exact future rates are uncertain. Therefore, a uniform probability distribution between a best-case and worst-case scenario is assumed in order to describe uncertainties regarding global collection rates. In the worst-case scenario, average collection rates for EV batteries and portable batteries in non-EU countries are assumed to be 50 and 0%, respectively. In the best-case scenario, collection rates similar to EU rates are assumed.
Since scrap is produced within the supply chain, it is reasonable to assume that this material will enter directly into recycling processes. Collection rates for production scrap can therefore be assumed to be 100%, unlike for EoL batteries.

3.7. Recovery Rate

The current recovery rate of lithium from LIBs is highly uncertain, but probably very low, since recovery is not economic at the moment [47]. Therefore, recyclers will probably follow regulations imposed upon them by governments. In the EU, legally mandated recovery rates for lithium will be 50% in 2028, and 80% in 2032 [3]. For our calculations, it was assumed that EU recovery rates for lithium will show a linear increase from 0% today to the target rate of 50% in 2028, and subsequently 80% in 2032. Thereafter, the lithium recovery rate was assumed to remain constant at the 2032 level. For the rest of the world, two scenarios were assumed, a worst-case scenario with a recovery rate of 0% as well as a best-case scenario with a recovery rate similar to those mandated in the EU, with a uniform probability distribution describing the likelihoods of intermediate cases.

4. Global Results

In the following subsections, we briefly summarise the global results of the statistical analysis for each production scenario. Figure 6 summarises these results for all production scenarios, showing both the median estimates and 95% confidence intervals (C.I.s) through time. While differences exist in the absolute production, scrap, and EoL battery quantities (in terms of Mt/a of LCE) between scenarios, it is noteworthy that they all follow similar trends. The estimates for collected batteries plus scrap as a proportion of total production generally stay below 40%, while estimated recycling contributions are unlikely to reach the 20% mark by 2050 in all of the production scenarios.

4.1. Low Production Scenario

In the low production scenario, the calculated amount of LCE contained in batteries increases from 0.4 Mt/a (million tons/annum) in 2024 up to 2.7 Mt/a in 2050. In the low production scenario (Figure 6A) the median total scrap volumes plus EoL batteries in terms of Mt of lithium carbonate equivalent (LCE) per year increases from less than 0.1 Mt/a in 2024 up to 1.8 Mt/a in 2050. The 95% C.I. of the median total scrap volume and the EoL battery amount ranges between 0.07 and 0.09 Mt/a in the year 2024 and between 1.4 and 2.2 Mt/a in the year 2050. Uncertainties are already substantial for EoL batteries plus scrap rates (Figure 6A). This reflects the uncertainties in the lifetime distribution parameters since there are no other uncertainties that affect the estimated total amounts of EoL batteries in these simulations.
The median of the total return flows is expected to grow from 18% in 2024 (95% C.I.: 16–20%) to 64% in 2050 (95% C.I.: 49–77%), as a fraction of battery production. Based on our model assumptions, new scrap production will contribute around a third of these total return flows (5–9% of production, 95% C.I.) until 2030 (Figure 6B). After 2030, new scrap rates are expected to decrease, down to a contribution to the total return flow of 3 to 5% (95% C.I.) by 2035. These assumptions were made for the global and European markets, resulting in the same values, and will not be mentioned again in the description of the European results.
The total material volume available for recycling (collected EoL batteries and new scrap) is expected to increase from 12% (95% C.I.: 8–15%) in 2024 to 13% (C.I.: 9–17%) in 2030, 14% (C.I.: 8–25%) in 2035, and 39% (19–69%) in 2050 (Figure 6C). The median contribution of lithium recycling to total battery production is expected to be 0.7% (95% C.I.: 0.3–1.3%) in 2025. In 2050, recycling production is expected to grow to a median of 17.7%, with a comparatively wide 95% confidence interval of 6.1–44.0% (Figure 6D).

4.2. Medium Production Scenario

In the medium production scenario, battery production in 2024 is expected to amount to an equivalent of 0.6 Mt/a LCE, going up to 5.4 Mt/a LCE in 2050. Based on this, the median total scrap volumes plus EoL batteries increase from less than 0.1 Mt/a LCE in 2024 up to 2.8 Mt/a LCE in 2050 (Figure 6E), with 95% C.I.s of 0.08–0.11 Mt/a in 2024, and 2.2–3.4 Mt/a in 2050. Uncertainties for these figures are similarly substantial as in the low production scenario, reflecting again the uncertainties in the lifetime distribution parameters.
New scrap production might contribute 0.04 Mt/a LCE in 2024 as part of the total scrap volumes, with a 95% C.I. of 0.03–0.06 Mt/a LCE. In 2050, the new scrap volume might increase to 0.22 Mt/a LCE (95% C.I.: 0.17–0.27 Mt/a LCE) (Figure 6E).
In percentage terms, the median total return flow of EoL batteries and new scrap is expected to grow from 15% of total battery production in 2024 (95% C.I.: 13–16%) to 51% in 2050 (95% C.I.: 40–50%) (Figure 6F). Collected batteries plus new scrap will amount to 10% in 2024, expected to grow to 32% in 2050 (95% C.I.: 16–54%) in 2050 (Figure 6G). Finally, recycling could contribute a median of 14% of total battery production in 2050, with a 95% C.I. ranging from 5 to 35% (Figure 6H).

4.3. High Production Scenario

In the high production scenario, LCE consumption for batteries is projected to grow from 0.9 Mt/a LCE in 2024 to 10.7 Mt/a LCE in 2050 (Figure 6I). In this scenario, the median total return flow of batteries (new scrap and EoL) would amount to 12% of overall battery production in 2024 (with a 95% C.I. of 10–14%), and would grow to 50% in 2050 (95% C.I. of 39–61%) (Figure 6J). Collected EoL batteries and new scrap would be 9% (6–11%) of total battery production in 2024, reaching 32% (15–54%) in 2050 (Figure 6K). Lithium recycling would be expected to contribute 0.5% to total LCE use in batteries in 2025, and 14% in 2050, with 95% C.I.s of 0.2–0.9% and 5–35%, respectively (Figure 6L).

5. EU Results

Similar to the global results, the estimates done at the EU level (Figure 7) show comparable patterns in each scenario for the total percentages of new scrap plus EoL batteries as a fraction of total production/consumption. The median estimates for collected batteries reach between 50–60% by 2050 in all scenarios. A decrease in this proportion from 2020 to 2025 was also noted. This is largely due to the shift from portable batteries to EV batteries as the main constituents of EoL battery flow. In contrast to the global results, overall recycling contributions are expected to be higher, reaching around 50% by 2050 in the low-production scenario. In the medium and high production scenario recycling might contribute ~40% of the lithium demand for battery production by the year 2050. These higher proportions largely reflect the effects of the planned regulatory framework in the EU (cf. methods section).

5.1. Low Production Scenario

For the EU, the median usage of LCE in batteries is expected to increase from 0.1 Mt/a in 2024 up to 0.7 Mt/a in 2050 (Figure 7A) in the low-production scenario. Thus, the median total scrap volumes plus EoL batteries in terms of contained LCE per year are expected to increase from 0.02 Mt/a (0.016–0.022 Mt/a) in 2024 up to 0.44 Mt/a (0.31–0.61 Mt/a) in 2050. Again, the uncertainties are already substantial for these flows (Figure 7A). The 95% confidence interval of the percentage of collected material and new scrap is 11–16% (median: 14%) in 2024. This range grows wider in the future years to 16–29% in 2035, and 49–76% in 2050 (Figure 7C). The probable recycling contribution of lithium in 2025 amounts to 1.3% (1.1–1.6%) of total lithium use in batteries. In 2050, this could increase to 51% (39–61%) (Figure 7D).

5.2. Medium Production Scenario

In the medium production scenario, the median LCE use in batteries for the EU amounts to 0.15 Mt/a LCE in 2024, increasing to 1.35 Mt/a LCE in 2050 (Figure 7E). The median total return flow would grow from 14% in 2024 (95% C.I.: 12–17%) to 51% in 2050 (95% C.I.: 40–60%) (Figure 7F). The total proportion of collected material plus new scrap would be 12% (95% CI: 9–14%) in 2024 and 50% (95% C.I.: 40–60%) in 2050 (Figure 7G). The contribution of lithium from recycling would then amount to 1.1% of total battery consumption in 2025 (95% C.I.: 0.9–1.3%), reaching 40% (32–48%) in 2050 (Figure 7H).

5.3. High Production Scenario

In the high production scenario, 0.23 Mt/a LCE are consumed by battery production for the EU in 2024 (95% C.I.: 0.19–0.28 Mt/a LCE), increasing to 2.68 (2.17–3.17) Mt/a LCE in 2050 (Figure 7I). The total return flows in this scenario are expected to reach 11% of consumption in 2024 (95% C.I.: 9–14%) and 50% in 2050 (95% C.I.: 39–61%) (Figure 7J). Collected EoL batteries plus new scrap are expected to reach 10% of total consumption in 2024 (95% C.I.: 8–12%), and 50% in 2050 (95% C.I.: 39–60%) (Figure 7K). The recycling contribution of lithium to battery consumption would be expected to be 0.9% (0.7–1.1%) in 2025 and should increase to 40% (31–48%) in 2050 40% (Figure 7L). This is 10% less than in the low-production scenario, but essentially the same as in the medium-production one.

6. Discussion

In the following subsections, we first consider the limitations of our estimates due to unavailable data (producing uncertainties) and factors that we could not consider. The likely effects of these limitations on our results are discussed and summarized. We then consider the policy implications of our results at both the global and EU level.

6.1. Major Sources of Uncertainty

Major sources of uncertainty in the factors we considered in this study include future battery production, battery lifetime distributions and their likely evolution in the future, collection rates, and lithium recovery rates in the recycling processes. These are discussed below.
  • Battery production: Future battery production scenarios are highly uncertain. This is why we used three cases in this study, without specifying the relative probabilities of each of these cases. Globally, battery cell production capacities for LIBs have been between 700 and 800 GWh for the EV sector in 2024 [48]. Current battery cell production for the EV sector in Europe amounts to around 190 GWh/a [48]. Both figures, global and EU, approximately correspond to the production capacities in the low production scenario (Figure 7 and Figure 8). Comparing actual tracked capacities in the literature with simulated production capacities in each scenario globally and on the EU level, the low production scenario is probably most realistic to happen in the short- to mid-term future. Especially the recent slowdown in EV sales and cancellations of battery cell factories in the EU underpin this assumption [49,50]. The uncertainty in the production scenarios naturally increases the further projections are made into the future. However, we note that the final results of expected recycling rates by 2050 do not differ substantially between scenarios and are only slightly higher in the low-production scenario compared to the medium- and high-production scenarios. Therefore, the substantial uncertainty in future production growth does not translate to similar uncertainties for expected recycling rates.
  • Battery lifetime: Uncertainties in the distributions of battery lifetimes are much more important as a source of uncertainty in our estimates. An increasing lifetime of a maximum 15-year warranty-relevant period in 2030 was assumed, remaining constant afterwards. The current development and rapid dynamics in battery research indicate that the average lifespan of batteries tends to lengthen. However, it is not clear whether this trend will continue indefinitely. It is not clear at what level further improvements will not be economic. Either way, improvements in battery lifetimes beyond those assumed in our simulations would imply that the return flows of EoL batteries would be smaller in the future than we estimated. Furthermore, batteries may remain in use beyond their currently expected lifetime distributions, depending on customer needs or their repurposing for secondary purposes. These factors greatly influence the available EoL material that should ultimately be available for recycling. Assuming lifespans of over 20 years [51] with a subsequent secondary use phase of 5–30 years [52,53], the availability of substantial amounts of EoL material, and consequently its contribution to new battery production as recycled lithium, could be delayed well beyond 2050.
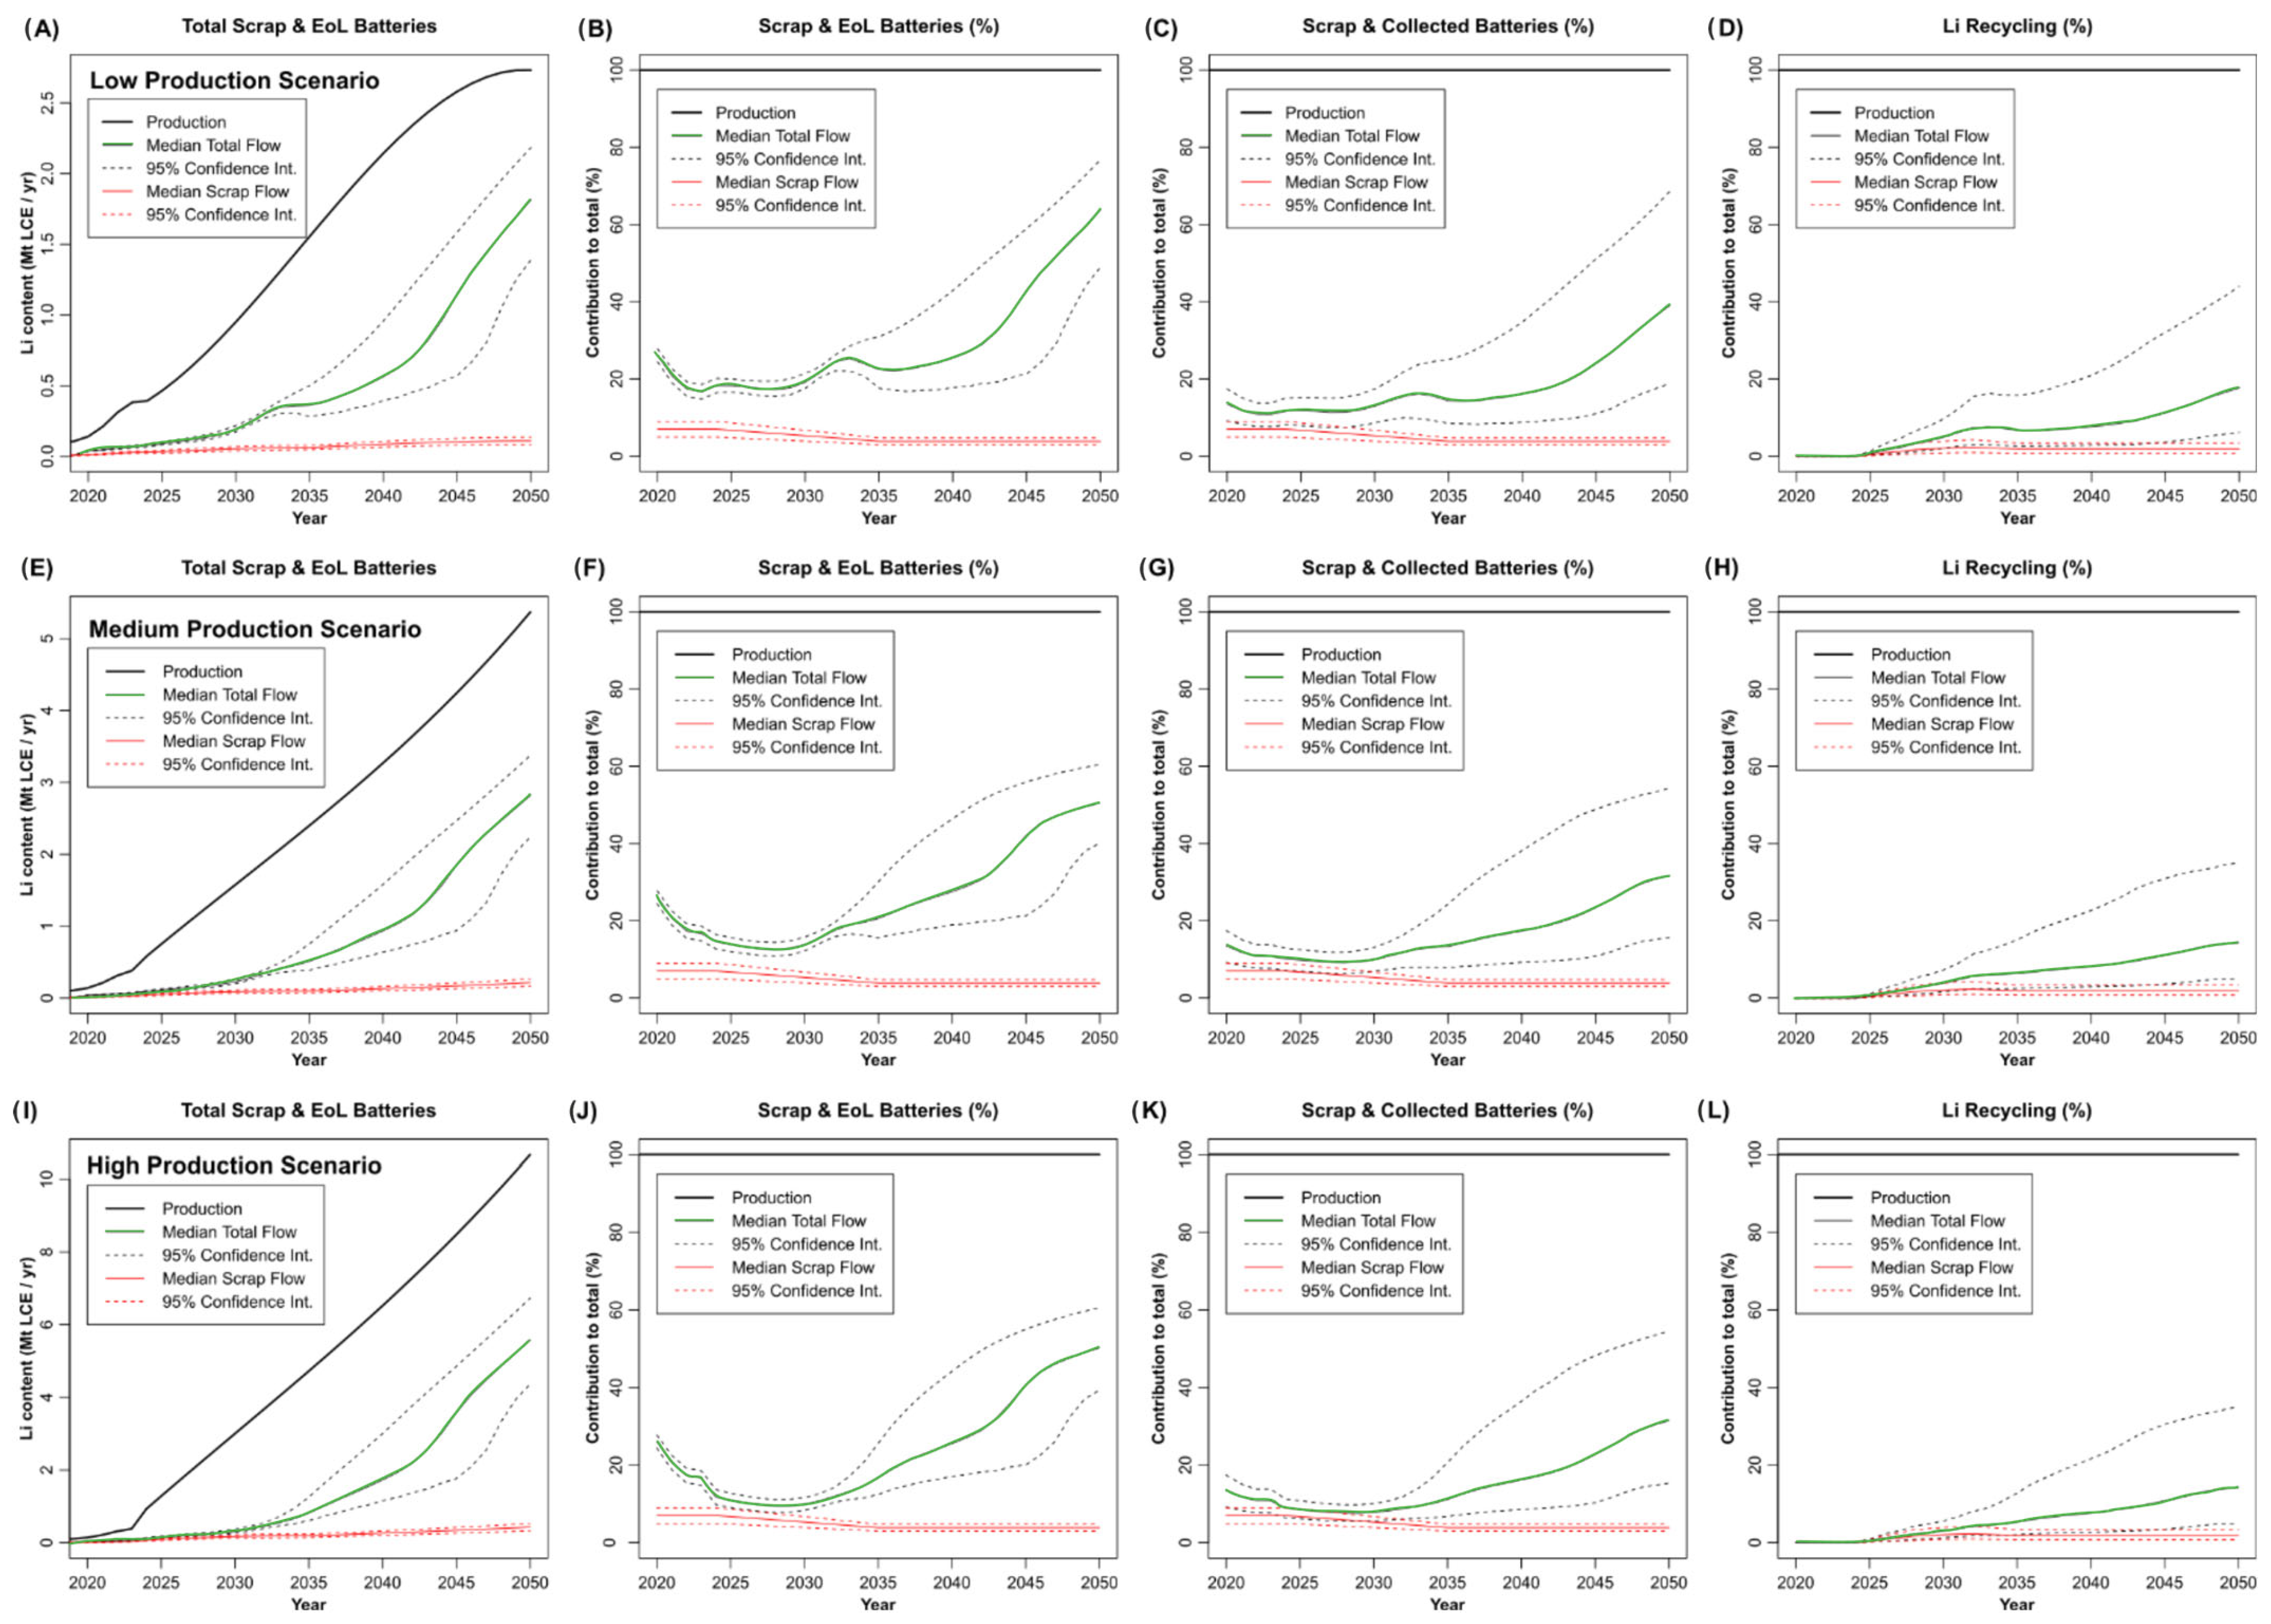
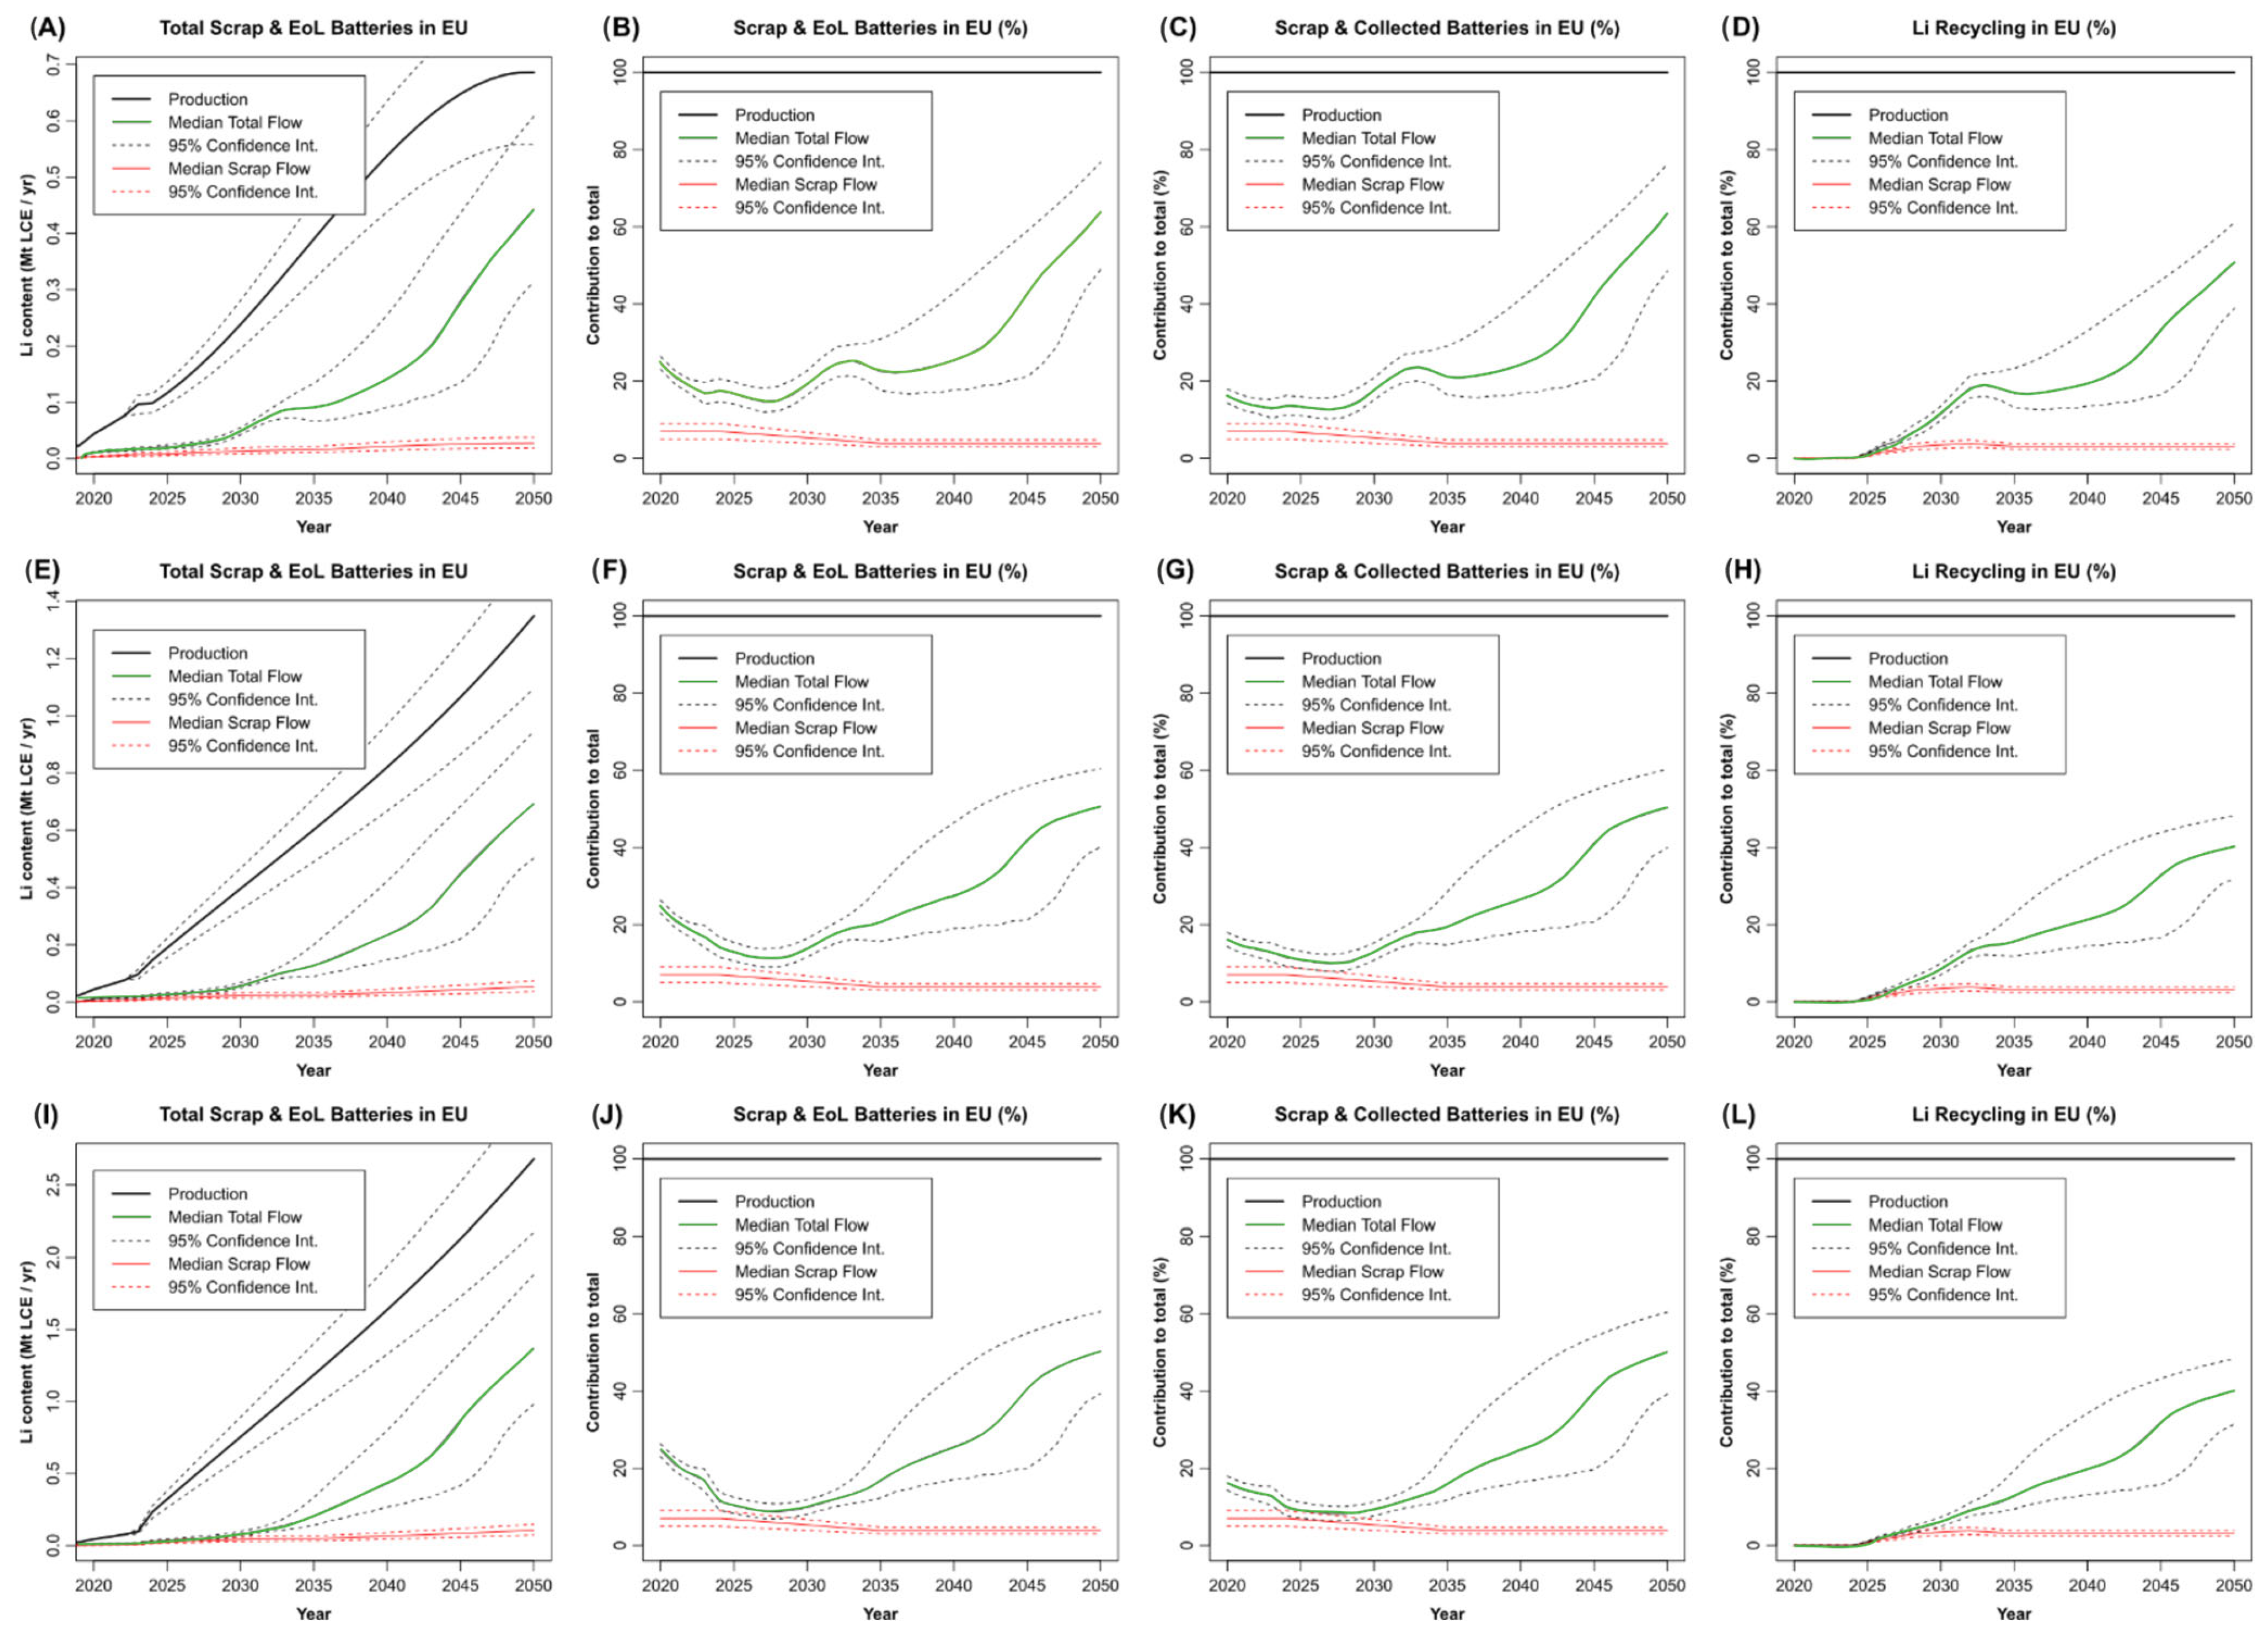
  • Collection rates: the rates for globally collected batteries plus scrap volumes available for recycling, range approximately between 20% and 60 to 70% of battery production in the medium and high production scenario. The median is below 40% in all the scenarios. The lower limits of these estimates result from the assumed range of collection rates between 0% and EU rates in non-EU countries, where only production scrap is collected and contributes to recycling. The general increasing trend of collected batteries and scrap volumes results mostly from regulated increases in the EU (see methods) and increasing return flows relative to production volumes over time, which are in turn due to the expected slowdown in the relative growth rates of battery production by 2050 (Figure 4). The contribution to the total amounts to maximum values between 60 to 70% in each of the scenarios, which results from the assumed global collection rate of EoL batteries of 100% by 2050, is the ideal case. However, this final rate is highly uncertain. Comparing global and EU results, it is noticeable that the collection rates are higher in the EU due to implemented targets set on a national level and in the EU battery regulation (cf. methods). The significant increase at the end is most probably due to the high volumes of EoL batteries. The little bump between the years 2030 and 2035 (for the proportion of collected EoL batteries plus scrap) is mostly due to the little kink at the beginning of the production time series (2023–2024), where we go from real data to interpolated future production. For collected batteries plus scrap as a proportion of total production, we note an actual decrease in proportion from 2020 to 2022. This is due to the transition from portable to EV batteries being the dominant EoL battery type (longer average battery lifetimes decrease return rates initially). Overall, we believe that our assumptions for global (non-EU) collection rates, which we took to be 45–50% on average, provide a reasonable intermediate scenario. The raw materials contained in LIBs already make their recycling economically attractive, which may incentivize higher rates in the future. However, this may change if battery compositions become dominated by low-value components such as in LFP batteries.
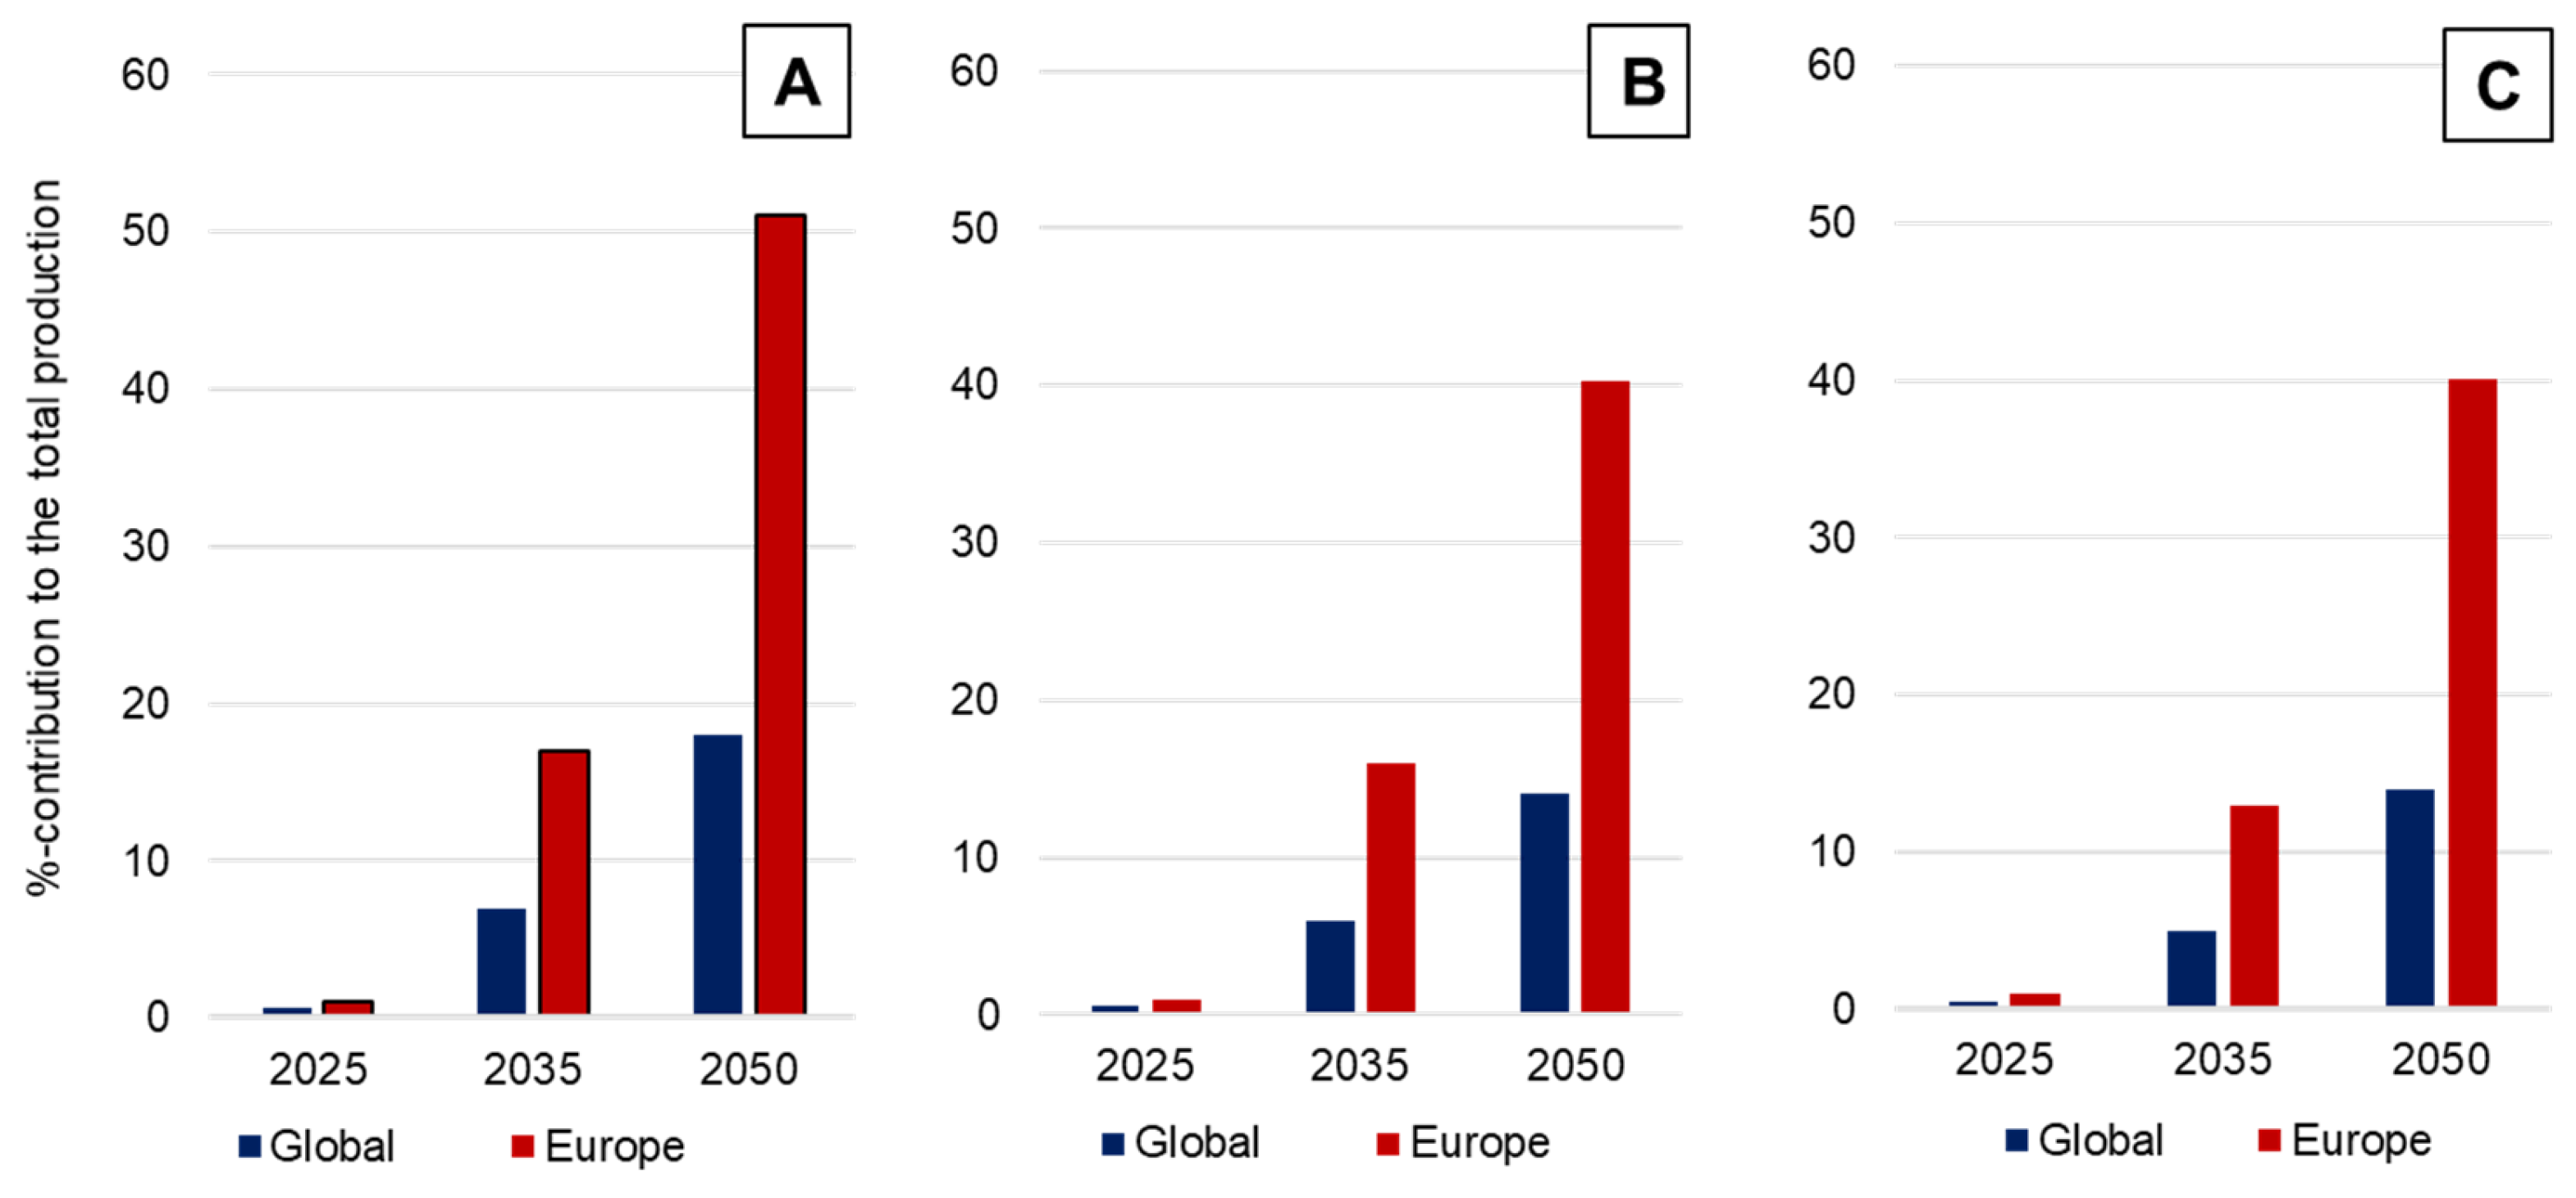
  • Recovery rates: The contribution of recycled lithium to battery production also depends greatly on the recovery rates of lithium in recycling processes. Effective recovery rates for lithium on the global and European scales are currently unknown. Lithium is currently only recovered by hydrometallurgical processes. In our simulations, the expected contribution of recycled lithium in 2050 ranges between ~40 and 50% in Europe, across all scenarios (Figure 8). These large quantities are a result of the high recovery rates that the EU sets in the EU battery regulation. In case these rates should be revised due to the uneconomic conditions they may induce for the recycling industry, recovery rates could be reduced and recycled lithium would not be available in the estimated amounts. On a global scale, the median recycled lithium contribution to the total production does not exceed 20% by 2050 in any of the scenarios (Figure 8), even though expected total return flows (medians) generally reach around 50–60% by 2050. However, the ranges are quite narrow in the beginning and will get wider in the future years. Besides, the second use of EV LIBs is gaining traction, with numerous real-world projects e.g., Nissan [54], Vattenfall [55] and Mercedes Benz [56], and projects indicating a significant role for repurposed batteries especially in energy storage systems. The parameters of the second life were not taken into account in this study, mainly because there is a lack of reliable and publicly available data. However, it is certain that in case of a large-scale implementation of second-use applications, the return volume of EoL batteries will be delayed by several years and therefore less recycled lithium will be available.
Global recoveries of lithium from spent batteries are likely to remain smaller as long as recovery is neither economic nor mandatory. The EU regulations are unlikely to have a global impact. In case the recycling capacities will not be installed as announced due to the economic conditions and financial incentives for mining, the global contribution of secondary lithium could only reach about the 10% mark in the year 2050.
In summary, uncertainties in future production scenarios do not appear to have a major impact on estimated future recycling rates, as long as the future follows a more or less steady growth scenario. Major uncertainties are due to battery lifetime distributions, collection rates of batteries, and recycling recovery rates for lithium. While we used a relatively conservative assumption for lifetime distributions, longer lifetimes and second-use of EV batteries in the future may significantly decrease the amounts of EoL batteries available for recycling compared to our simulations.
For recovery and collection rates, the future evolution probably depends on the decisions made in countries outside the EU and technological developments, since lithium is not currently economically recyclable from LIBs. However, we believe that the uncertainties associated with collection and recovery rates are well-captured in our current simulations, and therefore, would not expect reality to diverge substantially from the 95% confidence intervals of our predictions.

6.2. Factors Not Considered in This Study

The quantities of secondary lithium supply simulated in this study represent a case where installed recycling capacities do not constitute a limiting factor for recycling rates. However, detailed market dynamics in the recycling sector do impact installed capacities and thus recycling rates. Furthermore, the sales figures of EVs have impacts on the number of spent LIBs available for recycling in the future, and our study did not consider potential deviations from projected, largely policy-driven scenarios for future EV sales. Finally, global trade in EoL battery materials would likely affect lithium recycling rates, if there is a net outflow (or inflow) of material from the EU, where assumed recycling rates are higher due to regulatory frameworks.
Our battery production scenarios do not take into account actual declining EV sales in Europe but these will have a significant impact on the new scrap volumes and return quantities of EoL material. As of 2024, the market is in a difficult situation. Many companies have become cautious about investments in the areas of e-mobility, battery and cathode production, as well as recycling. Lower capacity utilization in battery cell production has a direct impact on the availability of production scrap, and also EoL batteries in the future.
There are increasing reports of cancellations, delays and postponements in the construction of recycling plants. In case recycling capacities will not be installed in the mid- to long-term future, the material cannot be processed. A subsidy landscape that is currently attracting investors to the US is making it even more difficult for the European players to be competitive.
According to Rho Motion [57], 15.2 million EVs have been sold globally so far in 2024, growing by 25% year-to-date. The EV market of the region of the EU & EFTA and the UK remains down, total EV sales dropped by 3% in November, compared to the same period. The region had 280,000 units sold in November, thus reaching 2.7 million units sold year-to-date. All these factors will ultimately have an impact on the secondary amount of lithium available, as all of them play a crucial part in the value chain. Declining EV sales lead to lower demand for battery cells produced and deployed, which leads to less new scrap volumes, and subsequently less EoL material available for recycling. This represents a clear investment uncertainty, as constant input for recycling plants is necessary for them to operate profitably.
The price instability of primary raw materials and battery cells naturally has an effect on the availability of recycled lithium. Lithium prices have fallen sharply since January 2023. The actual price for battery-grade lithium carbonate amounts to approximately 10,650 US$/t (58). Prices for nickel and cobalt are also at low levels. Since July 2022, the LME prices for cobalt metal declined to 25,000 US$/t (August 2024), and the LME nickel metal price is currently at 16,246 US$/t (August 2024) [58]. The cost of production of lithium-ion batteries has also fallen drastically and will most likely continue to fall in the next few years. According to Wood et al. [59], the estimated cost for NMC111 cells produced in the United States in the year 2015 was around $271 kWh−1, due to the high costs of electrode materials, current collectors, separator and electrode processing. Recent cost models put cell production costs at $106 kWh−1 (NMC622) and $98 kWh−1 (NMC811) in Europe and the United States [60,61]. Due to these declines, the recycling of LIBs can only progress slowly, as it is not economically viable (at least for lithium) for the industry yet, lowering the amount of recycled lithium available in the end. Recycling costs play a major role. There are no minimum price figures per raw material for when recycling is worthwhile, only prices for production costs of primary cells are described. It would be an important addition if recycling prices of the raw materials were available. However, lithium recycling can be made mandatory by regulation.
In addition to these considerations, the collection infrastructure for EoL batteries presents significant challenges due to the lack of a uniform, globally standardized process. The absence of consistent guidelines complicates the safe and efficient collection and transportation of EoL batteries. Addressing this issue requires international agreements to establish an extensive collection infrastructure, a costly and complex process.
The international trade in lithium-ion batteries and recycled raw materials, especially black mass, is becoming increasingly important. Black mass is a valuable globally traded raw material. It is possible to store black mass in order to secure raw materials, but only under strict conditions in accordance with waste legislation. For European companies, however, the storage of black mass does not currently represent a profitable business model. For this reason, it is usually sold off in order to capitalize on the contained values immediately. Copper, nickel, cobalt and lithium are the most profitable raw materials here. From a global perspective, exports and imports have no influence on the available quantity of recycled lithium. At the European level, however, when the valuable black mass is exported to Asia or the US, it is no longer available for the production of new battery-grade material in Europe. Unfortunately, the trade in black mass cannot be tracked at the moment. Black mass is a non-standardized “waste” material, which complicates the definition in HS codes. However, the classification of black mass as hazardous waste is currently being discussed by the European Commission as part of an amendment to the European list of waste to address waste batteries and wastes from treating them [62,63]. If significant amounts of black mass leave the EU and are processed in countries where lithium recycling is not legally mandated, then the contained lithium would be lost, and global recycling rates may drop below those projected in our simulations.
Research on new cathode and anode material developments and the development of new recycling technologies will also affect the secondary supply in the long term. The development of new systems such as other metal anodes, e.g., sodium-ion or vanadium-flow batteries, and gaseous or liquid cathode systems have the potential to displace at least some of the existing LIB types in certain applications. Those battery systems based on other ions will actually reduce the overall demand for lithium by displacement, even if only a small proportion. If the demand for lithium shrinks in the long-term future, recycling of LIBs potentially could cover a small part of secondary material contents as it depends on previous LIBs production. However, a commercial market penetration of alternative battery systems and thus the potential replacement of lithium is not expected in the next 10 to 15 years. Recently, solid-state batteries have attracted interest as energy stores for electric vehicles. This type requires higher lithium contents, assumingly between 0.26 and 0.52 kg/kWh as mentioned earlier, which would mean a huge increase in demand for lithium in LIBs. Based on electric vehicle manufacturers’ technology roadmaps and technological advances, possible commercial viability of solid-state batteries must be awaited within the next 5 years [64,65]. In the case of commercial deployment, it would also imply a high recycling potential due to the high lithium content. It remains to be seen whether the recycling processes will be efficient enough to recover the material in solid-state batteries.
LFP and LMFP battery types increase their market shares on a global scale [19,34]. Both do not require any cobalt and nickel, which is advantageous in terms of a resilient supply chain, but recycling does not deliver a value-creating black mass. Instead, the main valuable materials would be lithium and graphite. Whether the recycling of these two types is a business case remains to be seen, as there is an increasing interest in direct recycling of the cathode and anode materials. At the moment, this process route is still in the early stages without any deployment at an industrial scale but could be promising in terms of efficiency, especially for LFP/LMFP. In case these two battery types increase their market shares drastically, but recycling would not be economic, especially in Europe, as it would impact the supply of secondary lithium.

6.3. Policy Implications

The EU Battery Regulation has been in effect for Europe since August 2023. The regulation specifies labelling rules, information obligations, e.g., CO2-footprint, and supply-chain due diligence standards. It also mandates metal-specific recycling recovery rates, and the use of recycled content in batteries with a capacity above 2 kWh, most of which are used in EVs. The amended proposal of the battery regulation from June 2023 states that LIBs have to contain a minimum percentage share of 6% recycled lithium from 08/2031, recovered from battery manufacturing waste or postconsumer waste, and 12% recycled lithium from 08/2036.
Our simulations suggest that the EU goals of recovery rates and minimum recycled lithium content should technically be achievable, yet the economic feasibility of the required recycling plants is questionable. Nevertheless, the results of the present study indicate that sufficient recycled lithium in each of the production scenarios (on a European scale), would be available in the years 2031 and 2036 to meet the targets.
Taking the current market developments into consideration, recycling plants will have to process accumulated new scrap volumes ranging between 5 and 9% until the larger return flow of EoL material arrives. These production scraps are highly sought after as material available for recycling will subsequently impact recycling plants. Without enough feedstock, they cannot operate at full capacity. The international trade in LIBs and recycled raw materials, especially black mass, is becoming increasingly important. Black mass is a valuable, globally traded raw material. It is possible to store black mass in order to secure raw materials, but only under strict conditions in accordance with waste legislation. For European companies, the storage of black mass is currently not a profitable business model. For this reason and due to the fact that there is no comprehensive large-scale processing of black mass in Europe, European recycling companies generally export black mass in order to monetise the resources immediately. Black mass is exported as a product or hazardous waste to Asia. It is becoming clear that a regulated and harmonised trading system for this kind of material is missing. Export controls could counteract here but would require the processing capacities for black mass in Europe as well as downstream buyers of recycled materials, ideally pCAM or CAM producers. In addition, lithium recycling is not economical, but battery recycling, in general, is very economical though, otherwise, there would not be international competition for the black mass. It would need an enormous political effort to work against the principles of companies in a market economy.

6.4. Future Work

The results of this study highlight the multiple influences on current and future lithium recycling flows on a global scale, as well as the uncertainties associated with them. The study also addresses general issues with respect to forecasts of future battery production and return quantities of EoL material available for recycling. The distribution of battery lifetimes is one of the most critical inputs in the simulations since it is an important determinant of the amount of EoL batteries available each year for recycling. Battery lifespans not only become longer by optimising the battery itself but also through the increasing secondary use of batteries in other application sectors. The highly dynamic and immature market of battery cell production and battery recycling is driven by political, regulatory and economic factors. As long as lithium recycling from LIBs is not economically viable, mining will be the first choice to meet demand.
To address further gaps in the methodology, additional factors could be considered, e.g., (1) lithium contents in other newly developed battery types and the probable deployment of these types, (2) the probability of installed recycling plants and their actual capacities to recycle LIBs and refine the valuable black mass, (3) marginal costs of adding lithium extraction to existing recycling facilities would need to be balanced against lithium prices to determine whether extraction is likely.

Supplementary Materials

The following supporting information can be downloaded at: https://www.mdpi.com/article/10.3390/recycling10040122/s1.

Author Contributions

Conceptualization: C.K., M.F. and B.B.; Methodology: C.K., M.F. and B.B.; Investigation: C.K. and B.B.; Formal analysis: C.K., M.F. and B.B.; Visualization: C.K., M.F. and L.B.A.; Supervision: M.F. and B.B.; Project Administration: M.F. and B.B.; Resources: C.K., M.F., B.B. and L.B.A.; Funding acquisition: M.F. and B.B.; Writing—original draft: C.K., M.F. and B.B.; Writing—review and editing: all authors. All authors have read and agreed to the published version of the manuscript.

Funding

This research was funded by the Federal Ministry of Education and Research under grant number 03XP0335B. The APC was funded by the Federal Institute for Geosciences and Natural Resources.

Data Availability Statement

The data supporting this article have been included as part of the Supplementary Materials.

Acknowledgments

The project “BatMix”, on which this publication is based, was funded by the Federal Ministry of Education and Research. The responsibility for the content of this publication lies with the authors.

Conflicts of Interest

The authors declare no conflict of interest.

References

  1. Buchert, M.; Dolega, P.; Degreif, S. Gigafactories für Lithium-Ionen-Zellen–Rohstoffbedarfe für Die globale Elektromobilität bis 2050; Oeko-Inst. eV: Darmstadt, Germany, 2019. [Google Scholar]
  2. Clean Energy Institute. Lithium-Ion Battery. University of Washington. 2020. Available online: https://www.cei.washington.edu/research/energy-storage/lithium-ion-battery/ (accessed on 14 December 2023).
  3. European Commission. Regulation of the European Parliament and of the Council Concerning Batteries and Waste Batteries, Amending Directive 2008/98/EC and Regulation (EU) 2019/1020 and repealing Directive 2006/66/EC 2023. 2023. Available online: https://eur-lex.europa.eu/legal-content/EN/TXT/PDF/?uri=CELEX:32023R1542 (accessed on 16 June 2025).
  4. Agora Verkehrswende.Klimabilanz von Elektroautos. Einflussfaktoren und Verbesserungspotenzial. 2019. Available online: https://www.agora-verkehrswende.de/fileadmin/Projekte/2018/Klimabilanz_von_Elektroautos/Agora-Verkehrswende_22_Klimabilanz-von-Elektroautos_WEB.pdf (accessed on 16 June 2025).
  5. World Economic Forum. A Vision for a Sustainable Battery Value Chain in 2030: Unlocking the Full Potential to Power Sustainable Development and Climate Change Mitigation. 2019. Available online: https://www3.weforum.org/docs/WEF_A_Vision_for_a_Sustainable_Battery_Value_Chain_in_2030_Report.pdf (accessed on 16 June 2025).
  6. PEM Chair at RWTH and Roland Berger GmbH. Battery Monitor 2023. The Value Chain Between Economy and Ecology. 2023. Available online: https://content.rolandberger.com/hubfs/07_presse/Batteriemonitor_2023_digital_final.pdf (accessed on 16 June 2025).
  7. Circular Energy Storage. CES Online Database. 2023. Available online: https://www.circularenergystorage-online.com/ (accessed on 16 June 2025).
  8. Benchmark Minerals. Lithium Has to Scale Twenty Times by 2050 as Automakers Face Generational Challenge. 2022. Available online: https://source.benchmarkminerals.com/article/lithium-has-to-scale-twenty-times-by-2050-as-automakers-face-generational-challenge (accessed on 3 July 2024).
  9. Castro, F.D.; Cutaia, L.; Vaccari, M. End-of-life automotive lithium-ion batteries (LIBs) in Brazil: Prediction of flows and revenues by 2030. Resour. Conserv. Recycl. 2021, 169, 105522. [Google Scholar] [CrossRef]
  10. Gaines, L.; Zhang, J.; He, X.; Bouchard, J.; Melin, H.E. Tracking Flows of End-of-Life Battery Materials and Manufacturing Scrap. Batteries 2023, 9, 360. [Google Scholar] [CrossRef]
  11. Sattar, A.; Greenwood, D.; Dowson, M.; Unadkat, P. Automotive Lithium-ion Battery Recycling in the UK. Warwick University (The British Advance). 2020. Available online: https://hvm.catapult.org.uk/wp-content/uploads/2022/06/22350m-WMG-Battery-Recycling-report-v7.pdf (accessed on 16 June 2025).
  12. Weyhe, R.; Yang, X. Investigation about Lithium-Ion Battery Market Evolution and future Potential of Secondary Raw Material from Recycling. 2019. Available online: https://accurec.de/wp-content/uploads/2018/04/0-2Market-Research_YXF_3.0.pdf (accessed on 16 June 2025).
  13. Kastanaki, E.; Giannis, A. Dynamic estimation of end-of-life electric vehicle batteries in the EU-27 considering reuse, remanufacturing and recycling options. J. Clean. Prod. 2023, 393, 136349. [Google Scholar] [CrossRef]
  14. Shafique, M.; Rafiq, M.; Azam, A.; Luo, X. Material flow analysis for end-of-life lithium-ion batteries from battery electric vehicles in the USA and China. Resour. Conserv. Recycl. 2022, 178, 106061. [Google Scholar] [CrossRef]
  15. Brückner, L.; Frank, J.; Elwert, T. Industrial Recycling of Lithium-Ion Batteries—A Critical Review of Metallurgical Process Routes. Metals 2020, 10, 1107. [Google Scholar] [CrossRef]
  16. Ciez, R.E.; Whitacre, J.F. Examining different recycling processes for lithium-ion batteries. Nat. Sustain. Nat. 2019, 2, 148–156. [Google Scholar] [CrossRef]
  17. Hanisch, C.; Diekmann, J.; Stieger, A.; Haselrieder, W.; Kwade, A. Recycling of Lithium-Ion Batteries. In Handbook of Clean Energy Systems; Yan, J., Ed.; John Wiley & Sons, Ltd.: Chichester, UK, 2015; pp. 1–24. [Google Scholar]
  18. Harper, G.; Sommerville, R.; Kendrick, E.; Driscoll, L.; Slater, P.; Stolkin, R. Recycling lithium-ion batteries from electric vehicles. Nature 2019, 575, 75–86. [Google Scholar] [CrossRef]
  19. IEA Recycling of Critical Minerals-Strategies to Scale Up Recycling and Urban Mining. 2024. Available online: https://iea.blob.core.windows.net/assets/3af7fda6-8fd9-46b7-bede-395f7f8f9943/RecyclingofCriticalMinerals.pdf (accessed on 16 June 2025).
  20. Mayyas, A.; Steward, D.; Mann, M. The case for recycling: Overview and challenges in the material supply chain for automotive li-ion batteries. Sustain. Mater. Technol. 2019, 19, e00087. [Google Scholar] [CrossRef]
  21. Sojka, R.; Pan, Q.; Billmann, L. Comparative Study of LIB Recycling Processes. 2020. Available online: https://accurec.de/wp-content/uploads/2021/04/Accurec-Comparative-study.pdf (accessed on 16 June 2025).
  22. Zhou, L.F.; Yang, D.; Du, T.; Gong, H.; Luo, W.B. The Current Process for the Recycling of Spent Lithium Ion Batteries. Front. Chem. 2020, 8, 578044. [Google Scholar] [CrossRef]
  23. Windisch-Kern, S.; Holzer, A.; Ponak, C.; Raupenstrauch, H. Pyrometallurgical Lithium-Ion-Battery Recycling: Approach to Limiting Lithium Slagging with the InduRed Reactor Concept. Processes 2021, 9, 84. [Google Scholar] [CrossRef]
  24. Olutogun, M.; Vanderbruggen, A.; Frey, C.; Rudolph, M.; Bresser, D.; Passerini, S. Recycled graphite for more sustainable lithium-ion batteries. Carbon Energy 2024, 6, e483. [Google Scholar] [CrossRef]
  25. Vanderbruggen, A.; Hayagan, N.; Bachmann, K.; Ferreira, A.; Werner, D.; Horn, D.; Peuker, U.; Serna-Guerrero, R.; Rudolph, M. Lithium-Ion Battery Recycling─Influence of Recycling Processes on Component Liberation and Flotation Separation Efficiency. ACS EST Eng. 2022, 2, 2130–2141. [Google Scholar] [CrossRef]
  26. Frenzel, M.; Mikolajczak, C.; Gutzmer, J.; Reuter, M.A. Quantifying the relative availability of high-tech by-product metals–The cases of gallium, germanium and indium. Resour. Policy 2017, 52, 327–335. [Google Scholar] [CrossRef]
  27. Nassar, N.T.; Kim, H.; Frenzel, M.; Moats, M.S.; Hayes, S.M. Global tellurium supply potential from electrolytic copper refining. Resour. Conserv. Recycl. 2022, 184, 106434. [Google Scholar] [CrossRef]
  28. Öko Institut. B2DS Szenario-“Unter 2 Grad Szenario”. 2019. Available online: https://www.now-gmbh.de/wp-content/uploads/2020/10/now-factsheet_elektrobomilitaet-und-rohstoffe.pdf (accessed on 16 June 2025).
  29. Avicenne Energy. Commercial Data. 2021. Available online: https://www.avicenne.com/pdf/Presentation_Avicenne_Energy_June_2022.pdf (accessed on 16 June 2025).
  30. Moores, S. The Global Battery Arms Race: Lithium-Ion Battery Gigafactories and Their Supply Chain. Oxford Institute for Energy Studies. 2021. Available online: https://www.oxfordenergy.org/wpcms/wp-content/uploads/2021/02/THE-GLOBAL-BATTERY-ARMS-RACE-LITHIUM-ION-BATTERY-GIGAFACTORIES-AND-THEIR-SUPPLY-CHAIN.pdf (accessed on 16 June 2025).
  31. Rho Motion. EV Battery Outlook. 2022. Available online: https://rhomotion.com/research/ev-battery-forecast/ (accessed on 16 June 2025).
  32. S&P Global Mobility (EVs). Press Release. 2022. Available online: https://www.spglobal.com/market-intelligence/en/news-insights/research/investment-in-lithium-ion-batteries-could-deliver-5-point-9-twh-capacity-by-2030 (accessed on 16 June 2025).
  33. S&P Global Mobility (EVs). Press Release. 2021. Available online: https://www.spglobal.com/market-intelligence/en/news-insights/research/top-electric-vehicle-markets-dominate-lithium-ion-battery-capacity-growth (accessed on 16 June 2025).
  34. IEA. Global EV Outlook 2023. 2023. Available online: https://iea.blob.core.windows.net/assets/dacf14d2-eabc-498a-8263-9f97fd5dc327/GEVO2023.pdf (accessed on 16 June 2025).
  35. Marscheider-Weidemann, F.; Langkau, S.; Baur, S.J.; Billaud, M.; Deubzer, O.; Eberling, E.; Erdmann, L.; Haendel, M.; Krail, M.; Loibl, A.; et al. Raw materials for emerging technologies 2021. DERA Rohst. 2021, 50, 348. [Google Scholar]
  36. Anderson, B.A.; Råde, I. Metal resource constraints for electric-vehicle batteries. Transp. Res. Part D Transp. Environ. 2001, 6, 297–324. [Google Scholar] [CrossRef]
  37. Gerssen-Gondelach, S.; Faaij, A.P.C. Performance of batteries for electric vehicles on short and longer term. J. Power Sources 2012, 212, 111–129. [Google Scholar] [CrossRef]
  38. BYD. Warranty Policy. 2025. Available online: https://www.byd.com/eu/service-maintenance/warranty-policy (accessed on 16 June 2025).
  39. Hyundai. Warranty Policy. 2025. Available online: https://www.hyundai.com/eu/driving-hyundai/owning-a-hyundai/why-hyundai-services/warranty.html (accessed on 16 June 2025).
  40. KIA. Warranty Policy. 2025. Available online: https://www.kia.com/uk/about/news/electric-car-battery-warranty/ (accessed on 16 June 2025).
  41. Tesla. Warranty Policy. 2025. Available online: https://www.tesla.com/support/vehicle-warranty (accessed on 16 June 2025).
  42. Volkswagen. Warranty Policy. 2025. Available online: https://www.volkswagen.co.uk/en/electric-and-hybrid/living-electric/looking-after-your-ev/vehicle-and-battery-warranties.html (accessed on 16 June 2025).
  43. EU. Consumer Guarantees. 2024. Available online: https://europa.eu/youreurope/business/dealing-with-customers/consumer-contracts-guarantees/consumer-guarantees/index_en.htm (accessed on 5 August 2024).
  44. Gattiglio, F. The Batteries Directive Review. In Proceedings of the 24th International Congress for Battery Recycling ICBR 2019, Lyon, France, 18–20 September 2019. Panel discussion. [Google Scholar]
  45. EPBA The Collection of Waste Portable Batteries in Europe in View of the Achievability of the Collection Targets Set by Batteries Directive 2006/66/EC. Short Update Covering 2018 Data. 2020. Available online: https://www.epbaeurope.net/assets/resources/Report-on-the-portable-battery-collection-rates-Short-Update-Mar-20-final-1.1.pdf (accessed on 16 June 2025).
  46. DOE Energy Department Announces Battery Recycling Prize and Battery Recycling R&D Center. 2019. Available online: https://www.energy.gov/articles/energy-department-announces-battery-recycling-prize-and-battery-recycling-rd-center#:~:text=Currently%2C%20lithium%2Dion%20batteries%20are,ion%20batteries%20for%20eventual%20recycling.%20 (accessed on 5 August 2024).
  47. Ziemann, S.; Müller, D.B.; Schebek, L.; Weil, M. Modeling the potential impact of lithium recycling from EV batteries on lithium demand: A dynamic MFA approach. Resour. Conserv. Recycl. 2018, 133, 76–85. [Google Scholar] [CrossRef]
  48. VDI/VDE Innovation + Technik GmbH. Battery Cell Production in Europe: Status Quo and Outlook, Market Analysis Update Q2 2024. 2024. Available online: https://www.ipcei-batteries.eu/accompanying-research/market-updates (accessed on 16 June 2025).
  49. EY. How to Retake the Momentum in the EV Transition. Press Release. 2024. Available online: https://www.ey.com/en_gl/insights/automotive/how-to-retake-the-momentum-in-ev-transition#:~:text=Consequently%2C%20overall%20EV%20market%20growth,2025%20up%20to%20approximately%2023%25 (accessed on 8 October 2024).
  50. Transport & Environment. How not to Lose It All: Two-Thirds of Europe’s Battery Gigafactories at Risk Without Further Action. 2023. Available online: https://www.transportenvironment.org/uploads/files/TE-Battery-risk-report.pdf (accessed on 16 June 2025).
  51. Fastmarkets. EV Battery Lifespans: Unlocking the Secrets to Battery Lifetimes and Battery Recycling. Press Release. 2024. Available online: https://www.fastmarkets.com/insights/ev-battery-lifespans-unlocking-the-secrets-to-battery-lifetimes-and-battery-recycling/#:~:text=The%20longevity%20of%20lithium%2Dion,to%20extend%20beyond%2015%20years (accessed on 18 December 2024).
  52. Bobba, S.; Mathieux, F.; Blengini, G.A. How will second-use of batteries affect stocks and flows in the EU? A model for traction Li-ion batteries. Resour. Conserv. Recycl. 2019, 145, 279–291. [Google Scholar] [CrossRef]
  53. Casals, L.C.; García, B.A.; Canal, C. Second life batteries lifespan: Rest of useful life and environmental analysis. J. Environ. Manag. 2019, 232, 354–363. [Google Scholar] [CrossRef]
  54. Nissan. Nissan and Ecobat to Give Used EV Batteries a Second Life Beyond the Car. 2024. Available online: https://uk.nissannews.com/en-GB/releases/nissan-and-ecobat-to-give-used-ev-batteries-a-second-life-beyond-the-car (accessed on 13 January 2025).
  55. Vattenfall. Autobatterien Entsorgen und Recyceln. 2023. Available online: https://www.vattenfall.de/infowelt-energie/e-mobility/elektroauto-batterie-recycling (accessed on 13 January 2025).
  56. Mercedes-Benz Energy Storage. 2025. Available online: https://www.mercedes-benz.com/en/mercedes-benz-energy/ (accessed on 13 January 2025).
  57. Rho Motion. Press Release “Record Number EVs Sold in November” 2024. Available online: https://rhomotion.com/news/record-number-evs-sold-in-november/ (accessed on 16 December 2024).
  58. DERA. Preistrendmonitor. 2025. Available online: https://www.deutsche-rohstoffagentur.de/DERA/DE/Aktuelles/Monitore/2025/01-25/2025-01-preistrendmonitor.pdf?__blob=publicationFile&v=2 (accessed on 16 June 2025).
  59. Wood, D.L.; Li, J.; Daniel, C. Prospects for reducing the processing cost of lithium ion batteries. Power Sources 2015, 275, 234–242. [Google Scholar] [CrossRef]
  60. Duffner, F.; Mauler, L.; Wentker, M.; Leker, J.; Winter, M. Large-scale automotive battery cell manufacturing: Analyzing strategic and operational effects on manufacturing costs. J. Clean. Prod. 2021, 232, 107982. [Google Scholar] [CrossRef]
  61. Mauler, L.; Duffner, F.; Leker, J. Economies of scale in battery cell manufacturing: The impact of material and process innovations. Appl. Energy 2021, 286, 116499. [Google Scholar] [CrossRef]
  62. European Commission. Waste Treatment–Amendment to the European List of Waste to Address Waste Batteries and Wastes from Treating Them. Published Initiative. 2024. Available online: https://ec.europa.eu/info/law/better-regulation/have-your-say/initiatives/14016-Waste-treatment-Amendment-to-the-European-List-of-Waste-to-address-waste-batteries-and-wastes-from-treating-them_en (accessed on 19 December 2024).
  63. European Commission. Critical Raw Materials Act. 2024. Available online: https://single-market-economy.ec.europa.eu/sectors/raw-materials/areas-specific-interest/critical-raw-materials/critical-raw-materials-act_en (accessed on 19 December 2024).
  64. Yole Développement. Solid-State Battery 2021, Market & Technology Report. 2021. Available online: https://medias.yolegroup.com/uploads/2021/04/YINTR21187_Solid-State_Battery_2021_Flyer.pdf (accessed on 16 June 2025).
  65. Fraunhofer Institute for Systems and Innovation Research ISI. Solid-State Batteries for Electric Vehicles: Still in R&D or on the Verge of Commercialization? Blog Battery Update. 2024. Available online: https://www.isi.fraunhofer.de/en/blog/themen/batterie-update/feststoffbatterien-elektro-autos-kommerzialisierung-stand-forschung-entwicklung.html (accessed on 19 December 2024).
Figure 1. Status quo of the estimated global (A) and European (B) recycling capacities, return volumes of EoL batteries available for recycling (afr) and production scrap in 2023 and estimates for 2030 in GWh (Data source and forecasts [7].
Recycling 10 00122 g001
Figure 2. Overview of commercial processes for lithium-ion battery recycling. Modified after [11,21].
Recycling 10 00122 g002
Figure 3. Simulation structure of input parameters to quantify lithium recycling flows.
Recycling 10 00122 g003
Figure 4. Scenarios for future Li-ion battery production used in our analysis. Low production means the lowest assumption of projected production from studies in Table 1. High production means the upper end of projected production from studies in Table 1. The vertical line marks the year 2023.
Recycling 10 00122 g004
Figure 5. (A) Reconstructed EV battery lifetime distributions (Weibull) for the 8-year warranty period, as described in main text. The vertical line shows the end of the 8-year period. (B) Reconstructed portable battery lifetime distributions (Weibull) for the 2-year warranty period, as described in main text. The vertical line shows the end of the 2-year period.
Recycling 10 00122 g005
Figure 6. Global results of the statistical analysis. Panel (AD) low production scenario. Panel (EH) medium production scenario. Panel (IL) high production scenario.
Recycling 10 00122 g006
Figure 7. EU results of the statistical analysis. Panel (AD) low production scenario. Panel (EH) medium production scenario. Panel (IL) high production scenario.
Recycling 10 00122 g007
Figure 8. Median recycled lithium volumes as a %-contribution to the total production globally and European level in years 2025, 2035 and 2050. (A) Low production scenario; (B) Medium production scenario; (C) High production scenario.
Recycling 10 00122 g008
Table 2. Specific lithium requirements for various cathode materials [kg/kWh]. NMC–Nickel-Manganese-Cobalt, NCA–Nickel-Cobalt-Aluminium, LFP–Lithium-Iron-Phosphate, LMO–Lithium-Manganese-Oxide, LMNO–Lithium-Manganese-Nickel-Oxide, LMFP–Lithium-Manganese-Iron-Phosphate [35].
Cathode MaterialLithium Content
NMC0.096–0.123
NCA0.095–0.098
LFP0.084
LMO0.080
LMNO0.065
LMFP0.082
Note: NMC cathode material includes NMC 111, 532, 622, and 811.
Table 3. Summary table of warranty periods offered by manufacturers for their products.
Manufacture Warranty Period Reference
BYD8 years[38]
Hyundai8 years[39]
KIA8 years[40]
Tesla8 years[41]
Volkswagen8 years[42]
Disclaimer/Publisher’s Note: The statements, opinions and data contained in all publications are solely those of the individual author(s) and contributor(s) and not of MDPI and/or the editor(s). MDPI and/or the editor(s) disclaim responsibility for any injury to people or property resulting from any ideas, methods, instructions or products referred to in the content.

