Article

Discrimination of Poor Electrode Junctions within Lithium-Ion Batteries by Ultrasonic Measurement and Deep Learning

1
Non-Destructive Evaluation Team, Safety Measurement Institute, Korea Research Institute of Standards and Science, 267 Gajeong-ro, Daejeon 34113, Korea
2
Department of Mechanical Engineering, Sungkyunkwan University, 2066 Seobu-ro, Suwon-si 16419, Korea
3
Department of Industrial Engineering, University of Management and Technology, C-II Block C 2 Phase 1 Johar Town, Lahore 54770, Punjab, Pakistan
4
Department of Science of Measurement, University of Science and Technology, 217 Gajeong-ro, Daejeon 34113, Korea
*
Author to whom correspondence should be addressed.
Batteries 2022, 8(3), 21; https://doi.org/10.3390/batteries8030021
Submission received: 8 December 2021 / Revised: 11 January 2022 / Accepted: 22 February 2022 / Published: 26 February 2022
(This article belongs to the Special Issue Lithium-Ion Batteries: Latest Advances and Prospects II)

Abstract

:
Lithium-ion batteries, which have high energy density, are the most suitable batteries for use in high-tech electromechanical applications requiring high performance. Because one of the important components that determines the efficiency of lithium-ion batteries is the electrode, the manufacturing process for this junction plays an important role in the entire production process. In particular, the process related to the resistance spot welding of the electrode is very important, directly affecting the safety of users, and greatly affecting the performance of the batteries. However, because the electrode tab is spot-welded onto the inner surface of the case, it is impossible to verify with visual testing (using the naked eye) whether the junction is well bonded. Therefore, it is very important to perform quality evaluation of the resistance welding of electrodes after completing the manufacturing process, using non-destructive testing methods. In this paper, a non-destructive ultrasonic testing technique was applied to examine the quality of lithium-ion batteries in which the negative electrode tabs were welded to the inner surface of the cell cans. The status of resistance spot welding between the electrode and the can was verified using deep-learning techniques with the experimentally acquired ultrasonic signal database.

1. Introduction

Recently, with the development of electronic machines ranging from laptops and smart phones to electric vehicles and robots, there has been increasing demand for correspondingly high-performance batteries. Among the various types of batteries, lithium-ion batteries are currently attracting attention due to their high performance and high efficiency [1]. Therefore, many studies have been performed to improve the performance of lithium-ion batteries. The lithium-ion battery is a type of secondary battery, and it is a chemical device that converts chemical energy into electrical energy by moving lithium-ions from a negative electrode to a positive electrode during discharge. Lithium ions can return from the positive electrode to the negative electrode and find a place; thus, recharging is possible [2]. Accordingly, lithium-ion batteries are different from primary batteries, and the lithium-ion battery has a breakthrough life that is more than three times that of a conventional lead-acid battery, assuming that the standard of battery life is the number of charge/discharge cycles [3,4]. Moreover, because its use-time is also relatively long, it is the main battery applied for portable electronic devices and electric vehicles. To maximize these advantages, the main focus currently for lithium-ion battery development is greater capacity and longer battery life.
At the same time, problems with the safety of lithium-ion batteries have emerged. Because the inside of a miniaturized lithium-ion battery is very complex and sensitive, there is potential for ignition and explosion due to abnormal heat generation. Lithium-ion batteries can be divided into three parts: positive electrode, negative electrode, and electrolyte. Depending on what materials are used, the voltage, life, capacity, and stability of the battery change significantly. Because a lithium-ion battery is so small and has a complicated structure, internal resistance is increased in the junction for each part, thereby generating heat [5]. In the case of a poor weld joint, high joint resistance may occur, and heat may be generated during charge and discharge. This may affect battery life, and there is a risk of high-temperature short circuit and secondary battery explosion [6,7]. Therefore, to increase the reliability of the safety of lithium-ion batteries, it is considered important to thoroughly inspect welding defects before providing it to users.
The welding technologies used in secondary batteries include ultrasonic welding and spot welding. These make it difficult to assure consistent weldability and electrical conductivity when laminating the thin metal films currently used [8,9]. As a result, the shape and depth of the welds vary, which makes it easy for a weld to separate, or for the stability of its electrical conductivity to deteriorate. In addition, when a tab is welded to the inner surface of the cell case, it is more difficult to evaluate the weld because visual inspection is not physically acceptable to inspectors.
For these reasons, there is a trend toward non-destructive evaluation techniques and equipment for the precise inspection of secondary batteries. This is because the highest level of availability is expected for high-performance devices, while maximizing reliability. Lambert et al. used an electrochemical impedance spectroscopy technique to measure the impedance of the cells [10]. Sood et al. used ultrasonic transducers to non-destructively inspect and monitor the internal state of vital interfaces where degradation is prevalent inside lithium-ion batteries [11]. Mohanty et al. evaluated the homogeneity and thickness of dry and wet lithium secondary battery electrodes using infrared thermography and laser caliper methods [12]. Among non-destructive testing techniques, ultrasonic testing has the advantage that it can be performed quickly, inexpensively, and conveniently, so it is potentially well-suited for inspecting the welding state of the electrode of a lithium-ion battery during the manufacturing process. Nevertheless, studies on non-destructive testing of electrode welds of lithium-ion batteries using ultrasonic methods have not been attempted.
On the other hand, in the case of a very thin object, such as the electrode of the lithium-ion battery, it is difficult to evaluate the welding quality by analyzing received signals using only the existing methods. Accordingly, in recent years, studies have been aimed at more-accurately diagnosing conditions using artificial intelligence in cases where it is difficult to verify the condition using only existing non-destructive evaluation techniques [13]. In particular, deep learning based on high-performance computing and artificial neural networks is emerging as a useful artificial intelligence technique [14,15,16]. However, studies that applied deep learning techniques to electrode welding of batteries have not been conducted.
In this paper, the results of evaluating whether the electrodes of lithium-ion batteries are properly resistance spot welded, using a non-destructive ultrasonic method and deep learning, are described. The radio-frequency (RF) signal data obtained from ultrasonic experiments on the batteries were pre-processed using an upsampling method and data augmentation technique, and k-fold cross validation was employed for training and testing of the datasets. The constructed ultrasonic signal database was classified according to the welding status of lithium-ion battery electrodes using fully connected deep neural networks and convolutional neural networks while regularizing by a drop-out method for solving an overfitting problem. Figure 1 presents a general processing flow of classifying the welding of electrodes described in this paper.

2. Ultrasonic Experiment

2.1. Specimens

The batteries used in this study were cylindrical lithium-ion batteries (type 21700), each of which was a rechargeable lithium-ion cell with a diameter of 21 mm and a length of 70 mm. The case of this kind of battery is made of stainless steel, and electrodes are made of copper plated with aluminum. The electrode tab and the inside of the case are connected by resistance spot welding, and this welding condition is divided into four types: non-welding, insufficient welding, good welding, and excessive welding. Non-welding refers to a state in which welding is not performed at all, so that the electrode and the case are in contact with each other but not joined. These cases are easy to distinguish because they are not physically connected. Insufficient welding may increase the internal resistance of the battery, degrade product performance, and may cause the weld to release due to external impulses which may cause power failure. In addition, excessive welding may cause damage to the case of the welded portion, thereby causing defects such as electrolyte leakage. Therefore, non-welding, insufficient welding, and excessive welding can all be regarded as abnormal welding. Batteries rated as having an abnormal welding condition should be filtered out during production. Figure 2 shows the lithium-ion batteries covered in the study. Ten batteries of each type of welding were employed in the following tests.

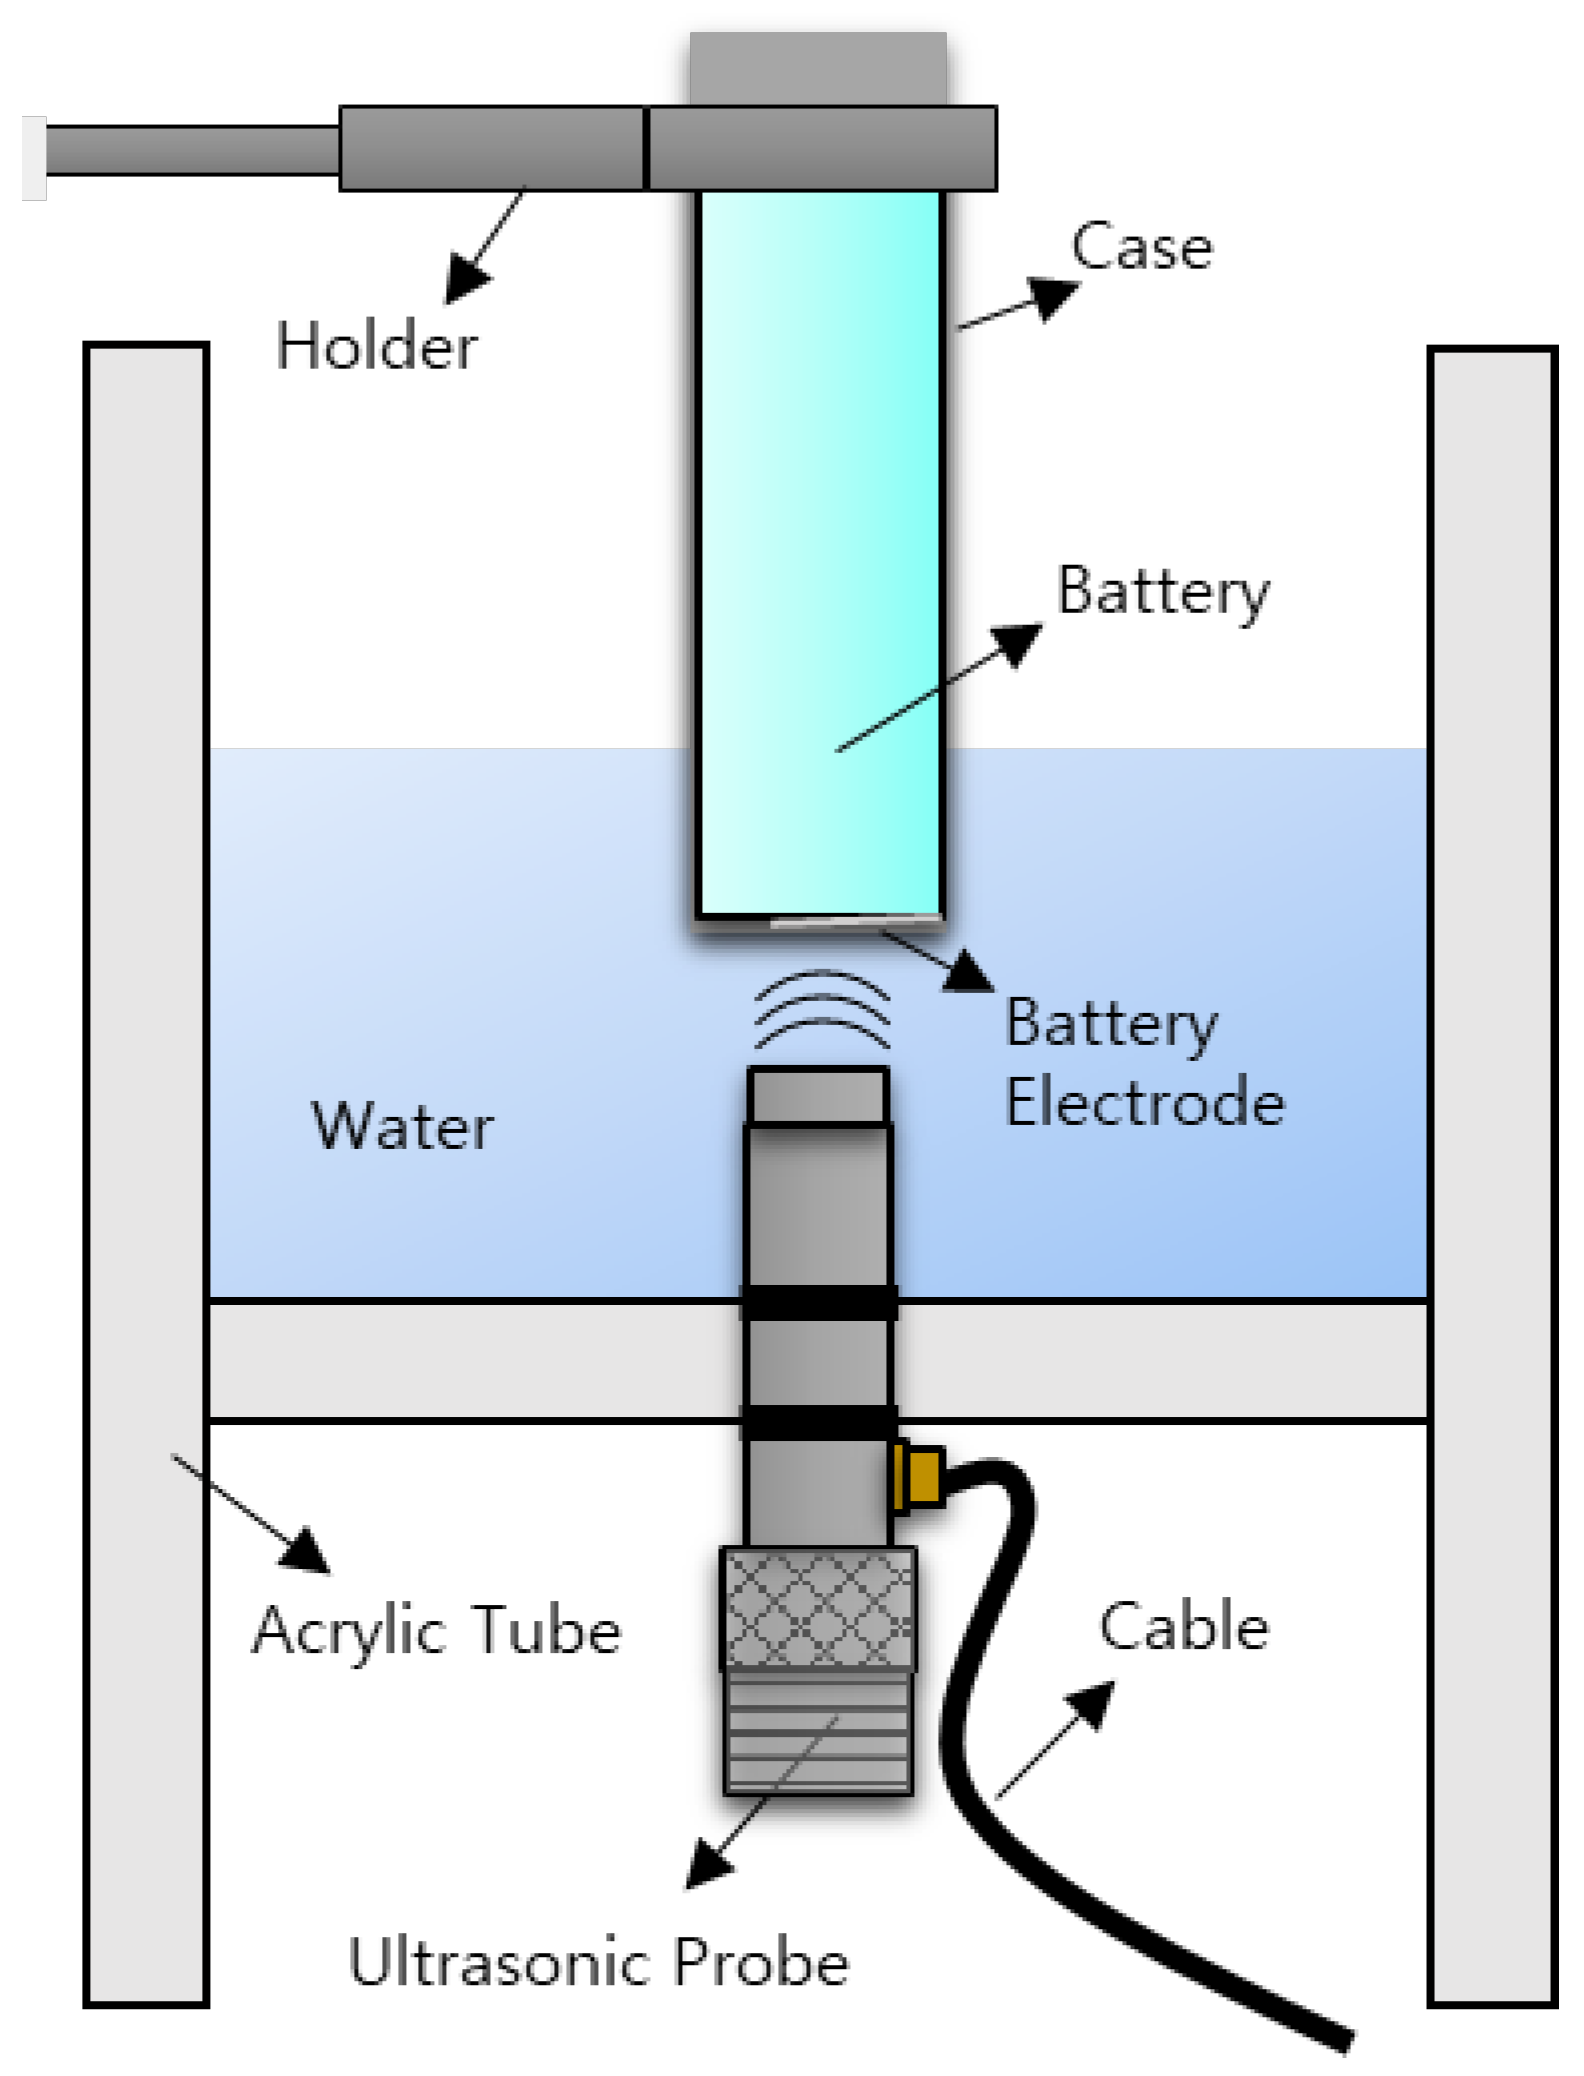
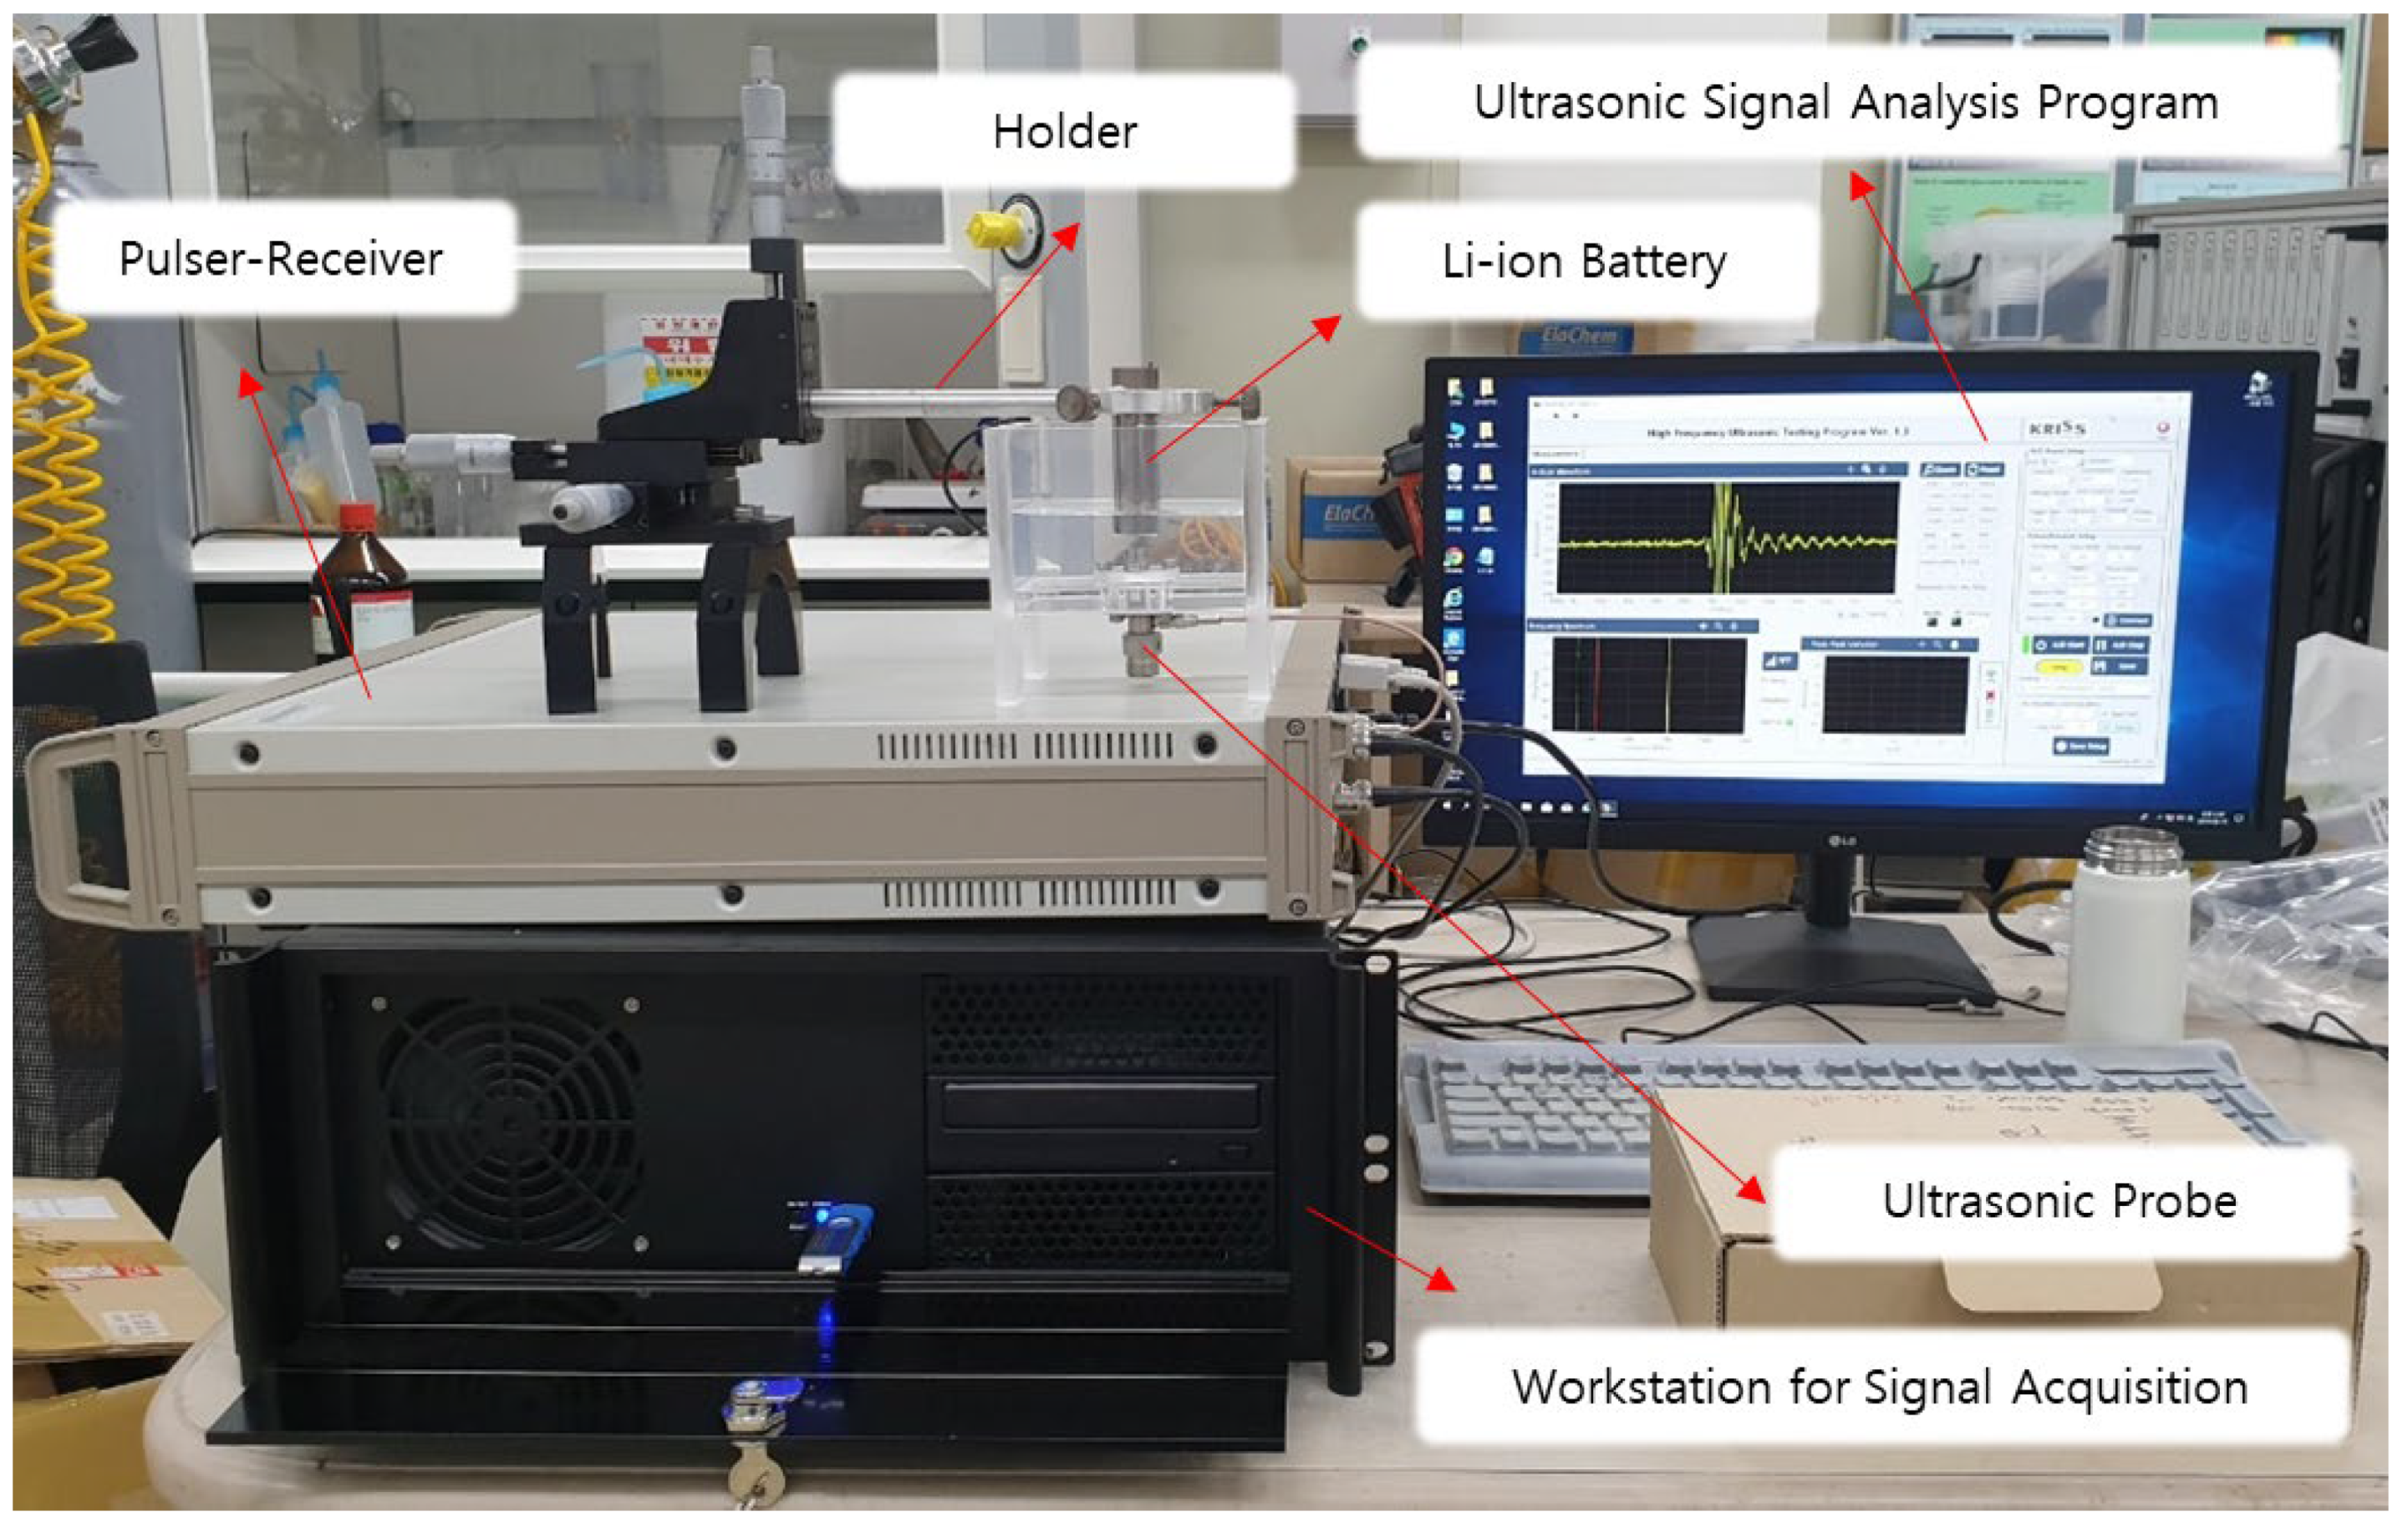
2.2. Experimental Set-Up

Because the case and electrode tab of the lithium-ion battery were very thin (0.3 and 0.1 mm, respectively), a high-sensitivity ultrasonic probe having a center frequency of 80 MHz and bandwidth greater than 100 MHz was used. This probe is for ultrasonic immersion inspection; it is used immersed in water together with the subject. In the case of submerging batteries to perform a conventional experiment using this probe, immersion may short out the terminals. Therefore, as shown in Figure 3, the ultrasonic testing was conducted with only the tip of the battery immersed in water. Figure 4 shows a photograph of the experimental set-up.

3. Ultrasonic Database

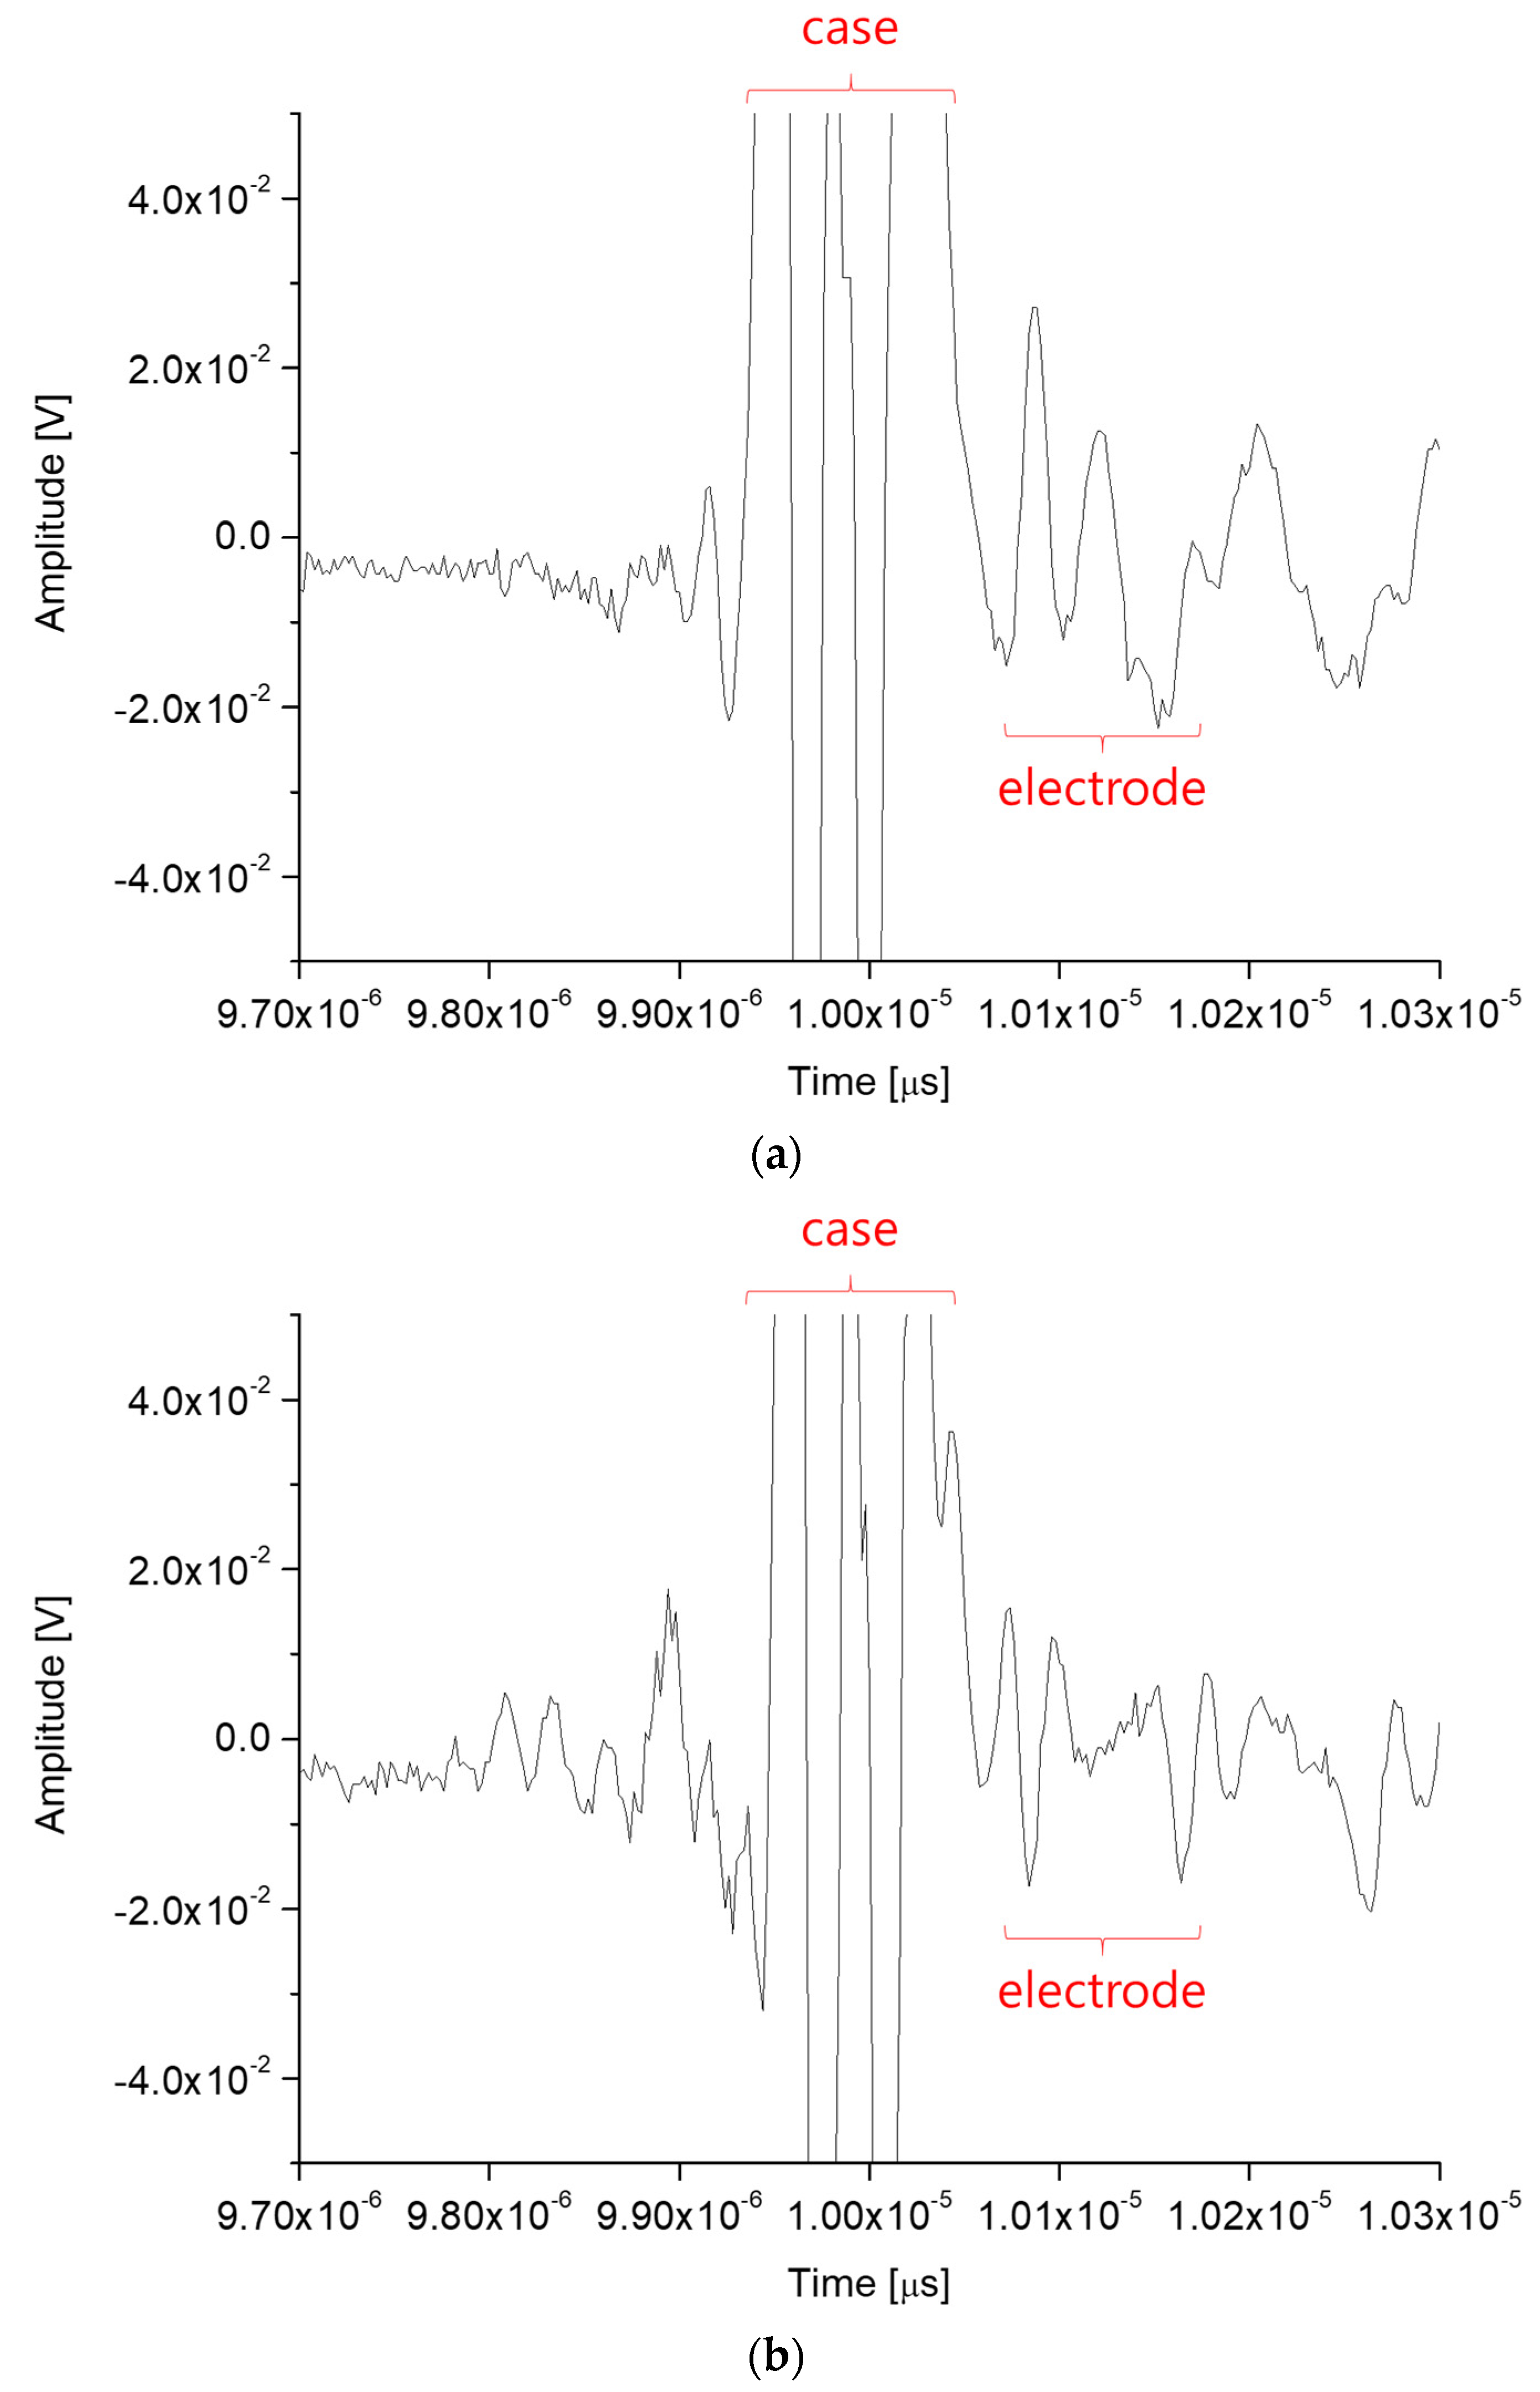
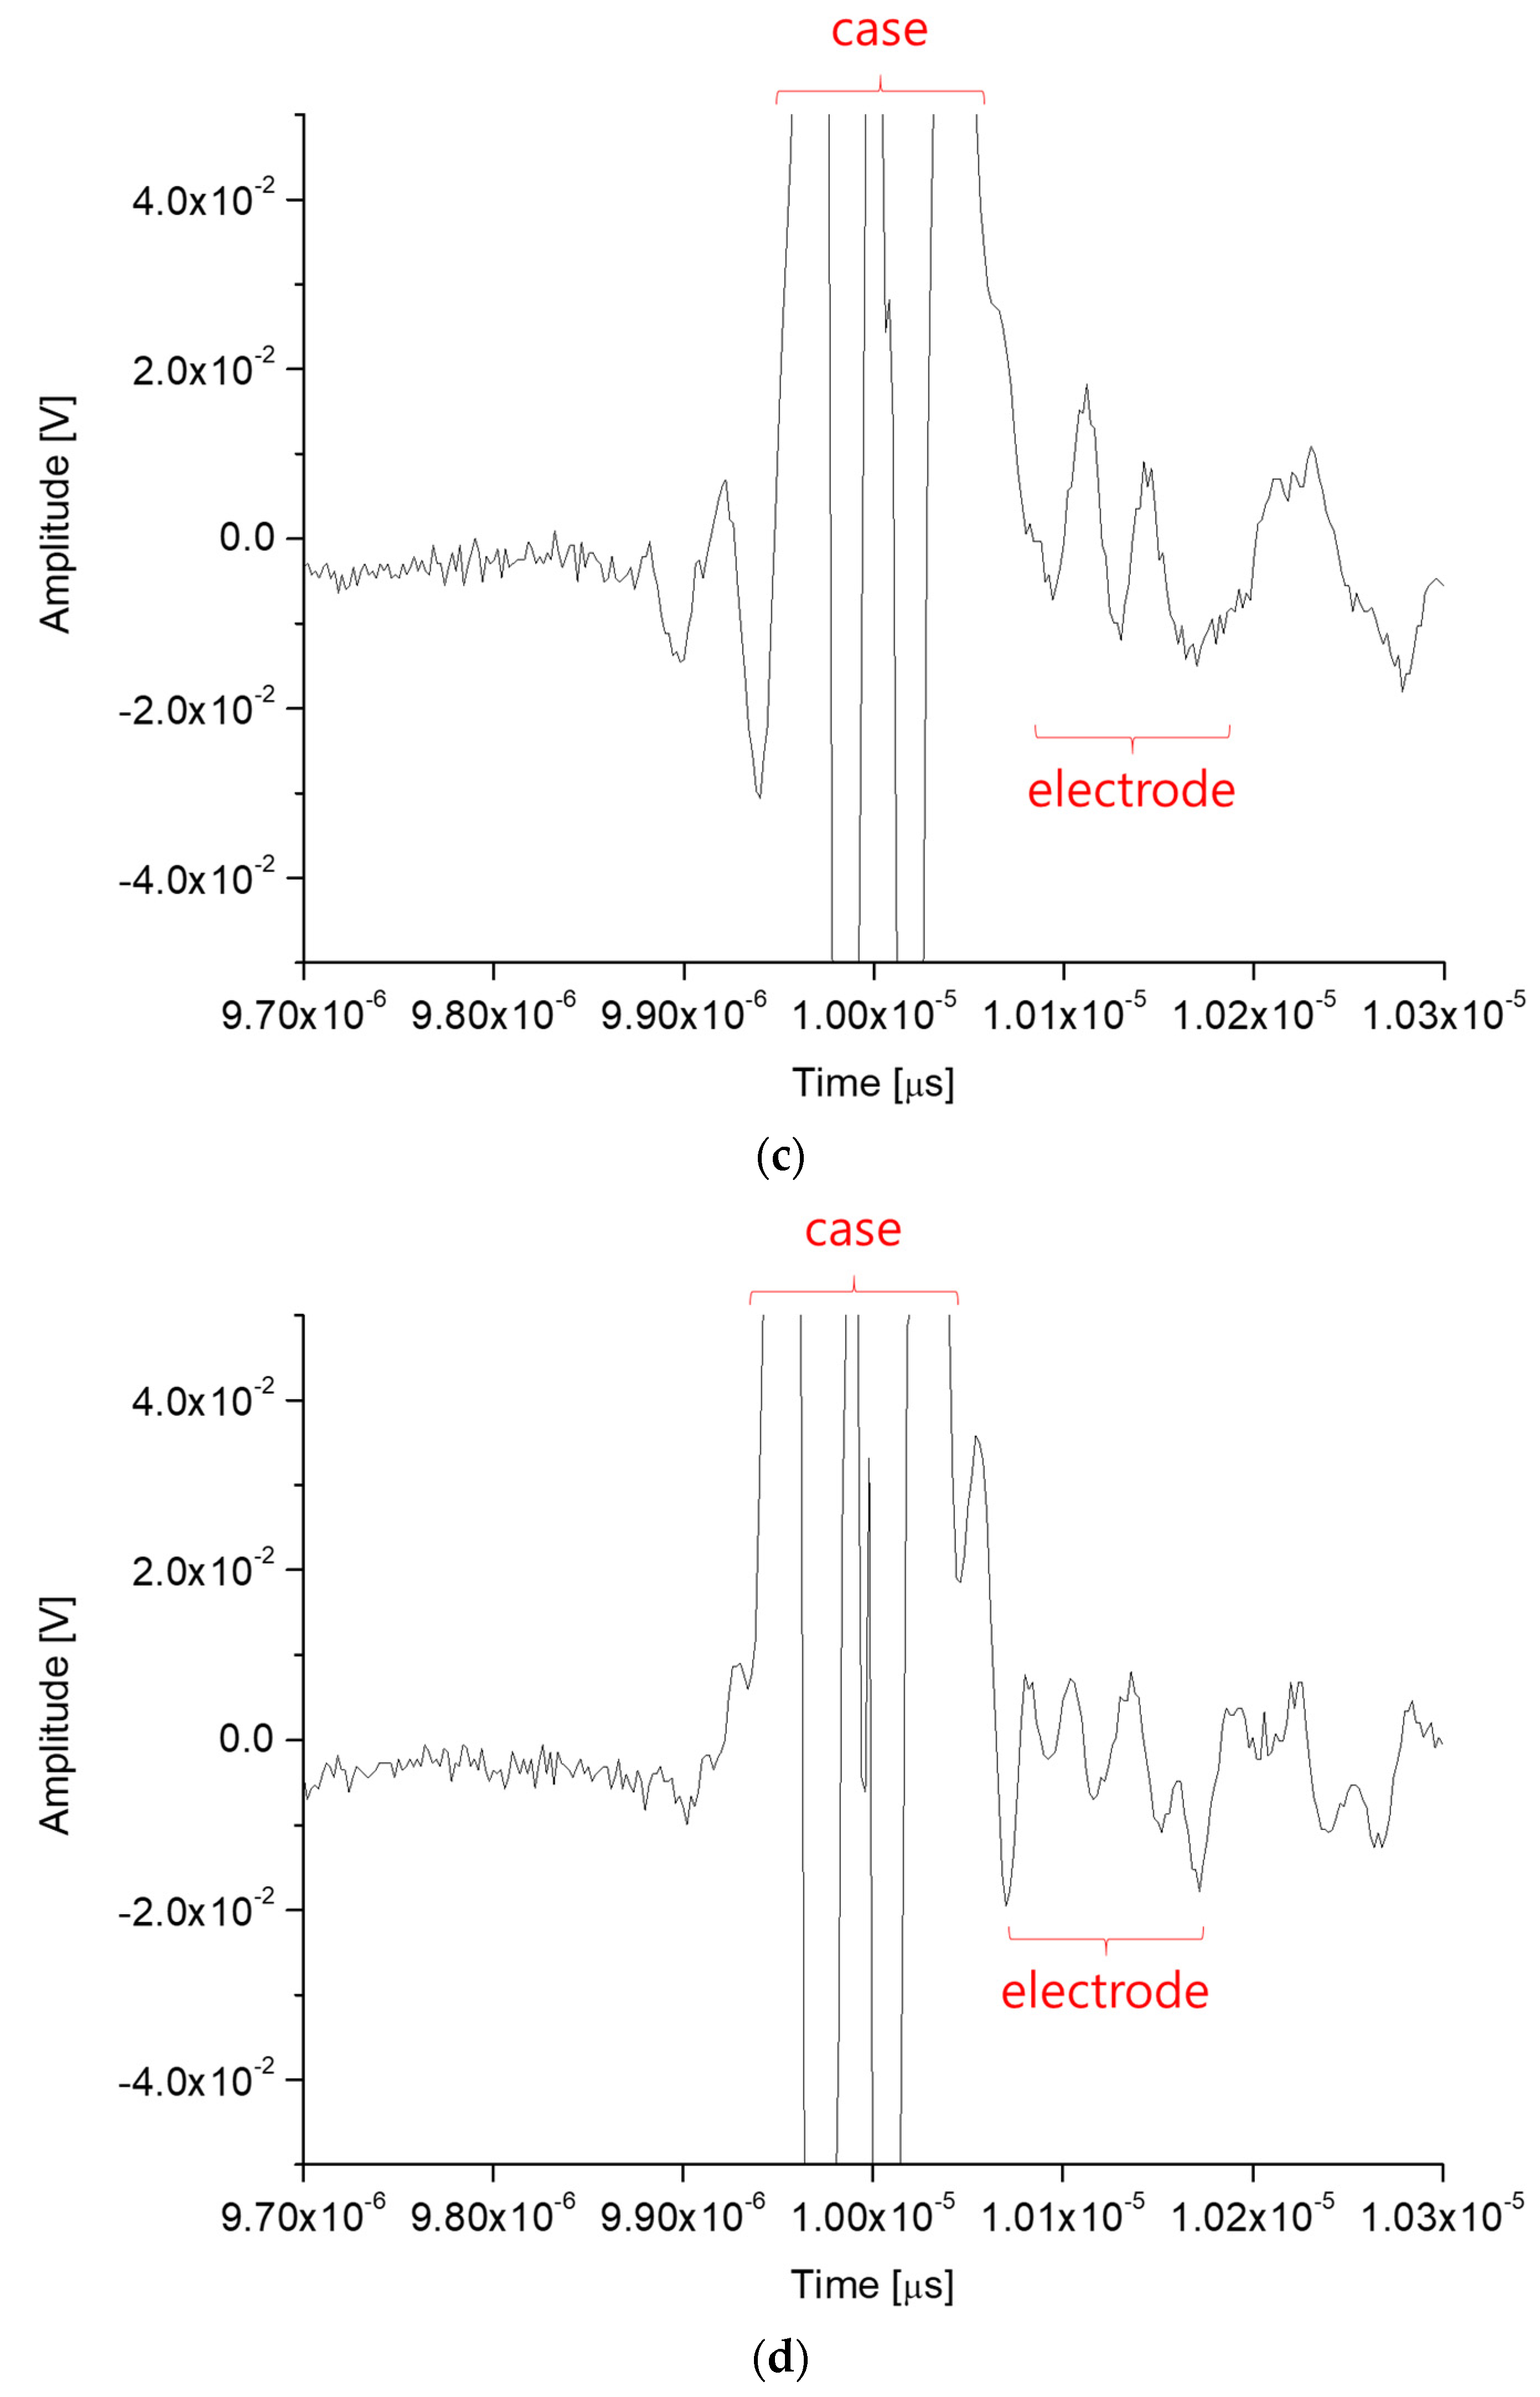
3.1. Analysis of Received RF Signals

Ultrasonic signals acquired from the ultrasonic semi-immersion testing were analyzed. Because the set distance between the probe surface and the bottom surface of the battery case was 7.5 mm, the time-of-flight of approximately 10 μs was calculated to examine the reflected signal from the battery case. Thus, the signals received from about 10.1 μs, which is the flight time of the ultrasonic waves reflected from the battery electrode, were investigated. Figure 5 shows the ultrasonic signals acquired from the ultrasonic inspection for batteries with different welding conditions. The amplitude of the ultrasonic signal reflected from the electrode was relatively lower than that of the ultrasonic signals reflected by the case. So, in order to analyze the signals reflected from each electrode, the signals were acquired by increasing the gain value even if the signal reflected in the case was saturated.
First, as shown in Figure 5a, it can be confirmed that the ultrasonic wave could be transmitted because the very thin layers were closely adhered, even though they were not welded. In contrast to Figure 5a, the ultrasonic signals received from the resistance-welded electrodes were corrupted due to noise added according to the presence of a weld nugget, which is a molten then solidified part generated in the joint. Therefore, the ultrasonic signals obtained from the electrodes in the welded state (Figure 5b–d) were noisier than that of the electrode in the unwelded state (Figure 5a). On the other hand, the ultrasonic signal received from the electrode in the case of normally performed resistance spot welding (Figure 5c) has two wave peaks similar to that of the non-welded case, only with more noise. On the contrary, in the cases of insufficient welding (Figure 5b) and excessive welding (Figure 5d), those wave peaks were accompanied by a time shift in the faster direction, and additional multiple peaks appear after receiving them. Further, compared to the case of excessive welding, it was confirmed that the ultrasonic signal acquired from the insufficient welded electrode generated relatively more noise at the additional peaks. The additional peaks in addition to the existing two peaks can be attributed to scattering by diffuse reflection occurring at the nugget and its interface. However, when welding is insufficient or excessive, the insufficient or excessive degree of welding cannot be quantitatively calculated, and because the physical shapes of the welded parts and welding conditions are all different, it cannot be clearly classified only by visually comparing the ultrasonic signals obtained.
Accordingly, it is nearly impossible to classify the welding state of the electrode by analyzing the acquired ultrasonic signals with the naked eye or by comparing them using general analysis programs, because the region of interest in the batteries to be inspected consists of multiple thin layers. Thus, deep-learning techniques were applied to automatically classify the measured RF signals. To apply this techniques, many measured ultrasonic signals were acquired for each battery. In the case of 10 batteries with good welding, 16 signals were acquired for each, thereby obtaining a total of 160 data sets. For the 30 batteries with abnormal welding (10 non-welding samples, 10 insufficient welding sample, and 10 excessive welding sample), 10 signals were acquired for each to reach a total of 300 data sets. The sampling frequency was 0.5 GHz and the number of samples of all signals was 2048 times.

3.2. Database Construction for Deep Learning

Non-destructive evaluation for the resistance welding of the electrodes was performed by applying deep-learning to the database obtained from ultrasonic semi-immersion testing. The following section describes the database processing techniques applied in this study to learn and test effectively the artificial neural network.
First, an upsampling method was applied to increase the resolution of the received ultrasonic signals to improve the learning efficiency of the artificial neural networks. In the case where the sampling frequency of the signals is fixed or limited by the specification of the measurement system for collecting the ultrasonic signals, their resolution can be increased through the upsampling method. Accordingly, the sampling frequency was increased from 0.5 to 1 GHz using interpolation. That is, signals sampled 2048 times were converted into 4096 digital signals.
To solve the many problems that may occur in the learning process, and to train the artificial neural network efficiently, a large amount of data are required. Thus, a data augmentation technique was applied to improve the performance of signal classification using deep learning [17,18,19,20,21,22]. To amplify the number of data sets, while retaining the same signal shape, new signals were generated by parallel shifting (by −20, −14, −10, −6, 0, 6, 10, 14, and 20 ns) along the time axis of the signals using the time-shifting technique. Thereby, the dataset of the upsampled 160 signals for good welding category was extended to provide 1440 signals, a 9-fold increase by the time-axis adjustment. On the other hand, the upsampled signals from datasets for abnormal welding were parallel shifted on the time axis (by −10, −5, 0, 5, and 10 ns), and extended by 5 times, to provide 1500 signals. Thus, the deep-learning database included a total of 2940 ultrasonic signals.
To verify that learning by the artificial neural network was performed, and to minimize the effects of randomization, a k-fold cross-validation technique was used. The k-fold cross validation is a technique that divides the database into k number of folds so that learning is conducted in as many cases as possible without overlapping the training data and the test data [23,24]. Figure 6 shows an overview of the k-fold cross validation.
K-fold cross validation with k = 10 was applied to the datasets. Accordingly, 294 randomly selected signals (10% of the total of 2940 signals) were used for testing and the remaining 90% (2646 signals) were used for training. In this way, 10 repetitions were performed, but training was performed so that no signal was used for testing more than twice.

4. Deep Neural Network

4.1. Regularization

Because the performance of individual computer processors has dramatically increased in recent years, artificial neural networks with deep structure and a large number of layers have been developed. Such an artificial neural network may exhibit an overfitting problem with high accuracy only in the training data of the trained model. To avoid this problem, regularization can be applied, which ultimately induces weight decay of the artificial neural network to level the weight, thereby allowing the thinking structure of the artificial neural network to be generalized.
For the fully connected deep neural network (fully connected DNN) used in this study, a drop-out method was applied for regularization [22,25,26]. The drop-out method does not perform learning on all layers in the network, but is a technique that prevents the weight of a specific path from being specialized by the training data. This is achieved by omitting some neurons of an input layer or some hidden layers in the network [27,28]. Through this technique, the effect of a specific neuron is not increased, but an average effect by voting can be obtained, and co-adaptation can be avoided.

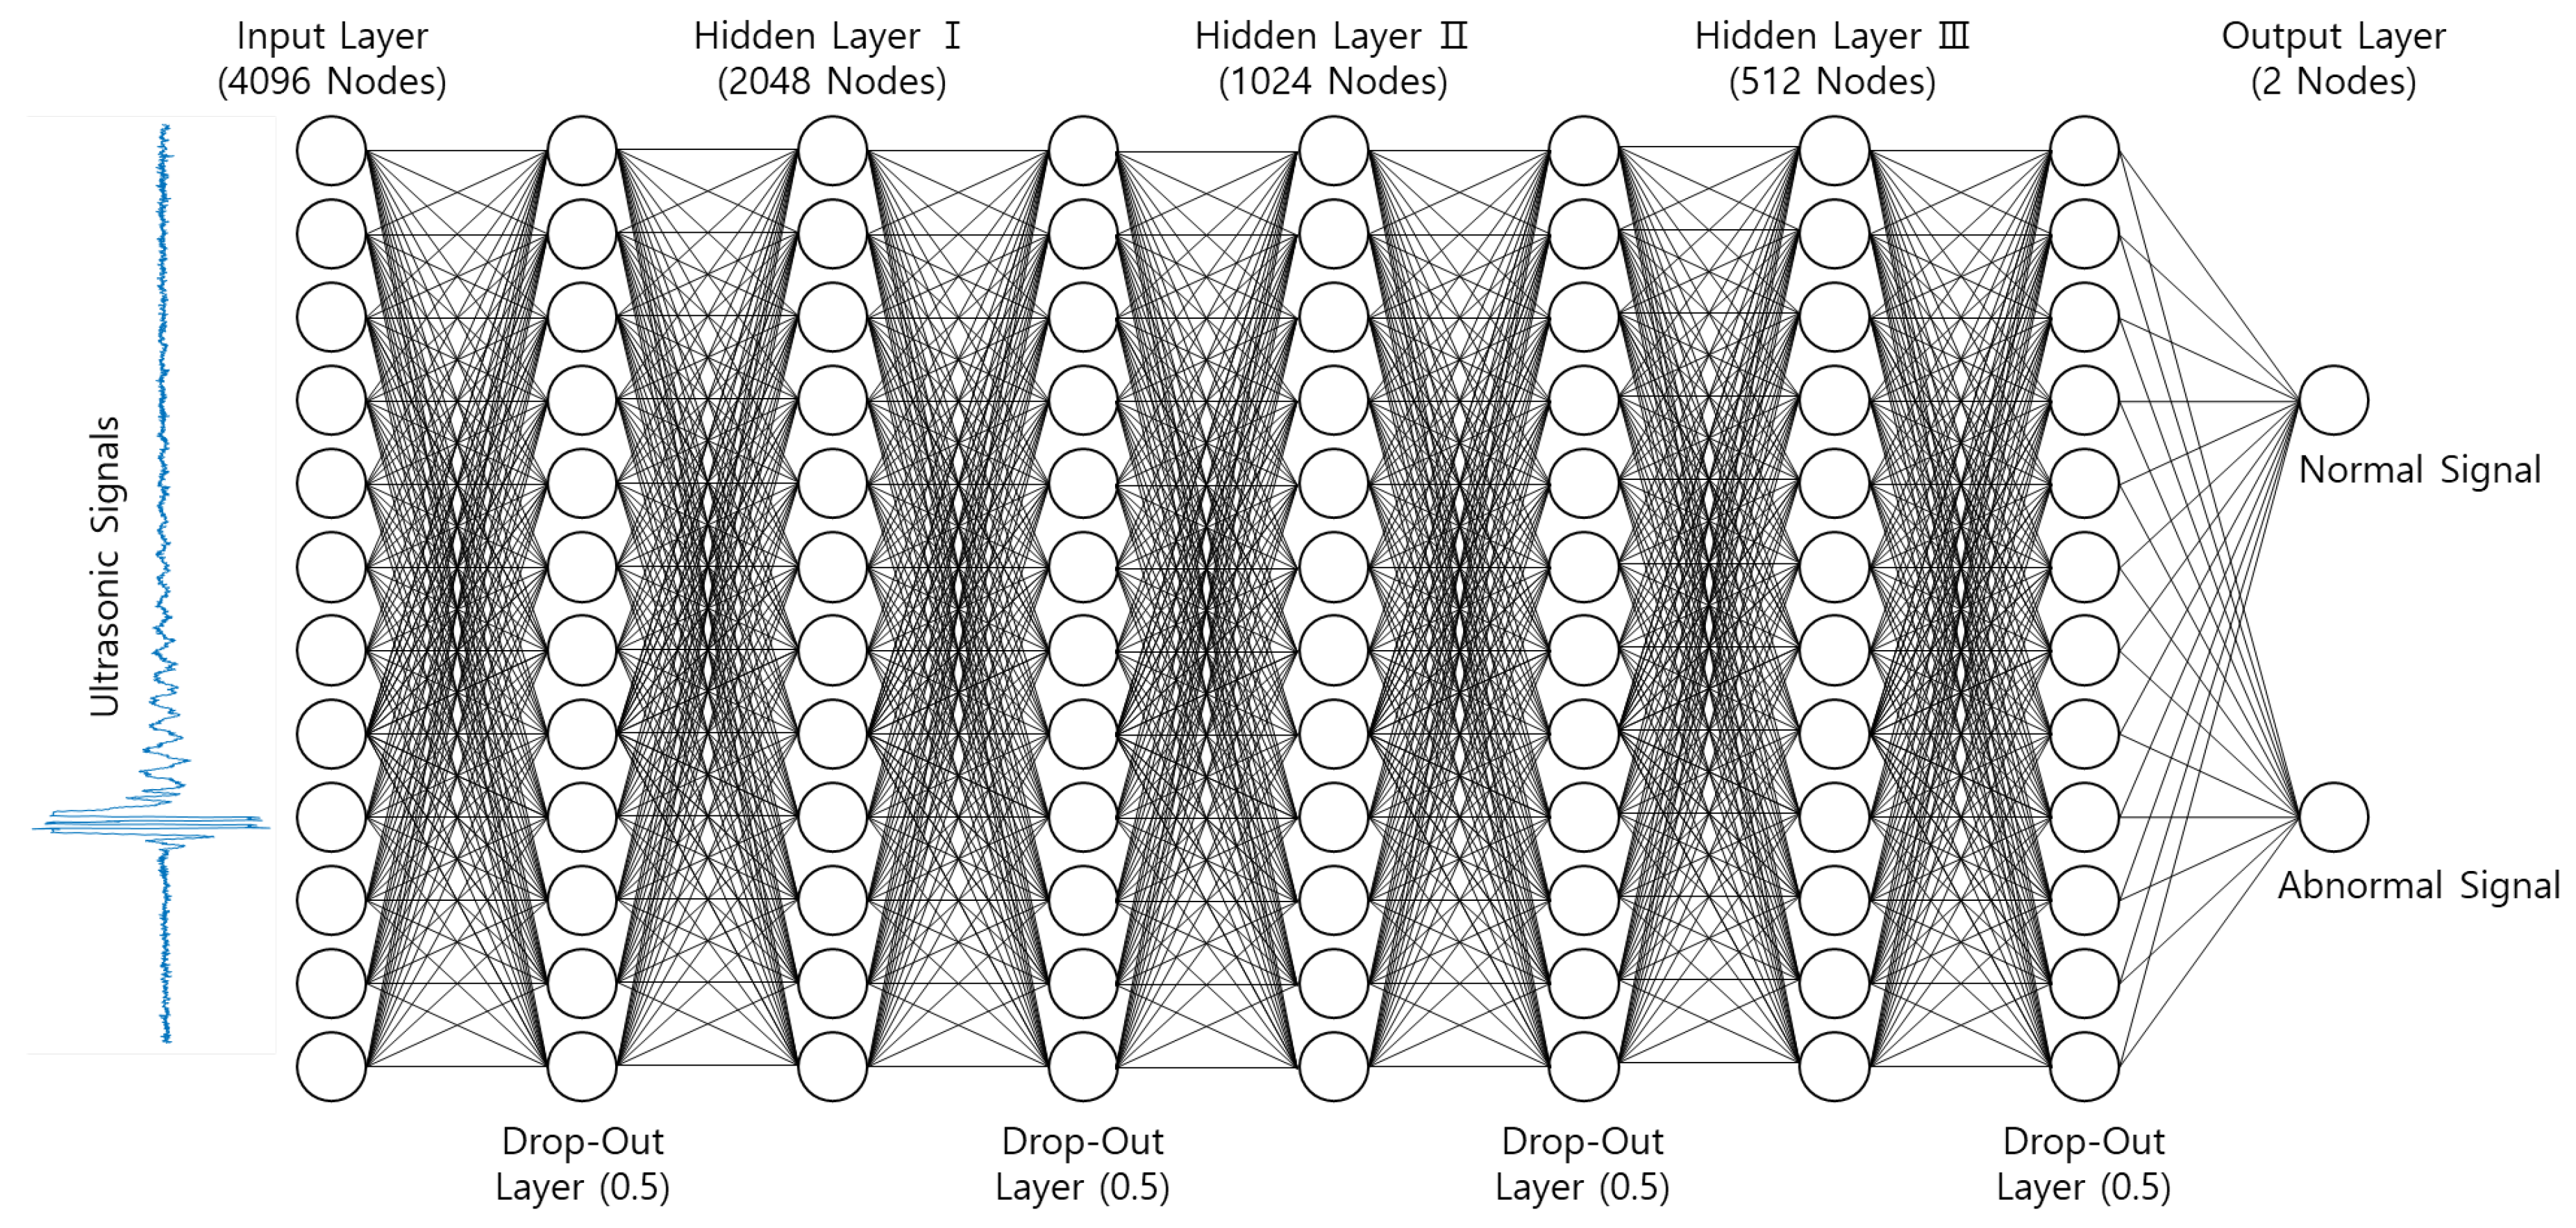
4.2. Fully Connected Deep Neural Network

The ultrasonic signal database was classified for the resistance welding of the battery electrodes by employing the fully connected DNN. The number of nodes in the input layer was set to 4096, which is the number of times the upsampling signals were sampled. There was a total of three hidden layers set to 2048, 1024, and 512 nodes, respectively. The output layer was set to two nodes to distinguish between normal and abnormal. The reason for the classification of normal and abnormal welding is that it is very important to distinguish normal products from defective ones in the actual manufacturing process.
In the fully connected DNN, the values coming into a node were not passed directly to the next layer, but were passed after passing a nonlinear function called the activation function. A sigmoid function is the most widely applied in the input layer, but this function has a vanishing gradient problem and the learning speed is slow. For this reason, activation functions such as a Rectified Linear Unit (ReLU) function have recently been used [26,29,30,31,32,33,34]. However, this function has the problem of Dying ReLU because the slope is 0 for values with x < 0. In this study, the exponential linear unit (ELU) function was applied as the activation function of the input layer. This function includes all the advantages of the ReLU function, but has also the feature of solving the Dying ReLU problem [17,35,36].
Softmax functions were applied to the output layer appropriately for multinomial classification as an activation function, and the sum of the result values was fixed at 1, so it is possible to represent the probability that data passing through the network are classified. The cross-entropy function was applied as a cost function for performing linear regression by calculating the difference between the predicted value of the Softmax function and the actual value. For this neural network, the drop-out rates for each layers were 0.5 [28] and the learning rate selected was 0.002. Figure 7 shows the architecture of the fully connected DNN.

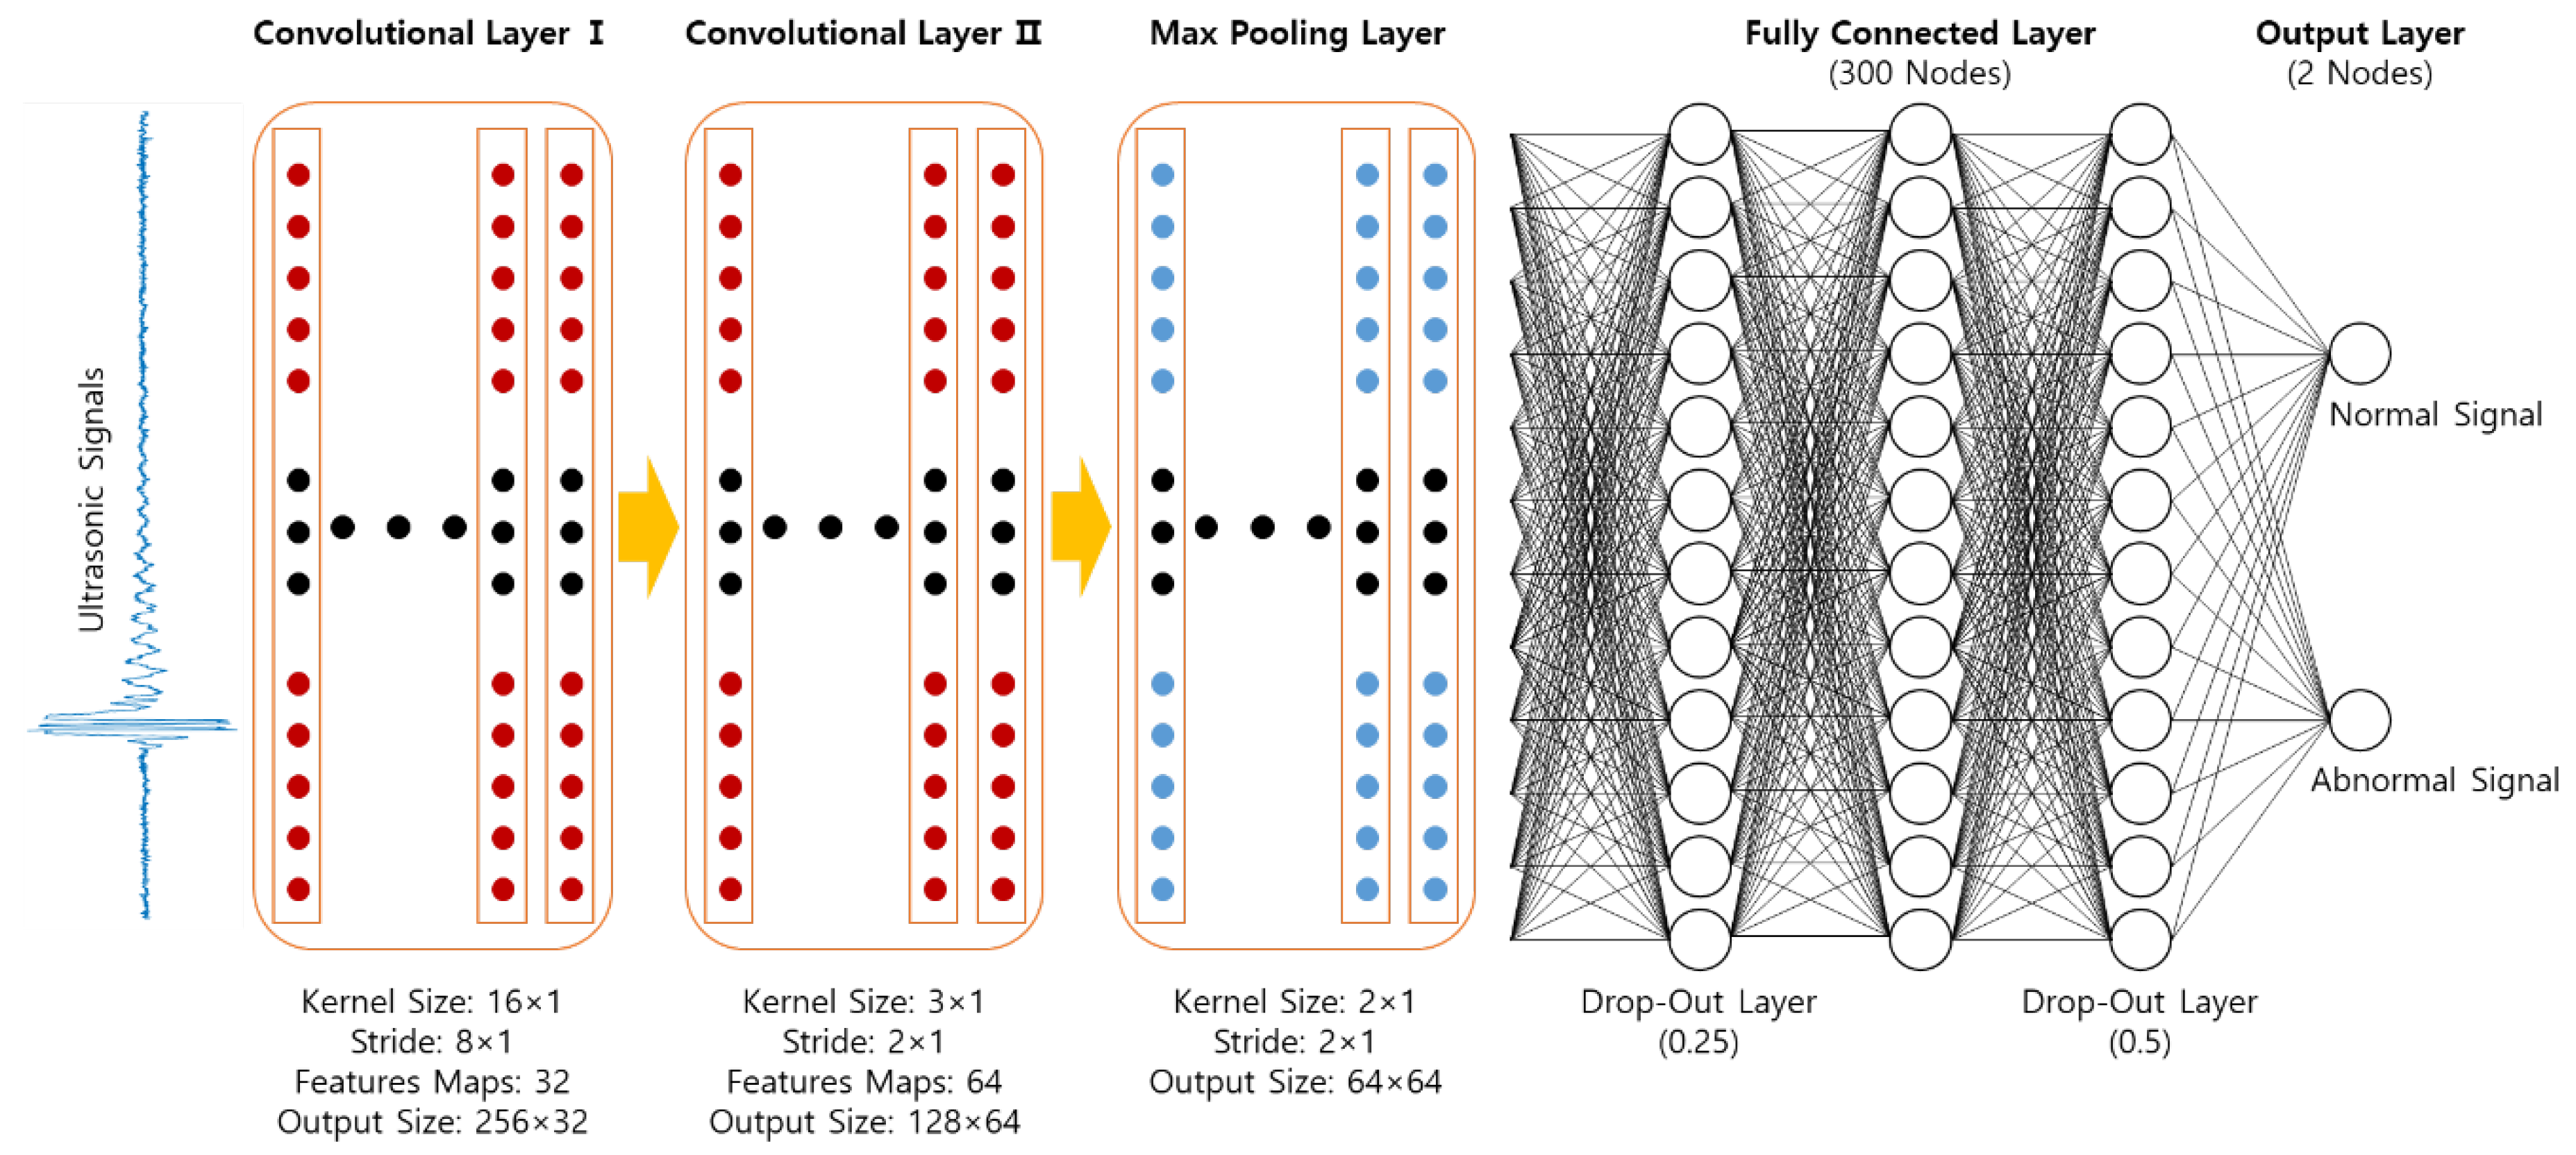
4.3. Convolutional Neural Network

The same database was classified according to whether the battery electrode welds were normal or not by applying a convolutional neural network (CNN). CNN is a technique that creates a feature map by applying convolution using a specific number of kernels to data, and classifies data by passing the extracted features through a fully connected layer [14,15,16,35,37,38,39]. The network consisted of one input layer, two convolutional layers, one max pool layer, and one fully connected layer.
The number of nodes in the input layer was 4096 (equivalent to the fully connected DNN). The first convolutional layer had 32 kernels, and the kernel size was 16 × 1, which was largely maintained for good performance in interpreting noisy signals. The effect of pooling was applied by setting the stride of the second convolutional layer to 2 × 1 [40]. This reduces the number of layers, but does not affect performance.
After extracting the feature map through the convolution layer, the fully connected layer had 300 nodes, and the output layer had two nodes. As in the fully connected DNN, the ELU function was applied as the activation function of the input layer, and the Softmax function was used as the activation function of the output layer. The cross-entropy function was applied as the cost function. Drop-out regularization was also used for the fully connected layer to avoid overfitting. This neural network is regularized by drop-out layers with training probabilities of 0.25 and 0.5 respectively before and after the fully connected layer to avoid overfitting. And, the learning rate selected was 0.002. Figure 8 show the architecture and parameters of the CNN.

5. Results

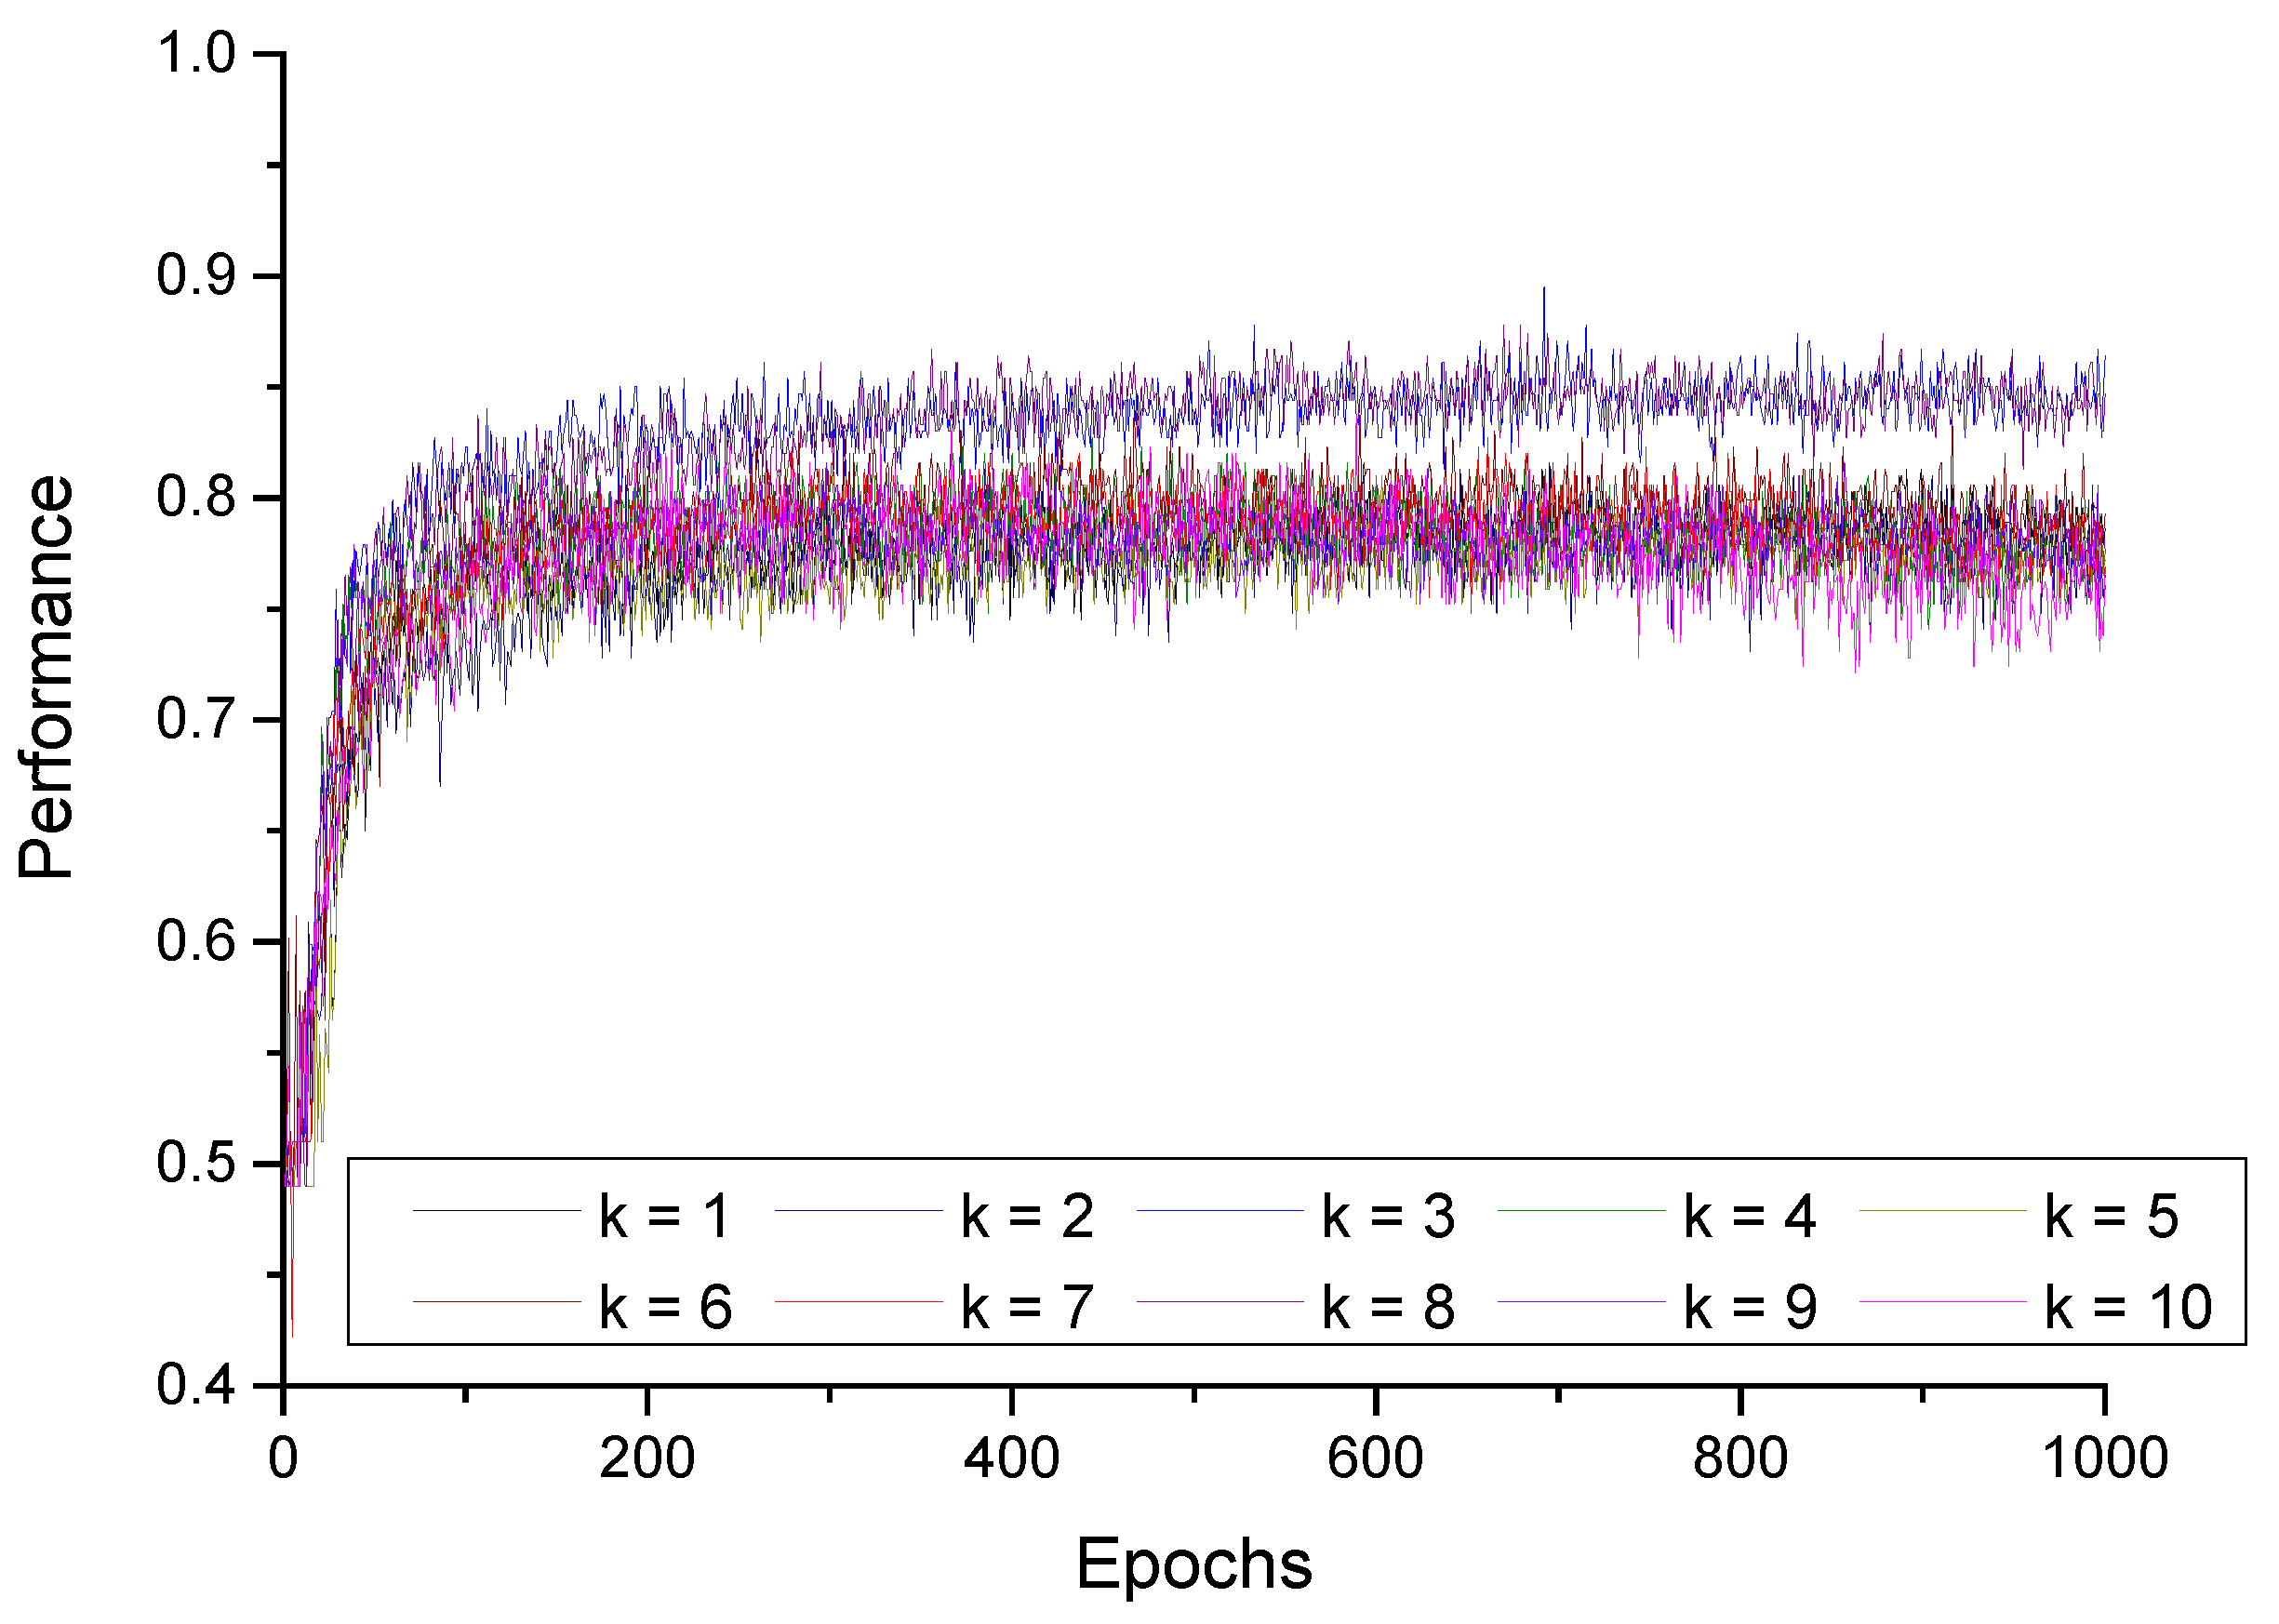
5.1. Results of the Fully Connected Deep Neural Network

From the learning results gained using the training database and testing against the test database, the performance obtained through the fully connected DNN was evaluated. For the k-fold cross-validation with k = 10, 10 results were obtained by performing 10 trainings. As shown in Figure 9, the learning curves obtained started with an accuracy of about 49%, reached the saturation point at about the 175th epoch, and did not show improvement after this. Accordingly, the run was completed at the 1000th epoch due to lack of improved results. Table 1 shows the accuracy achieved through the fully connected DNN.

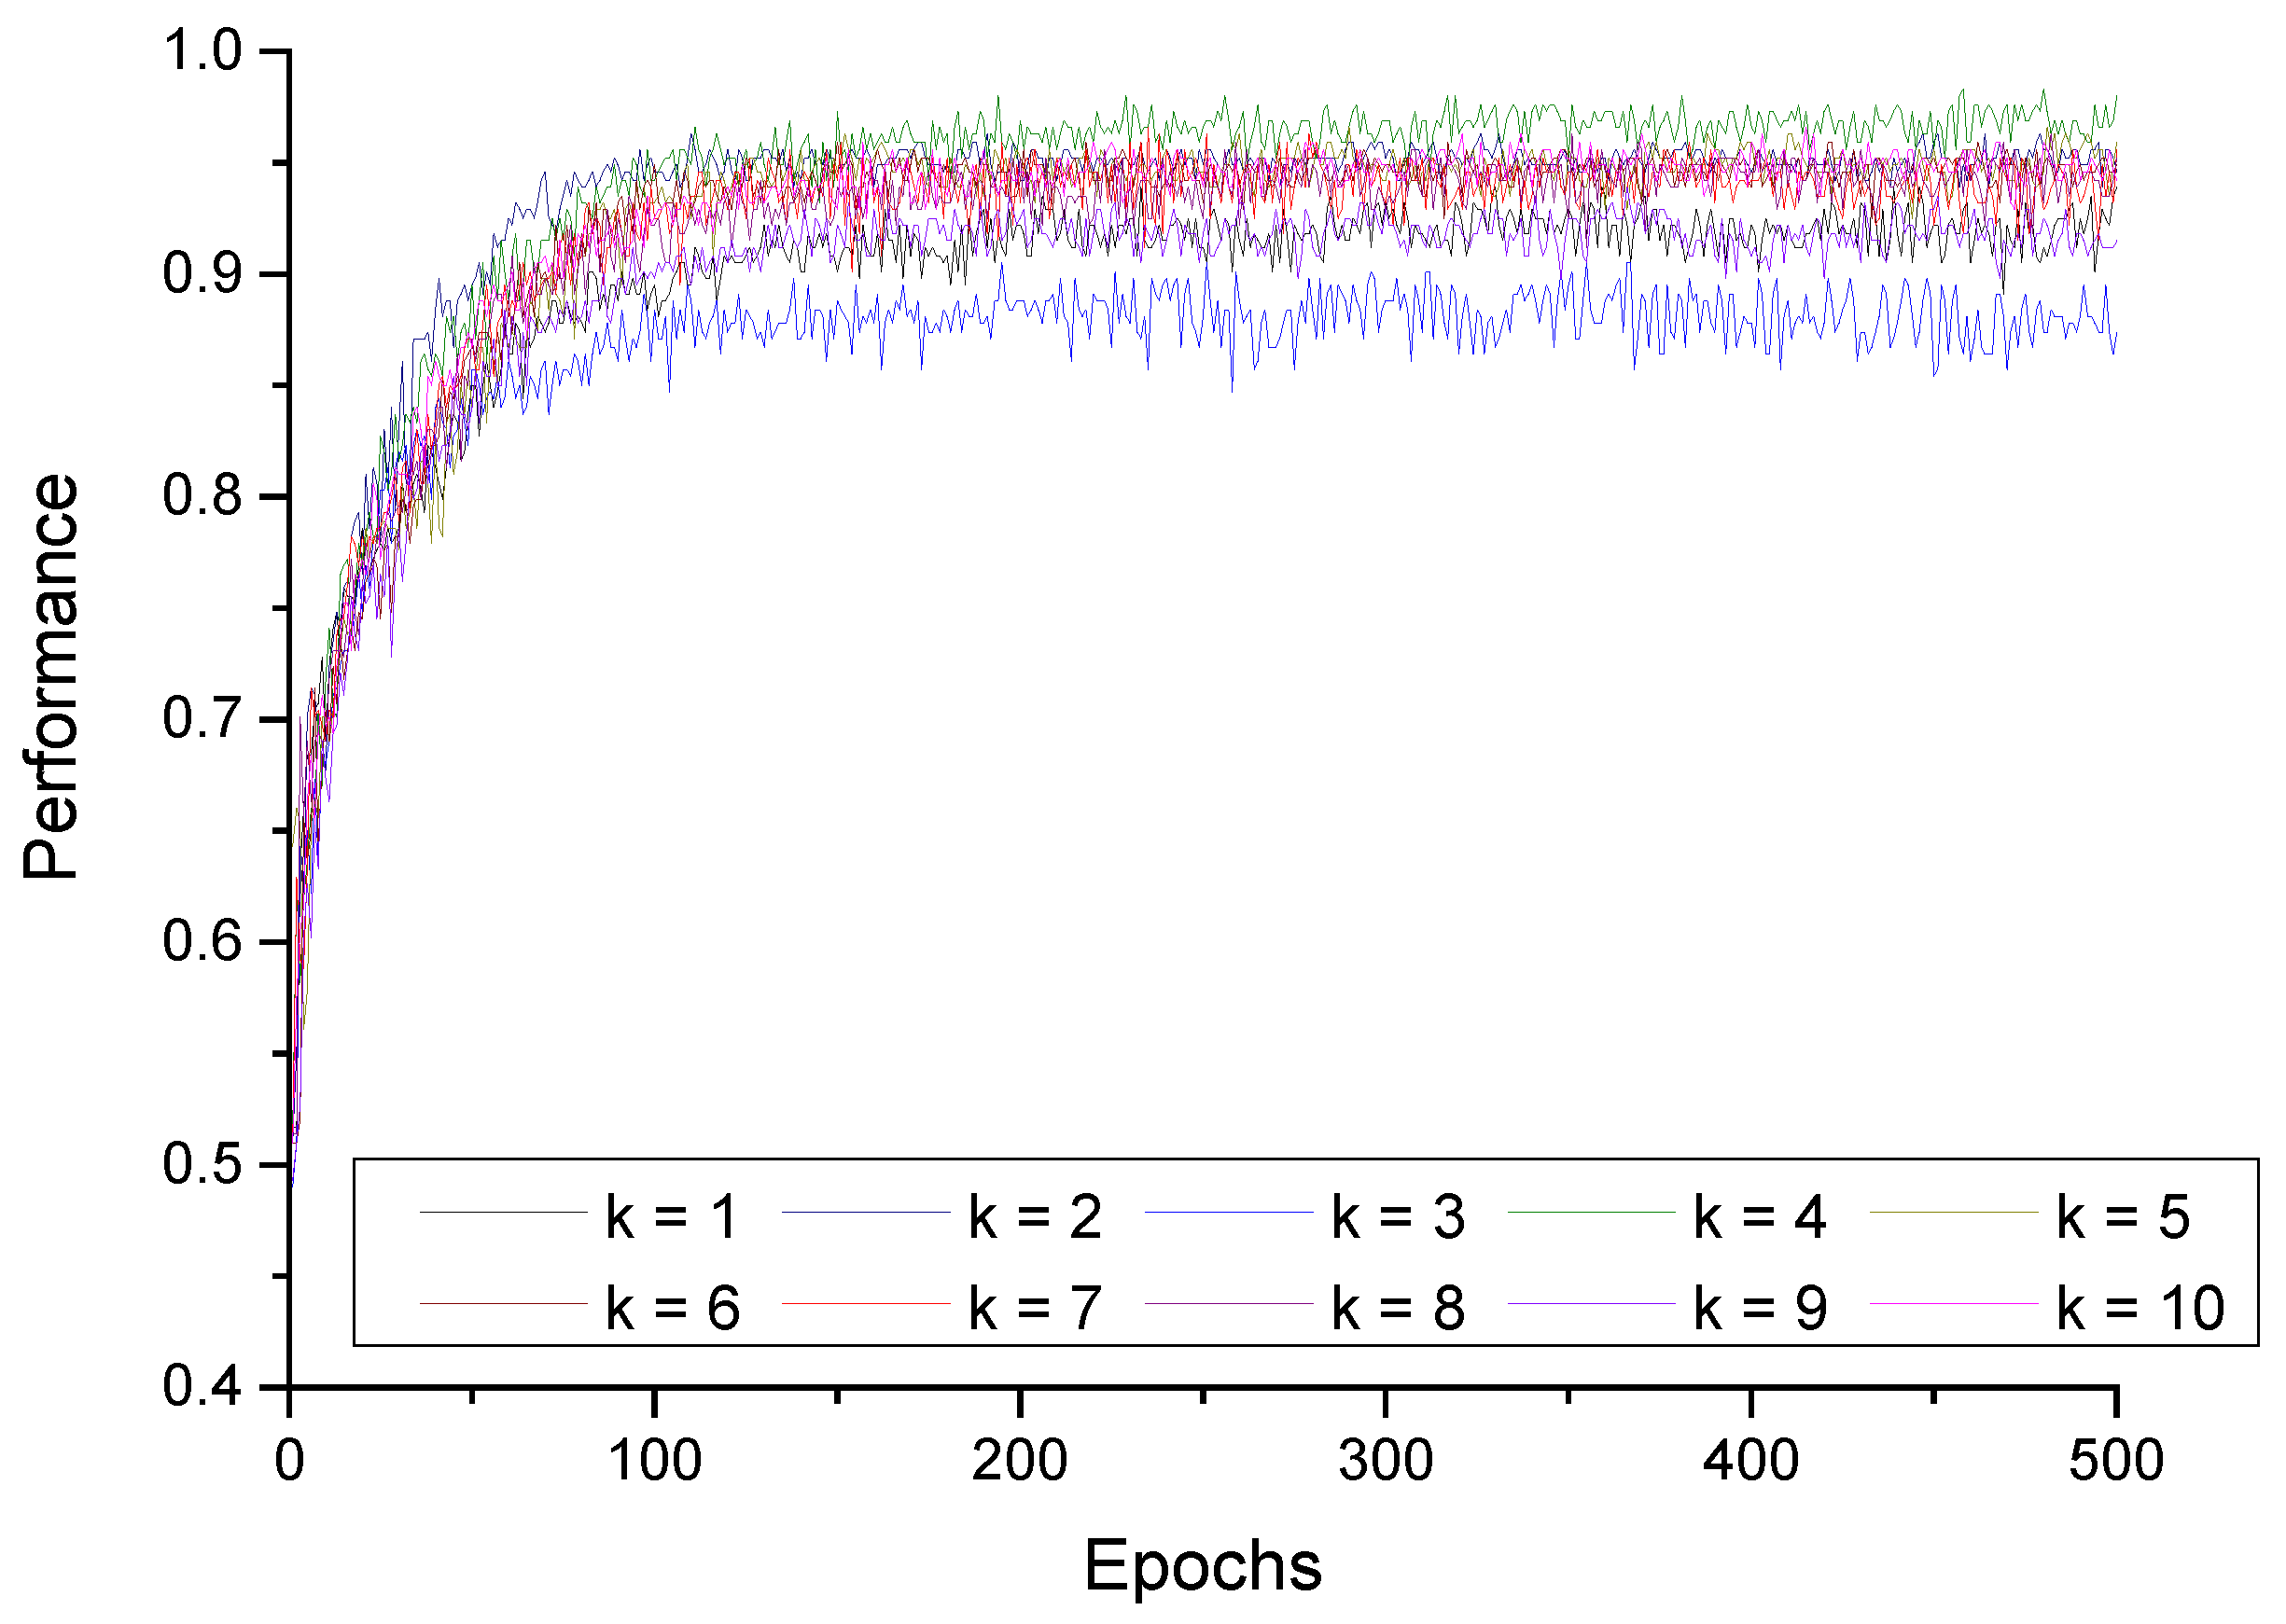
5.2. Results for the Convolutional Neural Network

The results through the CNN were also evaluated using the same database. Figure 10 shows the learning curves for 500 epochs. The results obtained with the CNN started at approximately 51% testing accuracy and reached the saturation point at approximately the 75th epoch. Table 2 shows the accuracy achieved using the CNN.

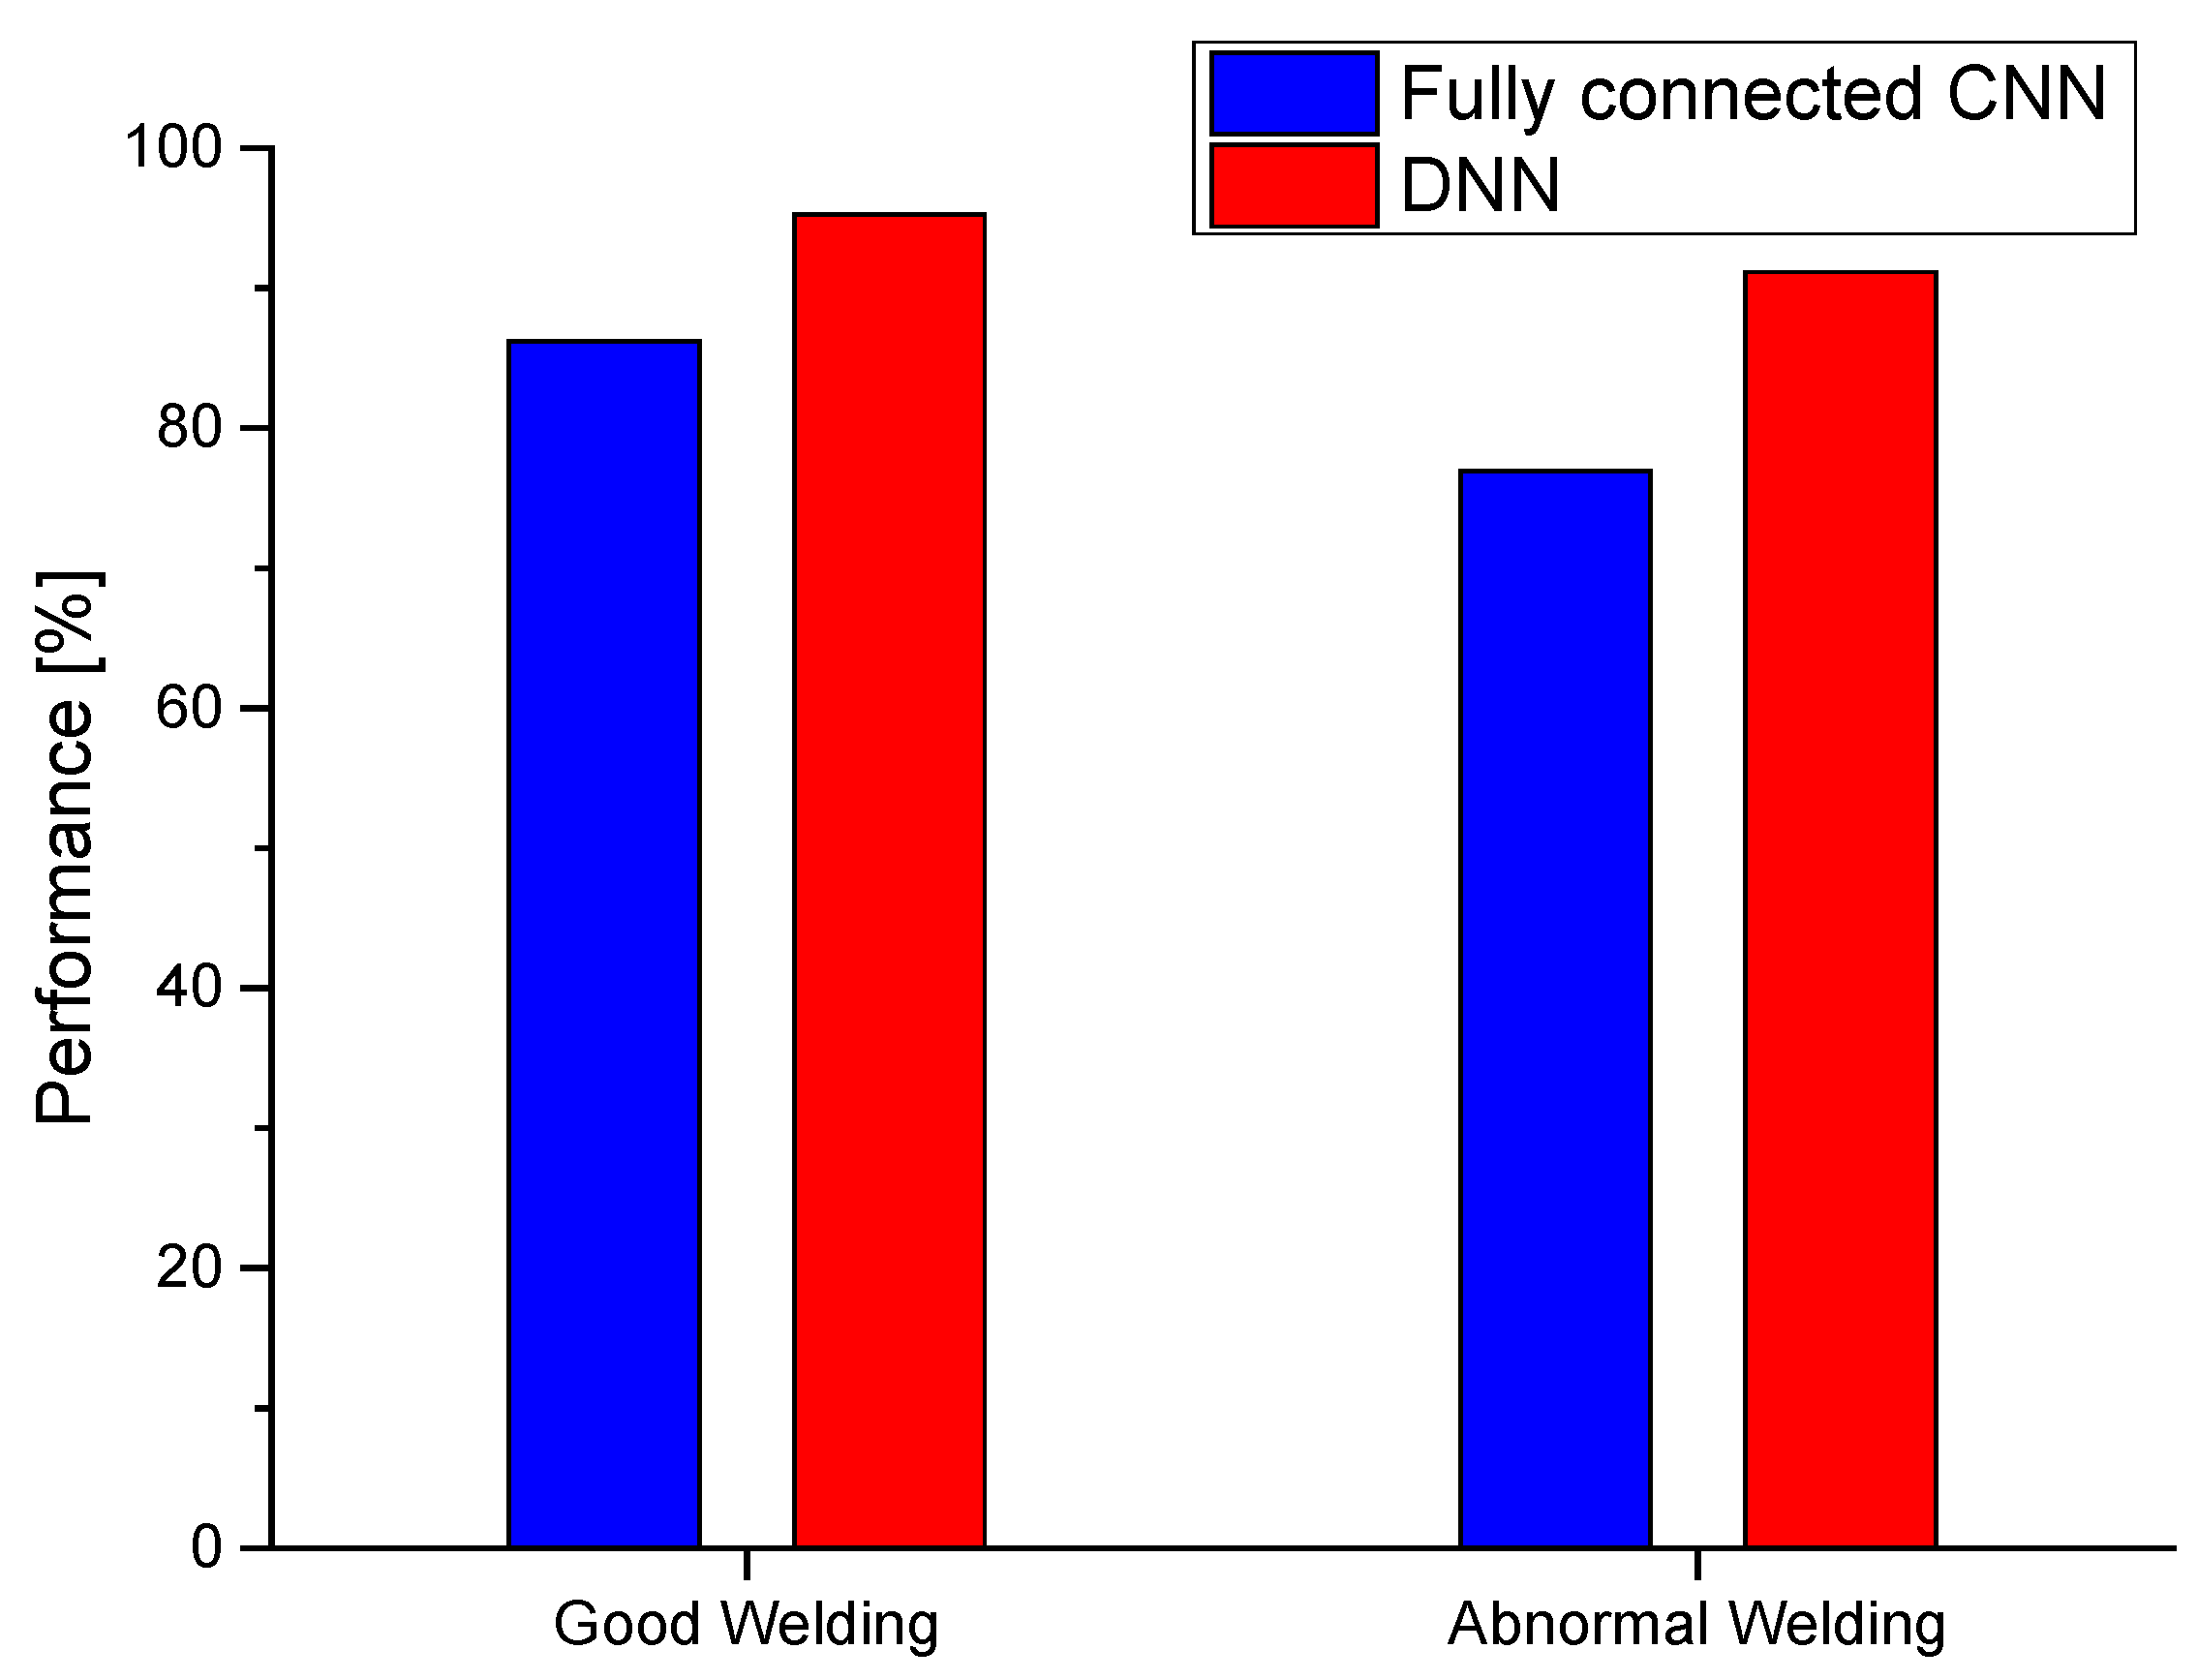
5.3. Performance Comparison

According to the comparison of the classification using the fully connected DNN and CNN in the ultrasonic database, in relation to the weld-state of the battery electrode, it was determined that the CNN showed high performance, on average. When comparing the average values, the performance for distinguishing good welds was 9.08% higher, and the performance for sorting abnormal welds was 14.17% higher.
In addition, as shown in Figure 9 and Figure 10, the fully connected DNN tended to exhibit fluctuating learning performance, making it difficult to obtain valid results. From these points, the difference in the performance of fully connected DNN and CNN is expected to be quite high. That the CNN shows better performance in a subject having such a thin structure was verified. Figure 11 shows the average values of the results through the two networks.

6. Conclusions

In this paper, research conducted to automatically classify the electrodes in batteries according to the state of resistance welding was described. The most important parts of this study related to the acquisition of the signals by transmitting ultrasonic waves through thin electrodes, and constructing network architectures that enable classification according to each welding state using the obtained database.
First, several ultrasonic experiments were performed on lithium-ion batteries to obtain ultrasonic data, and the original database was processed to facilitate classification. The fully connected DNN was applied to this database to effectively classify the ultrasonic signals obtained through the experiments. Moreover, the CNN was additionally applied to improve the performance of automatic classification.
Finally, the results for correctly classifying the normal and abnormal welds were compared. The average performance of the CNN was 95.26% and 91.127%, respectively, with 9.08% and 14.17% improvement over the fully connected DNN, respectively. Therefore, it can be concluded that a CNN is more suitable for classifying states using ultrasonic signals for thin structured objects, such as welds of electrodes in lithium-ion batteries. Furthermore, because this approach achieved high performance in classifying good welds, the potential for the use of artificial neural networks for the evaluation of lithium-ion battery integrity was verified.

Author Contributions

Conceptualization, H.-J.K. and K.-B.K.; methodology, H.-J.K. and K.-B.K.; software, J.P. and N.M.; validation, Y.-I.H., J.P. and K.-B.K.; formal analysis, Y.-I.H. and N.M.; investigation, Y.-I.H.; resources, S.-J.S. and K.-B.K.; data curation, Y.-I.H., J.P. and N.M.; writing—original draft preparation, Y.-I.H.; writing—review and editing, J.P. and K.-B.K.; visualization, Y.-I.H. and J.P.; supervision, H.-J.K., S.-J.S. and K.-B.K.; project administration, K.-B.K.; funding acquisition, K.-B.K. All authors have read and agreed to the published version of the manuscript.

Funding

This research was supported by a “development of safety measurement technology for infrastructure industry” grant funded by the Korea Research Institute of Standards and Science (KRISS-2022-GP2022-0010).

Institutional Review Board Statement

Not applicable.

Informed Consent Statement

Not applicable.

Data Availability Statement

Not applicable.

Conflicts of Interest

The authors declare no conflict of interest.

References

  1. Lu, L.; Han, X.; Li, J.; Hua, J.; Ouyang, M. A review on the key issues for lithium-ion battery management in electric vehicles. J. Power Sources 2013, 226, 272–288. [Google Scholar] [CrossRef]
  2. Yoshino, A. The birth of the lithium-ion battery. Angew. Chem. Int. Ed. 2012, 51, 5798–5800. [Google Scholar] [CrossRef] [PubMed]
  3. Barré, A.; Deguilhem, B.; Grolleau, S.; Gérard, M.; Suard, F.; Riu, D. A review on lithium-ion battery ageing mechanisms and estimations for automotive applications. J. Power Sources 2013, 241, 680–689. [Google Scholar] [CrossRef] [Green Version]
  4. Vetter, J.; Novák, P.; Wagner, M.R.; Veit, C.; Möller, K.C.; Besenhard, J.O.; Winter, M.; Wohlfahrt-Mehrens, M.; Vogler, C.; Hammouche, A. Ageing mechanisms in lithium-ion batteries. J. Power Sources 2005, 147, 269–281. [Google Scholar] [CrossRef]
  5. Kong, L.; Li, C.; Jiang, J.; Pecht, M.G. Li-Ion Battery Fire Hazards and Safety Strategies. Energies 2018, 11, 2191. [Google Scholar] [CrossRef] [Green Version]
  6. Yao, X.-Y.; Pecht, M.G. Tab Design and Failures in Cylindrical Li-ion Batteries. IEEE Access 2019, 7, 24082–24095. [Google Scholar] [CrossRef]
  7. Chung, J.S.; Park, S.S.; Kim, J.H.; Kwon, H.M.; Hong, S.H.; Lee, M.K. Process Optimization for Improving Resistance Welding Quality of Cylindrical Secondary Battery. J. Korean Soc. Qual. Manag. 2020, 48, 69–86. [Google Scholar]
  8. Lee, S.S.; Kim, T.H.; Hu, S.J.; Cai, W.W.; Abell, J.A. Joining Technologies for Automotive Lithium-Ion Battery Manufacturing: A Review. In Proceedings of the International Manufacturing Science and Engineering Conference, Erie, PA, USA, 12–15 October 2010; pp. 541–549. [Google Scholar] [CrossRef]
  9. Schwartz, S.; Soderstrom, R.; Bjareklint, A.U.S. Method of Joining Metal to Graphite by Spot Welding. U.S. Patent 4,343,982, 10 August 1982. [Google Scholar]
  10. Lambert, S.M.; Armstrong, M.; Attidekou, P.S.; Christensen, P.A.; Widmer, J.D.; Wang, C.; Scott, K. Rapid Nondestructive-Testing Technique for In-Line Quality Control of Li-Ion Batteries. IEEE Trans. Ind. Electron. 2016, 64, 4017–4026. [Google Scholar] [CrossRef]
  11. Sood, B.; Osterman, M.; Pecht, M. Health Monitoring of Lithium-Ion Batteries. In Proceedings of the 2013 IEEE Symposium on Product Compliance Engineering (ISPCE), Austin, TX, USA, 7–9 October 2013; pp. 1–6. [Google Scholar]
  12. Mohanty, D.; Li, J.; Born, R.; Maxey, L.C.; Dinwiddie, R.B.; Daniel, C.; Wood, D.L., III. Non-destructive evaluation of slot-die-coated lithium secondary battery electrodes by in-line laser caliper and IR thermography methods. Anal. Methods 2014, 6, 674–683. [Google Scholar] [CrossRef]
  13. Hou, W.; Wei, Y.; Guo, J.; Jin, Y.; Zhu, C. Automatic Detection of Welding Defects using Deep Neural Network. J. Phys. Conf. Ser. 2018, 933, 012006. [Google Scholar] [CrossRef]
  14. Rumelhart, D.E.; Hinton, G.E.; Williams, R.J. Learning Internal Representations by Error Propagation (No. ICS-8506); Institute for Cognitive Science, University of California: San Diego, CA, USA, 1985. [Google Scholar]
  15. LeCun, Y.; Bengio, Y.; Hinton, G. Deep learning. Nature 2015, 521, 436–444. [Google Scholar] [CrossRef] [PubMed]
  16. Schmidhuber, J. Deep Learning in Neural Networks: An Overview. Neural Netw. 2015, 61, 85–117. [Google Scholar] [CrossRef] [PubMed] [Green Version]
  17. Munir, N.; Kim, H.-J.; Park, J.; Song, S.-J.; Kang, S.-S. Convolutional neural network for ultrasonic weldment flaw classification in noisy conditions. Ultrasonics 2018, 94, 74–81. [Google Scholar] [CrossRef] [PubMed]
  18. Lin, M.; Chen, Q.; Yan, S. Network in network. arXiv 2013, arXiv:1312.4400, preprint. [Google Scholar]
  19. Gan, Z.; Henao, R.; Carlson, D.; Carin, L. Learning Deep Sigmoid Belief Networks With Data Augmentation. In Proceedings of the International Conference on Artificial Intelligence and Statistics, San Diego, CA, USA, 9–12 May 2015; pp. 268–276. [Google Scholar]
  20. Cui, X.; Goel, V.; Kingsbury, B. Data augmentation for deep neural network acoustic modeling. IEEE/ACM Trans. Audio Speech Lang. Process. 2015, 23, 1469–1477. [Google Scholar] [CrossRef]
  21. Perez, L.; Wang, J. The effectiveness of data augmentation in image classification using deep learning. arXiv 2017, arXiv:1712.04621, preprint. [Google Scholar]
  22. Virkkunen, I.; Koskinen, T.; Jessen-Juhler, O.; Rinta-Aho, J. Augmented Ultrasonic Data for Machine Learning. J. Nondestruct. Eval. 2021, 40, 1–11. [Google Scholar] [CrossRef]
  23. Bengio, Y.; Grandvalet, Y. No unbiased estimator of the variance of k-fold cross-validation. J. Mach. Learn. Res. 2004, 5, 1089–1105. [Google Scholar]
  24. Rodríguez, J.D.; Pérez, A.; Lozano, J.A. Sensitivity Analysis of k-Fold Cross Validation in Prediction Error Estimation. IEEE Trans. Pattern Anal. Mach. Intell. 2009, 32, 569–575. [Google Scholar] [CrossRef]
  25. Géron, A. Hands-on Machine Learning with Scikit-Learn and Tensor Flow; O’Reilly Media, Inc.: Newton, MA, USA, 2018. [Google Scholar]
  26. Park, S.-H.; Choi, S.; Jhang, K.-Y. Porosity Evaluation of Additively Manufactured Components Using Deep Learning-based Ultrasonic Nondestructive Testing. Int. J. Precis. Eng. Manuf. Technol. 2021, 1–13. [Google Scholar] [CrossRef]
  27. Hinton, G.E.; Srivastava, N.; Krizhevsky, A.; Sutskever, I.; Salakhutdinov, R.R. Improving neural networks by preventing co-adaptation of feature detectors. arXiv 2012, arXiv:1207.0580. [Google Scholar]
  28. Srivastava, N.; Hinton, G.; Krizhevsky, A.; Sutskever, I.; Salakhutdinov, R. Dropout: A simple way to prevent neural networks from overfitting. J. Mach. Learn. Res. 2014, 15, 1929–1958. [Google Scholar]
  29. Nair, V.; Hinton, G.E. Rectified Linear Units Improve Restricted Boltzmann Machines. In Proceedings of the international Conference on Machine Learning, Haifa, Israel, 21–24 June 2010; pp. 807–814. [Google Scholar] [CrossRef]
  30. Maas, A.L.; Hannun, A.Y.; Ng, A.Y. Rectifier nonlinearities improve neural network acoustic models. Proc. Icml. 2013, 30, 3. [Google Scholar]
  31. Alex, K.; Sutskever, I.; Hinton, G.E. ImageNet classification with deep convolutional neural networks. Commun. ACM 2017, 60, 84–90. [Google Scholar] [CrossRef]
  32. Yan, Y.; Liu, D.; Gao, B.; Tian, G.Y.; Cai, Z.C. A Deep Learning-Based Ultrasonic Pattern Recognition Method for Inspecting Girth Weld Cracking of Gas Pipeline. IEEE Sens. J. 2020, 20, 7997–8006. [Google Scholar] [CrossRef]
  33. Ye, J.; Ito, S.; Toyama, N. Computerized Ultrasonic Imaging Inspection: From Shallow to Deep Learning. Sensors 2018, 18, 3820. [Google Scholar] [CrossRef] [Green Version]
  34. Park, S.-H.; Hong, J.-Y.; Ha, T.; Choi, S.; Jhang, K.-Y. Deep Learning-Based Ultrasonic Testing to Evaluate the Porosity of Additively Manufactured Parts with Rough Surfaces. Metals 2021, 11, 290. [Google Scholar] [CrossRef]
  35. Munir, N.; Park, J.; Kim, H.-J.; Song, S.-J.; Kang, S.-S. Performance enhancement of convolutional neural network for ultrasonic flaw classification by adopting autoencoder. NDT E Int. 2020, 111, 102218. [Google Scholar] [CrossRef]
  36. Clevert, D.A.; Unterthiner, T.; Hochreiter, S. Fast and accurate deep network learning by exponential linear units (elus). arXiv 2015, arXiv:1511.07289. [Google Scholar]
  37. Lecun, Y.; Bottou, L.; Bengio, Y.; Haffner, P. Gradient-based learning applied to document recognition. Proc. IEEE 1998, 86, 2278–2324. [Google Scholar] [CrossRef] [Green Version]
  38. Miorelli, R.; Fisher, C.; Kulakovskyi, A.; Chapuis, B.; Mesnil, O.; D’Almeida, O. Defect sizing in guided wave imaging structural health monitoring using convolutional neural networks. NDT E Int. 2021, 122, 102480. [Google Scholar] [CrossRef]
  39. Cao, Y.; Dong, Y.; Cao, Y.; Yang, J.; Yang, M.Y. Two-stream convolutional neural network for non-destructive subsurface defect detection via similarity comparison of lock-in thermography signals. NDT E Int. 2020, 112, 102246. [Google Scholar] [CrossRef]
  40. Springenberg, J.T.; Dosovitskiy, A.; Brox, T.; Riedmiller, M. Striving for simplicity: The all convolutional net. arXiv 2014, arXiv:1412.6806. [Google Scholar]
Figure 1. Overview of the scheme of the classification for resistance welding conditions of electrodes.
Batteries 08 00021 g001
Figure 2. Photograph of lithium-ion batteries used in this study.
Batteries 08 00021 g002
Figure 3. Illustration of the experimental set-up for nondestructive testing of the welding of the battery electrode using a high-frequency ultrasonic probe.
Batteries 08 00021 g003
Figure 4. A photograph of the ultrasonic testing set-up for nondestructive evaluation of battery-electrode welds.
Batteries 08 00021 g004
Figure 5. Ultrasonic signals obtained by reflection from a lithium-ion battery with different weld status: (a) non-welding, (b) insufficient welding, (c) good welding, and (d) excessive welding.
Batteries 08 00021 g005aBatteries 08 00021 g005b
Figure 6. Overview of the k-fold cross validation applied.
Batteries 08 00021 g006
Figure 7. Architecture of the fully connected deep neural network.
Batteries 08 00021 g007
Figure 8. Architecture of the convolutional neural network applied [17].
Batteries 08 00021 g008
Figure 9. Learning curves for 10 performances using the fully connected DNN.
Batteries 08 00021 g009
Figure 10. Learning curves for 10 performances using the CNN.
Batteries 08 00021 g010
Figure 11. Comparison of the classification results using the fully connected DNN and CNN for ultrasonic signals reflected from the electrode in lithium-ion batteries.
Batteries 08 00021 g011
Table 1. Performance of the fully connected deep neural network.
kGood WeldingAbnormal Welding
188.45 ± 5.58%76.85 ± 0.30%
287.04 ± 1.21%75.07 ± 3.52%
389.56 ± 14.86%77.29 ± 1.18%
483.51 ± 7.53%78.32 ± 3.24%
584.27 ± 2.02%73.24 ± 3.82%
686.56 ± 9.09%75.82 ± 0.60%
782.92 ± 2.49%78.18 ± 1.95%
884.41 ± 3.73%82.59 ± 4.78%
984.07 ± 6.29%77.04 ± 0.94%
1090.99 ± 6.01%75.21 ± 0.28%
Table 2. Performance of the fully connected deep neural network.
kGood WeldingAbnormal Welding
195.67 ± 4.69%88.74 ± 0.64%
294.95 ± 0.05%93.81 ± 3.78%
390.91 ± 4.36%84.03 ± 2.24%
498.26 ± 3.82%94.33 ± 0.33%
595.97 ± 2.01%95.17 ± 0.05%
694.72 ± 0.33%95.44 ± 1.40%
793.38 ± 12.50%85.44 ± 3.16%
899.26 ± 2.84%90.22 ± 0.63%
992.20 ± 0.68%90.44 ± 4.44%
1097.23 ± 1.67%93.65 ± 0.67%
Publisher’s Note: MDPI stays neutral with regard to jurisdictional claims in published maps and institutional affiliations.

