Abstract
The temperature and heat produced by lithium-ion (Li-ion) batteries in electric and hybrid vehicles is an important field of investigation as it determines the power, performance, and cycle life of the battery pack. This paper presented both laboratory data and simulation results at C-rates of 1C, 2C, 3C, and 4C at an ambient temperature of approximately 23 °C. During experiment thermocouples were placed on the surface of the battery. The thermal model assumed constant current discharge and was experimentally validated. It was observed that temperature increased with C-rates at both the surface and the tabs. We note that at 4C the battery temperature increased from 22 °C to 47.40 °C and the tab temperature increased from 22 °C to 52.94 °C. Overall, the simulation results showed that more heat was produced in the cathode than the anode, the primary source of heat was the electrolyte resistance, and the battery temperature was the highest near the tabs and in the internal space of the battery. Simulation of the lithium concentration within the battery showed that the lithium concentration was more uniform in the anode than in the cathode. These results can help the accurate thermal design and thermal management of Li-ion batteries.
1. Introduction
In the US, 28% of greenhouse gas emissions are from the transportation sector. Electric vehicles (EVs) are a critical measure in reducing emissions. Lithium-ion (Li-ion) batteries play an essential role in the adoption of EVs into society. However, Li-ion batteries are sensitive to temperature, and sub-optimum temperatures can lead to degradation and thermal runaway. The need for research in the field of thermal management systems is apparent and necessary to create EVs that can be welcomed by the public.
The rapid development of EVs, hybrid electric vehicles (HEVs), and plug-in hybrid electric vehicles (PHEVs) has unfolded in recent years [1]. These types of vehicles consist of hundreds to thousands of battery cells connected in series and parallel. The battery pack plays an essential role in EVs and is typically worth 10,000 USD. Li-ion batteries are the primary solution for these types of vehicles as they possess: (1) high specific energy and power densities allowing for longer ranges and acceleration [2]; (2) high nominal voltage and low self-discharge rate which allows for lower weight and efficiency [3]; and (3) long cycle-life and no memory effect leading to a longer time period before the battery needs to be replaced and more reliable performance [4]. There is an inherent safety concern with Li-ion batteries as they are flammable and thermal runaway is a possibility [5]. Safety and longevity concerns are addressed by ensuring the battery does not receive too much abuse; the precautions taken during charge and discharge include not exceeding the voltage, current, temperature, or power limits of the cells.
At temperatures above 80 °C, the solid electrolyte interface (SEI layer) begins to break down [6]. At temperatures above 110 °C, the electrolyte begins to breakdown, and at temperatures above 135 °C, the separator melts [7]. Thus, we can see that the maximum temperature of the battery pack must be controlled. The temperature uniformity in the pack is also a concern as a difference in temperature in the pack or the cell can lead to localized functioning, resulting in degradation.
In Waldman et al. [8], the aging behavior of NMC/MnO2 blend cathode with graphite anode is tested in the range of −20 °C to 70 °C. It is found that the aging rate is at a minimum at 25 °C and that above 25 °C the predominant aging mechanism is cathode degeneration including Mn dissolution and SEI layer growth at the anode. While at temperatures below 25 °C, the major cause of aging is lithium plating while the anode also suffers from low anode potential. It is found that both graphite and amorphous carbon anodes are negatively polarized with respect to Li/Li+ at temperatures from 20 °C to −10 °C and that this leads to lithium plating. At temperatures above 25 °C, other degradation methods are present instead of those being predominantly SEI film growth and degradation of the cathode. The aging mechanisms for high and low temperature ranges are found not only through an Arrhenius plot but also through Post-Mortem analysis including scanning electron microscopy (SEM), energy dispersive X-ray analysis (EDX), inductively coupled plasma (ICP), and X-ray diffraction (XRD).
In Panchal et al. [9], the heat generation rate of a 20 Ah lithium iron phosphate prismatic battery encased in aluminum is investigated and modeled in a 1–4C C-rate range and a 5–35 °C temperature boundary condition range. The model is developed using neural networks and shows good alignment with experimental data. The results show that for an equal depth of discharge heat generation increases with discharge rate.
Simplified thermal models typically include a joule heating/ohmic heating term and an entropic effect/reversible heat term [6]. More sophisticated models include an irreversible heat term, reversible heat term, and ohmic terms for both the solid and the electrolyte. At low discharge rates, the reversible heat term is the primary contributor to the total heat but at high C-rates the ohmic heat terms dominate the total heat produced [6,10].
In Heubner et al. [10], heat generation in lithium cobalt oxide cathodes is investigated. Irreversible heat generation due to ohmic resistance, charge transfer, and mass transfer losses are investigated along with the reversible heat. These heat generation terms from the cathode are determined from electrochemical measurements and are modeled as functions of the C-rate, temperature, and lithium concentration in the active material. The C-rate is varied from 1C charge to 1C discharge, the temperature is controlled between 10–30 °C. It is found that the reversible heat is negative (endothermic) during charging and positive (exothermic) during discharging, though the total heat is typically always positive. The reversible heat contribution to the total heat was most significant at high temperatures and low C-rates in the cathodes. Among the irreversible heat terms, the mass transport loss term is the greatest contributor to the total heat. Total heat is observed to increase at low temperatures and high C-rates and is larger for discharging than it is for charging.
Battery models can accurately predict battery degradation, thermal runaway, and performance for design purposes. Different cold plate regimes (parallel and series channels), flow rates, angles, spacing among other parameters will be considered and optimized using simulations derived from our models. Battery models can also be used to design a control strategy for the various thermal management systems. The control strategies optimize for temperature uniformity and maximum temperature while considering the power input. The models may also be used for fault analysis including internal short circuit and thermal runaway prediction. Battery models typically fall into the following categories: (1) Neural networks: these models require large amounts of data with their accuracy depending on the amount of data and training method [9]; (2) Equivalent circuit models (ECMs) in which the battery is represented as a combination of a pure voltage source and a series of resistors and capacitors [11]; (3) Physio-chemical methods including finite element model (FEM) or lumped parameter models (LPM) [12].
The 5 major thermal management systems in electric vehicles are air cooling, liquid cooling, phase change materials, heat pipes, and thermoelectric devices. Air cooling and liquid cooling are commercially available methods of cooling while phase change materials and heat pipes are rising areas of research that show great potential. Thermoelectric devices are advanced technology but have a high energy requirement. Passive cooling systems such as Phase change materials and heat pipes allow for decreased energy usage increasing vehicle range and as such need to be investigated as thermal management solutions in electric vehicles. Hybrid PCM liquid cooling and PCM heat pipe systems show promise and are an area of investigation for this project.
We note that temperature increases as the C-rate increases, this is particularly important for electric vehicles undergoing fast charging. As vehicles fast charge at high C-rates the temperature of the battery pack increases and at these heightened temperatures parasitic side reactions occur which increase the degradation of the battery. An effective thermal management system would allow for faster charging.
Thermal runaway is a major concern for Li-ion batteries and is another reason we must ensure the use of a battery thermal management system. Elevated temperatures in batteries can trigger exothermic reactions which lead to a further increase in temperature and more deleterious reactions. This process is known as thermal runaway. Studies show the onset of thermal runaway varies with the state of charge (SOC). For LiCoO2 batteries, we see the onset of a thermal runaway at 144 °C for 2.8 V, at 109 °C for 3.0 V, and at 104 °C for 4.06 V [13].
At 80 °C the SEI layer at the anode begins to breakdown leaving the graphite anode exposed to the electrolyte [6]. With the protective SEI layer broken the lithiated carbon can now react and reduce the electrolyte; this is an exothermic reaction that occurs at temperatures around 100 °C with the reaction peaking at 200 °C [6,13]. We note that the electrolyte evaporates at 140 °C and the vapors of the typical organic electrolyte readily combust in the presence of oxygen [13]. Since oxygen is released from the decomposition of the cathode at high temperatures (200–230 °C) the situation is quite dangerous, and the temperatures of Li-ion batteries must be controlled [6].
A concise review of the relevant current literature regarding battery thermal management (BTMS) and battery modeling is presented below:
Patil et al. [14] investigated the cooling performance of cold plates on a 20 Ah Li-ion pouch cell. Two cold plates were placed on either side of the cell surface and the inlet coolant flow rate was varied from 0.000833 kg/s to 0.003333 kg/s, while the inlet coolant temperature was adjusted from 5 °C to 35 °C. The paper also studied the effects of the cold plate geometry parameter by varying the number of channels from 4 to 10. The study showed enhanced cooling energy efficiency at low inlet coolant temperature, low inlet coolant mass flow rate, and when using a high number of the cooling channels. Chalise et al. [15] analyzed the thermal management system of a Li-ion battery pack. The governing equations for energy conservation for both thermal conduction and convection were coupled to each other and used to calculate the final temperature distribution in the pack. The model was then used to investigate the temperature dependence of several materials and geometric parameters. The paper showed that the minimum coolant flowrate required can be reduced by improving the thermal conductivity of the individual Li-ion cells. Shah et al. [16] investigated the steady-state temperature profiles in convectively cooled cylindrical Li-ion cells operating at high discharge rates. The paper presented closed-form analytical solutions to the mentioned system and the results showed that an increase in radial thermal conductivity and axial convective heat transfer coefficient resulted in a significant reduction of peak temperature. The optimization of battery size was also performed using the analytical model and showed the importance of cell size and aspect ratio on temperature. An et al. [17] used COMSOL, a commercial finite element analysis, solver, and multiphysics simulation software that allows coupled systems of partial differential equations (PDEs), to simulate and validate the thermal runaway of prismatic and pouch Li-ion cells. The effectiveness of boiling in minichannels based on a water-cooled BTMS was also investigated as a thermal runaway prevention strategy. Panchal et al. [18] developed a mathematical model for the transient temperature distribution in 20 Ah LiFePO4 prismatic battery at 1C, 2C, 3C, and 4C C-rates. In the study, a Li-ion battery was placed vertically with ambient air cooling. Infrared Images were taken of the battery during discharging and used in validating the model developed in ANSYS Fluent. Finally, Lai et al. [19] built a pseudo-two-dimension (P2D) electrochemical model combined with a 3D heat transfer model. The numerical model solved the conservation of energy equations throughout the battery and considered the sources of heat generation from the 2D model including the electrochemical reactions, active polarization, and Ohmic losses. They found that heat generation in the current collectors and separator was generally lower in magnitude and had little effect on the temperature. They found that the total reversible heat was predominately affected by the cathode while the total irreversible heat primary contributor was the anode.
The rest of the paper is organized as follows: Section 2 experimental set-up and procedure, Section 3 model development, Section 3.1 geometry and meshing, Section 3.2 governing equations and boundary conditions, Section 4 results and discussion, followed by Section 5 conclusion.
2. Experimental Set-up and Procedure
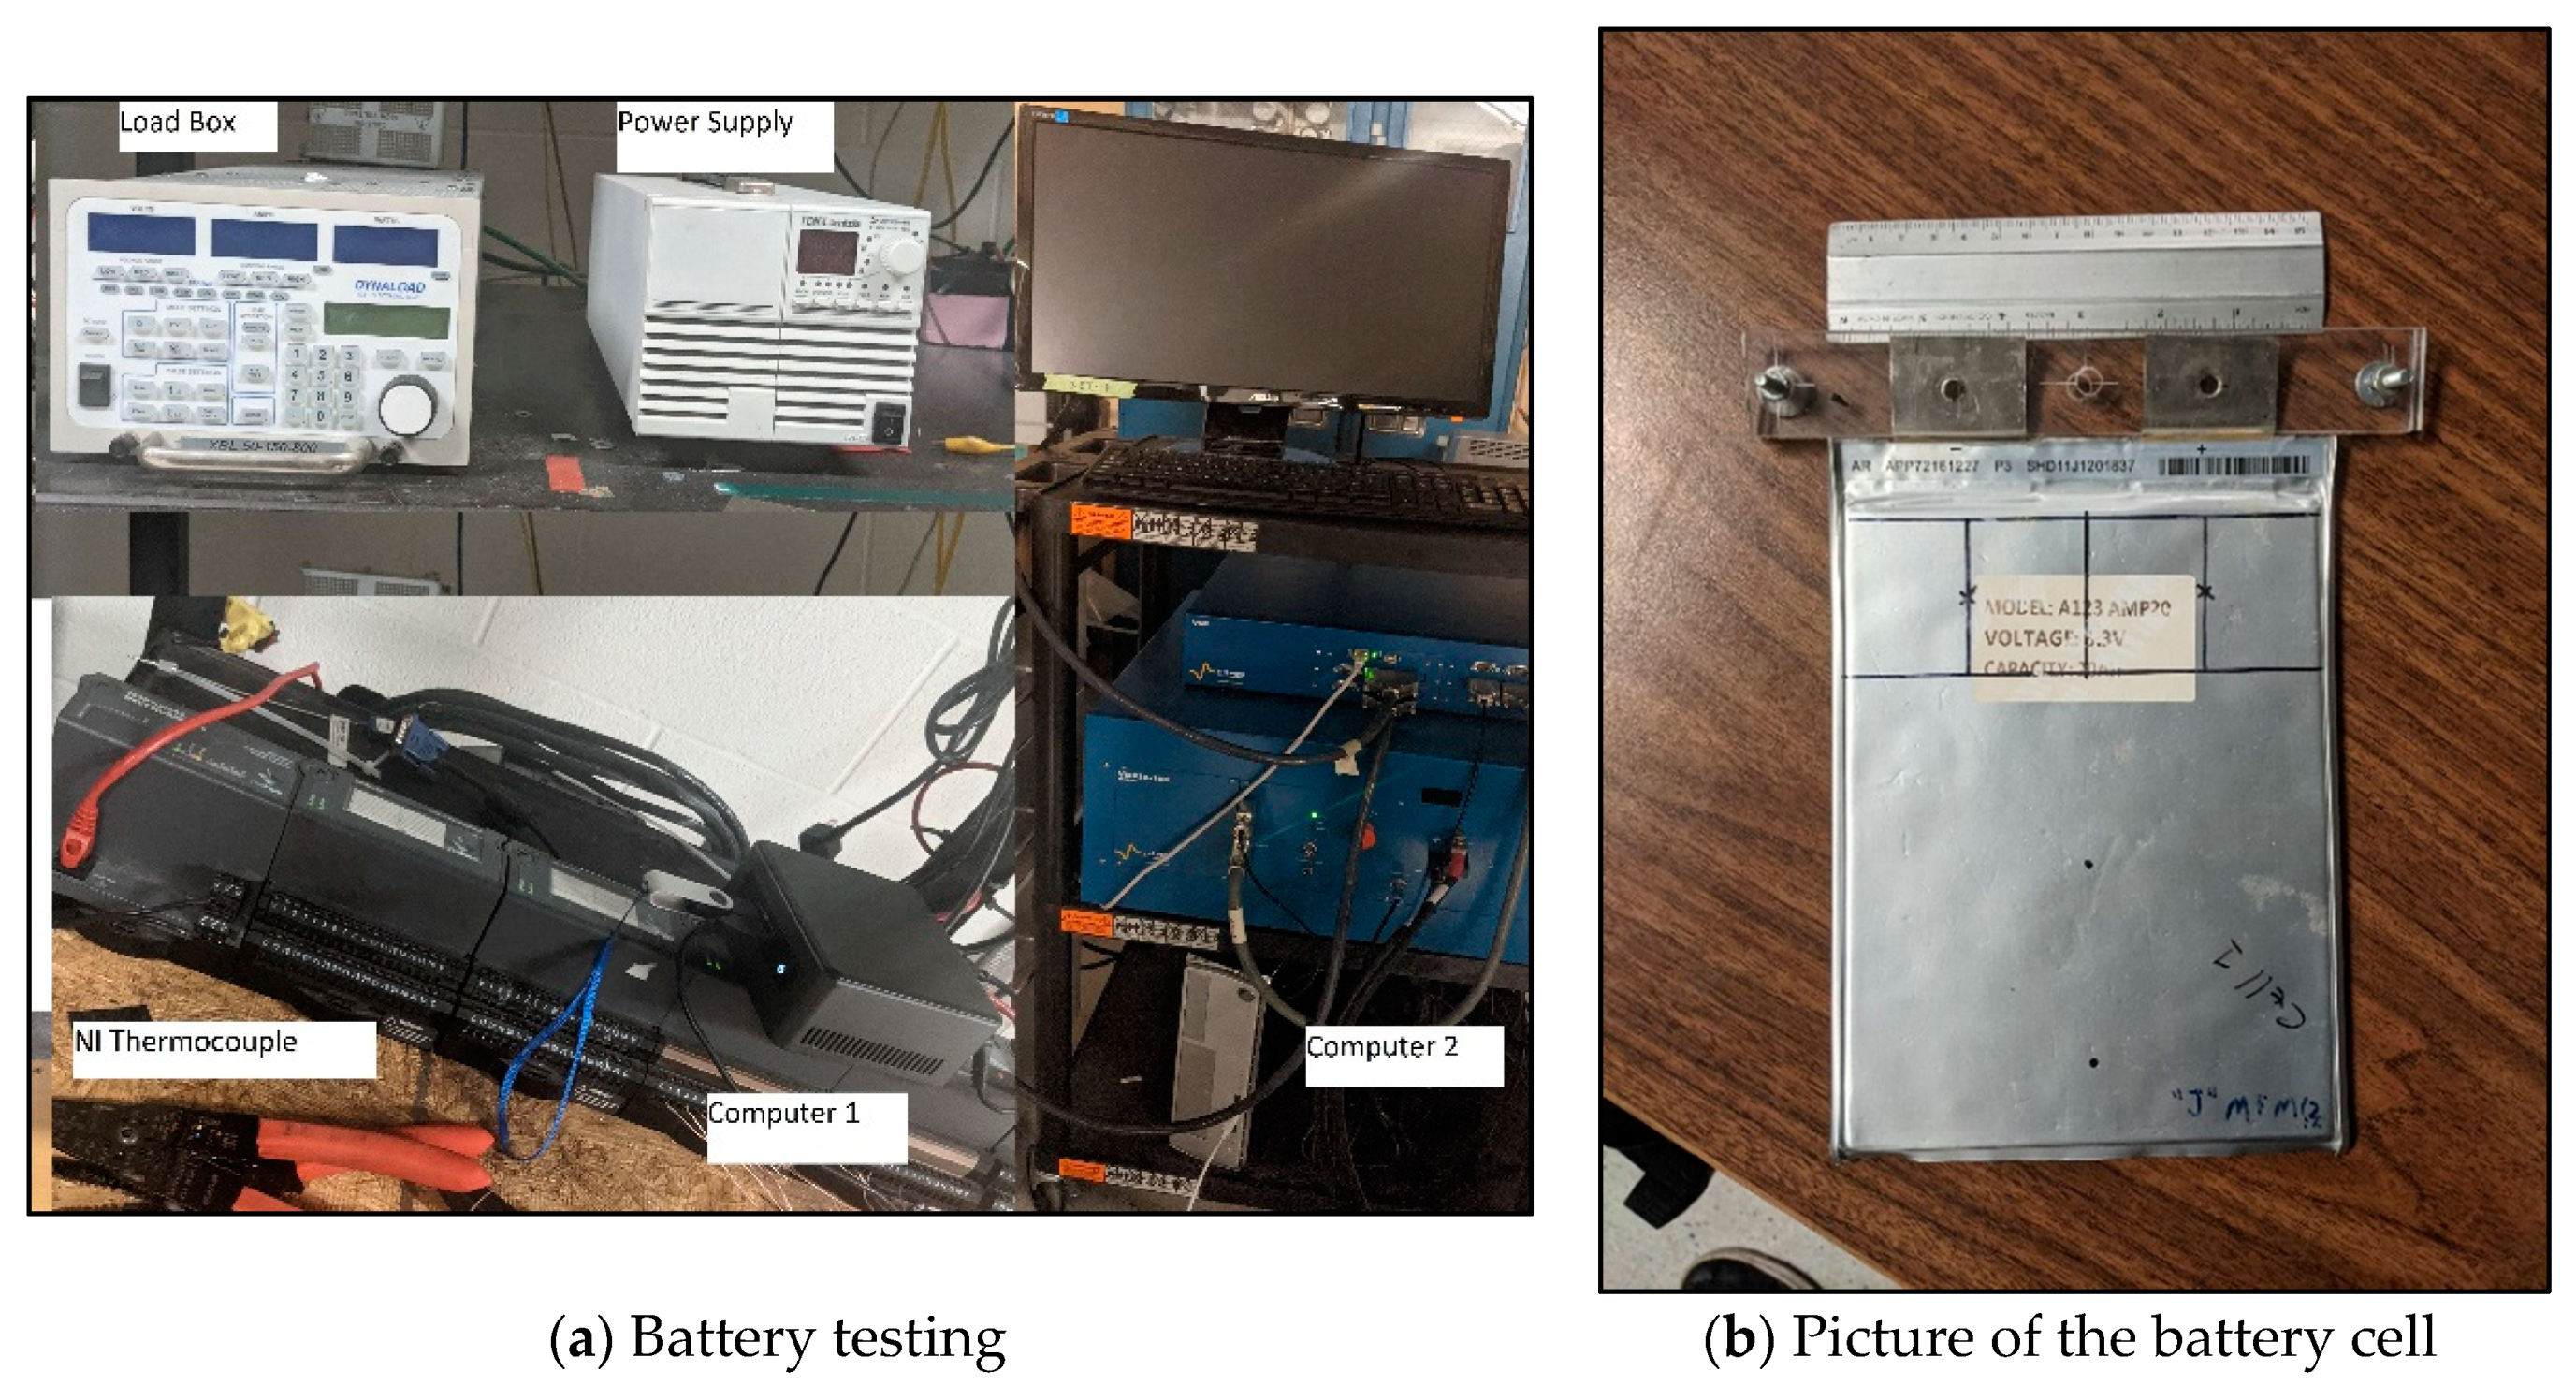
The experimental setup is shown in Figure 1a. A 20 Ah LiFePO4 prismatic Li-ion pouch battery cell was used, and this experimental data was then used to validate the mathematical model. Cell specifications are presented in Table 1 while a picture of the actual cell can be found in Figure 1b. Ambient air cooling was the cooling method investigated with the battery being placed vertically in a stand while the ambient temperature was held constant at approximately 22 °C for all experiments. The test bench consisted of five components: (1) Charging unit; (2) Load box; (3) LabVIEW National Instrument (NI) temperature measurement device; (4) Computer 1; and (5) Computer 2.
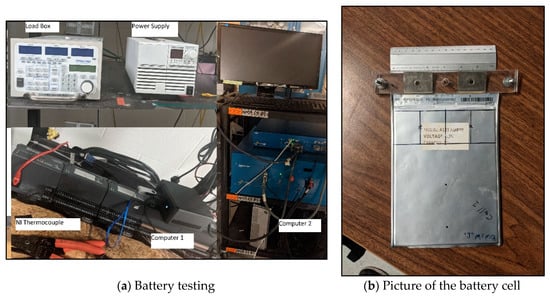
Figure 1.
Experimental set-up and battery.

Table 1.
LiFePO4 20 Ah Lithium-ion pouch cell specifications.
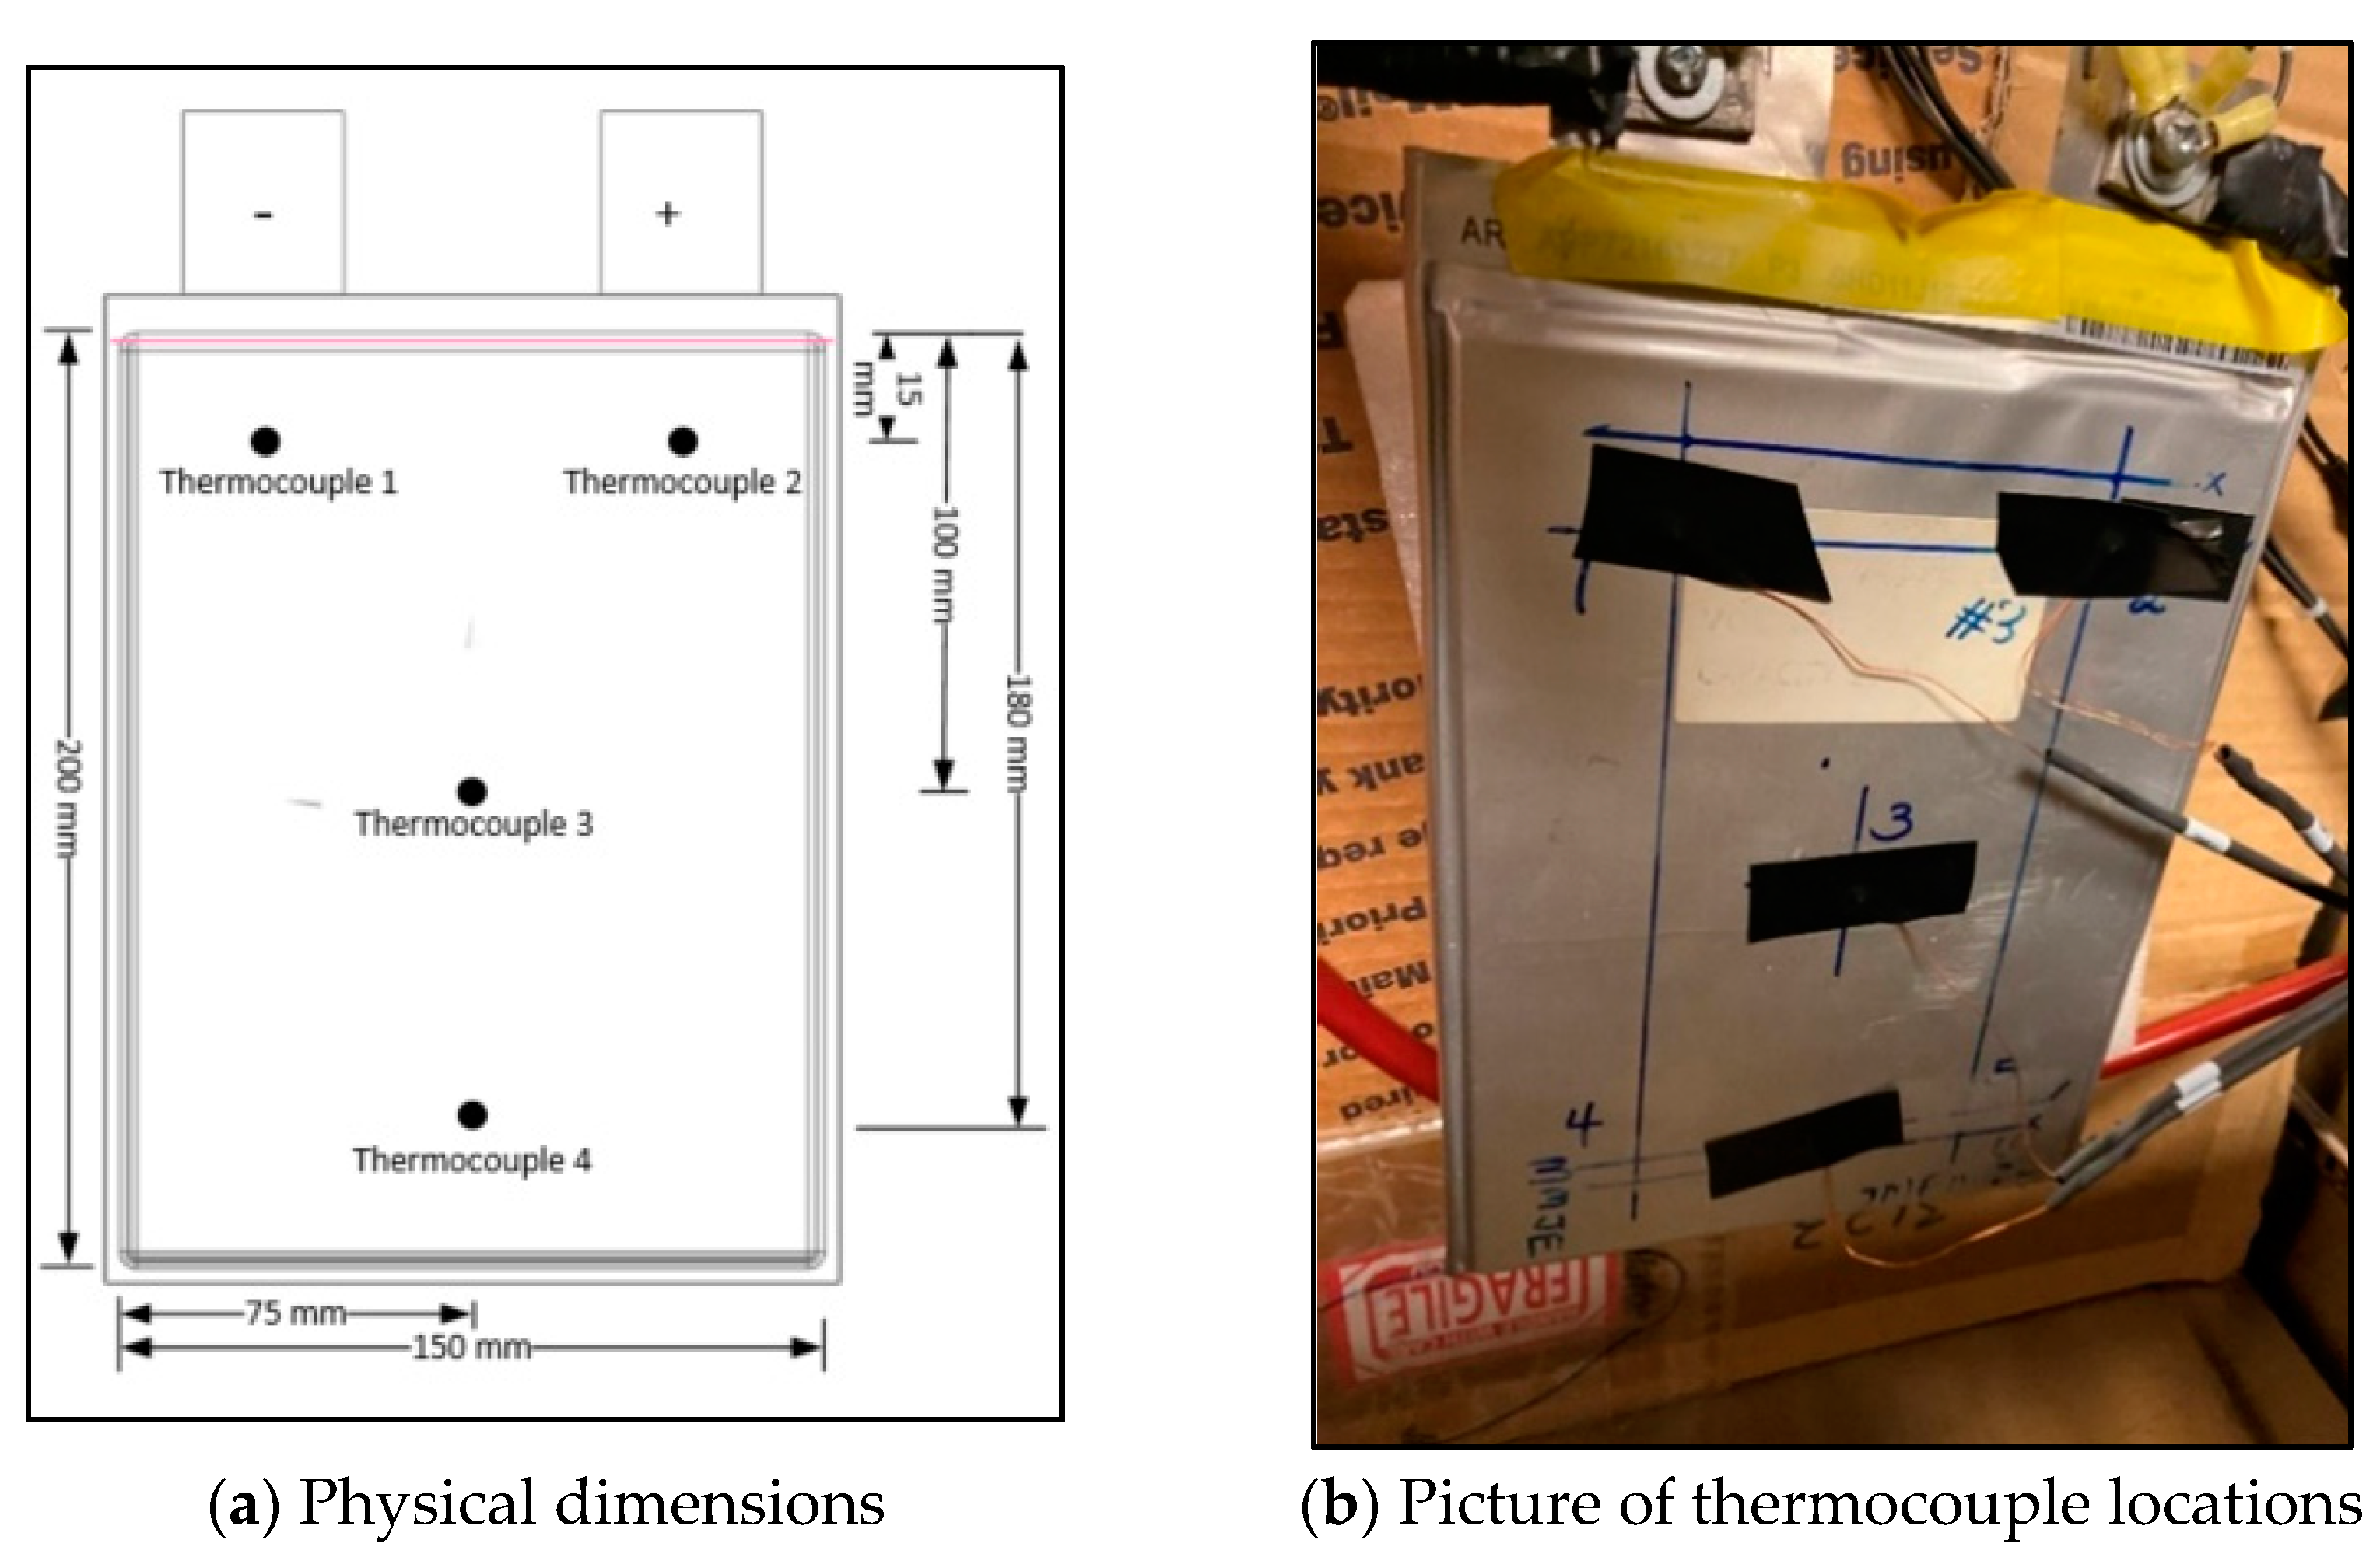
The temperatures of the battery were recorded at four different discharge rates (constant current): 1C, 2C, 3C, and 4C. The charge rate (constant current-constant voltage) was 1C. The experimental plan is shown in Table 2. The XBL 50-150-800 Dynaload load box with a maximum capacity of 800 W was used to discharge the battery. A TDK-Lambda power supply with a maximum capacity of 20 V and 40 A was used to charge the cell. The load box was connected to the cell using heavy-duty copper cables with a 100 A fuse placed between them. The temperature was measured using T-type thermocouples, these thermocouples were connected to a National Instruments temperature measurement device which was then connected to the computer. LabVIEW 8.2 software was used to control the National Instruments temperature measurement device. The thermocouple locations are presented in Figure 2a,b.

Table 2.
Experimental plan.

Figure 2.
Thermocouple locations and physical dimensions.
3. Model Development
The models are produced in COMSOL for a prismatic Li-ion cell with the same dimensions and chemistry (LiFePO4) as the experimental data. The electrolyte modeled was LiPF6 in ethylene carbonate plus solvent mixture with electrolyte parameters given in Table 3 Parameters used for model development [20,21,22]. A 1-D electrochemical model is created where the cathode length, anode length, and separator length are input with an added extra dimension for particle radius along with the relevant parameters to calculate the heat generated from the battery. The average heat from the 1-D electrochemical model is then used as a heat source in addition to the Ohmic heat source in the tabs to calculate the temperature distribution in the 3D model.

Table 3.
Parameters used for model development [20,21,22].
The governing equations, boundary conditions, material properties, and parameters used are presented in the next section. The electrochemical model used can accurately predict the behavior of the anode and cathode by considering the material phase-change inside the active electrode particles. These types of models allow us to understand the battery phenomenon precisely; even at the particle-level where we can for example solve for particle surface concentration and its relationship to various electrochemical-thermal outcomes. Finally, the model results are compared against the experimental data of the surface temperature of the 20 Ah prismatic cell at 1C, 2C, 3C, and 4C discharge rates.
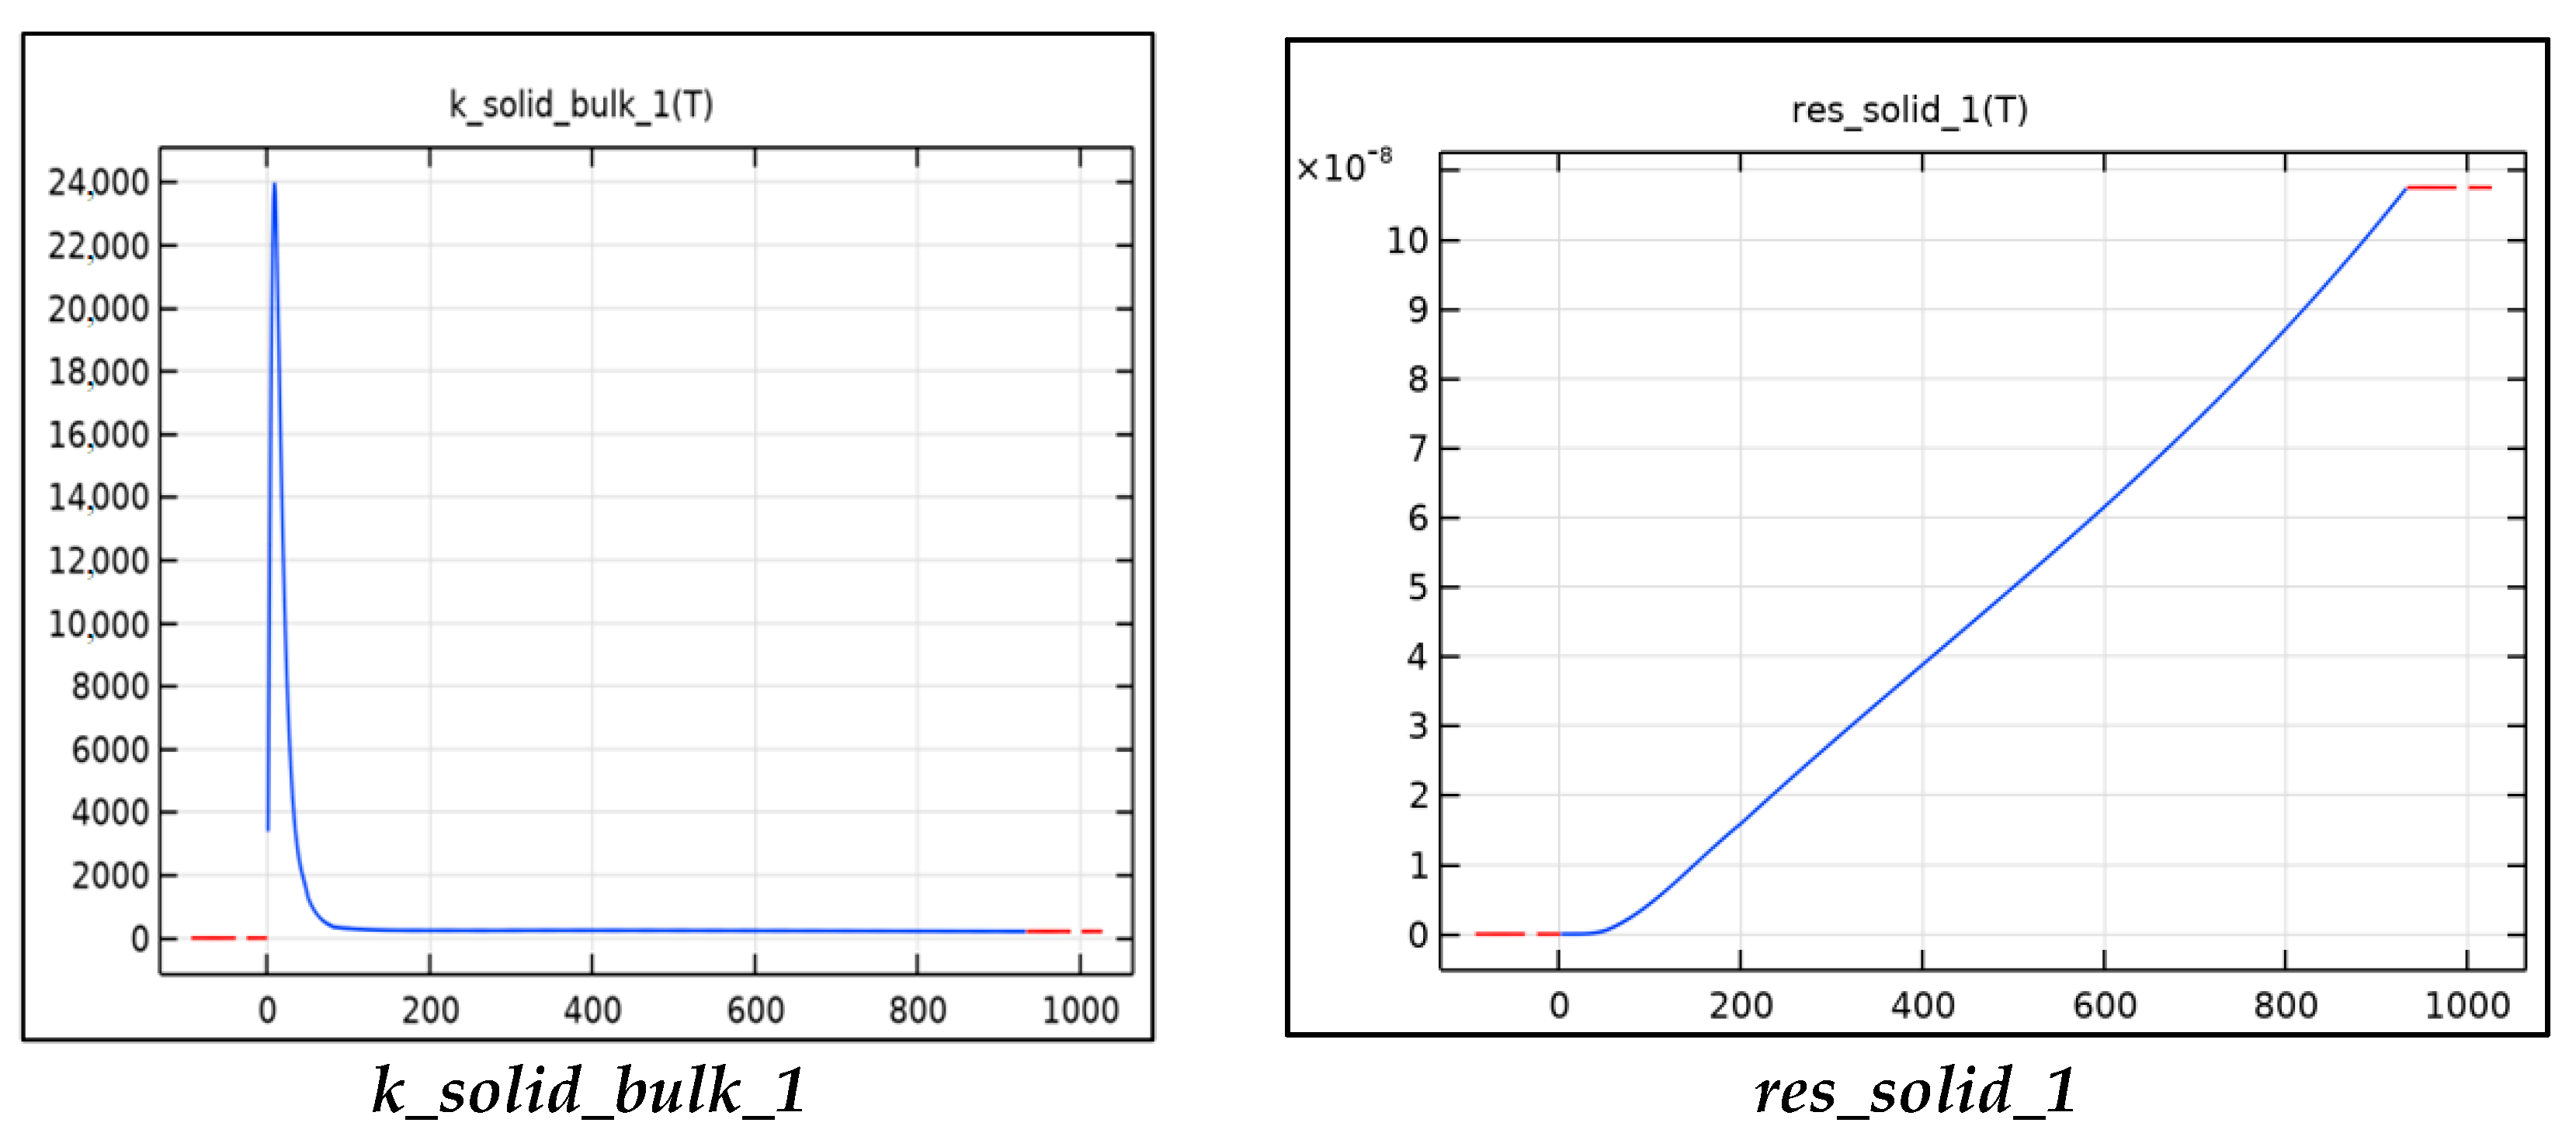
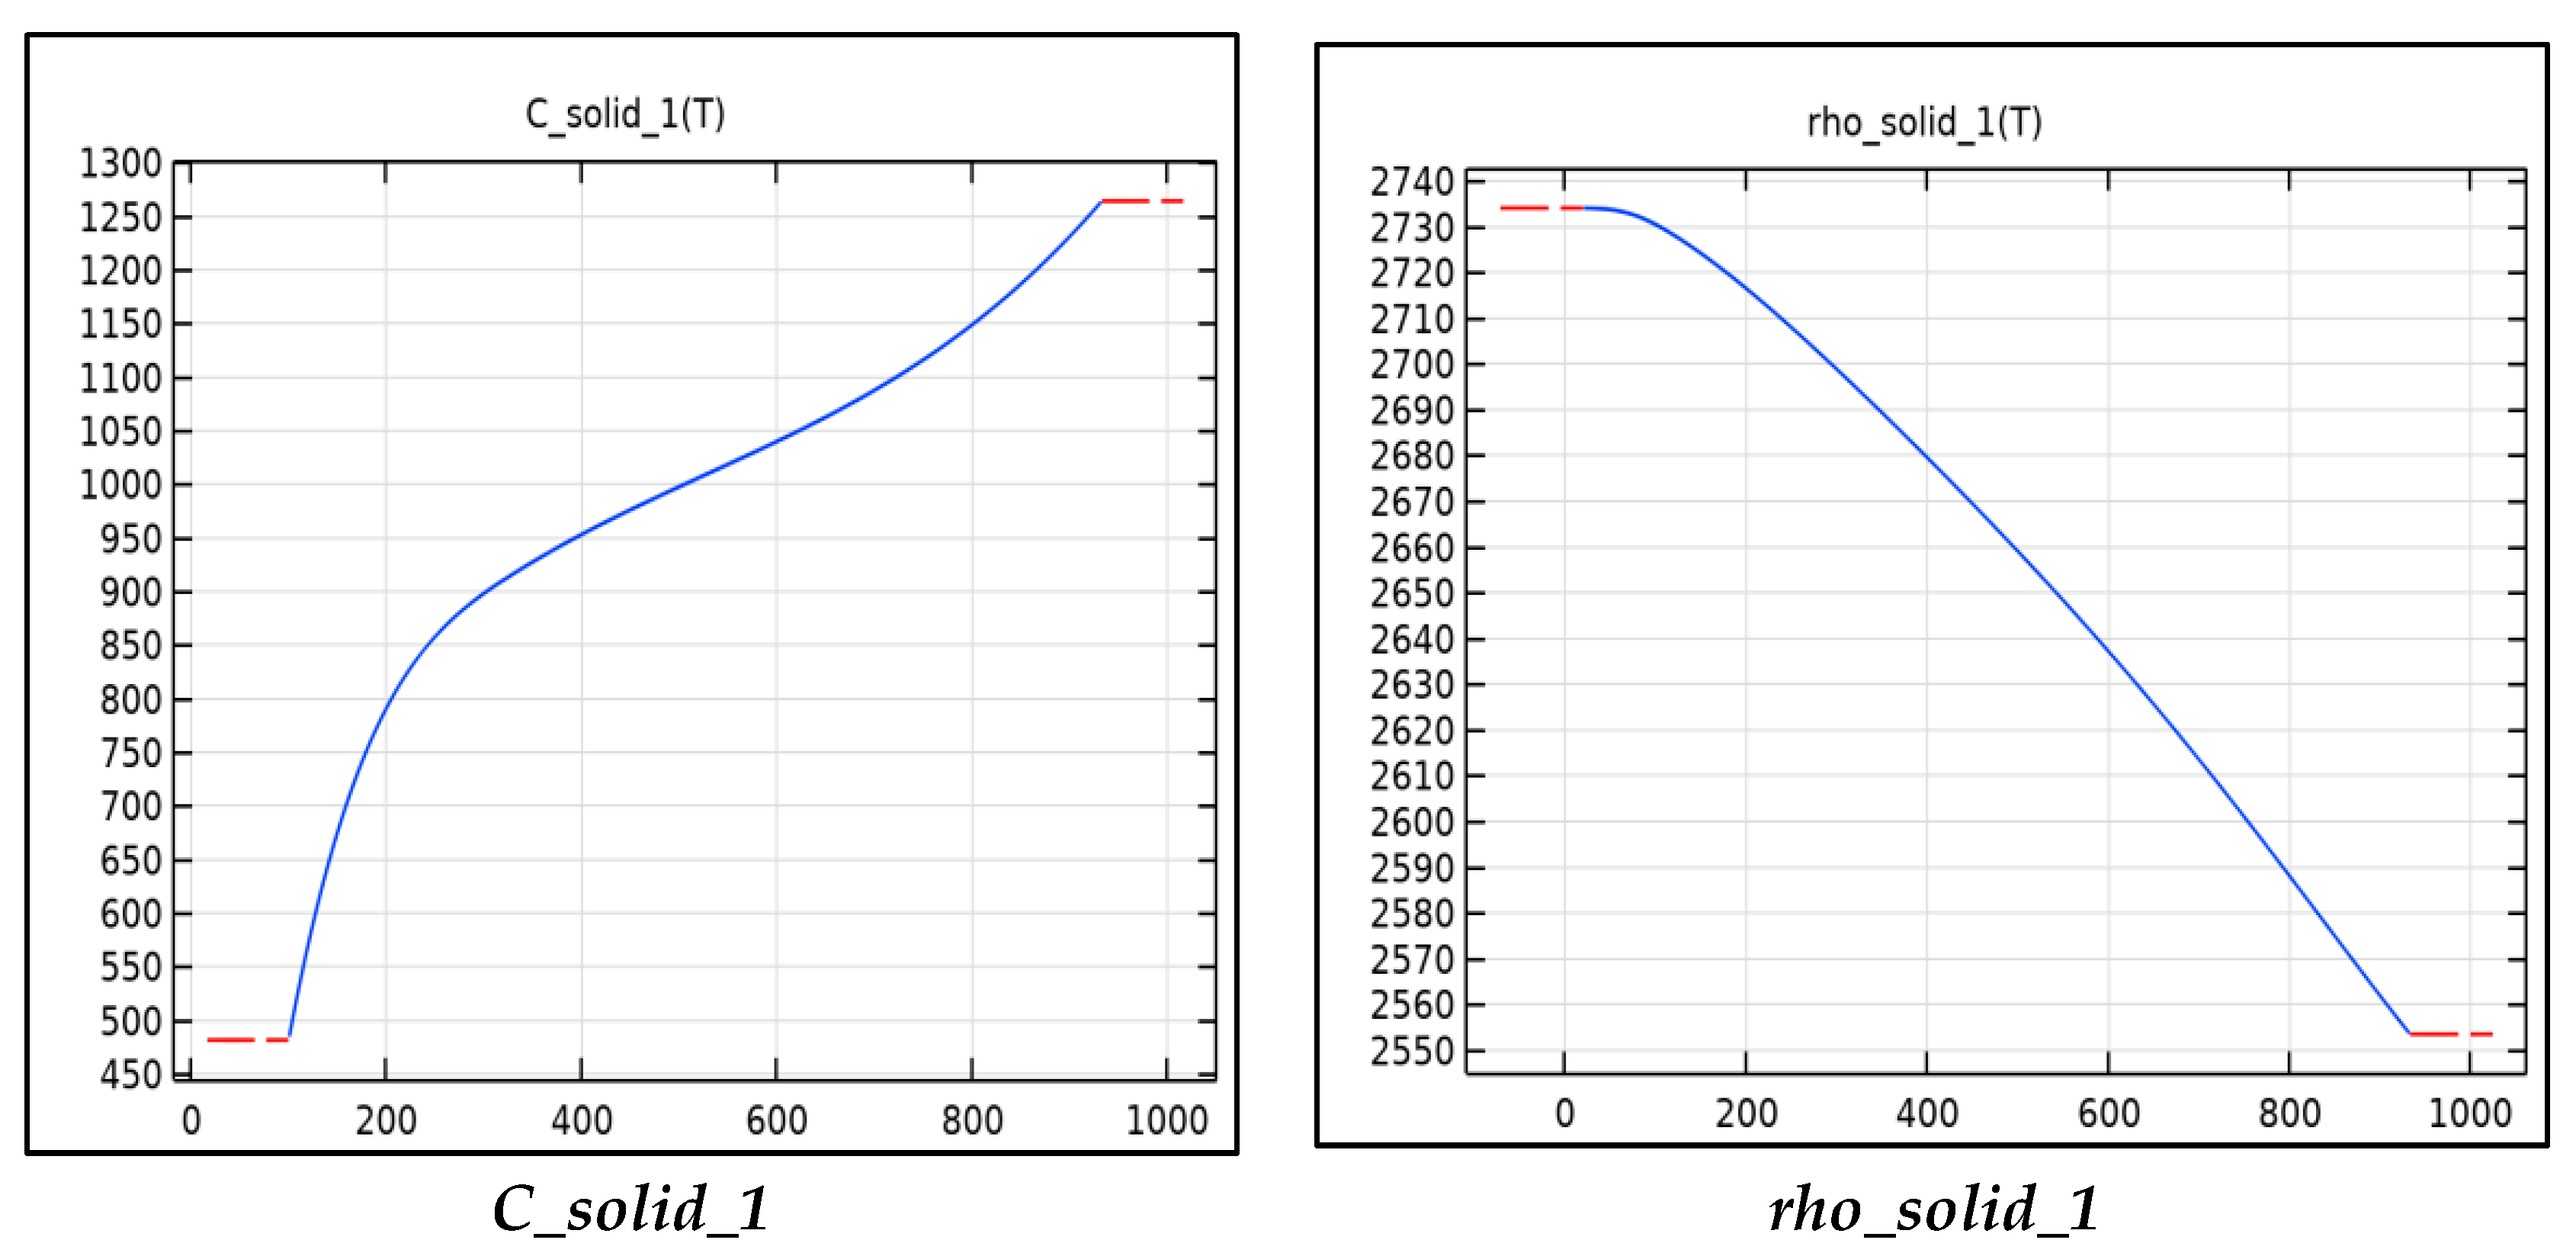
Figure 3 includes the functions used to calculate the thermal properties of aluminum tabs for the model. The thermal conductivity, resistivity, specific heat capacity, and density are all calculated using these functions. The functions shown are functions of temperature and can be read from Figure 3. The resistivity is used to calculate the Ohmic heat source term for the tabs, this is calculated as the current squared multiplied the resistivity into a third constant term Table 4. The major heat source in the tabs is the junction resistance. When two surfaces are in contact, there is a large resistance and voltage drop across the surfaces due to inadequate contact and typically an oxide layer. The resistance can be minimized by increasing the contact pressure and by running current through the junction, a phenomenon known as creeping resistance. In our model, the junction resistance is modeled as a gain factor multiplied by the resistivity. The density, specific heat capacity, and thermal conductivity are used in the heat equation to calculate the temperature.

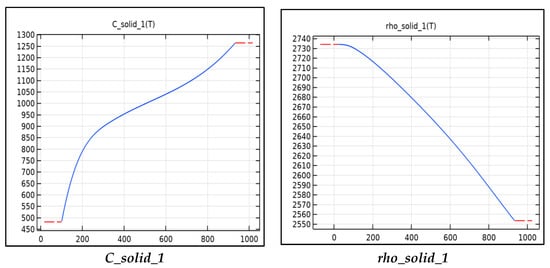
Figure 3.
Material parameters as a function.

Table 4.
Material properties used for model development [20].
3.1. Geometry and Meshing
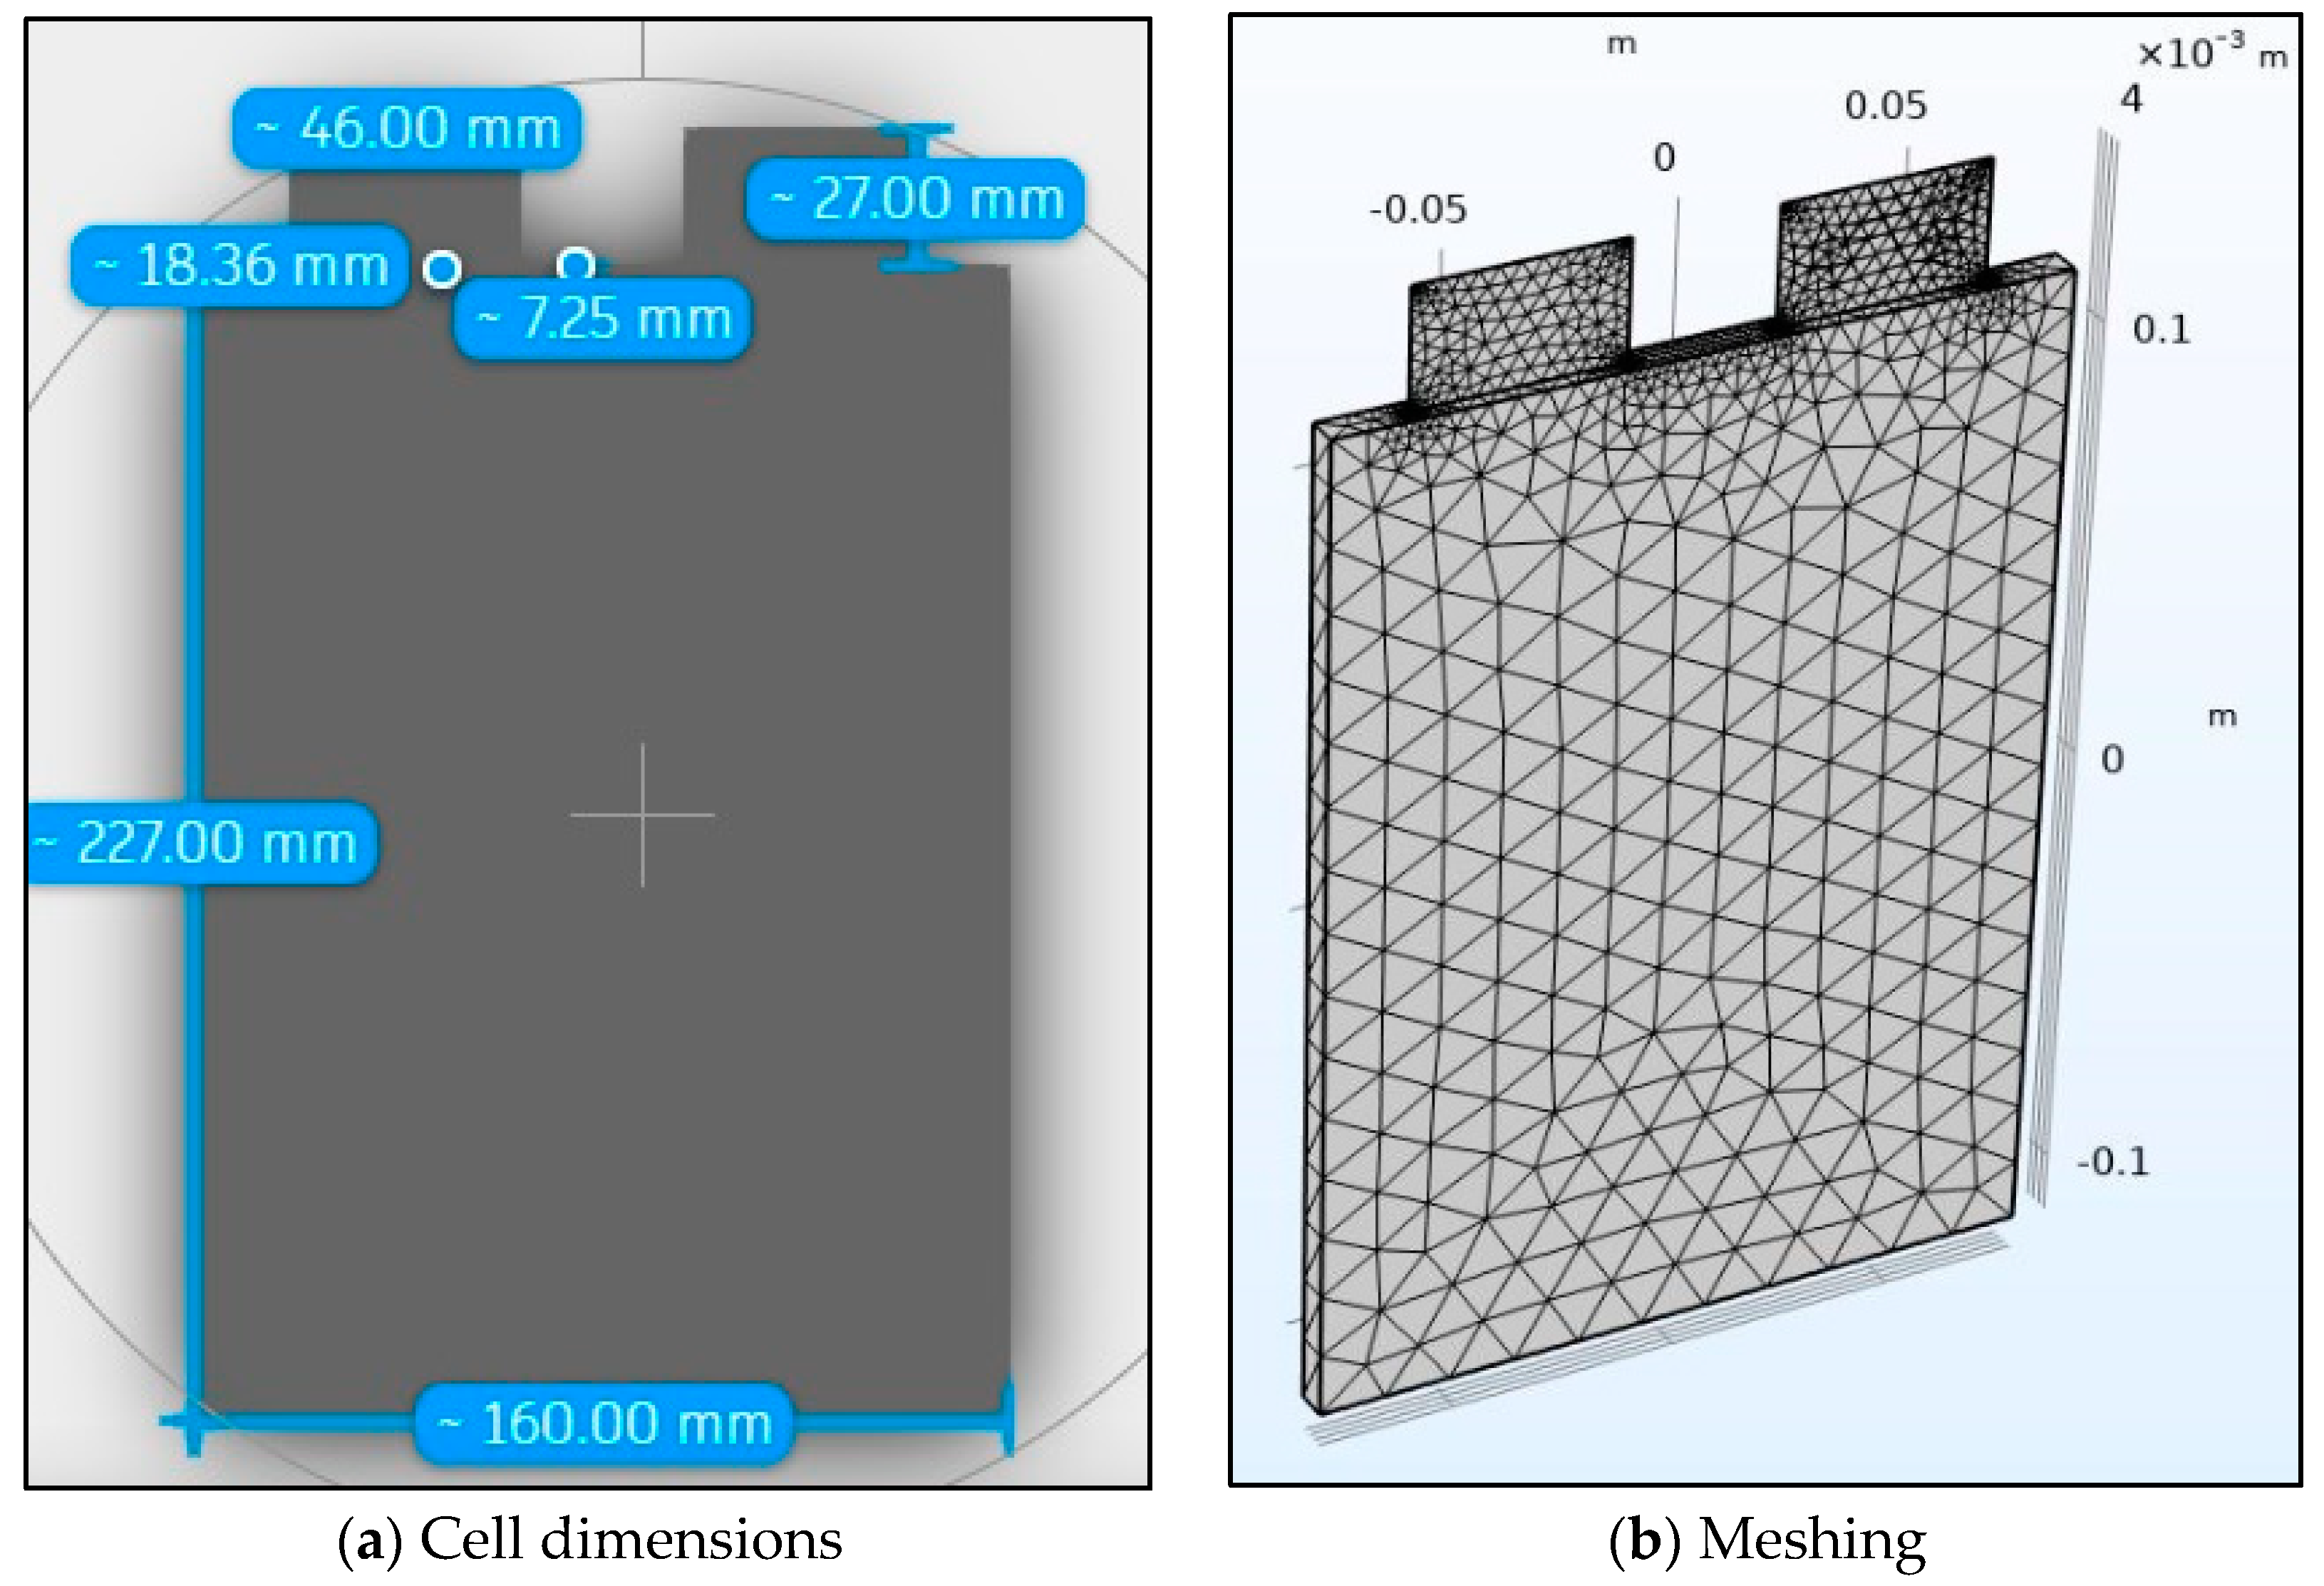
The 20 Ah-LiFePO4 battery used for simulation is identical to the experimental battery and its geometry is shown in Figure 2a with its mesh shown in Figure 4b. The tab dimensions along with other cell dimensions such as cell thickness are also shown in Figure 4a. The mesh for the 3D thermal simulation is made up of 1394 tetrahedron elements and 976 triangular elements. It has a minimum element quality of 0.1807 and an average element quality of 0.5398. The maximum element size is 0.0227 and the minimum element size is 0.00409. The curvature factor is 0.6 with the resolution of narrow regions being 0.5 and the maximum element growth rate being 1.5.

Figure 4.
Battery geometry and meshing.
3.2. Governing Equations and Boundary Conditions
The general governing equations that are used to simulate Li-ion batteries are presented in Table 5 [20,21,22]. These are the mass and charge balances on both the electrodes and the electrolyte, and an insertion particle concentration variant of the Butler-Volmer equation. The particular governing equations used in COMSOL are presented in the section below in detail. This section covers the governing equations of charge and lithium conservation in both the solid and electrolyte phases as well as the electrochemical kinetics and the heat equation for the 3D battery domain along with their boundary conditions.

Table 5.
Governing equations in the electrochemical model [20,21,22].
3.2.1. Governing Equations in the Electrolyte
From the continuity equation we know:
where,
These equations are a modified version of the Nernst-Planck equation. Where is the electrolyte salt concentration, is the flux of the lithium ions, is the volumetric generation rate of lithium ions and its equation will be provided in the porous electrode section, is the diffusion coefficient of the electrolyte, is the electrolyte current density, is the transport number, electrolyte conductivity, electrolyte potential, R is the universal gas constant of 8.3143 kJ/mole.K, T is the temperature, F is the Faraday constant with a value of 96,485 coulomb/mole, is the activity dependence in this case 0 for the electrolyte and is the electrolyte current source which will be described further in the porous electrode section.
3.2.2. Porous Electrodes
The porous electrode governing equations are broken into 3 sections: the particle intercalation into active solid particles, electrolyte lithium conservation in the porous electrodes, and the porous electrode reaction sections:
Particle Intercalation in Active Solid Particles
The lithium ions material balance for the active particles solid material is governed by Fick’s second law shown in spherical coordinate below [20,23]:
with boundary conditions of,
where is the concentration of lithium in the solid phase. is the intercalation diffusivity, is the radial coordinate along the active material particle, is the radius of the solid active material particle, is the volume fraction of solid particle (active material) in the electrode, is the stoichiometric coefficient for lithium metal with oxidized species being negative and the reduced species being positive in this case m is 1 and is 1, is the electrode reaction source, is the number of participating electrons in this case 1.
Electrolyte Lithium Conservation in the Porous Electrodes
Much like in the electrolyte domain we start with the continuity equation:
where,
These equations are a modified version of the Nernst Planck equation with Equation (11) being a modified version of Ohm’s Law for the solid electrode. is the volume fraction of electrolyte in the porous electrode, is the stoichiometric coefficient for oxidized lithium in this case −1, is the volumetric current from diffusion in the electrolyte at the electrode, is the electrode current density in the solid electrode, is the conductivity of the solid electrode and is the potential in the solid electrode
We note that is the effective electrolyte conductivity in the porous electrode given by:
This is the transport correction factor for the electrolyte conductivity where is the effective electrolyte conductivity, is the Bruggeman porosity exponent in this case 1 and is the Electrolyte phase volume fraction.
To complete the governing equations in the porous electrode for electrolyte lithium conservation we have:
where is the local current density, is the total interface current density, is the electrode reaction source, is the electrode current source and is the current density due to diffusion in the electrolyte at the electrode. A line integral of the electrode reaction source across the porous electrode results in the total electrode current density.
Porous Electrode Reaction
The voltage and overpotential are given by the equations below [24]:
where is the overpotential, is the voltage drop across the film resistance, is the film resistance, is the equilibrium potential.
Also,
where is the active specific surface area for the active solid particles. The electrochemical reaction rate on the surface of the electrode particles is given by a modification of the Butler-Volmer equations [25,26,27], where the exchange current density is given as a function of lithium insertion kinetics as shown in the equations below:
where is the exchange current density (a function of lithium concentrations in both the electrolyte and the solid), is the transfer coefficient of the anode, is the transfer coefficient of the cathode, is the maximum concentration of lithium in the solid phase and is the concentration of lithium at the solid particle’s surface and is the electrolyte reference concentration
Temperature-dependent physicochemical properties, such as diffusion coefficient for the anode ( are needed and coupled to the heat equation in the model. The temperature-dependent equation for the anode’s diffusion coefficient is shown below:
3.2.3. Energy Equation
The energy balance equation is given by [20]:
in other words,
The above equation is further modified to
also,
where the heat in the tabs expressed by the first 2 terms of Equation (30) can further be expressed as:
with the relevant values presented in Table 4 (Material properties) used for model development [20]. is our gain term that compensates for the junction resistance of the tabs. The junction resistance is a function of many unmeasured variables such as the contact pressure, current, and surface roughness, we observe a general decrease in this gain term with an increase in current.
Also is the electrochemical heat and is given by [20]:
also,
where is the heat generation rate and includes joule heating expressed in an alternative form of voltage squared over resistance, activation loss/Ohmic loss/concentration loss expressed in an alternate form of the current multiplied by the overpotential, and the entropic heat (reversible heat) alternatively expressed as the temperature multiplied by the entropy, is the density, and is the specific heat.
The heat can be further decomposed into the heat produced in the separator and the heat produced from the porous electrode. Within the porous electrode domains, we can decompose the heat further into the reversible heat, the irreversible heat, and the heat from the electrolyte current and its resistance. The equations for these quantities are presented below:
where is the total power loss across the separator. In the separator, the only current that is flowing is the electrolyte current. is the reversible heat, is the x coordinate of where the electrode begins, is the x coordinate where the electrode ends, is the irreversible heat, is the sum of the electrolyte resistance in the porous electrodes and the ohmic energy loss of the solid electrode simply referred to as the electrolyte conductivity loss. We note that though the electrolyte current is smaller than the solid electrolyte current in the electrode, the potential drop of the electrolyte is much larger than that of the solid; thus, the primary contributor to this energy loss is the electrolyte resistance. The values for these are presented in Section 4.3 (total power, separator heat, electrolyte, irreversible, and reversible heat, anode electrolyte, anode irreversible heat, anode reversible heat, cathode electrolyte, cathode irreversible heat, cathode reversible heat).
4. Results and Discussion
The results section presents the surface and tab temperature validation along with the voltage profile comparison at 1C, 2C, 3C, and 4C discharge rates. Later, temperature contours are also discussed. Lastly, the total power, separator heat, electrolyte, irreversible heat, and reversible heat discussion are presented.
4.1. Surface Temperature, Tab Temperature, and Voltage Distribution
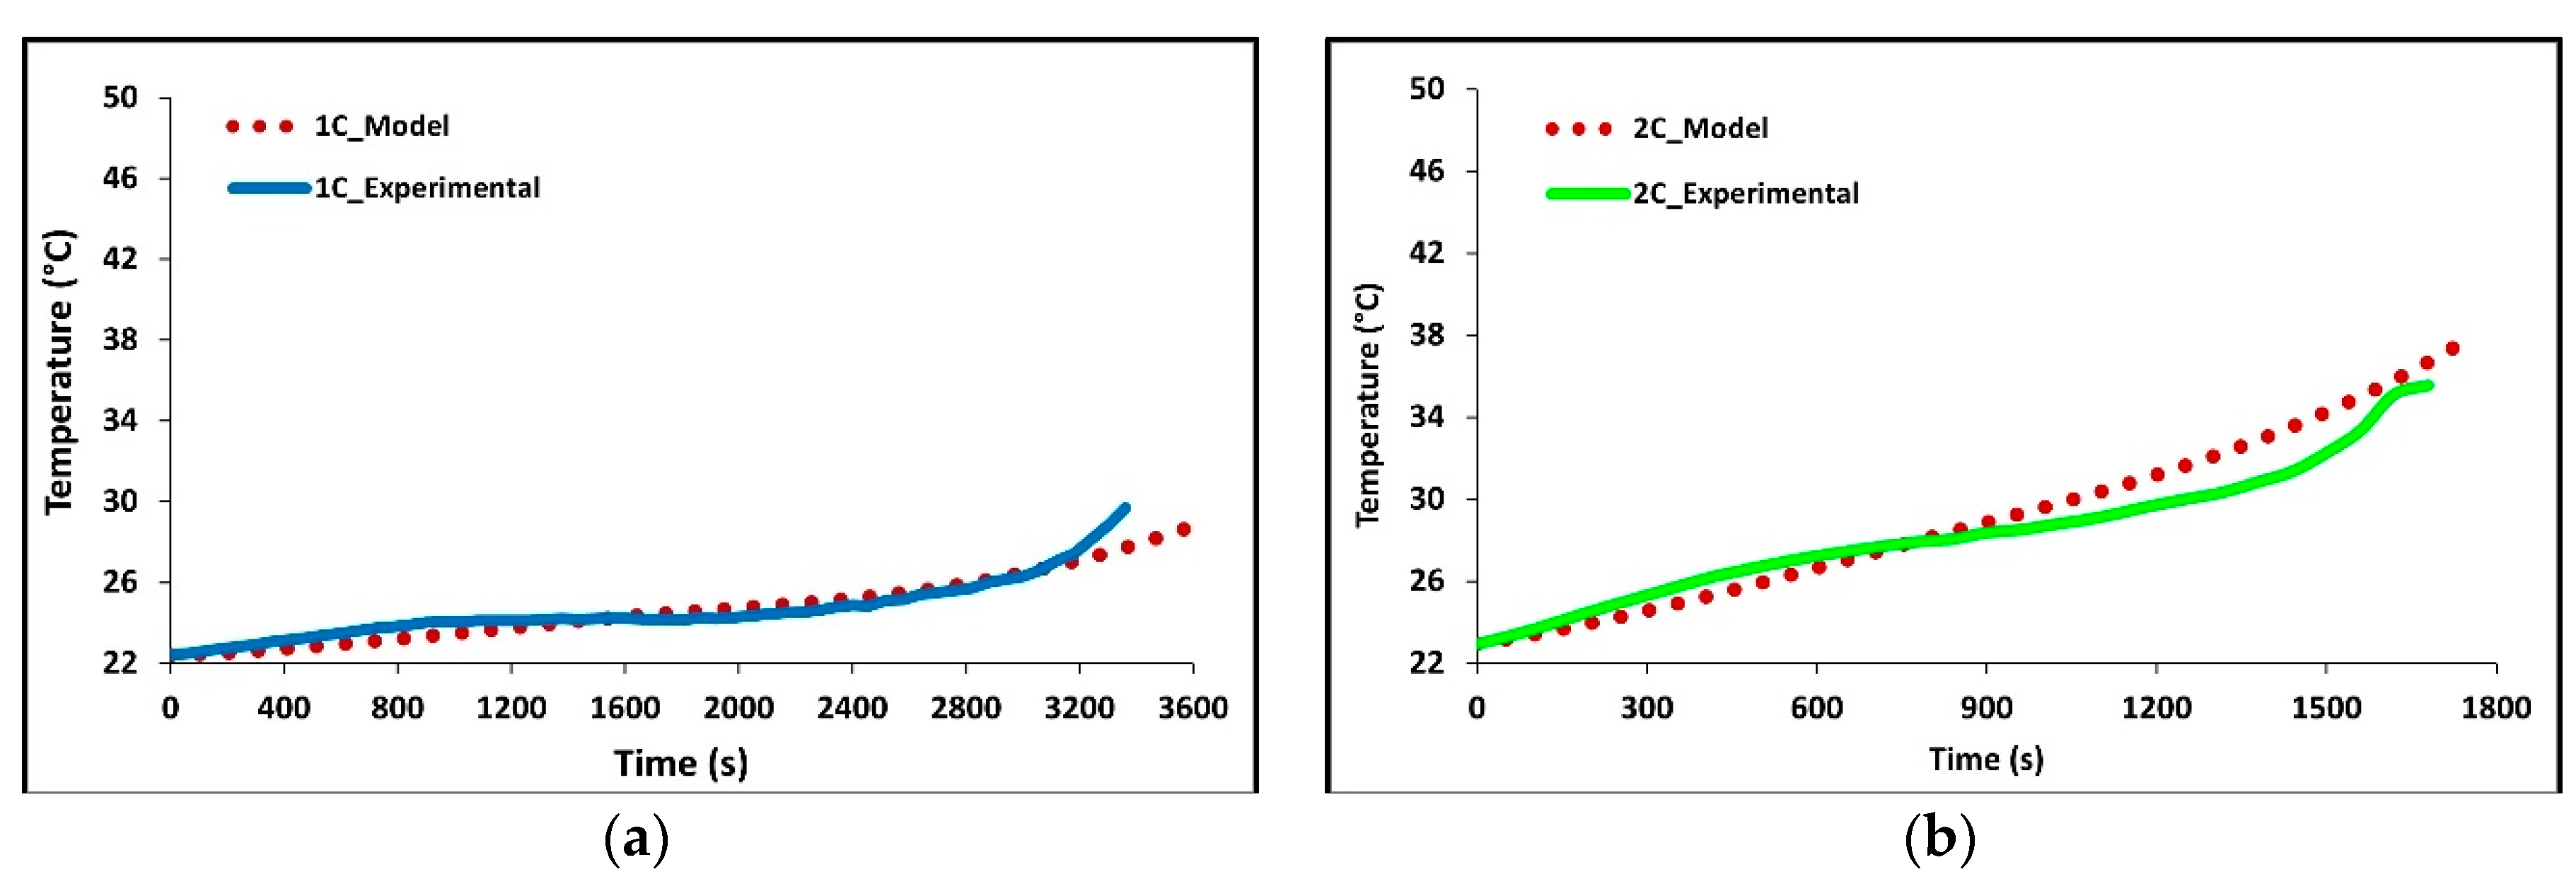
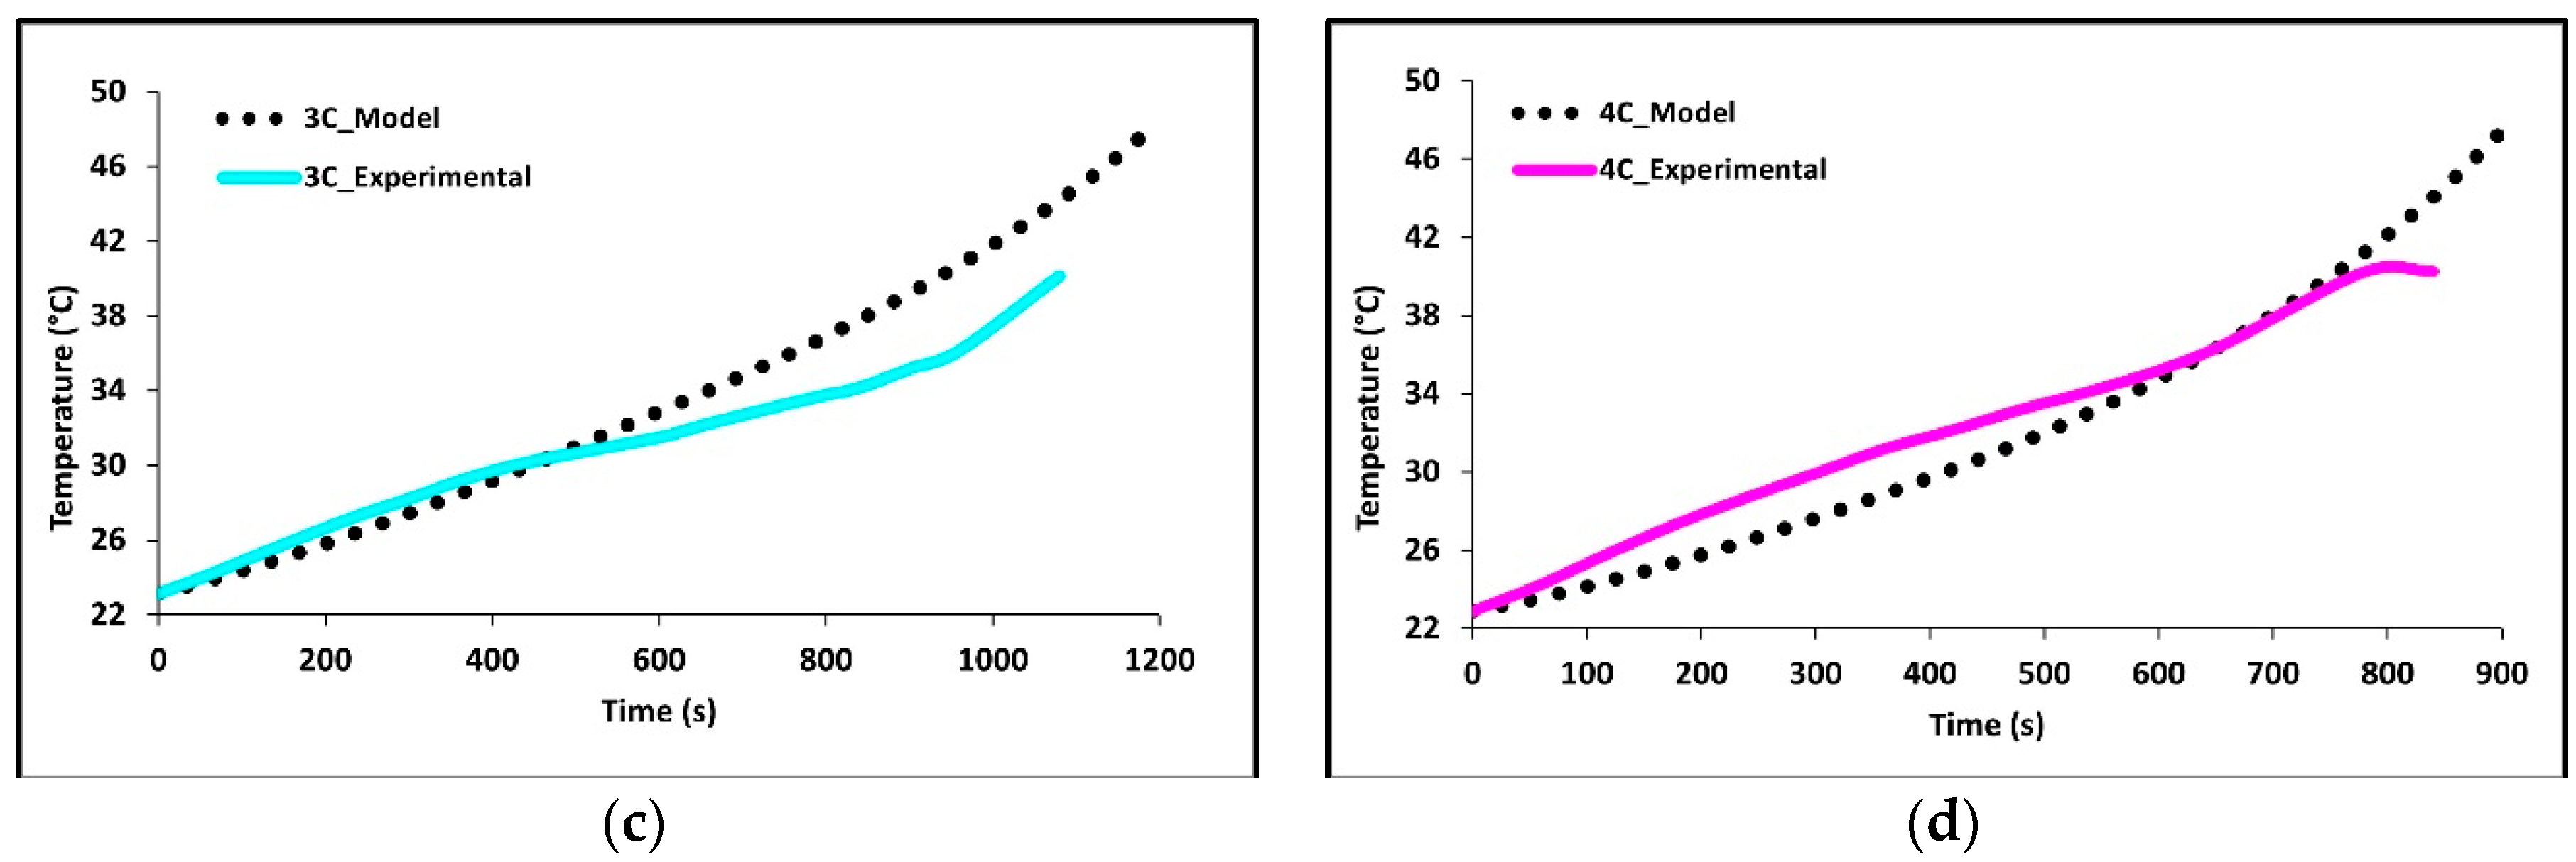
In Figure 5a–d we see how well the simulation results fit the experimental data at 1C, 2C, 3C, and 4C discharge rates. The average battery surface temperature recorded by the four thermocouples, based upon their area, is plotted as a function of time. The temperature of the model is simply the average surface temperature of both sides of the battery. The experimental data shows that the thermocouples at TC-1 and TC-2 have the fastest rate of increase; these are the thermocouples nearest to the tabs of the battery. The high temperatures at these locations suggest the highest heat accumulation in these areas indicating an increased current draw and Ohmic heating at the tabs. Though the conductivities of the tabs are high there is still a large voltage drop at the tabs due to the junction resistance. The figure shows that temperature increases with C-rate with 4C being the highest and 1C being the lowest. The data shows this to be true for all thermocouple locations. The highest temperatures were recorded at the end of discharge and the values were 28.68 °C for 1C, 38.02 °C for 2C, 47.87 °C for 3C, and 47.49 for 4C.
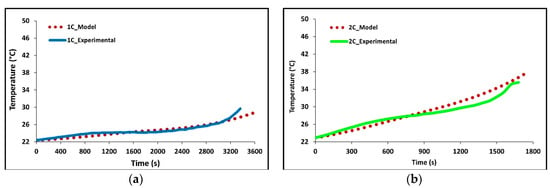
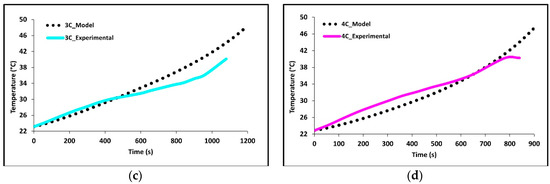
Figure 5.
Comparison of experimental and model discharge temperature profiles at 22 °C boundary condition (BC) for (a) 1C, (b) 2C, (c) 3C, and (d) 4C.
Overall, the experimental data and model results were in good agreement. At low discharge rates (1C and 2C), the predicted values follow the expected trends. However, at higher discharge rates (3C and 4C), slight discrepancies were observed. The model’s temperature depends on the heat generated by losses in the battery cell (primarily Ohmic, activation, and mass transfer/concentration losses), the thermal mass of the battery cell, and the heat transfer to the environment. Access to more definitive information on battery cell properties would lead to better agreement between the model and experimental data. At high C-rates (3C and 4C) the model accuracy decreases with time, one major reason for this decrease is a non-constant convective heat transfer coefficient which increases with increasing temperature differential.
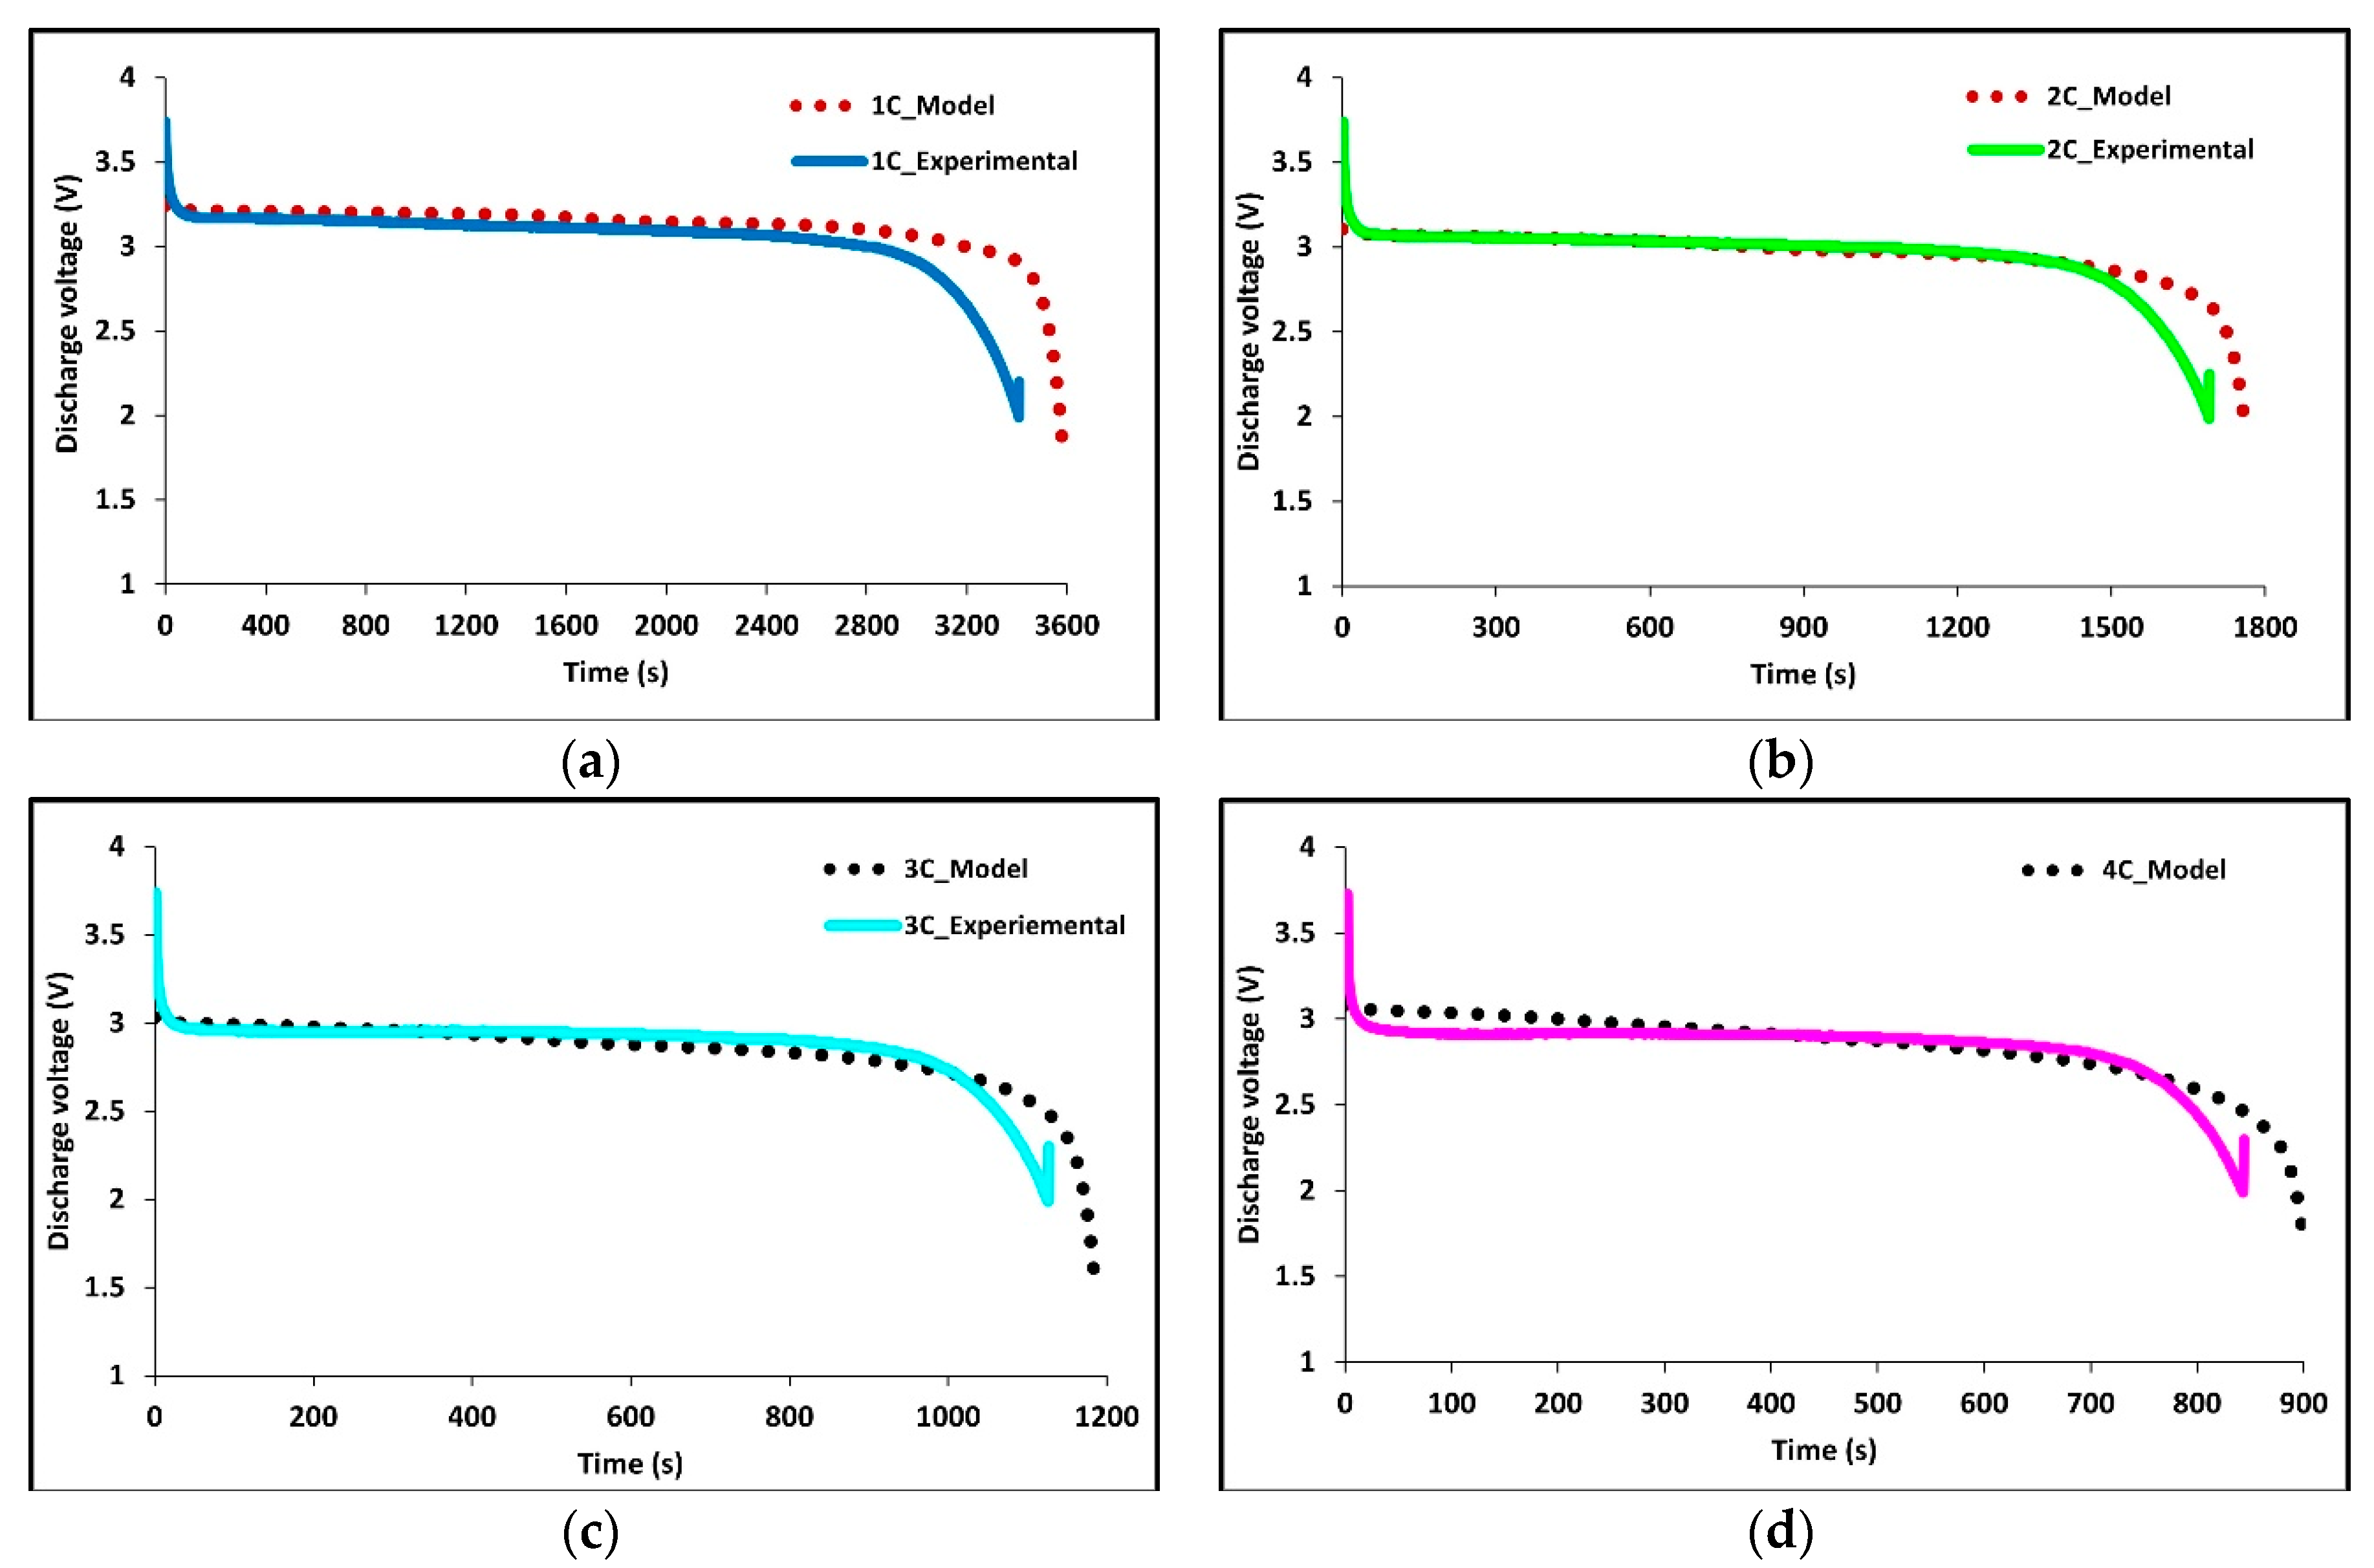
Figure 6a–d shows the experimental and model voltage profiles at 1C, 2C, 3C, and 4C discharge rates held at an ambient temperature of 22 °C. The model is a great fit to the experimental data and demonstrates the robustness and accuracy of the model as both the average surface temperature and the voltage profiles are accurate. However, some discrepancies are observed at higher C-rates.
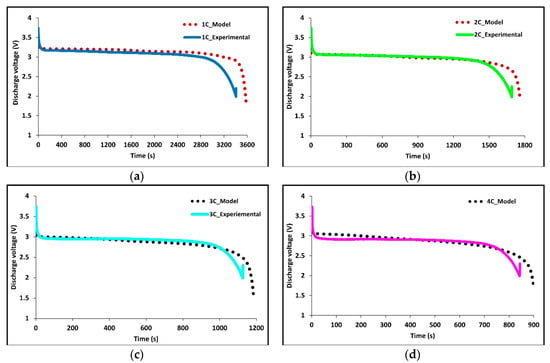
Figure 6.
Comparison of experimental and model discharge voltage profiles at 22°C BC for (a) 1C, (b) 2C, (c) 3C, and (d) 4C.
Experimentally the battery is charged using constant current-constant voltage (CC-CV) with a voltage limit of 3.7 V, the cell is discharged at constant current (CC) until a voltage of 2.3 V. We note at lower discharge rates the cell potential stays close to the cell’s open circuit potential (OCP). While at high discharge rates the cell voltage deviates significantly from the OCP due to Ohmic, activation, and mass transport losses, and a larger overpotential is observed.
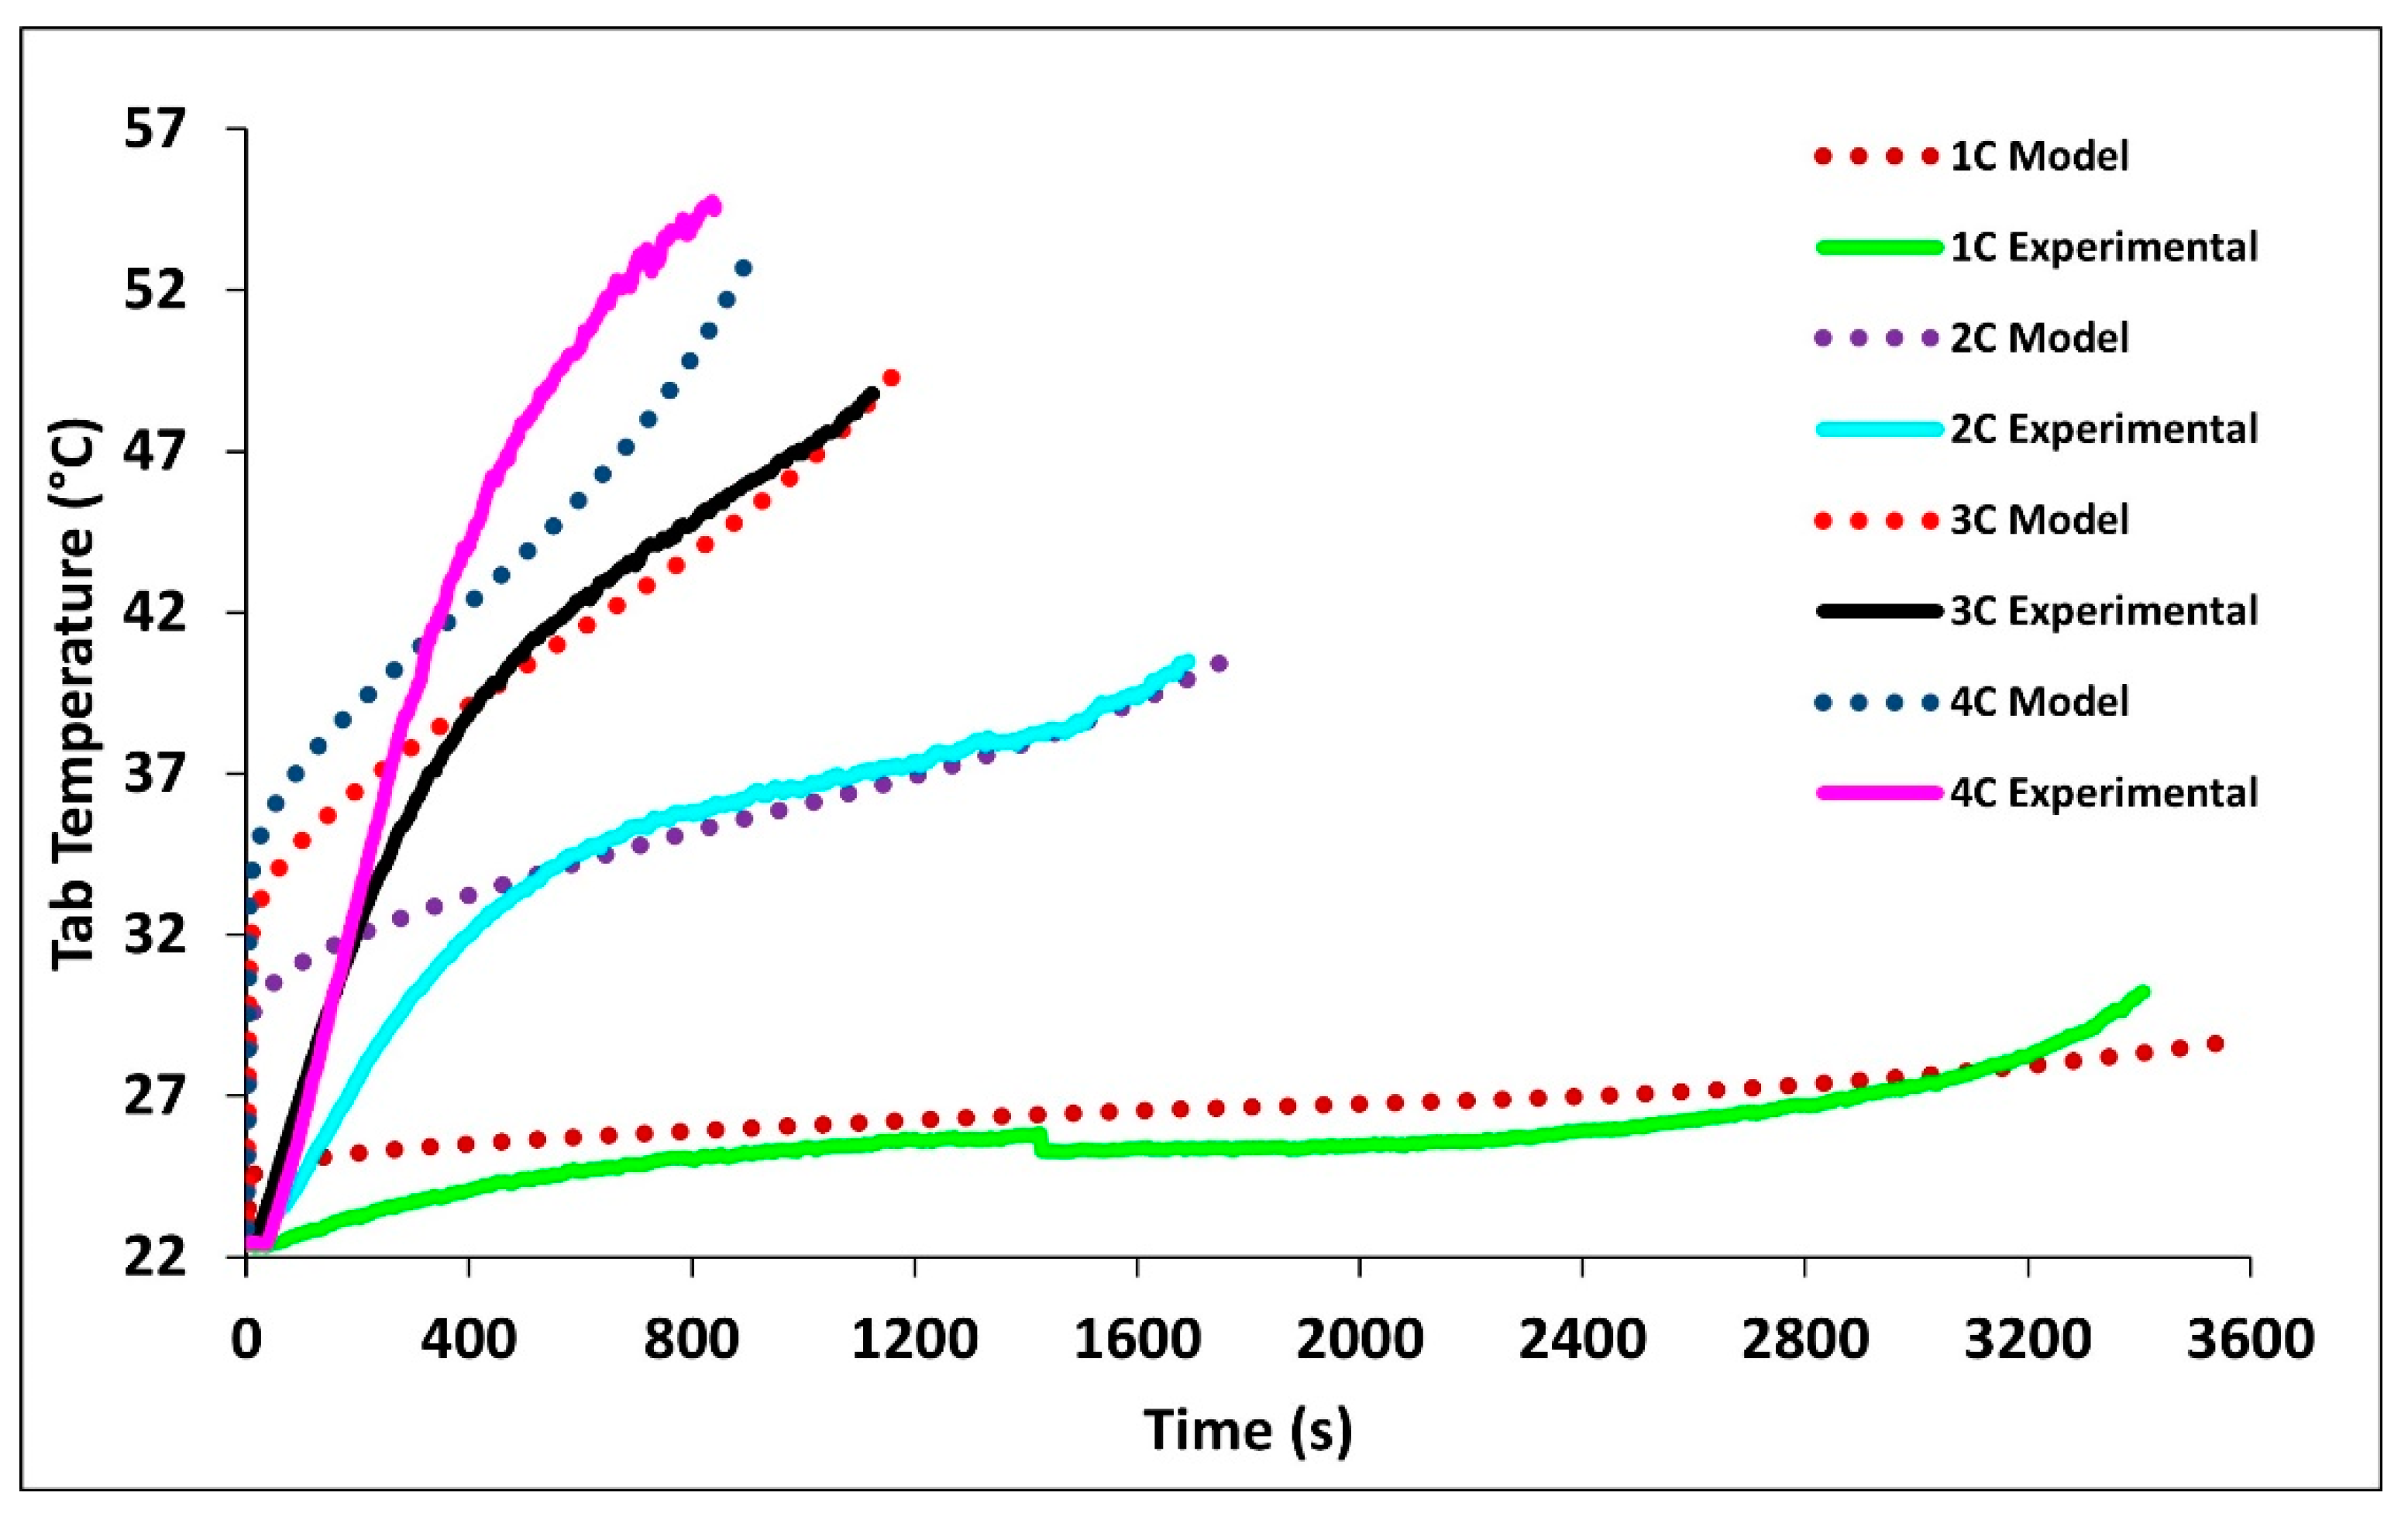
Figure 7 compares the experimental and model tab temperatures at 1C, 2C, 3C, and 4C discharge rates. The figure shows tab temperatures are always higher than the surface temperature. The tabs, just as the battery, experienced their highest temperature profiles at 4C and their lowest at 2C following the expected trend. It is observed that increased discharge rates result in increased tab temperatures. The highest temperatures were recorded at the end of discharge with the values of 28.718 °C for 1C, 40.52 °C for 2C, 49.85 °C for 3C, and 52.92 °C for 4C. It is seen that the model closely follows the tab temperatures for the later time periods, while during the initial stage, the error is large, this is the case as a uniform heat source is assume in the volume of the tab instead of Ohmic heating between the areas of which current is flowing. Table 6 tabulates the experimental and model surface and tab temperatures at the end of discharge rates with relative error.
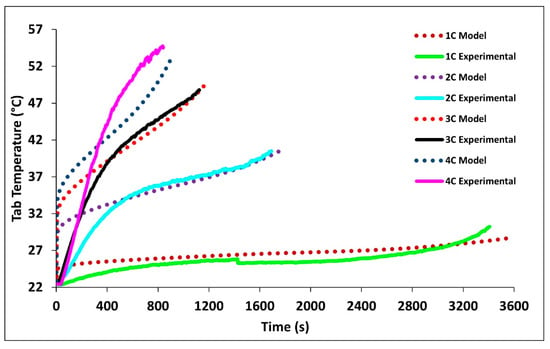
Figure 7.
Comparison of experimental and simulated tab temperature profiles at 1C, 2C, 3C, 4C at 22 °C BC.

Table 6.
Surface and tab temperature at end of discharge.
4.2. Temperature Contours
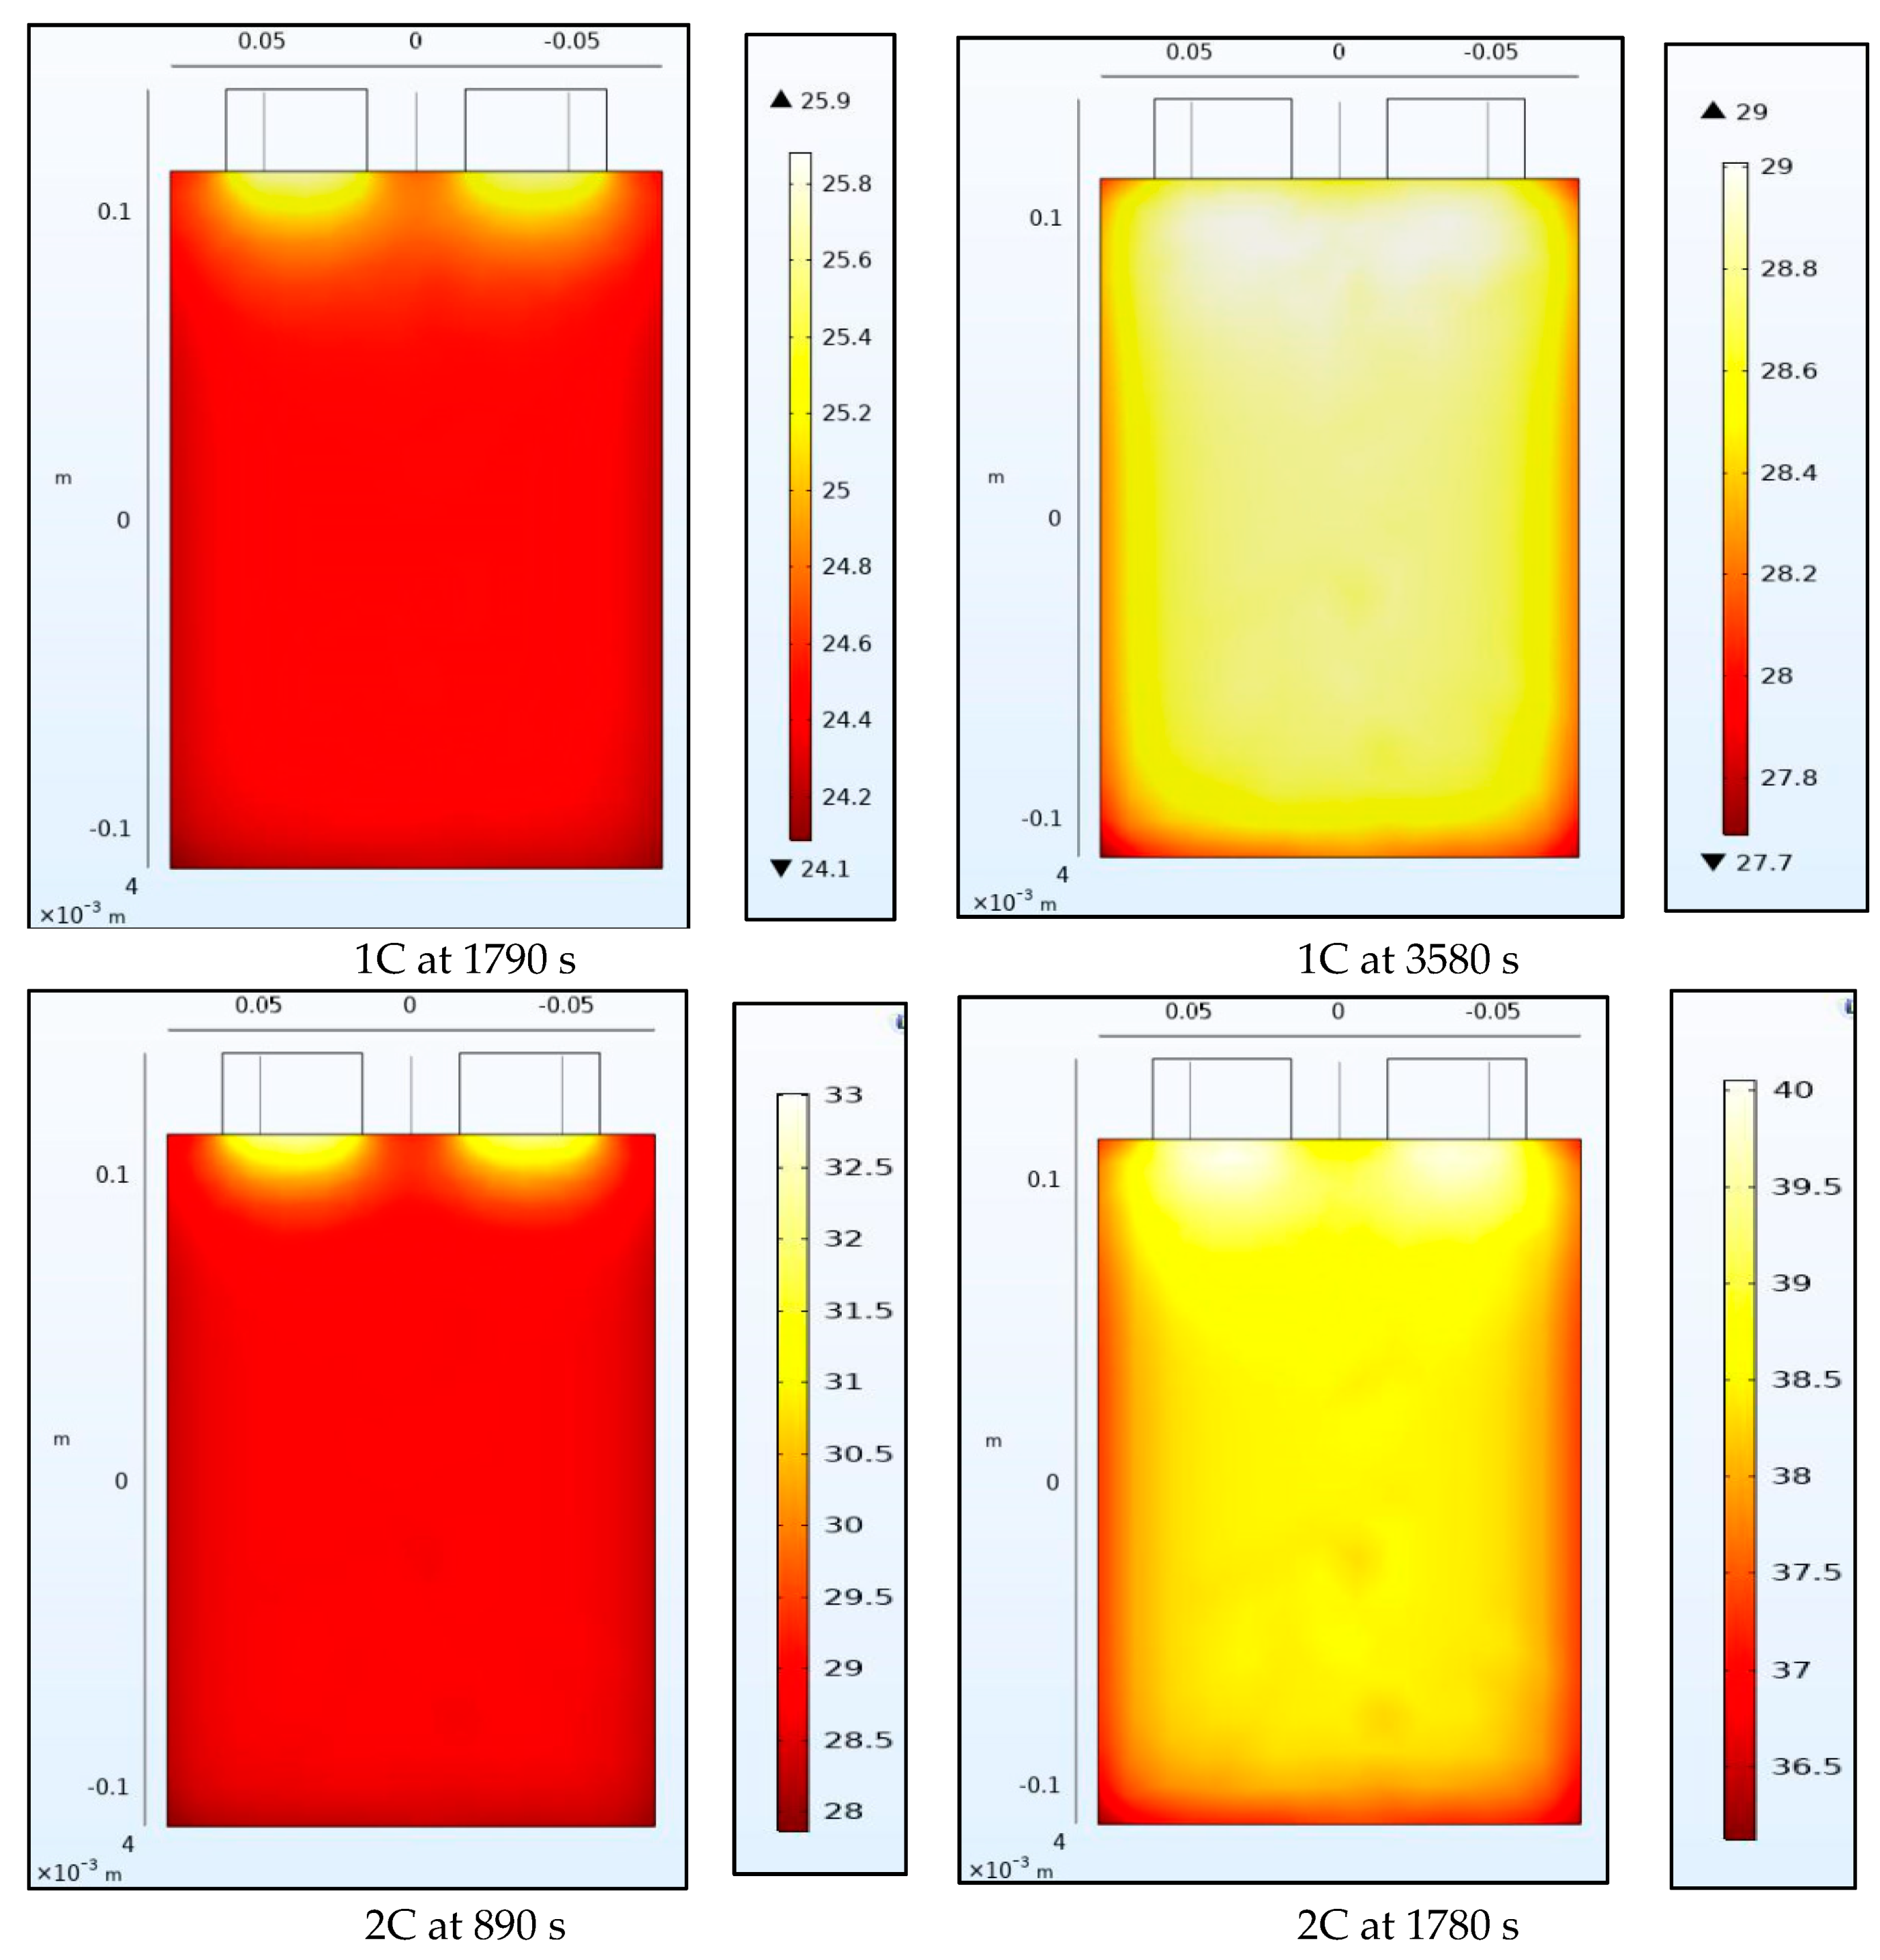
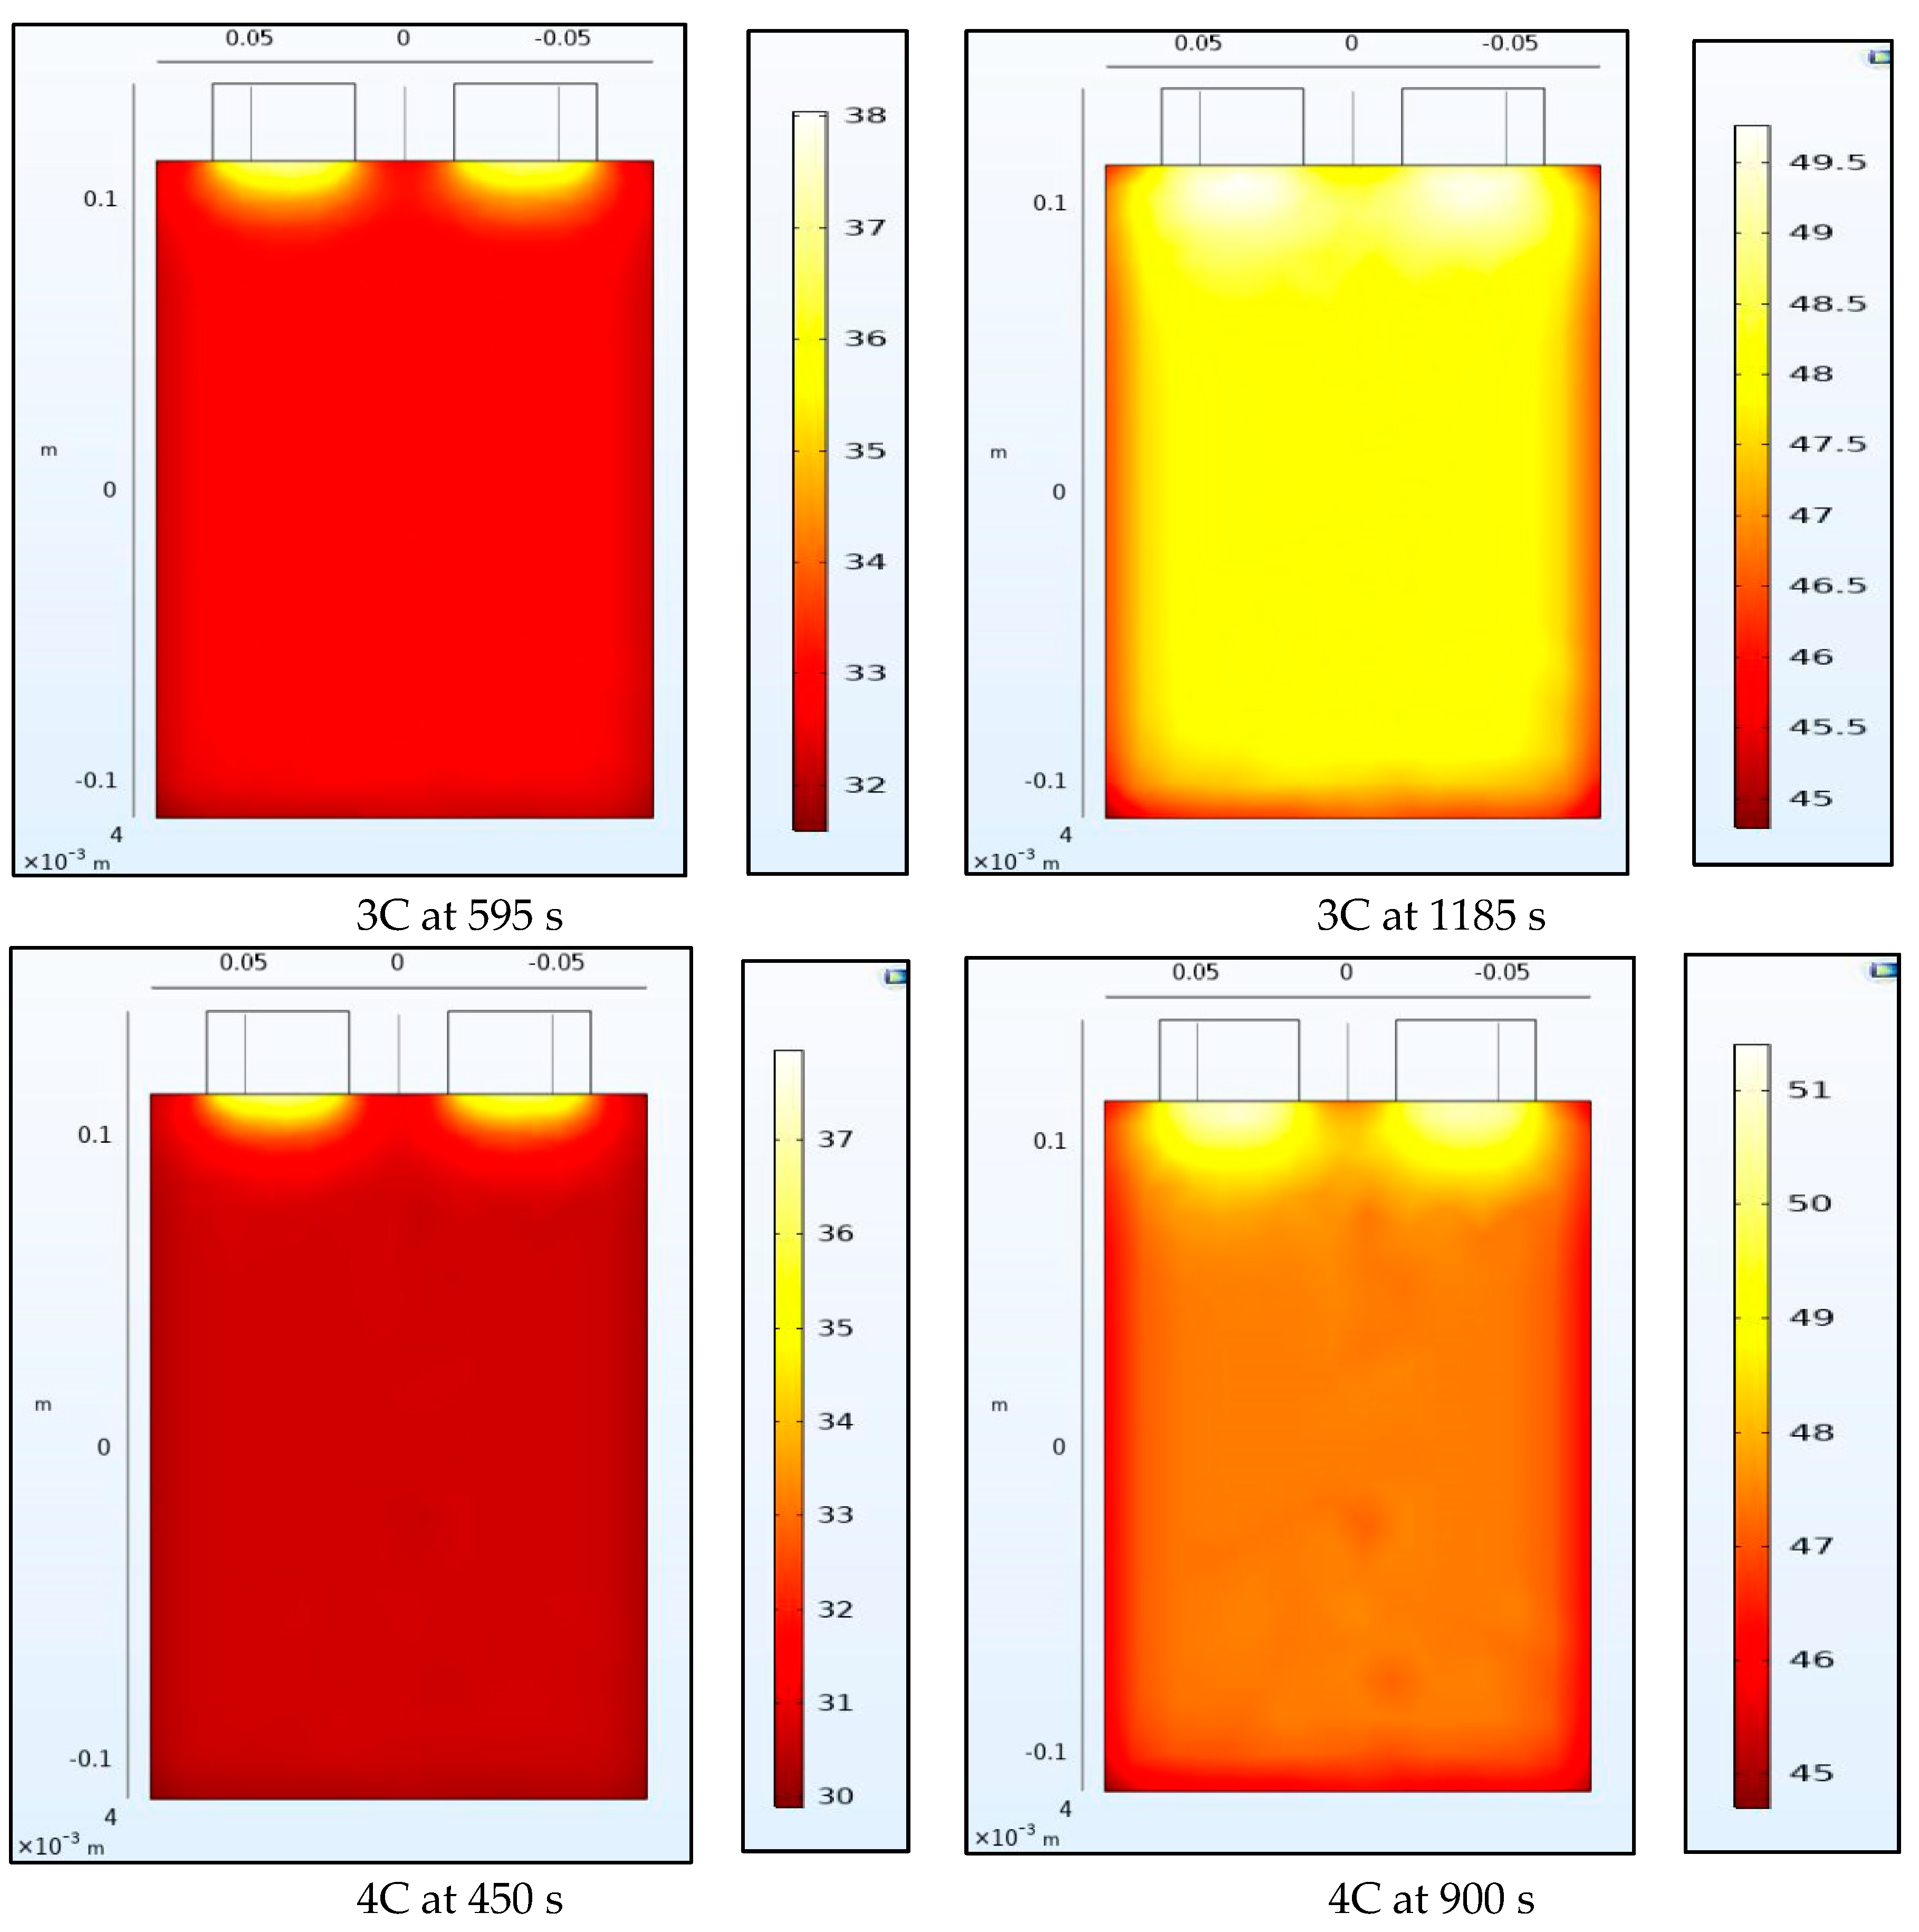
Figure 8 and Figure 9 show the temperature of the battery at the half-way and the end of the discharge cycle. A convective boundary condition is assumed at all boundaries of the battery with a convective coefficient of 5 W/m2K and an ambient temperature of approximately 23 °C. There are 2 heat sources in this thermal model, the first is the heat generated from the electrochemical 1-D model of the battery while the second is the Ohmic resistance within the tabs. The tab heat source is assumed to be a simple current squared multiplied by the resistance model while the heat generated by the battery is assumed to be uniform across the 3-D battery domain and is calculated as the average heat from all the domains of the 1-D electrochemical battery model. The 1-D heat is calculated as the irreversible heat, which is calculated as the local current source multiplied by the overpotential, in addition to the reversible heat and an electrolyte conductivity loss term. The reversible heat is calculated as the local current source multiplied by the temperature multiplied by the derivative of the equilibrium potential with respect to temperature. The electrolyte conductivity loss term is made up of two terms: (1) the first is being the electrolyte current density multiplied by the derivative of the electrolyte potential, and (2) the second being the electrode current density multiplying the derivative of the electrode potential in the x-direction. Both the reversible and irreversible heat are included in the model, but the heat of mixing is neglected. We observe that heating at the tabs due to Ohmic heating leads to increased temperatures at the top of the battery compared to the bottom. The temperature range within the battery is larger at half discharge than at full discharge with higher C-rates having larger temperature ranges. Non-uniform temperatures within the battery lead to different parts of the battery delivering different current outputs and ultimately lead to degradation. This is why tab cooling has been a leading field of research. Temperature uniformity at the pack and cell level is a necessity to prolong battery life.
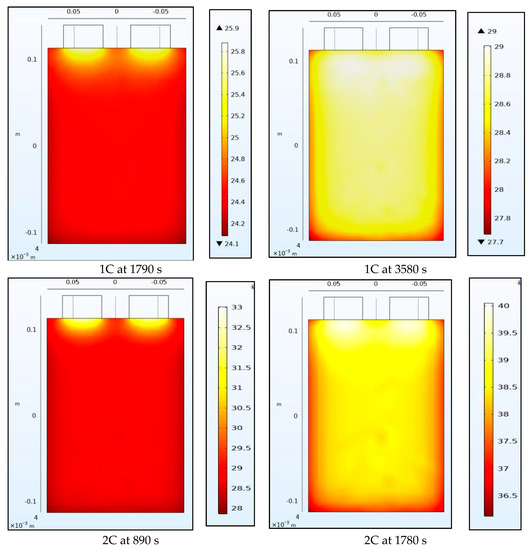
Figure 8.
Temperature contours at 1C and 2C at the middle and end of discharge.
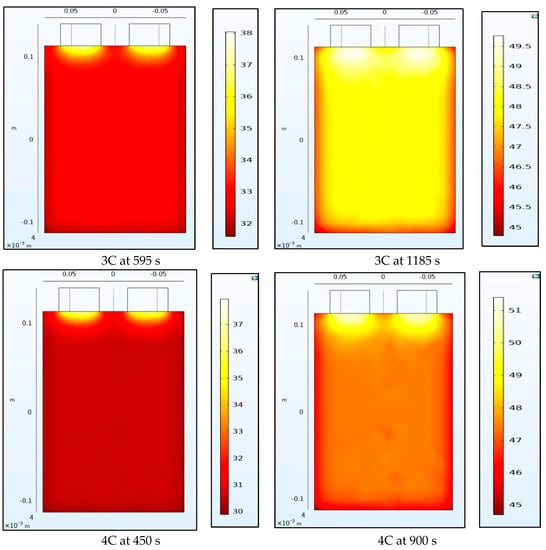
Figure 9.
Temperature contours at 3C and 4C at the middle and end of discharge.
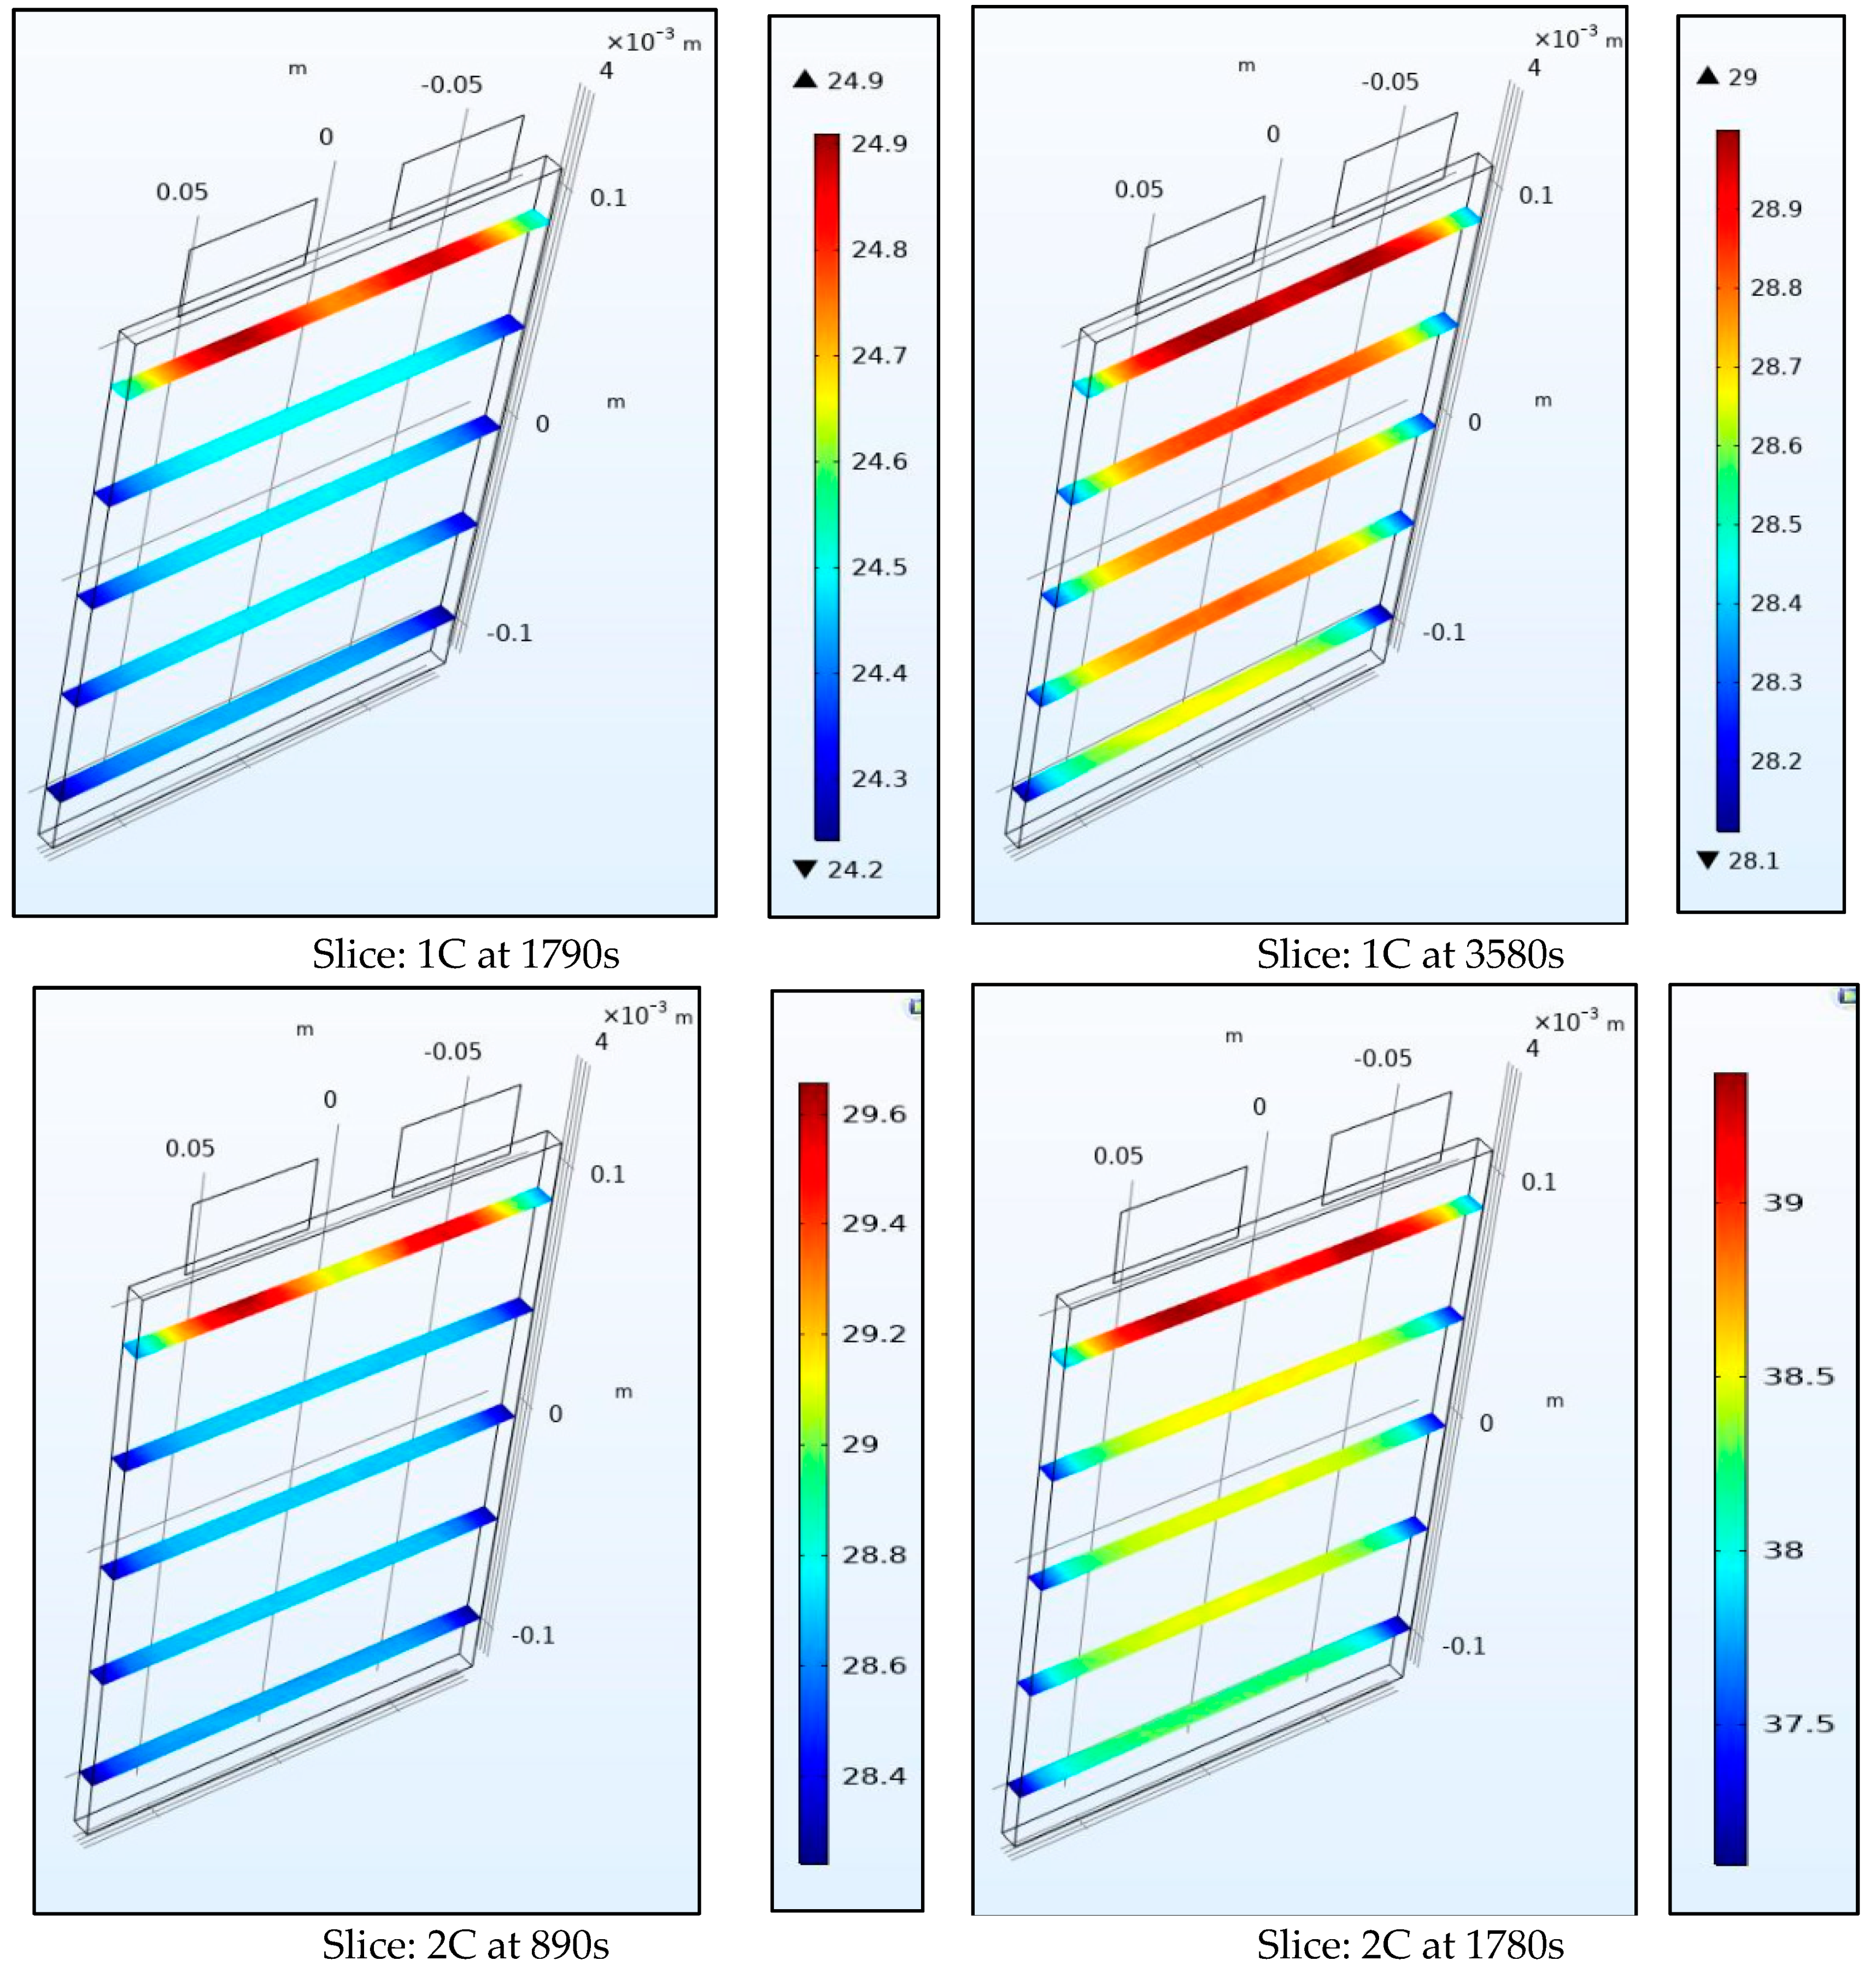
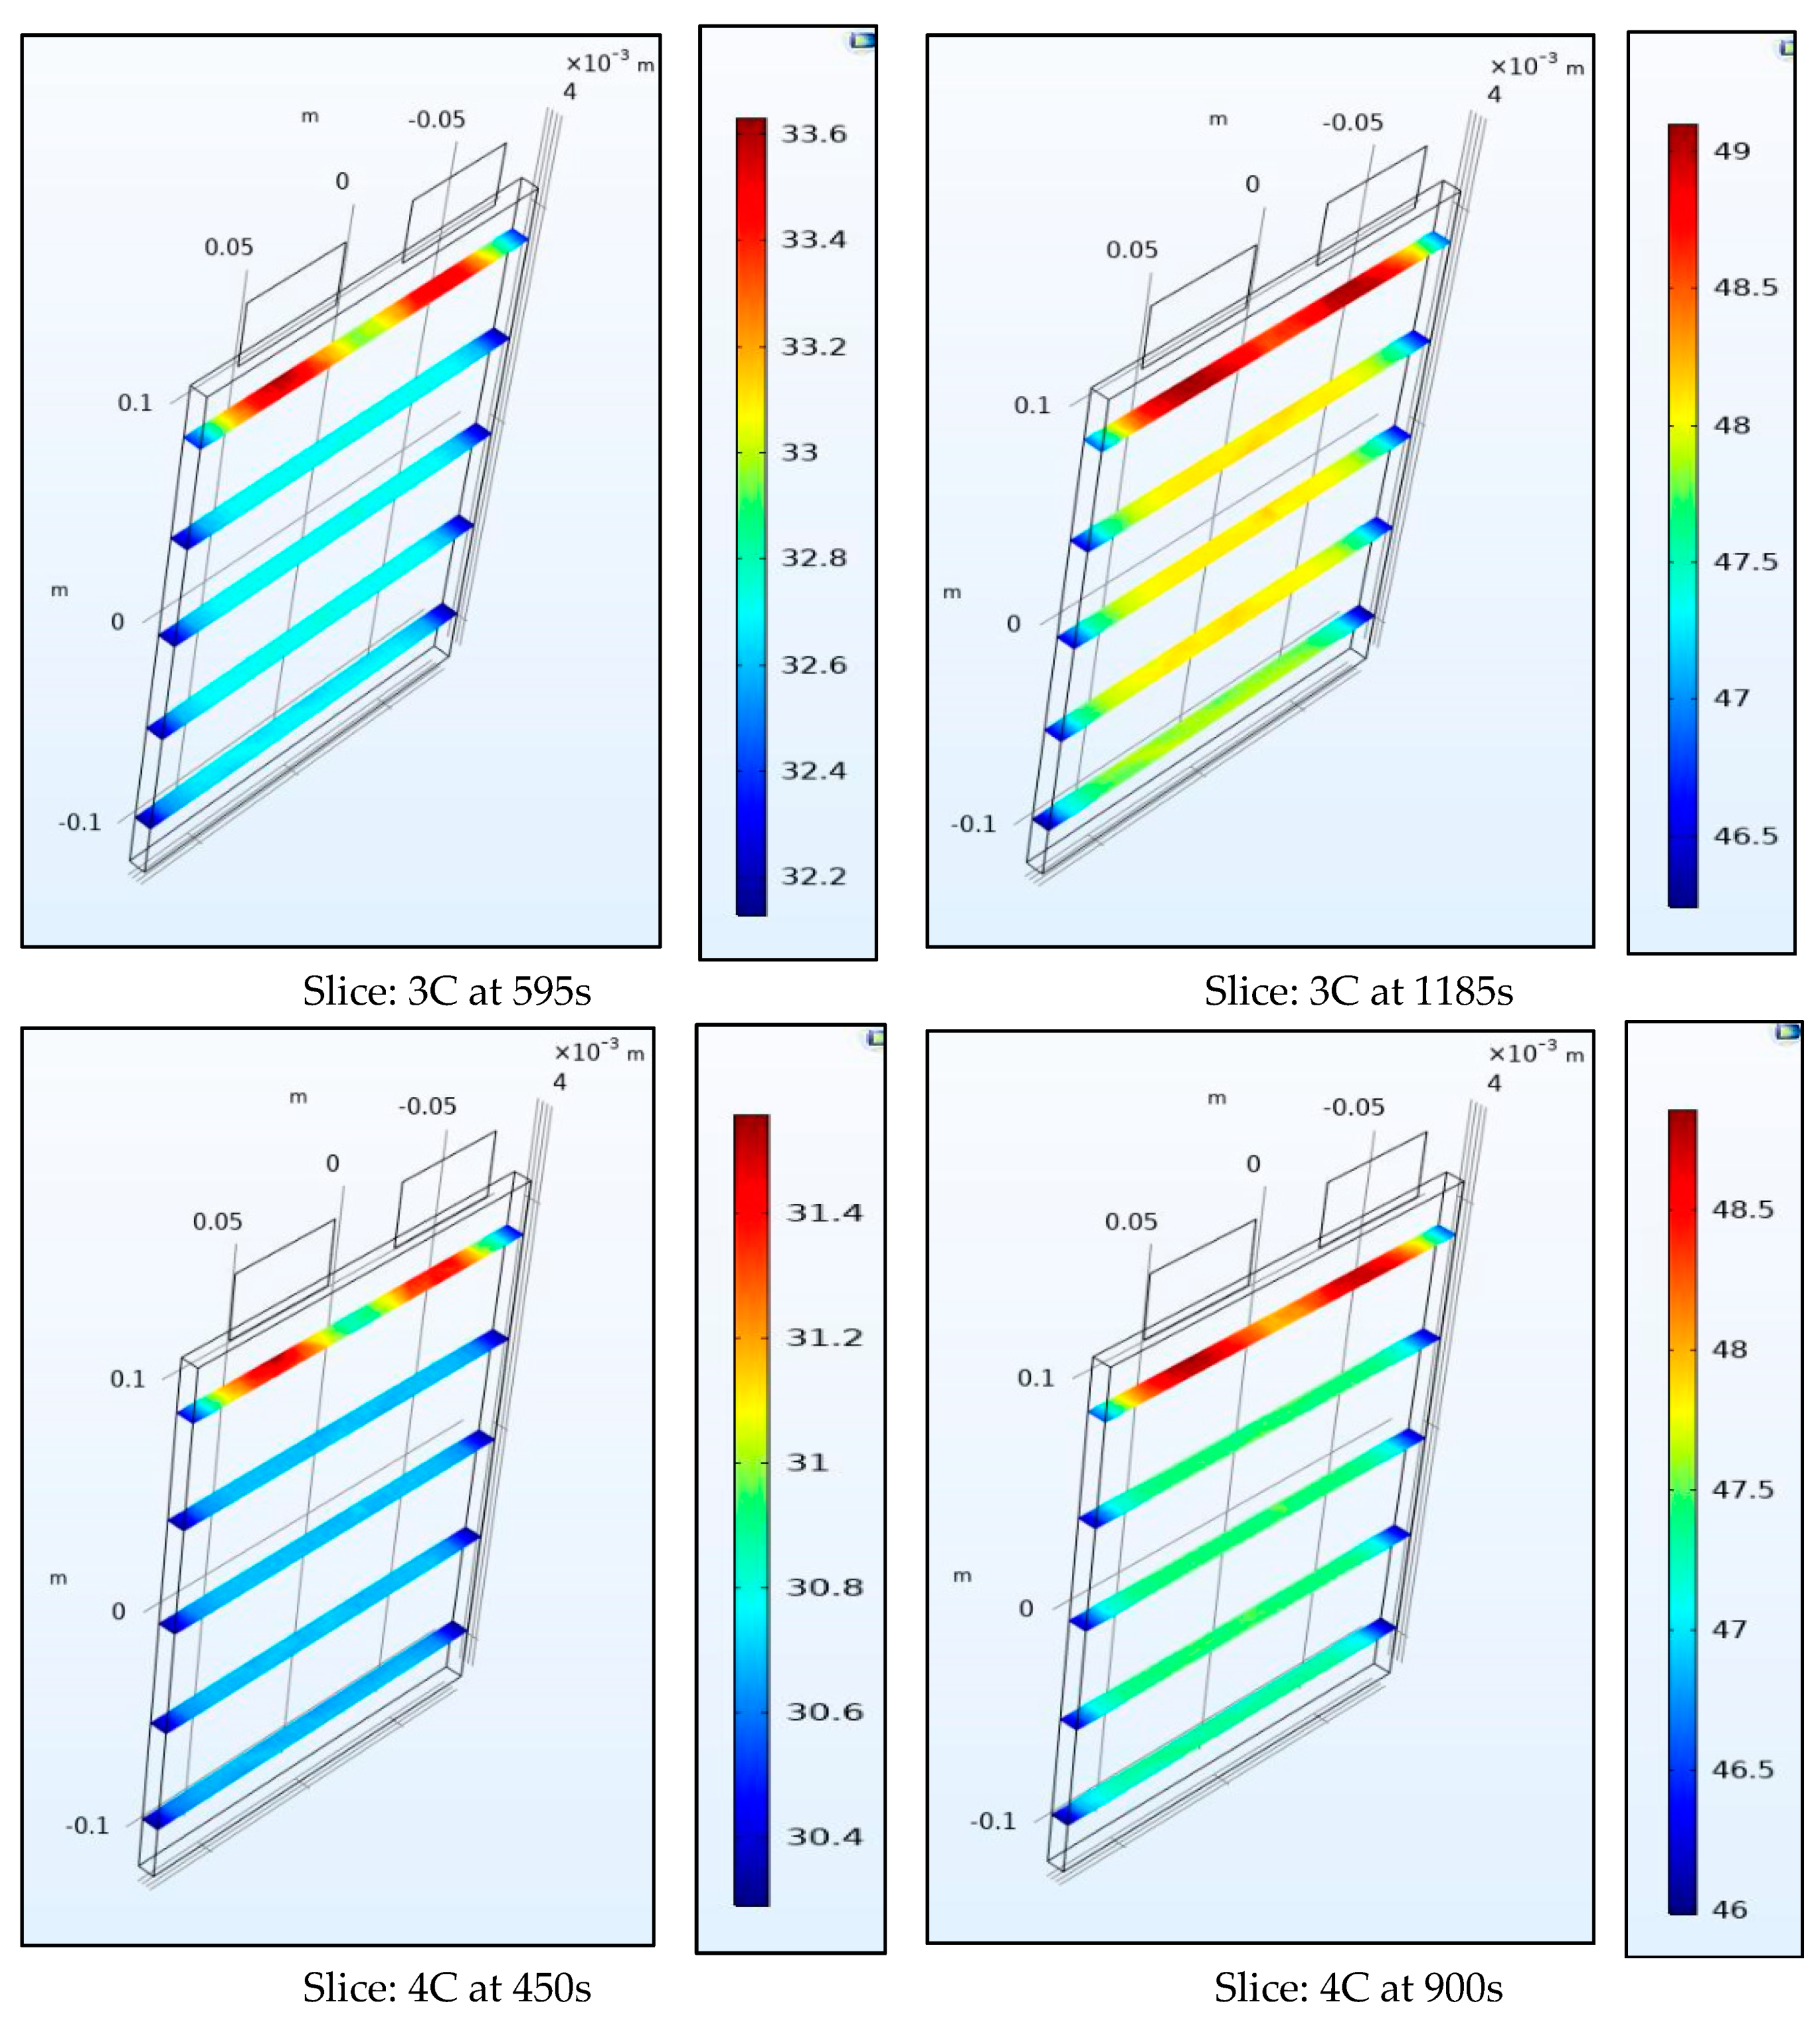
Figure 10 and Figure 11 show the internal temperature of the battery at the half-way and the end of the discharge cycle, a convective boundary condition is assumed at all boundaries of the battery which thus leads to higher temperatures within the battery than at the surface as the heat source is uniform throughout the volume. We observe that the range of temperature for the surface plots is larger than those for the slice plots, this is true as the top part of the battery near the tabs is not included in the slice plots. Figure 10 and Figure 11 also show the gradient within the battery is steep and as the thermal conductivity coefficient of the battery of 0.89724 W/m-K is low this leads to a steep spatial thermal gradient. We observed that the temperature of the battery changed rapidly from its internal to surface space. This non-uniform temperature distribution leads to non-uniform SOCs (state of charge) and current densities in the battery and leads to enhanced degradation.

Figure 10.
Temperature at 1C and 2C at the middle and end of discharge.

Figure 11.
Temperature at 3C and 4C at the middle and end of discharge.
4.3. Total Power, Separator Heat, Electrolyte, Irreversible and Reversible Heat
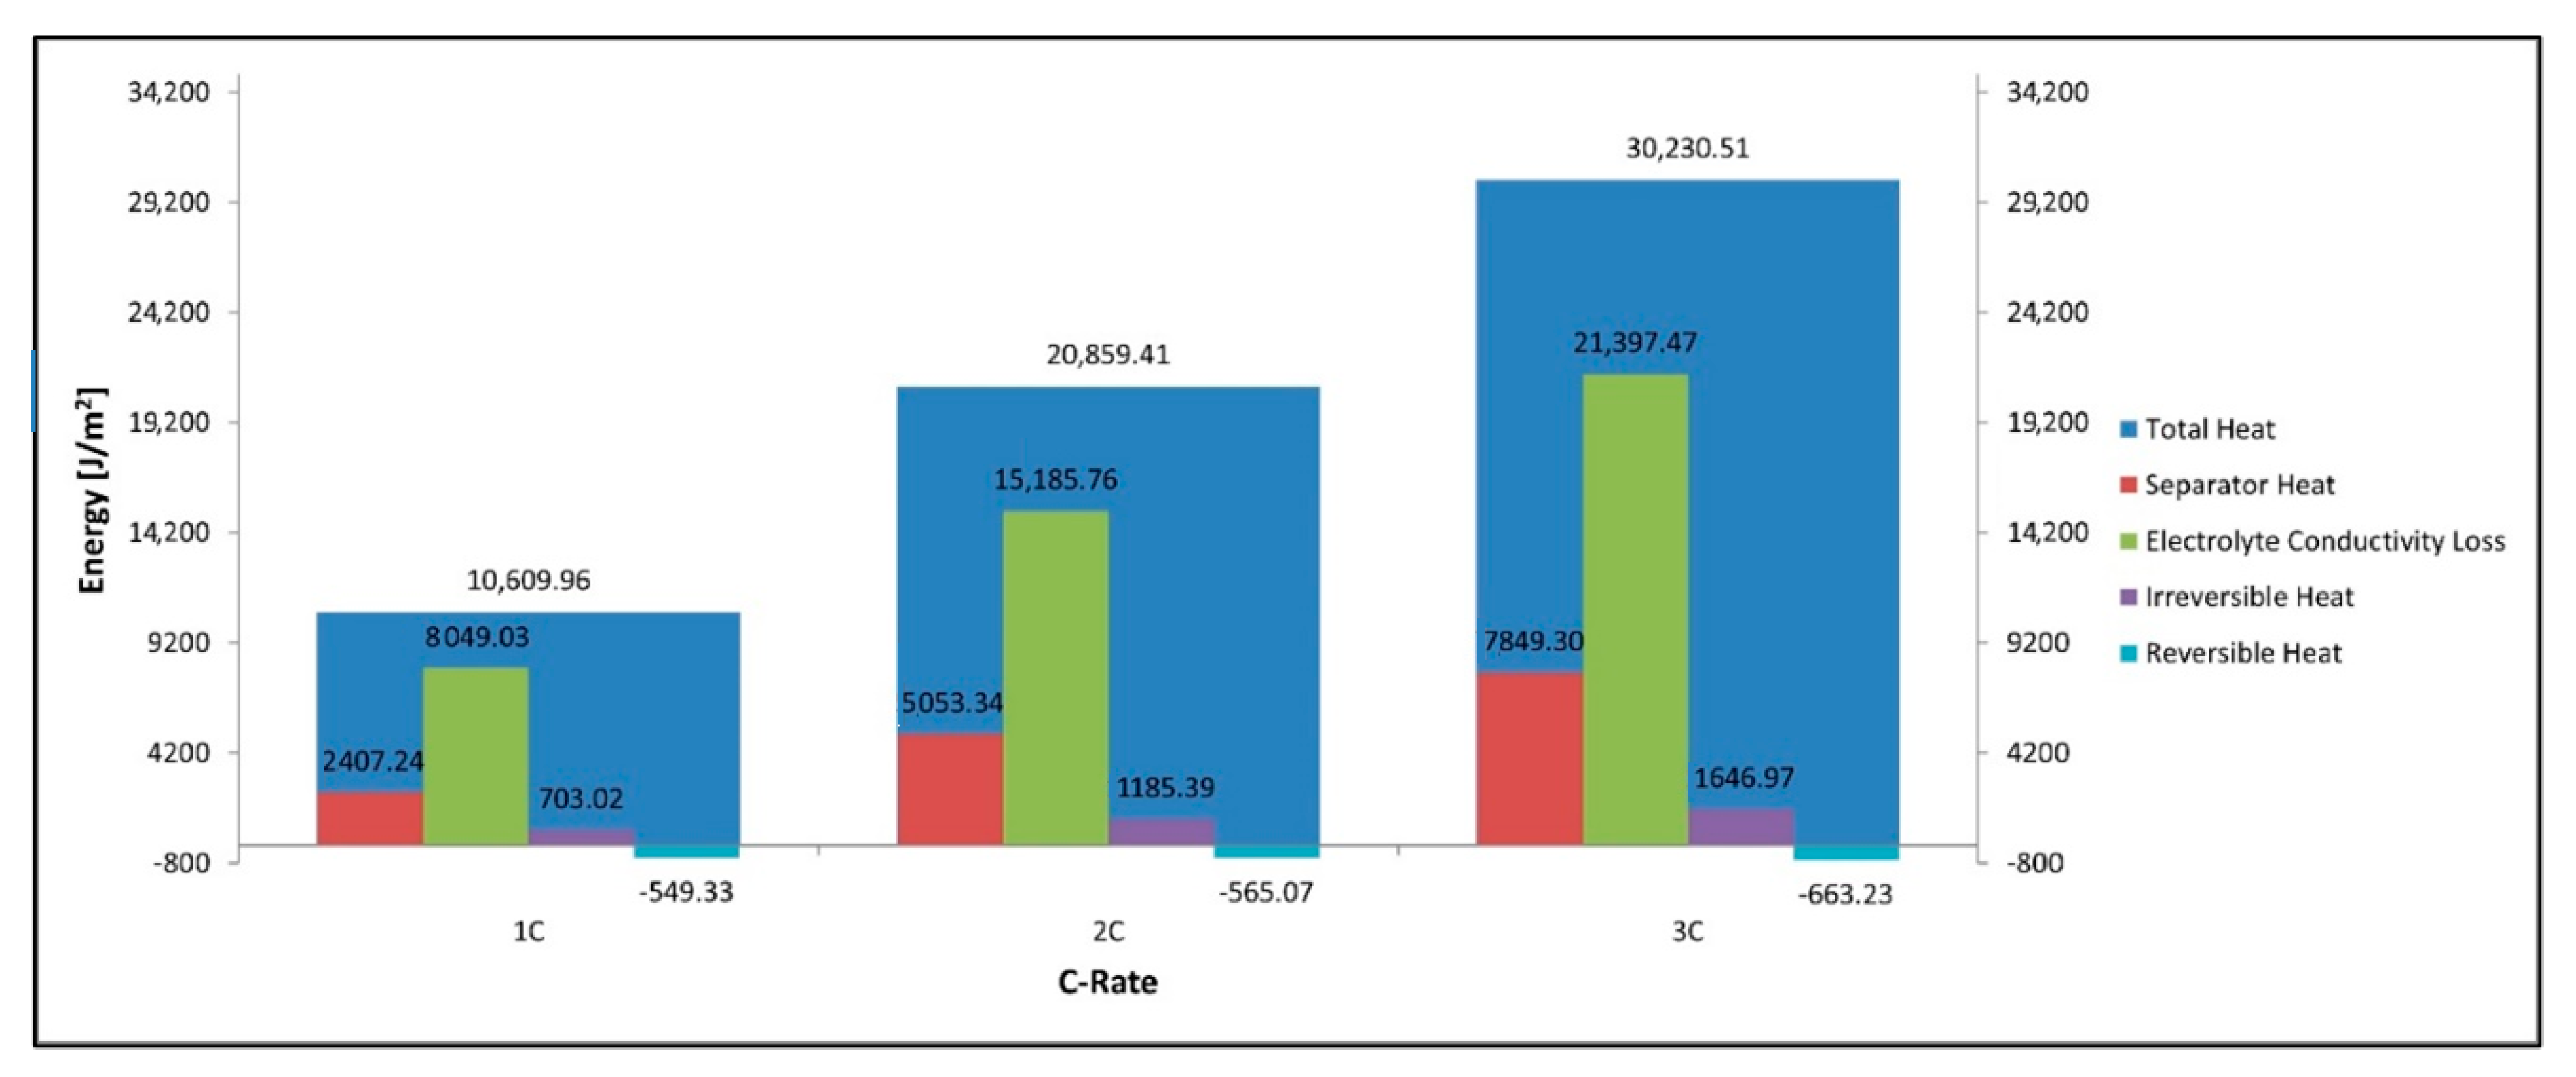
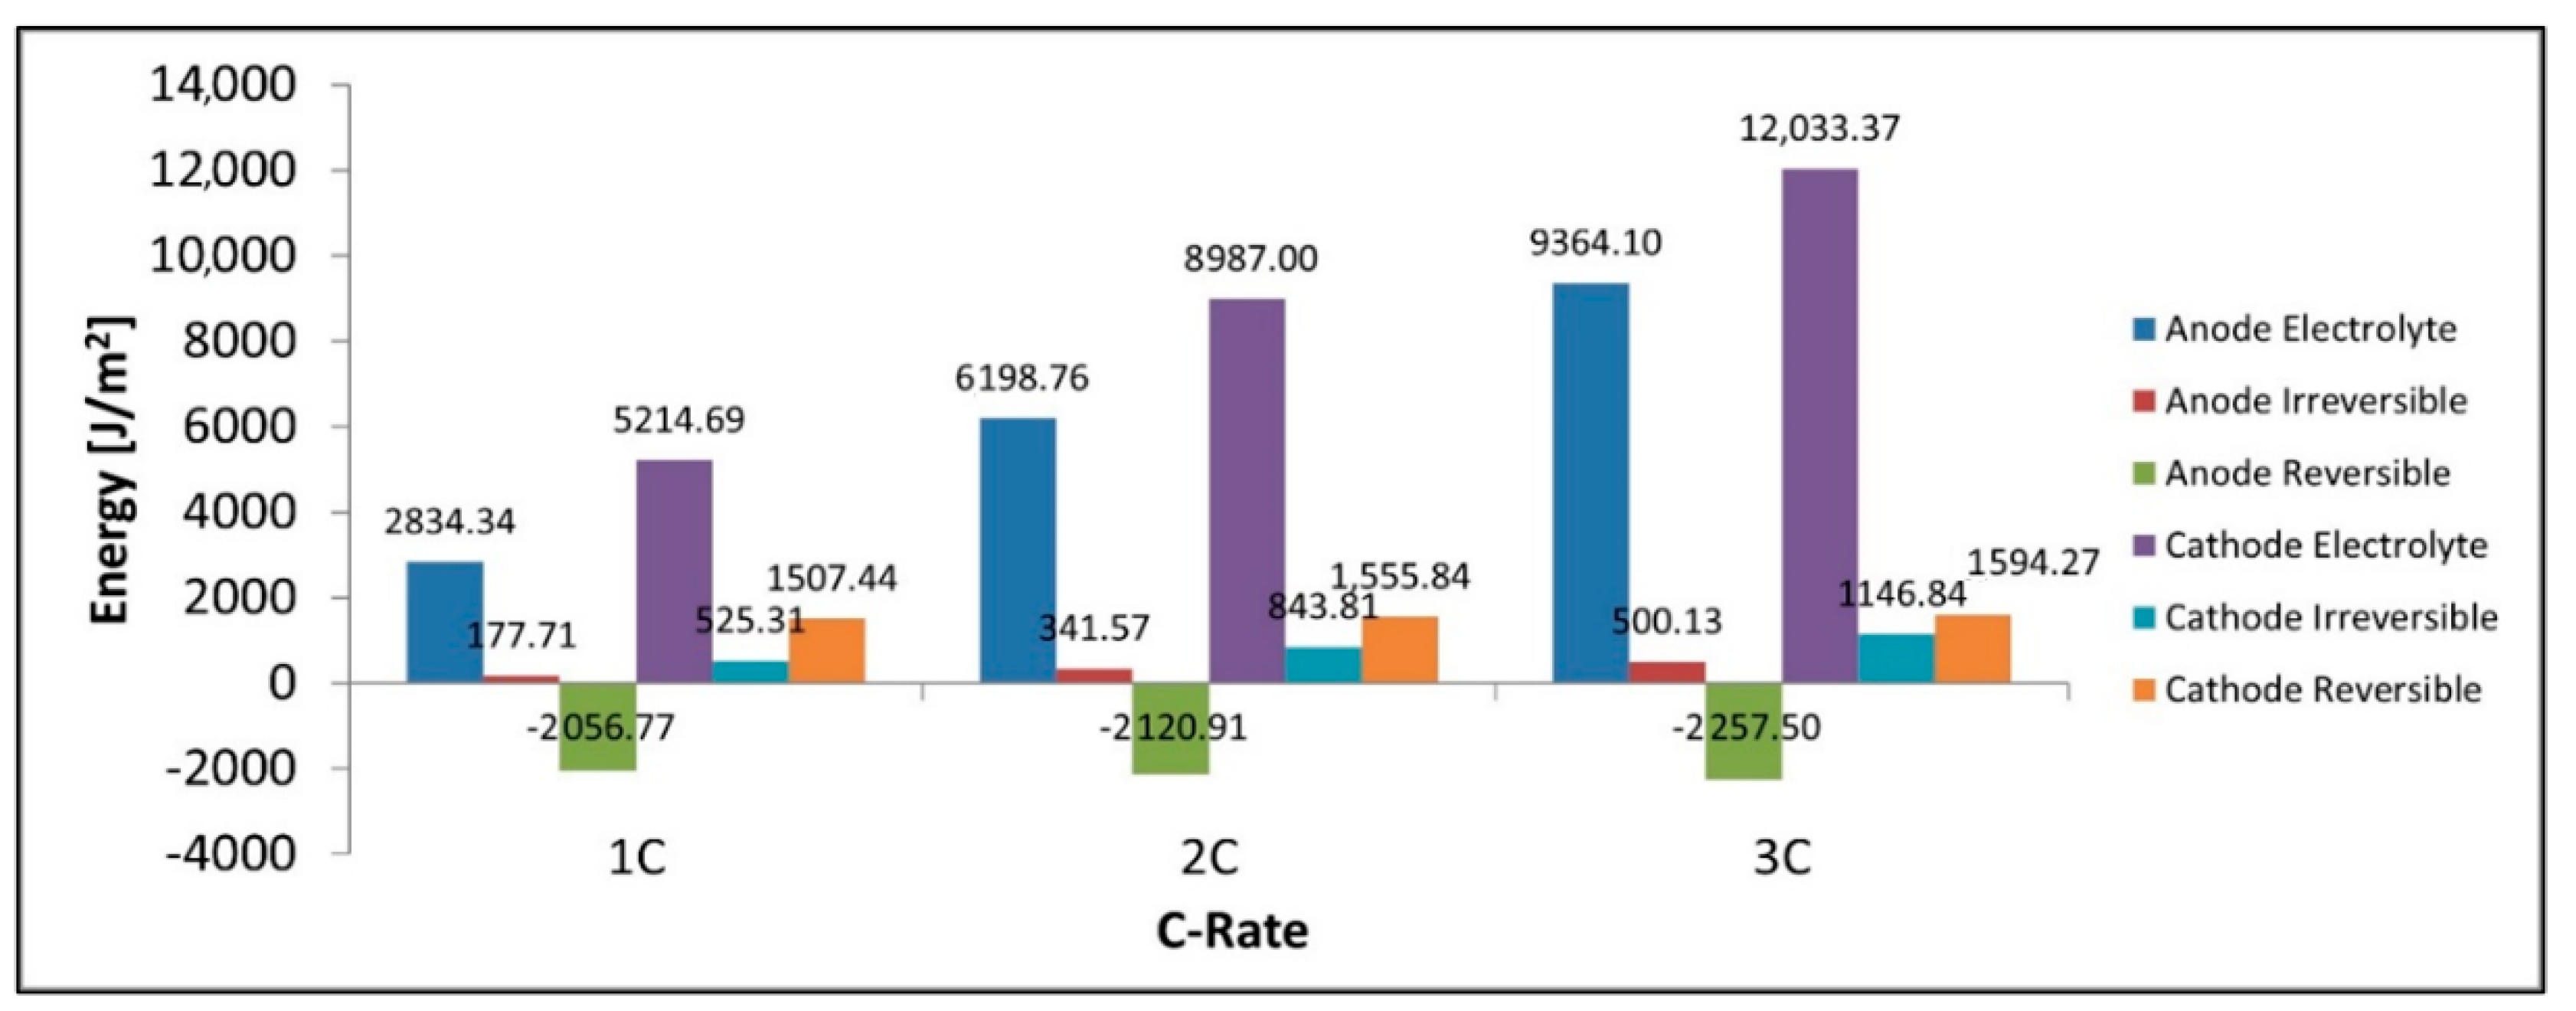
Figure 12 shows that the total power lost as heat is the sum of the heat in the separator, electrolyte loss, irreversible loss, and reversible loss. We can see that the total heat increases with C-rate along with its constituent components with the only exception being the reversible heat which becomes increasingly negative. It is observed that the largest contributors to the heat are the electrolyte resistance terms in both the electrodes and the separator. Figure 13 shows that for discharge the reversible heat in the cathode is positive while that in the anode is negative with the total reversible heat being negative at these C-rates and with the given parameters. We also note the electrolyte loss is larger in the cathode than in the anode. We see from Figure 13 that the total heat produced in the cathode is higher than that of the anode, this is true for all heat components including the electrolyte, irreversible, reversible components. The cathode’s larger electrolyte loss means that the contribution of the electrolyte current to the total current in the electrode is larger in the cathode than in the anode. The electrolyte current experiences a much larger spatial voltage gradient () and subsequent voltage drop than the spatial voltage gradient for the solid electrode () thus we have a larger energy loss in the electrolyte heat term in the cathode as this is where we have a larger electrolyte current. The reversible heat for the anode during discharge is in fact negative and has a cooling effect, while this is the opposite for the cathode. Finally, we see the irreversible heat term is also larger in the cathode than the anode thus the sum of all heat terms for the cathode is larger than the anode.

Figure 12.
Total power, separator heat, electrolyte, irreversible, and reversible heat.
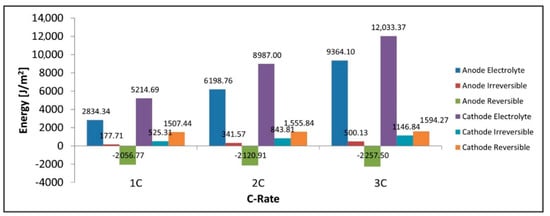
Figure 13.
Anode electrolyte, anode irreversible heat, anode reversible heat, cathode electrolyte, cathode irreversible heat, cathode reversible heat.
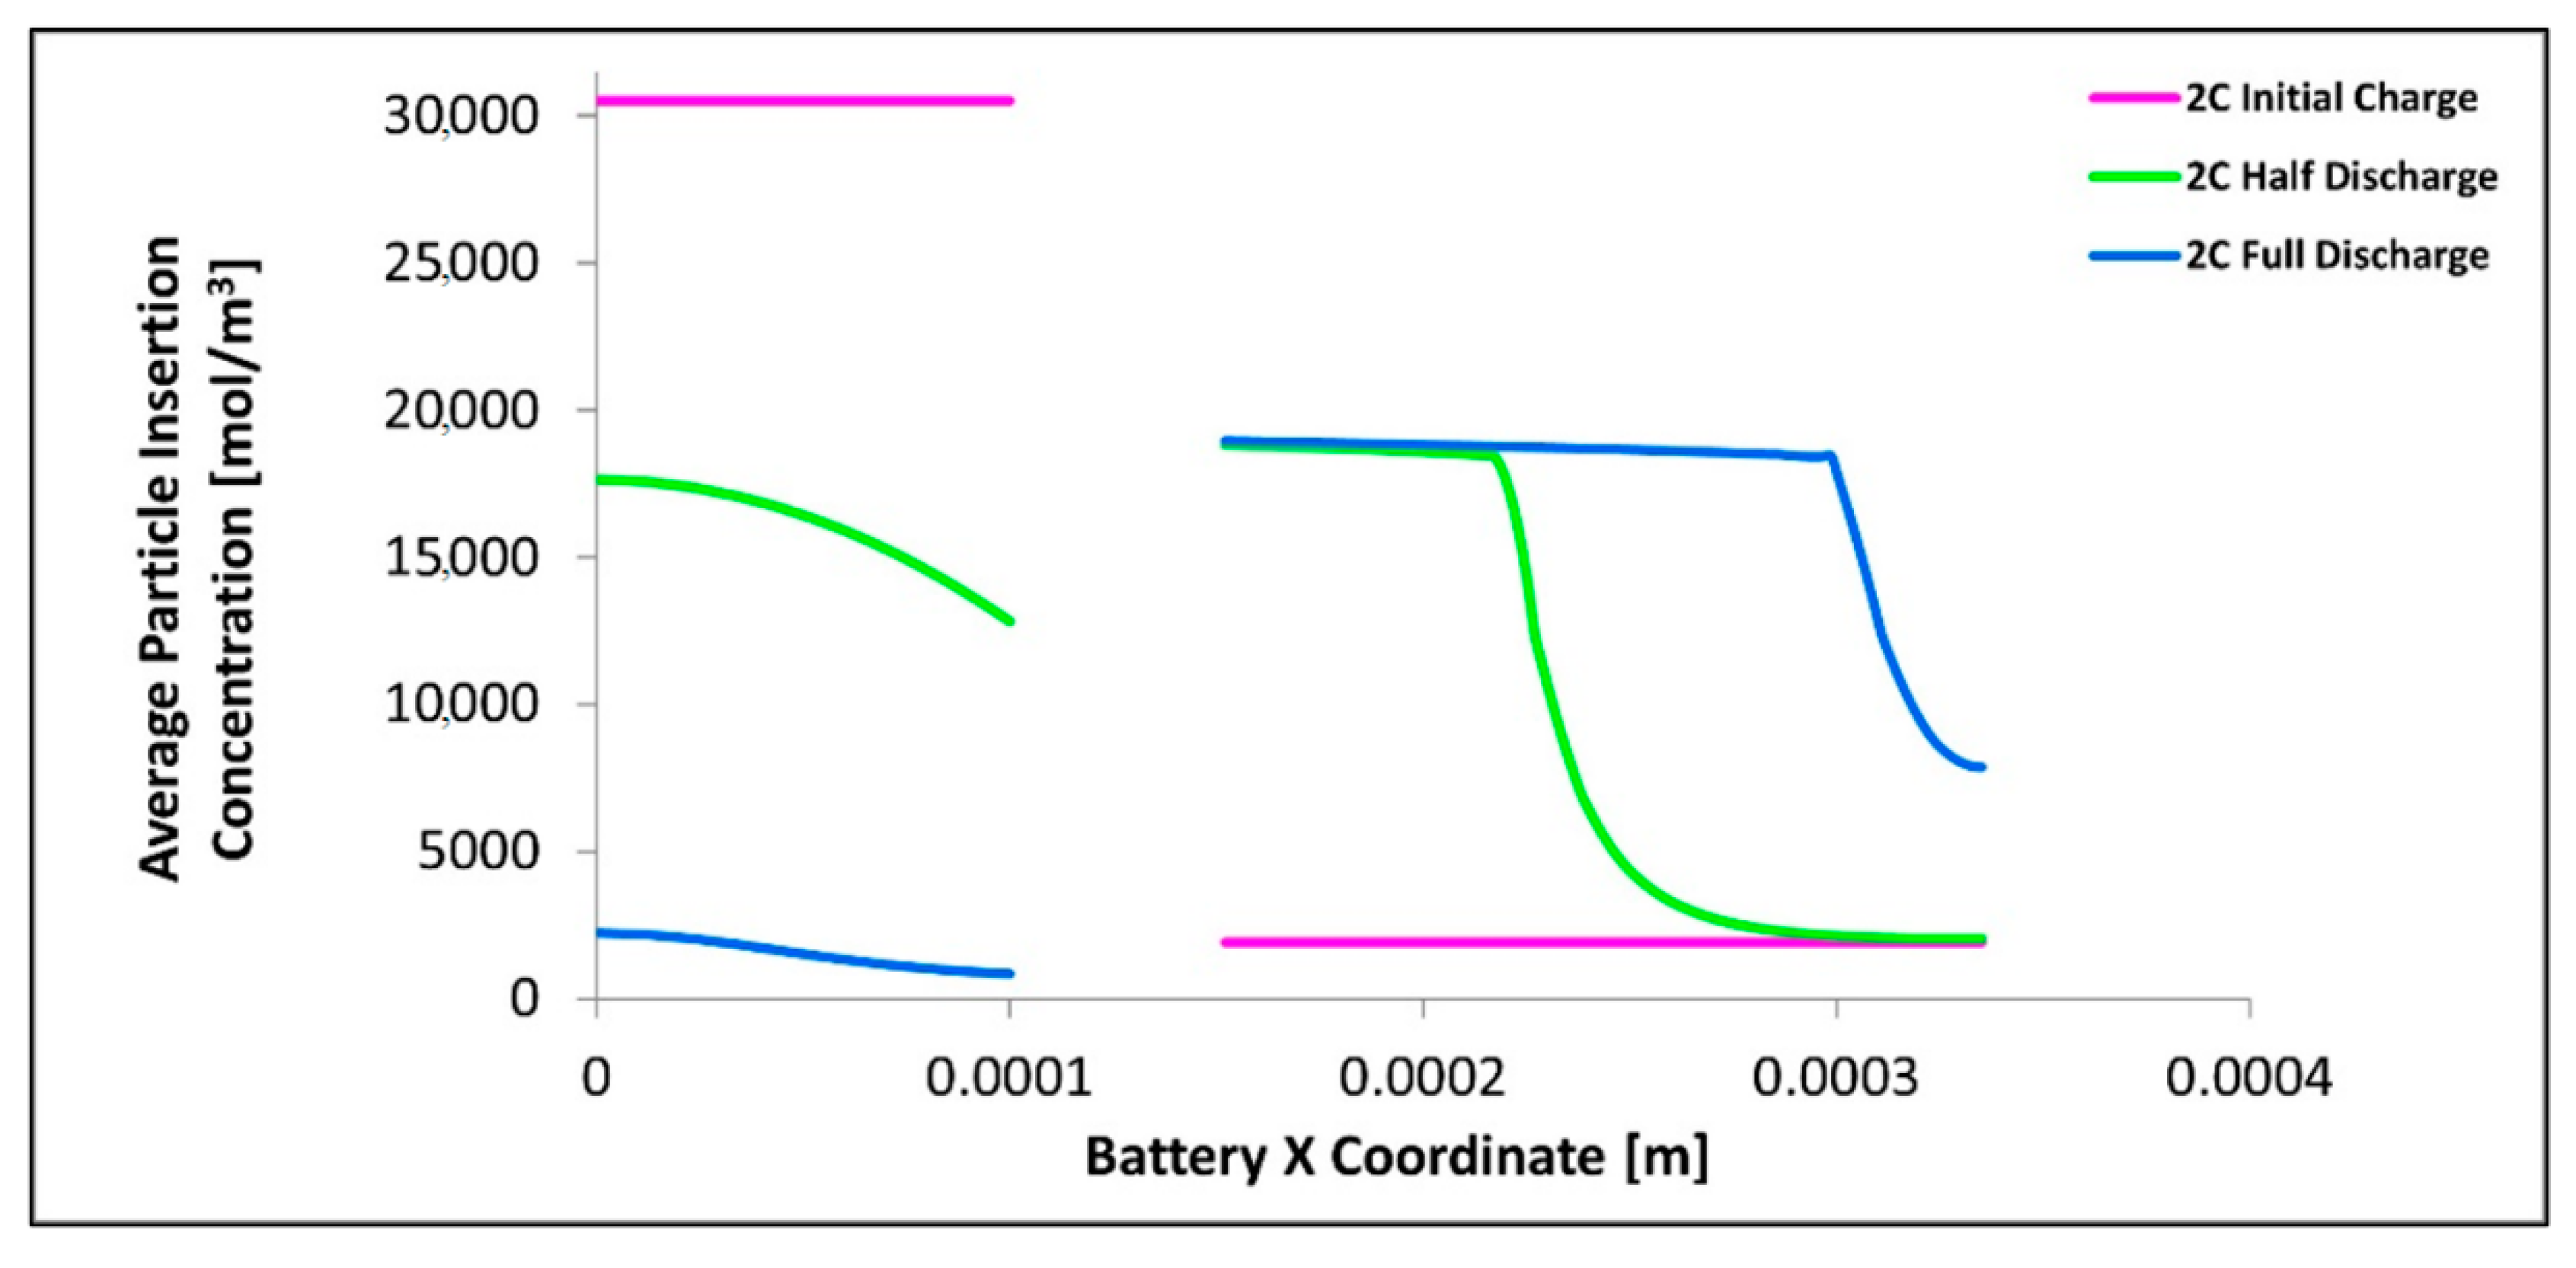
Figure 14 shows the lithium concentration in the electrodes as a function of position and time. We have noted that the results for 1C, 2C, and 3C C-rates are similar in shape and pattern and have been neglected for clarity, instead just the data for 2C is chosen and shown in Figure 14. As expected the average lithium concentration in the particles decreases with time in the anode and increases with time in the cathode. We noted that the average lithium particle concentration for the cathode is higher near the electrolyte-electrode interface and lower the deeper the position in the cathode porous electrode, this situation is reversed for the anode. We noted that for the cathode the average lithium concentration near the electrolyte surface is relatively constant from the halfway discharge to full discharge while the deeper layers do change in concentration. For the anode, we observed that even at the electrode-electrolyte interface there is still a change in concentration with time at the specified times. We note the plateau for the cathode at approximately 19,000 mol/m3 this is close to the maximum Lithium concentration in the positive electrode of 21,190 mol/m3. We also found that the presence of excess cathode material as the concentration within the cathode in the deeper layers is lower than the maximum at the end of discharge. This excess cathode material is one of the factors that contribute to the non-uniform concentration in the cathode. We also note that the cathode achieves close to full saturation (maximum intercalation concentrations) before intercalating into deeper layers and this is yet another contributor to the increased uniformity in the anode than the cathode. We note that the surface concentration is given by the PDE Equation (5) and that the diffusion coefficient in this temperature range is about 100 times larger for the anode than the cathode with the porosity of the anode also being larger, thus as expected the anode has a more uniform surface concentration due to the ease of intercalation into the electrode particles.
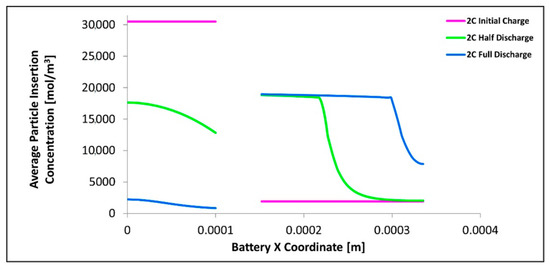
Figure 14.
Average insertion particle concentration as a function of x-position shown at 0s, 890s, and 1780s.
5. Conclusions
This paper presents a comparison between the experimental temperatures and electrochemical thermal model temperatures for a 20 Ah LiFePO4 prismatic battery cell at 1C, 2C, 3C, and 4C discharge rates. Some of the major conclusions that one can draw from this study are presented below:
- (i)
- The surface temperature of the battery increases with C-rate
- (ii)
- The thermocouple sensors closest to the electrodes provide higher temperatures than the centerline-thermocouple sensors
- (iii)
- The tab temperatures are always higher than the surface temperatures
- (iv)
- During discharge, the positive current collector temperature is always higher than the negative current collector for all the discharge rates
- (v)
- The primary source of heat in the battery is the electrolyte resistance
- (vi)
- The cathode produces more heat than the anode being about 7 times more at 1C and 2 times more at 2C and 3C
- (vii)
- The lithium insertion concentration is more uniform in the anode than in the cathode.
These results can provide physical insights for the design and thermal optimization of Li-ion batteries.
Author Contributions
Conceptualization, A.M. and M.F.; methodology, S.P., M.F., and R.F.; software, A.M. and M.-K.T.; formal analysis, A.M., S.P., and M.-K.T.; writing—original draft preparation, A.M. and S.P.; writing—review and editing, A.M., S.P., M.-K.T., M.F., and R.F.; visualization, A.M. and M.-K.T.; supervision, S.P., R.F., and M.F.; funding acquisition, R.F. and M.F. All authors have read and agreed to the published version of the manuscript.
Funding
This research received no external funding.
Acknowledgments
This work was supported by the Natural Sciences and Engineering Research Council of Canada (NSERC), Collaborative Research and Development Grant, CRDPJ 537104-18, and University of Waterloo, Chemical Engineering Department, Canada Research Chair Tier I—Zero-Emission Vehicles and Hydrogen Energy Systems Grant number: 950-232215.
Conflicts of Interest
The authors declare no conflict of interest.
Nomenclature
| solid/electrolyte interfacial area per unit volume or active surface area per electrode unit volume for electron transfer reactions [1/cm] | |
| A | area [m2] |
| specific heat capacity [J/kg°C] | |
| specific heat for positive tab [J/kg-K] | |
| specific heat for negative tab [J/kg-K] | |
| specific heat for active zone [J/kg-K] | |
| Electrolyte salt concentration [mol/m3] | |
| concentration of lithium in solid phase [mol/m3] | |
| electrolyte reference concentration [mol/m3] | |
| maximum solid Li+ Concentration for positive electrode [mol/m3] | |
| maximum solid Li+ Concentration for negative electrode [mol/m3] | |
| diffusivity of the electrolyte [m2/s] | |
| intercalation diffusivity [m2/s] | |
| reference diffusivity for positive electrode [m2/s] | |
| reference diffusivity for negative electrode [m2/s] | |
| reference solid diffusion coefficient | |
| effective diffusion coefficient | |
| voltage drop across film resistance [V] | |
| electrode potential of the reaction or thermodynamic open circuit potential[V] | |
| molecular activity coefficient of the electrolyte also called electrolyte activity coefficient | |
| F | Faraday‘s constant [96,485 coulomb/mol] |
| exchange current density [A/m2] | |
| I | current [A] |
| current density due to diffusion in the electrolyte [A/m2] | |
| electrolyte current density [A/m2] | |
| local current density [A/m2] | |
| electrode current density in the solid electrode [A/m2] | |
| total interface current density [A/m2] | |
| electrode reaction source [A/m3] | |
| volumetric current from diffusion in the electrolyte [A/m3] | |
| electrode reaction source [A/m3] | |
| j | current density [A/m2] |
| the flux of lithium ions [mol/ m2s] | |
| length of negative electrode [µm] | |
| length of separator [µm] | |
| length of the positive electrode [µm] | |
| overall length ( in [µm] | |
| number of electrons | |
| heat generation rate [W] | |
| electrolyte current source [A/m3] | |
| electrode current source [A/m3] | |
| radial coordinate along active material particle | |
| R | resistance [Ω] |
| Rfilm | Film resistance [Ωm2] |
| universal gas constant [8.3143 kJ/kg mole. K] | |
| volumetric generation rate of lithium [mol/m3s] | |
| radius of solid active material particle [µm] | |
| particle radius for positive electrode [µm] | |
| particle radius for negative electrode [µm] | |
| T | temperature [°C or K] |
| transfer number of lithium-ion | |
| T | time [s] |
| V | cell voltage or cell potential [V] |
| Greek Symbols | |
| A | thermal diffusivity [m2/s] |
| energy dissipation rate | |
| Β | Burggeman porosity exponent |
| density [kg/m3] | |
| gradient operator | |
| solid phase potential [V] | |
| electrolyte phase potential [V] | |
| electrolyte conductivity [S/m] | |
| effective electrolyte conductivity in the porous electrode [S/m] | |
| effective electrical conductivity for positive tab [S/m] | |
| effective electrical conductivity for negative tab [S/m] | |
| stoichiometric coefficient for lithium metal | |
| stoichiometric coefficient for lithium ion | |
| volume fraction of electrolyte phase in electrode | |
| volume fraction of solid particle (active material) in electrode | |
| volume fraction of filler material in electrode | |
| ionic conductivity of the electrolyte [S/m] | |
| diffusional conductivity of the electrolyte [S/m] | |
| transfer coefficient of anode | |
| transfer coefficient of the cathode | |
| Subscripts | |
| ∞ | Ambient |
| 0 | Initial |
| A | Anode |
| c | Cathode |
| E | electrolyte |
| F | Filler |
| exp | Experimental |
| N | negative electrode |
| oc | open circuit |
| P | positive electrode |
| ref | Reference |
| S | Separator |
| sim | Simulated |
| tot | Total |
| x,y,z | Cartesian coordinate directions |
| ° | Degree |
| Li | Lithium |
| effective | |
| ECH | Electrochemical heat |
| Acronyms | |
| ANSYS Inc. | American Computer-aided engineering software developer |
| BC | Boundary condition |
| BTMS | Battery thermal management system |
| C | Capacity |
| CC | Constant-current |
| CV | Constant-voltage |
| CFD | Computational fluid dynamics |
| COMSOL | A cross-platform finite element analysis, solver and multiphysics simulation software |
| ECT | Electrochemical thermal |
| ECM | Equivalent circuit-based modeling |
| EV | Electric vehicle |
| FEM | Finite element method |
| HEV | Hybrid electric vehicle |
| IR | Infra-red |
| ICE | Internal combustion engine |
| Li-ion | Lithium-ion |
| LIB | Lithium-ion battery |
| LiFePO4 | Lithium iron phosphate |
| LFP | Lithium phosphate |
| LPM | Lumped parameter model |
| LPV | Linear parameter varying |
| LabVIEW | Laboratory virtual instrument engineering workbench |
| NI | National Instrument |
| OCV/OCP | Open circuit voltage/Open circuit potential |
| PC | Personal computer |
| P2D | Pseudo two dimensional |
| PDE | Partial differential equation |
| PHEV | Plug-in hybrid electric vehicle |
| SOC | State of charge |
| TC | Thermocouple |
| 1D | one-dimensional |
| 2D | two-dimensional |
| 3D | three-dimensional |
References
- Tran, M.-K.; Sherman, S.; Samadani, E.; Vrolyk, R.; Wong, D.; Lowery, M.; Fowler, M. Environmental and Economic Benefits of a Battery Electric Vehicle Powertrain with a Zinc–Air Range Extender in the Transition to Electric Vehicles. Vehicles 2020, 2, 398–412. [Google Scholar] [CrossRef]
- Panchal, S.; Gudlanarva, K.; Tran, M.-K.; Fraser, R.; Fowler, M. High Reynold’s Number Turbulent Model for Micro-Channel Cold Plate Using Reverse Engineering Approach for Water-Cooled Battery in Electric Vehicles. Energies 2020, 13, 1638. [Google Scholar] [CrossRef]
- Tran, M.-K.; Fowler, M. Sensor Fault Detection and Isolation for Degrading Lithium-Ion Batteries in Electric Vehicles Using Parameter Estimation with Recursive Least Squares. Batteries 2020, 6, 1. [Google Scholar] [CrossRef]
- Ye, Y.; Saw, L.H.; Shi, Y.; Tay, A.A. Numerical analyses on optimizing a heat pipe thermal management system for lithium-ion batteries during fast charging. Appl. Therm. Eng. 2015, 86, 281–291. [Google Scholar] [CrossRef]
- Tran, M.-K.; Fowler, M. A Review of Lithium-Ion Battery Fault Diagnostic Algorithms: Current Progress and Future Challenges. Algorithms 2020, 13, 62. [Google Scholar] [CrossRef]
- Wang, Q.; Jiang, B.; Li, B.; Yan, Y. A critical review of thermal management models and solutions of lithium-ion batteries for the development of pure electric vehicles. Renew. Sust. Energy Rev. 2016, 64, 106–128. [Google Scholar] [CrossRef]
- Mendoza, S. Lithium Ion Battery Thermal Modeling; Penn State University: State College, PA, USA, 2013. [Google Scholar]
- Waldmann, T.; Wilka, M.; Kasper, M.; Fleischhammer, M.; Wohlfahrt-Mehrens, M. Temperature Dependent Ageing Mechanisms in Lithium-ion Batteries—A Post-Mortem Study. J. Power Sources 2014, 262, 129–135. [Google Scholar] [CrossRef]
- Panchal, S.; Dincer, I.; Agelin-Chaab, M.; Fraser, R.; Fowler, M. Experimental and simulated temperature variations in a LiFePO 4–20Ah battery during discharge process. Appl. Energy 2016, 180, 504–515. [Google Scholar] [CrossRef]
- Heubner, C.; Schneider, M.; Michaelis, A. Detailed study of heat generation in porous LiCoO2 electrodes. J. Power Sources 2016, 307, 199–207. [Google Scholar] [CrossRef]
- Tran, M.-K.; Mevawala, A.; Panchal, S.; Raahemifar, K.; Fowler, M.; Fraser, R. Effect of integrating the hysteresis component to the equivalent circuit model of Lithium-ion battery for dynamic and non-dynamic applications. J. Energy Storage 2020, 32, 101785. [Google Scholar] [CrossRef]
- Alaoui, C. Solid-State Thermal Management for Lithium-Ion EV Batteries. IEEE Trans. Veh. Technol. 2013, 62, 98–107. [Google Scholar] [CrossRef]
- Bandhauer, T.M.; Garimella, S.; Fuller, T.F. A Critical Review of Thermal Issues in Lithium-Ion Batteries. J. Electrochem. Soc. 2011, 158, R1–R25. [Google Scholar] [CrossRef]
- Patil, M.S.; Panchal, S.; Kim, N.; Lee, M.Y. Cooling Performance Characteristics of 20 Ah Lithium-Ion Pouch Cell with Cold Plates along Both Surfaces. Energies 2018, 11, 2550. [Google Scholar] [CrossRef]
- Chalise, D.; Shah, K.; Prasher, R.; Jain, A. Conjugate Heat Transfer Analysis of Thermal Management of a Li-Ion Battery Pack. J. Electrochem. Energy Convers. Storage 2018, 15, 1–8. [Google Scholar] [CrossRef]
- Shah, K.; Drake, S.J.; Wetz, D.A.; Ostanek, J.K.; Miller, S.P.; Heinzel, J.M.; Jain, A. Modeling of steady-state convective cooling of cylindrical Li-ion cells. J. Power Sources 2014, 258, 374–381. [Google Scholar] [CrossRef]
- An, Z.; Shah, K.; Jia, L.; Ma, Y. Modeling and analysis of thermal runaway in Li-ion cell. Appl. Therm. Eng. 2019, 160, 113960. [Google Scholar] [CrossRef]
- Panchal, S.; Dincer, I.; Agelin-Chaab, M.; Fraser, R.; Fowler, M. Transient electrochemical heat transfer modeling and experimental validation of a large sized LiFePO4/graphite battery. Int. J. Heat Mass Transf. 2017, 109, 1239–1251. [Google Scholar] [CrossRef]
- Lai, Y.; Du, S.; Ai, L.; Ai, L.; Cheng, Y.; Tang, Y.; Jia, M. Insight into heat generation of lithium ion batteries based on the electrochemical-thermal model at high discharge rates. Int. J. Hydrogen Energy 2015, 40, 3039–3049. [Google Scholar] [CrossRef]
- Yang, N.; Zhang, X.; Li, G.; Hua, D. Assessment of the forced air-cooling performance for cylindrical lithium-ion battery packs: A comparative analysis between aligned and staggered cell arrangements. Appl. Therm. Eng. 2015, 80, 55–65. [Google Scholar] [CrossRef]
- Li, G.; Li, S. Physics-Based CFD Simulation of Lithium-ion Battery under the FUDS Driving Cycle. ECS Trans. 2015, 64, 1–14. [Google Scholar] [CrossRef]
- Huo, Y.; Rao, Z.; Liu, X.; Zhao, J. Investigation of power battery thermal management by using mini-channel cold plate. Energy Convers. Manag. 2015, 89, 387–395. [Google Scholar] [CrossRef]
- Xu, M.; Zhang, Z.; Wang, X.; Jia, L.; Yang, L. A pseudo three-dimensional electrochemicalethermal model of a prismatic LiFePO4 battery during discharge process. Energy 2015, 80, 303–317. [Google Scholar] [CrossRef]
- Huo, W.; He, H.; Sun, F. Electrochemical–thermal modeling for a ternary lithium ion battery during discharging and driving cycle testing. RSC Adv. 2015, 71, 57599–57607. [Google Scholar] [CrossRef]
- Fotouhi, A.; Auger, D.J.; Propp, K.; Longo, S.; Wild, M. A review on electric vehicle battery modelling: From Lithium-ion toward Lithium–Sulphur. Renew. Sustain. Energy Rev. 2016, 56, 1008–1021. [Google Scholar] [CrossRef]
- Majdabadi, M.M.; Farhad, S.; Farkhondeh, M.; Fraser, R.A.; Fowler, M. Simplified electrochemical multi-particle model for LiFePO4 cathodes in lithium-ion batteries. J. Power Sources 2015, 275, 633–643. [Google Scholar] [CrossRef]
- Fang, W.; Kwon, O.J.; Wang, C.Y. Electrochemical–thermal modeling of automotive Li-ion batteries and experimental validation using a three-electrode cell. Int. J. Energy Res. 2009, 34, 107–115. [Google Scholar] [CrossRef]
Publisher’s Note: MDPI stays neutral with regard to jurisdictional claims in published maps and institutional affiliations. |
© 2020 by the authors. Licensee MDPI, Basel, Switzerland. This article is an open access article distributed under the terms and conditions of the Creative Commons Attribution (CC BY) license (http://creativecommons.org/licenses/by/4.0/).

