Article

Design and Implementation of an Electrolyte Temperature Control System for AgO-Al Batteries

School of Mechanical and Materials Engineering, North China University of Technology, Beijing 100144, China
*
Author to whom correspondence should be addressed.
Batteries 2025, 11(7), 244; https://doi.org/10.3390/batteries11070244
Submission received: 30 April 2025 / Revised: 14 June 2025 / Accepted: 20 June 2025 / Published: 24 June 2025

Abstract

AgO-Al batteries generate substantial heat during discharge, and inadequate heat dissipation can degrade battery performance and pose thermal runaway risks. To meet thermal control requirements for experimental scenarios, a feedback-controlled thermal management system was developed. Computational fluid dynamics was employed to analyze the effects of seawater flow rate, seawater temperature, electrolyte flow rate, and initial electrolyte temperature on electrolyte outlet temperature and heat dissipation capacity. Results indicate that heat dissipation capacity is negatively correlated with seawater temperature and positively correlated with electrolyte inlet temperature. It increases with higher seawater and electrolyte flow rates, though the increase becomes negligible when the seawater flow rate exceeds 10 m/s. The designed system adapts to dynamic operating conditions via real-time parameter tuning. Experimental validation confirms its effectiveness in regulating electrolyte outlet temperature, achieving steady-state control accuracy within ±3 °C and a dynamic response time of less than 7 min—meeting thermal management requirements for battery test benches. This study provides critical data and technical support for developing temperature control technologies and performance testing of seawater-activated batteries.

1. Introduction

AgO-Al batteries serve as critical power sources for unmanned underwater vehicles (UUVs) [1,2,3], with their discharge performance inherently linked to operational parameters [4]. Seawater temperature, salinity, and flow velocity exert significant influences on battery performance [5,6]. The marine operational environment for underwater equipment is characterized by complexity and variability [7]: in the equatorial western Pacific, seawater temperatures range from 29 to 30 °C, whereas the eastern Pacific typically exhibits temperatures between 23 and 30 °C [8,9]. At depths of 1000 m, water temperatures stabilize at approximately 4–5 °C [10]. UUVs’ velocities vary extensively, reaching maximum speeds of up to 50 knots [11], resulting in substantial fluctuations in the inlet/outlet fluid flow rates and temperatures of AgO-Al batteries [12,13]. The speed directly affects the convective heat transfer efficiency between the case and seawater, and it also determines the seawater flow rate at the inlet of the heat exchanger of the power reactor. These dynamic conditions render the electrochemical behavior of AgO-Al batteries highly complex under real-world service scenarios. Importantly, once activated, these batteries cannot be terminated prematurely and must undergo complete discharge [14]. To thoroughly investigate the impacts of these discharge conditions on battery performance [15] and ensure compliance with equipment requirements in complex marine environments, the development of a discharge condition simulation device for AgO-Al batteries is imperative. Such a device provides a standardized test platform for battery research and development, facilitating the evaluation of their practical performance metrics.
During the discharge process, AgO-Al batteries generate considerable thermal energy: a portion of this heat is utilized to maintain the optimal temperature for electrochemical reactions, while the residual heat is dissipated as waste through heat exchangers into the surrounding seawater [16,17,18]. The reaction temperature is a critical parameter affecting the stable navigation of UUVs. The electrochemical reactions within AgO-Al batteries exhibit an optimal operating temperature around 80 °C [19]. When the temperature drops below a critical threshold, electrical performance deteriorates significantly, failing to meet power demands; conversely, exceeding an upper threshold introduces risks of thermal runaway, potentially leading to battery combustion and safety hazards [20]. Consequently, the development of a temperature control system is essential to establish a regulated heat dissipation environment for AgO-Al batteries, ensuring precise control over their reaction temperatures [21].
AgO-Al batteries are primarily composed of a positive plate, a negative plate, and an electrolyte. The electrolyte in these batteries serves as an ionic conductive medium for charge transfer, participates in the electrochemical reactions at both the positive and negative electrodes, and regulates internal heat distribution. The electrolyte in AgO-Al batteries is typically a seawater-based solution containing dissolved sodium hydroxide or potassium hydroxide. The simplified heat transfer model of the UUV AgO-Al battery compartment is shown in Figure 1, showing that the area where the battery case contacts the electrolyte is divided into two sections [22]: one involves uncontrollable forced convective heat transfer between the electrolyte and case, with heat dissipation rates determined by inherent fluid dynamics and unmodifiable due to fixed structural constraints; the other allows controlled heat transfer through a temperature-control valve that regulates the relative flow velocity of the electrolyte within the case. The controllable section consists of cooling channels between the electrode stack and battery housing, through which the electrolyte flows from the front compartment to the rear compartment under pressure before recirculating to the stack inlet via reflux apertures on the stack. By adjusting the opening of the valve port at the reactor inlet, the flow rate through these controllable channels is precisely modulated, enabling real-time control of heat exchange power to meet the required temperature conditions.
Existing temperature control studies have predominantly focused on lithium batteries. For example, Liu et al. [23] developed a thermoelectric–liquid cooling hybrid system using a fuzzy PID algorithm, experimentally demonstrating its ability to reduce thermal runaway battery temperatures from 63.5 °C to 25 °C within 280 s. Wang et al. [24] proposed a CPCM-WMCP hybrid system for extreme heat flux conditions of 1.1 MW/m2, controlling maximum temperature within 139.85 °C and delaying thermal runaway by up to 650 s while improving flow and temperature uniformity (25% and 1.6 °C, respectively). Yue et al. [25] innovatively integrated micro heat pipes, air cooling, and intelligent water spraying, reducing maximum temperature by 7.9 °C to 29.6 °C under 3C discharge compared to pure air cooling. In contrast, thermal management research for AgO-Al batteries remains in its infancy, with no targeted temperature control solutions currently available. The AgO-Al system faces unique technical challenges arising from its high-energy discharge characteristics and electrolyte-dependent thermodynamic mechanisms, necessitating dedicated research to address heat dissipation and temperature regulation under its specific operational conditions.
Computational fluid dynamics (CFD) has been widely applied in the design and optimization of hydrodynamic and heat transfer structures [26,27,28]. In this study, CFD technology is innovatively integrated with the unique thermal management requirements of AgO-Al batteries. A numerical model of the electrolyte heat dissipation channel was developed using Fluent 2022 R1 software to simulate the coupled temperature and flow velocity fields of the electrolyte within the heat dissipation channels. Unlike traditional thermal management studies of lithium-ion batteries, this work introduces dynamic boundary conditions related to the navigational speed of underwater vehicles, systematically revealing the variation patterns of heat dissipation power under the influence of parameters such as seawater flow rate, seawater temperature, initial electrolyte temperature, and electrolyte flow rate. The developed electrolyte temperature control system for AgO-Al batteries utilizes a PID-based dynamic parameter adaptive regulation strategy, enabling responsive control of the electrolyte outlet temperature through real-time adjustments of operational parameters. Through the deep integration of CFD simulation and intelligent control strategies, this study addresses the technical challenges of electrolyte temperature control in AgO-Al batteries and provides technical support for their efficient discharge under experimental conditions.

2. Materials and Methods

2.1. Model Building

AgO-Al batteries generate substantial heat during discharge. However, the epoxy resin board used as the battery’s base material exhibits low thermal conductivity (0.5 W/m·K), resulting in inefficient heat dissipation through the casing. Consequently, most of the generated heat must be dissipated via the electrolyte. To address this, the cooling structure of the AgO-Al battery employs a sandwich configuration interposed between the inner surface of the battery casing and the core. This structure is typically designed as a spiral flow channel to enhance fluid flow coverage and heat transfer efficiency [17].
When a UUV operates submerged in water, the battery casing comes into contact with seawater. Since the temperature of the electrolyte within the battery exceeds that of the surrounding seawater, the heat from inside the battery is released to the external seawater via the battery casing. The entire heat transfer process is illustrated in Figure 2. Here, the heat produced by the battery core is conveyed to the electrolyte through convective heat exchange. Subsequently, the heat is transmitted to the inner surface of the casing via the cooling runner. The inner surface of the casing then conducts heat to the outer surface, which in turn transfers heat to the seawater by convective means.
A heat dissipation model is developed using CFD to further investigate the various factors influencing battery heat dissipation. This model analyzes the effects of seawater flow rate (simulating the speed of UUVs), seawater temperature, electrolyte flow rate, and the initial temperature of the electrolyte on the battery’s heat dissipation capacity. For computational simplicity, the model is streamlined, and the computational model is depicted in Figure 3. While sailing, the UUVs are in direct contact with seawater through the inner casing. In practical applications, an outer casing is added to conserve space and enhance structural integrity. The outer casing has an inner diameter of 156 mm, a thickness of 8 mm, and a length of 600 mm. The seawater channel thickness is 8 mm, and the battery sleeve measures 350 mm in length. The inner casing features an outer diameter of 140 mm and a thickness of 3 mm. The spiral flow channel incorporates ribs with a height of 5 mm and width of 20 mm. The channel design employs a double-inlet, double-outlet configuration with co-located inlet/outlet ports on the same side, each with a diameter of 20 mm, and a spiral head count of 2.
Based on mass conservation, momentum conservation equations, and energy conservation equation within the Navier–Stokes (N-S) equations, this study conducts numerical simulations of problems related to the thermal management system of AgO-Al batteries.
The mass conservation control equation is as follows:
ρ t + ( ρ u ) x + ρ v y + ρ w z = 0
In Equation (1), ρ represents the fluid density, t denotes time, and u, v, and w are the velocity components of the fluid in the x, y, and z directions, respectively.
The momentum conservation control equation is presented as
ρ u i t + ρ u i u j x j = p x i + τ i j x j + ρ g i + F i
τ i j = u u i x j + u j x i 2 3 u u j x i δ i j
In Equations (2) and (3), p denotes the pressure acting on the fluid, τij represents the viscous shear stress components of the fluid, and Fi indicates the volume force components acting on the fluid.
The energy conservation equation is presented as
ρ c p T t + ρ c p u j T x j = x j μ λ c p T P r x j + w s Q s
In Equation (4), cp is the specific heat capacity, T is the temperature, Pr is the Prandtl number, and wsQs denotes other forms of imported energy.
Subsequently, to determine the viscosity model, the Reynolds number (Re) is calculated. The hydraulic diameter is used to compute the Reynolds number, expressed as
R e = ρ V L μ
In Equation (5), Re is the Reynolds number, V is the flow velocity, L is the equivalent diameter, and μ is the dynamic viscosity.
Using Equation (5), the Re at the model inlet is calculated. The critical Reynolds number, Rec, typically selected for engineering applications, is 2300. Since Re > Rec, this study opts for the turbulence model.

2.2. Boundary Condition

Physical parameters are listed in Table 1. The electrolyte and seawater inlets were set as velocity-inlet boundaries, while their outlets were defined as pressure-outlet boundaries with an ambient pressure of 0 Pa. Thermodynamic boundary conditions at all fluid–solid interfaces were specified as coupled heat transfer. The SIMPLE algorithm was employed for pressure–velocity coupling. For discretization, a second-order upwind scheme was used for pressure, momentum, and energy equations; turbulent kinetic energy and turbulent dissipation rate were solved with second-order upwind differences. All relaxation factors were retained at Fluent’s default values.
The standard k-ε turbulence model was employed, with the energy equation enabled. Calculations estimate a turbulence intensity of 4.9% and a turbulent viscosity ratio of 150 in the internal fluid domain; in the external domain, these parameters are estimated as 3.2% and 600, respectively. A standard wall function was utilized to model near-wall turbulence. Convergence criteria were set as a residual of 10−6 for the energy equation and 10−3 for all other equations. Heat transfer at the thermoset interface exhibits “coupled” characteristics, with the outer shell wall surface heat transfer coefficient set at 5 W/m2 and the ambient temperature maintained at 22 °C. The electrolyte utilized in this study is a 4 mol/L NaOH solution.

2.3. Grid Delineation and Independence Verification

The cooling structure simulation model incorporates three domains: internal electrolyte fluid, solid battery casing, and external seawater. The AgO-Al battery was first 3D-modeled in SolidWorks(v2023), and the parametric geometry was imported into Ansys Fluent. Fluid domains—including electrolyte channels and external cooling regions—were extracted via Boolean operations. A polyhedral mesh was applied for discretization, with domain boundaries and flow paths visualized in Figure 4.
To ensure grid independence and optimize computational efficiency, a grid independence verification was conducted. Four models with grid counts of 0.5 million, 1.05 million, 1.72 million, and 2.48 million were established and solved. To enhance simulation accuracy, boundary layer meshes were applied at fluid–solid interfaces, and grid refinement was performed in critical regions, including the electrochemical reaction zone and electrolyte inlet/outlet areas. The electrolyte inlet conditions were set as follows: temperature was set at 95 °C, flow rate was 2.4 m3/h; seawater parameters included a flow velocity of 1 m per second and a temperature of 22 °C. The average temperature at the electrolyte outlet was monitored, as depicted in Figure 5. Results indicated that once the grid count exceeded 1.05 million, further increases in grid count had negligible effects on the cross-sectional average temperature. Balancing computational efficiency and accuracy, the 1.05-million-grid model was selected for subsequent calculations.

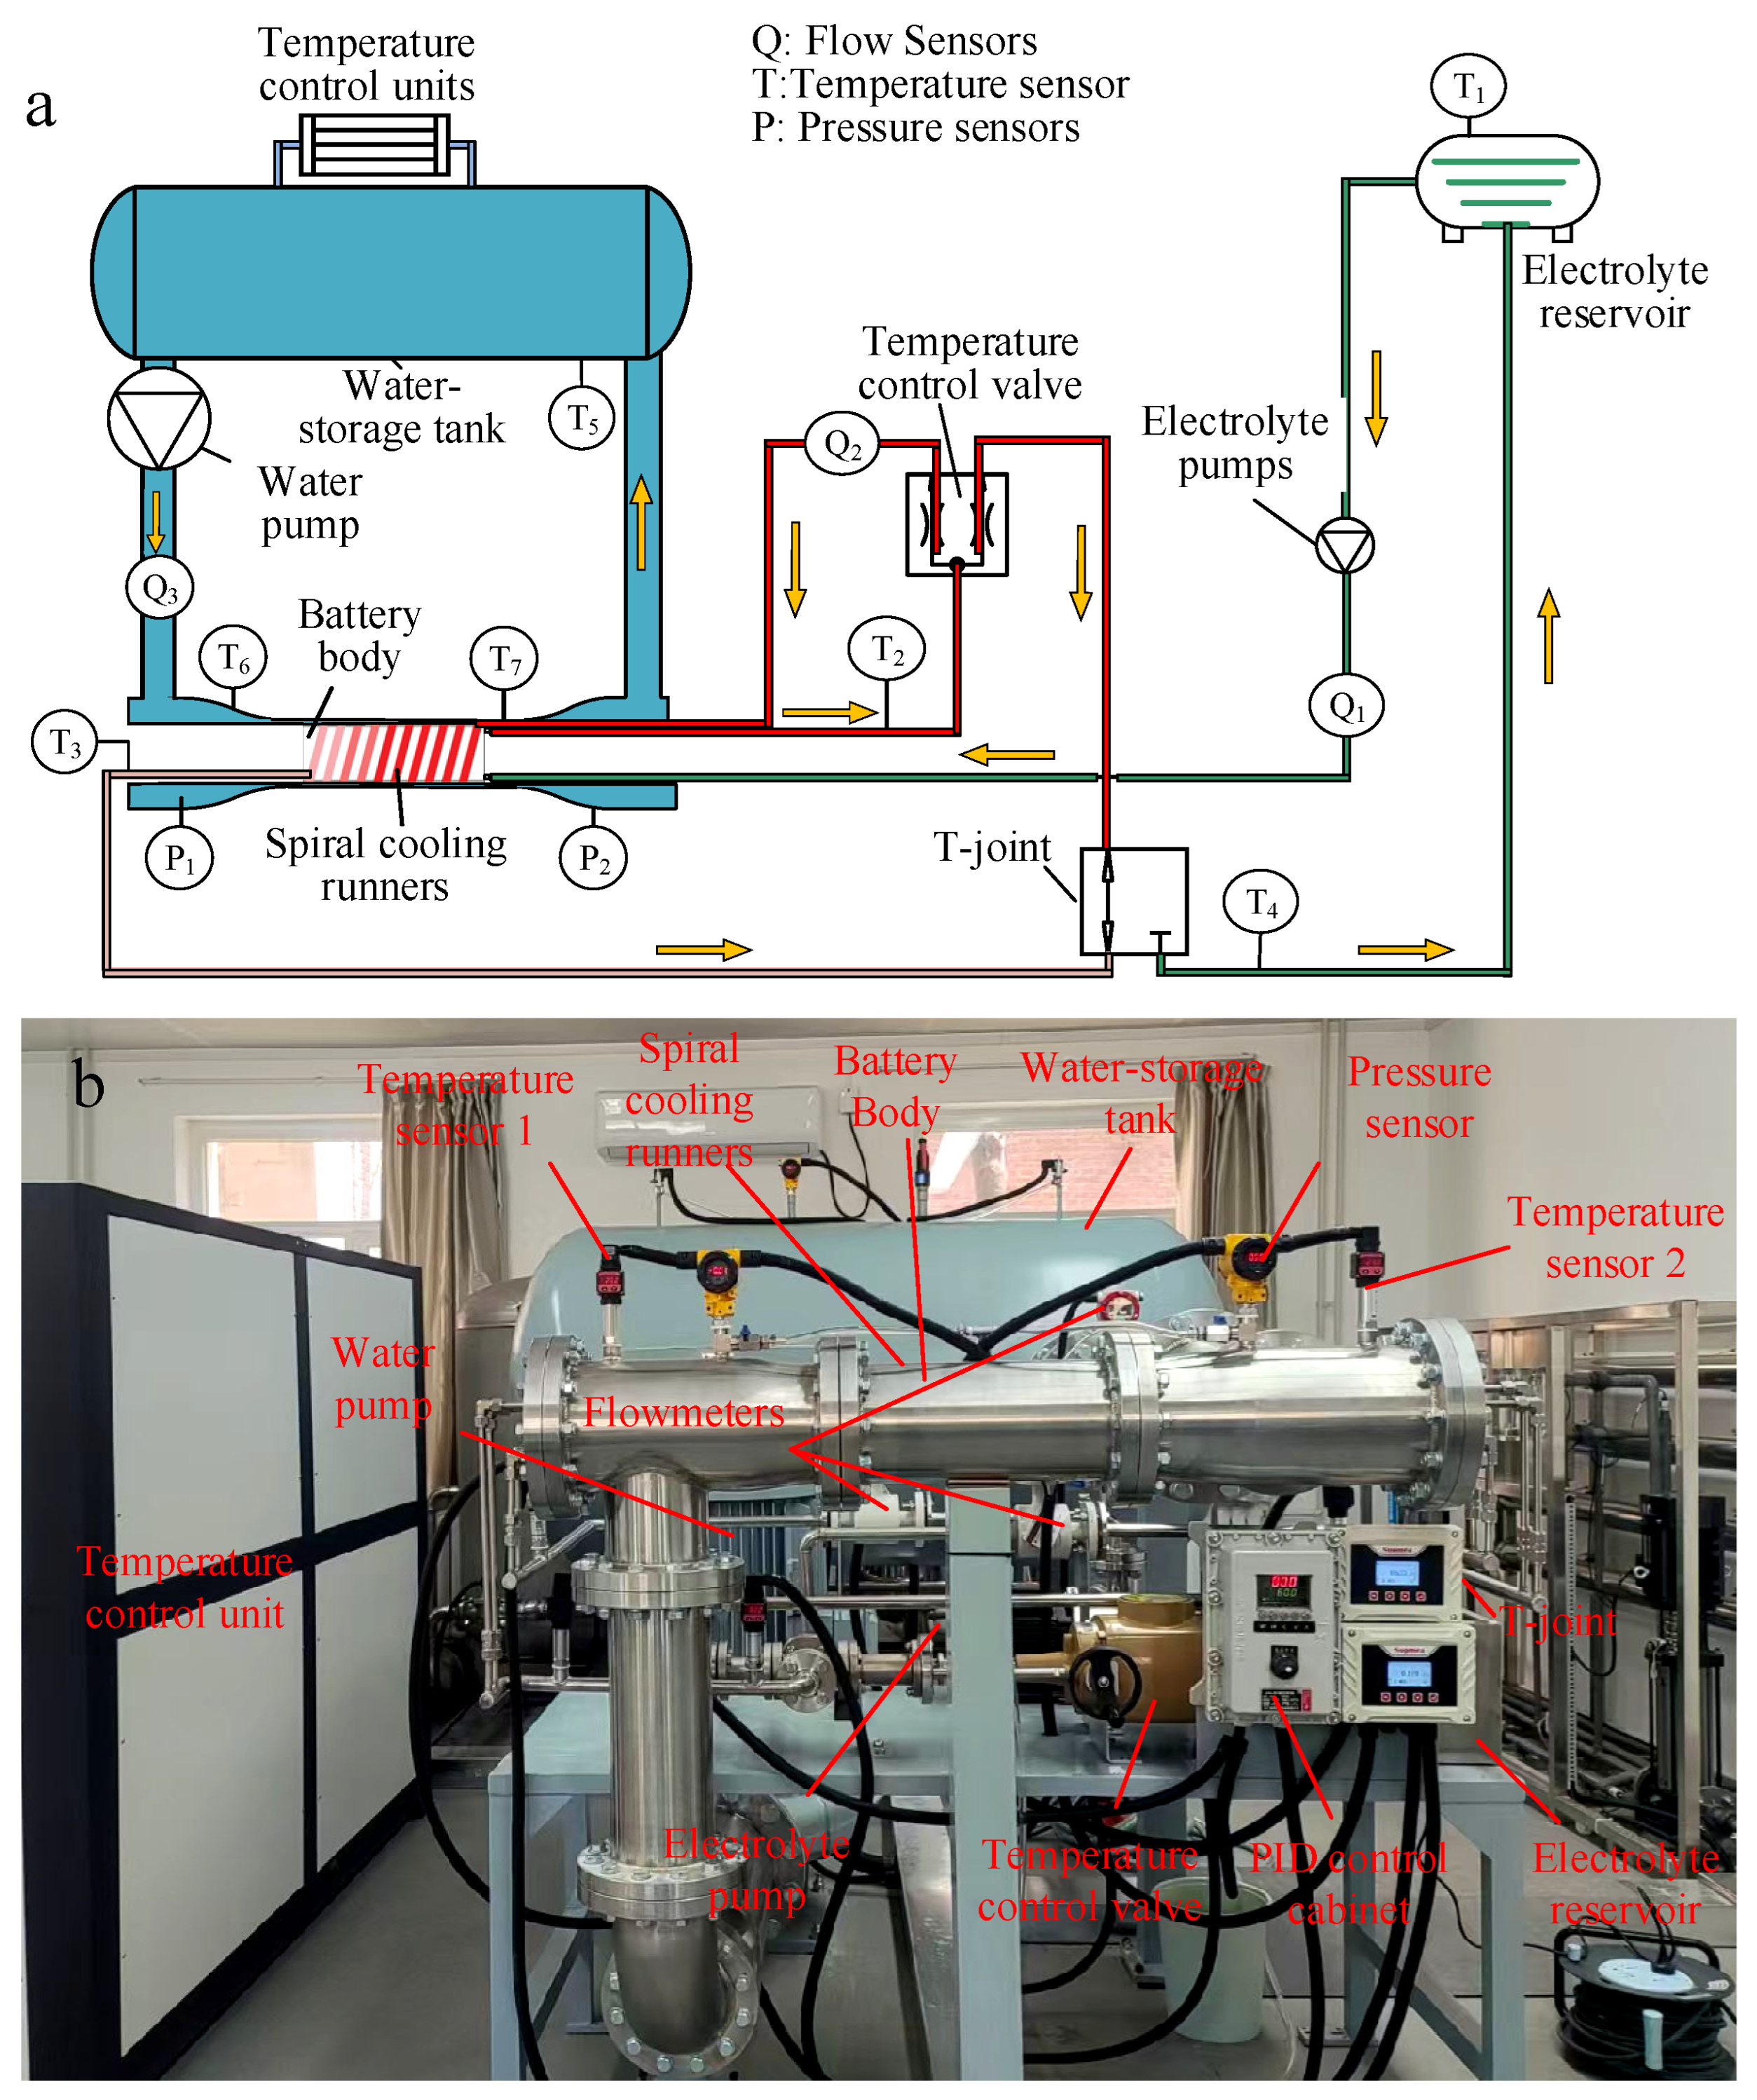
2.4. Experimental Validation

To validate the model’s accuracy, a simplified experimental setup was designed to measure the outlet temperature of the spiral cooling channel under varying seawater flow rates. Using water as the fluid medium, the experiment adopted an electrolyte flow rate of 2.4 m3/h [29], an electrolyte inlet temperature of 80 °C, and an ambient temperature of 22 °C. The spiral cooling channel was constructed from aluminum alloy, with stainless steel pipelines used for fluid conveyance. The experimental principle, illustrated in Figure 6, involved pumping water from a thermostatic tank into the pipeline system, where it traversed the spiral cooling channel designed to facilitate heat exchange with the external environment during flow.
Two temperature sensors were integrated into the system: sensor 1 measured the inlet water temperature before it entered the spiral channel, and sensor 2 recorded the outlet water temperature at the channel’s exit. A flow meter was installed to monitor the water flow rate in real time. By systematically varying seawater flow rates at 2 m/s, 5 m/s, 10 m/s, 15 m/s, and 25 m/s, we continuously monitored electrolyte outlet temperature and generated corresponding temperature–flow rate curves for model validation. To enhance the credibility of the data, this study performed three independent replicate tests under each set of experimental conditions, and the average of the three measurements was taken as the ultimate experimental data.
Experimental and simulation results were compared, as depicted in Figure 7. Close agreement exists between the measured and simulated electrolyte outlet temperatures, with minimal deviation across all tested conditions. Under the 15 m/s seawater flow rate condition, the experimental electrolyte outlet temperature was 60.5 °C, while the simulation predicted 62.73 °C—a temperature difference of 2.2 °C. This condition exhibited the maximum discrepancy between the two datasets, with a relative error of 3.69%. Despite this being the largest deviation, the error remains within an acceptable range, confirming the model’s reliability in predicting electrolyte outlet temperatures under varying operational scenarios.

3. Analysis and Discussion

Simulations were performed across diverse operational conditions to investigate variations in electrolyte outlet temperature and calculate heat dissipation power as functions of seawater flow rate, seawater temperature, electrolyte flow rate, and initial electrolyte temperature. Detailed results are presented in Table 2.
The heat dissipation power is calculated using the following equation:
p = c m T
In Equation (6), c is the specific heat capacity of the electrolyte, J/(kg·°C); m is the mass flow rate of the electrolyte, kg/s; and ΔT is the temperature difference between the import and export in °C.
The pressure distributions within the internal and external fluid domains were analyzed using working condition number 7 as a representative example, with results visualized in Figure 8. The internal fluid domain exhibits a pressure loss of approximately 89 kPa, whereas the external fluid domain experiences a total pressure loss of 165 kPa between its inlet and outlet. As a result, the design index condition of a spiral runner pressure drop of 100 kPa or less is satisfied while keeping the case strength and case thickness unchanged.
Within the internal domain, the pressure field exhibits a systematic decrease along the spiral flow passage under inlet velocity boundary conditions, culminating in a steady pressure profile at the electrolyte outlet. In contrast, the external fluid domain displays a gradual pressure decline from inlet to outlet, with a more pronounced pressure drop than the internal domain. This disparity arises from differences in geometric configuration and flow dynamics: the spiral flow passage features a larger cross-sectional area and lower fluid velocity, leading to reduced pressure loss; conversely, the external domain’s narrower flow area and higher fluid velocity result in greater pressure dissipation.
Increasing the seawater and electrolyte flow rates enhances cooling efficiency but simultaneously elevates pressure loss, directly impacting pumping power requirements. A higher pump power output necessitates a larger pump size, which can impose significant constraints on system layout and integration. Given that the experimental section represents only a subset of the full-scale system, cumulative pressure losses across all components would be even more substantial. Therefore, during system design, it is critical to balance cooling performance requirements with minimizing pressure loss to optimize overall energy efficiency and compactness.
The temperature distribution within the fluid domain is visualized in Figure 9. Analysis of the internal fluid domain in Figure 9a reveals that high-temperature fluid entering the spiral flow channel at elevated velocities generates a high convective heat transfer coefficient, driving rapid cooling of the electrolyte. This observation highlights the pivotal role of the spiral flow channel geometry in the temperature control system design, as its structural configuration directly influences heat transfer efficiency in this region. Examination of the temperature field along the spiral channel demonstrates a systematic decrease from inlet to outlet, with the electrolyte temperature dropping from 80.0 °C at the inlet to approximately 60.0 °C at the outlet.
In contrast, the seawater temperature profile in Figure 9b shows a gradual increase with heat exchange, exhibiting a minimal temperature rise of 0.18 °C. This negligible temperature variation confirms that the seawater—by virtue of its effective thermal capacity, implicitly related to its thickness or volume—provides an adequate thermal sink to meet the battery’s heat dissipation requirements, maintaining a stable external thermal environment throughout the process.

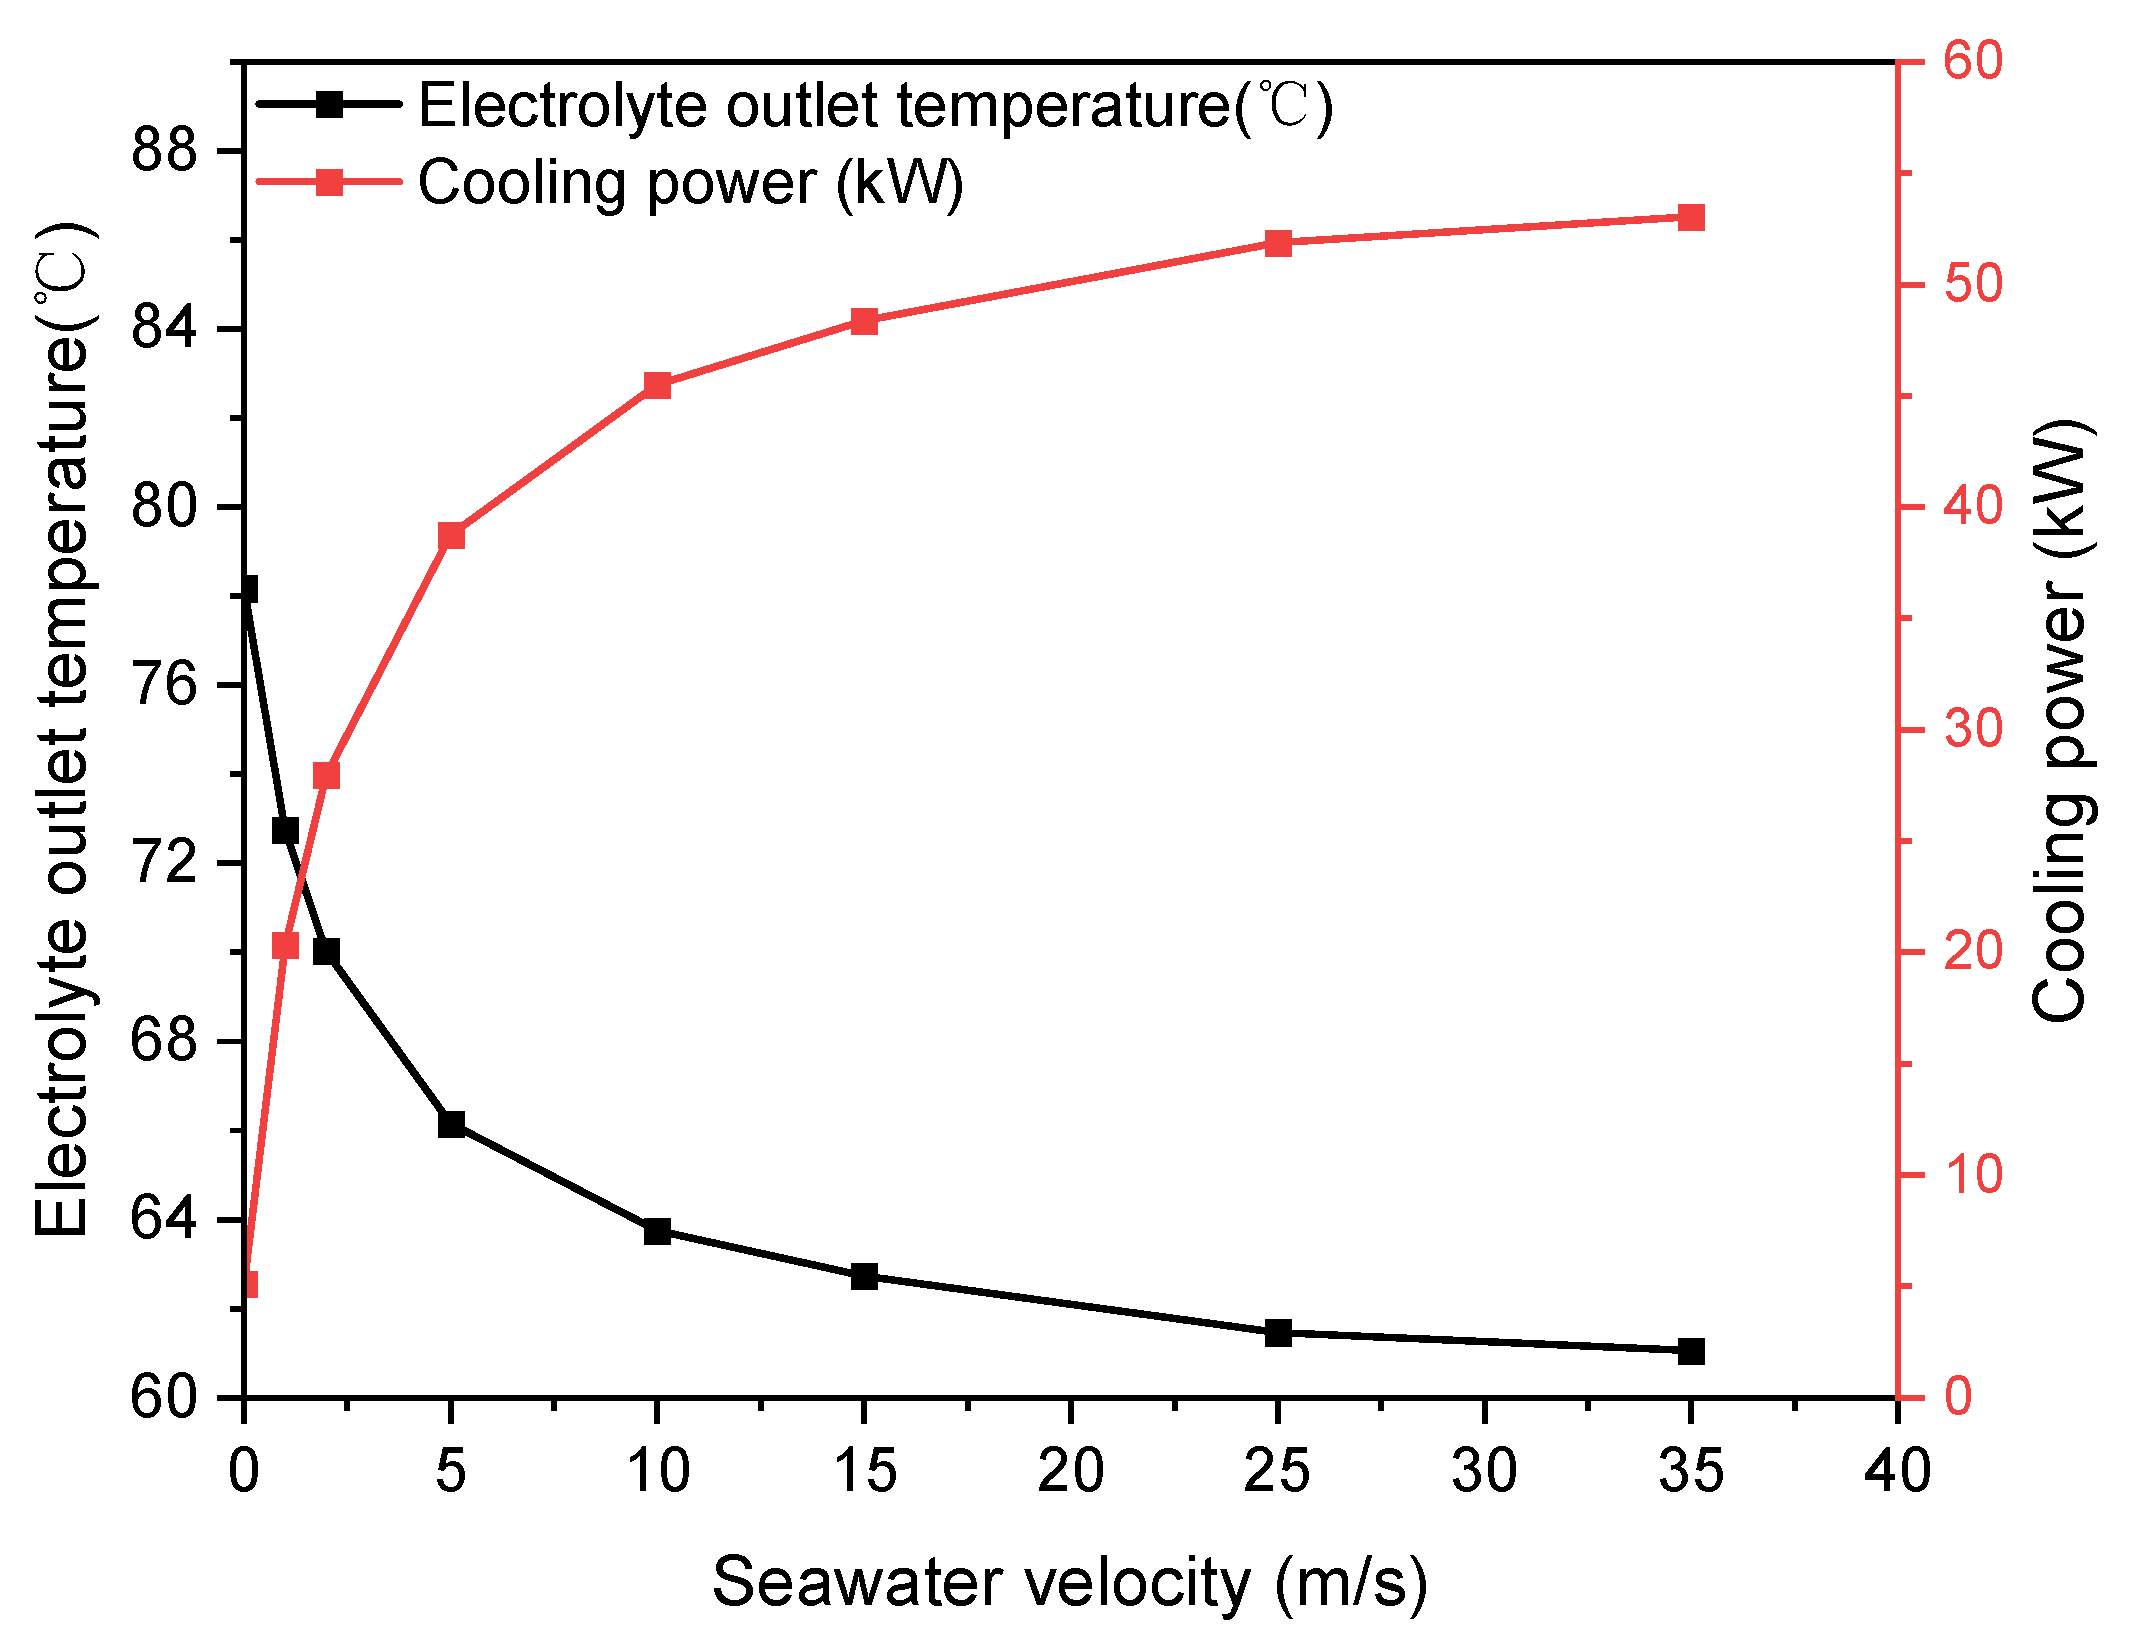
3.1. Effect of Seawater Flow Rate on Thermal Power Dissipation

The relationship between seawater flow velocity, electrolyte outlet temperature, and the heat dissipation power of the cooling structure is depicted in Figure 10. Analysis shows that as the seawater flow velocity increases, the electrolyte outlet temperature decreases with a gradually attenuating decline rate, while the heat dissipation power exhibits an opposite trend. This behavior stems from the Reynolds number-dependent evolution of fluid flow regimes and heat transfer mechanisms: higher flow velocities increase Re, driving the transition from laminar to turbulent flow. Turbulence enhances fluid mixing and vortex formation, reducing boundary layer thermal resistance and intensifying convective heat transfer from the electrolyte to the seawater—a phenomenon quantitatively characterized by the Nusselt number, a key indicator of convective heat transfer intensity at fluid–solid interfaces.
Over the tested velocity range from 0.01 m/s to 35.0 m/s, the electrolyte outlet temperature decreases from 78.17 °C to 61.06 °C, and the heat dissipation power increases from 5.12 kW to 53.03 kW, with a distinct inflection point observed at approximately 10.0 m/s. When the flow velocity increases from 0.01 m/s to 10.0 m/s, the electrolyte outlet temperature drops by 14.42 °C and the heat dissipation power rises by 40.38 kW (a 789% increase), primarily due to the significant improvement in heat transfer efficiency as the flow transitions to full turbulence. By contrast, increasing the velocity from 10.0 m/s to 35.0 m/s results in only a 2.69 °C temperature decrease and a 7.53 kW power increase (17% enhancement), as the benefits of enhanced turbulence are partially offset by reduced fluid residence time at the heat exchange surface—higher velocities shorten contact duration, moderating the growth of heat dissipation efficiency.
From an engineering perspective, system design must balance thermal efficiency against structural pressure losses. While higher seawater flow velocities enhance heat transfer, marginal gains in cooling performance diminish at flow velocities exceeding 10.0 m/s. Pumping power scales with flow velocity, leading to significant increases in energy consumption and mechanical stress, as well as heightened system complexity. Considering this trade-off, the optimal seawater flow rate under experimental conditions was determined to be slightly above 10 m/s. This parameter ensures adequate heat dissipation while minimizing energy expenditure and mechanical loads on the system.

3.2. Effect of Seawater Temperature on Cooling Power

The relationship between seawater temperature and cell heat dissipation power is depicted in Figure 11. With the seawater flow rate, electrolyte inlet temperature, and electrolyte flow rate held constant, variations in seawater temperature exhibit a pronounced effect on both the electrolyte outlet temperature and heat dissipation power. As the seawater temperature increases from 5.0 °C to 35.0 °C, the electrolyte outlet temperature rises from 55.96 °C to 65.56 °C, and the heat dissipation power decreases from 67.31 kW to 40.43 kW, respectively. This behavior is governed by multiple interdependent factors in the heat transfer process, including fluid thermophysical properties, flow regime, and geometric parameters of the cooling structure. An increase in seawater temperature directly reduces the temperature gradient between the electrolyte and seawater, subsequently decreasing convective heat exchange efficiency. This efficiency decline limits the amount of heat transferred from the electrolyte to the cooling medium within the heat exchanger, leading to a rise in electrolyte outlet temperature and a corresponding decrease in heat dissipation power. Quantitatively, each 5.0 °C increment in seawater temperature results in an average 1.6 °C increase in electrolyte outlet temperature and a 4.48 kW reduction in heat dissipation power. These findings highlight the critical role of seawater temperature in thermal management systems: higher seawater temperatures diminish the driving force for heat transfer, compromising the cooling structure’s ability to maintain optimal electrolyte temperatures. Maintaining lower seawater temperatures within operational constraints is therefore essential for maximizing heat dissipation efficiency and ensuring stable system performance.

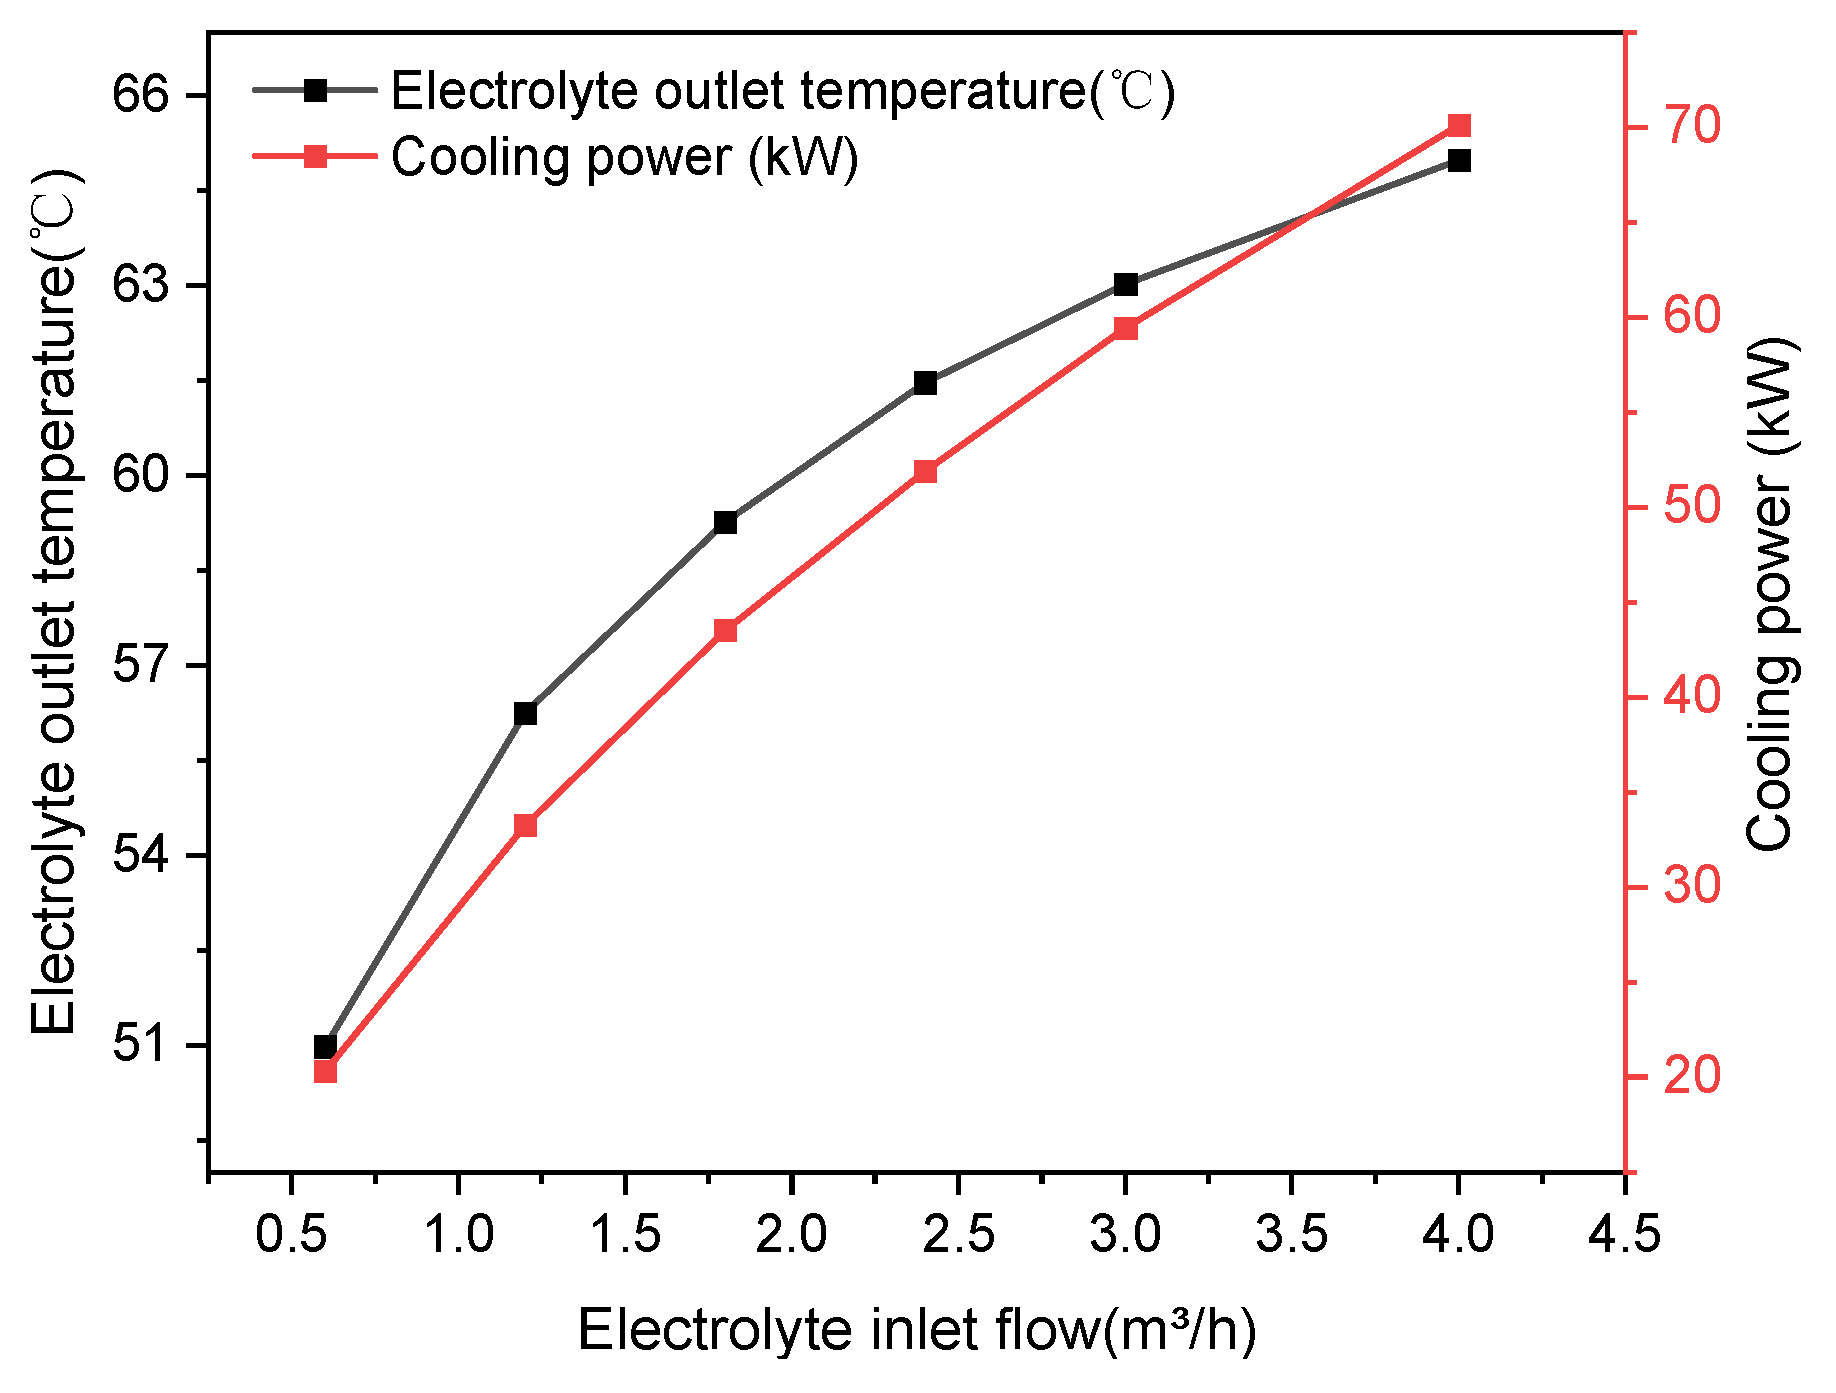
3.3. Effect of Electrolyte Flow on Thermal Power Dissipation

The relationship among the electrolyte flow rate, electrolyte outlet temperature, and heat dissipation power is depicted in Figure 12. When the seawater flow velocity is kept constant at 25.0 m/s, as the electrolyte flow rate increases from 0.6 m3/h to 4.0 m3/h, both the electrolyte outlet temperature and heat dissipation power exhibit an increasing trend following a logarithmic curve. Specifically, the electrolyte outlet temperature rises from 50.98 °C to 64.98 °C, and the heat dissipation power increases from 20.31 kW to 70.09 kW.
This phenomenon can be primarily attributed to the combined effects of the Reynolds number in fluid dynamics and the variation in the Nusselt number in the heat transfer process. As the electrolyte flow rate increases, the Reynolds number rises, enhancing the turbulent characteristics of the fluid. This enhanced turbulence increases the degree of fluid mixing with the heat sink surface, thereby promoting more effective heat transfer. Simultaneously, the increase in the Nusselt number signifies an increase in the heat flux density on the heat exchange surface, further augmenting the heat dissipation performance.
The correlation between heat dissipation performance and electrolyte flow rate can also be interpreted as the interplay between heat transfer rate and fluid flow characteristics. As a critical parameter influencing the heat exchange process, changes in electrolyte flow rate directly impact the contact duration between the electrolyte and the heat sink, as well as the overall heat exchange efficiency. When the electrolyte flow rate increases, the volume of electrolyte passing through the radiator per unit time expands, leading to an increase in the effective heat exchange area and the frequency of heat exchange events. Consequently, this acceleration of heat transfer results in enhanced heat dissipation performance.

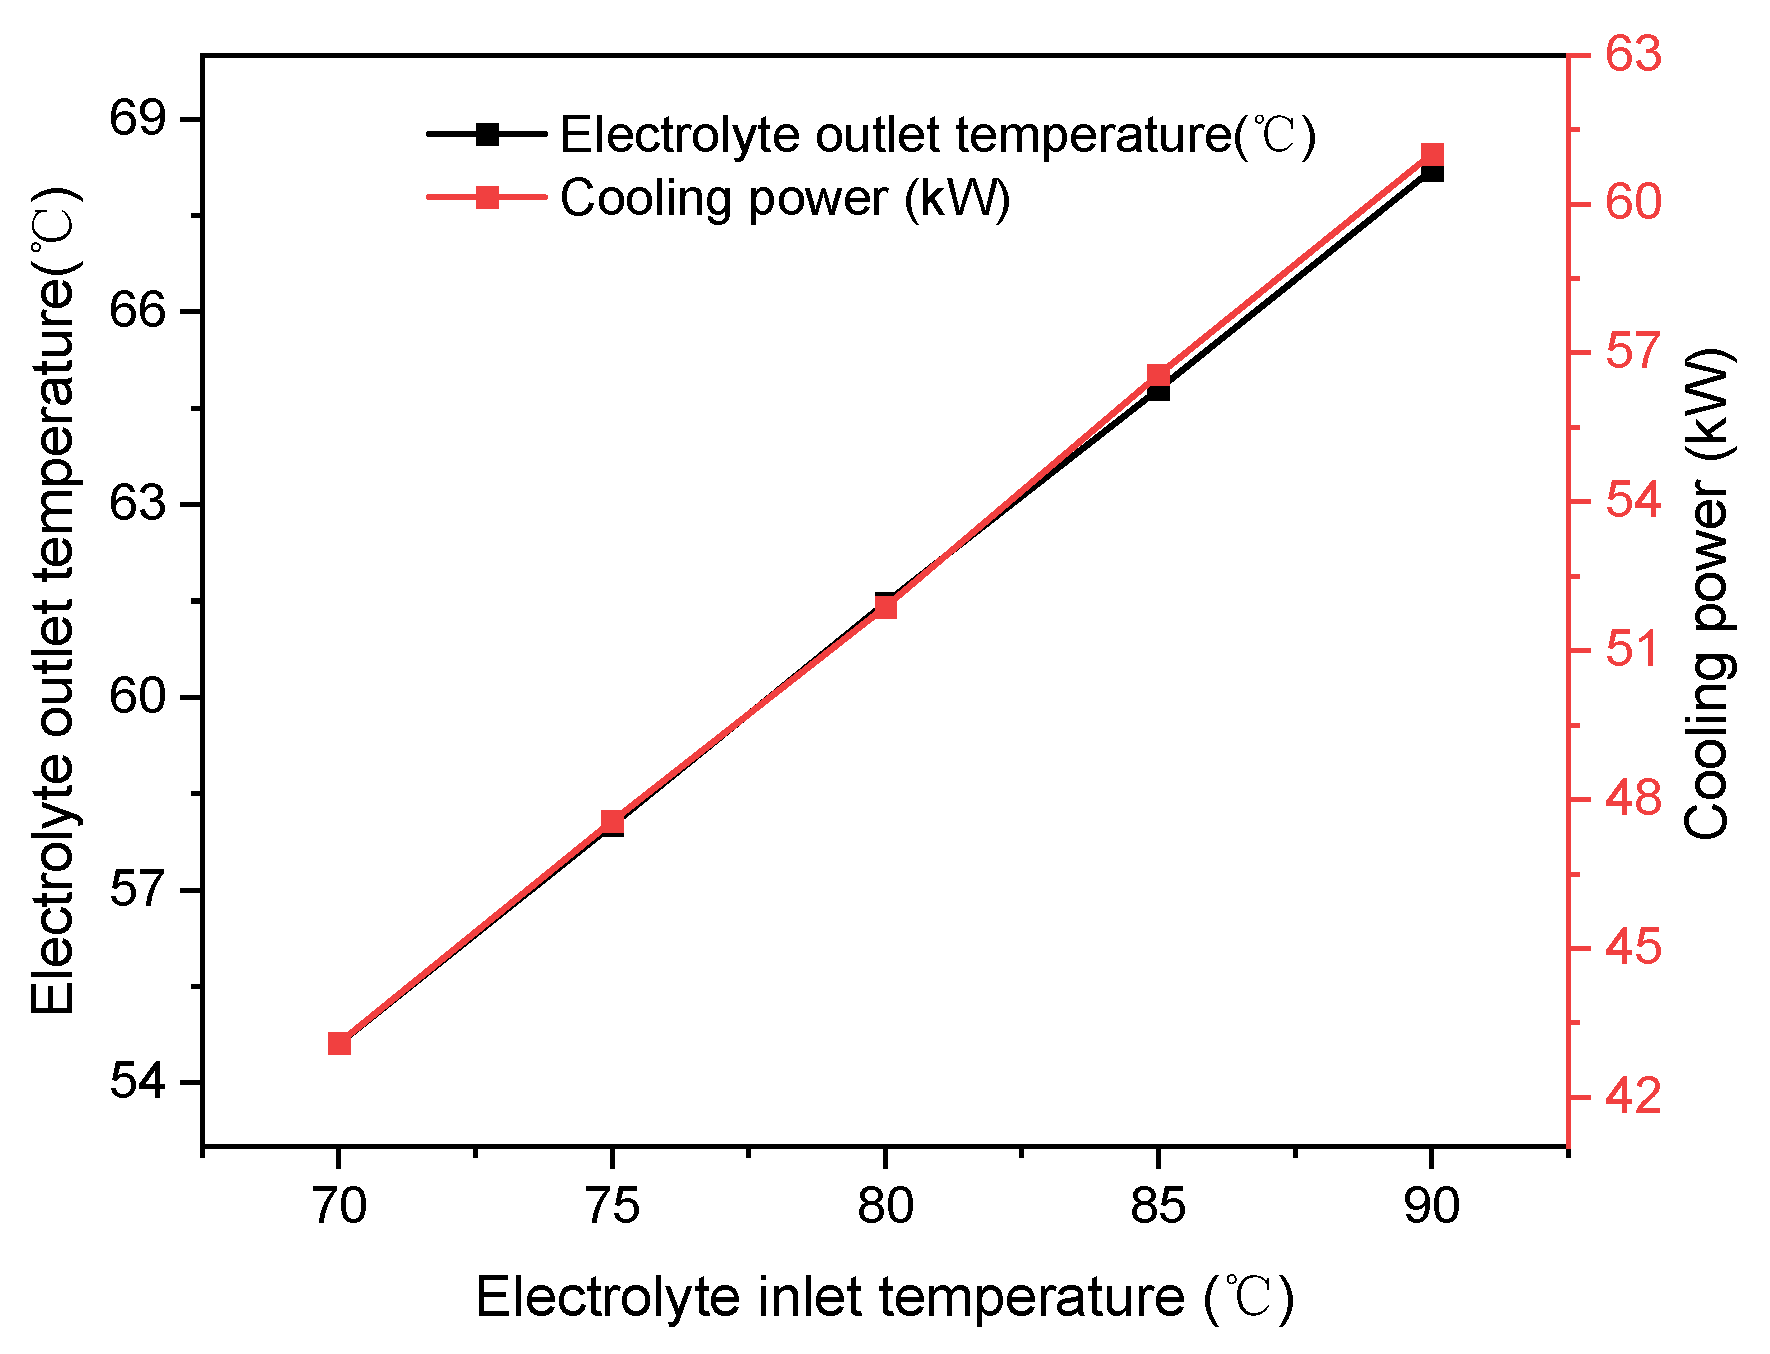
3.4. Effect of Initial Electrolyte Temperature on Heat Dissipation Power

The relationship among electrolyte inlet temperature, electrolyte outlet temperature, and heat dissipation power is depicted in Figure 13. As the electrolyte inlet temperature increases from 70.0 °C to 90.0 °C, the electrolyte outlet temperature rises from 43.09 °C to 54.61 °C, and the heat dissipation power increases from 43.09 kW to 61.01 kW. This behavior is attributed to the enhanced thermal driving force: higher inlet temperatures increase the heat flow density and conduction rate, thereby strengthening the temperature gradient between the spiral cooling channel surface and the electrolyte—key factors promoting convective heat transfer.
The heat dissipation power, serving as a quantitative indicator of the system’s heat transfer capability, directly reflects improvements in heat exchange efficiency with increasing inlet temperature. Under the simulated conditions, the relationship between heat dissipation power, electrolyte outlet temperature, and electrolyte inlet temperature follows a linear growth trend. Specifically, when the seawater flow rate is maintained at 25.0 m/s, for every 5.0 °C increment in the electrolyte inlet temperature, the electrolyte outlet temperature increases by an average of 3.40 °C, and the heat dissipation power grows by approximately 4.31 kW. This linear correlation highlights the dominant role of the inlet temperature gradient in governing heat transfer performance within the cooling structure, as the increased thermal potential difference provides a stronger driving force for heat dissipation to the cooling medium.

4. Design and Realization

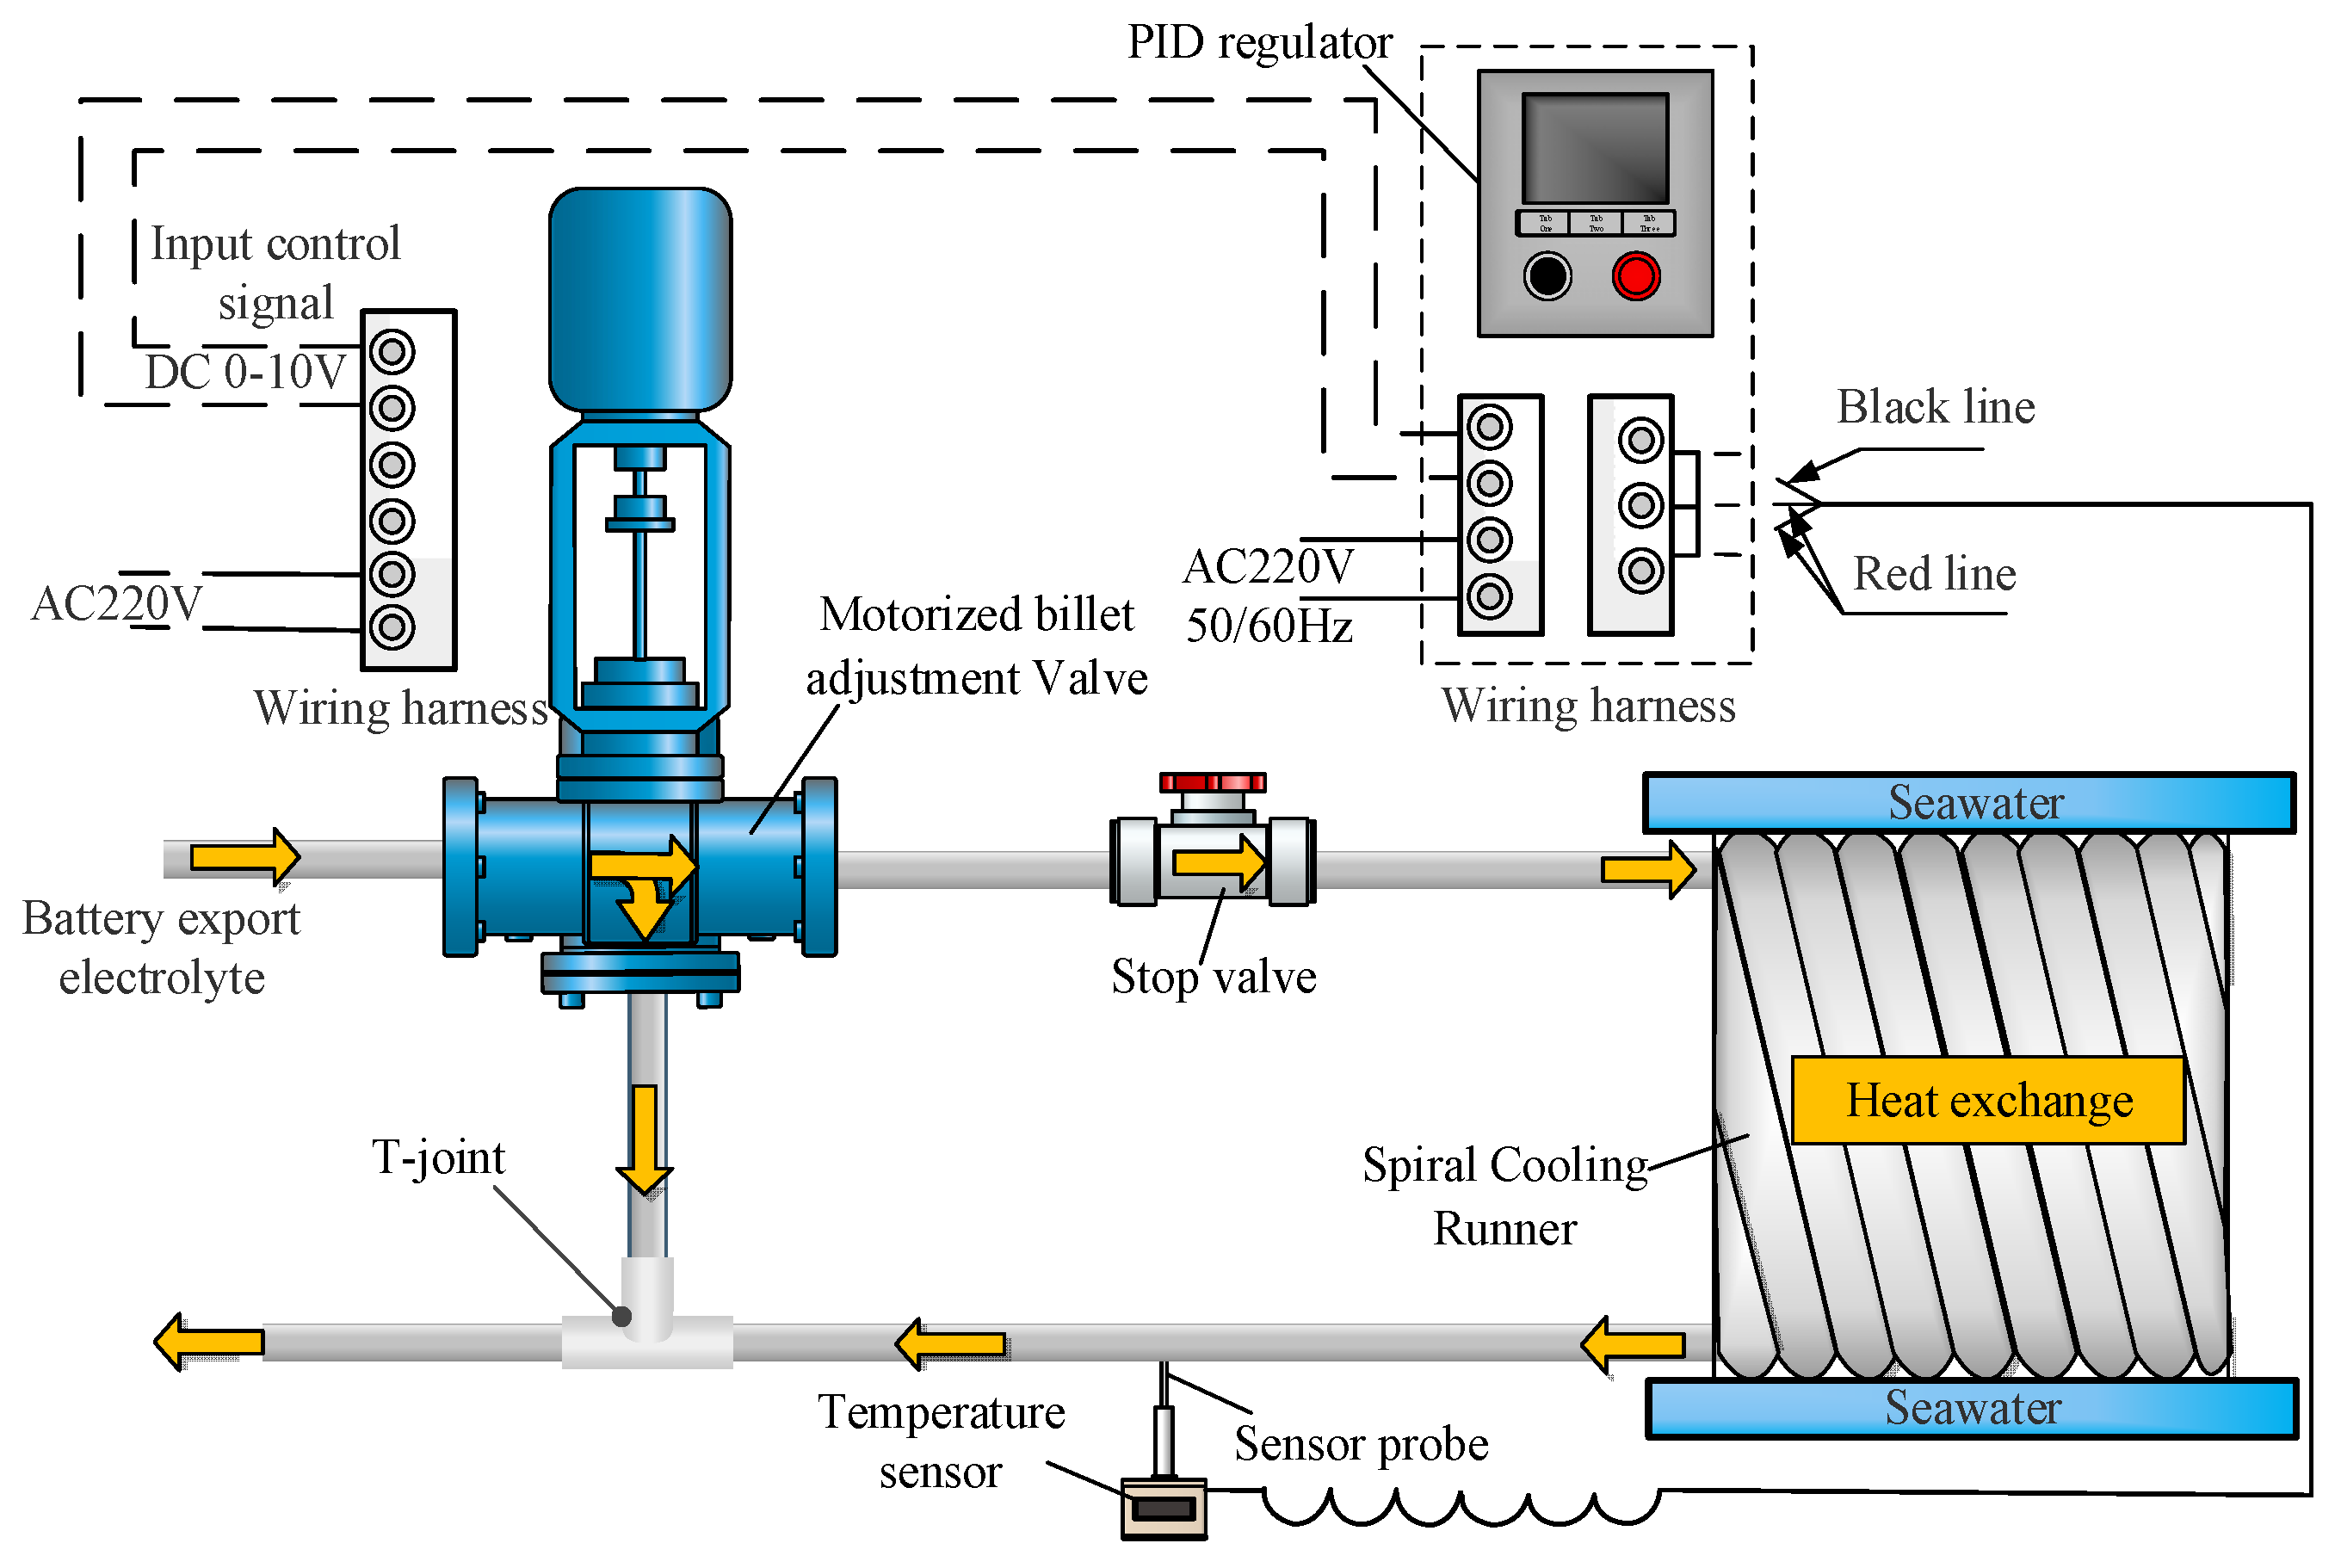
4.1. Temperature Control Design

The temperature control system of the AgO-Al battery comprises an external seawater circulation device and an internal electrolyte circulation device, as shown in Figure 14a. The physical diagram of the temperature control system experiment is presented in Figure 14b. The internal electrolyte circulation device serves to establish the discharge operating conditions for the AgO-Al battery, ensuring its normal discharge. The constant-temperature water tank heats the electrolyte to an appropriate temperature and maintains thermal insulation. A gear pump extracts the electrolyte from the tank, which then passes through a flow meter before entering the battery body. Post reaction, the electrolyte flows into a temperature control valve. The valve diverts part of the electrolyte to a T-joint, while the remainder enters the spiral cooling channels. The electrolyte from the cooling channels returns to the T-joint via a reflux pipe, and the mixed liquid is then sent back to the electrolyte reservoir, thus completing the internal circulation cycle. When the electrolyte traverses the battery body, it infiltrates the AgO-Al battery, triggering its discharge.
The external seawater circulation device aims to mimic the scouring and heat dissipation effects of seawater on the battery compartment. Through the circulation of seawater, it facilitates heat dissipation from the battery case during the discharge process, preventing overheating and potential performance degradation.
The schematic diagram of the temperature control system design principle is shown in Figure 15. The temperature control valve assembly comprises an electric actuator, a three-way valve, and a PID control cabinet. The PID control cabinet enables direct setting of the target temperature. A temperature sensor transmits real-time temperature signals to the PID control cabinet, which processes these signals and generates control commands. The electric actuator receives these commands and drives the valve stem of the three-way valve, causing the spool to move within the valve body and regulate the flow rate of the pipeline medium accordingly.
The seawater flow rate is adjustable via a water pump, with a maximum capacity of 25 m/s. The temperature of the seawater in the experimental section is controlled by a temperature regulation unit, allowing precise adjustment within the range of 5–35 °C. The flow rate of electrolyte entering the spiral flow channel is managed by the temperature control valve, offering a proportional adjustment range from 0% to 100%. Additionally, the initial temperature of the electrolyte is set using a thermostatic water tank, which can regulate temperatures from room temperature up to 99.9 °C.
During discharge of the AgO-Al battery, the system adapts to dynamic heat dissipation demands by modulating three core parameters: seawater flow rate, seawater temperature, and the proportion of the electrolyte routed to the spiral flow channel via a proportional flow control valve. Temperature control operates in dual modes: automatic and manual. The experimental configuration enables the quantification of parameter effects and trend analysis, facilitating the manual modulation of cooling power. For automatic control, a PID-based algorithm dynamically regulates these parameters in real time to balance battery heat generation, thereby enabling precise regulation of the electrolyte outlet temperature.

4.2. Performance Experimental Validation

The experimental setup primarily comprises a thermostatic water tank, electrolyte pump, battery cavity, flow meter, spiral cooling runner, temperature control valve, water storage tank, water pump, water flow meter, temperature control unit, temperature sensors, pressure sensors, and a condition control mainframe. Key equipment parameters are listed in Table 3.
To simulate battery heat generation while accounting for material limitations, a 15 kW heating bar is employed as the heat source. The fluid medium uses pure water, which matches the electrolyte in specific heat capacity and thermal conductivity, ensuring thermal equivalence in experimental conditions. A self-developed measurement and control program for discharge condition simulation is utilized to collect real-time data on electrolyte outlet temperature under varying operational scenarios.
The thermal management system performance verification experiment focuses on investigating the influence of different operating conditions on the electrolyte outlet temperature to assess the system’s capability to stabilize the outlet temperature at approximately 80 °C across diverse scenarios. Prior to testing, pipeline connections and valve seals are thoroughly inspected to ensure no fluid leakage, with all switches confirmed to be in the closed position. Three tons of pure water are prepared and stored in the storage tank. The target temperature is set via the temperature control unit’s interface, after which the equipment is started to adjust the storage tank water temperature to the specified value. The injection pump is then activated to fully charge the circulating water tanks and pipelines, followed by shutting down the pump, injection valve, and exhaust pressure-reducing valve. The pressurized valve is opened to start the pressure pump for setting the required pressure, which is then closed after stabilization. The functionality of data acquisition equipment is rigorously tested to ensure accurate signal recording.
During the experiment, the electrolyte pump and water pump are initiated, with the circulating water pump frequency adjusted to control flow rates. Real-time monitoring of electrolyte temperature, temperature control valve opening, and other key parameters is conducted, with data recorded at a 10 Hz sampling rate. Upon completion, all acquired data are saved, the system is depressurized to 0 bar, residual water is drained from the device, and all instruments are powered off.
Steady-state performance test results are summarized in Table 4, while dynamic response test data—collected by the measurement and control program with one representative sample retained per 100 sampling points—are visualized in Figure 16. Specifically, Figure 16a depicts the temperature response when the initial electrolyte temperature is 70 °C; Figure 16b shows the response at an initial temperature of 90 °C; Figure 16c illustrates the temperature behavior during an electrolyte flow rate transition from 0.5 m3/h to 1.2 m3/h; and Figure 16d presents the response to a seawater flow rate change from 2 m/s to 10 m/s.
Table 4 presents results showing that when seawater flow rate increases from 2.0 to 10.0 m/s—with seawater temperature, initial electrolyte temperature, and electrolyte flow rate held constant—the electrolyte outlet temperature remains approximately 80 °C. This indicates that within this flow rate range, seawater flow rate has a minimal effect on electrolyte outlet temperature, demonstrating the system’s ability to effectively maintain outlet temperature near the target value across varying flow conditions. When seawater temperature is varied while other parameters are fixed, a seawater temperature of 35.0 °C yields an electrolyte outlet temperature of approximately 81 °C, compared to approximately 80 °C at 5.0 °C. Notably, higher seawater temperatures cause marginal increases in outlet temperature, yet the system stabilizes electrolyte outlet temperature at approximately 80 °C across 5.0 °C, 22.0 °C, and 35.0 °C seawater conditions, reflecting robust adaptability to seawater temperature fluctuations.
Tests with varying initial electrolyte temperatures reveal that outlet temperatures remain near 82 °C for initial temperatures of 70.0 °C and 90.0 °C, and approximately 80 °C at an initial temperature of 80.0 °C. While initial electrolyte temperature changes induce moderate fluctuations in outlet temperature, the system maintains values close to 80 °C, underscoring its regulatory capability across diverse starting conditions. Increasing electrolyte flow rate from 0.5 to 2.4 m3/h decreases outlet temperature from approximately 81 °C to approximately 80 °C, demonstrating that elevated electrolyte flow enhances temperature stabilization, with the system controlling outlet temperature within tight bounds across the tested flow range.
Under a 15 kW electric power heating load, the developed temperature control system maintained the electrolyte outlet temperature at approximately 80.0 °C across all tested conditions, with a control accuracy of ±3 °C. These results collectively validate the system’s robust stability and adaptability in managing electrolyte temperatures under varying operational scenarios.
As shown in Figure 16a,b, when the initial electrolyte temperature is 70.0 °C, the system temperature rises rapidly initially, then slows, and stabilizes at approximately 81.0 °C. This behavior demonstrates that under low-temperature startup conditions, the system achieves effective heating via electric power input, though thermal equilibrium requires a transient period—reflecting the system’s thermal accumulation and regulation dynamics in cold environments. In contrast, at an initial electrolyte temperature of 90.0 °C, the outlet temperature remains stable at 82.0 °C with minimal fluctuations, indicating robust control over high-temperature initial conditions: the system effectively mitigates temperature decay and maintains thermal stability.
Transitioning to flow rate effects, as shown in Figure 16c,d, increasing the electrolyte flow rate from 0.5 to 1.2 m3/h results in narrow temperature oscillations around 80.0 °C, showcasing the thermal management system’s adaptability to flow variations. Flow rate adjustments induce no significant disruptions to temperature stability, evidencing the system’s robustness—achieved through internal heat exchange mechanism self-regulation to maintain target temperatures. When seawater velocity increases from 2.0 to 10.0 m/s, the temperature initially dips due to enhanced heat dissipation but recovers to 80.0 °C via dynamic system adjustments. This transient response reveals the system’s mechanism for handling sudden cooling changes: an initial heat loss-driven temperature drop is counterbalanced by adaptive thermal management, demonstrating its dynamic adjustment capability and temperature tracking precision.
Under a 15 kW heating load, the thermal management system exhibits notable resilience and regulation ability across variations in initial electrolyte temperature, electrolyte flow rate, and seawater velocity. Through adaptive adjustments of the cooling power via the temperature control system, the final electrolyte outlet temperature stabilizes at 80.0 ± 3 °C across all tested scenarios. Specifically, in the four evaluated conditions, outlet temperatures remained within the target range, with response times of 177.7 s, 90.5 s, 0 s, and 410.5 s—all under 7 min—satisfying the temperature control requirements for the AgO-Al battery experimental rig.

5. Conclusions

This study utilized CFD to investigate the effects of seawater flow rate, seawater temperature, electrolyte flow rate, and initial electrolyte temperature on the heat dissipation performance of a spiral flow channel, and we successfully designed a temperature control system for simulating the discharge conditions of AgO-Al batteries. The following conclusions were drawn:
(1)
Seawater flow rate, seawater temperature, electrolyte flow rate, and initial electrolyte temperature exert differential impacts on the thermal performance of the AgO-Al battery temperature control system. Specifically, cooling power exhibits an inverse proportionality to seawater temperature: a 5.0 °C increase in seawater temperature leads to an average decrease of 4.5 kW in cooling power. Conversely, it shows a positive correlation with inlet electrolyte temperature, increasing by approximately 4.3 kW on average for every 5.0 °C rise in inlet electrolyte temperature. Cooling power also increases with both electrolyte and seawater flow rates; however, when the seawater flow rate exceeds 10.0 m/s, the cooling capacity stabilizes, indicating negligible gains from further flow rate increases.
(2)
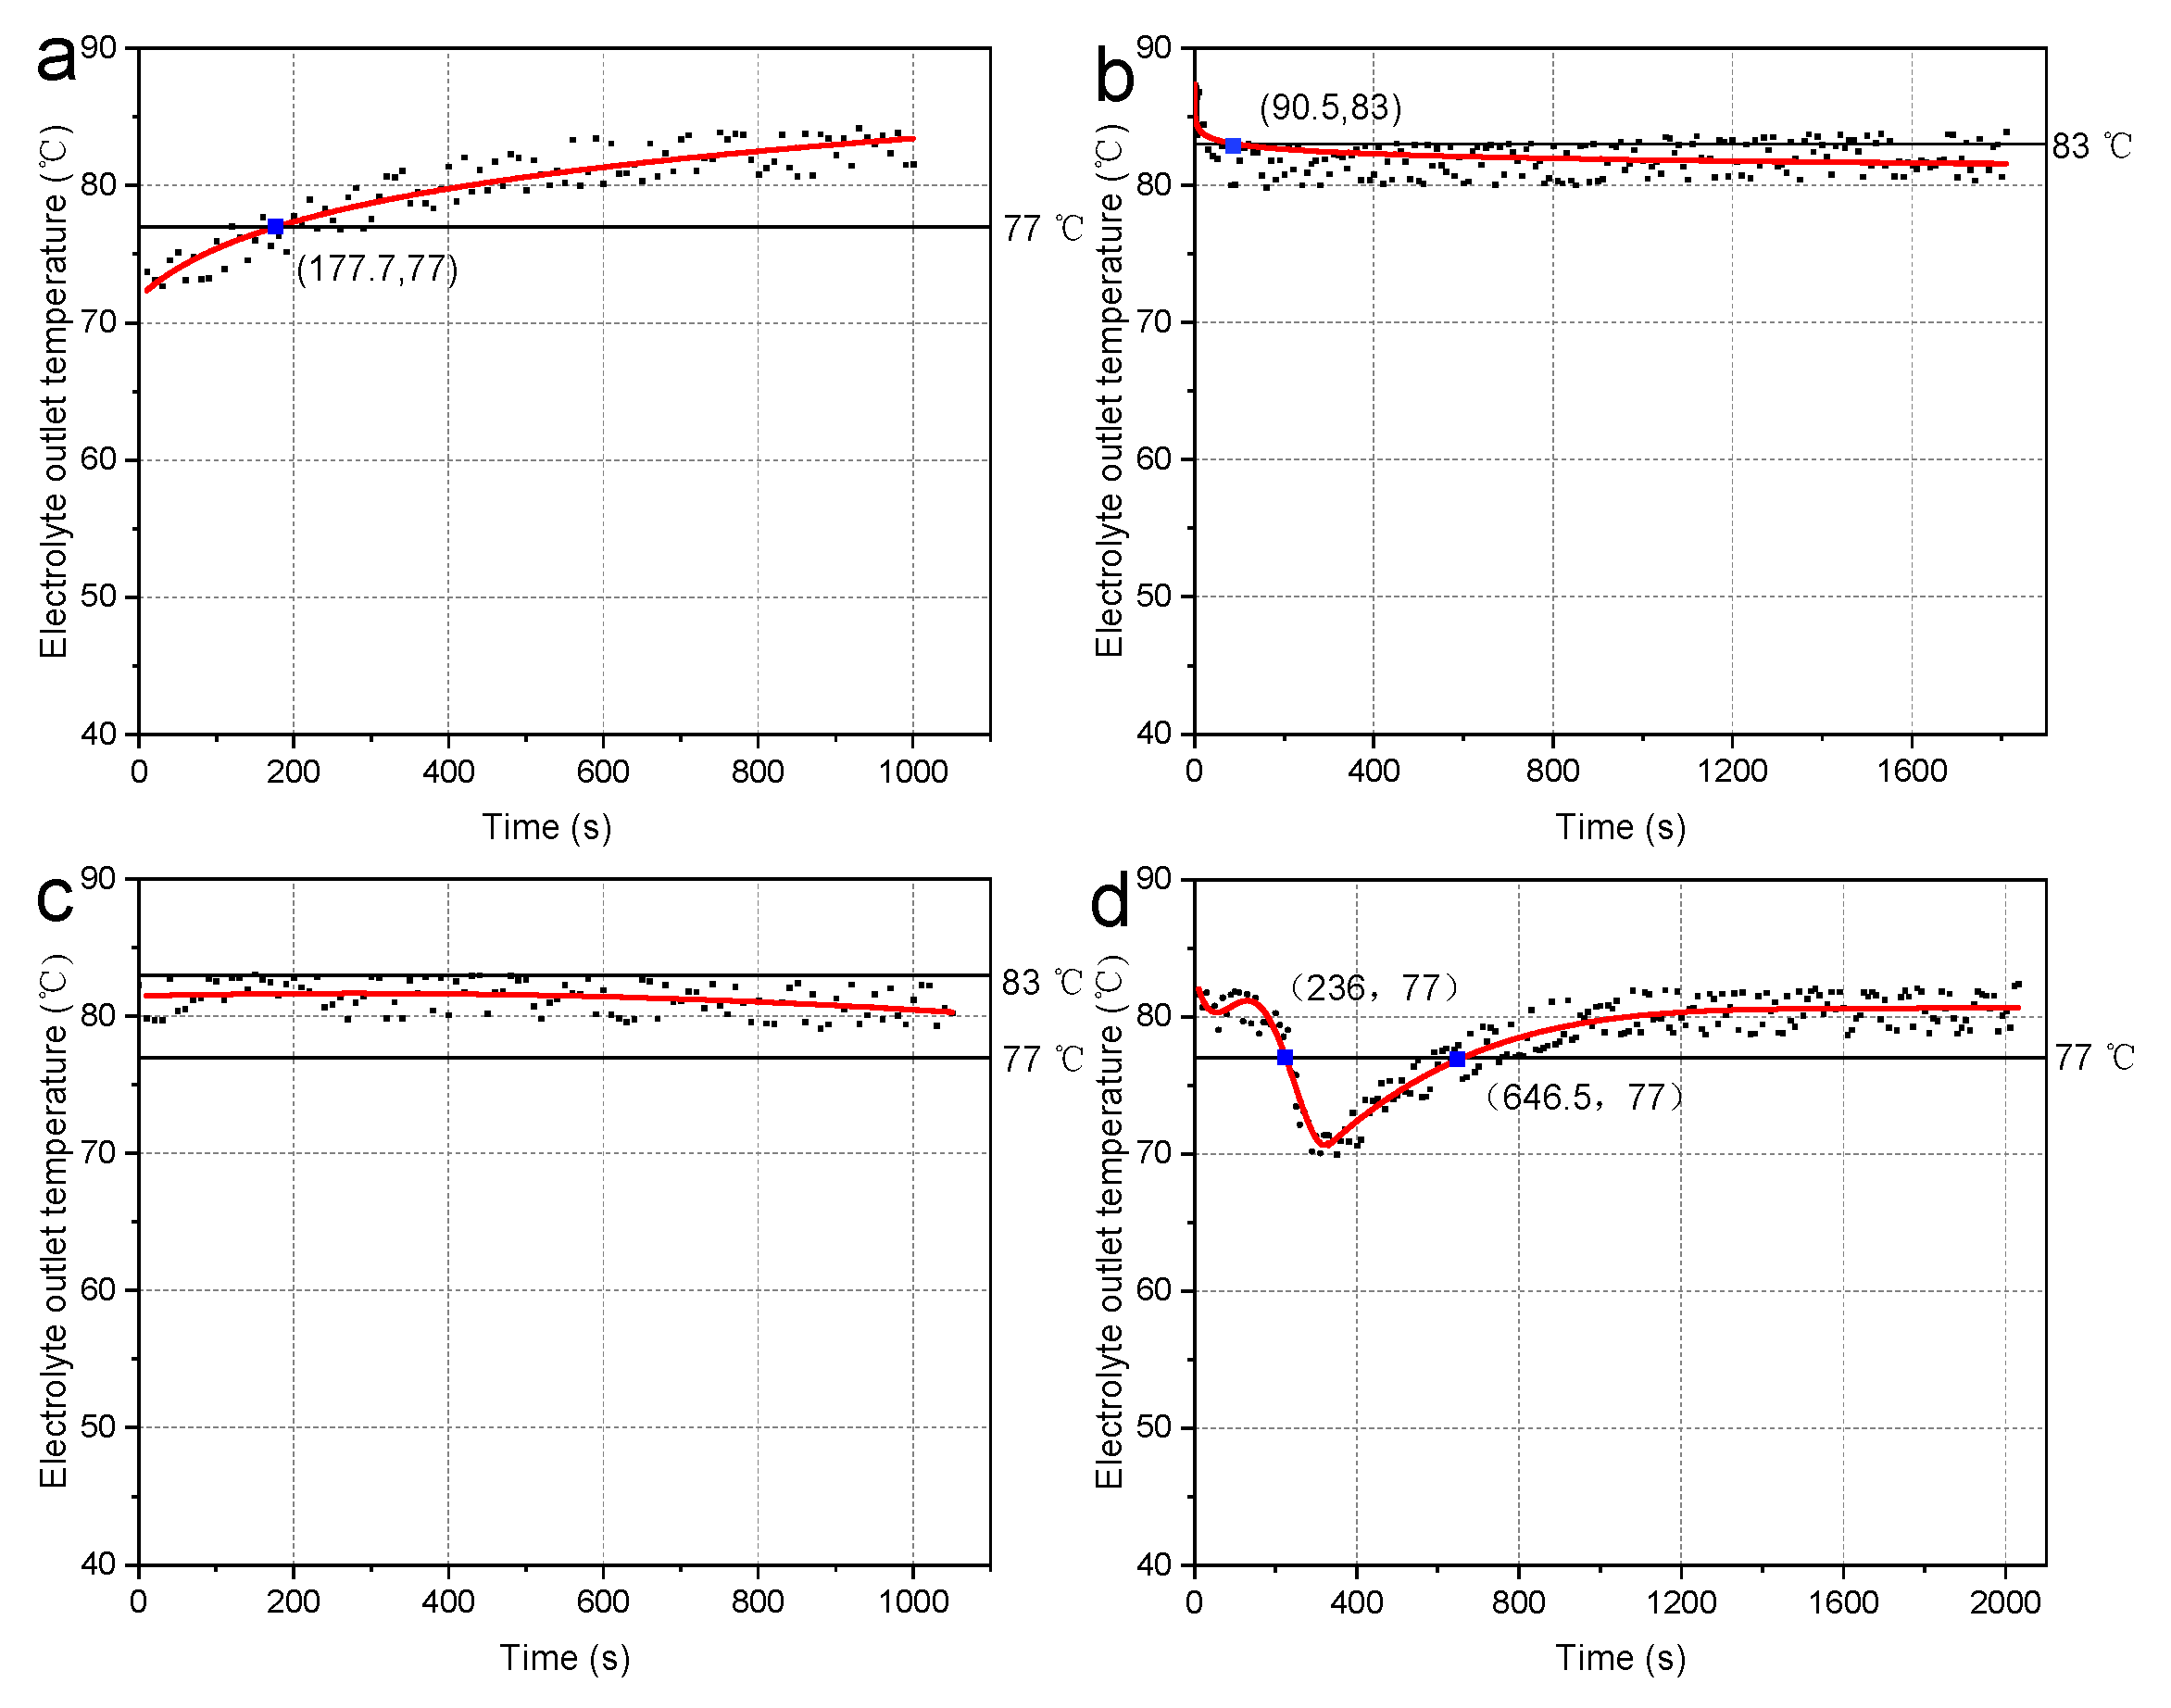
Under a 15 kW electric heating load, the system exhibited robust temperature regulation and operational resilience across varying initial electrolyte temperatures, electrolyte flow rates, seawater temperatures, and seawater velocities, with the electrolyte outlet temperature stabilized within the target range of 80.0 ± 3 °C through adaptive cooling power modulation. Dynamically, it demonstrated pronounced thermal stability and constraint capabilities—especially under high initial temperatures and during electrolyte flow rate adjustments—while seawater velocity variations highlighted its dynamic regulation and temperature tracking precision. All thermal response times remained below 7 min across tested scenarios, collectively validating the system’s ability to achieve precise electrolyte outlet temperature control and provide critical thermal management support for the experimental AgO-Al batteries’ discharges.
This paper elucidates the influence of seawater flow rate, temperature, electrolyte flow rate, and initial electrolyte temperature on heat dissipation performance, offering a theoretical basis for future research. The designed temperature control system provides an effective solution for the thermal management of AgO-Al batteries under experimental operating conditions. However, opportunities remain to optimize the time required to establish thermal equilibrium under scenarios such as low-temperature startups or abrupt seawater flow rate changes. Future work will focus on refining control strategies to enhance response speed and temperature control precision, thereby improving system adaptability and stability under complex conditions. The electrolyte temperature control strategy and system proposed herein enable efficient thermal management of AgO-Al batteries, thereby offering valuable references for the design of thermal management systems in other seawater-activated battery applications.

Author Contributions

Conceptualization, Z.D. (Zhaoliang Dou); Methodology, Q.T.; Software, Z.D. (Zhaoliang Dou); Validation, Q.T., Z.D. (Zhuangzhuang Du), Y.D. and S.L.; Formal analysis, Q.T.; Investigation, Q.T. and Z.D. (Zhuangzhuang Du); Resources, Z.D. (Zhaoliang Dou); Data curation, Q.T.; Writing—original draft, Z.D. (Zhaoliang Dou) and Q.T.; Writing—review & editing, Z.D. (Zhaoliang Dou) and Q.T.; Visualization, Q.T., Z.D. (Zhuangzhuang Du), Y.D. and S.L.; Supervision, F.L.; Funding acquisition, Z.D. (Zhaoliang Dou) and F.L. All authors have read and agreed to the published version of the manuscript.

Funding

The research is funded by North China University of Technology Organised Research Project 2024 (Grant Number: 110051360024XN148-38).

Data Availability Statement

The original contributions presented in this study are included in the article. Further inquiries can be directed to the corresponding author.

Conflicts of Interest

The authors declare no conflict of interest.

References

  1. Wang, X.; Shang, J.; Luo, Z.; Tang, L.; Zhang, X.; Li, J. Reviews of power systems and environmental energy conversion for unmanned underwater vehicles. Renew. Sustain. Energy Rev. 2012, 16, 1958–1970. [Google Scholar] [CrossRef]
  2. Li, X.; Li, W. Numerical simulation of portable AUV hydrodynamic coefficient. Ship Sci. Technol. 2023, 45, 61–65. [Google Scholar]
  3. Lu, J.; Tang, T.; Bai, C.; Gao, H.; Wang, J.; Li, C.; Gao, Y.; Guo, Z.; Zong, X. Reviews of Fuel Cells and Energy Storage Systems for Unmanned Undersea Vehicles. Energy Sources Part Recovery Util. Environ. Eff. 2024, 46, 11867–11888. [Google Scholar] [CrossRef]
  4. Zhen, Q.; Chen, P.; Wang, C. Electrolyte flow characteristics of seawater activated battery. CIESC J. 2024, 75, 4770–4779. [Google Scholar] [CrossRef]
  5. Kim, Y.; Lee, W. Primary Seawater Batteries. In Seawater Batteries: Principles, Materials and Technology; Springer Nature: Singapore, 2022; pp. 37–90. [Google Scholar] [CrossRef]
  6. Li, S.; Tian, X. Progress of Seawater Batteries: From Mechanisms, Materials to Applications. J. Power Sources 2024, 617, 235161. [Google Scholar] [CrossRef]
  7. Chen, J.; Sun, L.; Wang, K.; Zhang, Y. Research and Applications of Rechargeable Seawater Battery. J. Energy Storage 2024, 76, 109659. [Google Scholar] [CrossRef]
  8. Jia, Y.; Richards, K.J.; Annamalai, H. The Impact of Vertical Resolution in Reducing Biases in Sea Surface Temperature in a Tropical Pacific Ocean Model. Ocean Model. 2021, 157, 101722. [Google Scholar] [CrossRef]
  9. Qin, H.; Fan, X.; Cai, Z.; Ye, Y. Acoustic detection of flow rate and flux of bubbles in cold spring area of the ocean. J. Trop. Oceanogr. 2016, 35, 35–39. [Google Scholar] [CrossRef]
  10. Valdes, P.J.; Scotese, C.R.; Lunt, D.J. Deep Ocean Temperatures through Time. Clim. Past 2021, 17, 1483–1506. [Google Scholar] [CrossRef]
  11. Jiang, H.; Bai, R.; Fang, Z.; Lu, H.; Yu, J. A review on development trend of power battery for torpedo. Mar. Electr. Electron. Eng. 2023, 43, 57–61. [Google Scholar] [CrossRef]
  12. Mathiyazhagan, S.; Rani, M.; Kumar, A.; Rao, V.; Ramesh, K.V. Effect of Flow Rate on the Discharge Characteristics of Magnesium Sea Water Activated Batteries. Chem. Technol. Indian J. 2015, 10, 43–50. [Google Scholar]
  13. Chen, P.; Zheng, Q. Investigation on Flow Field Optimization of Seawater Activated Battery Based on Flow Channel Structure Design. J. Energy Storage 2024, 84, 110798. [Google Scholar] [CrossRef]
  14. Lu, Y.; Ding, F.; Jia, Y.; San, L.; Xu, H. Advance in application of seawater battery based on its principle and characteristic. J. Power Sources 2020, 44, 1697–1700. [Google Scholar] [CrossRef]
  15. Lu, Y.; Yang, L.; Zhang, Y.; Zhao, Q.; Sang, L.; Ding, F.; Xu, H. Influence of Simulating Deep-Sea Environmental Factors on Cathodic Performance of Seawater Battery. J. Oceanol. Limnol. 2020, 38, 334–341. [Google Scholar] [CrossRef]
  16. Wen, J. Thermal design of aluminum silver oxide battery. J. Power Sources 2016, 40, 1823–1825. [Google Scholar] [CrossRef]
  17. Chen, H.; Wen, J.; Li, X.; Hu, Y. Cooling structure design of silver aluminum oxide battery based on Fluent. J. Power Sources 2023, 47, 668–670. [Google Scholar] [CrossRef]
  18. Yang, C.; Bai, R.; Wang, W. Study on electrode performance improvement of AgO seawater battery. Mar. Electr. Electron. Eng. 2024, 44, 84–86+91. [Google Scholar] [CrossRef]
  19. Gu, Z.; Lu, D.; Xu, M.; Tang, H.; Cao, H.; Liu, X.; Wu, Y. Preparation and performance of Al/AgO batteries. Met. Funct. Mater. 2010, 17, 27–30. [Google Scholar] [CrossRef]
  20. Zhu, Y.; Zhang, H. Temperature control of a silver oxide torpedo battery section. Mar. Electr. Electron. Eng. 2020, 40, 19–22. [Google Scholar] [CrossRef]
  21. Tang, Q.; Dou, Z.; Du, Y.; Chen, Q.; Liu, F. Design of Experimental Section of a Water Tunnel for Simulation of Heat Dissipation Condition of Seawater-Activated Battery. J. Phys. Conf. Ser. 2024, 2865, 12036. [Google Scholar] [CrossRef]
  22. Cheng, H.; Wen, J.; Li, X. Finite element analysis of Al/AgO primary battery shell structure. J. Power Sources 2023, 47, 918–921. [Google Scholar] [CrossRef]
  23. Liu, Z.; Liu, Z.; Liu, J.; Wang, N. Thermal management with fast temperature convergence based on optimized fuzzy PID algorithm for electric vehicle battery. Appl. Energy 2023, 352, 121936. [Google Scholar] [CrossRef]
  24. Wang, Y.; Wang, Y.; He, T.; Mao, N. A numerical study on a hybrid battery thermal management system based on PCM and wavy microchannel liquid cooling. Renew. Energy 2024, 235, 121273. [Google Scholar] [CrossRef]
  25. Yue, Q.; He, C.; Jiang, H.; Wu, M.; Zhao, T. A hybrid battery thermal management system for electric vehicles under dynamic working conditions. Int. J. Heat Mass Transf. 2021, 164, 120528. [Google Scholar] [CrossRef]
  26. Li, K.; Sun, C.; Zhang, M.; Wang, S.; Wei, B.; Cheng, Y.; Ju, X.; Xu, C. A Study of the Thermal Management and Discharge Strategies of Lithium-Ion Batteries in a Wide Temperature Range. Energies 2024, 17, 2319. [Google Scholar] [CrossRef]
  27. Chen, W.; Hou, S.; Shi, J.; Han, P.; Liu, B.; Wu, B.; Lin, X. Numerical Analysis of Novel Air-Based Li-Ion Battery Thermal Management. Batteries 2022, 8, 128. [Google Scholar] [CrossRef]
  28. Dai, H.; Wang, Y. Study on the Influence of Air Inlet and Outlet on the Heat Dissipation Performance of Lithium Battery. World Electr. Veh. J. 2023, 14, 113. [Google Scholar] [CrossRef]
  29. Chen, P.; Xiong, C.; Zheng, Q.; Ruan, M.; Xu, W. Numerical Simulation and Experimental Investigation on the Optimization of Flow-Guided Structures for High-Performance Aqueous AgO-al Batteries. Int. J. Heat Mass Transf. 2024, 235, 126167. [Google Scholar] [CrossRef]
Figure 1. Schematic diagram of the working principle of AgO-Al battery [22].
Batteries 11 00244 g001
Figure 2. Heat transfer pathway.
Batteries 11 00244 g002
Figure 3. Schematic diagram of the structure of the experimental section.
Batteries 11 00244 g003
Figure 4. Computational domain model meshing.
Batteries 11 00244 g004
Figure 5. Grid independence test.
Batteries 11 00244 g005
Figure 6. Verification experiment schematic. (a) Schematic diagram (b) Physical drawing.
Batteries 11 00244 g006
Figure 7. Comparison of simulated and experimental electrolyte outlet temperature curves.
Batteries 11 00244 g007
Figure 8. Pressure contour diagram. (a) Internal fluid domain. (b) External fluid domain.
Batteries 11 00244 g008
Figure 9. Temperature contour diagram. (a) Internal fluid domain. (b) External fluid domain.
Batteries 11 00244 g009
Figure 10. Relationship between seawater flow rate and electrolyte outlet temperature/heat dissipation power.
Batteries 11 00244 g010
Figure 11. Relationship between seawater temperature and electrolyte outlet temperature/heat sink power.
Batteries 11 00244 g011
Figure 12. Relationship between electrolyte flow rate and electrolyte outlet temperature/heat dissipation power.
Batteries 11 00244 g012
Figure 13. Relationship between electrolyte initial temperature and electrolyte outlet temperature/heat dissipation power.
Batteries 11 00244 g013
Figure 14. Electrolyte temperature control system. (a) Schematic diagram. (b) Physical drawing.
Batteries 11 00244 g014
Figure 15. Schematic diagram of temperature control design principle.
Batteries 11 00244 g015
Figure 16. Electrolyte outlet temperature evolution under varying operational conditions. (a) Initial electrolyte temperature at 70.0 °C. (b) Initial electrolyte temperature at 90.0 °C. (c) Electrolyte flow rates of 0.5 to 1.2 m3/h. (d) Seawater flow velocities of 2.0 to 10.0 m/s.
Batteries 11 00244 g016
Table 1. Material parameters.
Material NameDensity [kg·m3]Specific Heat Capacity [J/(kg·K)]Heat Conductivity
[W/(m·K)]
Viscosity
[kg/(m·s)]
Electrolyte125041820.60.002500
Seawater102538900.60.001003
Aluminum alloy2719871150-
Epoxy sheet18005500.5-
Table 2. Simulation results.
Working Condition NumberSeawater
Velocity [m/s]
Seawater
Temperature (°C)
Electrolyte Inlet Flow [m3/h]Electrolyte Inlet Temperature (°C)Electrolyte Outlet Temperature (°C)Cooling Power (kW)
10.0122.02.480.078.175.12
21.022.02.480.072.7420.33
32.022.02.480.070.0227.94
45.022.02.480.066.1638.75
510.022.02.480.063.7545.50
615.022.02.480.062.7348.36
725.022.02.480.061.4751.88
835.022.02.480.061.0653.03
825.05.02.480.055.9667.31
925.010.02.480.057.5662.83
1025.015.02.480.059.1558.38
1125.030.02.480.063.9644.91
1225.035.02.480.065.5640.43
1335.022.02.480.061.0653.03
1425.022.00.680.050.9820.31
1525.022.01.280.056.2533.25
1625.022.01.880.059.2743.53
1725.022.03.080.063.0259.43
1825.022.04.08064.9870.09
1925.022.02.470.054.6143.09
2025.022.02.475.058.0147.57
2125.022.02.485.064.8056.56
2225.022.02.490.068.2161.01
Table 3. Key equipment parameters.
NameEquipment Parameters
Thermostatic water tankPower: 1.8 kW
Temperature control range: indoor temperature −99.9 °C
Temperature control precision: ±0.1 °C
Electrolyte pumpLining material: PTFE
Maximum flow rate: 3.4 m3/h
Medium temperature: −10–120 °C
Spiral runnerSizes:350 mm × Φ150 mm
Material: Aluminum alloy
Temperature control valveMedium temperature: 0–120 °C
Lining material: 316L stainless steel
Flow rate characteristics: Equal percentage
Water pumpPower: 90 kW
Flow rate: 440 m3/h
Lift: 45 m
Temperature control unitCooling capacity: 60 kW
Heating capacity: 60 kW
Temperature control range: 5 °C–35 °C
Temperature control precision: ±1 °C
Temperature sensorMeasuring range: 0–200 °C
Accuracy Class: ±0.2%
Table 4. Experimental results.
Working
Condition Number
Seawater
Velocity [m/s]
Seawater
Temperature (℃)
Initial
Electrolyte Temperature (℃)
Electrolyte Inlet Flow [m3/h]Electrolyte
Outlet
Temperature (℃)
12.022.080.02.4About 80
25.022.080.02.4About 80
310.022.080.02.4About 80
410.05.080.02.4About 80
510.035.080.02.4About 81
610.022.070.02.4About 82
710.022.090.02.4About 82
810.022.080.00.5About 81
910.022.080.01.2About 80
Disclaimer/Publisher’s Note: The statements, opinions and data contained in all publications are solely those of the individual author(s) and contributor(s) and not of MDPI and/or the editor(s). MDPI and/or the editor(s) disclaim responsibility for any injury to people or property resulting from any ideas, methods, instructions or products referred to in the content.

