Article

High Yield Synthesis and Application of Magnetite Nanoparticles (Fe3O4)

1
University of Guelph, 95 Stone Road West, Guelph, ON N1H 8J7, Canada
2
University of Waterloo, 200 University Ave. W., Nanotechnology, Engineering, Waterloo, ON N2L 3G1, Canada
*
Author to whom correspondence should be addressed.
Magnetochemistry 2020, 6(2), 22; https://doi.org/10.3390/magnetochemistry6020022
Submission received: 9 April 2020 / Revised: 5 May 2020 / Accepted: 12 May 2020 / Published: 15 May 2020
(This article belongs to the Section Magnetic Nanospecies)

Abstract

:
Magnetite nanoparticles (Fe3O4), average particle size of 12.9 nm, were synthesized de novo from ferrous and ferric iron salt solutions (total iron salt concentration of 3.8 mM) using steady-state headspace NH3(g), 3.3% v/v, at room temperature and pressure, without mechanical agitation, resulting in >99.9% yield. Nanoparticles size distributions were based on enumeration of TEM images and chemical compositions analyzed by: XRD, EDXRF, and FT-IR; super-paramagnetic properties were analyzed by magnetization saturation (74 emu/g). Studies included varying headspace [NH3(g)] (1.6, 3.3, 8.4% v/v), and total iron concentrations (1.0 mM, 3.8 mM, 10.0 mM, and >>10 mM). An application of the unmodified synthesized magnetite nanoparticles included analyses of tetracycline’s (50, 100, 200, 300, and 400 ppb) in aqueous, which was compared to the same tetracycline concentrations prepared in aqueous synthesis suspension with >97% extraction, analyzed with LC-MS/MS.

1. Introduction

Magnetite (Fe3O4) nanoparticles (MNP) are of interest to industry and academia with research and applications in: medicine [1,2,3,4,5], technology [6,7], bioremediation, and analytical analysis [8,9,10,11]. They are often used as a core for surface modification with siloxanes and protein, making them suitable for targeted applications [9,12,13,14]. Their surface to volume ratios compared to micron particles are 100 times for 10 nm particles compared to 1000 nm particles. Combined with their inert properties, MNPs are super-paramagnetic, which permit simple removal from systems and applications [8,9,10].
Co-precipitation is one of the simplest techniques for MNP synthesis. It is typically carried out in aqueous solutions of ferrous (Fe2+) and ferric (Fe3+), with bulk addition of OH¯, with heat and/or agitation and/or sonication. These approaches are required to disrupt crystal growth during MNP synthesis [15]. While simple, issues with impurities from reagents are cumulative: from base, iron salts, water, which can all impact MNP phase purity, quality and changing their composition [16]. In many examples yields are not reported likely because of the synthesis of other iron oxides [17], resulting in the simultaneous nucleation of multiple iron oxides and crystal growth phases for others [18].
Magnetite is one form of iron oxide, others include hematite (α-Fe2O3) and maghemite (γ-Fe2O3) [15,19,20]; however, maghemite and hematite are high temperature oxidation products of magnetite. Studies to optimize MNP syntheses include increasing the efficiency and/or approach to OH¯ delivery with the reduction in titrant volume (µL sized volumes) [21,22].
In our work, we present a simple, high-yield, phase pure approach to MNP synthesis. A steady state [NH3(g)] was developed in a nitrogen gas stream (d[OH¯]/dt = 0), in the headspace of aqueous solutions of ferrous and ferric salts, thus avoiding contamination of synthesized MNPs. Repeatable MNP synthesis was realized without mechanical stirring or sonication, carried out at room temperature, with yields >99.9% and particle sizes of 12.9 nm ± 3.0 nm.
Material analyses were carried out using transmission electron microscopy (TEM) [23,24], inductively coupled plasma mass spectrometry (ICP-MS) [25], energy dispersive X-ray fluorescence (EDXRF) spectroscopy [26,27], X-ray diffraction (XRD) [28,29], and Fourier transform infrared spectroscopy (FT-IR) [28,30]. The synthesized nanoparticles were used for an analytical application with the selective extraction of target analytes, analyzed using liquid chromatography coupled to tandem mass spectrometry (LC-MS/MS)

2. Results and Discussion
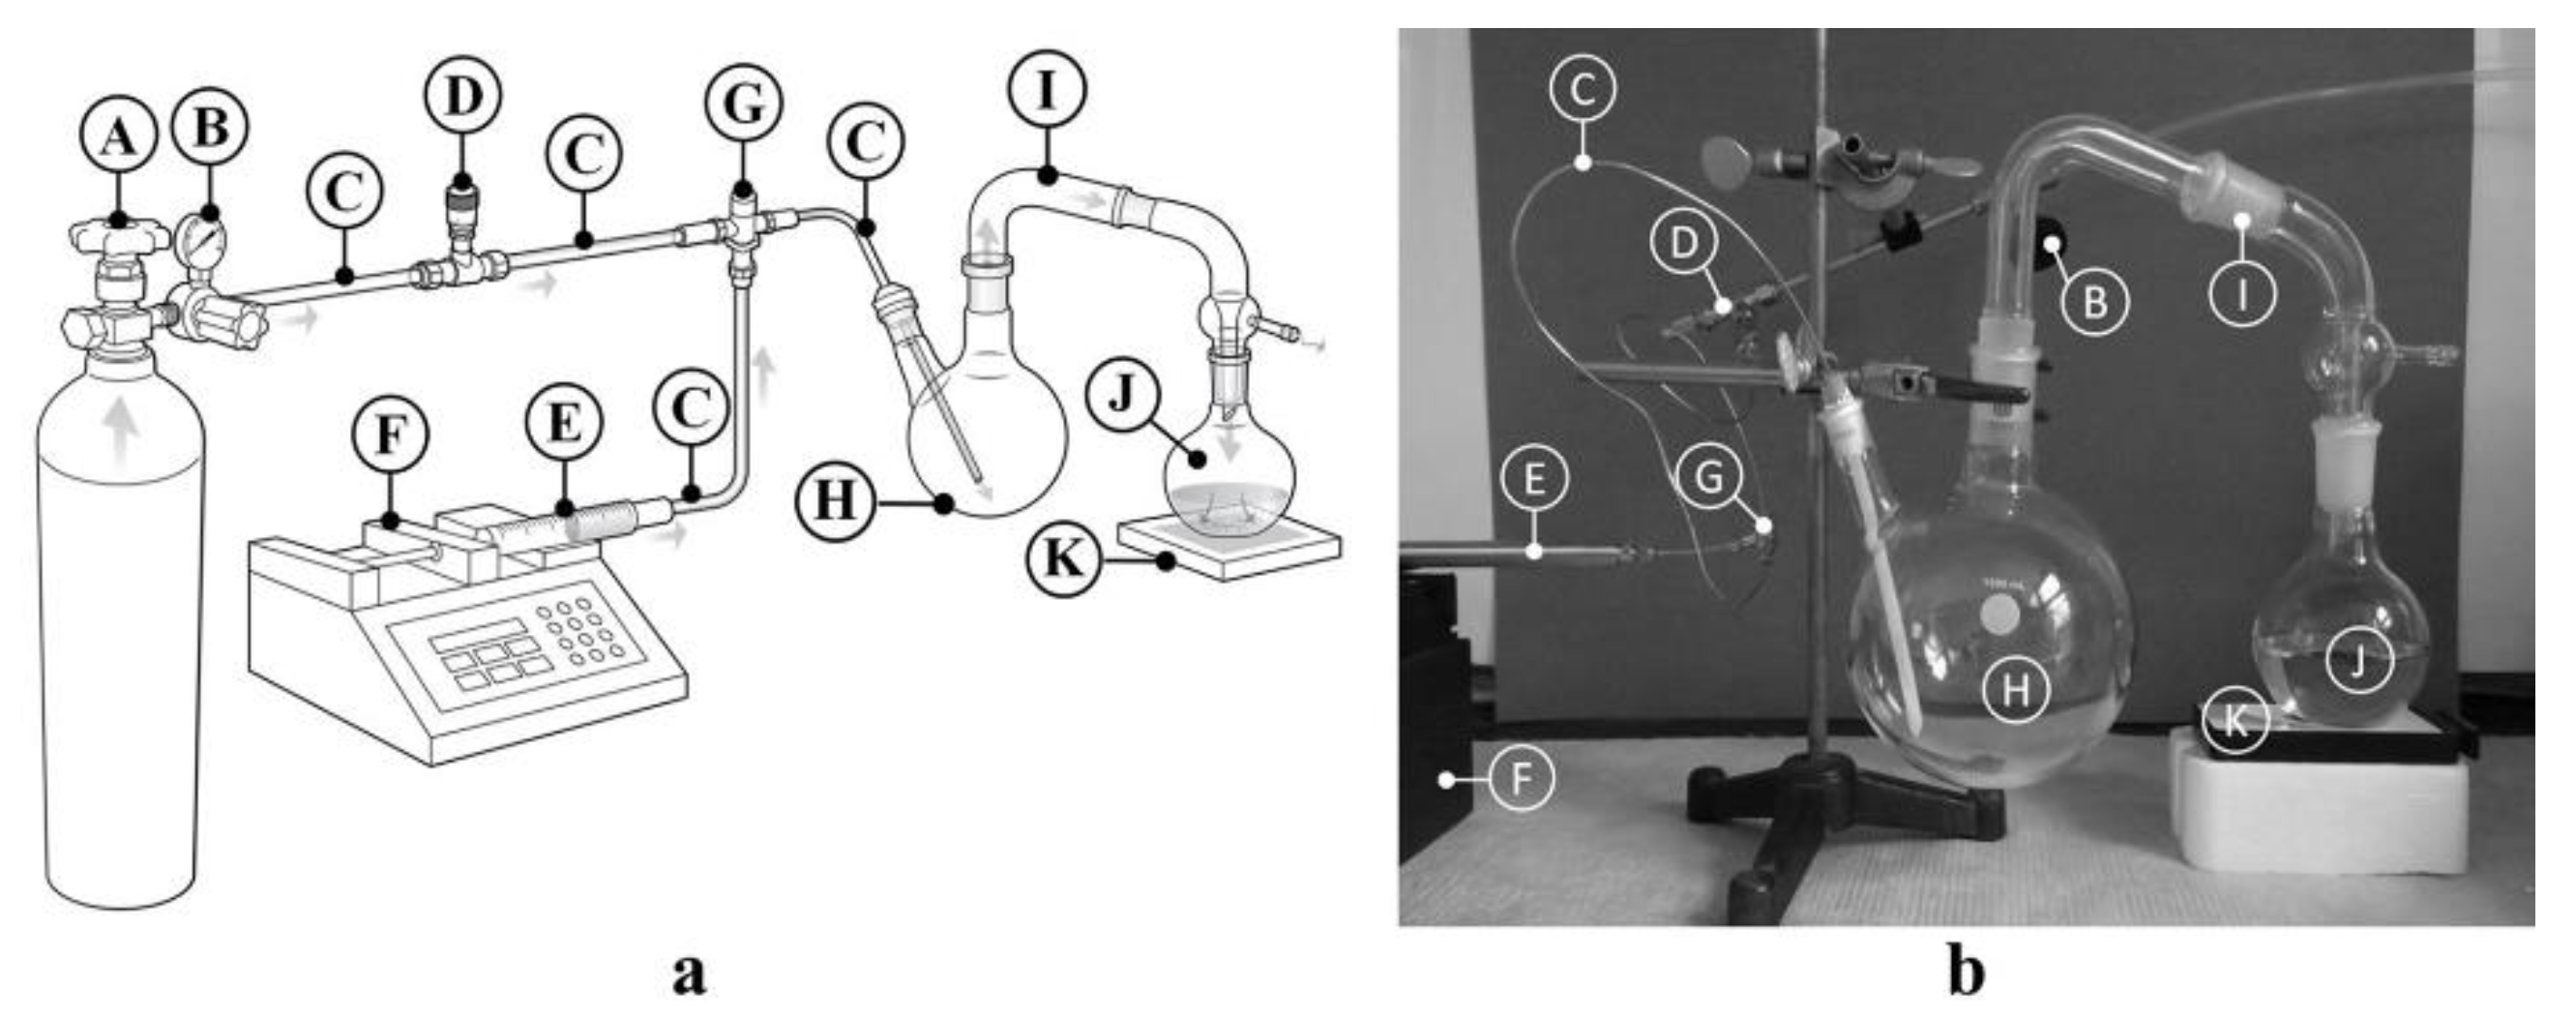
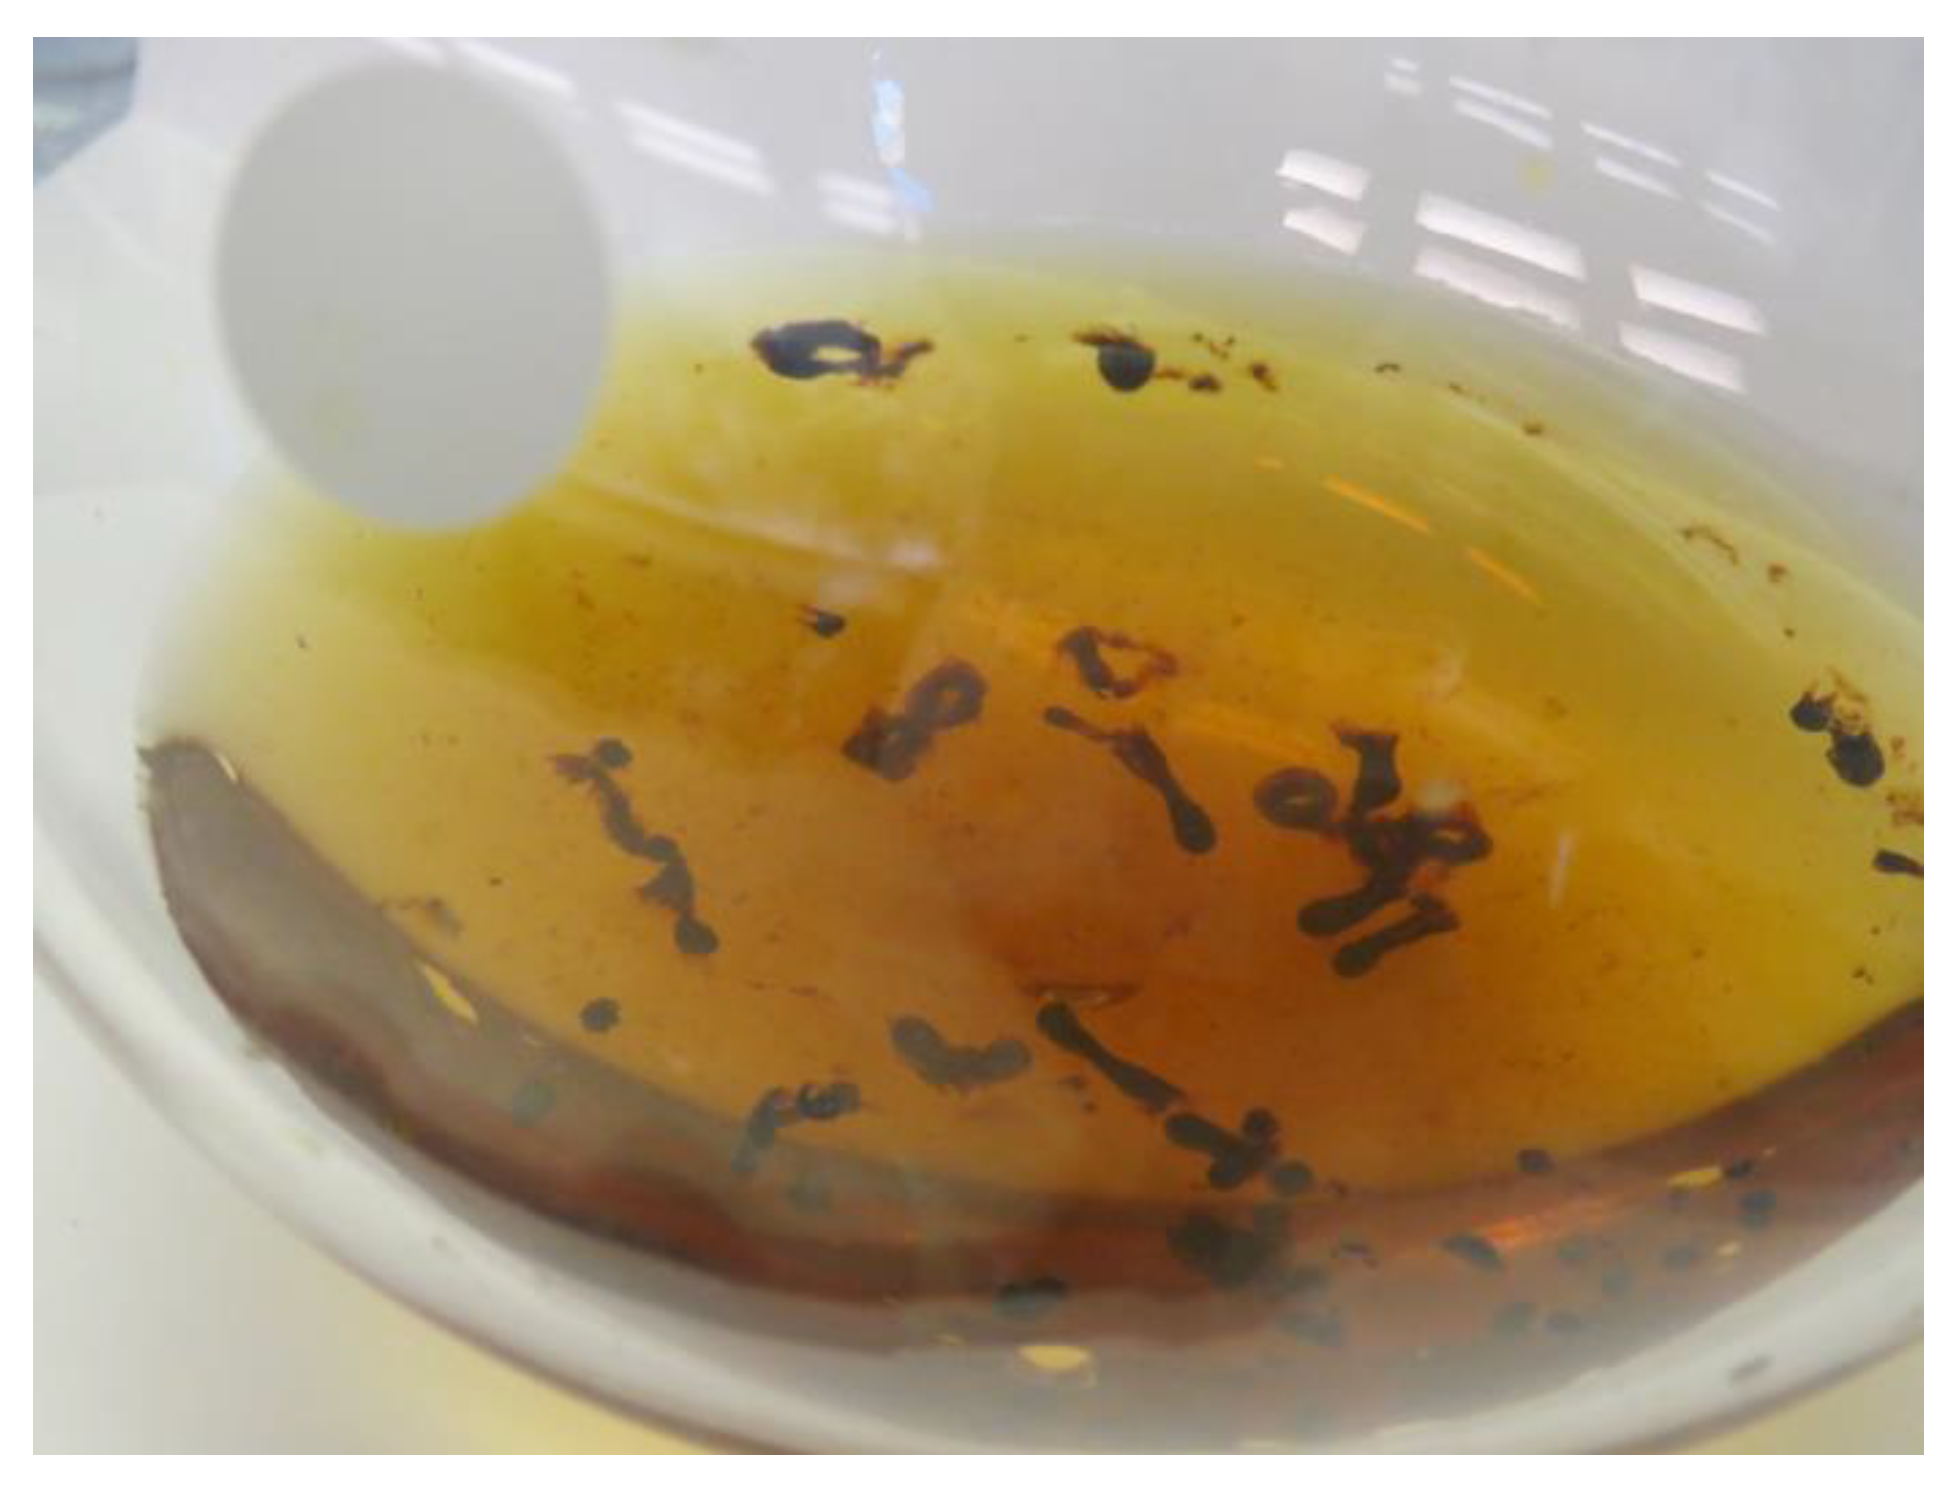
2.1. Apparatus

Figure 1 presents a diagram and photograph of the apparatus developed for the synthesis of magnetite nanoparticles (MNP) using NH3(g) headspace and iron salts (Fe2+, Fe3+) solution, in Vessel J. The apparatus is described in detail in the Section 3.2.4. With the apparatus, a steady-state concentration of NH3(g) is delivered into Vessel J, which results in a diffusion and equilibrium controlled [OH] in solution following diffusion of NH3(g) and equilibrium to NH3(aq) (Equation (1) and Figure 2). The mass flow rate-controlled delivery of NH3(g) into Vessel J is calculated with Equation (4), with [NH3(g)] using Equation (5). The [NH3(aq)] is proportional to [NH3(g)], and is in part described with Henry’s constant, 59 M/atm (NTP) 33, and is observed as an interface in water with phenolphthalein indicator dye, Figure 2. If the aqueous layer is not agitated, an interface of high [OH] is developed. This uniform high [OH] interface (~55 cm2) provides unlimited OH for reaction with Fe2+ and Fe3+ to magnetite. The reaction interface also defined the region between high [OH¯] and high [H+]. As iron salts react with OH¯ and the products of reaction diffuse from the interface into high [H+], stopping further reactions [15], additional OH¯ at the interface is developed following LeChatelier’s principle, Equation (1). The equilibrium favors diffusion of NH3(g) to the aqueous phase of the interface, which results in additional OH¯ diffusion into the reaction interface.
N H 3 ( g ) N H 3 ( a q ) + n H 2 O N H 4 ( a q ) + + O H ¯ + n H 2 O      ( T , P )
Solutions of iron salts (2:1, mol:mol, Fe2+:Fe3+) [31], in equilibrium with steady-state [NH3(g)] headspace, developed color changes from clear, light yellow to black as insoluble magnetite was synthesized, as described in Equation (2). Importantly, initial studies involving total concentrations of ferrous and ferric 10 mM to molar, all of which resulted in little to no MNP yield. Visible are sheets of iron oxides at the iron salts solution surface at 10 mM, Figure 3a, which then resulted in a physical barrier to NH3(g) diffusion. Reducing total iron concentrations to 3.8 mM, Figure 3b, resulted in controlled MNP synthesis with ferrous and ferric ions and OH¯ from NH3(g) in equilibrium with aqueous (Equation (1)). This resulted in visible discrete streams of MNPs at the reaction interface which were drawn from the reaction interface through the bulk solution.
2 F e 2 + + F e 3 + + 8 O H ¯ F e 3 O 4 ( s )
Magnetite synthesis was observed at the interface (Figure 4a) within 2 min following equilibrium development with steady-state NH3(g) headspace. Magnetic particles were magnetically drawn from that interface, into the high [H+] bulk solution (Figure 4b), terminating particle growth [15]. The suspension was black within 90 min (times for complete synthesis were approximately 90 min, regardless of [NH3(g)] headspace studied in our work) (Figure 4c), after which Vessel J was removed from the apparatus, lightly swirled, and a neodymium magnet was placed on the vessel wall. The suspension was stable for at least 3 months at 4 °C, under nitrogen. The clear aqueous fraction, (Figure 4d), pH ~6 to 7, was analyzed using ICP-MS. Post synthesis, residual iron concentrations were 42 ± 18 ppb, compared to 210 ppm initial, which was >99.9% reaction of the iron salts.
Observation of issues with direct base titration of Fe2+, Fe3+ solutions pointed to a reaction rate issue where the velocity of Fe3O4 synthesis was maximal, leading to the observed formation of iron oxide clumps of crystals, Figure 5. Conventional chemical coprecipitation, for the purpose of maximizing MNP mass output, includes molar concentrations of Fe2+, Fe3+, and OH¯ [31]. Equation (3) describes the velocity of Fe3O4 formation (from Equation (2)), which is maximal when concentrations of Fe2+, Fe3+, and OH¯ are similar. But it is under these conditions that lead to the observed issues shown in Figure 5.
v = k [ F e 2 + ] 2 [ F e 3 + ] [ O H ] 8
Sonication and agitation were required to disrupt the iron oxide and realize MNPs. It is noteworthy that pure MNP synthesis and high yield are rarely discussed in literature. In order to minimize the phenomenon observed in Figure 5, researchers have attempted to decrease the droplet size of base titrant [21,22], still with limited success for MNP synthesis yield and mass. It was apparent from Equation (3) that when [OH¯] >> [Fe2+] + [Fe3+] and when d[OH¯]/dt = 0, i.e., steady-state for OH¯, that the rate of Fe3O4 formation would be dependent on the concentrations of [Fe2+] + [Fe3+]. This led to the consideration of studying mM concentrations of total [Fe2+] + [Fe3+], rather than M concentrations. The development of steady-state [OH¯], using our steady-state ammonia gas generation system as the headspace shown in Figure 6 satisfied these reaction conditions.
We can also predict under these reaction conditions, with [OH¯]>>[Fe2+] + [Fe3+], that the reaction will not be dependent on [OH¯], which is shown below. Considering Le Chatelier’s principle, reaction of interfacial OH¯ with Fe2+ and Fe3+ results in additional OH¯ from NH3(g) to NH4+OH¯. The chemical potential for iron ion reactions therefore is maximal. It is assumed that the velocity of the reaction is, under these conditions, dependent on rate of diffusion of iron ions from the bulk solution to the reaction interface, with D Fe2+ = 7.19 × 10⁻⁶ cm2/s and D Fe3+ = 6.04 × 10⁻⁶ cm2/s (NTP), and with a concentration gradient of iron ions from the bulk solution to the reaction interface. As the reaction proceeds, decreasing concentrations of iron further decrease the velocity of Fe3O4 synthesis, until essentially all iron ions have reacted. Nucleation and growth of magnetite is realized in the reaction interface, with termination once the particle is no longer neutrally buoyant, and settles into the region of high H+ (Figure 4b).
Controlled experiments to quantify this will be carried out and will involve subsampling from the reaction interface and from the bulk solution of iron ions, with analysis using ICP-MS. Finally, further understanding of the reaction interface will be carried out using cross flow synthesis systems, with discrete mixing chambers, using real-time particle analysis detection.

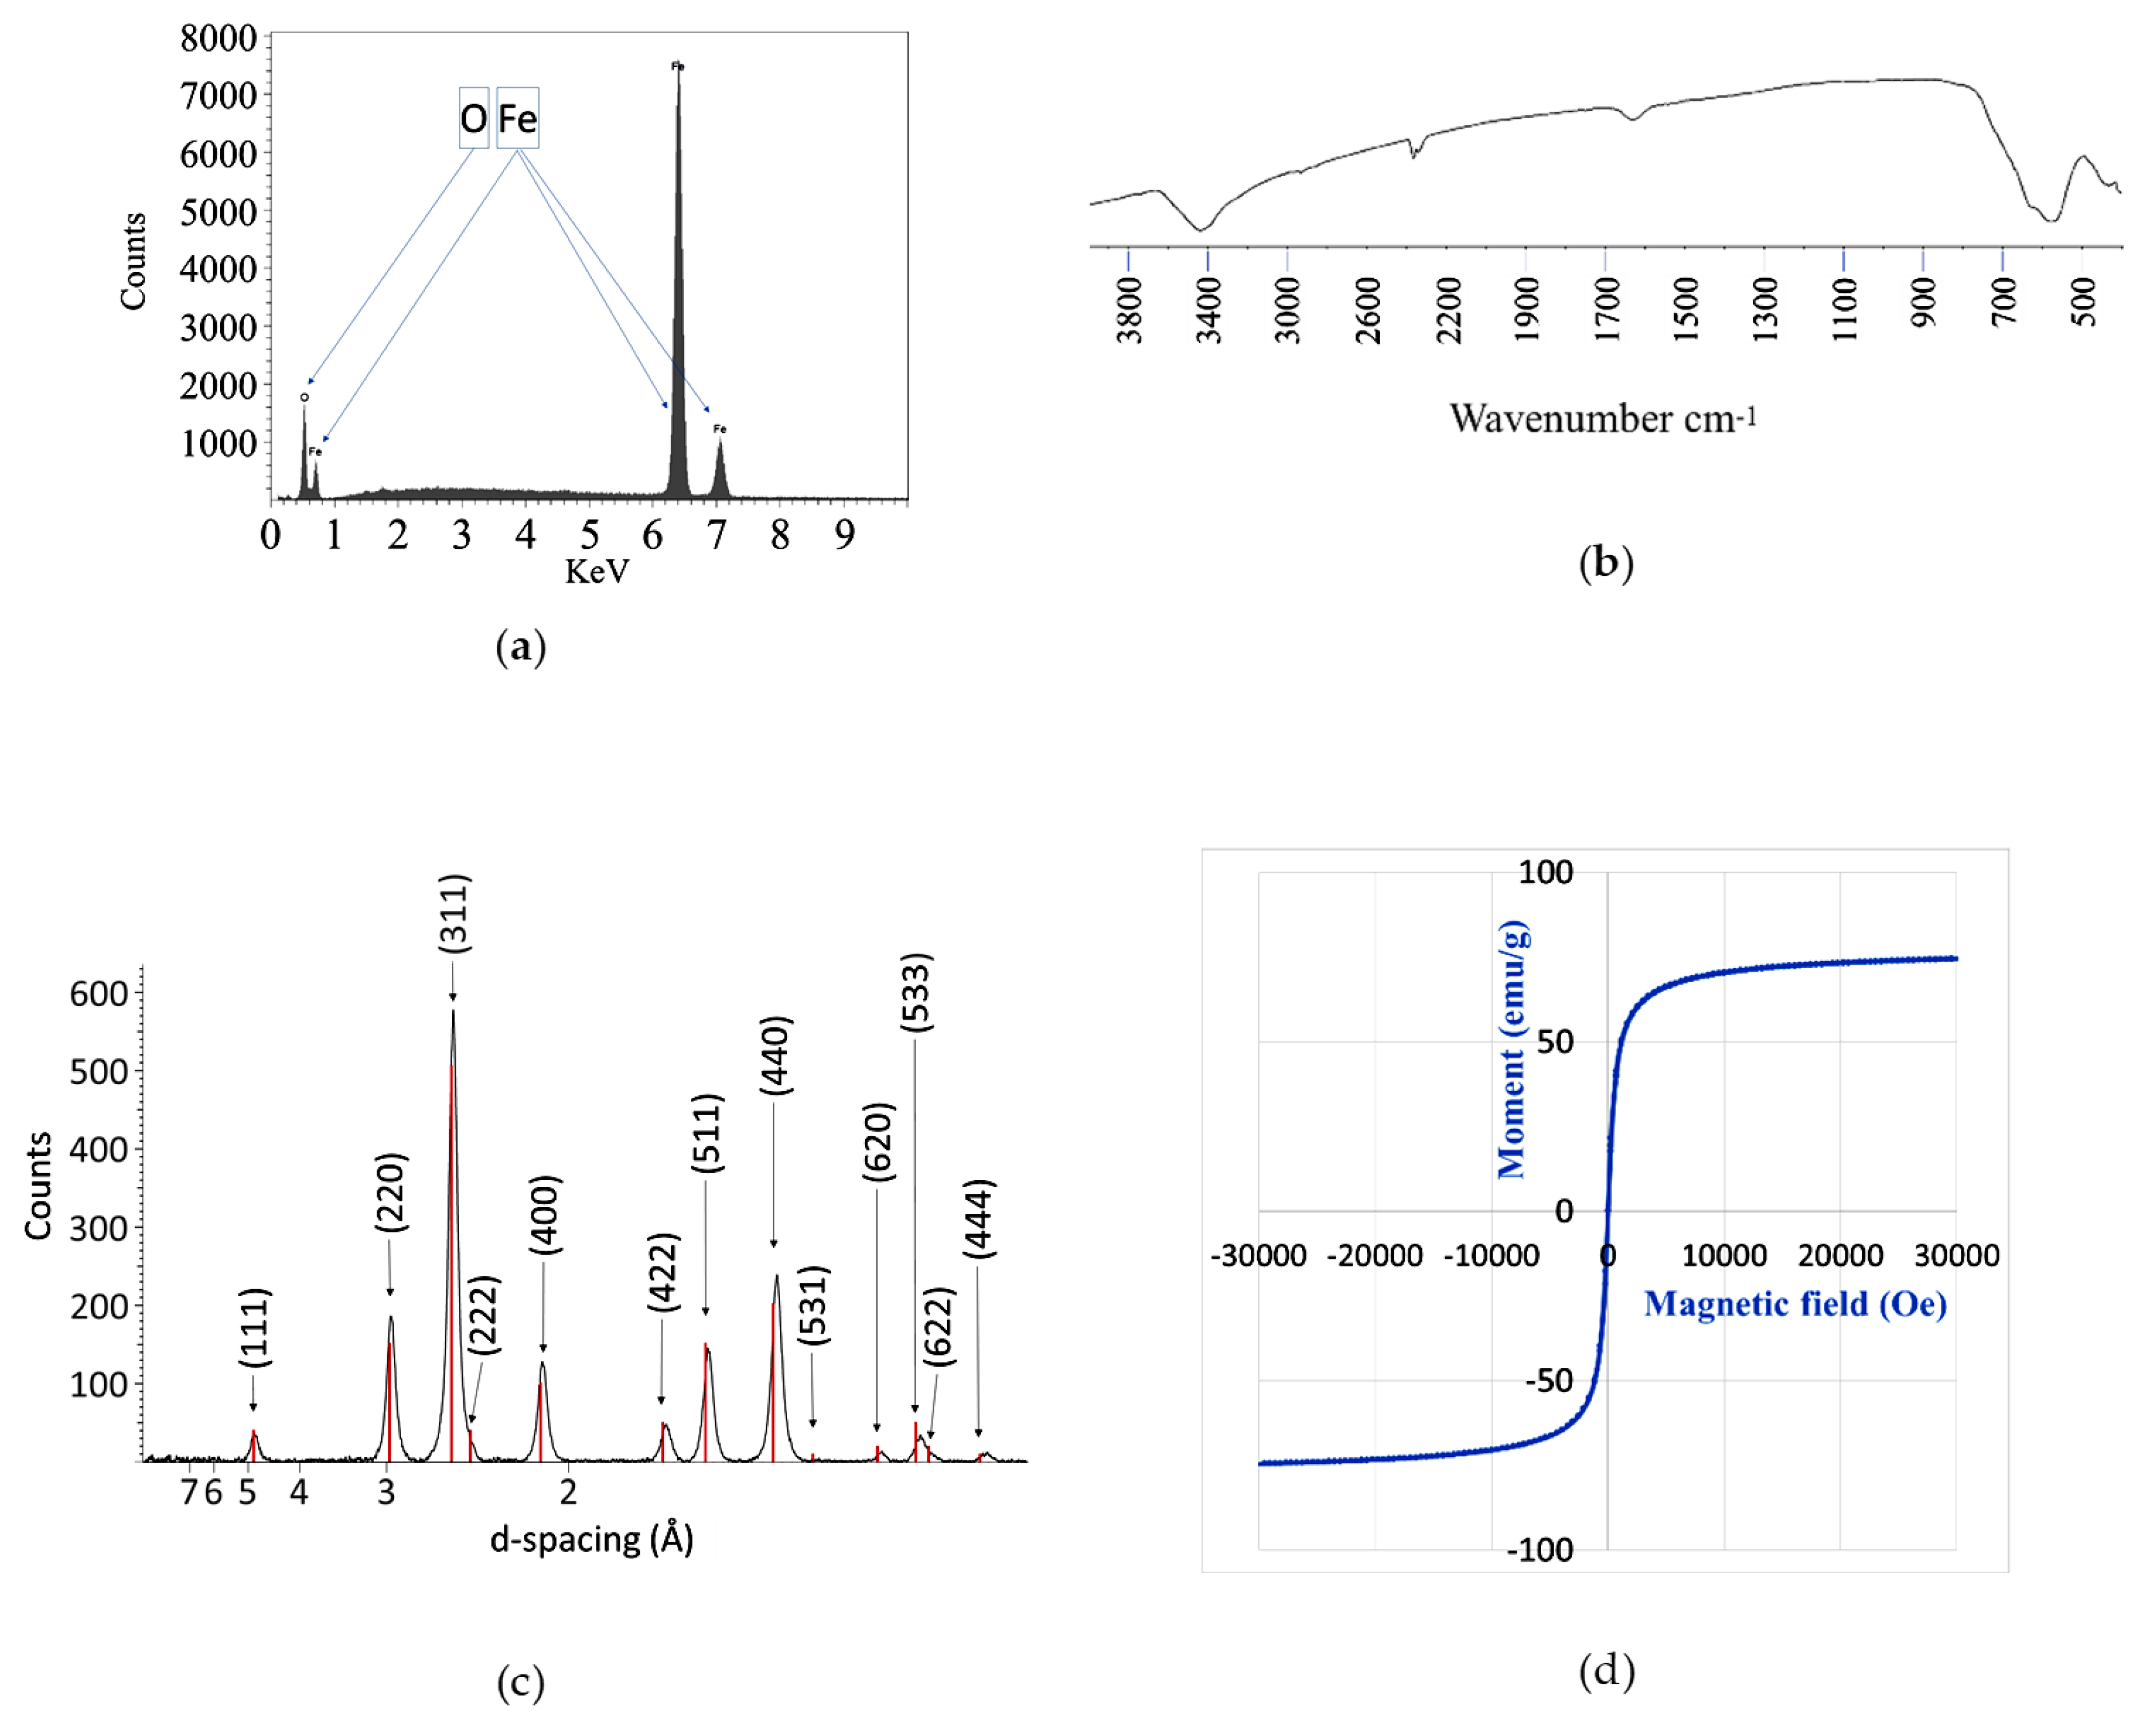
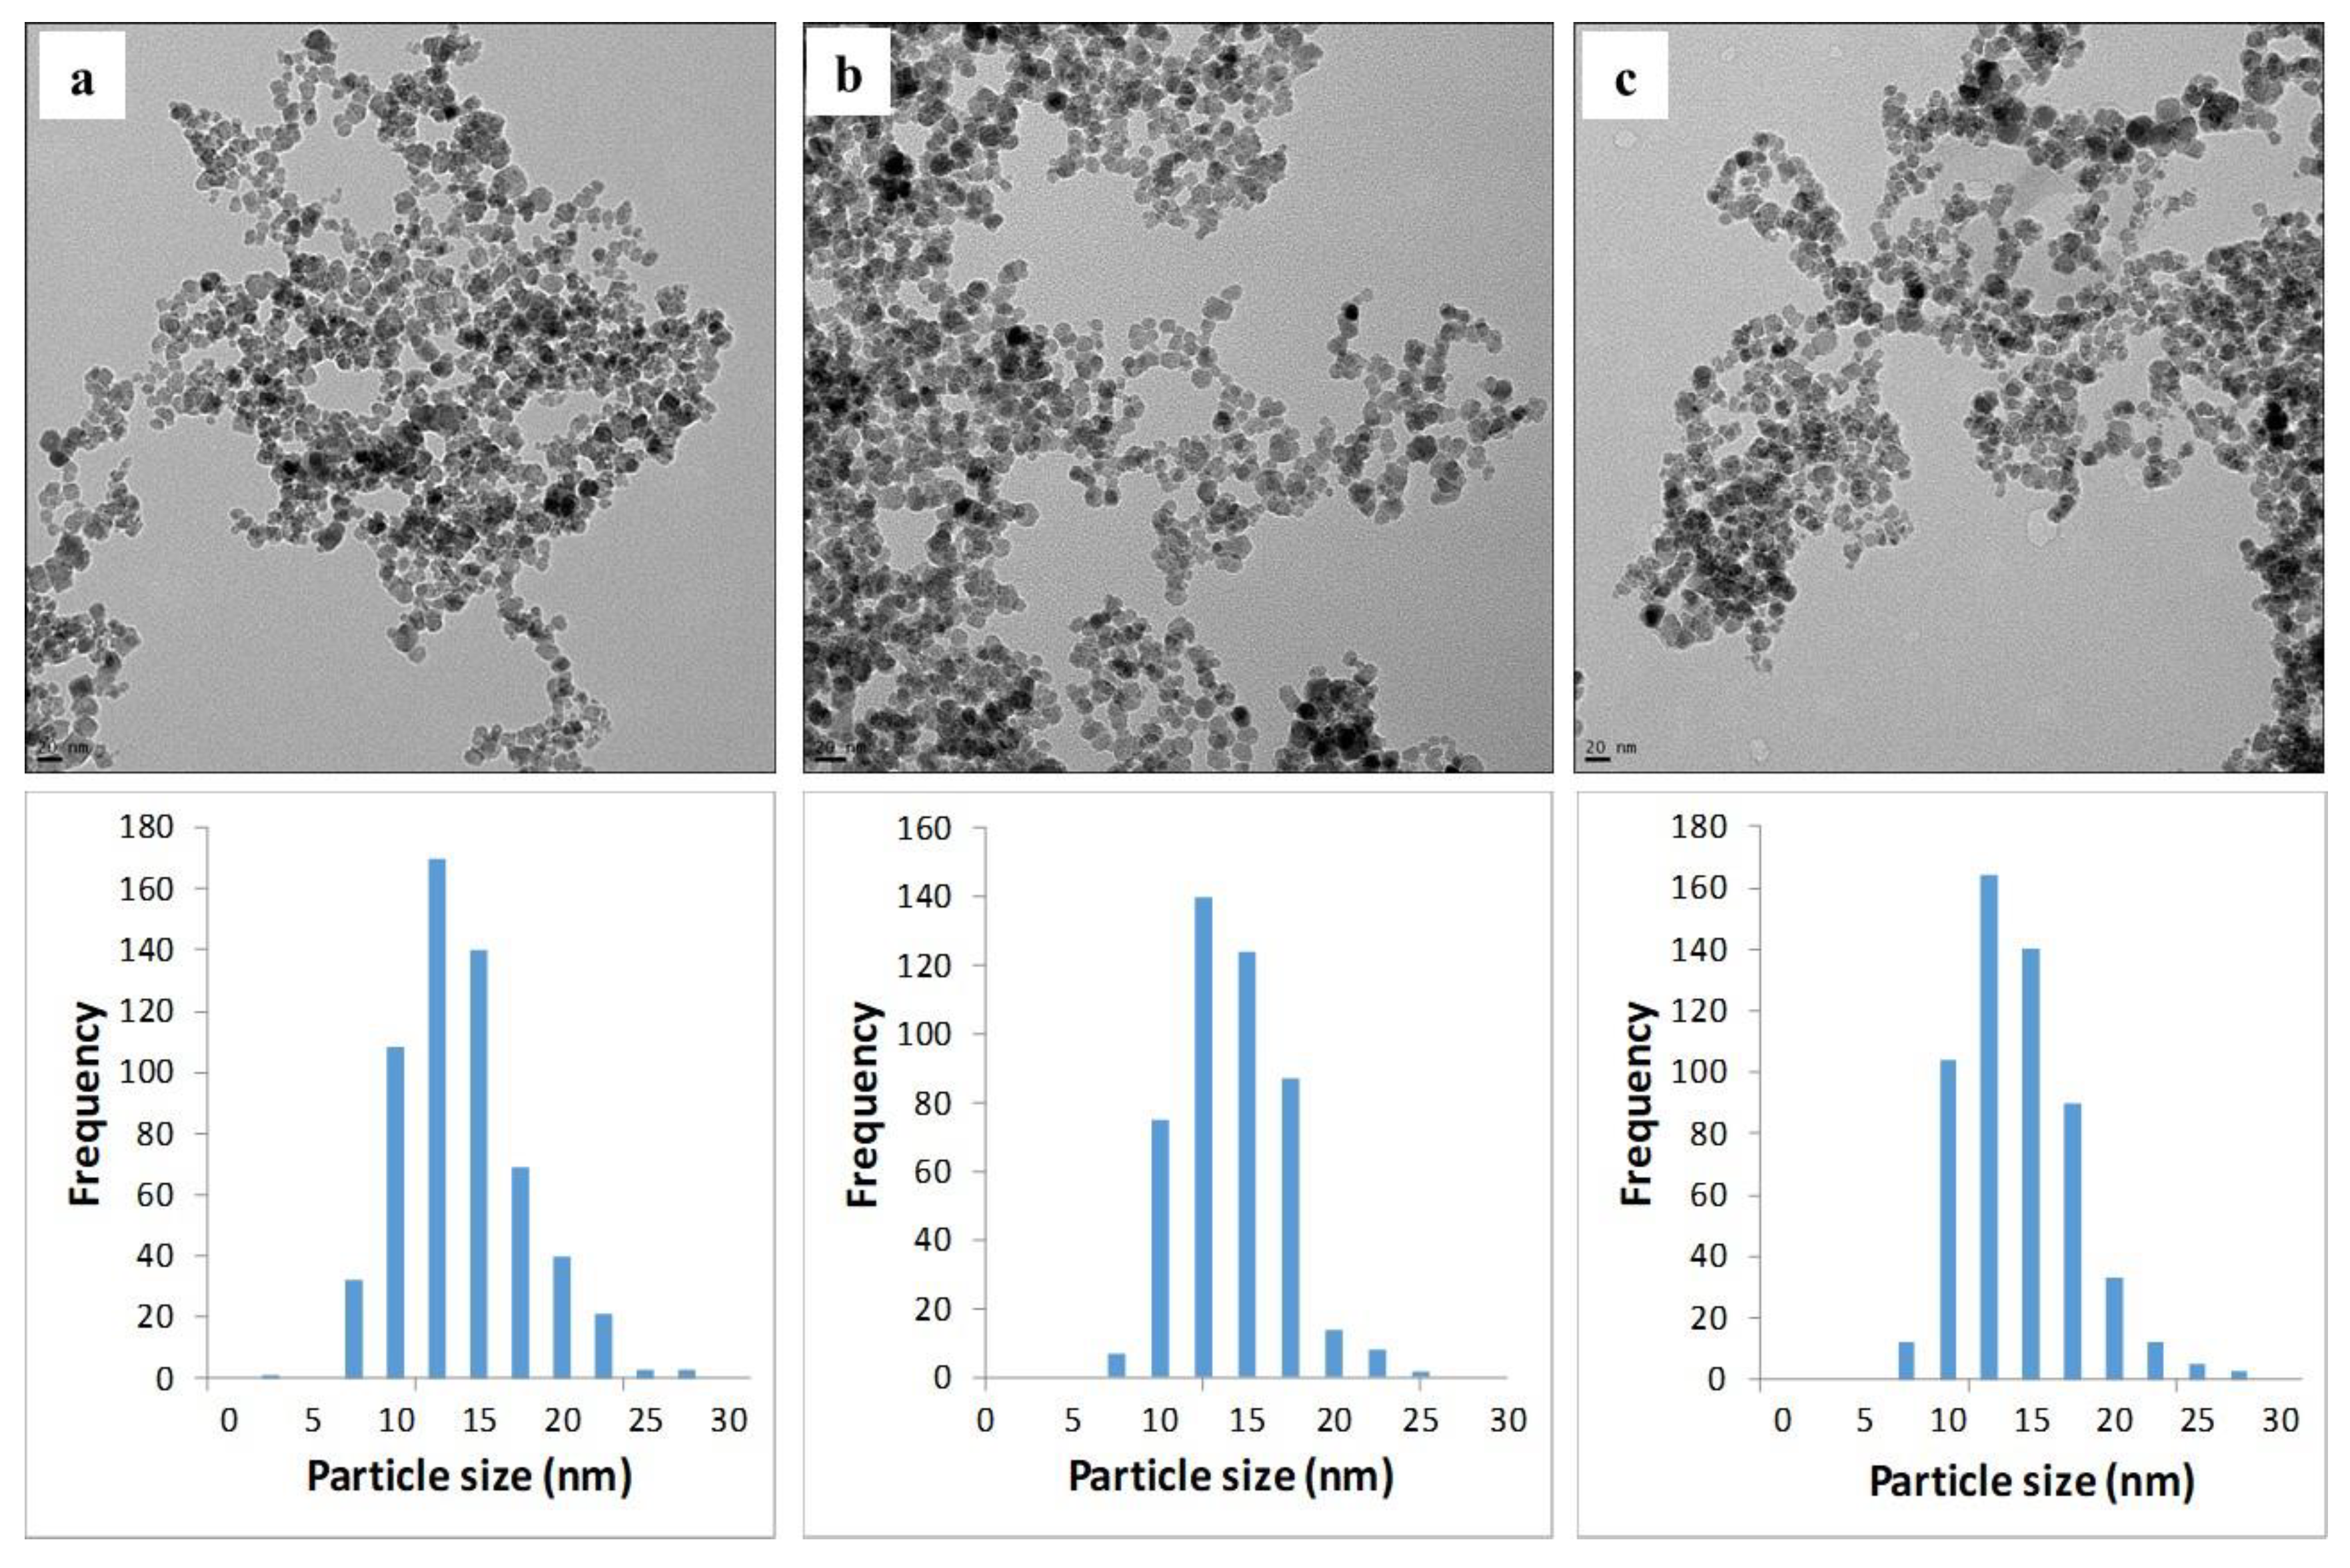
2.2. Material Analyses

The EDXRF spectrum of synthesized nanoparticles show elemental emission corresponding to iron, 0.7, 6.4, 7.1 keV and oxygen, 0.5 keV (Figure 7a), resulting with the elemental composition of Fe, 72.6% ± 0.4% and O, 27.4% ± 0.4%. Elemental composition analyses were confirmed using reference Fe3O4 nanoparticles (50–100 nm), with the elemental composition of Fe, 72.4% and O, 27.6%. The calculated concentrations of Fe and O suggest composition of 3Fe to 4O and within one standard deviation are highly consistent with magnetite.
Figure 7b shows an FT-IR spectrum for synthesized nanoparticles. Absorption at 580 cm−1, 1630 cm−1, 2350–2400 cm−1, and 3435 cm−1 were observed, consistent with literature [22,32]. Absorption at 580 cm−1 agrees with theoretically calculated vibrational frequencies for Fe-O, ca. 545–600 cm−1 [33].
Diffraction patterns of synthesized nanoparticles (Figure 7c) are: d -spacing: 4.85, 2.97, 2.53, 2.42, 2.10, 1.71, 1.62, 1.48, 1.42, 1.33, 1.28, 1.27, 1.21 corresponding to Miller indices of the crystal planes: (111), (220), (311), (222), (400), (422), (511), (440), (531), (620), and (444). Reference magnetite (Fe3O4) from the Joint Committee on Powder Diffraction Standards (JCPDS PDF 00-019-0629) is shown in red. These results strongly suggest a single phase of polycrystalline magnetite (Fe3O4). Estimated crystallite sizes uses the Scherrer equation, with the result being in the order of 11 nm diameter, but this is not actually a reflection of particle size. This was considering 35 to 50 degrees, 2θ, FWHM = 1 2θ, and K = 1, with λ = 1.78 Å. The absence of three diffraction patterns for (110), (210), and (211), with d-spacings of 5 to 3 exclude maghemite (ɣ-Fe2O3) and other common iron oxides such as hematite (α-Fe2O3) and goethite (FeO2H) [29,34].
Figure 7d shows a typical magnetization saturation curve for our synthesized nanoparticles, without hysteresis, which indicates these nanoparticles are super-paramagnetic. Typical magnetization saturation values were in the range 71–75 emu/g. Reference standard magnetite nanoparticles, 50 to 100 nm, show magnetization saturation of 99 emu/g (data not shown). Observation of lower magnetization saturation for our synthesized nanoparticles is highly consistent with magnetite nanoparticles, given a decreased magnetization saturation is observed as the surface properties particles become more significant with decreasing particle sizes [35,36].
Representative, replicate analyses of TEMs, (Figure 8) for 3.8 mM total Fe2+:Fe3+ with variable [NH3(g)] headspace demonstrated repeatable MNP syntheses; TEMs among analysts were also compared, and over time, with no distinguishable differences based on particle shapes and sizes (Table 1). Incomplete synthesis products, such as lepidocrocite, goethite, and hematite [15,19,20] were not observed in any TEMs.
There was no impact on particle size distributions and descriptive statistical analyses with varying [NH3(g)] headspace. All frequency distributions were normal with a slight positive skew.

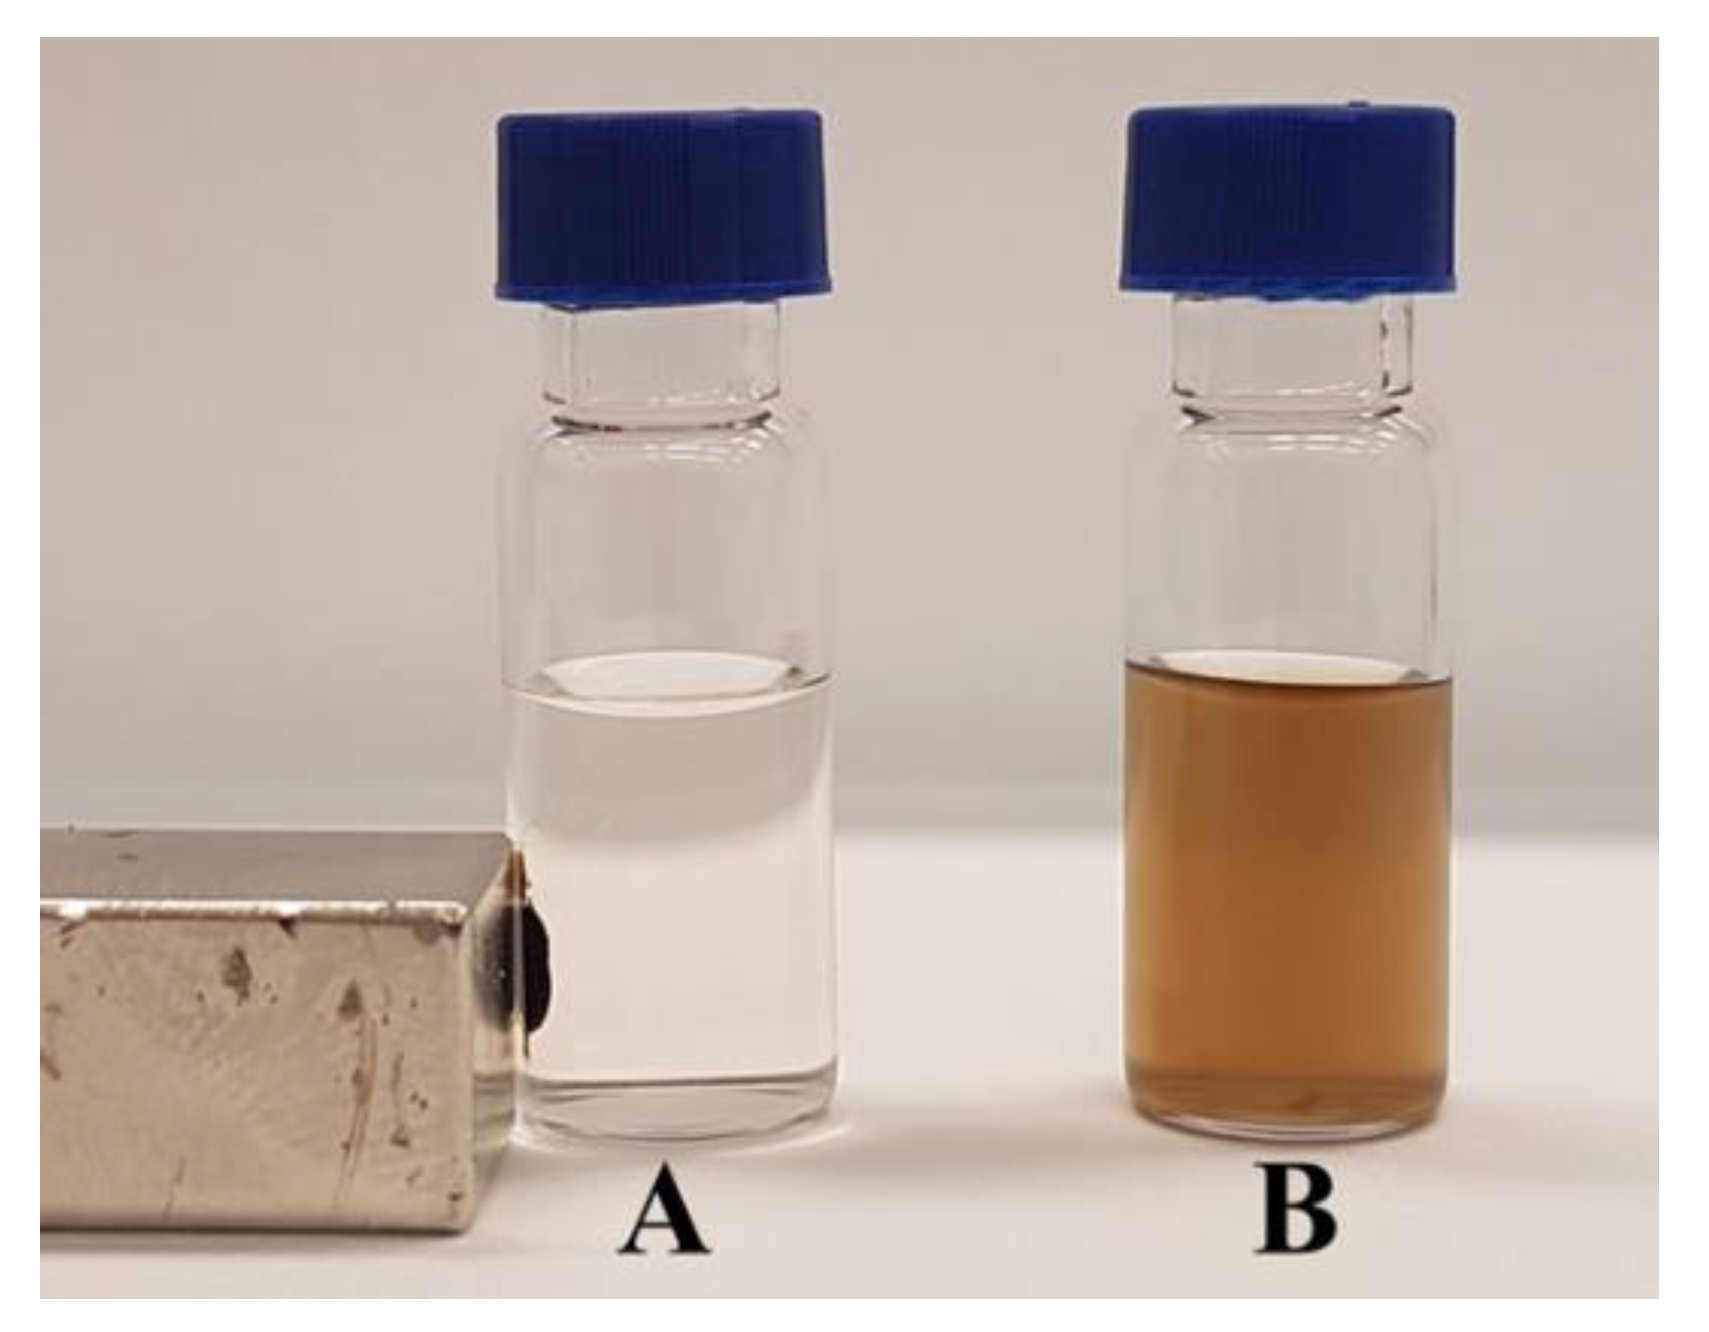
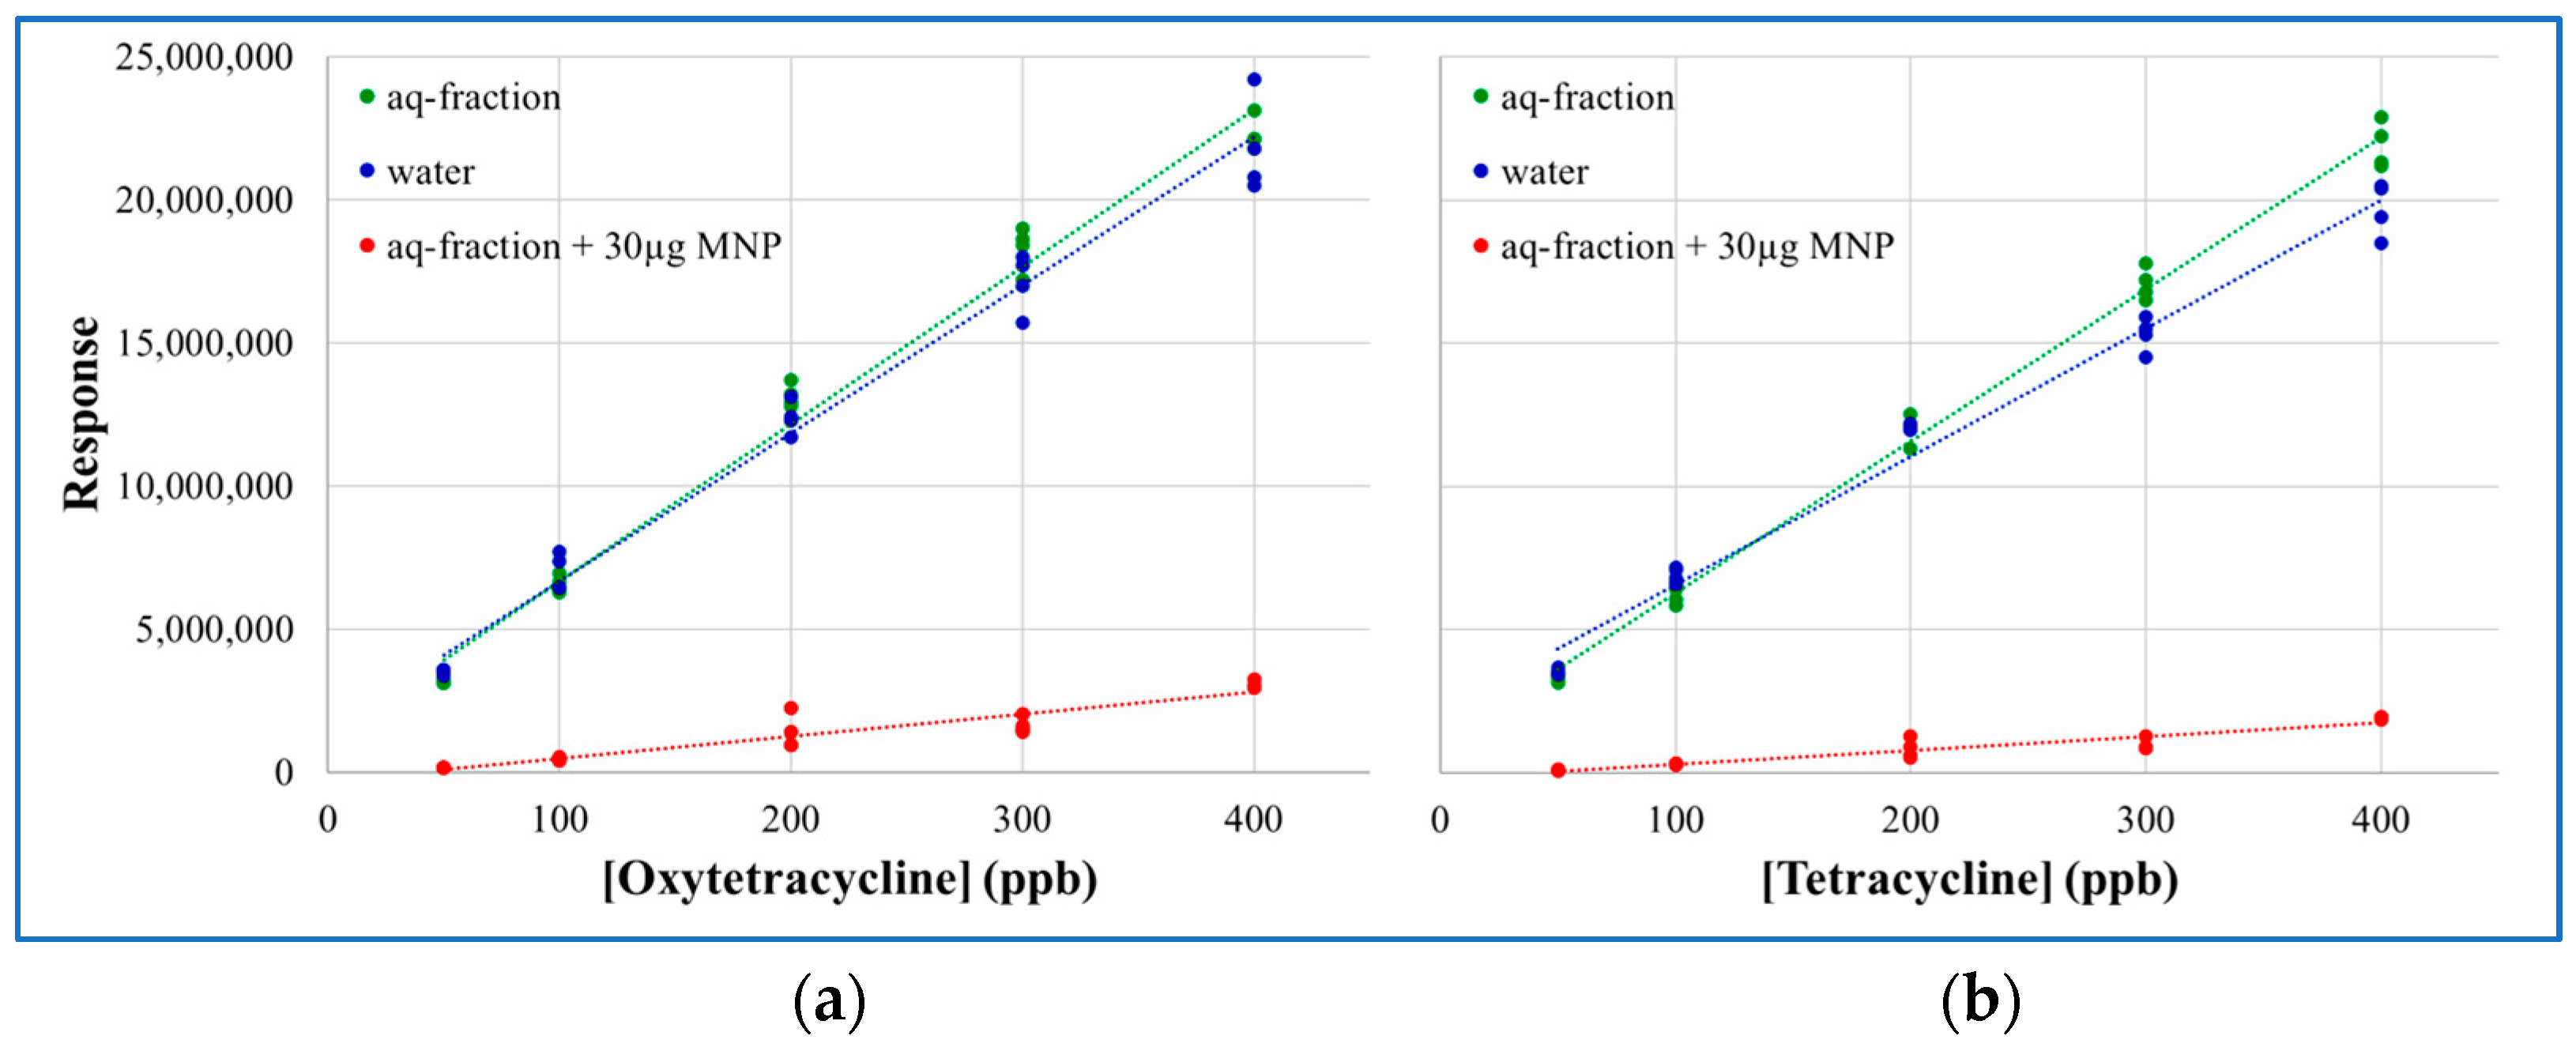
2.3. MNP Extraction of Tetracyclines

Synthesized MNPs were used to selectively extract oxytetracycline (OTC) and tetracycline (TC) in solution as a proof of concept for applications in international food safety initiatives [37]. The MNPs were magnetically drawn from suspensions in solutions of tetracyclines, after 30 s mixing (Figure 9). Calibration curves, (Figure 10), for both OTC and TC, with and without extraction with 30 µg MNPs (100 µL MNP suspension), yield from 83–96% extraction for OTC and 89–97% extraction for TC, for all mass loadings of the tetracyclines. The use of 30 µg MNP extracts ~97% tetracyclines at 200 ppb.
The affinity of tetracyclines to bind to polyvalent metallic cations has been studied [38]. Coordination and absorption of these complexes are considered insoluble or poorly absorbed, which decrease their therapeutic efficacy in biological systems. We have previously shown (American Chemical Society, Washington, 2017, Analytical challenges and developments for methods required to support regulatory requirements) [39] that iron oxide contaminants from aqueous mobile phase (<0.20 µm) accumulated at the head of UHPLC columns, which selectively interfered with the elution of tetracyclines from a mixture of injected tetracyclines: peak shape, symmetry, and elution time were all impacted. Given the relatively large particle sizes, back flushing the column and using mobile phase free of iron oxides solved the issue. This observation led to the development of a proof of concept for an analytical approach to extract tetracyclines with MNP without surface modification. Complete adsorption profiles for the tetracyclines and MNP mass loadings and surface areas will be the focus of future research.

3. Materials and Methods

3.1. Materials and Instrumentation

Iron(II) chloride 4H2O (99.9%) (MW 198.811, 28.089% Fe2+), iron(III) chloride 6H2O (≥99.9%) (MW 270.294, 20.661% Fe3+), iron(II)(III) oxide (magnetic nanoparticle in toluene 10 nm ± 1 nm), sodium hydroxide (semiconductor grade ≥ 99.99%), phenolphthalein, oxytetracycline, tetracycline, and formic acid (>99%) were all purchased from Sigma Aldrich.
Iron(II)(III) oxide Fe3O4 (97% magnetite nanoparticle 50–100 nm), Optima LC-MS grade water, methanol and ammonia solution (25.1% w/v, 0.91 g /mL), and calcium chloride were purchased from Fisher Scientific. A Sartorius 4 point (Entris 124i) was used, annually re-certified. Ultra-high purity nitrogen (UHP) (99.998%) was purchased from Praxair, Ontario. An inline auxiliary carbon module from Parker Balston P/N B06-0182 was used to purify nitrogen. A precision nickel plated brass 1/4” metering valve, stainless steel 1/16” tee and stainless-steel tubing (0.020-inch, 1 m) were purchased from Chromatographic Specialties Inc. A Harvard (PHD 2000) syringe pump to deliver ammonia solution was from Harvard Apparatus, Holliston, Massachusetts.
All glassware including Class A volumetric flasks, and neodymium magnets were purchased from Fisher Scientific. A Gilson auto pipette (5.000 mL ± 0.0005 mL) from Fisher Scientific. Stainless-steel luer lock needles (17-gauge), compression nuts, ferrules, and stainless-steel mixing tee (20 μL internal volume) were purchased from Chromatographic Specialties Inc., Canada. The 2.5 mL high-pressure stainless-steel syringe with 1/16” Swagelock was purchased from KD Scientific. Gas flow rate measurements were carried out using an HP-1 bubble flow meter (1–50 mL) (Hewlett-Packard) and a Bios Defender 510 Primary Flow Meter (MesaLabs, CO, USA). Volumetric gas flow rates were corrected using barometric pressures acquired from the local airport. Temperatures were measured using a NIST traceable thermometer. A Branson sonicator (VWR) was used. A Cole-Parmer vortex was used.
Samples were imaged on a 200-kV field emission TEM FEI Tecnai G2 F20 fitted with a bottom-mounted Gatan 4K CCD. An Agilent 5110 ICP-OES with a Burgener peek Mira Mist nebulizer and double pass glass cyclonic spray chamber coupled to a ESI SC-DX fast autosampler was used for all ICP-MS analyses. Samples were pressed to disks using a Carver® hydraulic press. A HITACHI S-4500 scanning electron microscope coupled to a Quartz Xone energy dispersive spectrometer was used for EDXRF analysis. A Bruker Tensor 27 FTIR supplied with MCT (mercury, cadmium, telluride) 100-µm detector was cooled with liquid nitrogen with data processed using OPUS Bruker 7.5 software. A Bruker® D8 DISCOVER coupled with a DAVINCI.DESIGN and Vantec 500 (MiKroGap TM technology) area detector was used for XRD analysis, 2D frames were collected with DIFFRAC. Measurement Centre Version 6.5 software and integrated to 1D using DIFFRAC.EVA Version 4.0 (Bruker AXS). A Quantum Design’s MPMS 3 SQUID with MPMS 3 MultiVu software was used for data collection. Sciex 5500 LC-MS/MS equipped with a Shimadzu auto sampler, binary UHPLC pump, Nexera XR column oven and Waters C-18 column (2.1 × 50 mm, 1.7 µm particle size) was used and Analyst 1.6.2 software was utilized for data processing.
Illustrations were developed using Adobe Photoshop (version 12.2.0.385) and photos were acquired with a Canon PowerShot SX60 HS. ImageJ software was used for particle size analysis. Graphical representation of data was prepared in Microsoft® Excel® for Office 365 MSO (16.0.1243.20112) 32-bit).
Mobile phases for LC-MS/MS analysis were: A: Fisher Optima water with 0.1% v/v formic acid and B: Fisher LC-MS grade methanol with 0.1% v/v formic acid.

3.2. Magnetite Nanoparticle Synthesis

3.2.1. Chemical Co-Precipitation

Stock solutions of iron salts (iron(II) chloride (0.3 M) and iron(III) chloride (0.6 M)) without correction for Fe mol fraction was prepared separately with the addition of 0.6 g FeCl2 and 1.6 g FeCl3 into a 10-mL volumetric flask then filled to line (water) and inverted 100 times to dissolve.
Working standards of iron salts (iron(II) chloride (30 mM) and iron(III) chloride (60 mM)) was prepared from stocks into a 100-mL volumetric flask then filled to line (water) and inverted 100 times; the solution was transferred to a 1000-mL round bottom flask with angled side neck with septum; UHP nitrogen gas was used to purge the solution and headspace (50 mL/min) for 30 min.
A solution of sodium hydroxide (0.4 M) was prepared by the addition of 8 g NaOH into a 500-mL volumetric flask then filled to line (water) and inverted 100 times to dissolve. A total of 25 mL of NaOH(aq) was added to the iron salt solution at a rate of 200 µL/min.

3.2.2. Iron Salts Solutions (Fe2+ and Fe3+)

Stock solutions of iron salts (iron(II) chloride (75 mM Fe2+) and iron(III) chloride (55 mM Fe3+)) were prepared prior to each experiment with the addition of 150 mg of each salt into separate 10 mL volumetric flasks, filled to line with water, and inverted 100 times to dissolve.
Working solution mixtures of iron salts were prepared with varying concentrations (3.8 mM, and 10 mM) for 2:1 mol:mol Fe2+:Fe3 ratio in 100 mL volumetric flasks. These solutions were transferred to a 250 mL reaction vessel without nitrogen purging.

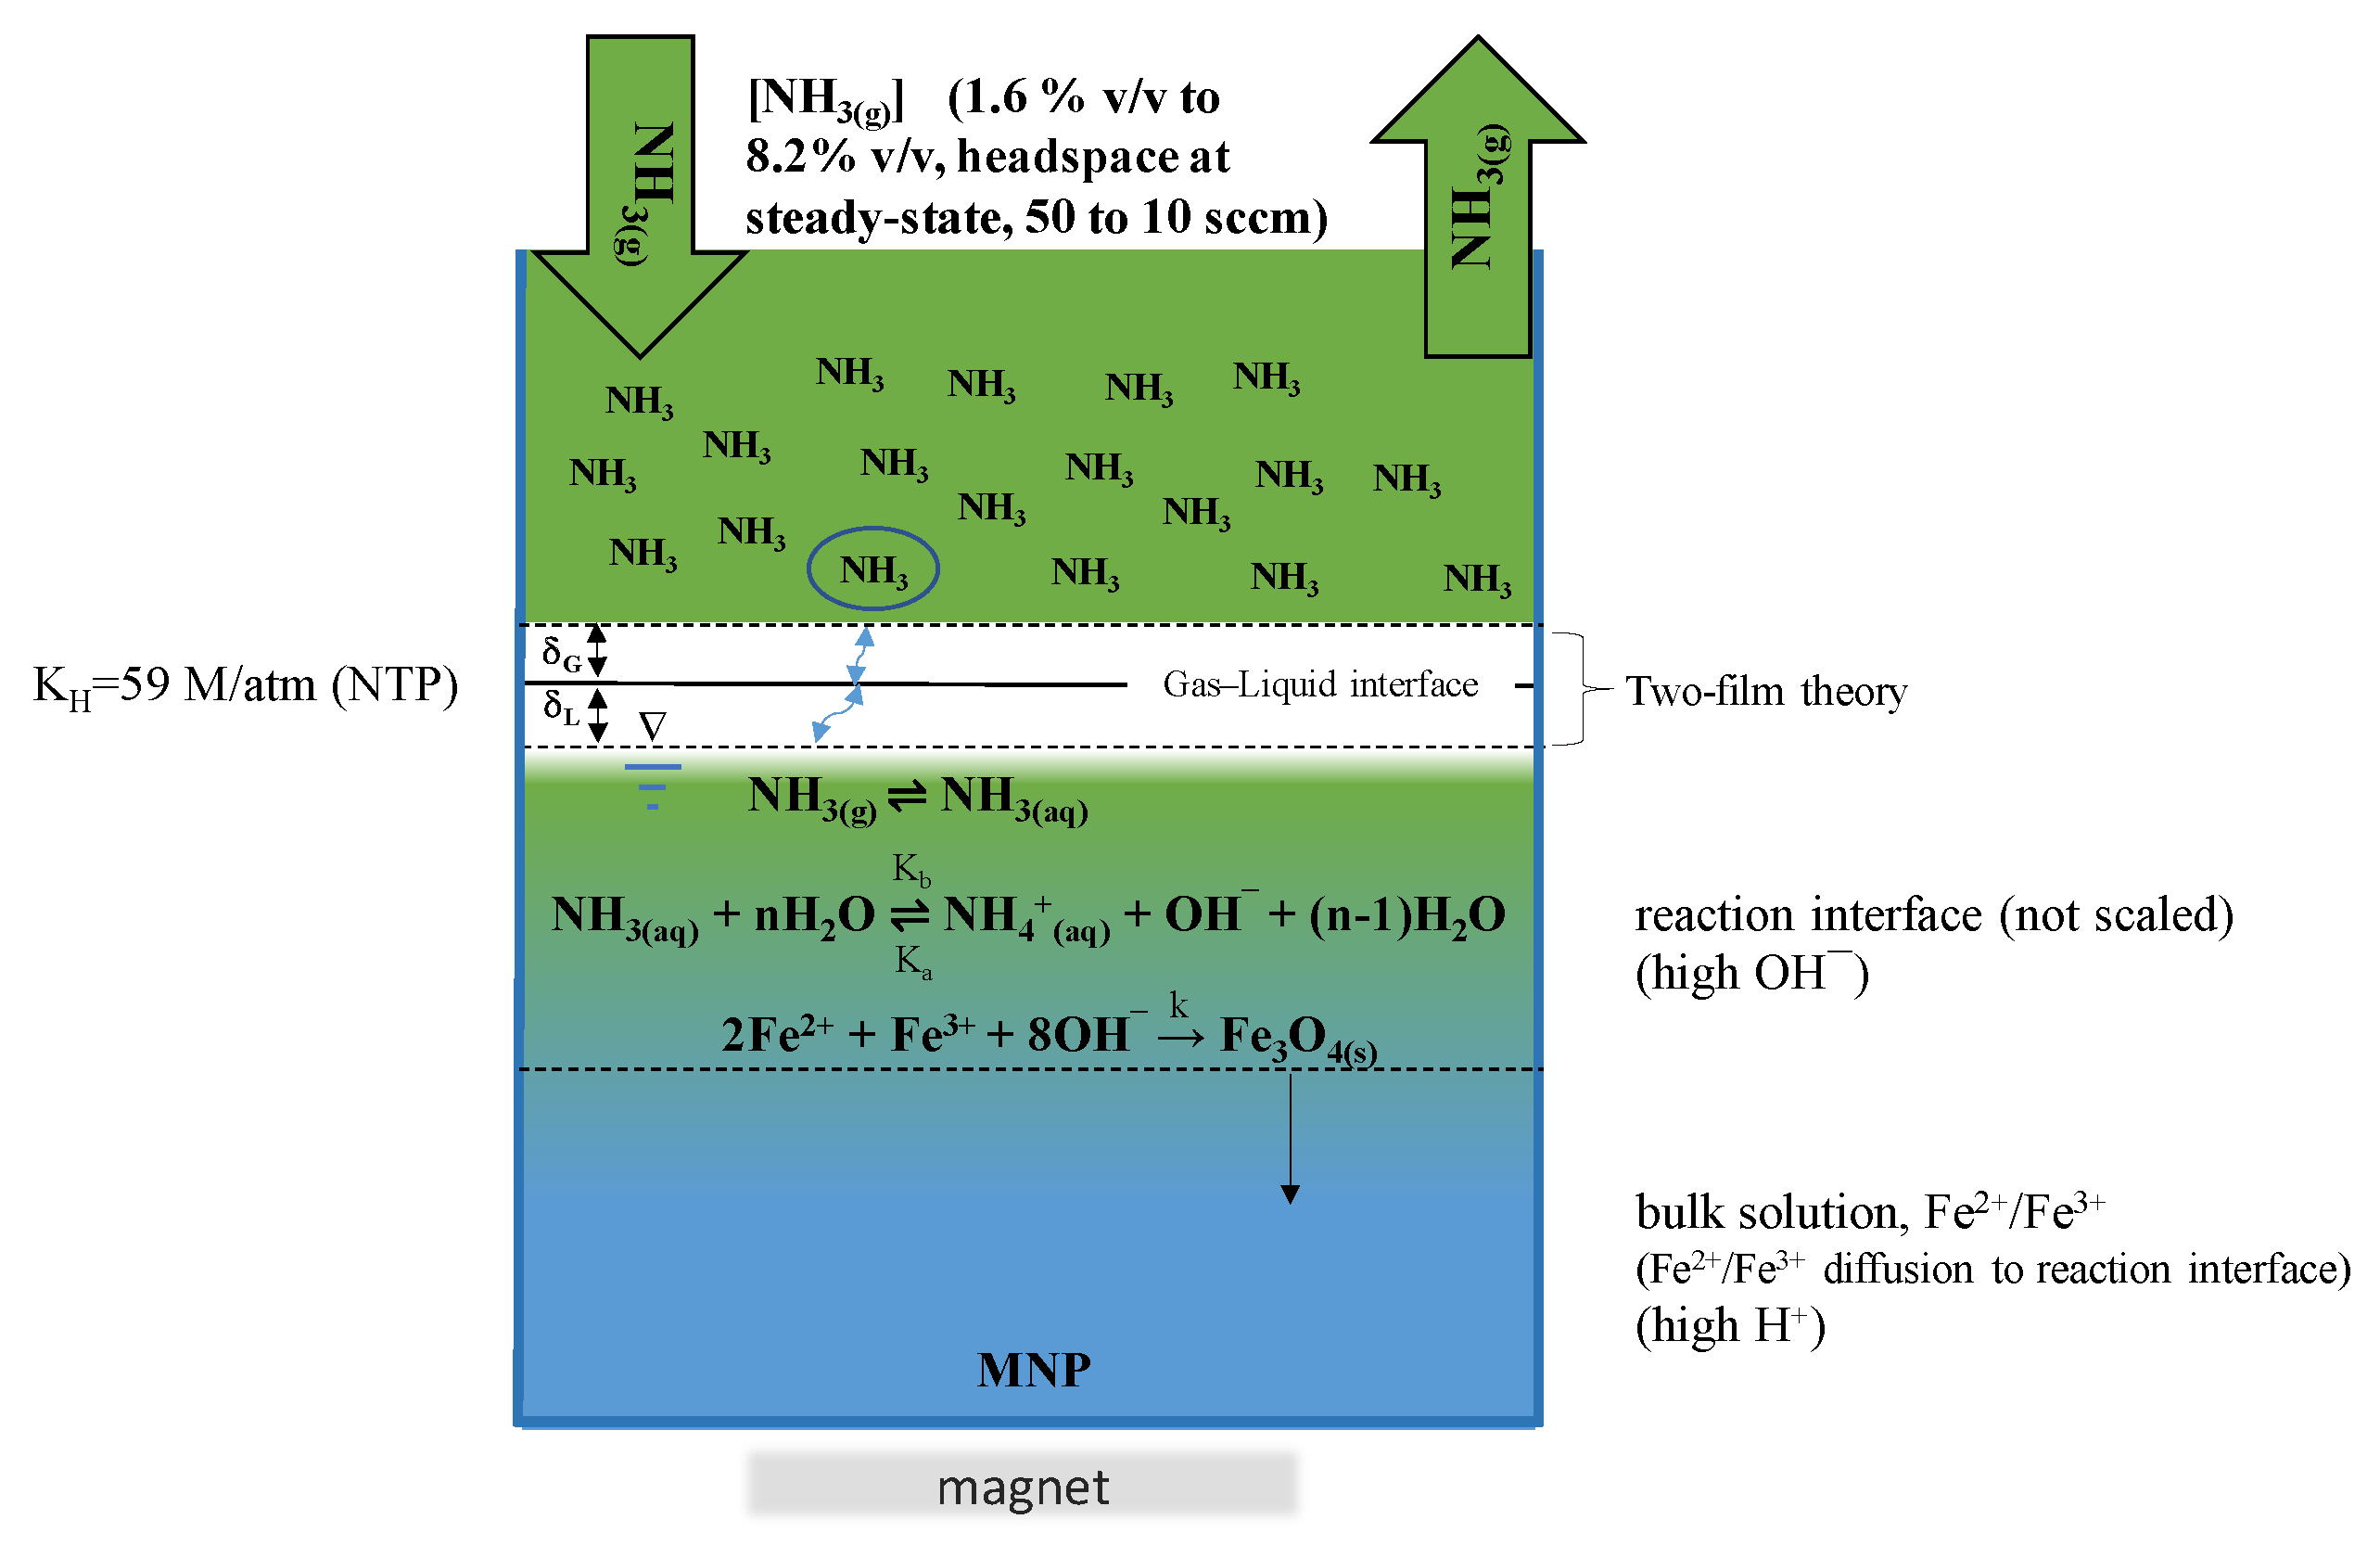
3.2.3. Steady State [NH3(g)]

Steady state [NH3(g)] were developed using NH3(aq) delivered at constant rate into a gas diluent at specific flow rates. Ammonia was transferred from the solvent bottle into a sealed vial, from which an aliquot was removed with a stainless-steel syringe for the syringe pump. A syringe pump was set to 2.5 µL/min, to deliver NH3(aq) at a constant rate of 9.52 × 10⁻⁶ g/s (Equation (1)) into a stainless steel tee; accuracy was confirmed with water, 2.5 µL/min, delivered to fill a 1.00 mL-volumetric flask to line, which took 400 min at 22 °C, adjusting for density. Headspace concentrations of NH3(g) (1.6, 3.3, and 8.4% v/v) (3.3% v/v shown in Equation (2)) were developed with the flow rate-controlled diluent nitrogen gas stream (10 to 50 mL/min, NTP). Gas flow rate deliveries were measured at the terminal points of the stainless-steel tubing post mixing and at the vent. Ammonia gas stream was demonstrated with pre-wet litmus paper showing no droplets or sputtering of ammonia (Supplementary Materials Figure S1).
2.5   µ L min × m L 1000   µ L × 0.91   g mL × 25.1 % × min 60   s = 9.517 × 10 6   g / s
9.517 × 10 6 g s × 60   s min × 1000   mL L × mol 17.0   g × 0.0820578   L   atm mol   K × 1 atm × 295.15   K 25   mL min = 3.3 %   v / v

3.2.4. Apparatus

See Figure 1. Connection points were tested for leaks using prewet litmus paper following system equilibration with NH3(g); displacement of >99% of air in the headspace was realized after two exchanges (112 min), with 25 mL/min into approximately 1.4 L (exchange is estimated at 56 min ((1400 mL)/((25 mL)/min)). Nanoparticle synthesis was studied with independent variation of NH3(g) headspace concentrations (see Section 3.2.3) and iron salt solutions (see Section 3.2.2). Following synthesis, the reaction was removed from the apparatus and aggregated with shaking for 30 s. Synthesized particles were stored at room temperature in the reaction vessel sealed with parafilm.

3.3. Material Analyses

3.3.1. Preparation of Nanoparticles for Analyses

Nanoparticle suspensions (100 mL) were vortexed at half max speed (30 s); aliquots (5 mL) were withdrawn (<30 s) from the middle of the synthesis suspension and dispensed into weight boats. Additionally suspensions were dispensed into clean glass vessels and magnetically separated (20 min); aqueous fraction were decanted and stored for downstream application while nanoparticles were resuspended in water (to volume) by vortex (30 s) and magnetically separated as before for five volume exchanges then transferred to weight boats. All samples were placed in desiccators at room temperature over a bed of CaCl2, to constant weight. Dried nanoparticles were transferred to glass vials, sealed and stored in the desiccator.

3.3.2. TEM

Nanoparticle suspensions (100 mL) were vortexed at half max speed (30 s), subsamples (1 µL) were withdrawn immediately (<30 s) from the middle of the vessel. Samples were dispensed onto 200-mesh copper TEM grids coated in formvar and carbon; suspensions were allowed to air dry for 5 min prior to imaging. Grids were systematically examined with representative images taken at various magnifications with reference bars corresponding to 100, 50 and 20 nm.

3.3.3. Particle Size Analyses

Nanoparticle size distributions were estimated for replicated TEM images (20 nm scale); particles boundaries outlined in ImageJ provided surface area (nm2) and particle diameter (nm) was back calculated assuming a spherical shape. Particle sizes were binned developing frequency distributions according to Excel histogram calculations. Independent two analyst verification was carried out for all TEMs along with image interpretation competency assessed against commercially available nanoparticles.

3.3.4. ICP-MS Analyses of Aqueous Fraction

Aqueous fractions of replicate synthesis (n = 4) were prepared (Section 3.3.1) and analyzed without digestion; sample injections (1 mL) were bracketed with standard metal mixes (ppb to ppm) and blanks. Results were reported for iron.

3.3.5. EDXRF

Iron oxides and dried nanoparticles (≈100 mg) (Section 3.3.1) were individually compressed (8 tons) into disks with a thickness of at least 1 mm and transferred onto double-sided carbon tape for analysis. Examination of surface homogeneity was carried out under magnification (1000×) where representative emission spectra were developed with 20 keV accelerating voltage and emission at 20 µA at a 20 mm working distance and 150 s scanning time.
In comparing samples; narrow distribution (±0.4%) of replicate measurements was reflective of compression to 1 mm which ensured infinite thickness removing bias of x-ray beam penetration and florescence escape depth.

3.3.6. FT-IR

Iron oxides and dried nanoparticles (≈20 mg, n = 2) (Section 3.3.1) were individually homogenized (≈2% w/w) with KBr spectrograde powder using a mortar and pestle and compressed (8 tons) into pellets with powder (≈300 mg) evenly distributed in the die. Liquid nitrogen was added to the MTC 100 µm detector prior to sample analysis (30 min) with set resolution of 4 cm−1 and 16 scans across a range of 4000–400 cm−1; blank KBr pellets were analyzed prior to sample spectra acquisition for subtraction of background.

3.3.7. XRD

Dried nanoparticle powder (≈100 mg n = 2) (Section 3.3.1) were transferred from glass vials directly onto sample holding mounts (silica wafers). A cobalt sealed tube source (λavg = 1.79026 Å) was set to 35 kV, and 45 mA; diffraction patterns (6 frames) were collected for coupled θ/2θ set to 600 s/frame across 10–100° 2θ fixed at 20 cm from the area detector. 2D fames were integrated to 1D and compared to reference library patterns. Following analysis nanoparticles were collected from holding mounts into inverted weight boat with magnets and transferred back into glass vials for analysis with orthogonal methods.

3.3.8. Magnetization Saturation

Iron oxide and dried nanoparticle powders (n = 2) were weighed out (1–7 mg ± 0.02 mg) with bracketing check weights into sample holders. Analysis was carried out covering a magnetic field range of −30 to +30 kOe with uniformity over 4 cm of 0.01% and a charging resolution of 0.33 Oe.

3.3.9. Extraction of Tetracyclines with Magnetite Nanoparticles

Stock solutions of oxytetracycline (OTC) (1000 ppm) and tetracycline (TC) (1000 ppm) were prepared with the addition of 100 mg each to separate volumetric flasks (10 mL), filing to line (water) and inverting 100 times to dissolve. Intermediate standards of 150 ppm were prepared from stocks with the protocol as described above. Calibration curves of OTC and TC mixtures were prepared separately in water and aqueous fraction (Section 3.3.1) to concentration of 50, 100, 200, 300, and 400 ppb in vial (1 mL, n = 4). All samples were analyzed in random order with LC-MS/MS. Following analysis suspended iron oxide nanoparticles (100 µL) were added to calibration curves developed in aqueous fraction; vials were vortexed for thirty seconds, then placed on a permanent magnet for five minutes. Samples (without further cleanup) were transferred to new vials, capped and directly analyzed by LC-MS/MS. Individual solutions of OTC (200 ppb) and TC (200 ppb) and solvent blanks were used as controls.
Transitions ([M+H]+) for oxytetracycline (OTC): 461 > 426, 461 > 443, and tetracycline (TC): 445 > 410, 445 > 154. Chromatographic conditions: flow rate of 250 µL/min starting at 1% B (1 min), 10% B/min (9.9 min) 100% B (5 min), injection volume 1.0 µL, and column temperature 25 °C.

4. Conclusions

Magnetite nanoparticles were repeatedly synthesized with a high yield > 99.9%, and with average particle sizes of 12.9 nm ± 3 nm. Reactions were carried out at room temperature, as well as MNP drying, with no evidence of other iron oxides. Synthesized nanoparticles were used to extract various mass loadings of tetracyclines from aqueous solutions, without MNP modification. Future work with MNP includes development of a high mass yield apparatus and nanoparticle surface modifications with SiO2, organo-siloxanes, and selective proteins for applications in analytical analyses and pathogen detection and mitigation for applications in food safety and public health.

Supplementary Materials

The following are available online at https://www.mdpi.com/2312-7481/6/2/22/s1. Figure S1. NH3(g) (3.3% v/v, 25 mL/min (NTP) makeup with N2) sprayed over wet litmus paper. Figure S2. Synthesis of a nonmagnetic iron oxide from an iron salt solution (1.0 mM ∑Fe and 2:1 Fe2+:Fe3+) with 3.3% (v/v) NH3(g). Since the intention of this work was the synthesis of phase pure MNPs with high yield, only 1 mM total Fe2+, Fe3+ was studied (Figure S2). This synthesis did not result in a high MNP yield as evidenced by non-magnetic particles that remained in suspension (Figure 5 and Figure 6).

Author Contributions

The manuscript was written through contributions of all authors. All authors have read and agreed to the published version of the manuscript.

Funding

This research received no external funding.

Acknowledgments

This work was in part supported by Ontario Agri-Food Innovation Alliance, a collaboration between the Ontario Ministry of Agriculture, Food & Rural Affairs and the University of Guelph. The authors acknowledge Andrew E Moore and Nick Schrier of the University of Guelph Agriculture and Food Laboratory for their assistance with FT-IR, EDXRF and ICP-MS.

Conflicts of Interest

The authors declare no conflict of interest.

References

  1. Zhou, L.; Yuan, J.; Yuan, W.; Sui, X.; Wu, S.; Li, Z.; Shen, D. Synthesis, characterization, and controllable drug release of pH-sensitive hybrid magnetic nanoparticles. J. Magn. Magn. Mater. 2009, 321, 2799–2804. [Google Scholar] [CrossRef]
  2. Yang, J.; Park, S.B.; Yoon, H.G.; Huh, Y.M.; Haam, S. Preparation of poly ε-caprolactone nanoparticles containing magnetite for magnetic drug carrier. Int. J. Pharm. 2006, 324, 185–190. [Google Scholar] [CrossRef]
  3. Jain, T.K.; Morales, M.A.; Sahoo, S.K.; Leslie-Pelecky, D.L.; Labhasetwar, V. Iron oxide nanoparticles for sustained delivery of anticancer agents. Mol. Pharm. 2005, 2, 194–205. [Google Scholar] [CrossRef] [PubMed] [Green Version]
  4. Javed, Y.; Akhtar, K.; Anwar, H.; Jamil, Y. MRI based on iron oxide nanoparticles contrast agents: Effect of oxidation state and architecture. J. Nanopart. Res. 2017, 19, 366. [Google Scholar] [CrossRef]
  5. Corot, C.; Robert, P.; Idée, J.M.; Port, M. Recent advances in iron oxide nanocrystal technology for medical imaging. Adv. Drug Deliv. Rev. 2006, 58, 1471–1504. [Google Scholar] [CrossRef] [PubMed]
  6. Bruck, A.M.; Cama, C.A.; Gannett, C.N.; Marschilok, A.C.; Takeuchi, E.S.; Takeuchi, K.J. Nanocrystalline iron oxide based electroactive materials in lithium ion batteries: The critical role of crystallite size, morphology, and electrode heterostructure on battery relevant electrochemistry. Inorg. Chem. Front. 2016, 3, 26–40. [Google Scholar] [CrossRef]
  7. Katz, E. Synthesis, Properties and Applications of Magnetic Nanoparticles and Nanowires—A Brief Introduction. Magnetochemistry 2019, 5, 61. [Google Scholar] [CrossRef] [Green Version]
  8. Shipley, H.J.; Engates, K.E.; Guettner, A.M. Study of iron oxide nanoparticles in soil for remediation of arsenic. J. Nanopart. Res. 2011, 13, 2387–2397. [Google Scholar] [CrossRef]
  9. Gaiani, G.; O’Sullivan, C.K.; Campàs, M. Magnetic Beads in Marine Toxin Detection: A Review. Magnetochemistry 2019, 5, 62. [Google Scholar] [CrossRef] [Green Version]
  10. Cecchin, I.; Reddy, K.R.; Thomé, A.; Tessaro, E.F.; Schnaid, F. Nanobioremediation: Integration of nanoparticles and bioremediation for sustainable remediation of chlorinated organic contaminants in soils. Int. Biodeterior. Biodegrad. 2017, 119, 419–428. [Google Scholar] [CrossRef]
  11. Sarcletti, M.; Vivod, D.; Luchs, T.; Rejek, T.; Portilla, L.; Müller, L.; Dietrich, H.; Hirsch, A.; Zahn, D.; Halik, M. Superoleophilic Magnetic Iron Oxide Nanoparticles for Effective Hydrocarbon Removal from Water. Adv. Funct. Mater. 2019, 29, 1–7. [Google Scholar] [CrossRef]
  12. Huang, Y.F.; Wang, Y.F.; Yan, X.P. Amine-functionalized magnetic nanoparticles for rapid capture and removal of bacterial pathogens. Environ. Sci. Technol. 2010, 44, 7908–7913. [Google Scholar] [CrossRef] [PubMed]
  13. Wu, W.; Wu, Z.; Yu, T.; Jiang, C.; Kim, W.S. Recent progress on magnetic iron oxide nanoparticles: Synthesis, surface functional strategies and biomedical applications. Sci. Technol. Adv. Mater. 2015, 16, 23501. [Google Scholar] [CrossRef] [PubMed]
  14. Zhang, D.; Fakhrullin, R.F.; Özmen, M.; Wang, H.; Wang, J.; Paunov, V.N.; Li, G.; Huang, W.E. Functionalization of whole-cell bacterial reporters with magnetic nanoparticles. Microb. Biotechnol. 2011, 4, 89–97. [Google Scholar] [CrossRef] [Green Version]
  15. Ahn, T.; Kim, J.H.; Yang, H.M.; Lee, J.W.; Kim, J.D. Formation pathways of magnetite nanoparticles by coprecipitation method. J. Phys. Chem. C 2012, 116, 6069–6076. [Google Scholar] [CrossRef]
  16. Wu, S.; Sun, A.; Zhai, F.; Wang, J.; Xu, W.; Zhang, Q.; Volinsky, A.A. Fe3O4 magnetic nanoparticles synthesis from tailings by ultrasonic chemical co-precipitation. Mater. Lett. 2011, 65, 1882–1884. [Google Scholar] [CrossRef]
  17. Abou-Hassan, A.; Dufrêchfer, J.F.; Sandre, O.; Mériguet, G.; Bernard, O.; Cabuil, V. Fluorescence confocal laser scanning microscopy for pH mapping in a coaxial flow microreactor: Application in the synthesis of superparamagnetic nanoparticles. J. Phys. Chem. C 2009, 113, 18097–18105. [Google Scholar] [CrossRef] [Green Version]
  18. Laurent, S.; Forge, D.; Port, M.; Roch, A.; Robic, C.; Elst, L.V.; Muller, R.N. Magnetic iron oxide nanoparticles: Synthesis, stabilization, vectorization, physicochemical characterizations, and biological applications. Chem. Rev. 2008, 108, 2064–2110. [Google Scholar] [CrossRef]
  19. Tronc, E.; Belleville, P.; Jolivet, J.P.; Livage, J. Transformation of ferric hydroxide into spinel by Fe(II) adsorption. Langmuir 1992, 8, 313–319. [Google Scholar] [CrossRef]
  20. Jolivet, J.; Chanéac, C.; Tronc, E. Iron oxide chemistry. From molecular clusters to extended solid networks. Chem. Commun. 2004, 98, 477–483. [Google Scholar] [CrossRef]
  21. Lee, S.J.; Jeong, J.R.; Shin, S.C.; Kim, J.C.; Kim, J.D. Synthesis and characterization of superparamagnetic maghemite nanoparticles prepared by coprecipitation technique. J. Magn. Magn. Mater. 2004, 282, 147–150. [Google Scholar] [CrossRef]
  22. Mo, Z.; Zhang, C.; Guo, R.; Meng, S.; Zhang, J. Synthesis of Fe3O4 nanoparticles using controlled ammonia vapor diffusion under ultrasonic irradiation. Ind. Eng. Chem. Res. 2011, 50, 3534–3539. [Google Scholar] [CrossRef]
  23. Mamani, J.B.; Gamarra, L.F.; De Souza Brito, G.E. Synthesis and characterization of Fe3O4 nanoparticles with perspectives in biomedical applications. Mater. Res. 2014, 17, 542–549. [Google Scholar] [CrossRef]
  24. Petrushevska, M.; Pavlovska, K.; Laskova, J.; Zdravkovski, P.; Dodov, M.G. Transmission Electron Microscopy: Novel Application of Established Technique in Characterization of Nanoparticles as Drug Delivery Systems. Prilozi 2019, 40, 67–72. [Google Scholar] [CrossRef] [PubMed] [Green Version]
  25. Habila, M.A.; Alothman, Z.A.; El-Toni, A.M.; Labis, J.P.; Soylak, M. Synthesis and application of Fe3O4@SiO2@TiO2 for photocatalytic decomposition of organic matrix simultaneously with magnetic solid phase extraction of heavy metals prior to ICP-MS analysis. Talanta 2016, 154, 539–547. [Google Scholar] [CrossRef]
  26. Farrell, D.; Majetich, S.A.; Wilcoxon, J.P. Preparation and characterization of monodisperse Fe nanoparticles. J. Phys. Chem. B 2003, 107, 11022–11030. [Google Scholar] [CrossRef]
  27. Mourdikoudis, S.; Pallares, R.M.; Thanh, N.T.K. Characterization techniques for nanoparticles: Comparison and complementarity upon studying nanoparticle properties. Nanoscale 2018, 10, 12871–12934. [Google Scholar] [CrossRef] [Green Version]
  28. Mahdavi, M.; Namvar, F.; Bin Ahmad, M.; Mohamad, R. Green biosynthesis and characterization of magnetic iron oxide (Fe3O4) nanoparticles using seaweed (Sargassum muticum) aqueous extract. Molecules 2013, 18, 5954–5964. [Google Scholar] [CrossRef]
  29. Kim, W.; Suh, C.Y.; Cho, S.W.; Roh, K.M.; Kwon, H.; Song, K.; Shon, I.J. A new method for the identification and quantification of magnetite-maghemite mixture using conventional X-ray diffraction technique. Talanta 2012, 94, 348–352. [Google Scholar] [CrossRef]
  30. Silva, V.A.J.; Andrade, P.L.; Silva, M.P.C.; Bustamante, A.D.; De Los Santos Valladares, L.; Albino Aguiar, J. Synthesis and characterization of Fe3O4 nanoparticles coated with fucan polysaccharides. J. Magn. Magn. Mater. 2013, 343, 138–143. [Google Scholar] [CrossRef] [Green Version]
  31. Alibeigi, S.; Vaezi, M.R. Phase transformation of iron oxide nanoparticles by varying the molar ratio of Fe2+:Fe3+. Chem. Eng. Technol. 2008, 31, 1591–1596. [Google Scholar] [CrossRef]
  32. Petcharoen, K.; Sirivat, A. Synthesis and characterization of magnetite nanoparticles via the chemical co-precipitation method. Mater. Sci. Eng. B Solid State Mater. Adv. Technol. 2012, 177, 421–427. [Google Scholar] [CrossRef]
  33. Singh, H.; Yadav, K.L. Structural, dielectric, vibrational and magnetic properties of Sm doped BiFeO3 multiferroic ceramics prepared by a rapid liquid phase sintering method. Ceram. Int. 2015, 41, 9285–9295. [Google Scholar] [CrossRef]
  34. Dar, M.I.; Shivashankar, S.A. Single crystalline magnetite, maghemite, and hematite nanoparticles with rich coercivity. RSC Adv. 2014, 4, 4105–4113. [Google Scholar] [CrossRef]
  35. Kolen’Ko, Y.V.; Bañobre-López, M.; Rodríguez-Abreu, C.; Carbó-Argibay, E.; Sailsman, A.; Piñeiro-Redondo, Y.; Cerqueira, M.F.; Petrovykh, D.Y.; Kovnir, K.; Lebedev, O.I.; et al. Large-scale synthesis of colloidal Fe3O4 nanoparticles exhibiting high heating efficiency in magnetic hyperthermia. J. Phys. Chem. C 2014, 118, 8691–8701. [Google Scholar] [CrossRef]
  36. He, X.; Zhong, W.; Au, C.T.; Du, Y. Size dependence of the magnetic properties of Ni nanoparticles prepared by thermal decomposition method. Nanoscale Res. Lett. 2013, 8, 1–10. [Google Scholar] [CrossRef] [Green Version]
  37. Jiang, H.L.; Li, N.; Cui, L.; Wang, X.; Zhao, R.S. Recent application of magnetic solid phase extraction for food safety analysis. TrAC Trends Anal. Chem. 2019, 120, 115632. [Google Scholar] [CrossRef]
  38. Neuvonen, P.J. Interactions with the Absorption of Tetracyclines. Drugs 1976, 11, 45–54. [Google Scholar] [CrossRef]
  39. Chemical, A.; National, S. 254th American Chemical Society National Meeting and Exposition; American Chemical Society: Washington, DC, USA, 2017; ISBN 2022494016. [Google Scholar]
Figure 1. (a) Schematic (b) photograph of system configuration. A: Ultra-high purity (UHP) nitrogen 99.998%, B: single stage regulator set to 100 psi, C: 0.02” stainless-steel tubing, D: fine metering valve E: 2.5 mL stainless steel high pressure gastight syringe (with 25.1% w/v ammonia), F: syringe infusion pump, G: mixing tee (20 μL), H: 1,000 mL round bottom flask, I: vacuum distilling adapter, J: 250 mL flat bottom flask with 100 mL iron salt (Fe2+/Fe3+) solution, K: permanent neodymium magnet.
Magnetochemistry 06 00022 g001
Figure 2. NH3(g) (3.3% v/v) headspace and aqueous solution with phenolphthalein indicator dye (0.001%) after 2 min. Phenolphthalein indicator dye is colorless <pH 8.2 and pink/red >pH 8.2.
Magnetochemistry 06 00022 g002
Figure 3. Interface of NH3(g) (3.3% v/v) headspace and iron salts solution (2:1 Fe2+:Fe3+) for total iron concentrations (a) 10 mM and (b) 3.8 mM.
Magnetochemistry 06 00022 g003
Figure 4. Synthesis progression of an iron salt solution (3.8 mM ∑Fe and 2:1 Fe2+:Fe3+) with 3.3% (v/v) NH3(g) after (a) 2 min, insert photo is starting Fe2+:Fe3+ salt solution, (b) after 15 min, (c) at 90 min, and (d) nanoparticles drawn to the magnet on the side of reaction vessel. Diffusion coefficients for Fe2+ and Fe3+ are 7.19 × 10⁻⁶ cm2/s and 6.04 × 10⁻⁶ cm2/s (NTP), respectively, and is 52.7 × 10⁻⁶ cm2/s for OH¯ 35.
Magnetochemistry 06 00022 g004
Figure 5. Iron oxide clumps observed during synthesis using conventional chemical coprecipitation with the addition of 0.4 M NaOH(aq) to an iron salt solution (90 mM ∑Fe).
Magnetochemistry 06 00022 g005
Figure 6. Illustration of the proposed magnetite (Fe3O4) nanoparticles (MNP) synthesis (3.8 mM ∑Fe and 2:1 Fe2+:Fe3+) with NH3(g).
Magnetochemistry 06 00022 g006
Figure 7. Analysis of powdered synthesized nanoparticles by: (a) energy dispersive X-ray fluorescence (EDXRF); (b) Fourier transform infrared spectroscopy (FTIR); (c) X-ray diffraction (XRD) with overlay from reference library in red; (d) magnetization saturation.
Magnetochemistry 06 00022 g007
Figure 8. TEMs of nanoparticle (20 nm reference bar) synthesized from an iron salt solution (3.8 mM and 2:1 Fe2+:Fe3+) with varying steady-state headspace concentrations of NH3(g), % v/v, (a) 1.6, (b) 3.3, and (c) 8.4.
Magnetochemistry 06 00022 g008
Figure 9. MNP added to solutions of tetracyclines: in a magnetic field (A) and suspended in the solution (B).
Magnetochemistry 06 00022 g009
Figure 10. Calibration curves for (a) oxytetracycline and (b) tetracycline for replicate (n = 4) samples at concentrations: 50, 100, 200, 300, and 400 ppb. In water, the aqueous fraction as shown in Figure 4d and in the aqueous fraction after extraction with 30 µg MNP suspension in vial.
Magnetochemistry 06 00022 g010
Table 1. Particle size analyses from transmission electron microscopy (TEMs) of syntheses from an iron salt solution (3.8 mM and 2:1 Figure 2. Fe3+) with varying % v/v [NH3(g)] headspace.
[NH3(g)], %v/vnMean (nm)Median (nm)S±1 S, %KurtosisSkewness
1.658712.812.3±3.7700.70.6
3.345712.912.6±3.0670.20.5
8.456312.912.5±3.5701.00.8

