1. Introduction
Climate change is one of the most critical challenges for agricultural production, as it directly affects the physiological responses of most crops and many qualitative soil characteristics [
1]. Soil texture is one of the most relevant properties as it is closely related to yield potential, soil management, root development and, consequently, crop yields [
2]. The mobility of nitrogen in the soil is also dependent on its texture, as soil with low permeability facilitates the accumulation of water in its pores, reducing the amount of oxygen and leading to higher losses of gaseous nitrogen, which does not occur in permeable soils. Texture, which depends on the amount of clay and sand in the soil, influences the soil’s capacity to retain water; therefore, it is also related to soil moisture [
3]. The fertility of soil refers to its capacity to allow adequate crop growth; i.e., it is a concept mainly oriented towards crop production. In this sense, fertility is conditioned by the physical, chemical and biological characteristics of the soil system [
4]. One of the physical properties that significantly determine fertility refers to the soil particles that give rise to soil texture. Depending on the textural classes, there are sandy, loamy, clayey soils and combinations of these textures; they represent fundamental aspects of soil fertility with agronomic relevance [
5]. Due to their granulometric composition and chemical properties, sandy soils have low nutrient reserves available to plants, resulting in low fertility compared to loam and clay soils, which contain particles that are sources of nutrients due to their colloidal nature [
6,
7].
Low soil fertility, drought, salinity and sub-optimal temperatures are the principal abiotic stresses limiting agricultural productivity, all aggravated by climate change in most parts of the world. Salinity and nutrient deficiencies, in particular, pose a severe threat to agriculture [
8]. It is difficult to accurately assess the global area of salinised soils due to its constant increase; however, it has been estimated that 20–30% of arable land worldwide is currently affected by salinity, and the percentage of the affected area is expected to exceed 50% within the next 25 years [
9]. This puts the production of many crops at risk, including most vegetables, which have low or, in some cases, such as tomatoes, moderate tolerance to salinity [
10]. Tomato is a crop of great economic importance, with excellent nutritional properties for a healthy human diet, contributing to weight control, blood pressure reduction and cancer prevention [
11]; however, it is sensitive to high salinity, being a species more affected by salt stress than its wild relatives [
12]. Previous studies have reported that the growth, metabolism and yield of
S. lycopersicum plants are affected by osmotic, ionic and oxidative stress caused by salinity [
13,
14].
Considering the continuous increase in global salinisation, studies aimed at elucidating the mechanisms of plant tolerance to salt stress have become very important for the future of agriculture. This is especially relevant for horticultural species since they often have a higher cash value than extensive crops and need more resources to cultivate. In addition, they provide a wealth of nutrients, including carbohydrates, fibre and minerals, all of which are necessary for a balanced diet [
15].
In recent years, biostimulant products have been recognised as innovative agronomic tools to generate sustainable systems, improving agricultural productivity, yield, plant health and tolerance to stress factors such as salinity. This is evidenced by the increase in scientific publications and the steady expansion of their market [
16]. Indeed, biostimulants positively affect plant metabolism under optimal and sub-optimal environmental conditions [
17]. However, the processes that biostimulants trigger are frequently difficult to pinpoint and are still being studied [
18]. Therefore, it is crucial to evaluate biostimulantsʹ mechanisms of action under different experimental conditions, as has been performed in the present study.
We considered, as a working hypothesis, that the type of soil texture could influence, to some extent, the retention of salt in the root zone and the effect of the biostimulant on the plants. Therefore, the study aimed to compare the effects of the biostimulant BALOX
® on
S. lycopersicum plants under three salinity conditions (non-saline, moderately saline and strongly saline soils) and two different soil textures (loamy and sandy soils). To achieve this objective, several morphological, physiological and biochemical parameters were analysed in tomato plants grown under all combinations of the above conditions. The effect of the biostimulant BALOX
®, containing bioactive ingredients such as polyphenols and glycine betaine, on enhancing tomato tolerance to salt stress was evaluated in one of our previous studies, growing the plants in clay-textured soil [
19]. The novelty of the present work lies in using two different and agronomically significant soil textural classes, loam and sandy, with very different physical and chemical properties.
2. Materials and Methods
2.1. Plant Material and Growth Conditions
The experiments were conducted at the Polytechnic University of Valencia, Spain, within a greenhouse under controlled environmental conditions. The greenhouse maintained an air temperature of 20 °C, 65% relative humidity, and a photoperiod of 14 h of light per day. A HOBO U23 Pro v2 data logger (Onset Computer Corporation, Bourne, MA, USA) was utilised to monitor the temperature and relative humidity.
Tomato seeds (Solanum lycopersicum L. var. DIEZMIL97 F1) were sown in trays filled with a mixture of commercial peat and vermiculite in a 1:1 ratio. After a growth period of 30 days, the resulting plantlets, with an average height of 12 cm, were transplanted individually into pots with a diameter of 14 cm, each containing 2000 g of soil.
2.2. Soil Types and Analysis
Two soil types, originating from quaternary alluvial sedimentary materials, were used in the study. The first had a loam texture (46% sand, 35% silt fraction, and 19% clay), with a cation exchange capacity (CEC) of 6.61 mEq/100 g of soil and an organic matter (OM) content of 0.34%. The second soil type had a sandy texture (97.5% sand, 0% silt fraction, and 2.5% clay), with a CEC of 0.52 mEq/100 g of soil and an OM content of 0.02%. Soil texture was determined using the Bouyoucos method with a hydrometer [
20]. CEC was determined according to Rhoades’ method [
21], and OM content was assessed following the method of Walkley and Black [
22].
Saturation extracts were prepared from each soil to determine electrical conductivity (EC), pH, and concentrations of monovalent and divalent ions (Na+, K+, Ca2+, and Mg2+). EC and pH were measured using a Crison micro-CM 2202 Conductimeter and a Crison micro-pH 2001 pH meter, respectively (Crison Instruments SA, Barcelona, Spain). The concentrations of Na+, K+, and Ca2+ were quantified using a flame photometer PFP7 (Jenway Inc., Burlington, VT, USA), whereas Mg2+ was determined through complexometric volumetric titration with EDTA at pH 10, employing eriochrome black T as reference.
2.3. Soil Salinisation
The loam and sandy soils, initially non-saline, with electrical conductivities of 2.46 and 0.78 dS m−1, respectively, were subjected to salinisation by treatment with a 100 mM NaCl solution. Subsequently, all soils were dried and sieved to 2 mm before being used for pot filling according to the respective treatments.
This salinisation process led to two levels of soil salinity: moderately saline (6.29 dS m
−1 for loam soil and 5.26 dS m
−1 for sandy soil) and strongly saline conditions (14.35 dS m
−1 for loam soil and 14.29 dS m
−1 for sandy soil) (
Table 1).
2.4. Biostimulant Treatments
The biostimulant utilised in this study, BALOX®, is a plant-derived product based on hydrolysates of rice and oat husks and commercially formulated by Innovak Global SA de CV (Chihuahua, Mexico). This biostimulant was specifically designed for root system application through irrigation (either alone or mixed with fertiliser) and is not intended for foliar use. Notably, BALOX® contains primary bioactive components, with concentrations of 1.4% (w/w) polyphenols and 3.0% (w/w) glycine betaine, which have demonstrated efficacy in ameliorating osmotic stress.
Irrigation was performed twice a week throughout the experiment, providing 175 mL of tap water (EC = 0.92 dS m−1) to each pot. The biostimulant was applied every 15 days, with the first application during transplantation and subsequent applications at 15, 30, and 45 days, respectively.
2.5. Experimental Design
The study incorporated three experimental factors: two treatments (control: without biostimulant; biostimulant: 0.40 mL L
−1 of BALOX
®), two soil types (loam and sandy), and three levels of soil salinity (non-saline, moderately saline and strongly saline; see
Table 1). Each treatment was replicated three times, resulting in a total of 36 pots.
2.6. Plant Growth Metrics
The experiment concluded after 60 days from transplanting when the plants were in the early reproductive stage. Subsequently, the plants were harvested, and various growth and biochemical parameters were evaluated in the laboratory. Measurements of number of leaves, stem length and diameter were taken for all plants. The roots were then carefully extracted and cleaned using a brush. For measuring the mean root area, all roots were scanned on a scanner (Epson Expression 11000XL, Epson America Inc., Long Beach, CA, USA), and the images were processed with RhizoVision Explorer software (© Noble Research Institute, LLC, Ardmore, OK, USA). The longest leaf of each plant was also scanned, and its area was measured by Digimizer v.4.6.1 software (MedCalc Software, Ostend, Belgium, 2005–2016).
Afterwards, the fresh weight of roots and aerial parts was determined using a precision balance. A portion of the fresh leaf material was rapidly frozen in liquid nitrogen and stored at −75 °C for subsequent biochemical analyses. The remaining fresh leaf, stem, and root samples were weighed and dried at 65 °C for 72 h until a constant weight was achieved. Following drying, the samples were weighed again to calculate the water content of each plant organ individually, according to the following formula:
where WC represents the water content, and FW and DW are respectively fresh and dry weight.
2.7. Determination of Photosynthetic Pigments
The concentrations of total chlorophyll (tChl) and total carotenoids (Caro) in the leaf tissue of the tomato plants were quantified using the methods and equations described by Lichtenthaler et al. [
23]. To extract the pigments, 50 mg of fresh leaf material was finely ground and mixed with 1 mL of ice-cold acetone (80%
v/
v). The samples were then incubated overnight in a shaker in the dark. After centrifugation at 13,300×
g for 10 min at 4 °C, the supernatant was carefully collected, and its absorbance was measured at 663 nm, 646 nm, and 470 nm. Pigment contents were finally expressed as mg g
−1 DW (dry weight).
2.8. Quantification of Mono and Divalent Ions
To determine the concentrations of mono (Na
+, Cl
−, and K
+) and divalent (Ca
2+) ions in root and leaf material, plant water extracts were prepared following Weimberg et al. [
24] from 100 mg of ground dried plant material mixed with 2 mL of Milli-Q water. After 24 h, the samples were incubated at 95 °C in a water bath for 30 min, followed by rapid cooling on ice and subsequently filtered through a 0.45 μm nylon filter. Cations (Na
+, Ca
2+, and K
+) concentrations were quantified using a PFP7 flame photometer (Jenway Inc., Burlington, VT, USA), whereas Cl
− concentrations were measured with a chlorimeter (Sherwood, model 926, Cambridge, UK).
2.9. Quantification of Osmolytes
Three osmolytes, commonly produced by tomato plants under stressful conditions, were analysed spectrophotometrically: proline (Pro), total soluble sugars (TSS) and glycine betaine (GB).
Pro content was determined following the protocol described by Bates et al. [
25]. Fresh leaf material (50 mg) was extracted in 3% (
w/
v) aqueous sulphosalicylic acid and combined with acid ninhydrin. The mixture was incubated at 95 °C for 1 h, cooled on ice and extracted with toluene. The absorbance of the organic phase was measured at 520 nm, with toluene as a blank. A calibration curve was generated using samples with known Pro concentrations, assayed in parallel, and Pro content was finally expressed as μmol g
−1 DW.
A previously reported method [
26] was used for TSS determination. Fresh leaf material (50 mg) was ground in liquid nitrogen and extracted with 2 mL of 80% (
v/
v) methanol. After 24 h of shaking, the samples were centrifugated at 13,300×
g for 10 min. The obtained supernatants were then diluted with water and mixed with sulphuric acid and phenol (95% and 5%, respectively). Following a 20-min incubation at room temperature, the absorbance was measured at 490 nm. A calibration curve was constructed with known amounts of glucose, used as the standard, and the TSS content was expressed as glucose equivalents (mg eq. glucose g
−1 DW).
Glycine betaine (GB) extraction and quantification were performed with slight modifications [
27] of the original Grieve et al. [
28] procedure. Fresh leaf material (150 mg) was extracted with 1.5 mL of Milli-Q water and shaken for 24 h at 4 °C. After centrifugation at 13,300×
g for 10 min, a 2 N H
2SO
4 solution was added to the supernatant. After a 60-min incubation on ice, 125 μL of the sample was mixed with 50 μL of cold KI-I
2 solution to induce GB precipitation in the form of golden crystals. The samples were stored at 4 °C for 16 h in the dark and then centrifuged at 13,300×
g for 45 min at 0 °C. After removing the supernatant, the GB crystals were dissolved in 1.4 mL of cold 1,2-dichloroethane. The samples were kept under cold and dark conditions for 2.5 h, and the absorbance was measured at 365 nm. GB concentrations were determined using a standard calibration curve, and GB content was expressed as μmol g
−1 DW.
2.10. Oxidative Stress Markers
To assess the impact of the experimental treatments on the oxidative stress level of tomato plants, malondialdehyde (MDA) and hydrogen peroxide (H
2O
2) contents were quantified in leaf extracts, as these two compounds are reliable biomarkers of oxidative stress. For the determination of H
2O
2, 50 mg of fresh plant material was extracted with a 0.1% (
w/
v) solution of trichloroacetic acid (TCA) in water, following the method described by Loreto and Velikova [
29]. Subsequently, one volume of 10 mM potassium phosphate buffer (pH 7.0) and two volumes of 1 M potassium iodide were added to the supernatant. The absorbance of the resulting samples was measured at 390 nm, and H
2O
2 concentrations were expressed as μmol g
−1 DW.
MDA content was determined in leaf extracts according to the method described by Hodges et al. [
30], as modified by Taulavuori et al. [
31], using the 80% methanol extracts prepared for TSS quantification. These extracts were mixed with 0.5% (
w/
v) thiobarbituric acid (TBA) prepared in 20% (
w/
v) trichloroacetic acid (TCA), or with 20% TCA without TBA for the corresponding controls, and incubated at 95 °C for 20 min. After cooling on ice and centrifugation at 13,300×
g for 10 min at 4 °C, the absorbance of the supernatants was measured at 532 nm; the non-specific absorbance at 600 and 400 nm was subtracted from the obtained values. MDA concentrations were calculated using the equations formulated by Hodges et al. [
30], and were expressed as nmol g
−1 DW.
2.11. Antioxidant Enzyme Activities
To investigate the enzymatic response of tomato plants to oxidative stress, the specific activity of three major antioxidant enzymes—superoxide dismutase (SOD), catalase (CAT), and glutathione reductase (GR)—was determined in crude protein extracts prepared from tomato leaves as previously described [
32]. Protein concentration in the extracts was measured by the Bradford assay [
33] using the commercial BioRad reagent and bovine serum albumin (BSA) as the standard.
For SOD activity, the inhibition of nitroblue tetrazolium (NBT) photoreduction by the enzyme present in the extracts was monitored at a wavelength of 560 nm, using riboflavin as a source of superoxide radicals in the reaction mixtures [
34]. One unit of SOD was defined as the amount of enzyme causing 50% inhibition of NBT photoreduction under the assay conditions.
CAT activity was assessed by evaluating the consumption of H
2O
2 added to the extract, measuring the decrease in absorbance at 240 nm [
35]. One CAT unit was defined as the amount of enzyme capable of decomposing one mmol of H
2O
2 per minute at 25 °C.
GR activity was quantified by the procedure described by Connell and Mullet [
36], following the decrease in absorbance at 340 nm, which corresponds to the oxidation of NADPH during the GR-catalysed reduction of oxidised glutathione (GSSG) to its reduced form (GSH). One unit of GR was defined as the amount of enzyme required to oxidise one mmol of NADPH per minute at 25 °C. Slight modifications introduced to the originally published SOD, CAT, and GR assays have been previously described [
32].
2.12. Quantification of Antioxidant Compounds
The concentrations of two major groups of antioxidant compounds—total phenolic compounds (TPC) and total flavonoids (TF)—were measured in the same methanol extracts used for TSS and MDA quantification.
TPC were determined by reaction with the Folin-Ciocalteu reagent [
37]. The methanol extracts were mixed with the reagent and Na
2CO
3, the samples were incubated for 90 min in the dark at room temperature, and the absorbance was measured at 765 nm. TPC concentrations were expressed as equivalents of the gallic acid (GA) standard (mg eq. GA g
−1 DW).
TF determination was based on the nitration with NaNO
2 of aromatic rings containing a catechol group, followed by a reaction with AlCl
3 under alkaline conditions [
38]. The absorbance of the sample was measured at 510 nm, and the total flavonoid content in the leaves was expressed in terms of equivalents of catechin (C), used as the standard (mg eq. C g
−1 DW).
2.13. Statistical Data Analysis
Data variance analysis was done using IBM SPSS Statistics for Windows (v. 23.0) software (IBM Corp., Armonk, NY, USA). A one-way ANOVA was performed at 95% confidence level, separately for the two types of soils (loam and sandy texture). Tukey’s honestly significant difference (HSD) test was used for post hoc comparisons.
A principal component analysis (PCA) was performed on all data using the statistical software R 6.3.6 with the FactoMineR package [
39]; the R package ggplot2 [
40] was used to extract and visualise the results.
3. Results
3.1. Effect of the Treatments on Morphological Parameters
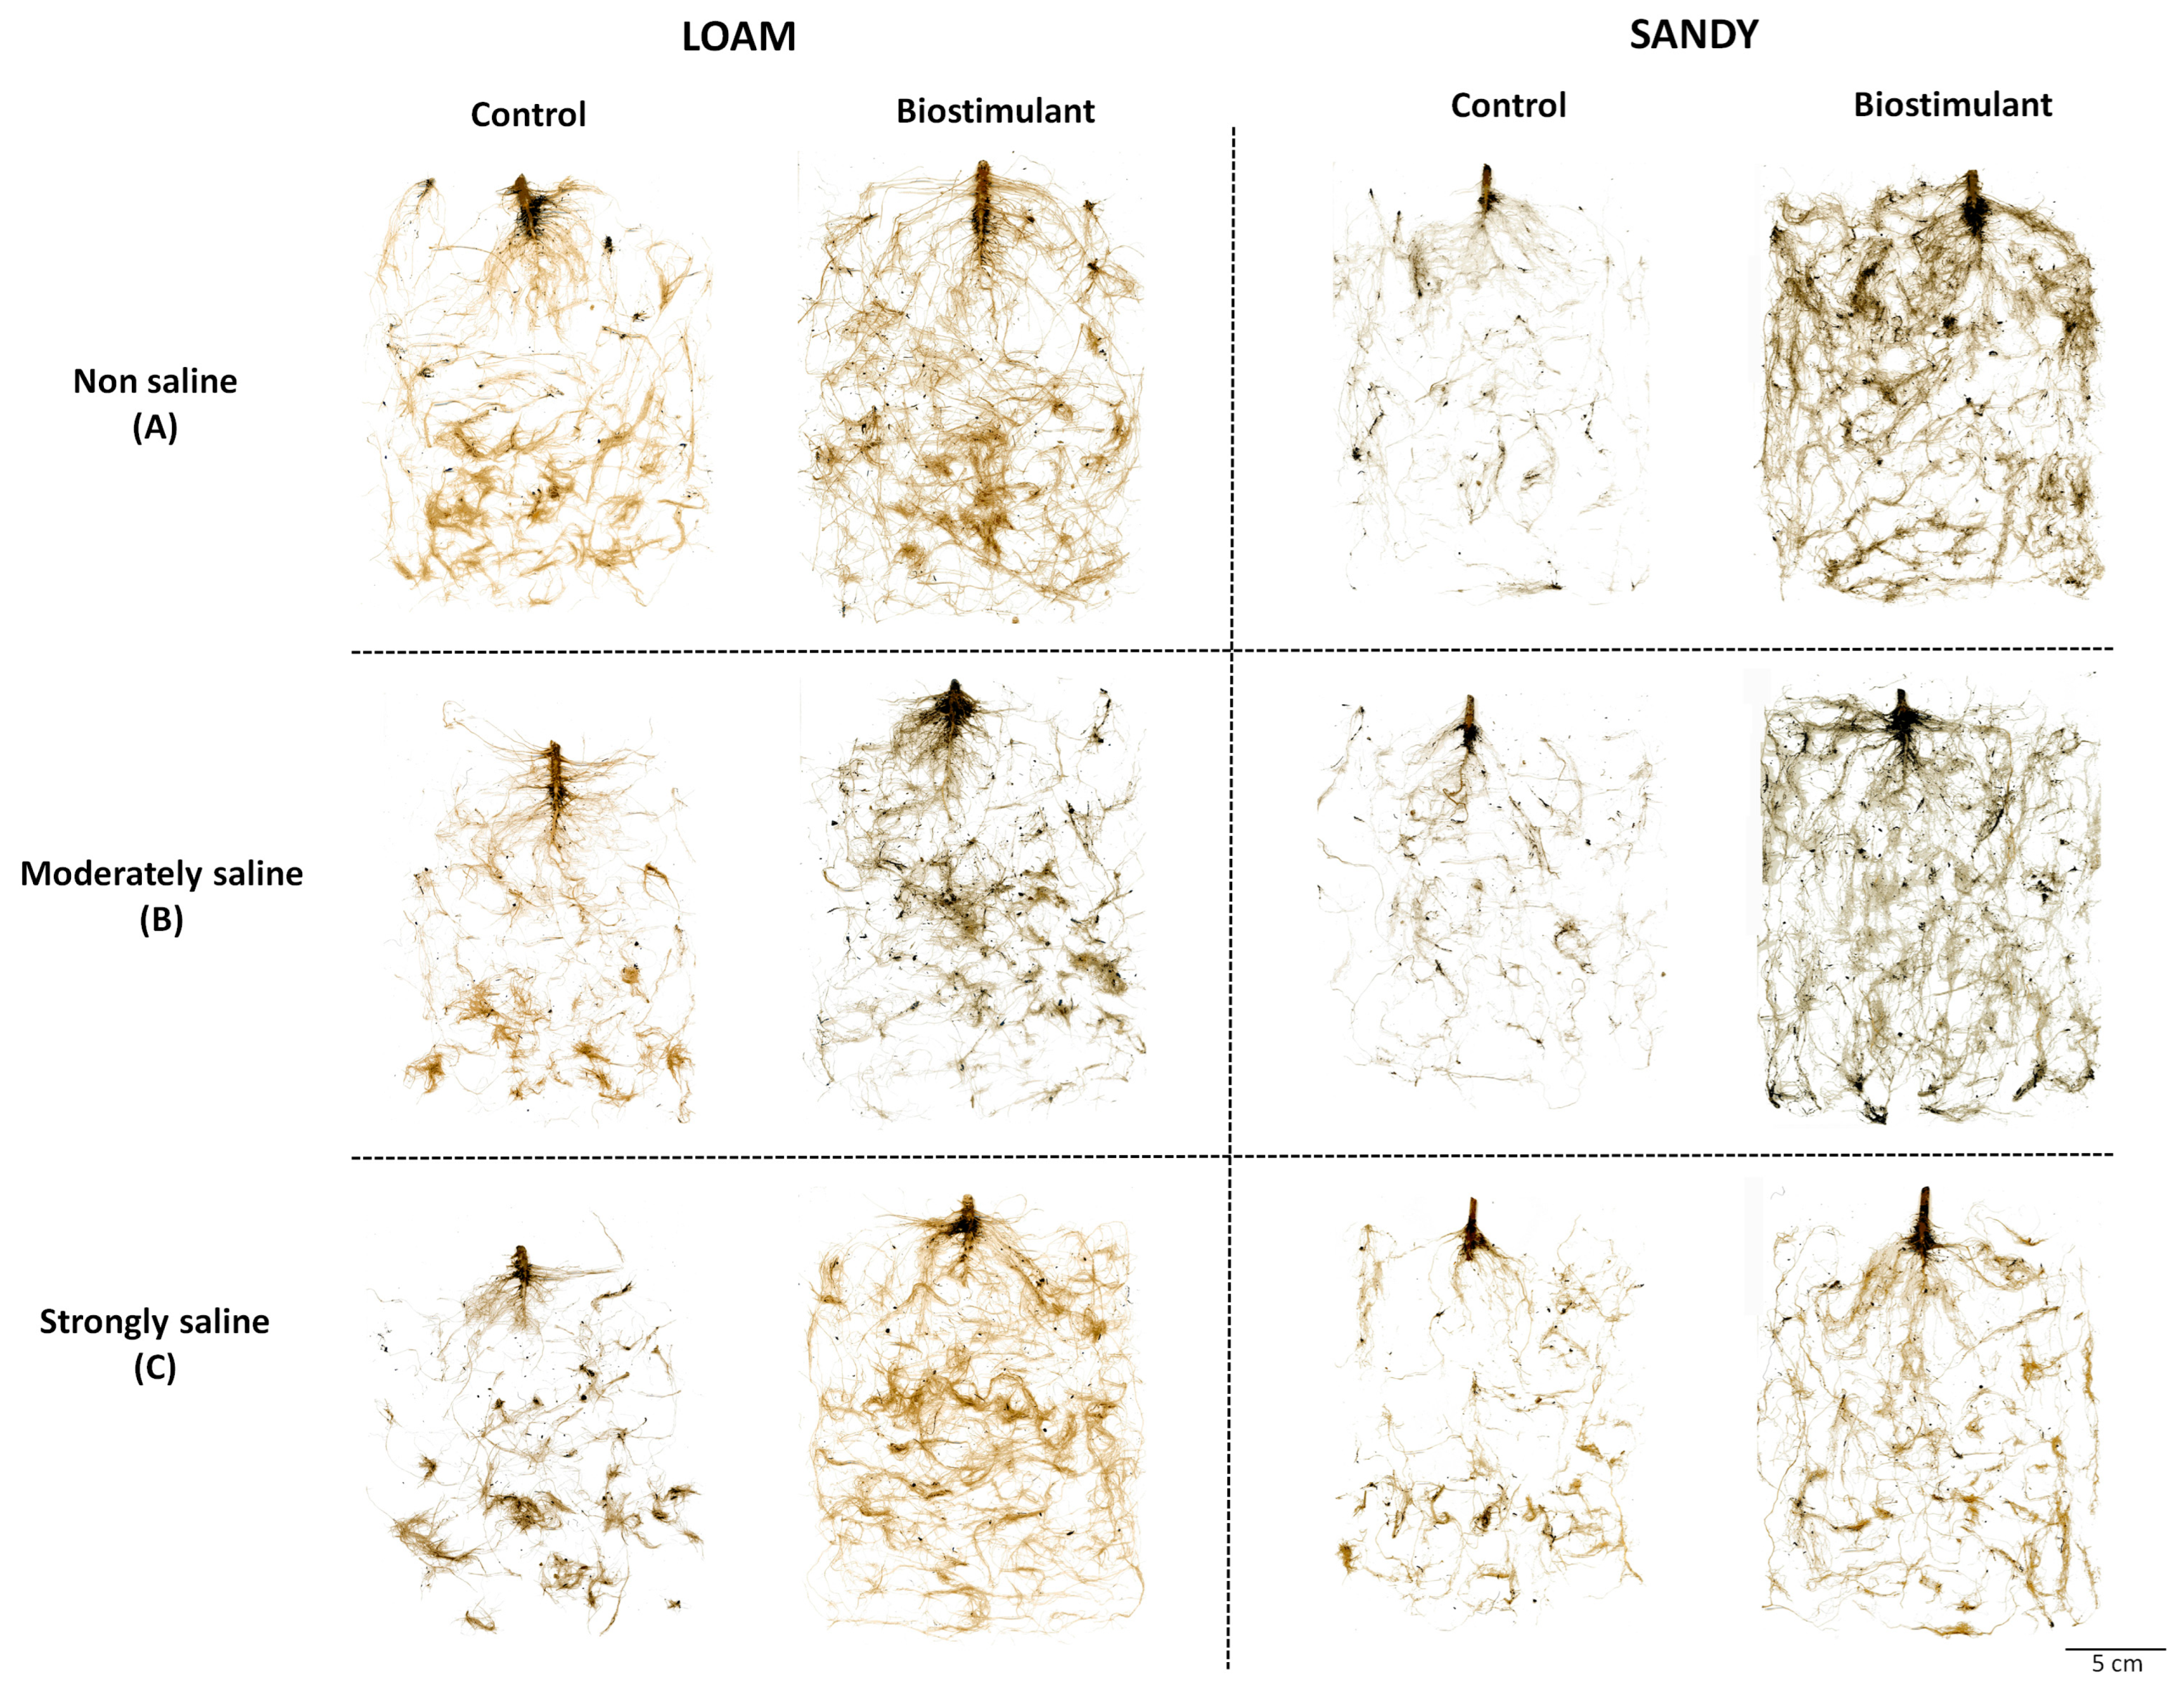
Salt stress inhibited the growth of control (no addition of the biostimulant)
S. lycopersicum plants in parallel with the increase in the concentration of salts in both types of soil texture (loam and sand), mainly affecting the roots, which represent the plant organs to be first and more directly exposed to the harmful effects of the salt in the substrate (
Figure 1).
However, applying the biostimulant BALOX
® favoured the development of the root system, which increased notably with respect to the corresponding controls without biostimulant under all tested experimental conditions. The best response was visually observed in plants grown on sandy-textured soil (
Figure 1). A significantly higher mean root area was observed for BALOX
®-treated plants with respect to the corresponding controls, on both soil types and under all conditions (
Table 2). In the loamy textured soil, the highest increase was found in plants from strongly saline conditions (2.61-fold), whereas in the sandy soil, this was found in the non-saline soils (5.40-fold).
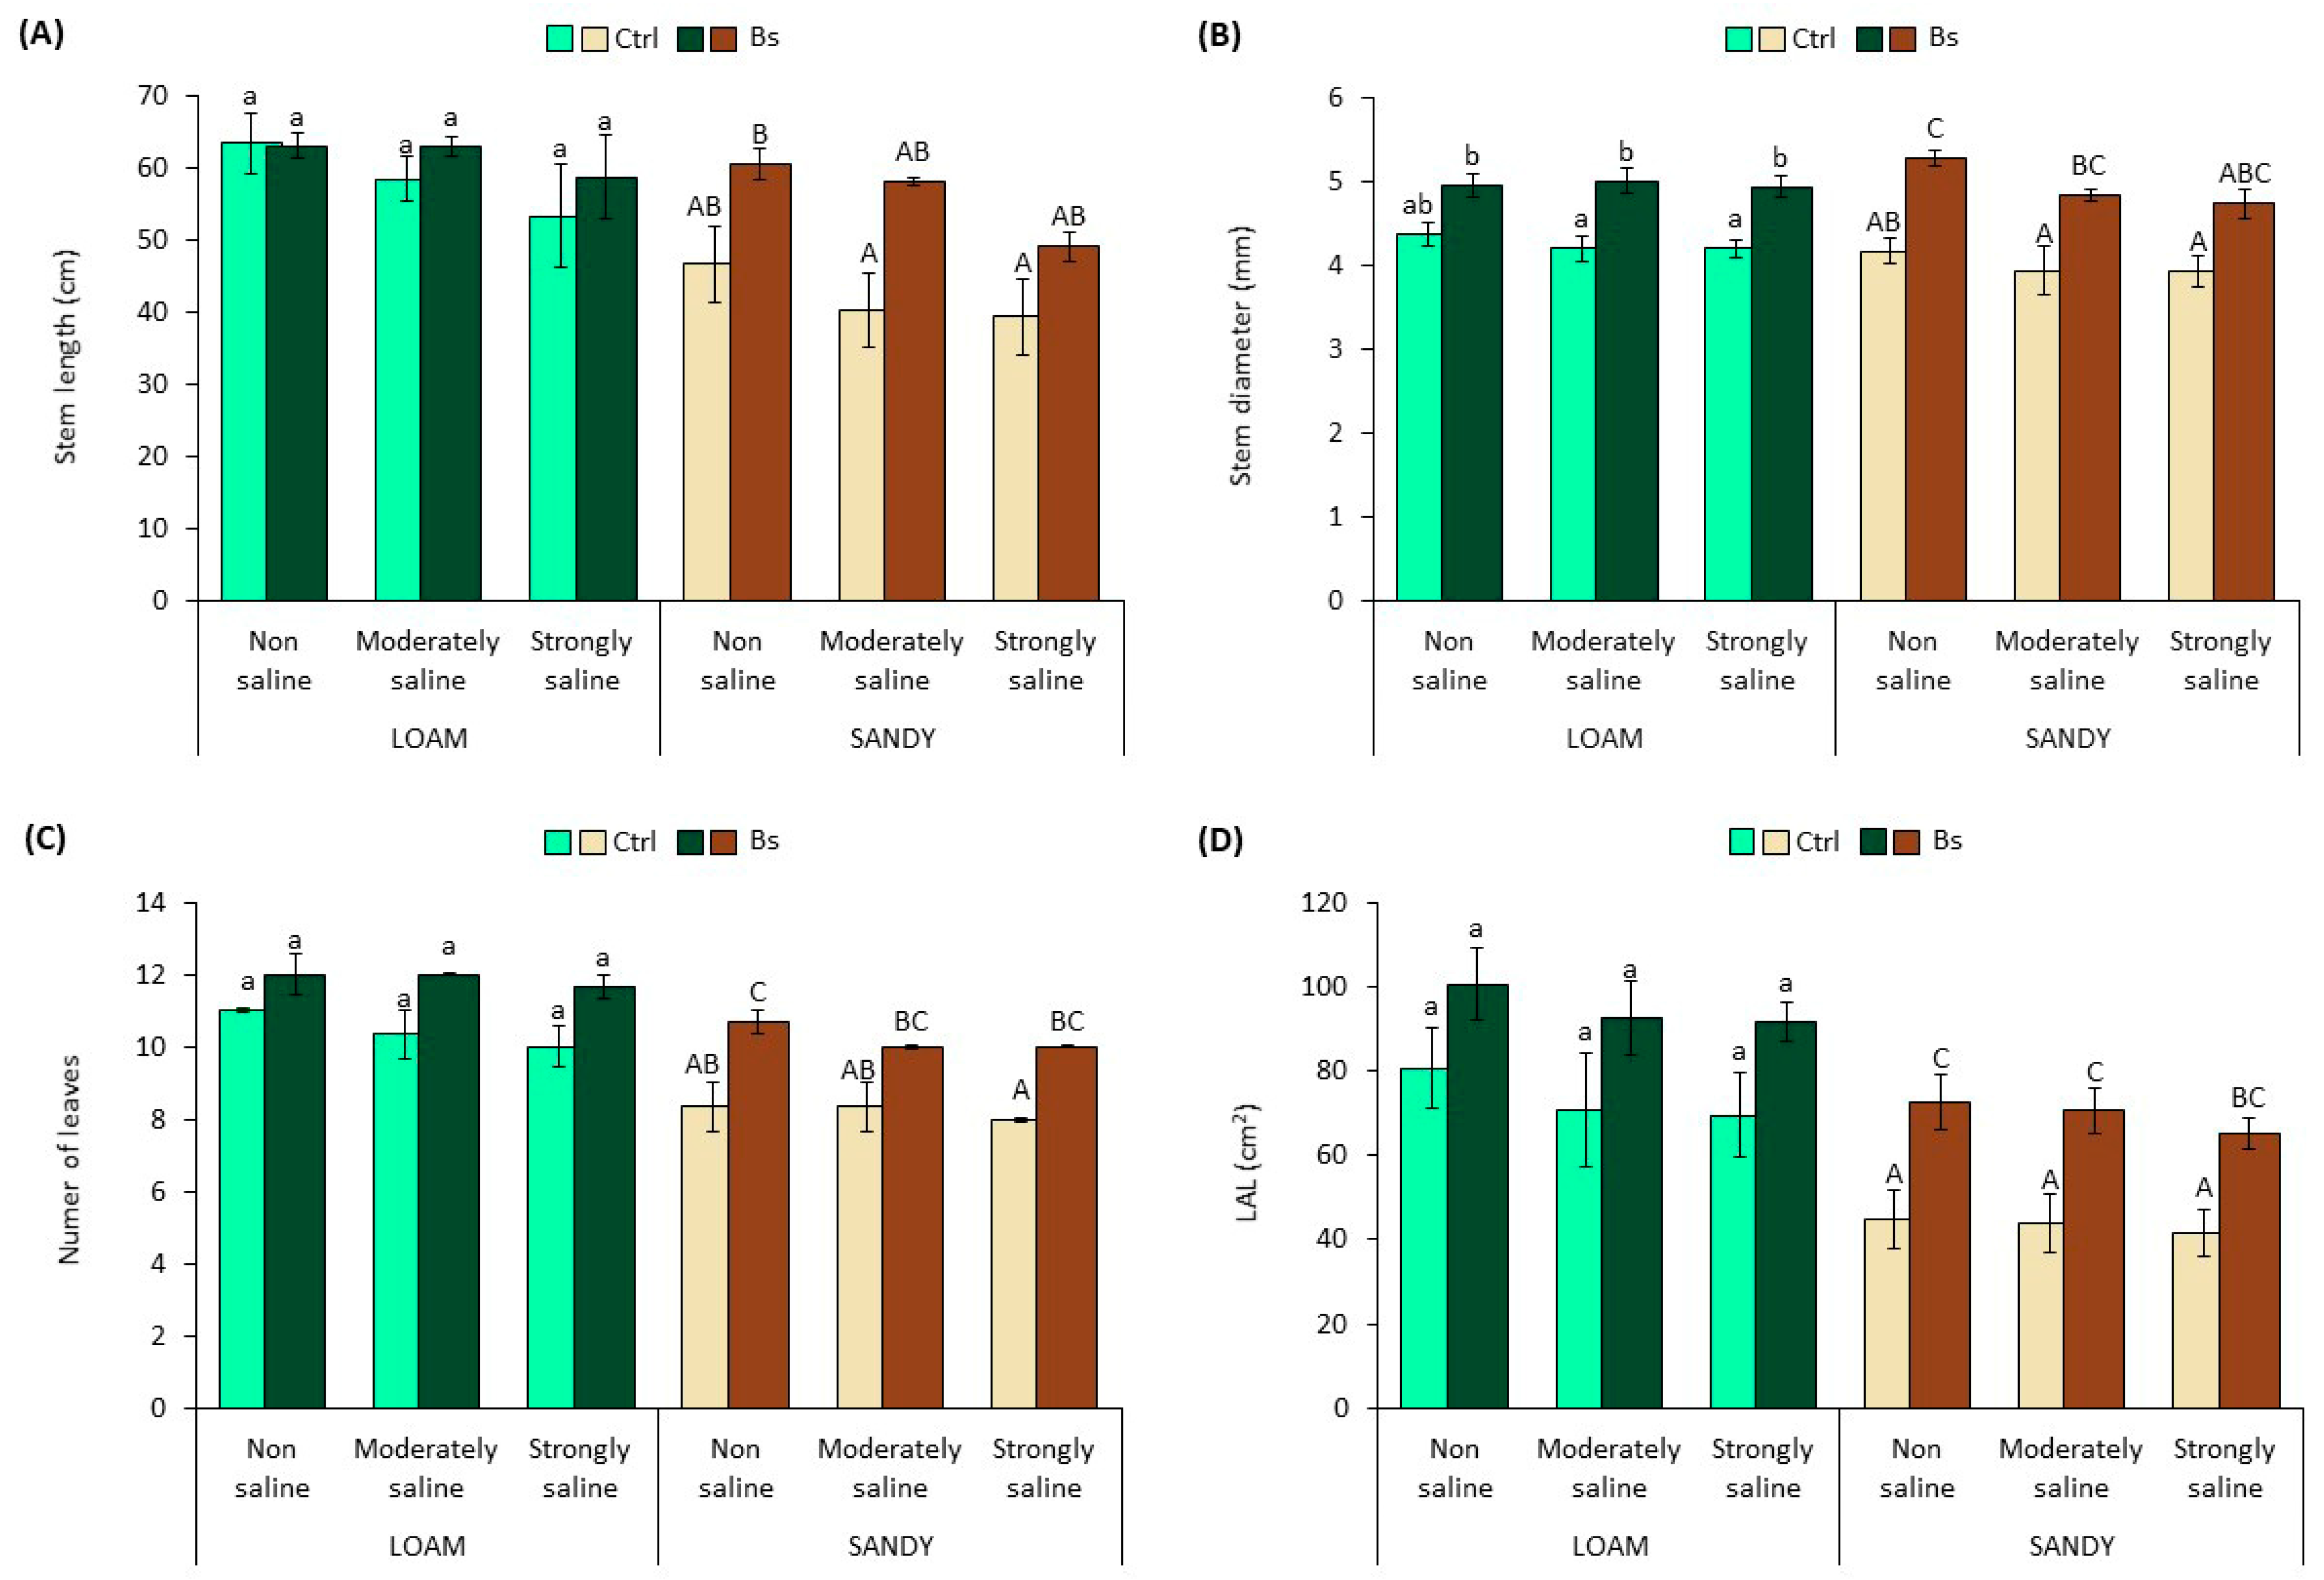
Stem length (SL) and stem diameter (SD), number of leaves (NL), leaf area of the longest leaf (LAL) (
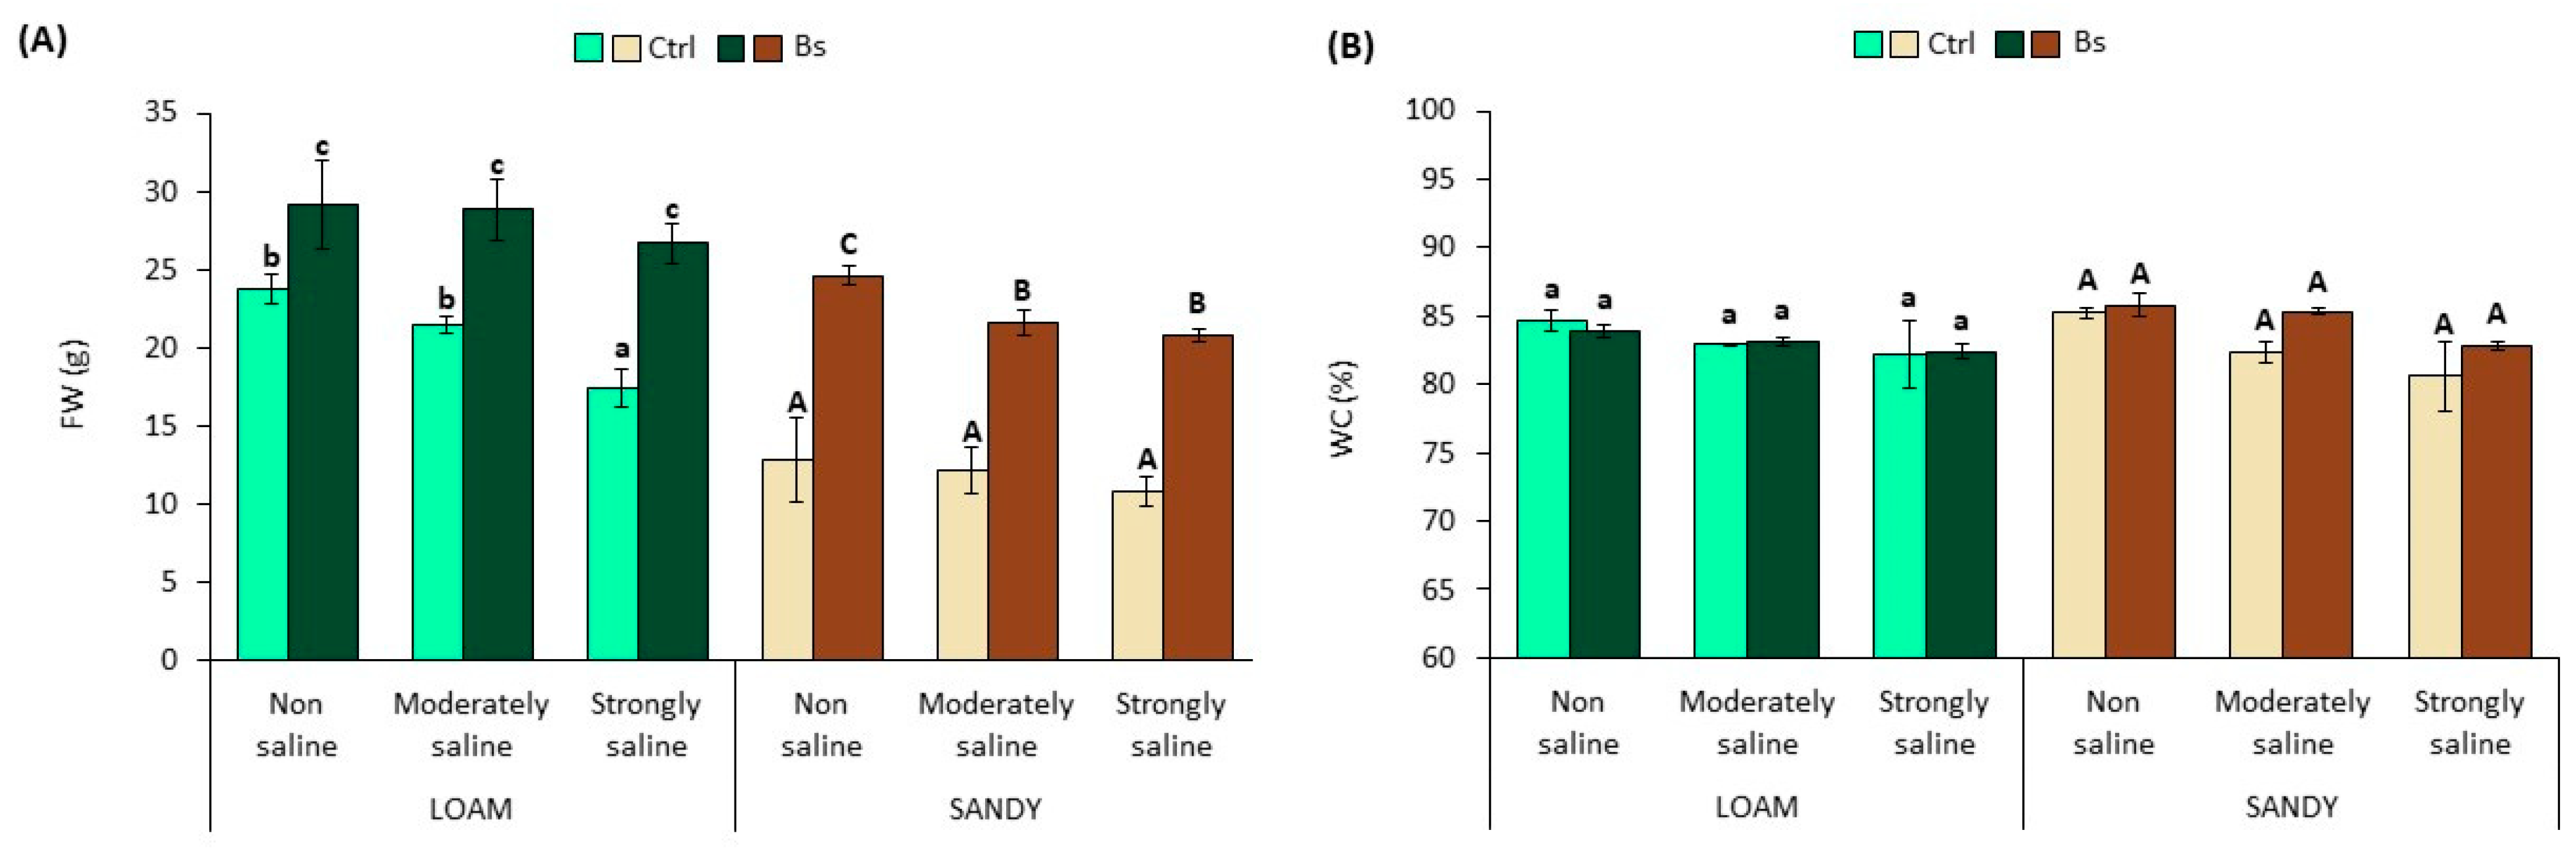
Figure 2) and total plant water content (WC) (
Figure 3) appeared to be also negatively affected by salinity in the two types of substrate, as a decreasing trend of the mean values of all these variables was observed with increasing soil salinity. However, the differences with non-saline soil were not statistically significant.
Similarly, the application of BALOX
® to plants grown in loam-textured soil increased the mean values of the measured growth parameters, SL, SD, NL and LAL (
Figure 2A–D); however, the differences with the corresponding controls without biostimulant were not statistically significant except for SD in moderately and strongly saline conditions (
Figure 2B). The effect of BALOX
® on plants grown in sandy-textured soil was more pronounced, inducing significant increases of SD, NL and LAL in practically all tested conditions, non-saline (NS), moderately saline (MS) and strongly saline (SS) (
Figure 2B–D). As expected, the higher stimulation of root growth induced by BALOX
® in sandy soil was reflected in plant aerial growth; for example, LAL increased 1.6-fold using the biostimulant in SS conditions compared to untreated plants (
Figure 2D).
However, a significant reduction of fresh weight (FW) was observed in control plants (no biostimulant applied) grown on loam-textured soil under strongly saline (SS) conditions, compared to those in non-saline (NS) and moderately saline (MS) substrates (
Figure 3A). The FW of control plants in sandy soil was also affected by salts, although not significantly. For example, the FW of plants under strongly saline (SS) conditions in loamy soil decreased by 27% compared to non-saline (NS) conditions. In contrast, under the same conditions in sandy soil, the FW of the plants decreased only by 16%.
Plants treated with the biostimulant BALOX
® showed significant increases in FW compared to control plants under non-saline and saline conditions and in both types of substrate, loam and sandy, although the relative FW increases were more pronounced in sandy soil (
Figure 3A). For example, in strongly saline conditions, plants from loam soil showed a FW 1.54-fold higher than that of the corresponding control, whereas under the same conditions on sandy soil, the FW increased 1.93-fold compared with the control. As mentioned above, plant water content decreased slightly with increasing soil salinity, but the differences were not statistically significant, as was also non-significant the effect of biostimulant applications under any of the experimental conditions tested (
Figure 3B).
3.2. Photosynthetic Pigments Content
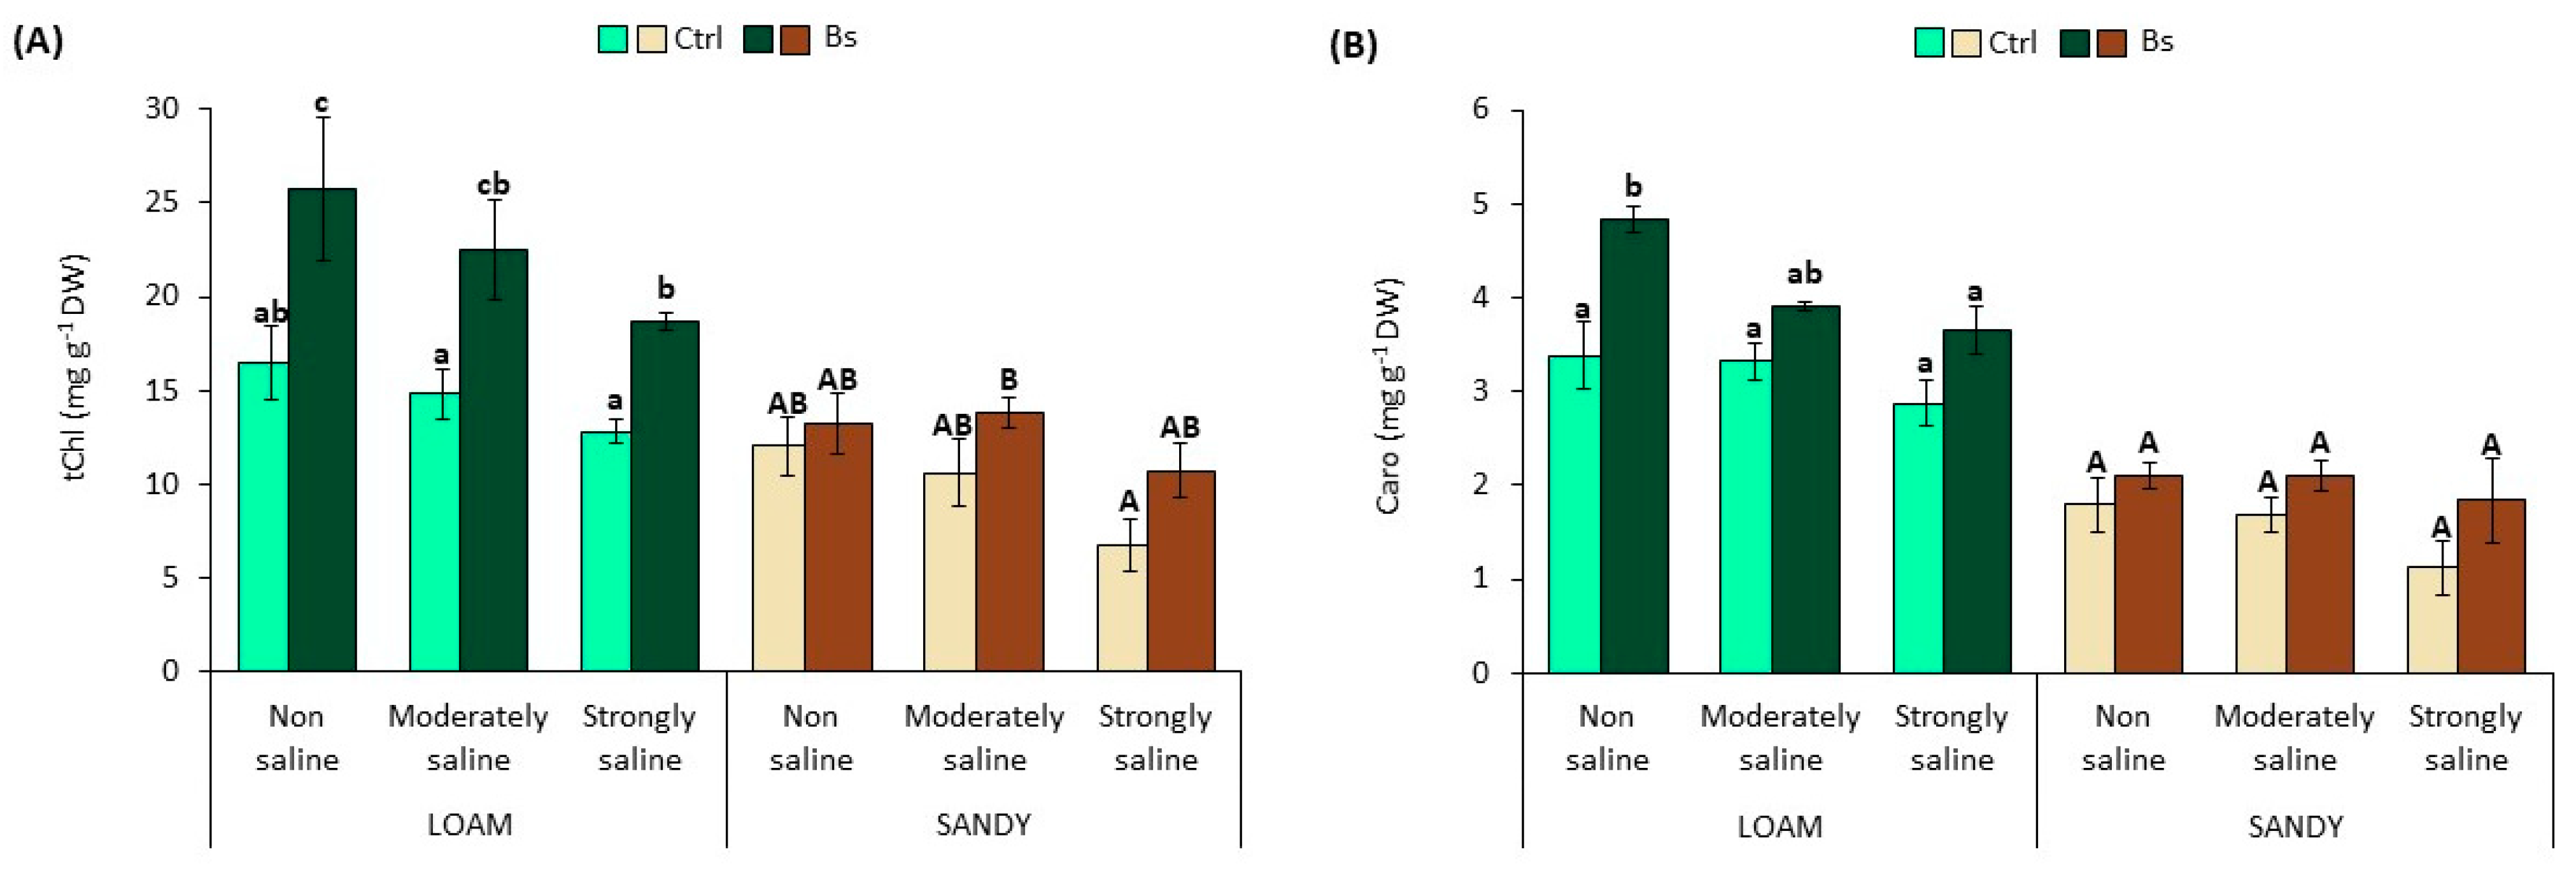
Salt stress caused a reduction in the contents of photosynthetic pigments, total chlorophylls and carotenoids, in S. lycopersium plants in a concentration-dependent manner and in the two soil textures.
Total chlorophyll contents (tChl) in leaves of control plants without biostimulant showed a reduction of 22 and 44% in strongly saline (SS) conditions of the loamy and sandy texture in relation to the non-saline (NS) conditions (
Figure 4A). Under the same conditions, the carotenoid content (Caro) was reduced by 15 or 38% in SS conditions, depending on the texture type (
Figure 4B).
Contrary to the observations in the controls, plants treated with BALOX® showed significant increases in pigments under all salinity conditions, mainly in the loamy texture, although important increases were also observed in plants grown in sandy texture soil.
For example, in loam texture, the concentration of tChl and Caro increased under all conditions by 1.5–1.6 and 1.2–1.4 fold, respectively, in biostimulant-treated plants. Likewise, in biostimulant-treated plants in sandy texture, these increments were 1.1 to 1.6 for tChl and 1.2 to 1.6 for Caro (
Figure 4).
3.3. Ion Accumulation
The concentration of sodium (Na+) and chloride (Cl−) increased significantly in both roots and leaves of control plants in parallel to the salt concentration in the two types of soil with different textures.
A maximum Na
+ concentration in roots was reached under strongly saline (SS) conditions in both loam (1175.85) and sandy (837.23 µmol g
−1 DW) textured soils. Lower values were observed in leaves than in roots; for example, the maximum Na
+ values were 739.16 and 557.78 µmol g
−1 DW in leaves of plants grown in SS conditions on loamy and sandy textured soils, respectively. In contrast, Cl
− concentration in roots was lower than in leaves, as shown in
Table 3. The use of the biostimulant BALOX
® caused a significant reduction of Na
+ and Cl
− contents in both roots and leaves of plants, mainly under strongly saline (SS) conditions of both soil textures. For example, in all experimental conditions, reductions in Na
+ concentrations in roots were found in the range of 14 to 24% on loamy soil and 12 to 26% on sandy soil. In leaves, this reduction was even greater in both soil textures in relation to the controls of 24 to 34% and 20 to 43%, respectively. Similar ranges of reduction were also found for Cl
− content (
Table 3).
A different pattern was found for potassium (K
+) and calcium (Ca
2+), which decreased in the roots and leaves of control plants in parallel to the salt concentration in both soil types. Nevertheless, the concentration of the two ions was higher in leaves than in roots. For example, under non-saline (NS) conditions where the maximum values were found, the K
+ concentration was 3.81- and 4.19-fold higher in leaves than in roots, in loamy and sandy soils, respectively. A similar pattern was observed for Ca
2+ concentration under the same conditions (NS), with a concentration on loam of 2.30-fold and on sand 7.57-fold higher in leaves than in roots. The addition of BALOX
® increased the concentration of K
+ mainly in leaves, increasing between 1.2 and 1.3-fold in all conditions in loam-textured soil. Likewise, the biostimulant increased the mean Ca
2+ in both roots and leaves of
S. lycopersium, with significant differences compared to control plants. This increase ranged from 1.1 to 1.2-fold in roots in all salinity conditions of plants grown on loamy-textured soil and from 1.4 to 1.6-fold in roots on sandy-textured soil. However, this increase was more pronounced in leaves, with up to 3.2 and 3.8-fold more Ca
2+ found in strongly saline (SS) conditions compared to controls in both loamy and sandy textured soils, respectively (
Table 3).
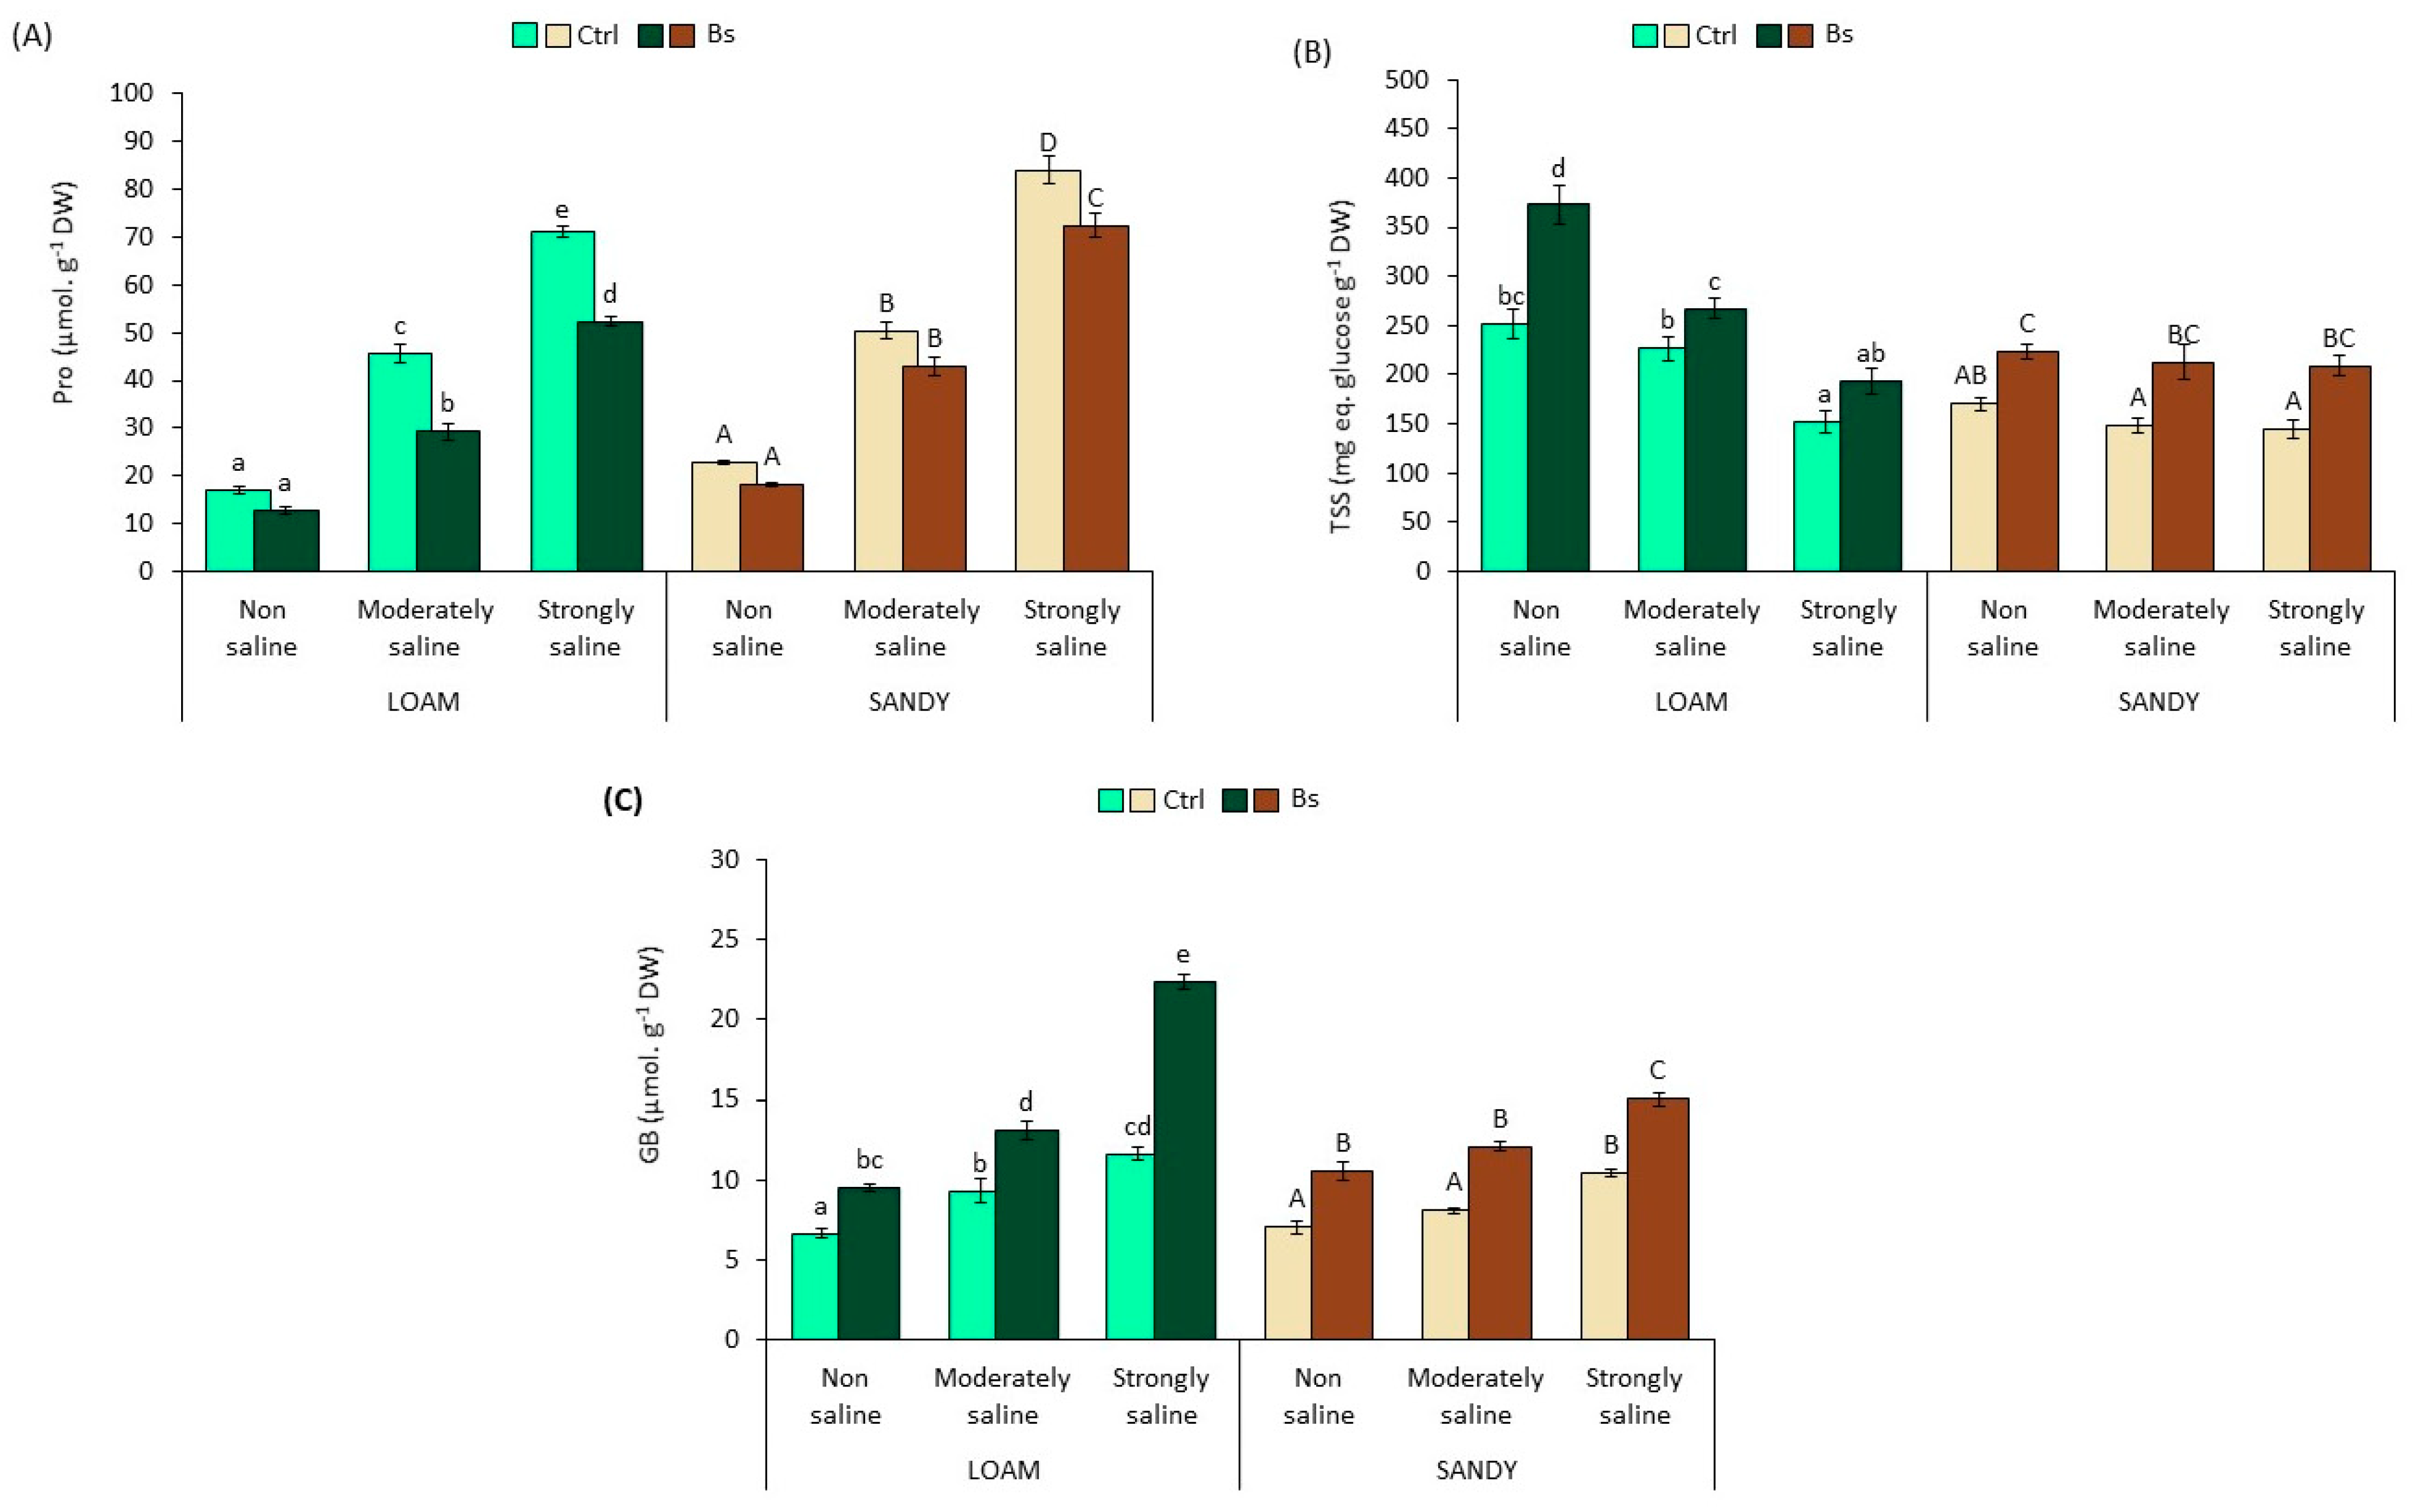
3.4. Osmolytes Analysis
The main effects of the different treatments on the mean values of the osmolytes analysed in
S. lycopersicum leaf extracts are shown in
Figure 5.
In the absence of the biostimulant, proline (Pro) concentration increased significantly in response to salinity, reaching a maximum peak of 4.2-fold on loamy soil and of 3.7-fold on sandy-textured soils compared to their respective non-saline (NS) conditions. However, the addition of BALOX
® reduced the concentrations of proline accumulated with respect to the values from untreated plants. This reduction was significant in plants from strongly saline conditions on both soils, whereas in the moderate saline conditions, it was significant only in soils with loamy texture (
Figure 5A).
Contrary to Pro, total soluble sugars (TSS) in leaves of plants without biostimulant gradually decreased in parallel with increasing soil salinity, reaching a minimum value in the presence of strongly saline (SS) conditions of 153 and 145 mg eq. glucose g
−1 DW on loamy and sandy soils, respectively (
Figure 5B), representing a reduction of 39% and 15% compared to non-saline (NS) conditions. However, TSS concentrations increased significantly in BALOX
®-treated plants in all salinity conditions and in both soil textures. For example, a 1.4 to 1.9-fold increase in TSS was achieved in loam-textured soil compared to plants not treated with BALOX
®.
Foliar levels of GB increased significantly with soil salinity, reaching maximum values of 12 and 10 µmol g
−1 DW in SS conditions compared to NS in loam and sandy-textured soils. These levels also increased significantly in the presence of BALOX
®, even doubling in some cases, as observed in the loam soil under strongly saline conditions (
Figure 5C).
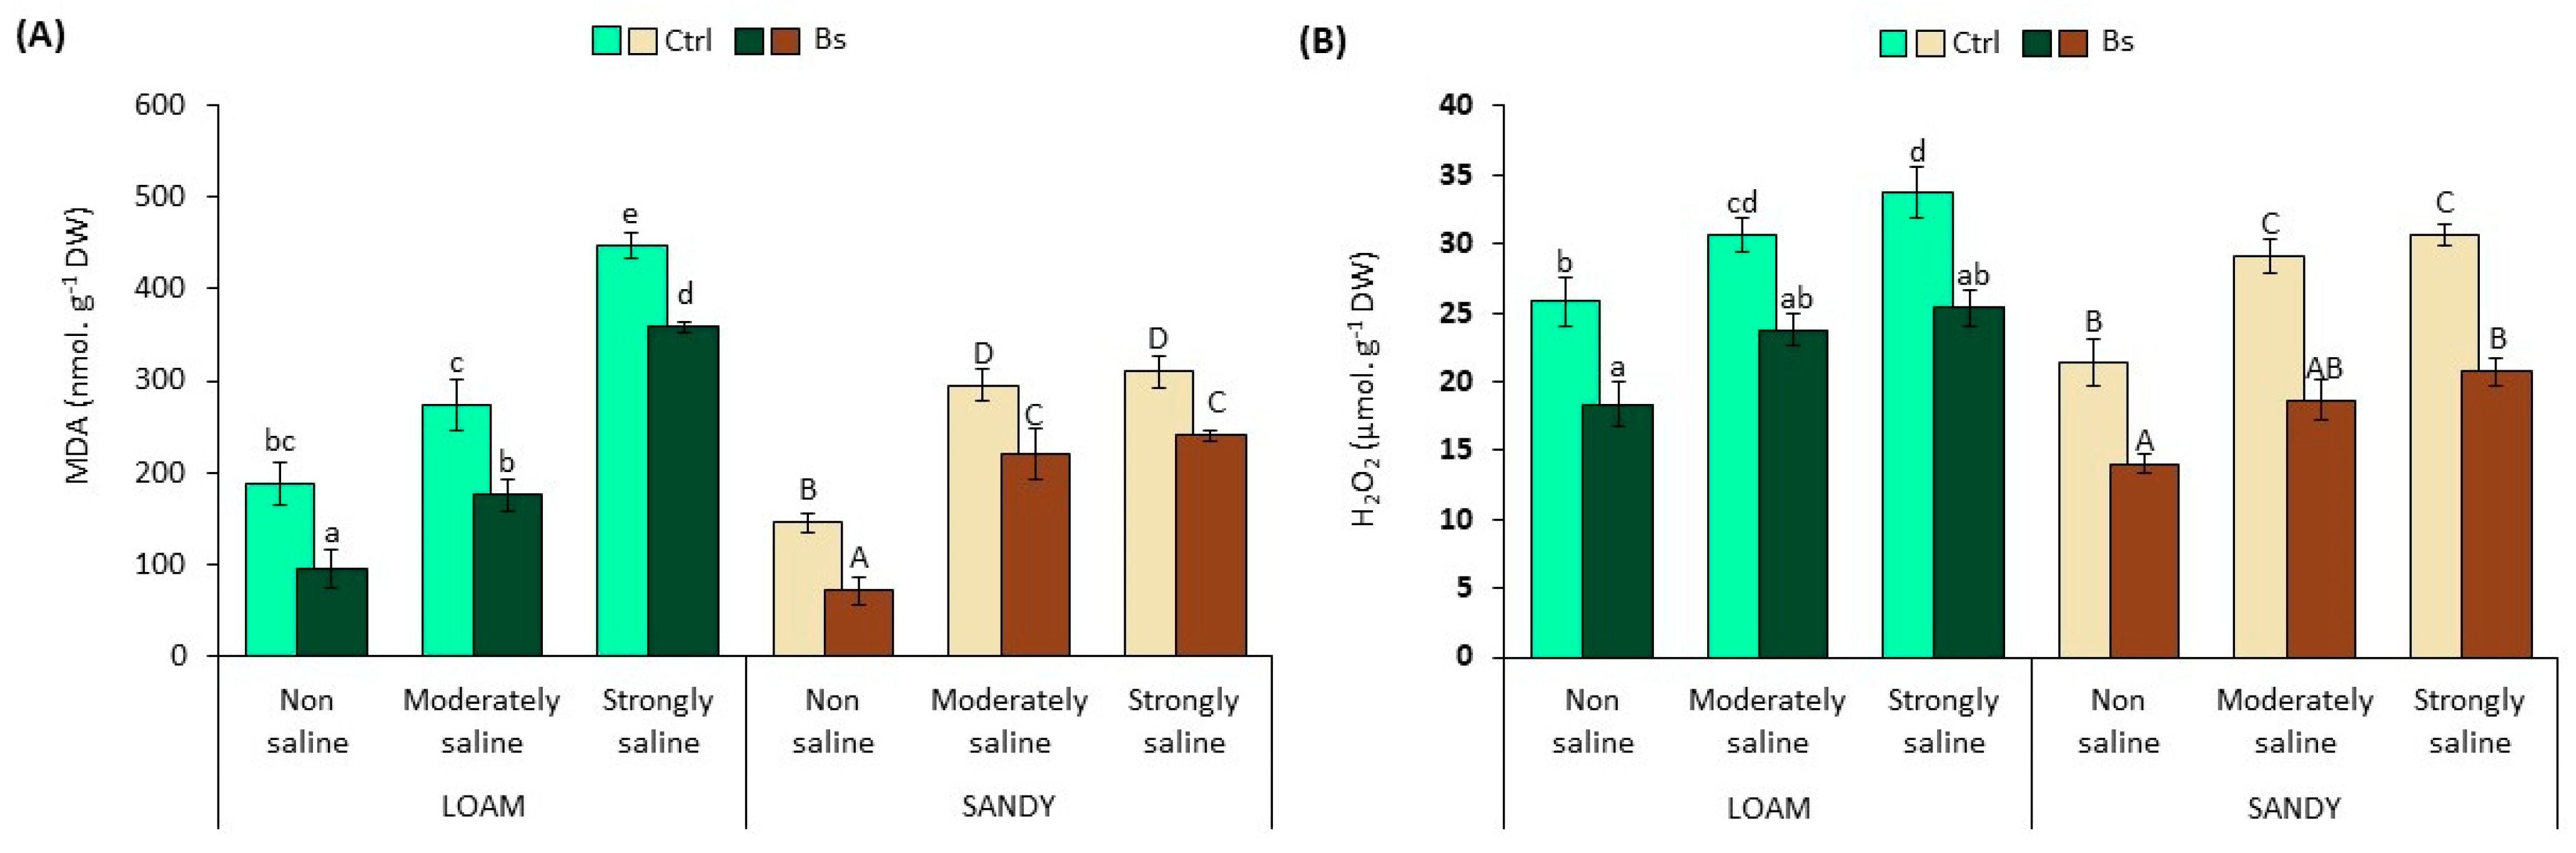
3.5. Oxidative Stress Biomarkers
The content of two reliable biochemical markers, malondialdehyde (MDA) and hydrogen peroxide (H
2O
2) in leaf extracts, was used to assess the possible generation of secondary oxidative stress in plants subjected to salt stress treatments. Malondialdehyde is a product of the peroxidation of unsaturated fatty acids, which indicates damage to cell membranes by “reactive oxygen species” (ROS) in plants and animals [
41].
The significant and progressive increase of MDA and H
2O
2 levels (
Figure 6) in leaf extracts in parallel to salinity revealed the production of secondary oxidative stress in
S. lycopersicum plants without biostimulant. A 1.5- and 2.0-fold increase in MDA was found in moderate salinity (MS) conditions, as well as a 2.4- and 2.1-fold increase in strongly saline (SS) compared to non-saline (NS) conditions in loamy and sandy textured soil, respectively (
Figure 6A).
Likewise, H
2O
2 levels reached a maximum content of 34 and 31 µmol g
−1 DW in SS conditions compared to NS, representing 1.3- and 1.4-fold increases in loam- and sandy-textured soil, respectively (
Figure 6B).
However, BALOX
®-treated plants significantly decreased both MDA and H
2O
2 levels in all experimental conditions. MDA reductions ranged from 20 to 49% and 22 to 51% lower in loam and sandy soil conditions, respectively (
Figure 6A). In addition, the H
2O
2 concentration in the foliar extracts was reduced to 25 and 21 µmol g
−1 DW under SS conditions, being 25 and 32% lower than in plants without biostimulant in loamy and sandy textured soils, respectively.
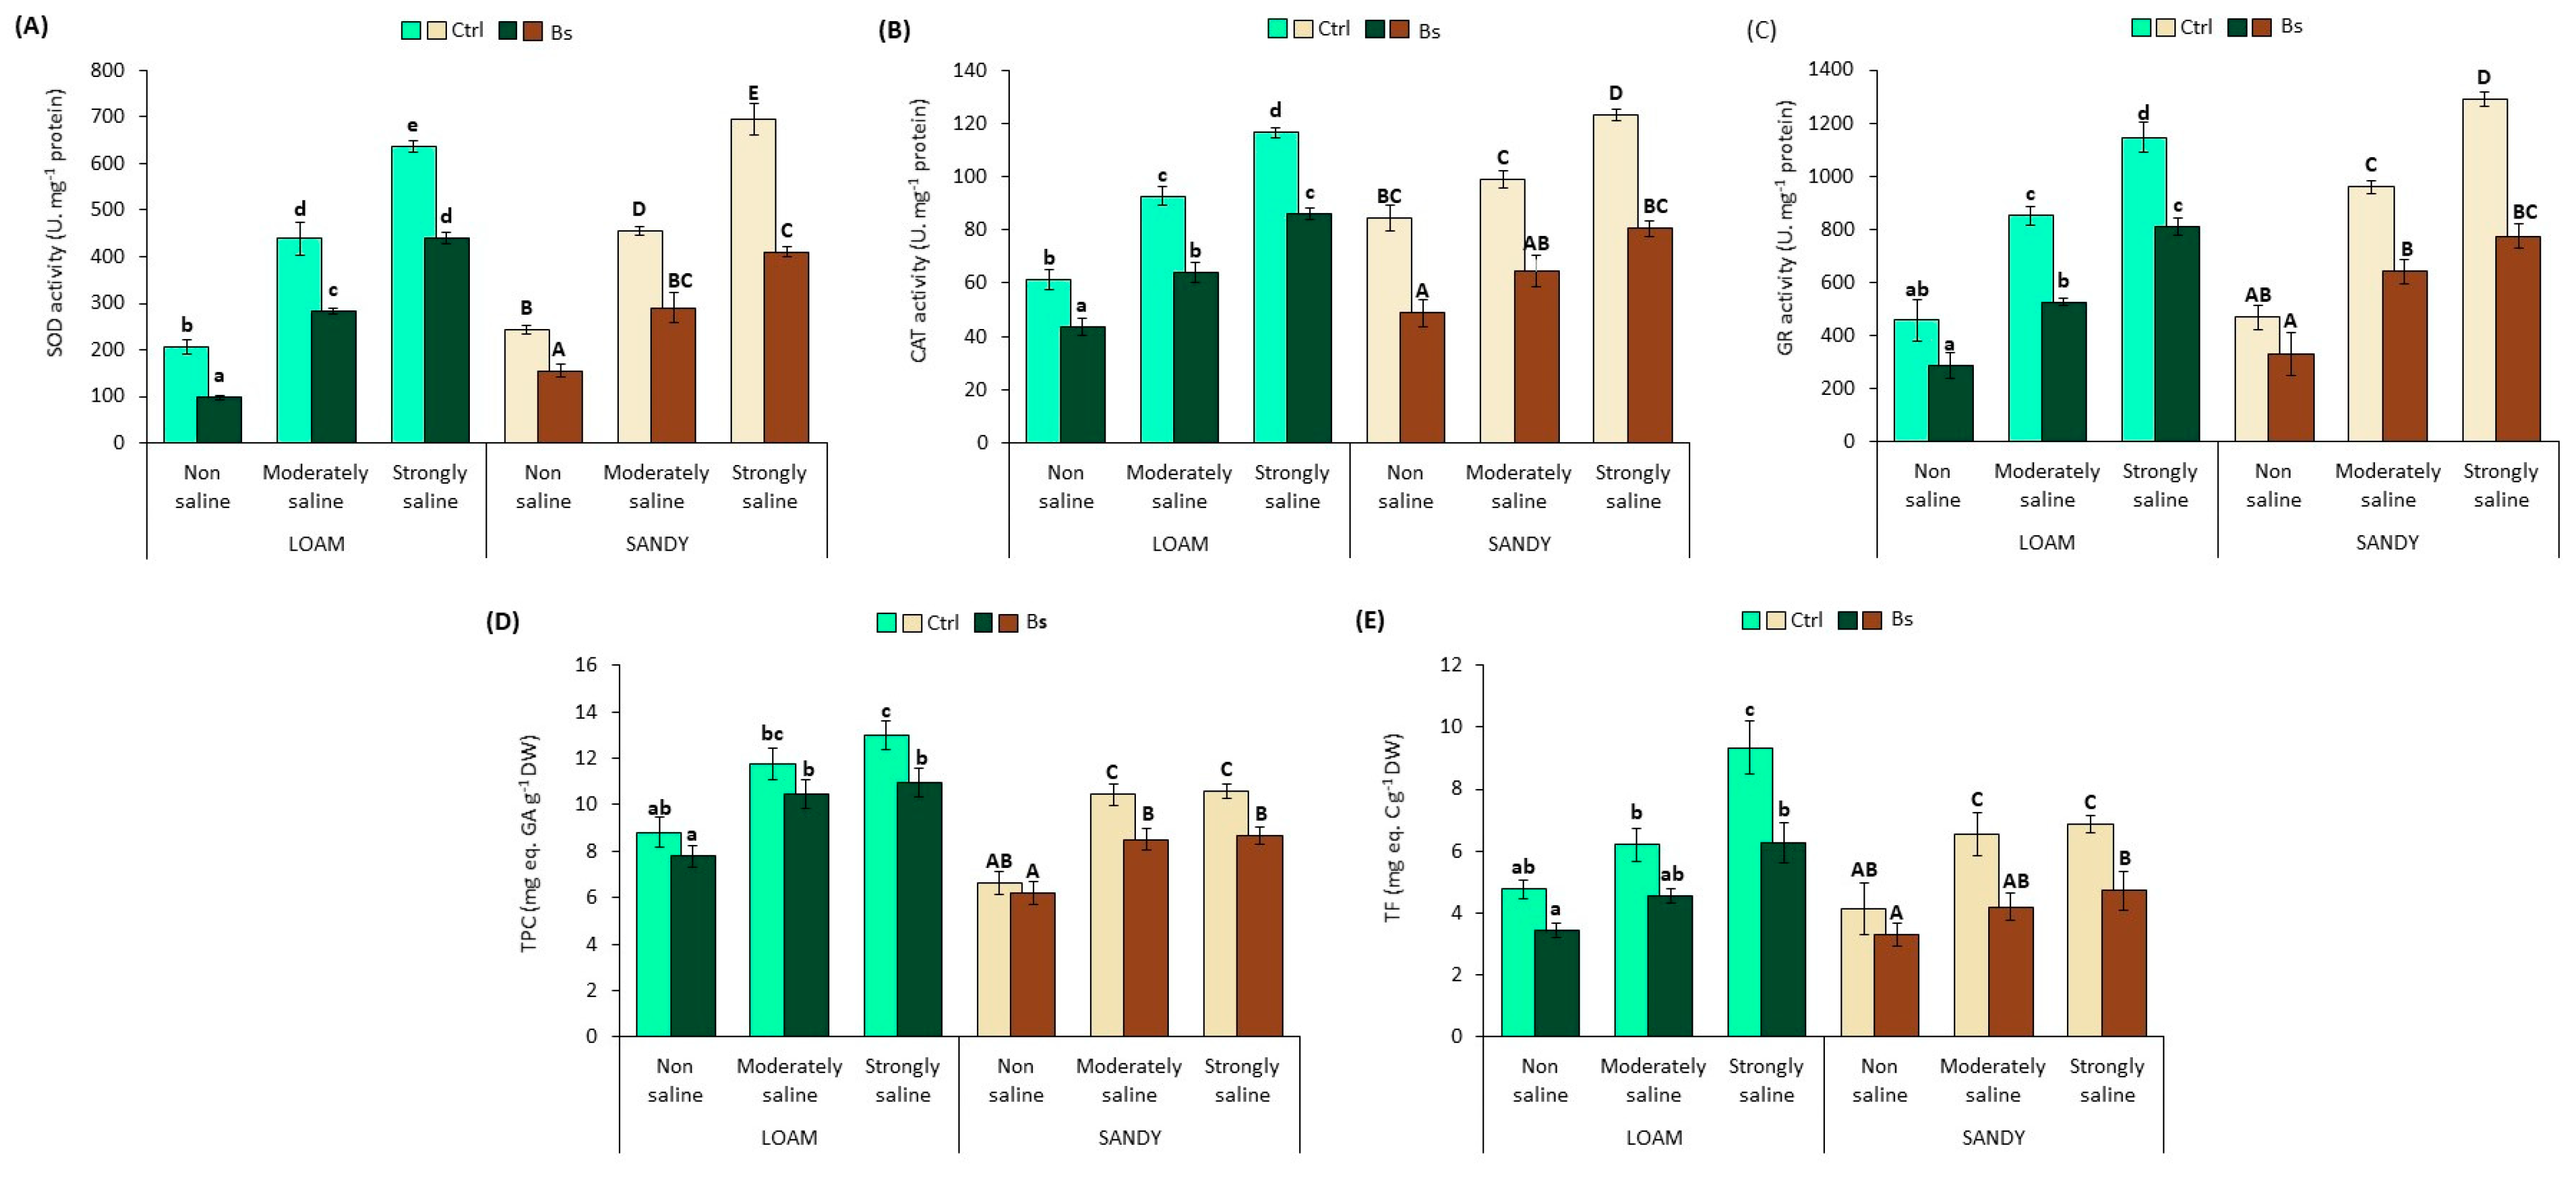
3.6. Antioxidant Enzyme Activities and Antioxidant Compounds
To counteract oxidative stress, plants use various antioxidant systems, both enzymatic and non-enzymatic. Amongst the former, some of the most relevant are the enzymes superoxide dismutase (SOD), catalase (CAT) and glutathione reductase (GR); non-enzymatic antioxidants include total phenolic compounds (TPC) and total flavonoids (TF), which act in plants after enzymes as a second line of defence against oxidative stress when ROS levels are too high [
42].
The specific activities of the mentioned enzymes were determined in leaf extracts of
S. lycopersicum plants (
Figure 7A–C). The activities of the three enzymes increased significantly in plants in parallel with salt concentration in both types of soil texture (loam and sand). SOD activities in control plants under strongly saline (SS) conditions reached values of 638 units per mg protein on loamy soil, and 694 on sandy soil (
Figure 7A), compared to 117 and 123 units mg
−1 protein of CAT (
Figure 7B), and 1146 and 1291 units mg
−1 protein of GR (
Figure 7C) in loam and sandy texture soils, respectively. However, plants treated with BALOX
® showed a significant reduction in the mean values of the specific activity of these three enzymes in all experimental conditions and both types of soil texture; for example, in SS conditions, the reductions amounted to 31% and 41% for SOD, 26 and 35% for CAT and for GR 29 and 40% with respect to plants without biostimulant in loam and sandy soil texture, respectively.
TPC and TF contents were also determined in leaf extracts, showing an upward trend similar to that of enzymes due to salinity effects. Again, in both soil texture types and all testing settings, BALOX® application decreased the TPC and TF levels.
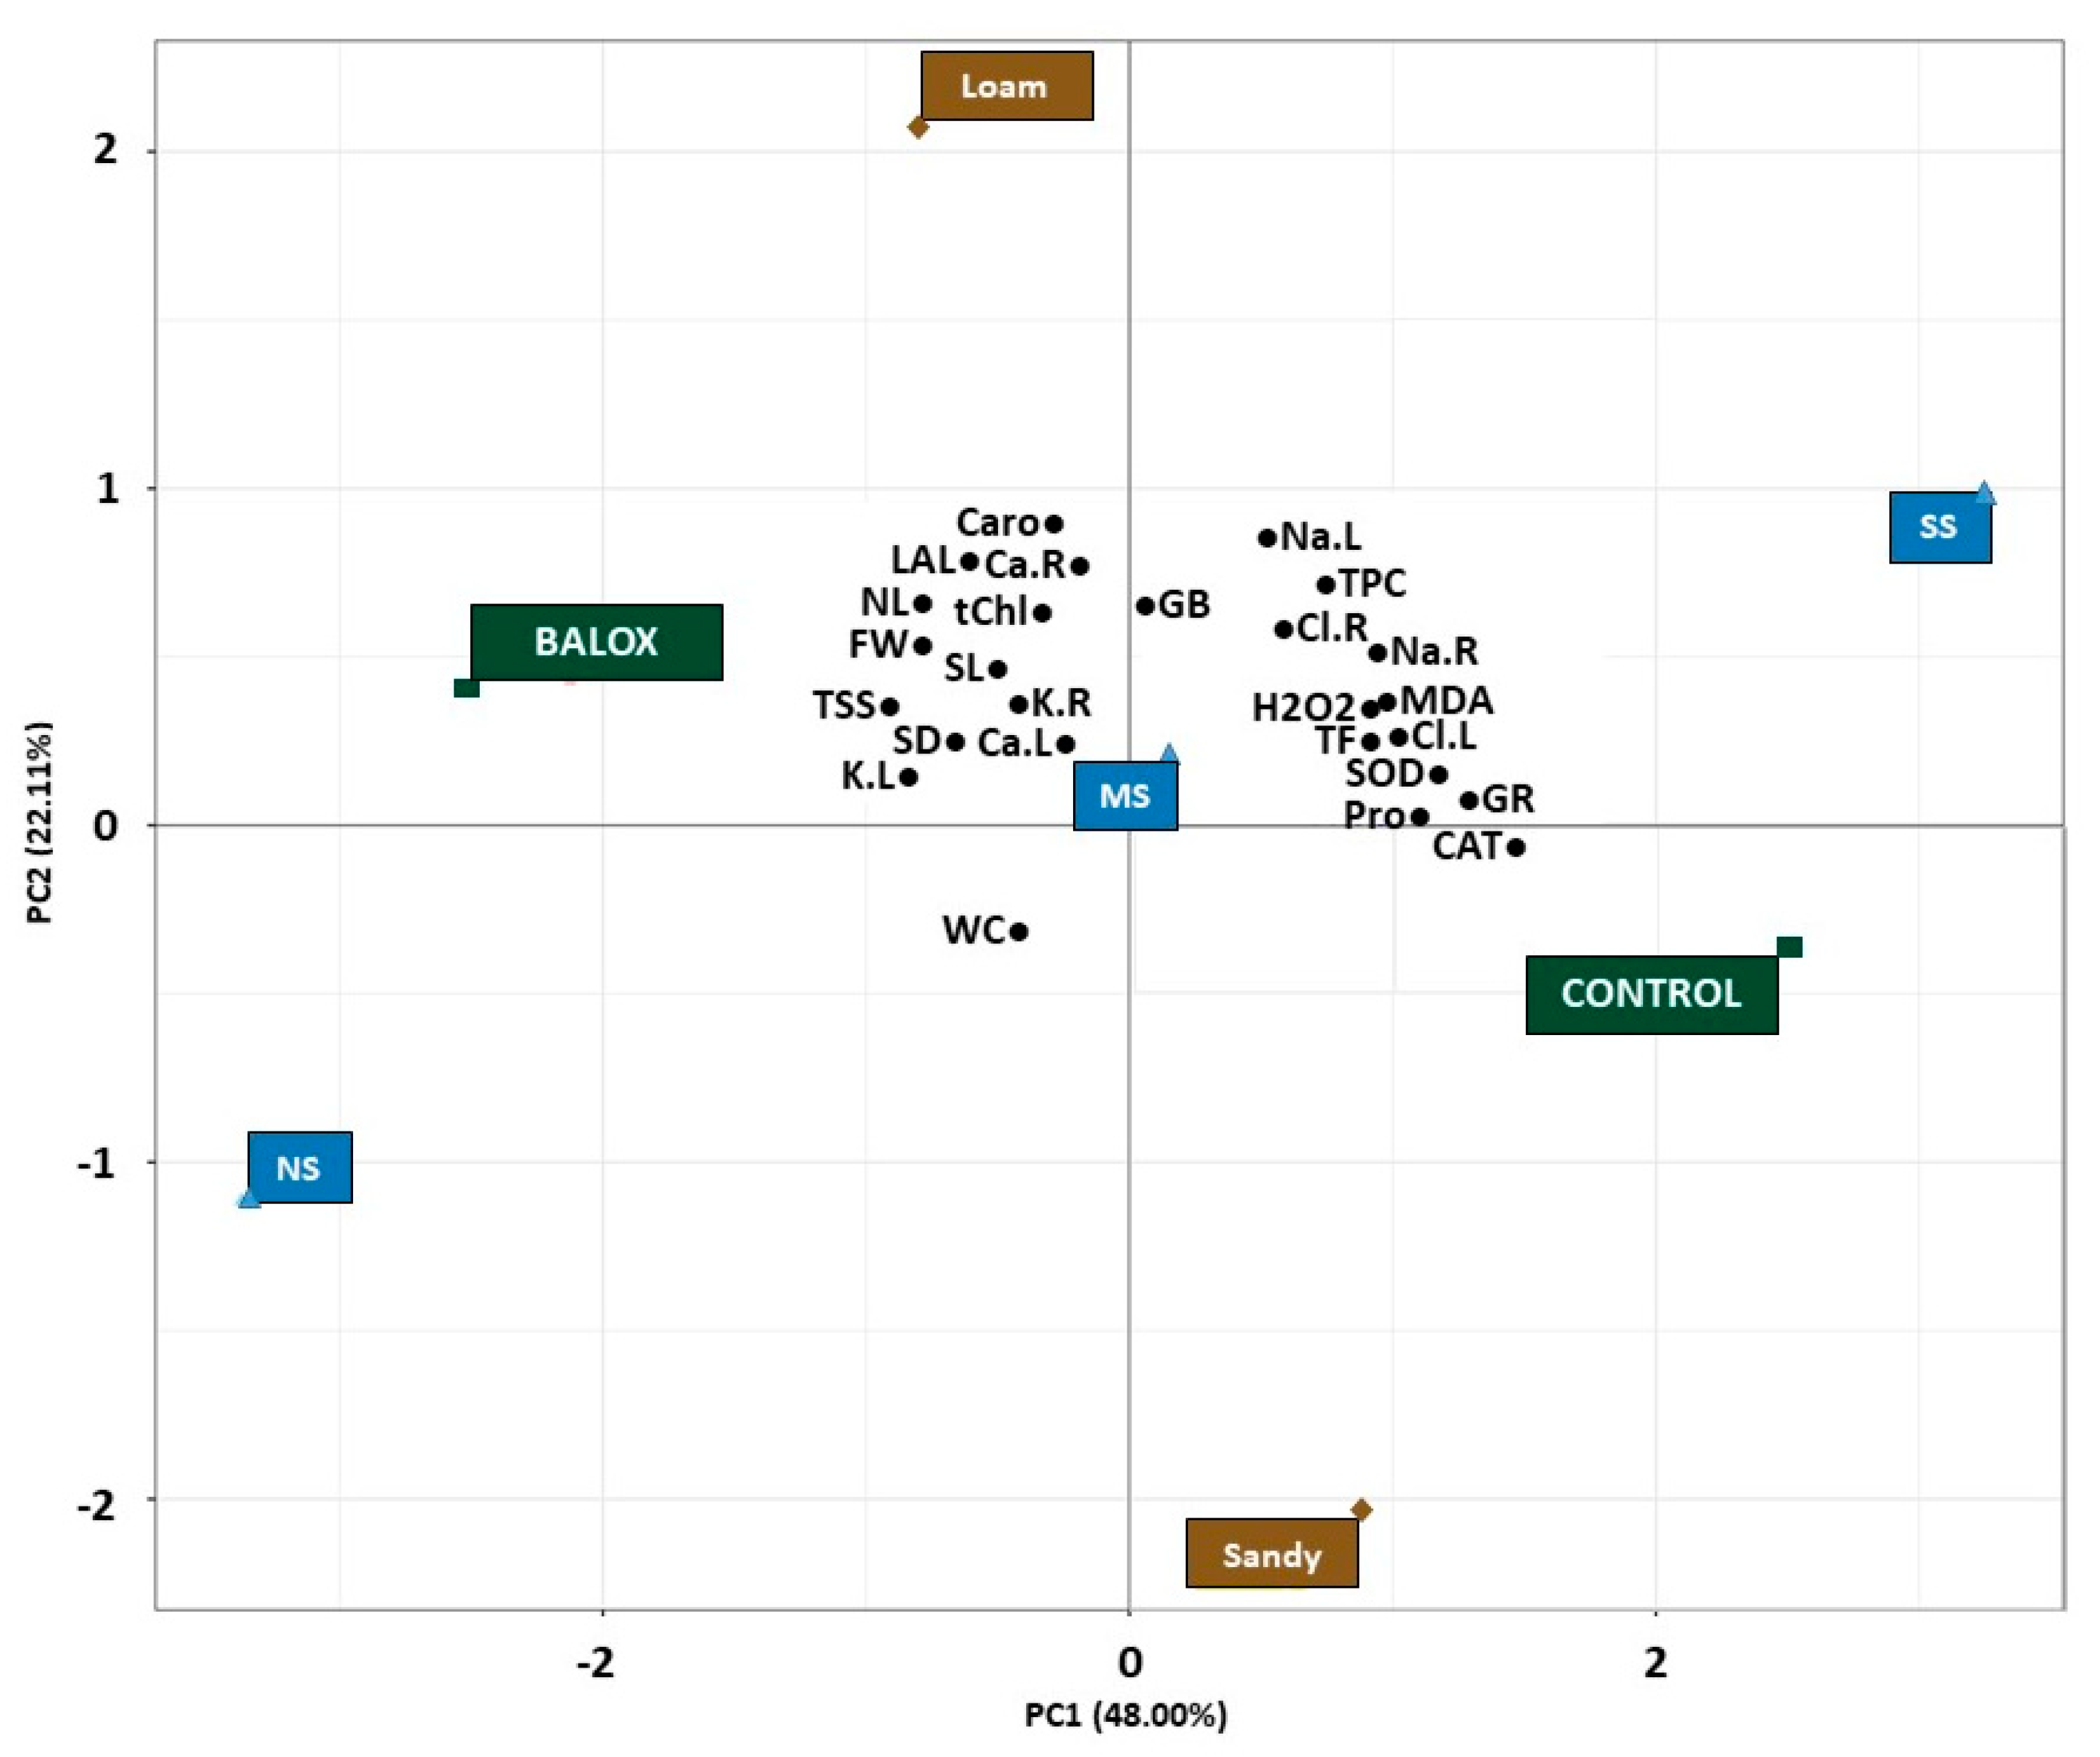
3.7. Principal Component Analyses
Principal Component Analysis (PCA) was finally performed to provide a comprehensive summary of the observed results and to draw more precise conclusions about the effects of the biostimulant on tomato plants under increasing salinity conditions in two different soil textures.
The first two principal components (PCs) of the PCA were observed to explain a large proportion, i.e., 70.11%, of the variability in the data set (
Figure 8). The first principal component (PC1), accounting for 48.00% of the total variation, revealed a noticeable separation of the effects of the two treatments evaluated (Control and BALOX
®), as well as of the three salinity levels (non-saline, NS), moderately saline, MS), strongly saline, SS) of the two soil textures (loam and sandy) and allowed distinguishing their relative impact on the 26 growth and biochemical parameters analysed.
The analysis revealed that the barycentres of the three salinity levels (
Figure 8) were aligned along a right-skewed diagonal, with the lowest salinity level (NS) on the negative side of the X-axis, the moderate salinity level (MS) on the central axis and the highest salinity level (SS) on the positive side.
Likewise, the barycentre of the control and the highest salt stress level (strongly saline: SS) were located on the positive side of the X-axis, revealing a positive correlation with PC1. In contrast, the barycentre of BALOX® and the lowest salinity concentration level (non-saline: NS) were located on the negative side of the X-axis, indicating a negative correlation with PC1.
This arrangement provides evidence that the first major component primarily reflects the effects of soil salinity and is related to the control treatment, indicating a substantial increase of Na+ and Cl− ions in both roots (Na.R, Cl.R) and leaves (Na.L, Cl.L) of tomato plants under higher salinities (SS). Similarly, proline (Pro), flavonoids (TF) and phenols (TPC) barycentres were also located on the positive side of PC1, as they are crucial osmoregulatory compounds that accumulate in response to salt stress. In addition, the barycentres of MDA and H2O2, which serve as markers of oxidative stress, were also found on the positive side of the x-axis, indicating that higher salinity levels induced higher oxidative stress in tomato plants; the barycentre of the sandy-textured soil was also located on this component, although it was slightly distanced from the parameters.
Conversely, the negative side of the x-axis was associated with parameters that showed an inverse correlation with salinity, such as growth parameters (e.g., plant fresh weight (FW), water content % of plant (WC), stem length (SL), number of leaves (NL), leaf area of the longest leaf (LAL), stem diameter (SD), number of leaves (NL), leaf area of the longest leaf (LAL)), as well as pigment content (total chlorophyll (tChl) and total carotenoids (Caro)), total sugar content (TSS) and ion content such as K+ and Ca2+ in both roots (K.R, Ca.R) and in leaves (K.L, Ca.L), where the biostimulant (BALOX®) was also placed.
Interestingly, the barycentre of glycine betaine (GB), one of the main osmolytes measured in this study, was positioned at the central axis, indicating that its contribution was more prominent under moderate stress conditions and less significant under high NaCl levels. Furthermore, the second principal component (represented by 22.11% of total variation) explains the effects of the biostimulant treatment. This observation suggests that the application of BALOX® had a stimulating effect on plant growth, the active transport of nutrients such as K+ and Ca2+, and photosynthetic efficiency; furthermore, it allowed greater protection at the biochemical level even under high salinity conditions.
4. Discussion
The main cytotoxic ions in soils affecting various crops, especially vegetables, are Na
+, Cl
– and SO
42– [
43]. Tomato is known to be moderately susceptible to salinity stress; however, from 2.5 dS m
−1 EC of saturated soil extract or 1.7 dS m
−1 in irrigation water, its yield is significantly affected and may decrease by 9–11% for each unit increase in EC of irrigation water [
10]. The effect of salts on the roots can slow down or even stop the growth of tomato plants depending on their concentration, even altering the morphology of the plants [
44]. Also, in this study, in the absence of the biostimulant, a reduction in the number of roots that can explore the soil, limitation of plant height, reduction of leaf area and number of leaves were observed in parallel to the increase in soil salinity as previously reported [
45]. Likewise, salinity can cause chlorosis, necrosis and alteration of stomatal density, affecting flowering and fruit production [
46]. Some authors have indicated that a further important factor that affects salt deposition at the root zone and, therefore, plant salt uptake, is soil texture [
12].
The present trials were conducted on two types of texture (loam and sandy) regarding their physical and chemical conditions. The sandy-textured soils have good drainage for water and a high aeration capacity; however, as they have a low content of colloidal particles, they cannot provide nutrients for the plants as they have low organic matter content. In contrast, loam soils with a certain amount of colloidal particles have good fertility and a higher amount of micropores, which retain more water content [
3]. In general, plants in sandy soil showed a more limited growth, resulting in a lower FW and lower photosynthetic pigments concentration than in loamy soil. However, in both textures, the effect of salinity on
S. lycopersicum was similar and deleterious in the absence of BALOX
®, as salinity caused significant alterations in growth and biochemical traits of plants in parallel with NaCl concentration, as also reported in other studies [
47].
BALOX
® significantly stimulated the growth of tomato plants in both types of soil and even in strongly saline conditions, protecting and stimulating the root system in all experimental conditions, which can be considered a mechanism of salt tolerance [
48]. Also, interestingly, the best response at the root level with the use of the biostimulant was observed in plants grown in sandy-textured soils, which was reflected in greater hydration of the plant. These soils facilitate crop growth because their root systems can move freely in search of moisture and nutrients in optimal natural environments that are desirable, difficult to locate, but feasible to obtain. They are soils of low physical and chemical fertility [
49] but with efficient management. In the case of tomato cultivation, sandy loam textured soils are suitable for deep root and overall plant development [
50]. It was also observed that the type of texture did not negatively influence the performance of the biostimulant on the plants. On the contrary, the effect of BALOX
® on the plants in both textures was similar, increasing the content of chlorophylls and carotenoids in addition to the fresh weight.
Salt stress, by limiting plant growth and development, affects several physiological and biochemical mechanisms, such as inhibition of photosynthesis, modulation of ion content hindering ionic homeostasis, biosynthesis of osmoprotectants and activation of antioxidant systems [
51,
52,
53] as found in the present experimental conditions in plants in the absence of the biostimulant. Interestingly, even under high salinity conditions, plants treated with BALOX
® significantly reduced Na
+ and Cl
− concentrations in both roots and leaves, facilitating the active transport of K
+ and Ca
2+ from the roots to the aerial part. On the one hand, the concentration of Na
+ and Cl
−, in general, was lower in plants grown on sandy soil, probably due to the textural condition (larger macropores), which would allow less retention of these ions and would facilitate their washing by the use of the biostimulant. According to Brady et al. [
49], sandy textured soils generate special physical and chemical conditions: a large number of macropores, high permeability, low adhesiveness and plasticity, and low moisture retention capacity so that they are saturated with little water and little or no chemical activity; on the other hand, they require a greater supply of nutrients than loam soils. However, the biostimulant BALOX
®, obtained from plant extracts and containing bioactive components such as polyphenols and glycine betaine, favoured plant growth and development in this type of soil.
On the other hand, in loam-textured soil, the concentration of K
+ and Ca
2+ was higher than that found in plants installed in sandy soil using the biostimulant, possibly also due to the contribution of the soil’s fertility. According to Topp et al. [
54], loamy soils containing fine, coarse and medium particles encompass the individual properties of each of them, generating an optimal physical system for crop development, allowing good root oxygenation, cohesion, adequate moisture and accumulation of nutrients that confer good physical and chemical fertility.
Salinity exerts osmotic, ionic and oxidative stresses on plants [
55]. The main physiological process that plants utilise to deal with osmotic stress is osmotic balance regulation, accomplished by the accumulation of different solutes, including carbohydrates, betaine, glycine, and amino acids, particularly proline [
56]. These compatible solutes, or osmolytes, preserve the structure and function of cells by promoting the absorption and retention of water [
57], and inducing tolerance against osmotic stress [
58,
59]. In the present study, foliar Pro levels increased significantly in parallel to the concentration of NaCl in the absence of the biostimulant. Proline is one of the most common osmolytes in plants, but in tomatoes, it is also an indicator of the level of stress experienced by plants [
60]. On the other hand, TSS levels were reduced under salt stress, while GB levels followed the same pattern as Pro. However, plants treated with BALOX
® significantly reduced Pro concentration even under strong salinity and increased TSS levels in all experimental conditions. This is noteworthy since there are reports indicating that a higher amount of sugars could account for a higher tolerance to salinity in tomato [
61]. Glycine betaine concentrations followed the same pattern as Pro in relation to salinity. However, a significant increase in GB concentrations was observed with respect to untreated plants, probably due to the composition of the biostimulant, which includes polyphenols and glycine betaine. Glycine betaine is involved in several protective functions in plants under abiotic stress, such as maintaining osmotic balance and membrane stability, protecting protein structure and reducing ROS under stress conditions [
62].
Salinity stress also induced the production of reactive oxygen species (ROS), which was reflected in a significant increase in the levels of oxidative stress indicators such as MDA and H
2O
2 in untreated plants [
63]. Severe and prolonged exposure to this type of stress can cause physiological alterations in metabolic processes. To mitigate the deleterious effects of oxidative damage, plants have developed complex defence mechanisms by establishing an effective ROS scavenging system involving a series of enzymatic antioxidants, such as some of the enzymes evaluated in the present research (superoxide dismutase, catalase, glutathione reductase), and non-enzymatic antioxidants, including, carotenoids, ascorbate, phenolic compounds and especially flavonoids [
64,
65]. In the present investigation, the elevated salinity levels in the SS conditions have increased not only the activity of antioxidant enzymes but also the concentration of metabolites, such as total phenolic compounds and flavonoids, indicating that in this case, enzymes were insufficient to overcome the cellular redox imbalance in untreated plants, as these non-enzymatic antioxidant compounds are also known as the “second line of defence” against stress [
42]. However, BALOX
®-treated plants, even in strongly saline conditions, did not compromise their energy in stress attenuation but in their development, as evidenced by low levels of Pro, MDA, H
2O
2 and enzymatic activity, as reported in other studies conducted with this biostimulant [
66]. The application of biostimulants based on plant protein hydrolysates shows effects analogous to auxin, cytokinin and gibberellin-type phytohormones. They act at the oxidative level by enhancing the synthesis of photosynthetic pigments and secondary metabolites, and activating antioxidant enzymes [
67]. Likewise, other authors obtained similar results using a biostimulant to counteract salt stress in tomato [
68]. Our findings suggest that root system stimulation, regulation of toxic ion uptake, photosynthetic efficiency and anti-oxidative defence systems are key factors modulating biostimulant responses to salinity tolerance in tomato plants irrespective of soil texture type.
5. Conclusions
The salinity levels present in the soils were sufficient to cause significant alterations in the growth of tomato plants, reducing their root system and fresh weight. Although Na+ and Cl− concentrations in roots and leaves were lower in sandy soils than in loamy soils, they increased significantly under high salinity conditions compared to non-saline conditions in both soil types. Salt stress induced ionic, osmotic and oxidative stress on the plants in the absence of the biostimulant in parallel to the increase in NaCl, independent of the type of soil texture in which they were grown.
The levels of Pro reached their maximum in strongly saline conditions, and the high concentration of biochemical markers of stress, MDA and H2O2, revealed significant oxidative stress, which activated the enzymatic and non-enzymatic antioxidant mechanisms in tomato plants, especially in those grown under the highest salt concentration.
The use of BALOX® generally reduced stress levels in plants even under strongly saline conditions, stimulating plant growth and improving biochemical responses. In this way, the plants did not devote their energy to attenuating stress but to development, as shown by low Pro levels and oxidative markers. It was also observed that the type of texture did not negatively influence the behaviour of the biostimulant on the plants, the effect of BALOX® being similar for both textures. However, at the root level, the biostimulant seemed to have a greater effect on sandy soils and improved plant hydration, which would be one of the defence mechanisms against salt stress.


 ,
, 


