Article

Proton Nuclear Magnetic Resonance (1H NMR) Metabolic Profiles Discriminate Two Monovarietal Extra Virgin Olive Oils, Cultivars Arbequina and Koroneiki, with Different Geographical Origin

by
Federica Angilè
1,
Laura Del Coco
1,
Chiara Roberta Girelli
1,
Francesca Calò
1,
Lucia Mazzi
2,
Francesco Paolo Fanizzi
1,*,
Gaetano Alessandro Vivaldi
3 and
Salvatore Camposeo
3,*
1
Department of Biological and Environmental Sciences and Technologies, University of Salento, Prov.le Lecce-Monteroni, 73100 Lecce, Italy
2
Certified Origins Italia Srl, Località Il Madonnino, 58100 Grosseto, Italy
3
Department of Soil, Plant and Food Sciences, University of Bari Aldo Moro, 70125 Bari, Italy
*
Authors to whom correspondence should be addressed.
Horticulturae 2023, 9(1), 66; https://doi.org/10.3390/horticulturae9010066
Submission received: 15 December 2022 / Revised: 23 December 2022 / Accepted: 31 December 2022 / Published: 5 January 2023
(This article belongs to the Section Fruit Production Systems)

Abstract

:
This study aims to evaluate the Proton Nuclear Magnetic Resonance (1H-NMR)-based metabolomic profiles of monovarietal olive oils obtained from Arbequina and Koroneiki, which are typically present in the Mediterranean basin and grown in Spain and Greece, respectively. Micro-milled oils were obtained from olives harvested both in their cultivar home countries (Spain and Greece) and in Italy. Investigations by 1H NMR metabolic profiling were carried out to develop a strategy for the correct interpretation of differences based on geographical origins. The NMR Spectroscopy and multivariate statistical analysis (MVA) revealed significant differences in fatty acids profile as well as the unsaponifiable fraction, not only according to the cultivars but also to the specific geographical origin of the olives used. In particular, the oils from Spain were higher in polyunsaturated fatty acids (PUFAs) content than those from Italy. Conversely, the Italian oils of Koroneiki showed higher content of monounsaturated fatty acids (MUFAs) than Greek oils. Regarding the Extra Virgin Olive Oils (EVOOs) minor fraction, for both cultivars, the olive oils obtained using olives harvested in Italy were characterized by higher relative content of phenolic compounds. It was found that each of the investigated cultivars (Arbequina and Koroneiki), very popular in super high density (SHD) planting systems, assumed a specific well-characterized metabolic EVOO profile when the olives are harvested in Italy. These results may contribute to extending and enforcing available literature data on 1H NMR-based chemometric models as powerful tools for EVOOs geographical origin discrimination.

1. Introduction

Extra Virgin Olive Oils (EVOOs) have a great impact on the agrifood sector, being dominant in the Mediterranean diet and culture [1]. Olive oil consumption is increasing, due to its nutraceutical effects on human health as well as its sensory characteristics [2]. To satisfy the increment in olive oil demand, traditional olive orchards, characterized by low tree density, often non-irrigated, with low yield [3], were gradually replacedby new irrigated planting systems, mainly in the form of super high density (SHD) plantings [4,5,6]. These new orchards give olive growing, on theone hand, good economic sustainability [7] and, on the other, high environmental sustainability, in terms of both carbon and water footprints [8,9]. In the last two decades, the spread of SHD olive groves has increased in traditional olive oil-producing areas, such as Italy, Spain, Greece, and Tunisia, as well as all over the world, reaching over 400,000 ha [2,10]. New olive growing models exclude most of the ancient cultivated olive varieties, which are not suitable for SHD due to their excessive vigor, late bearing, and susceptibility to the impact of machine beaters [11,12]. Among the genotypes exploitable for SHD, Arbequina, Koroneiki and Arbosana are the best-known and most used cultivars, together with new patented varieties [6,13]. These cultivars are characterized by low and medium-low vigor, early bearingand high constant yield [14,15]. These Spanish and Greek cultivars confirmed their vegetative and productive characteristics fit for SHD orchards when grown in Italy [11,16] where they also showed good oil quality [17]. “It is reasonable to suppose that in Italy, as in other olive-growing countries, two types of olive cultivation could co-exist: one which is historically linked to typical olive oil production and landscape conservation as well as to the rich heritage of genetic resources and traditional products, and one which is based on growing systems which can cut production costs and compete on the international extra virgin olive oil market” [17]. However, the preservation of traditional olive groves as an element of national identity in ancient olive growing areas, as in Italy, could lead to some limitations in the spread of new orchards due mainly to the introduction of foreign olive cultivars [18]. Therefore, the geographical origin and traceability of EVOOs havebecome crucial questions.
Geographical characteristics, pedoclimate conditions, agricultural practices and milling extraction have a marked influence on EVOO chemical composition, such that they may even differ among oils produced from olives of the same cultivar but grown in different geographical regions [19]. The cultivated genotype is an influencing factor, but geographical location, including latitude, longitude, and altitude, normally overcomes the varietal effect [20]. Beltràn et al. [21] showed that olive oil samples could be correctly classified according to their geographical origins. After fraud or the non compliance of fats and oils, the third most reported type of food falsification in 2021, especially with EVOOs, is falsified traceability not allowing consumers to identify the origin [22]. On this basis, in order to ensure EVOO traceability, the European Union (EU) launched a mandatory origin designation regime, according to which, for instance, an EVOO is labeled “Made in Italy” if the oil is obtained from olives harvested and milled in Italy, regardless of the origin of the cultivated variety [23].
Many studies showed the importance of significant molecules, such as oleic acid and saturated fatty acids, for the discrimination of olive oils by geographical origin [24,25]. It has also been demonstrated that linoleic acid, saturated fatty acids, and the unsaponifiable fraction (aldehydes and sterols), including bioactive compounds such as phenolic fraction, were mainly dependent on the geographical origin of the olive oil [24,26].
Several official analytical methods for the assessment of the quality and purity of olive oil are currently available. However, despite compulsory labeling indicating EVOO geographical origin being established over a decade ago [27], the latter still lacks an official assessment methodology [28]. Nuclear Magnetic Resonance (NMR)-based chemometric techniques have been widely used and proposed for cultivar and/or geographical origin characterization of EVOOs [28]. As already reported in the literature, the NMR Spectroscopy technique is a promising tool in food screening and authentication, in addition tothe classification of cultivar and/or geographical origin [29]. Moreover, the NMR methodology rapidly allows molecular characterization of mixtures and gives important information about specific markers investigation (targeted) or metabolite patterns (untargeted) analysis in metabolomic studies. In particular, for olive oils, both a selection of NMR signals [30] and the entire spectrum bucketing process have been considered in several studies for cultivar and/or geographical origin classification purposes. However, very little data are available when considering the effect of geographical origin on EVOO production from selected cultivars, especially for those coming from new SHD planting systems. These also include 1H NMR chemometric models obtained using a metabolomic approach for EVOO traceability.
In this study, 1H NMR spectra of both the main and the minor components (i.e., saponifiable and unsaponifiable fractions) were studied for monovarietal EVOOs samples of two widely spread cultivars, Arbequina and Koroneiki, grown in SHD olive orchards in order to evaluate their possible geographical-based grouping.

2. Materials and Methods

2.1. Olive Sampling and Oil Extraction

The olives of cultivars Arbequina and Koroneiki from Italy were collected in 2019 at the experimental SHD orchard located near Bari (Apulia Region; 41°01′ N; 16°45′ W; 110 m a.s.l.). The olive samples of cv. Arbequina from Spain (Siurana PDO region) and of cv. Koroneiki from Greece (Mylopotamos PDO region) were supplied in 2019 [31] by Certified Origins Italia srl within a joint PhD project [32]. Each sample, in three replicates, included about 1000 g of fruits hand-made harvested at the same ripening stage (IP = 2–3) [33]. The oils were obtained from olive samples by using the same laboratory-scale milling extraction method [34]. A total of 61 samples of EVOOs were lab-produced using the supplied olives (22 from Spain, 20 from Greece, and 19 from Italy). All the extractions were conducted within 24 h to reduce any decomposition due to thermal effects. Briefly, for each sample, about 50 olives randomly chosen were processed with fast-freezing by liquid nitrogen and ground to obtain a paste with a stainless-steel blender. Then, water was added and samples were stored at 4 °C overnight. Finally, the paste was centrifuged, obtaining about 2–4 mL of oil, which was collected from the upper phase and stored in amber vials until NMR analysis. Compliance with the standard limits in the parameters relating to the characteristics of extra virgin olive oil was assessed on olive oil samples [32].

2.2. 1H NMR Spectroscopy Analysis

For NMR analysis, olive oil (~140 mg) was dissolved in deuterated chloroform (CDCl3) containing tetramethylsilane (TMS) as an internal standard, in the ratio of oil:CDCL3 of 13.5:86.5 w/w (standard Bruker methodology), and vortexed for 15 s. From the obtained mixture, a volume of 600 μL was transferred into a 5 mm NMR tube. The 1H NMR spectra were acquired on a Bruker Avance III spectrometer operating at 400.13 MHz, T 300.0 K, equipped with a BBI 5 mm inverse detection probe incorporating a z-axis gradient coil. NMR acquisitions were performed under full automation for the entire process after loading each sample on a Bruker Automatic Samples Changer interfaced with IconNMR (Bruker) software. Automated tuning and matching, locking and shimming, and calibration of the 90° hard pulse P(90°) were performed for individual samples using standard Bruker routines ATMA, LOCK, TOPSHIM, and PLSECAL in order to optimize NMR conditions. The 1H NMR spectra were recorded with the following acquisition parameters: zg Bruker pulse program, 64 k time domain (TD), spectral width (SW) of 20.5524 ppm, a receiver gain (RG) of 4 and 16 repetitions. Moreover, to enhance signals of the minor components, a Bruker multi-suppressed 1H noesygpps NMR (noesygpps1d.comp2 pulse program) experiments was performed, using the following conditions: 32 k time domain, spectral amplitude 20.5555 (8223.685 Hz), p1 12.63 µs, pl1 −1.00 dB, 32 repetitions. All 1H spectra were obtained by the Fourier Transformation (FT) of the Free Induction Decay (FID), applying an exponential multiplication with a line broadening factor of 0.3 Hz, automatically phased, and baseline corrected. Chemical shifts were reported with respect to TMS signals set as 0.0 ppm, obtaining peak alignment. The olive oil profile and phenolic molecules assignments were performed based on 1D NMR spectral analysis and by comparison with published data [35].

2.3. Multivariate Statistical Analysis

The NMR spectra were processed using Topspin 2.1 and Amix 3.3.14 (Bruker, Biospin, Italy), checked by visual inspection, and subjected to the bucketing process for statistical analyses. Two different bucket tables were obtained, with a rectangular bucketing of 0.04 width, in the range 10.0–0.5 ppm (BUCKET-1, 1H zg) and 10.0–5.6 ppm (BUCKET-2, 1H noesygpps), respectively, excluding the residual solvent (chloroform) signals (7.6–6.9 ppm) for both. Normalization to total intensity was performed to reduce differences due to sample concentration and/or experimental conditions between samples. In particular, the input data matrix is made by the NMR descriptors (the buckets), labeled with the central chemical shift value for its specific 0.04 ppm width. Pareto-scaling scaled of the data matrix was performed, obtained by dividing the mean-centered bucket values by the square root of the standard deviation [36,37]. Both the bucket tables, obtained by alignment (using TMS for calibration at 0.00 ppm) and successive bucket row reduction of the spectra, are submitted to multivariate statistical analysis (MVA), by using Simca-14 software (Sartorius Stedim Biotech, Umeå, Sweden). In particular, unsupervised (Principal Component Analysis, PCA) and supervised (Orthogonal Projection to Latent Structures-Discriminant Analysis, OPLS-DA) analyses were used. Typically, PCA was applied to study a set of samples described by a large number of variables (the NMR-bucketed signals), while the OPLS-DA provides comprehensive class discrimination (at least two or eventually more) and more robust identification of important features [38]. For all statistical models, the reliability is evaluated. First of all, Hotelling’s T2 diagnostic is used to detect outliers, described by the ellipse (95% confidence interval) in each score plot. Moreover, model performance parameters are also evaluated, as the explained variation R2X and the fraction of predicted variation (Q2) for each component, while R2X (cum) and Q2(cum) values indicate the increased values when more components are added to the statistical model [39]. R2 measures the goodness of fit while Q2 measures the predictive ability of the model. While PCA represents the method of appraising discrimination ability, in pairwise OPLS-DA, these parameters provide a discriminating ability. A large discrepancy between R2 and Q2 indicates an overfitting of the model, generally due to the use of too many components. The 7-fold leave-out procedure is used for cross-validation and to evaluate model performance and Q2 measurements. In particular, for both PCA and OPLS-DA, the default SIMCA-14 cross-validation procedure has been used, in which the dataset is split into sevendifferent subsets. Moreover, the corresponding loading and/or S-plot is analyzed, describing the importance of loadings for each PCA and/or OPLS-DA score plot, also indicating how much a variable can contribute to a particular principal component in a PCA (or predictive/orthogonal component in the OPLS-DA) analysis. In detail, loadings are colored according to the strength of correlation (p(corr)), while high p[1] values, in both the positive and negative directions, have a large impact on the variance between groups [39].

3. Results

3.1. Multivariate Statistical Analysis of Main Components (BUCKET-1) of EVOO

Primarily, an untargeted approach was used on the main component for naively exploring the dataset. A PCA model was obtained, with 52% and 23% variance for the first (t[1]) and the second (t[2]) components, respectively, and a predictive variation of Q2 = 0.851. From the corresponding t[1]/t[2] PCA score plot, a nice separation of samples in three different groups was observed, mainly according to their geographical origins (Figure 1a).
Examining the loadings (Figure 1b), it’s possible to understand the most influentialvariables in the distribution of the samples. The variables linoleic (2.74 ppm) and linolenic acids (2.78 and 5.38 ppm) explained mostly the variance in the first t[1] component. In particular, the Arbequina olive oil obtained from olives harvested in Spain was characterized by a high relative content of polyunsaturated fatty acids (PUFAs), while saturated fatty acids (SFAs; loading 1.26 ppm) were found in Koroneiki olive oil obtained from Greek olives. Conversely, the loading of oleic acid (loadings corresponding to 1H NMR frequencies of 1.30 and 2.02 ppm) had a strong negative value, and should therefore explain mostly the distribution of samples on the second t[2] component, in particular of cv. Koroneiki oils obtained from olives harvested in Italy.
The significant variations found for all samples considered in the unsupervised model (PCA in Figure 1) werealso studied by using supervised pairwise comparisons. Olive oils obtained from Koroneiki and Arbequina cultivars were considered separately, focusing on differences in their geographical origins. Considering only cv. Koroneiki olive oils, collected from Italy and Greece, both for unsupervised (Figure S1) and supervised analyses, a good distribution of samples according to olive provenance was observed.
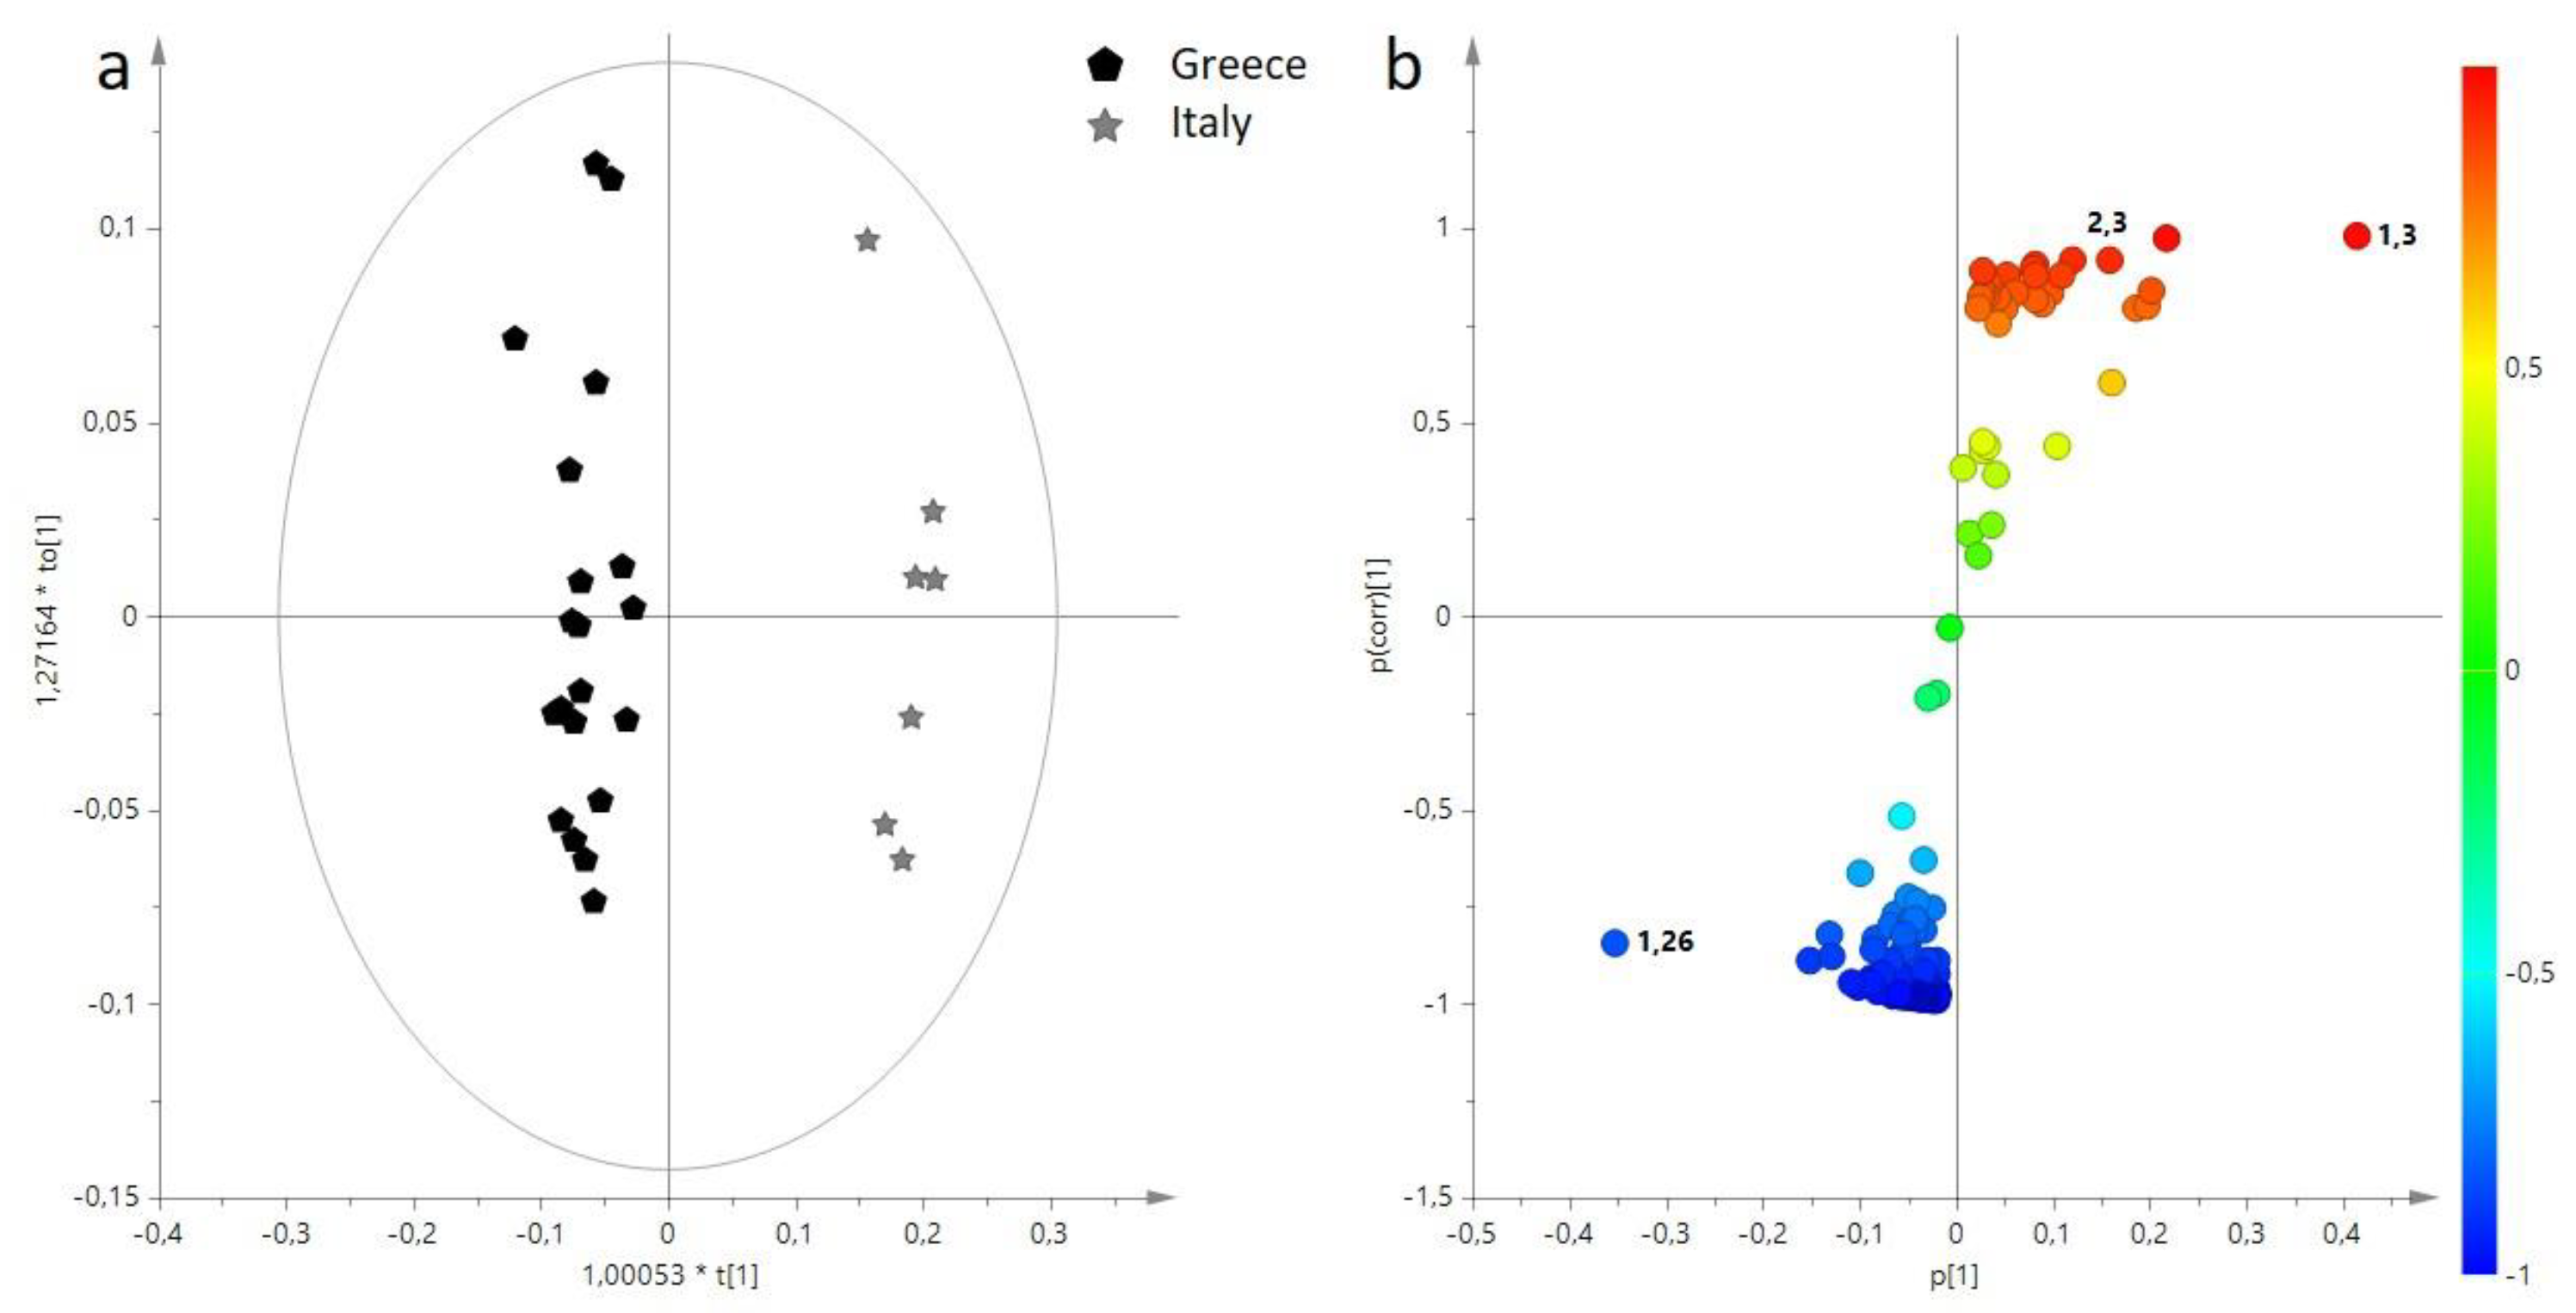
The Koroneiki olive oil samples separation was confirmed by the corresponding OPLS-DA analysis (model built using one predictive and one orthogonal component 1+1, R2X = 0.82, R2Y = 0.97, Q2 = 0.95), in which unambiguous classification for the corresponding class was found, as shown in the t[1]/to[1] score plot (Figure 2a). The S-plot for the model reported the loading importance, colored (from red to blue scale), according to the strength of the correlation (p(corr)) (Figure 2b). In particular, olive oils obtained from Koroneiki Italian samples were characterized by a high relative content of oleic acid, while SFAs were characteristic of the same cv. Koroneiki when cultivated in Greece.
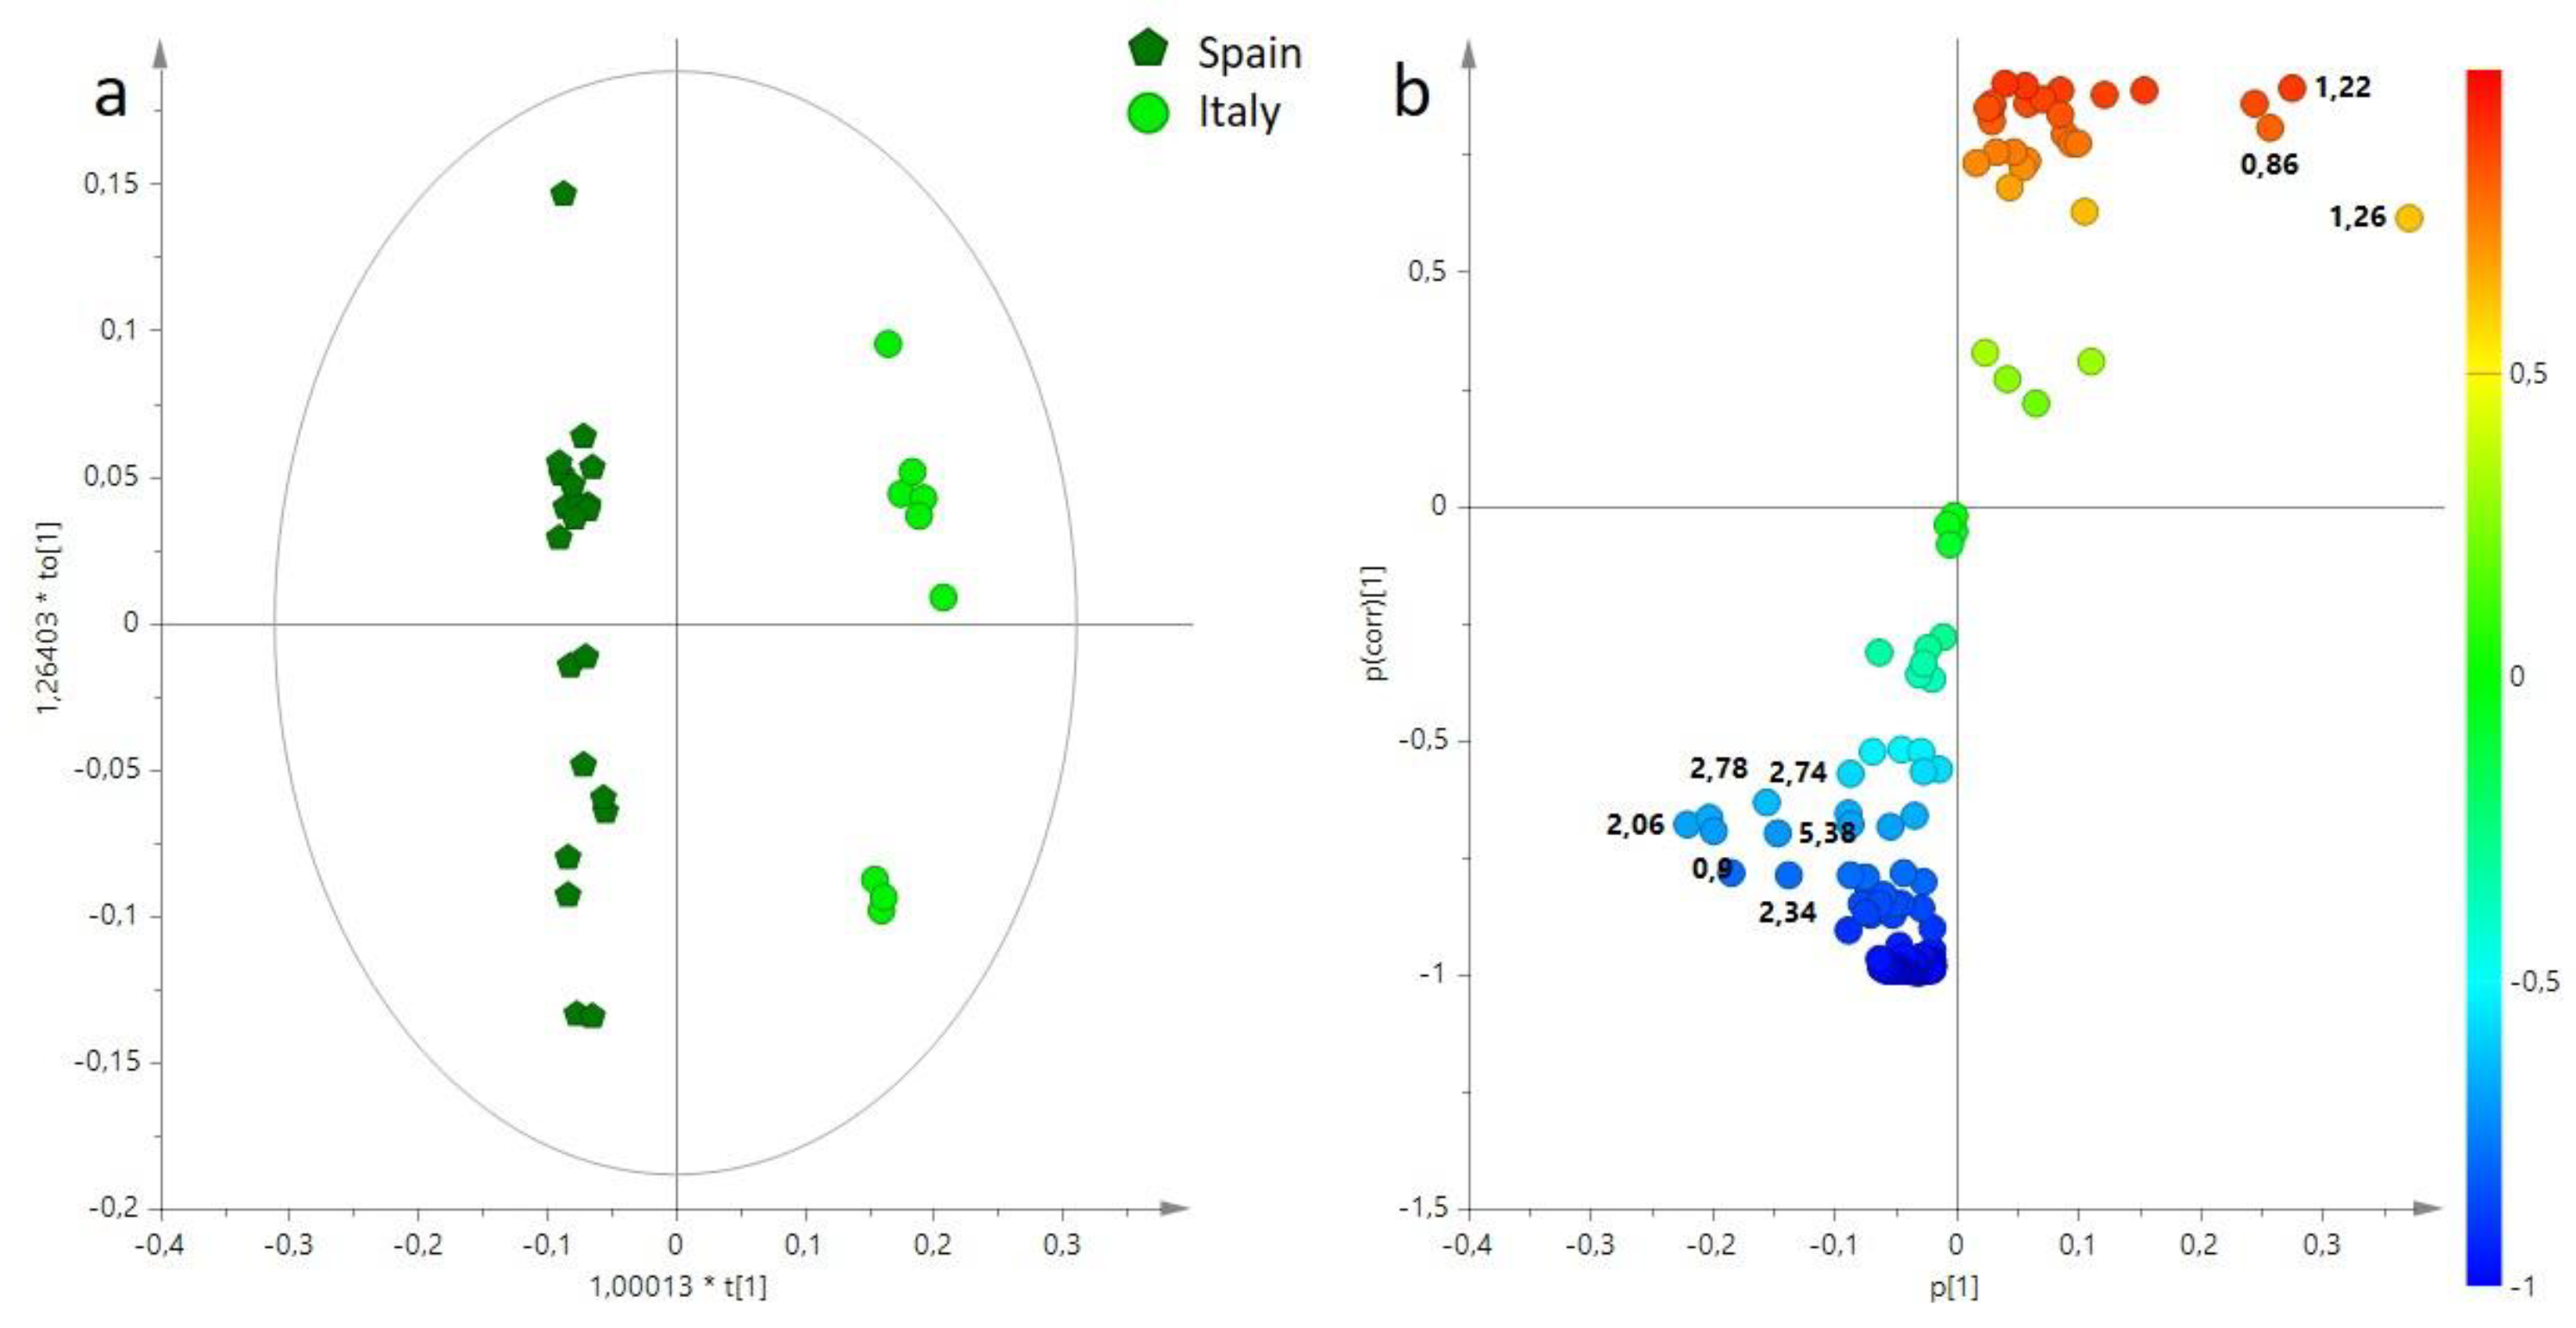
The approach used for Koroneiki olive oils was also applied to theArbequina samples. A preliminary PCA analysis (Figure S2) showed a grouping of oil samples based on the geographical origin of the olive samples. In order to confirm the separation between the two groups, Italy and Spain, and identify the discriminating metabolites, a supervised analysis was then performed. In the OPLS-DA model (built with one predictive and three orthogonal components, 1+3, R2X = 0.89, R2Y = 0.99, Q2 = 0.97), the corresponding t[1]/to[1] score plot (Figure 3a) showed that olive oil samples were grouped along the first predictive component t[1], clearly according to their geographical origin. The study of the corresponding S-plot of the OPLS-DA score plot (Figure 3b) led to the identification of the specific metabolites responsible for the separation of olive oils of Spain and Italy. In detail, a high relative content of SFAs was found in EVOOs obtained from Italy, while olive oils obtained from Spain were characterized by a high relative content of PUFAs, such as linoleic and linolenic fatty acids.

3.2. Multivariate Statistical Analysis of Minor Components (BUCKET-2) of EVOO

MVA was also performed using a selected NMR buckets dataset resulting from multi-suppressed 1H noesygpps spectra (BUCKET-2) to better evaluate the contribution of the unsaponifiable fraction to the olive oils discrimination by multi-suppression of fatty acids signals [38,40,41]. Interestingly, the preliminary PCA applied to the BUCKET-2 dataset revealed a clear difference in the oil samples according to their geographical origins. In particular, the first two components (t[1] and t[2]) explained 48% and 24% of the total variance, respectively, with a predictive variation Q2 = 0.754. The t[1]/t[2] score plot (Figure 4a) showed a degree of separation between the olive oils from Italy and olive oils from Spain and Greece, largely defined by the first principal component (PC) t[1]. Furthermore, the second PC displayed a clear differentiation between the olive oil samples according to the cultivar. In detail, the Arbequina olive oils from Italy and Spain werefound at positive values of the second (t[2]) principal component, while the Koroneiki olive oils from Italy and Greece were found to have negative values of the same t[2] component. The loading plot analysis (Figure 4b) showed that a higher relative content of phenolic compounds was characteristic of olive oil obtained from Koroneiki cultivated in Italy. In particular, phenolic compound discriminants for cv. Koroneiki EVOOs were tyrosol and hydroxytyrosol and their derivatives in the spectral range 6.74 and 6.78 ppm and aldehydes in the spectral range 9.22 and 9.66 ppm. These NMR signals include elenolic acid, oleacein, named 3,4-DHPEA-EDA, and oleocanthal, also known as p-HPEA-EDA [38,40,41].
In addition, the differences between Koroneiki and Arbequina olive oil samples, for the unsaponifiable fraction, possibly related to geographical origin, were separately evaluated.
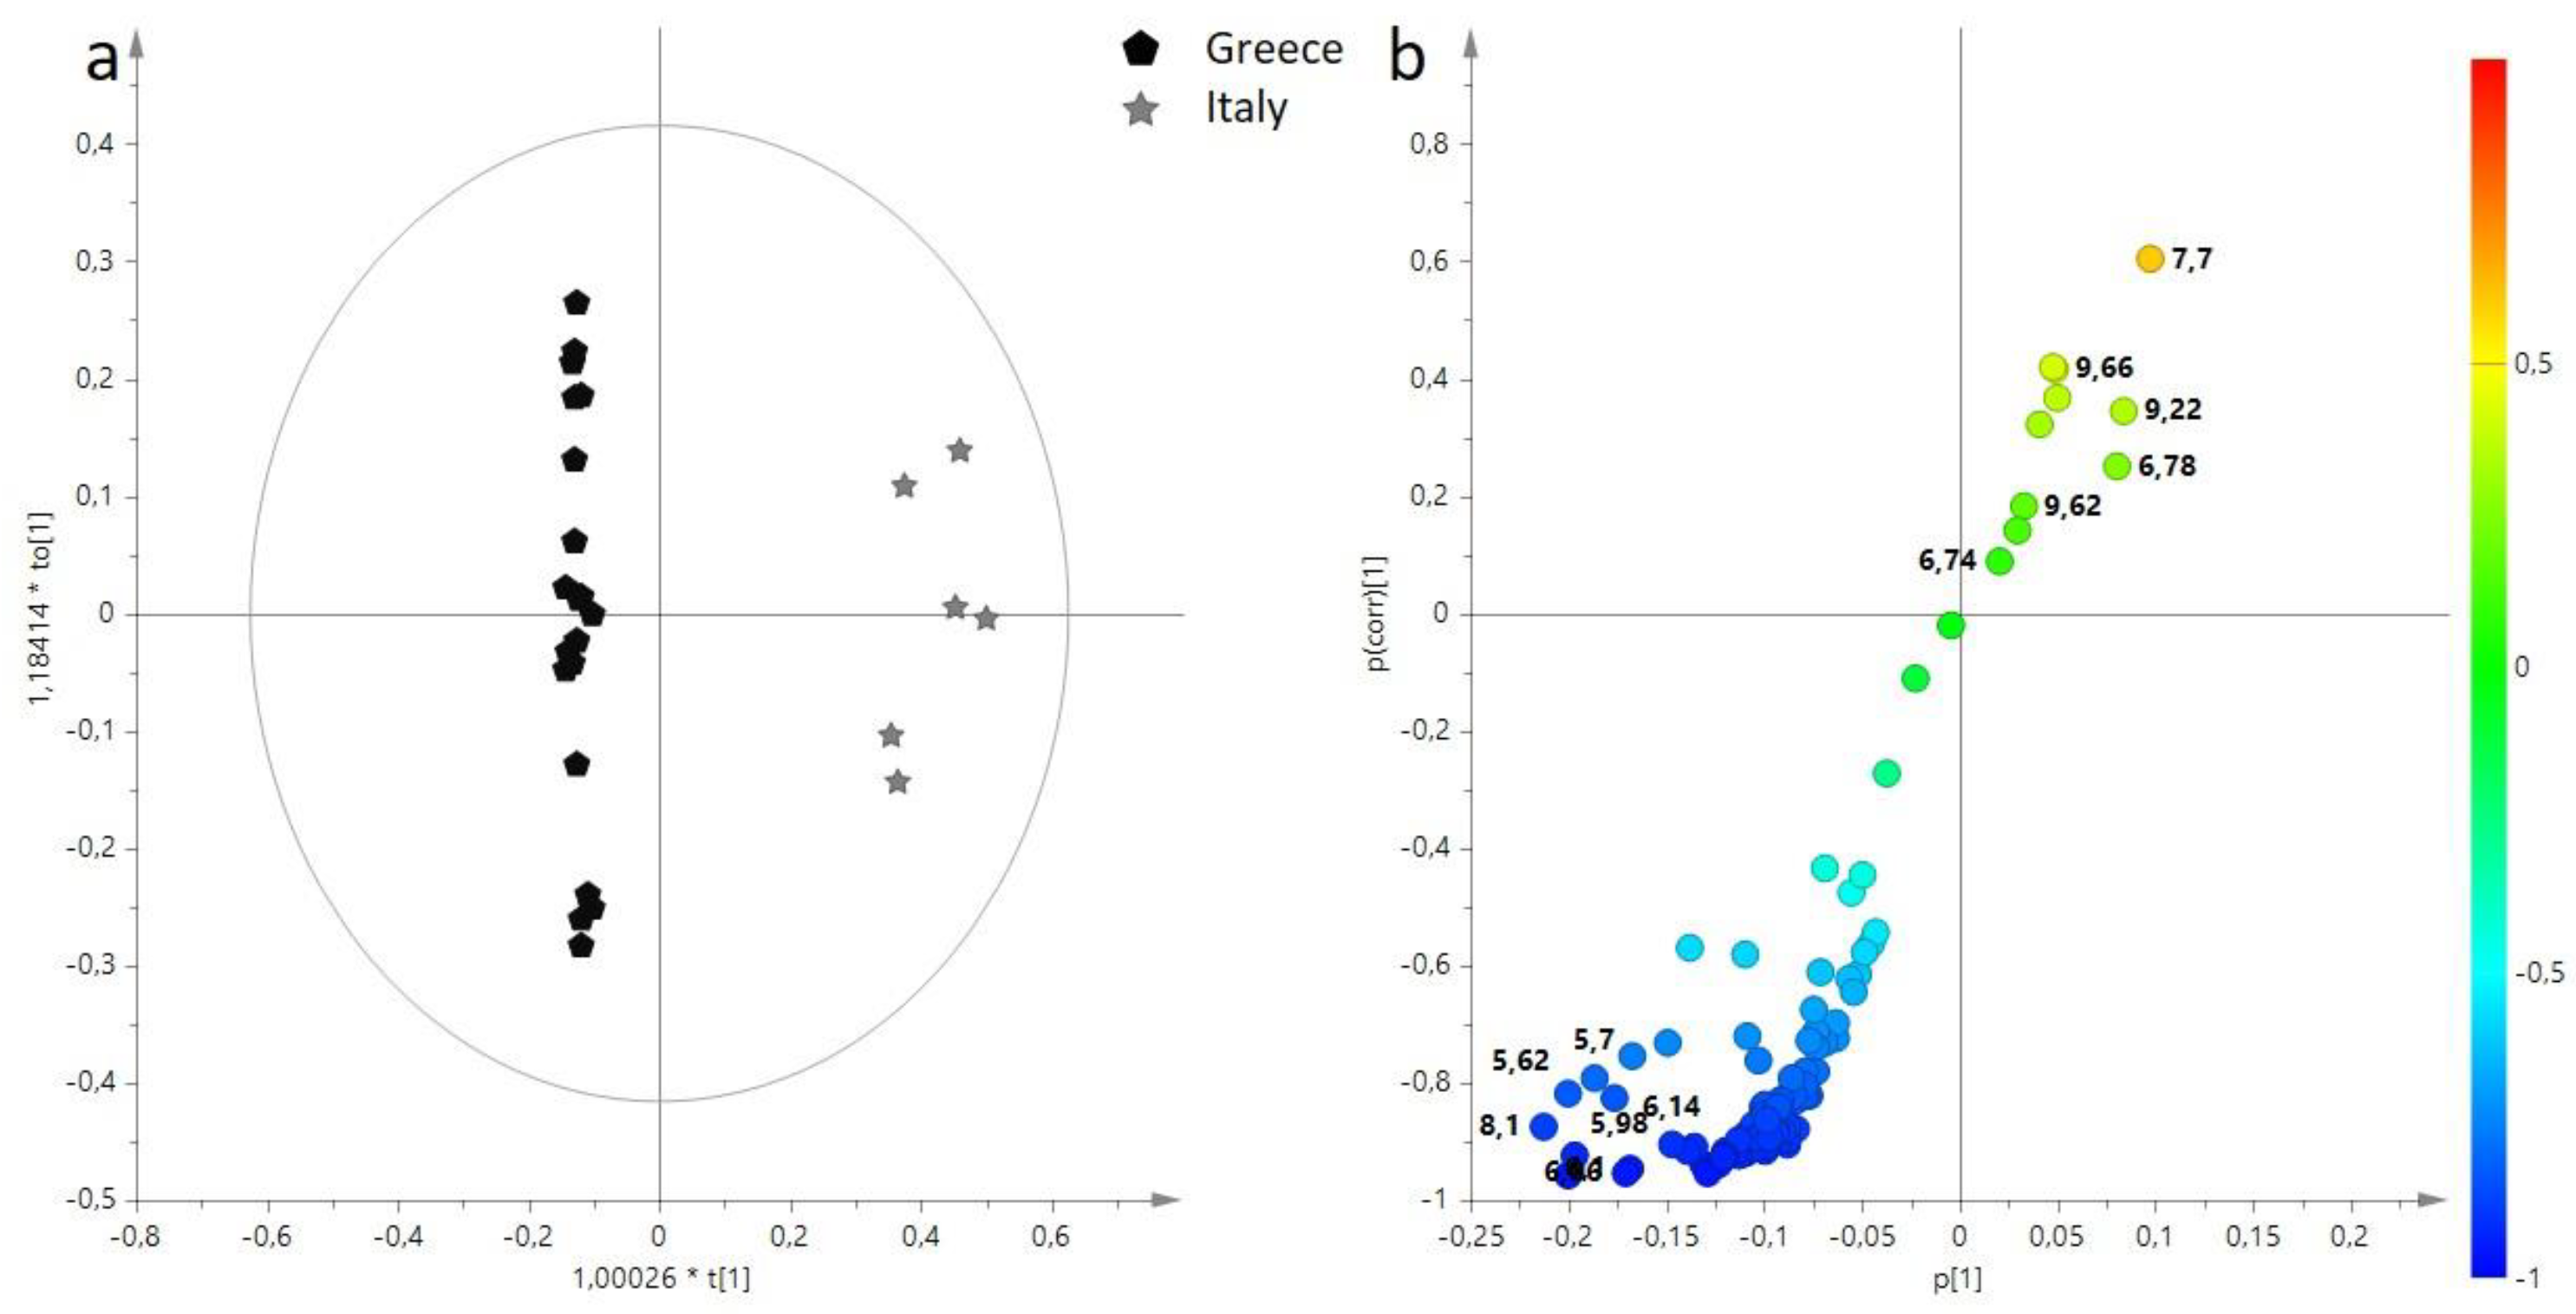
For Koroneiki olive oil, an explorative PCA model was obtained, and from the corresponding t[1]/t[2] score plot (Figure S3), a separation of the samples in agreement with their geographical origin was observed. This trend was further studied by the corresponding OPLS-DA model, built using one predictive and two orthogonal components (model parameters R2X = 0.85, R2Y = 0.99, Q2 = 0.92, Figure 5a). Analysis of the S-Plot (Figure 5b) revealed a high relative content of phenolic compounds (tyrosol, hydroxytyrosol, and their derivatives) in Koroneiki olive oil samples obtained from Italy; at the same time, other compounds, such as formaldehyde and hydroperoxides (in the spectral range 5.70 and 6.58 ppm) [41,42] were characteristic of olive oils obtained from Greece.
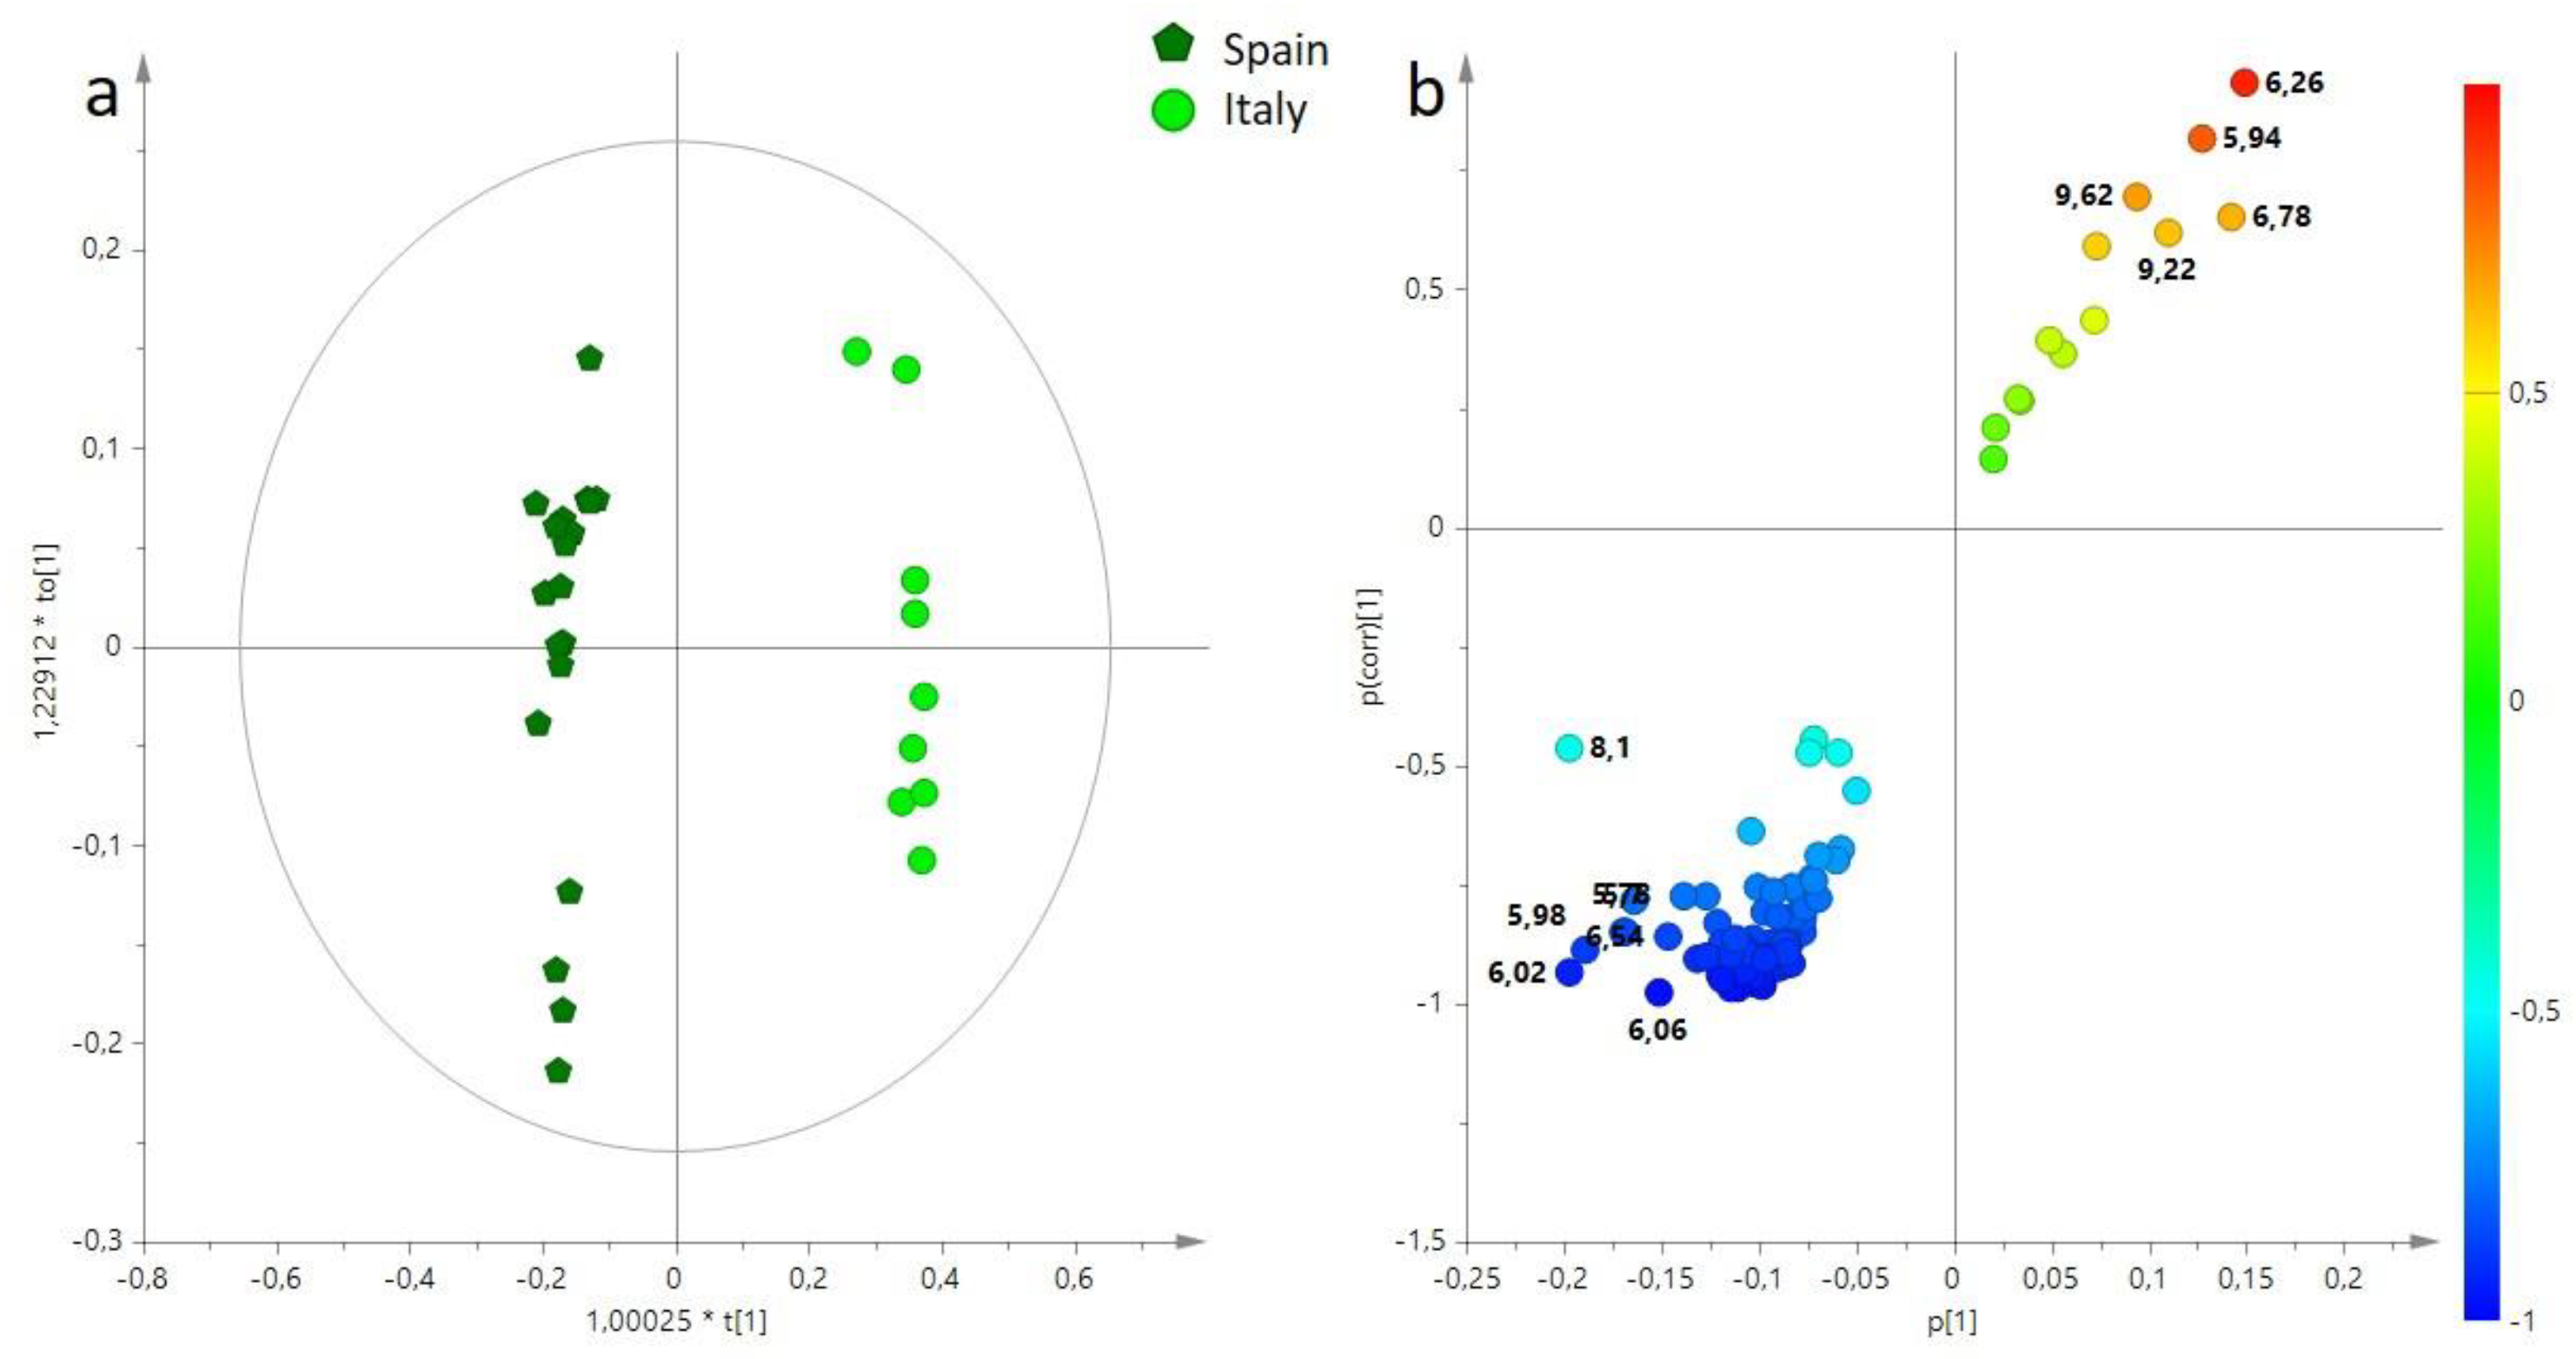
Thereafter, an unsupervised analysis was applied to Arbequina samples in order to evaluate the differences according to provenance. The preliminary PCA showed a good grouping of olive oil samples in agreement with geographical origin (Figure S4). To confirm the observed trend for Arbequina EVOOs samples, a supervised analysis was then performed. The OPLS-DA analysis gave a good model, 1+1+0, R2X = 0.69, R2Y = 0.99, Q2 = 0.97, and showed again the samples grouped according to origin in either Italy or Spain (Figure 6a). Similarly, for cv. Arbequina, the olive oils obtained from Italy were characterized by a higher relative content of phenolic compounds compared with olive oil samples obtained from Spain (Figure 6b). Conversely, the latter were characterized by the presence of formaldehyde and hydroperoxides.

4. Discussion

An attempt to discriminate two monovarietal EVOOs according to the geographical origin of the used olives through NMR-based chemometric models was performed. Arbequina and Koroneiki, two olive cultivars spread in the Mediterranean basin and typically grown in Spain and Greece, respectively, were used. Micro-milled oils were obtained from olives harvested both in their cultivar home countries (Spain, and Greece; Siurana PDO and Mylopotamos PDO regions, respectively) and in Italy (Bari province, Apulia region). Investigations by 1H NMR metabolic profiling were carried out to develop a strategy for the correct interpretation of differences based on geographical provenance. Unsupervised (PCA) and supervised (OPLS-DA) models clearly allowed the differentiation of the lab-produced monocultivar oils not only according to the cultivars but also to the specific geographical origin of the used olives. Interestingly, a clear differentiation according to olives origin (cultivar homeland or Italy) could be observed within a specific cultivar even in the simple unsupervised models using both major and minor components focused on NMR-spectra-derived databases. A relatively higher amount of polyunsaturated FAs (such as linoleic and linolenic acid) and lower content of phenolic compounds generally characterized Arbequina compared to Koroneiki olive oil samples. These results are in agreement with literature data, reporting higher polyunsaturated fatty acid content for Arbequina oils than Koroneiki oils [5,19]. This could be a disadvantage in terms of oxidative stability because polyunsaturated fats are less stable than monounsaturated fats. Therefore, Arbequina olive oil may as a result be more susceptible to oxidation and spoilage, and also be more dependent on storage conditions [19]. Furthermore, cv. Koroneiki oils were also studied by several authors through Gas Chromatography (GC) and High-Performance Liquid Chromatography (HPLC) analyses and showed to have a very high content of natural bioactive compounds with antioxidant properties compared to Arbequina oils. Specific results on this issue were reported in a study on Koroneiki and Arbequina varieties grown in northeastern Morocco [43] and California [5] under the irrigated SHD planting system.
It should be also noted that the same cultivar from different geographical origins (under different pedoclimatic conditions) could be also affected by a multi-layered interaction of several factors including growing systems [44]. In this study, we observed that the oils from Spain resulted in a higher content of PUFAs (linoleic and linolenic acids) with respect to those from Italy, which were richer in SFAs. On the contrary, the Italian oils of Koroneiki showed a higher content of MUFAs (oleic acid) than Greek oils. Italy, as a geographical EVOO origin, seemed to significantly modulate all the major components in relation to the cultivar. These results confirm literature data reporting different fatty acids profiles for Arbequina and Koroneiki monovarietal oils obtained from olives cultivated in a country other than the cultivars’ homelands (i.e., Spain and Greece, respectively). When considering EVOO minor components, it should be noted that both Arbequina and Koroneiki monocultivar products showed lower hydroperoxides and higher phenolic compounds content when obtained using olives harvested in Italy compared to their cultivar home countries (Spain and Greece for Arbequina and Koroneiki, respectively). Therefore. Italy, as a geographical EVOO origin, seems to significantly improve somehow both major and minor components at least for the two non-autochthonous cultivars studied here, improving their nutraceutical quality. This relates specifically to the content of phenolic compounds, considered the principal antioxidant in EVOOs, contributing to olive oil stability and responsible for the bitter and pungency characteristics in organoleptic tests [43]. However, it should be also underlined that, despite the correspondence of the EVOO characteristics in this study to other literature data related to the focused cultivars (Arbequina and Koroneiki), the specificity of the observed discrimination needs to be confirmed by multiyear experiments [44,45].

5. Conclusions

In addition to genetic factors, geographical origin significantly influences the metabolic profile of monovarietal EVOOs, as ripening time and extraction conditions were identical for all the studied samples. Fatty acids and phenols, as major and minor olive oil components, respectively, are reliable metabolomic markers able to discriminate EVOOs of the same cultivar but coming from different geographical areas. These insights also serve to enforce metabolomic approaches and 1H NMR-based chemometric models as powerful tools for EVOOs traceability, including the characterization of specific products from new SHD planting systems. Interestingly, in the present case, the same cultivar showed different FAs and minor components EVOOs composition when cultivated in Italy. Specifically, it was found that each of the investigated cultivars (Arbequina and Koroneiki), very popular in super high density (SHD) planting systems, assumed a specific well-characterized metabolic EVOO profile when the olives are cultivated and harvested in Italy. This result may help producers meet food security requirements and consumers make informed choices when dealing with EVOO trading. At the same time, the results reported here show the need for further research, which could focus on several other olive cultivars (including newly patented) and olive-growing countries in order to provide more general conclusions. Moreover, since the characteristics of the final products (EVOOs) are also strictly related to the specific harvesting year climatic conditions, this study should be repeated in subsequent years to confirm these results.

Supplementary Materials

The following supporting information can be downloaded at: https://www.mdpi.com/article/10.3390/horticulturae9010066/s1, Figure S1: (a) t[1]/t[2] PCA score plot (3 PCs, R2X = 0.903, Q2 = 0.810) performed on major components (BUCKET-1) for Koroneiki olive oil samples obtained from Greece and Italy, (b) PCA loading plot colored according to the correlation-scaled loading vector (p(corr)). The variables indicated the chemical shift value (ppm) in the 1H NMR spectrum; Figure S2: (a) t[1]/t[2] PCA score plot (3 PCs, R2X = 0.870, Q2 = 0.696) performed on major components (BUCKET-1) for Arbequina olive oil samples obtained from Spain and Italy, (b) PCA loading plot colored according to the correlation-scaled loading vector (p(corr)). The variables indicated the chemical shift value (ppm) in the 1H NMR spectrum; Figure S3: (a) t[1]/t[2] PCA score plot (2 PCs, R2X = 0.798, Q2 = 0.744) performed on minor components (BUCKET-2) for Koroneiki olive oil samples obtained from Greece and Italy, (b) PCA loading plot colored according to the correlation-scaled loading vector (p(corr)). The variables indicated the chemical shift value (ppm) in the 1H NMR spectrum; Figure S4: (a) t[1]/t[2] PCA score plot (2 PCs, R2X = 0.727, Q2 = 0.619) performed on minor components (BUCKET-2) for Arbequina olive oil samples obtained from Spain and Italy, (b) PCA loading plot model colored according to the correlation-scaled loading vector (p(corr)). The variables indicated the chemical shift value (ppm) in the 1H NMR spectrum.

Author Contributions

Conceptualization, F.P.F. and S.C.; methodology, F.P.F. and G.A.V.; software, L.D.C. and C.R.G.; formal analysis, F.A.; investigation, F.A., F.C. and L.M.; data curation, L.D.C. and C.R.G.; writing—original draft preparation, F.A. and S.C.; writing—review and editing, F.P.F. and S.C. All authors have read and agreed to the published version of the manuscript.

Funding

This research received no external funding.

Institutional Review Board Statement

Not applicable.

Informed Consent Statement

Not applicable.

Data Availability Statement

Not applicable.

Acknowledgments

The authors give special thanks for collaboration to Certified Origins Italia s.r.l. Località Il Madonnino, Grosseto, Toscana, Italy, supplier of the Greek and Spanish olives.

Conflicts of Interest

The authors declare no conflict of interest.

References

  1. Mazzocchi, A.; Leone, L.; Agostoni, C.; Pali-Schöll, I. The Secrets of the Mediterranean Diet. Does [Only] Olive Oil Matter? Nutrients 2019, 11, 2941. [Google Scholar] [CrossRef] [PubMed] [Green Version]
  2. Rodrigues, N.; Casal, S.; Pinho, T.; Cruz, R.; Baptista, P.; Martín, H.; Asensio-S-Manzanera, M.C.; Peres, A.M.; Pereira, J.A. Olive Oil Characteristics of Eleven Cultivars Produced in a High-Density Grove in Valladolid Province (Spain). Eur. Food Res. Technol. 2021, 247, 3113–3122. [Google Scholar] [CrossRef]
  3. Famiani, F.; Farinelli, D.; Rollo, S.; Camposeo, S.; Di Vaio, C.; Inglese, P. Evaluation of Different Mechanical Fruit Harvesting Systems and Oil Quality in Very Large Size Olive Trees. Span. J. Agric. Res. 2014, 12, 960–972. [Google Scholar] [CrossRef] [Green Version]
  4. Rodrigues, N.; Casal, S.; Peres, A.M.; Baptista, P.; Bento, A.; Martín, H.; Asensio-S-Manzanera, M.C.; Pereira, J.A. Effect of Olive Trees Density on the Quality and Composition of Olive Oil from Cv. Arbequina. Elsevier Enhanc. Reader. 2018, 238, 222–233. [Google Scholar] [CrossRef] [Green Version]
  5. Polari, J.J.; Mori, M.; Wang, S.C. Virgin Olive Oils from Super-High-Density Orchards in California: Impact of Cultivar, Harvest Time, and Crop Season on Quality and Chemical Composition. Eur. J. Lipid Sci. Technol. 2021, 123, 2000180. [Google Scholar] [CrossRef]
  6. Camposeo, S.; Vivaldi, G.A.; Montemurro, C.; Fanelli, V.; Canal, M.C. Lecciana, a New Low-Vigour Olive Cultivar Suitable for Super High Density Orchards and for Nutraceutical EVOO Production. Agronomy 2021, 11, 2154. [Google Scholar] [CrossRef]
  7. Pellegrini, G.; La Sala, P.; Camposeo, S.; Contò, F. Economic Sustainability of the Olive Oil High and Super-High Density Cropping Systems in Italy. Glob. Bus. Econ. Rev. 2017, 19, 553–569. [Google Scholar] [CrossRef]
  8. Pellegrini, G.; Ingrao, C.; Camposeo, S.; Tricase, C.; Contò, F.; Huisingh, D. Application of Water Footprint to Olive Growing Systems in the Apulia Region: A Comparative Assessment. J. Clean. Production 2016, 112, 2407–2418. [Google Scholar] [CrossRef]
  9. Camposeo, S.; Vivaldi, G.A.; Russo, G.; Melucci, F.M. Intensification in Olive Growing Reduces Global Warming Potential under Both Integrated and Organic Farming. Sustainability 2022, 14, 6389. [Google Scholar] [CrossRef]
  10. Home Blog. Available online: https://www.agromillora.com/olint/en/ (accessed on 6 December 2022).
  11. Camposeo, S.; Godini, A. Preliminary observations about the performance of 13 varieties according to the super high density oliveculture training system in Apulia (southern Italy). Adv. Hortic. Sci. 2010, 24, 16–20. [Google Scholar] [CrossRef]
  12. Trentacoste, E.R.; Connor, D.J.; Gómez-Del-Campo, M. Response of Oil Production and Quality to Hedgerow Design in Super-High-Density Olive Cv. Arbequina Orchards. Agron. 2021, 11, 1632. [Google Scholar] [CrossRef]
  13. Sánchez-Rodríguez, L.; Kranjac, M.; Marijanović, Z.; Jerković, I.; Corell, M.; Moriana, A.; Carbonell-Barrachina, Á.A.; Sendra, E.; Hernández, F. Quality Attributes and Fatty Acid, Volatile and Sensory Profiles of “Arbequina” HydroSOStainable Olive Oil. Molecules 2019, 24, 2148. [Google Scholar] [CrossRef] [PubMed] [Green Version]
  14. Lo Bianco, R.; Proietti, P.; Regni, L.; Caruso, T. Planting Systems for Modern Olive Growing: Strengths and Weaknesses. Agriculture 2021, 11, 494. [Google Scholar] [CrossRef]
  15. Connor, D.J.; Gomez-Del-Campo, M.; Rousseaux, M.C.; Searles, P.S. Structure, Management and Productivity of Hedgerow Olive Orchards: A Review. Sci. Hortic. 2014, 169, 71–93. [Google Scholar] [CrossRef]
  16. Vivaldi, G.; Strippoli, G.; Pascuzzi, S.; Stellacci, A.; Camposeo, S. Olive Genotypes Cultivated in an Adult High-Density Orchard Respond Differently to Canopy Restraining by Mechanical and Manual Pruning. Sci. Hortic. 2015, 192, 391–399. [Google Scholar] [CrossRef]
  17. Caruso, T.; Campisi, G.; Marra, F.; Camposeo, S.; Vivaldi, G.; Proietti, P.; Nasini, L. Growth and Yields of “Arbequina” High-Density Planting Systems in Three Different Olive Growing Areas In Italy. Acta Hortic. 2014, 1057, 341–348. [Google Scholar] [CrossRef] [Green Version]
  18. Clodoveo, M.L.; Camposeo, S.; De Gennaro, B.; Pascuzzi, S.; Roselli, L. In the Ancient World, Virgin Olive Oil Was Called “Liquid Gold” by Homer and “the Great Healer” by Hippocrates. Why Has This Mythic Image Been Forgotten? Food Res. Int. 2014, 62, 1062–1068. [Google Scholar] [CrossRef]
  19. Lechhab, T.; Lechhab, W.; Cacciola, F.; Salmoun, F. Sets of Internal and External Factors Influencing Olive Oil (Olea europaea L.) Composition: A Review. Eur. Food Res. Technol. 2022, 248, 1069–1088. [Google Scholar] [CrossRef]
  20. Romero, N.; Saavedra, J.; Tapia, F.; Sepúlveda, B.; Aparicio, R. Influence of Agroclimatic Parameters on Phenolic and Volatile Compounds of Chilean Virgin Olive Oils and Characterization Based on Geographical Origin, Cultivar and Ripening Stage. J. Sci. Food Agric. 2016, 96, 583–592. [Google Scholar] [CrossRef]
  21. Beltrán, M.; Sánchez-Astudillo, M.; Aparicio, R.; García-González, D.L. Geographical Traceability of Virgin Olive Oils from South-Western Spain by Their Multi-Elemental Composition. Food Chem. 2015, 169, 350–357. [Google Scholar] [CrossRef]
  22. The EU Food Fraud Network. Available online: https://food.ec.europa.eu/safety/agri-food-fraud/eu-food-fraud-network_en (accessed on 6 December 2022).
  23. No. 1019/2002; Marketing Standards for Olive Oil. The Commission of the European Communities: Brussels, Belgium, 2002.
  24. Masetti, O.; Sorbo, A.; Nisini, L. NMR Tracing of Food Geographical Origin: The Impact of Seasonality, Cultivar and Production Year on Data Analysis. Separations 2021, 8, 230. [Google Scholar] [CrossRef]
  25. Hlima, H.B.; Ayed, R.B.; Ennouri, K.; Smaoui, S. Geographical Discrimination of Virgin Olive Oils from the Tunisian Coasts by Combining Fatty Acids and Phenolic Acids Profiles within a Multivariate Analysis. J. Oleo Sci. 2017, 66, 963–971. [Google Scholar] [CrossRef] [PubMed] [Green Version]
  26. Klikarová, J.; Česlová, L.; Kalendová, P.; Dugo, P.; Mondello, L.; Cacciola, F. Evaluation of Italian Extra Virgin Olive Oils Based on the Phenolic Compounds Composition Using Multivariate Statistical Methods. Eur. Food Res. Technol. 2020, 246, 1241–1249. [Google Scholar] [CrossRef]
  27. European Commission. Commission Regulation (EC) No 182/2009 of 6 March 2009 Amending Regulation (EC) No 1019/2002 on Marketing Standards for Olive Oil. Off. J. Eur. Union. 2009, 63, 6–8. [Google Scholar]
  28. Calò, F.; Girelli, C.R.; Wang, S.C.; Fanizzi, F.P. Geographical Origin Assessment of Extra Virgin Olive Oil via NMR and MS Combined with Chemometrics as Analytical Approaches. Foods 2022, 11, 113. [Google Scholar] [CrossRef] [PubMed]
  29. Maestrello, V.; Solovyev, P.; Bontempo, L.; Mannina, L.; Camin, F. Nuclear Magnetic Resonance Spectroscopy in Extra Virgin Olive Oil Authentication. Compr. Rev. Food Sci. Food Saf. 2022, 21, 4056–4075. [Google Scholar] [CrossRef]
  30. Mannina, L.; Patumi, M.; Proietti, N.; Bassi, D.; Segre, A.L. Geographical Characterization of Italian Extra Virgin Olive Oils Using High-Field 1 H NMR Spectroscopy. J. Agric. Food Chem. 2001, 49, 2687–2696. [Google Scholar] [CrossRef]
  31. Girelli, C.R.; Calò, F.; Angilè, F.; Del Coco, L.; Papadia, P.; Biagianti, A.; Barbini, D.; Mazzi, L.; Fanizzi, F.P. 1H NMR–metabolomics for PDO and PGI EVOOsAssessment. In Proceedings of the Virtual 2020 AOCS Annual Meeting & Expo, Urbana, IL, USA, 29 June–3 July 2020. [Google Scholar] [CrossRef]
  32. Calò, F. Metabolomic Techniques Applied To Extra Virgin Olive Oils For Geographical Certification. Ph.D. Thesis, University of Salento, Lecce, Italy, 2022. [Google Scholar]
  33. Camposeo, S.; Vivaldi, G.A.; Gattullo, C.E. Ripening Indices and Harvesting Times of Different Olive Cultivars for Continuous Harvest. Sci. Hortic. 2013, 151, 1–10. [Google Scholar] [CrossRef]
  34. Girelli, C.R.; Del Coco, L.; Zelasco, S.; Salimonti, A.; Conforti, F.L.; Biagianti, A.; Barbini, D.; Fanizzi, F.P. Traceability of “Tuscan PGI” Extra Virgin Olive Oils by 1H NMR Metabolic Profiles Collection and Analysis. Metabolites 2018, 8, 60. [Google Scholar] [CrossRef] [Green Version]
  35. Girelli, C.R.; Calò, F.; Angilè, F.; Mazzi, L.; Barbini, D.; Fanizzi, F.P. 1H NMR Spectroscopy to Characterize Italian Extra Virgin Olive Oil Blends, Using Statistical Models and Databases Based on Monocultivar Ref. Oils. Foods 2020, 9, 1797. [Google Scholar] [CrossRef]
  36. van den Berg, R.A.; Hoefsloot, H.C.; Westerhuis, J.A.; Smilde, A.K.; van der Werf, M.J. Centering, Scaling, and Transformations: Improving the Biological Information Content of Metabolomics Data. BMC Genom. 2006, 7, 142. [Google Scholar] [CrossRef] [PubMed] [Green Version]
  37. Mohammadkhani, L.G.; Khoshkam, M.; Kompany-Zareh, M. Effect of Different Pretreatment Methods on Classification of Serum Samples Measured with 1H-NMR. Research Square 2022. [CrossRef]
  38. Angilè, F.; Vivaldi, G.A.; Girelli, C.R.; Del Coco, L.; Caponio, G.; Lopriore, G.; Fanizzi, F.P.; Camposeo, S. Treated Unconventional Waters Combined with Different Irrigation Strategies Affect 1H NMR Metabolic Profile of a Monovarietal Extra Virgin Olive Oil. Sustainability 2022, 14, 1592. [Google Scholar] [CrossRef]
  39. Grace, S.C.; Hudson, D.A. Processing and Visualization of Metabolomics Data Using R. In Metabolomics-Fundamentals and Applications; IntechOpen: London, UK; BoD–Books on Demand: Norderstedt, Germany, 2016; pp. 63–94. [Google Scholar]
  40. Ruiz-Aracama, A.; Goicoechea, E.; Guillén, M.D. Direct Study of Minor Extra-Virgin Olive Oil Components without Any Sample Modification. 1H NMR Multisupression Experiment: A Powerful Tool. Food Chem. 2017, 228, 301–314. [Google Scholar] [CrossRef]
  41. Del Coco, L.; Girelli, C.; Angilè, F.; Mascio, I.; Montemurro, C.; Distaso, E.; Tamburrano, P.; Chiurlia, S.; Clodoveo, M.; Corbo, F.; et al. NMR-Based Metabolomic Study of Apulian Coratina Extra Virgin Olive Oil Extracted with a Combined Ultrasound and Thermal Conditioning Process in an Industrial Setting. Food Chem. 2021, 345, 128778. [Google Scholar] [CrossRef]
  42. Martínez-Yusta, A.; Goicoechea, E.; Guillén, M.D. A Review of Thermo-Oxidative Degradation of Food Lipids Studied by 1H NMR Spectroscopy: Influence of Degradative Conditions and Food Lipid Nature. Compr. Rev. Food Sci. Food Saf. 2014, 13, 838–859. [Google Scholar] [CrossRef]
  43. Mansouri, F.; Ben Moumen, A.; Aazza, S.; Belhaj, K.; Fauconnier, M.; Sindic, M.; Caid, H.S.; Elamrani, A. Quality and Chemical Profiles of Virgin Olive Oils of Three European Cultivars Suitable for Super-High-Density Planting Conditions in Eastern Morocco. Mater. Today Proc. 2019, 13, 998–1007. [Google Scholar] [CrossRef] [Green Version]
  44. Temime, S.B.; Manai, H.; Methenni, K.; Baccouri, B.; Abaza, L.; Daoud, D.; Casas, J.S.; Bueno, E.O.; Zarrouk, M. Sterolic Composition of Chétoui Virgin Olive Oil: Influence of Geographical Origin. Food Chem. 2008, 110, 368–374. [Google Scholar] [CrossRef]
  45. Girelli, C.R.; Del Coco, L.; Papadia, P.; De Pascali, S.A.; Fanizzi, F.P. Harvest year effects on Apulian EVOOs evaluated by 1H NMR based metabolomics. Peer. J. 2016, 4, e2740. [Google Scholar] [CrossRef]
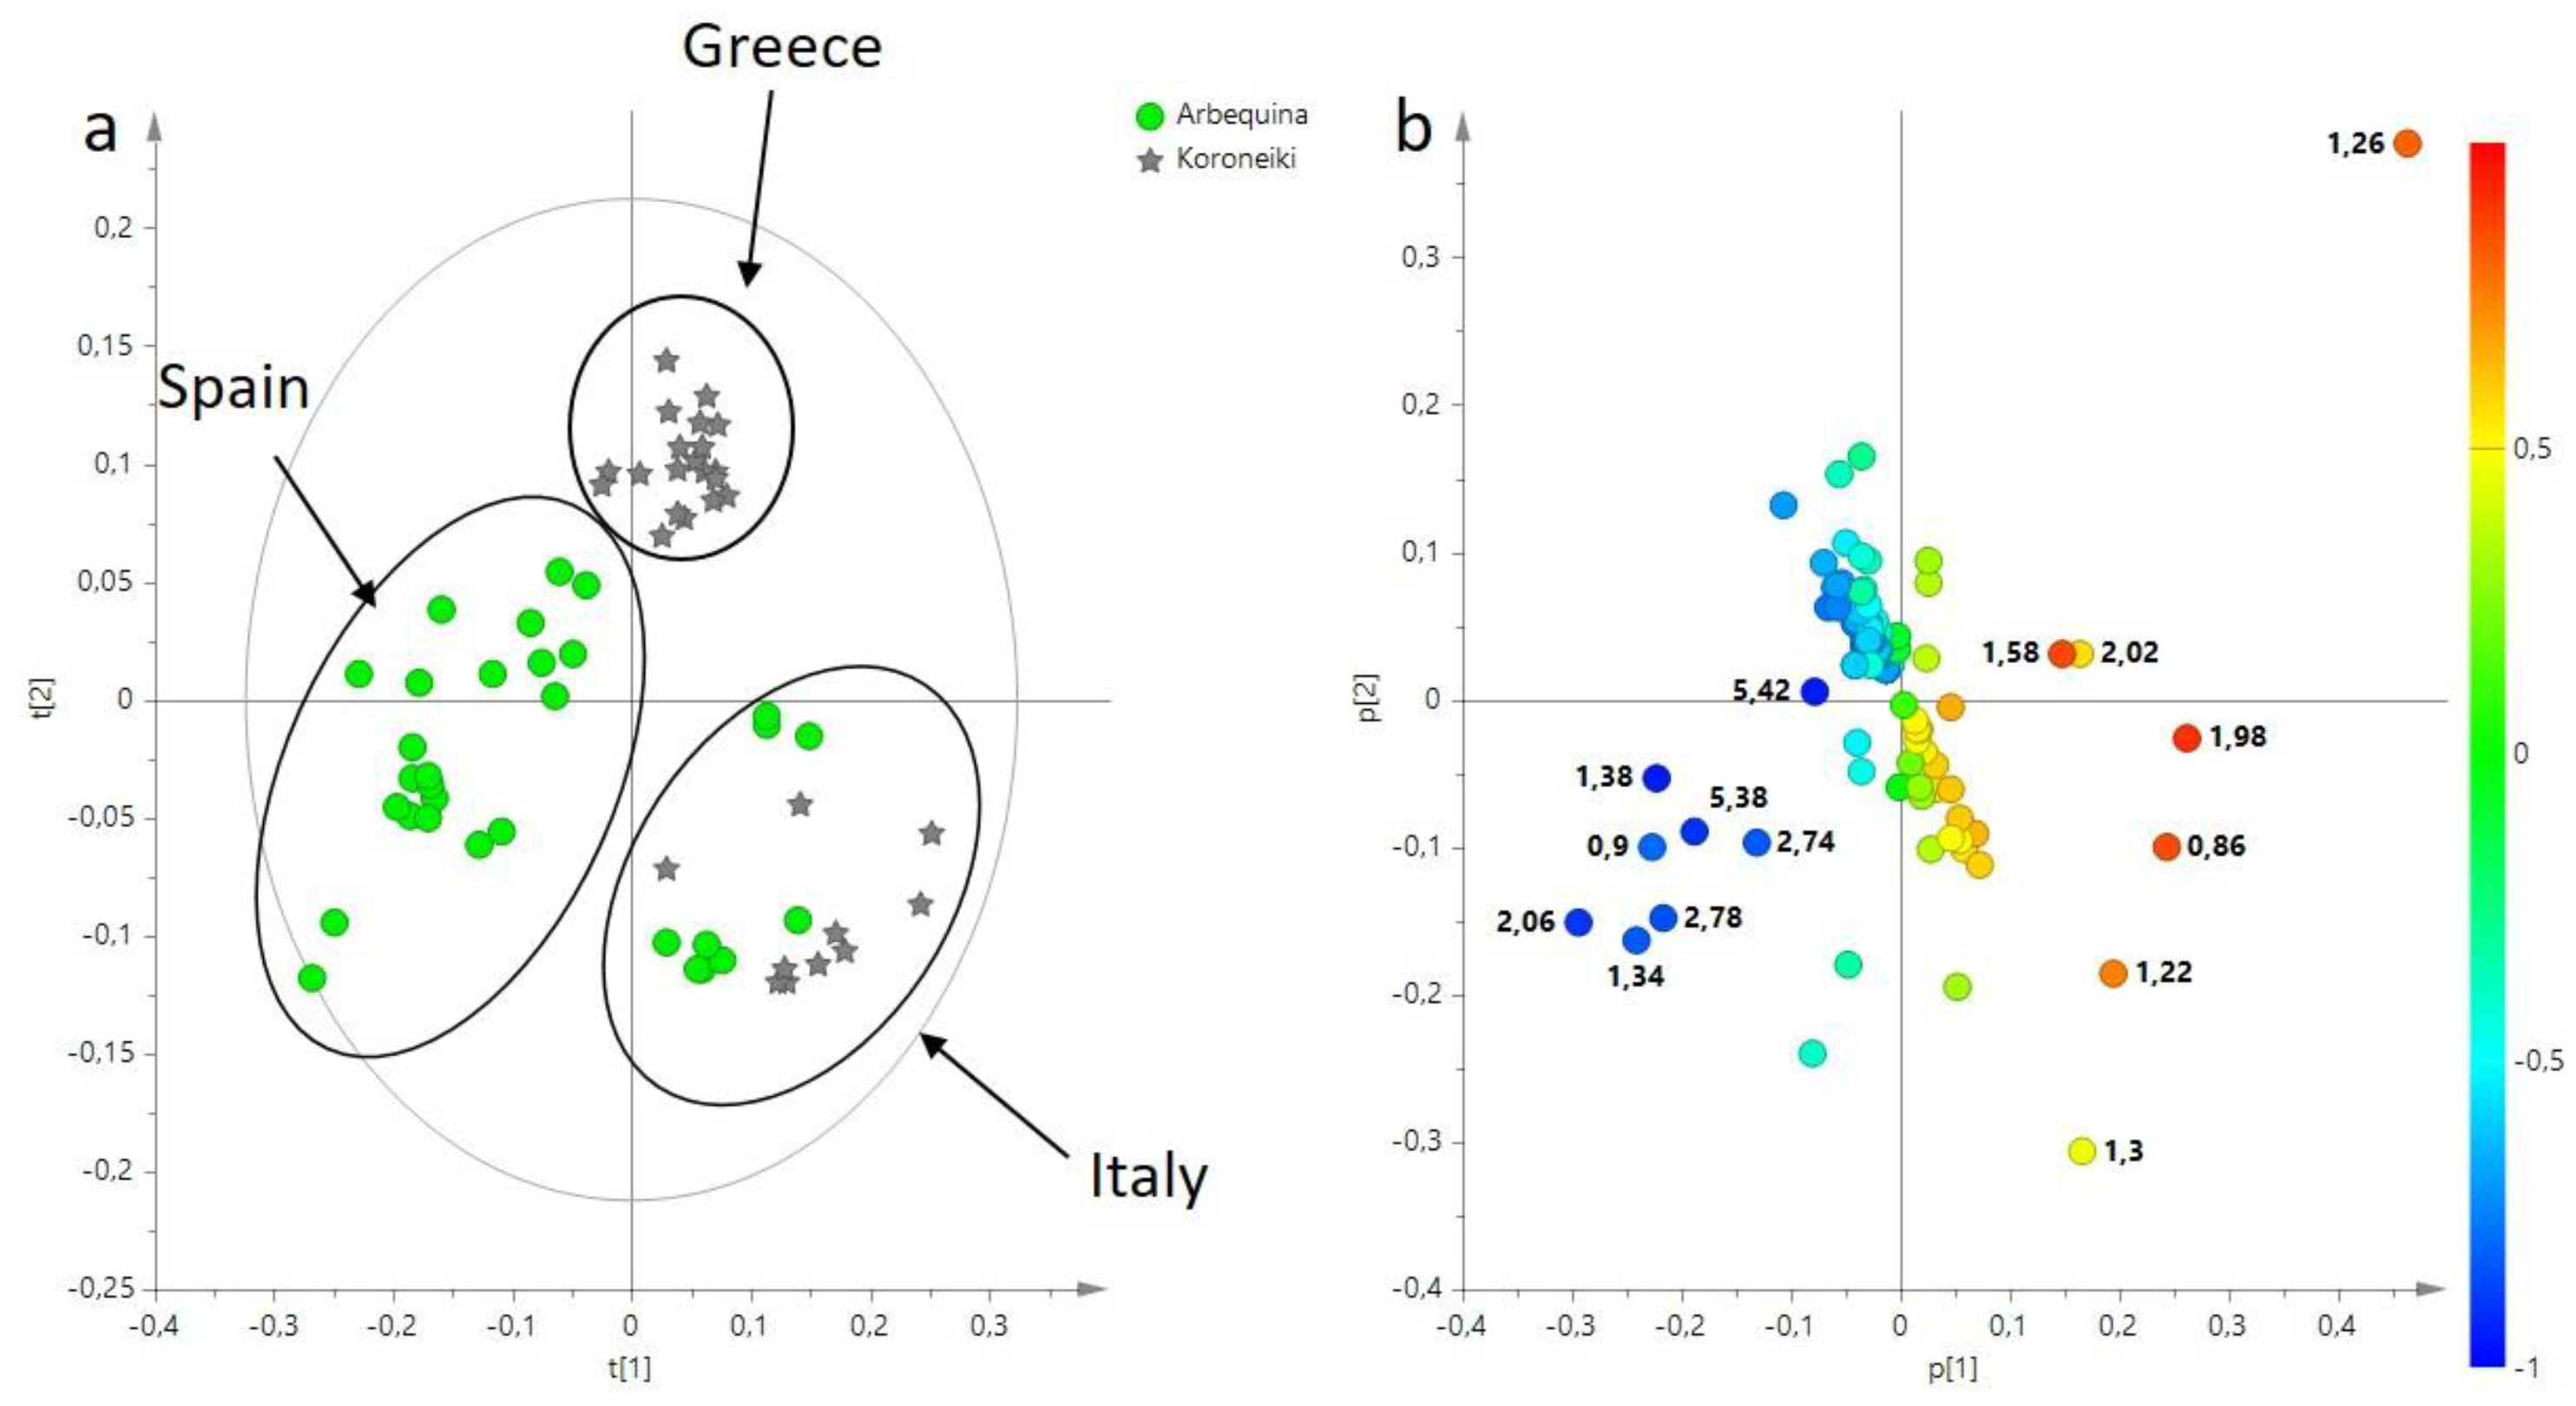
Figure 1. (a) t[1]/t[2] PCA score plot performed on major components (BUCKET-1) for Arbequina and Koroneiki EVOOs samples obtained from Spain, Greece, and Italy, (b) PCA loading plot, colored according to the correlation-scaled loading vector (p(corr)). The variables indicated the chemical shift value (ppm) in the 1H NMR spectrum.
Horticulturae 09 00066 g001
Figure 2. (a) OPLS-DA t[1]/to[1] PCA score plot performed on major components (BUCKET-1) of Koroneiki EVOOs samples obtained from Greece and Italy, (b) S-plot for the OPLS-DA model colored according to the correlation-scaled loading vector (p(corr)). The variables indicated the chemical shift value (ppm) in the 1H NMR spectrum.
Horticulturae 09 00066 g002
Figure 3. (a) OPLS-DA t[1]/to[1] PCA score plot performed on major components (BUCKET-1) of Arbequina EVOOs samples obtained from Spain and Italy, (b) S-plot for the OPLS-DA model colored according to the correlation-scaled loading vector (p(corr)). The variables indicated the chemical shift value (ppm) in the 1H NMR spectrum.
Horticulturae 09 00066 g003
Figure 4. (a) t[1]/t[2] PCA score plot performed on minor components (BUCKET-2) of Arbequina and Koroneiki EVOOs samples obtained from Spain, Greece, and Italy, (b) PCA loading plot, colored according to the correlation-scaled loading (p(corr) vector). The variables indicated the chemical shift value (ppm) in the 1H NMR spectrum.
Horticulturae 09 00066 g004
Figure 5. (a) OPLS-DA t[1]/to[1] PCA score plot performed on minor components (BUCKET-2) of Koroneiki EVOOs samples obtained from Greece and Italy, (b) S-plot for the OPLS-DA model colored according to the correlation-scaled loading vector (p(corr)). The variables indicated the chemical shift value (ppm) in the 1H NMR spectrum.
Horticulturae 09 00066 g005
Figure 6. (a) OPLS-DA t[1]/to[1] PCA score plot performed on minor components (BUCKET-2) of Arbequina EVOOs samples obtained from Spain and Italy, (b) S-plot for the OPLS-DA model colored according to the correlation-scaled loading vector (p(corr)). The variables indicated the chemical shift value (ppm) in the 1H NMR spectrum.
Horticulturae 09 00066 g006
Disclaimer/Publisher’s Note: The statements, opinions and data contained in all publications are solely those of the individual author(s) and contributor(s) and not of MDPI and/or the editor(s). MDPI and/or the editor(s) disclaim responsibility for any injury to people or property resulting from any ideas, methods, instructions or products referred to in the content.