Article

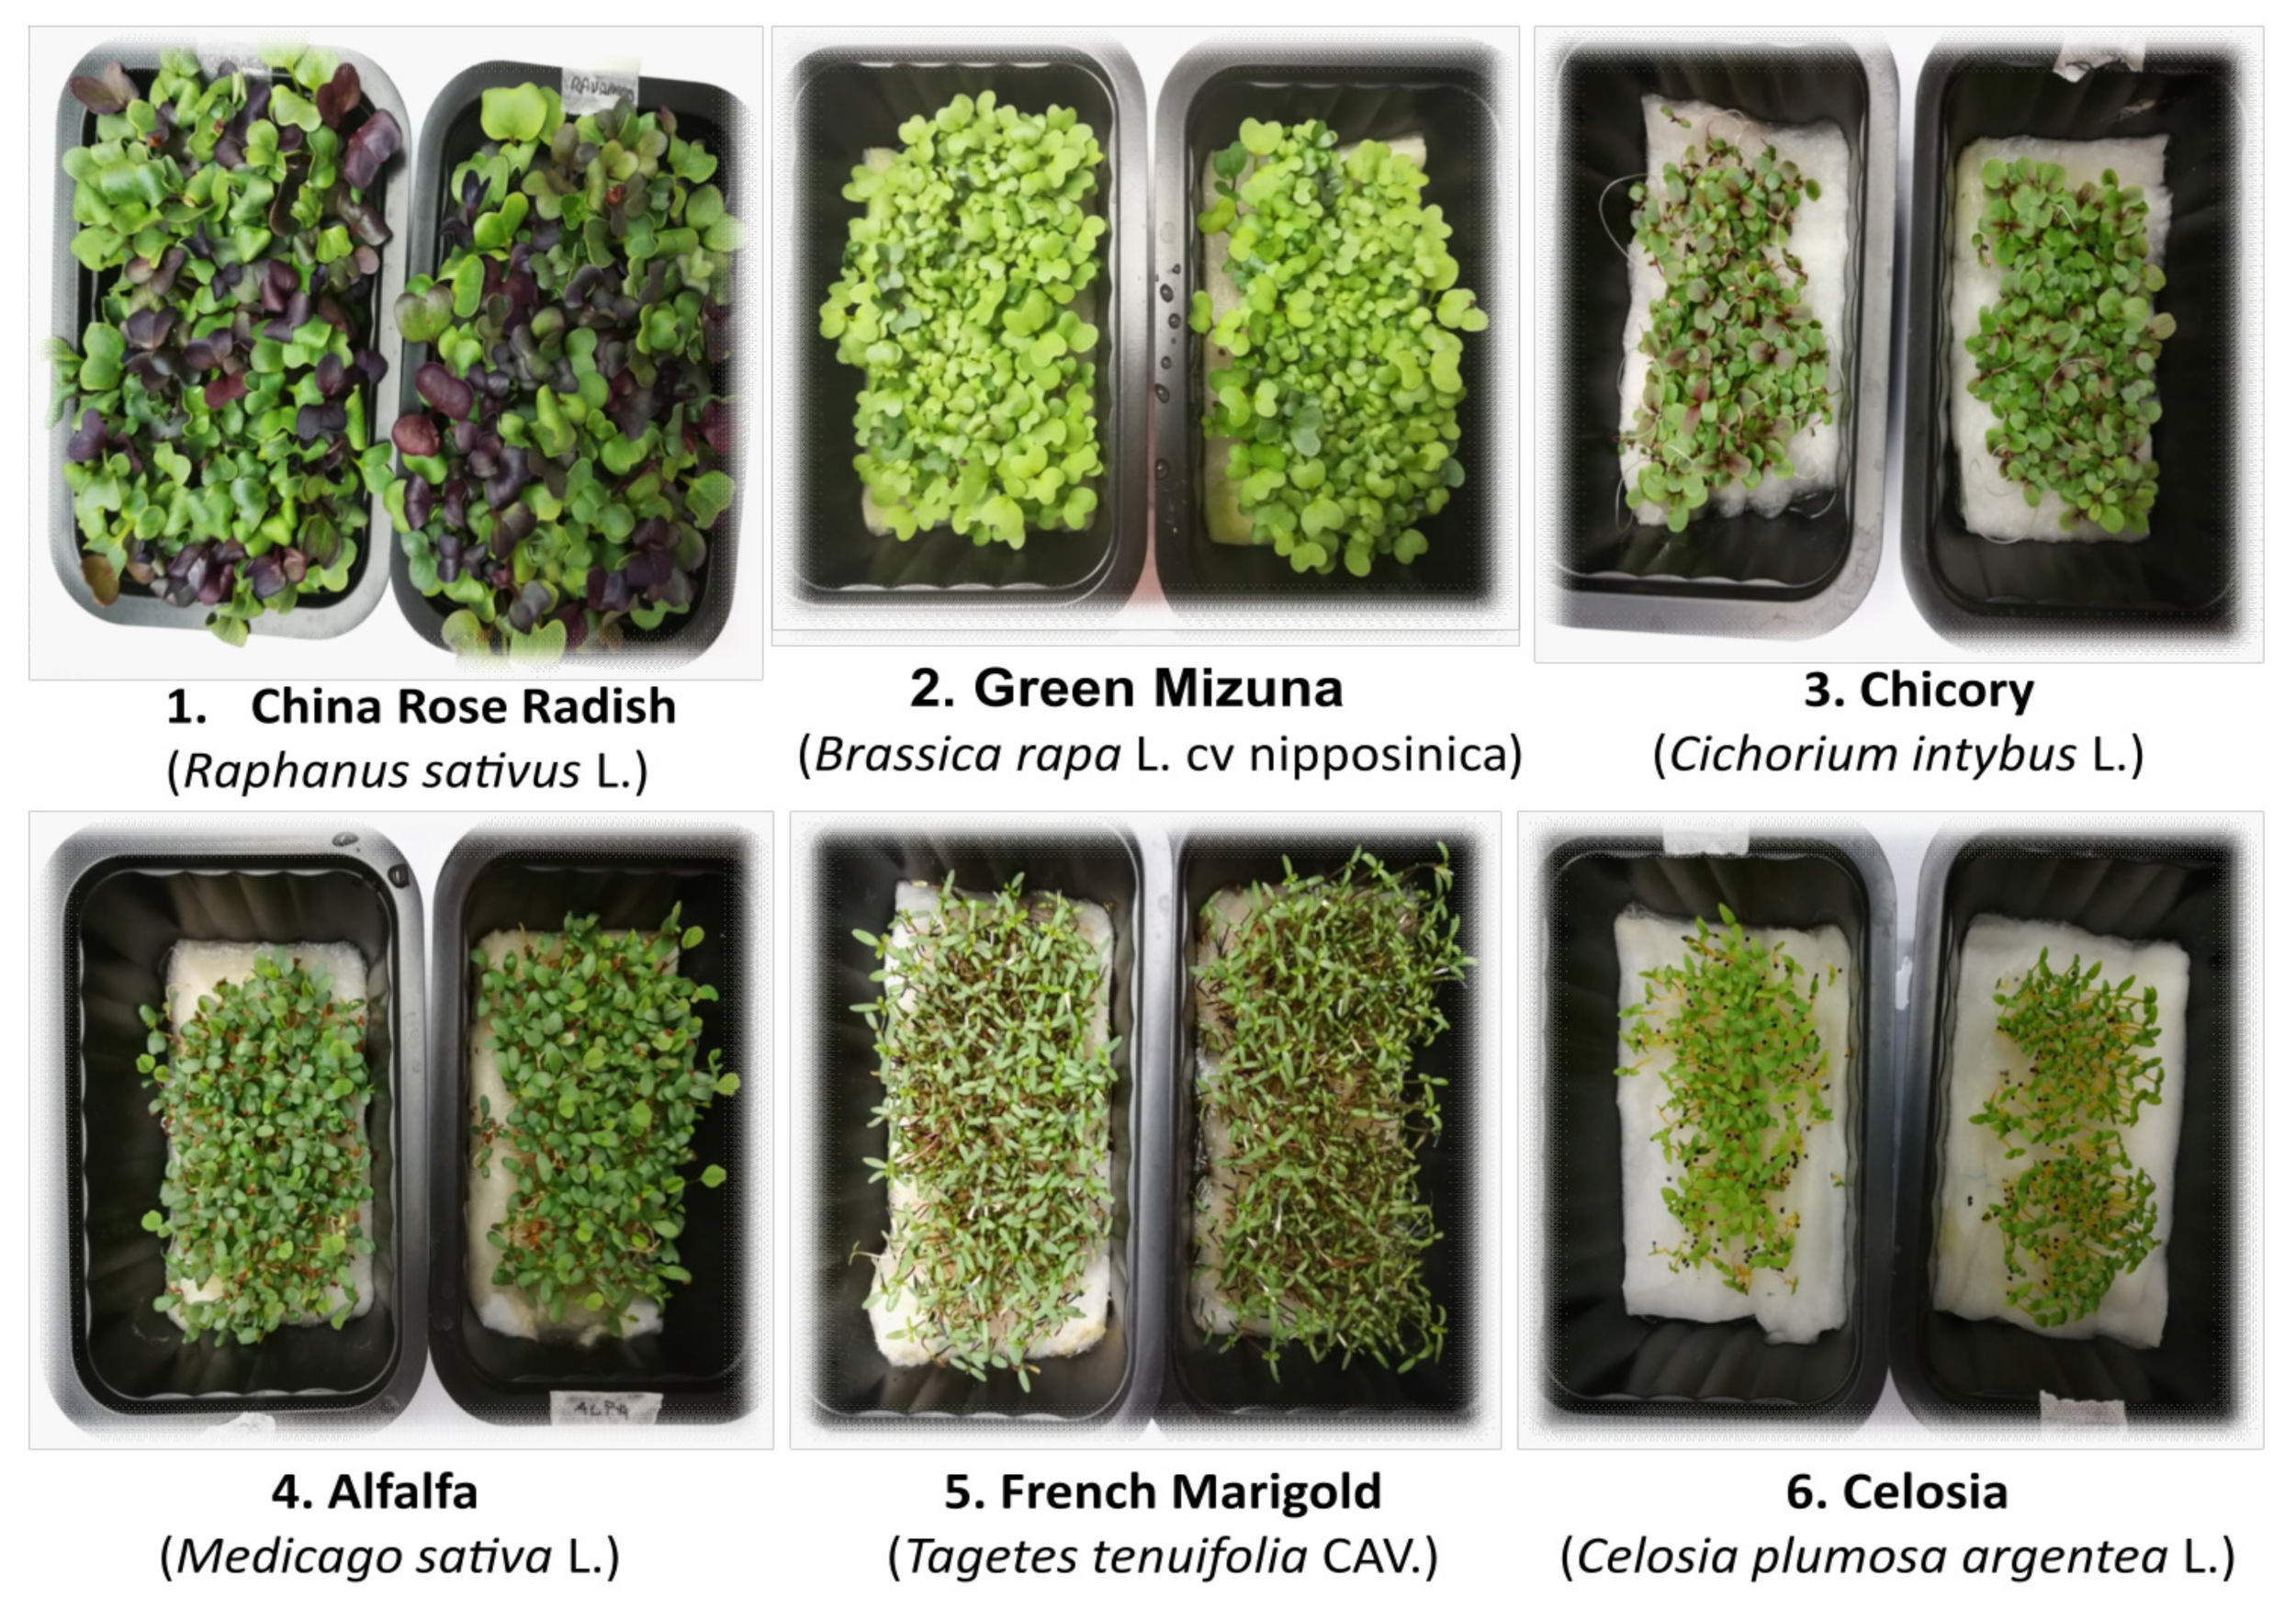
The Inclusion of Green Light in a Red and Blue Light Background Impact the Growth and Functional Quality of Vegetable and Flower Microgreen Species

1
Institute of Life Sciences, Scuola Superiore Sant’Anna, Piazza Martiri della Libertà 33, 56127 Pisa, Italy
2
Department of Agriculture, Food and Environment, Università degli Studi di Pisa, Via del Borghetto, 80, 56124 Pisa, Italy
3
Department of Agricultural and Environmental Sciences, Università degli Studi di Milano, 20133 Milano, Italy
*
Author to whom correspondence should be addressed.
Horticulturae 2022, 8(3), 217; https://doi.org/10.3390/horticulturae8030217
Submission received: 31 January 2022 / Revised: 24 February 2022 / Accepted: 26 February 2022 / Published: 1 March 2022
(This article belongs to the Special Issue Indoor Farming and Artificial Cultivation)

Abstract

:
Microgreens are edible seedlings of vegetables and flowers species which are currently considered among the five most profitable crops globally. Light-emitting diodes (LEDs) have shown great potential for plant growth, development, and synthesis of health-promoting phytochemicals with a more flexible and feasible spectral manipulation for microgreen production in indoor farms. However, research on LED lighting spectral manipulation specific to microgreen production, has shown high variability in how these edible seedlings behave regarding their light environmental conditions. Hence, developing species-specific LED light recipes for enhancement of growth and valuable functional compounds is fundamental to improve their production system. In this study, various irradiance levels and wavelengths of light spectrum produced by LEDs were investigated for their effect on growth, yield, and nutritional quality in four vegetables (chicory, green mizuna, china rose radish, and alfalfa) and two flowers (french marigold and celosia) of microgreens species. Microgreens were grown in a controlled environment using sole-source light with different photosynthetic photon flux density (110, 220, 340 µmol m−2 s−1) and two different spectra (RB: 65% red, 35% blue; RGB: 47% red, 19% green, 34% blue). At harvest, the lowest level of photosynthetically active photon flux (110 µmol m−2 s−1) reduced growth and decreased the phenolic contents in almost all species. The inclusion of green wavelengths under the highest intensity showed positive effects on phenolic accumulation. Total carotenoid content and antioxidant capacity were in general enhanced by the middle intensity, regardless of spectral combination. Thus, this study indicates that the inclusion of green light at an irradiance level of 340 µmol m−2 s−1 in the RB light environment promotes the growth (dry weight biomass) and the accumulation of bioactive phytochemicals in the majority of the microgreen species tested.

1. Introduction

Microgreens are a class of specialty crop, which includes edible seedlings of vegetables, ornamental species, and herbs that are harvested after the cotyledons have fully developed, either before or directly after the first true leaves have appeared [1,2]. Starting twenty years ago as fashionable, high-value ingredients for high-end restaurants, today microgreens have gained increasing popularity among consumers due to their sensorial characteristics, high nutrients, and health-promoting phytochemical concentrations even superior to their corresponding mature plants [2,3]. Moreover, the cultivation of microgreens is extremely versatile. They can be grown in a variety of environments (i.e., greenhouse, indoor, outdoor) employing soil media in trays or soilless substrates such as hydroponic, using organic and inorganic fertilizers, and natural or artificial light sources or a combination of them [4].
These specialty crops are also ideally suited for urban agriculture production systems to achieve a sustainable food supply [5,6,7,8] and are now widely promoted for such applications, since they have a short production cycle, high yields per unit area, and small growing space requirements, while also possessing high nutritional values [3,9].
As concerns the cultivation techniques, microgreens offer wide opportunities in choosing the scale of production, ranging from household level (micro-scale) where microgreens can be grown by individuals for domestic consumption to more commercialized agriculture (large scale) adopting hydroponic growing systems using different soilless growing media [10,11]. Microgreens are very suited for indoor production using artificial lighting and with the development of the urban farming production facilities and the rise of vertical farming systems, there is an increasing interest among commercial growers to produce microgreens using soilless media in hydroponic systems [12,13,14,15,16,17]. In particular, the use of vertical farming operations by the introduction of multilayer production that allows the crop to grown in vertical racks (shelving units) under sole-source (SS) light-emitting diodes (LEDs) as artificial lighting system, is becoming nowadays a promising technological advancement to obtain high density growth and manipulate morphological traits and phytochemical composition of crops [18,19,20,21].
Light is a crucial environmental factor that provides energy source for carbon fixation in photosynthesis and regulates through its signaling many other physiological processes related to plant growth and morphology [22,23]. In indoor farming, plants are grown within controlled environmental conditions and the radiation for photosynthesis and light signaling is totally supported by external sources of light. In this condition, both the quality and quantity of incident light have drastic impacts on the morpho-physiology of microgreens, and the biosynthesis and accumulation of secondary metabolites [24,25]. Compared to traditional light sources (i.e., high-pressure sodium, fluorescent, and metal halide lamps) used in controlled environments, the recent light-emitting diode (LED) technology shows several advantages, including energy efficiency, low maintenance cost, longevity, as well as the possibility to control spectral composition and select high light intensity while maintaining low heat emission [26].
Light at different irradiance levels may have different effects on plant growth, yield, and nutritional quality of microgreens, thus an optimal management of light intensity is required. In fact, low irradiance levels can suppress the growth and diminish the nutritional value of microgreens, whereas excessive radiation can have detrimental effects on photosystems, electron transport and ATP synthase complexes, and enzymes of the Calvin–Benson cycle [27,28]. Typically, the photosynthetic photon flux density (PPFD) that is supplied to microgreens for optimal yield, appearance, and nutritional quality in indoor production lies between 300 to 400 mmol m−2 s−1 [29,30].
Regarding the spectral composition (i.e., light quality), the combination of blue and red LED lights is widely used for horticultural crop production in controlled environments, including microgreens [29,31,32]. In fact, blue and red wavelengths are the main LEDs involved in stimulating the plant growth and have the greatest impact on photosynthesis due to the absorption peaks of chlorophyll molecules [33] by promoting the opening of stomata, electron transport, Rubisco activity [34], antioxidant accumulation, and pigment production [3,35]. Previous studies indicated that morphological responses of various microgreen species vary with different red:blue ratios and these effects were species-specific. Several microgreen species showed an inhibition response on growth traits and crop yields (i.e., hypocotyl length, cotyledon area, biomass accumulation) under increasing blue light percentage [30,36,37,38,39] while others exhibited an enhancement when the red light portion increased [39].
Light quality is not only involved in plant photomorphogenesis, but it also has been reported to have pronounced effects on secondary metabolism via the photosensory network driven by photoreceptor pathways allowing the production of phytochemically-enriched horticultural crops [40,41,42]. Similar to that observed for plant growth traits, the enhanced accumulation of certain phytochemicals in several microgreen species also appears dependent on species, and the specific spectral bandwidths used. For example, higher percentages of blue light positively affected the accumulation of phenolics, anthocyanins [43], and macro and micronutrients [44] in Brassicaceae microgreens. However, Bantis [39] reported a higher phenolic content and antioxidant capacity displayed by ferric reducing antioxidant power (FRAP) in five of seven microgreens (garlic chives, red amaranth, borage, green basil, and pea shoots) tested under increased red-light portion. Accumulation of carotenoids and the lipophilic antioxidant capacity of microgreens were favored by blue-red light environment compared to a red or blue LED as sole light source [45]. When the blue light percentage increased, the total carotenoid content in beet microgreens was enhanced [46,47] but not in parsley and mustard microgreens [46].
Despite many previous studies on red-blue LED lighting effects on microgreens, limited information is available about the interactions between green and red-blue light combinations. In general, green light is known to deeply penetrate the plant canopy compared to blue and red affecting the growth and synthesis of bioactive compounds via cryptochrome-dependent/independent processes [48]. When green light is supplemental for red and blue LED combination in controlled environmental agriculture, the effects on plant physiology are reported to be dependent on its proportions. Green light at high proportion (from 25 to 44%) in the red-blue light environment, has been reported to reverse blue- or red-light-induced responses (i.e., stem growth rate inhibition, chloroplast gene expression, stomatal opening, phytochemical accumulation) [49], and negatively influence the quality of microgreen products [49,50,51,52]. On the other hand, no changes in microgreen growth and appearance quality were found by substituting partially green wavelengths at low proportion (<9%) in a red-blue light environment [53]. However, when green percentage was increased (to 22%), lettuce and kale showed an enhancement of leaf expansion and biomass [54]. Similarly, Orlando et al. [55] and Bian et al. [56] showed that the combination of red and blue LED with suitable levels of green LED light (with a green percentage of 12 and 20%, respectively) was more effective than the combined use of RB light alone in enhancing the synthesis of bioactive compounds in Crocus sativus and lettuce plants.
Although previous reports have indicated that light intensity and light quality from sole-source LEDs influenced the growth of microgreens, the optimal ‘‘light recipe’’ appears to vary with lighting intensity and quality, as well as plant species. Based on previous research, this study adopted three different light intensities (from 110 to 340 µmol m−2 s−1) and two light combinations with higher red-blue ratios, with or without green LED light, to investigate the effects of these different light environments on growth, biomass accumulation and nutritional quality of six different microgreen species.

2. Materials and Methods

2.1. Plant Materials and Growing Conditions

The species used China Rose Radish (Raphanus sativus L.), Green Mizuna (Brassica rapa L. CV Nipposinica), Chicory (Cichorium intybus L.), and Alfalfa (Medicago sativa L.), were purchased from Blumen (Milano, Italy). In addition, flower species such as French Marigold (Tagetes tenuifolia CAV.) and Celosia (Celosia plumosa argentea L.) were used, and they were kindly provided by Domina Seeds (San Felice sul Panaro, Modena, Italy) (Figure 1).
The microgreen seeds were sown in plastic containers of size 5 cm × 4 cm × 4 cm (63 cm2). Depending on size and weight of the seeds we used 1 to 2 g of seeds per vessel. The substrate used was sterile cotton wool (Sterilcompress PIC, Como, Italy). After sowing, to synchronize the germination the seeds were placed at 4 °C for 48 h. All trays were transferred to polyethylene (PE) tanks (30 × 60 × 6.5 cm) each containing 3 L of half-strength Hoagland’s nutrient solution (macroelements expressed in mM: N 7.5, P 0.5, K 3.0, Ca 2.5, Mg 1.0; microelements expressed in µM: Fe 25.0, B 23.1, Mn 4.6, Zn 0.39, Cu 0.16, Mo 0.06; initial pH: 5.56; initial electric conductivity: 1.12 mS cm−1), prepared with distilled water (three tanks per species). The microgreen seedlings were grown in a floating hydroponic system in a grow chamber, under LED-light conditions for 7 days, at 23 °C, 16:8 h of photoperiod, RH 65–75%, and air recirculated through a fan placed on the ceiling. The position of the trays in each tank were changed daily to avoid their proximity to the edges of the tanks. Two different LED lamps were tested: (i) red λ = 600–700 (65%) and blue λ = 400–499 nm (35%) (RB); and (ii) red λ = 600–700 nm (47%), green λ = 500–600 nm (19%), and blue λ = 400–499 nm (34%) (RGB). For B, G, and R percentage is defined as the photon flux emitted in their waveband, divided by the total photon flux emitted between 400 and 700 nm. The relative spectral distributions of RB and RGB LED lighting treatments are reported in Figure S1 (Supplementary Materials in back matter). Different irradiance levels, expressed as photosynthetic photon flux densities (PPFD) were set in each lighting compartment (110, 220 and 340 µmol m−2 s−1): essentially, the LED tubes were fixed at both ends to adjustable chains allowing to customize the different heights above the crop canopy and reach the previously established irradiance levels. PPFD was measured at the plant canopy at five points (center and four edges) using a light sensor reader (Field ScoutSpectrum Technologies, Inc., Painfield, IL, USA).

2.2. Plant Growth Parameters

Ten random plants for each replicate and treatment were harvested at the base of hypocotyls at the “end of seedling stage” (9 days after sowing, DAS). Shoot length and fresh and % dry weight were recorded. The samples for dry weight determination were dried in a forced-air oven at 80 °C for 72 h. The resulting samples were weighed and frozen in liquid nitrogen and then stored at −80 °C for subsequent biochemical analysis.

2.3. Plant Extraction

Pure methanol solution was used for the extraction. The extraction protocol reported by Maggini et al. [57] was used with minor modifications. The frozen fresh tissue samples (0.03 g) were soaked with 1.5 mL extraction solvent in 3-mL tubes. The tubes were sonicated 30 min in an ice bath two times and stored overnight at −20 °C. After separation of the supernatant, the extraction was repeated on the pellet with 1.5 mL of fresh extraction solvent. The two supernatant aliquots were pooled and used for the subsequent analyses within a few days. All the parameters were expressed on a fresh weight (FW) basis.

2.4. Total Phenol Content

The determination of total phenols was carried out using the Folin–Ciocalteu phenol reagent reported by [58]. For the former assay, 100 μL methanol extract, 2.0 mL distilled water and 300 μL Folin–Ciocalteu phenol reagent were mixed in plastic test tubes. After four minutes, 7.5% sodium carbonate (1.6 mL) was added into the tubes and the solutions were kept 2 h at room temperature. The concentration of total phenols was determined by measuring the absorbance of the solutions at 765 nm, using standard gallic acid (0–500 mg L−1) for calibration, and expressing the results as mg gallic acid g−1 FW.

2.5. FRAP Antioxidant Capacity

The total antioxidant capacity was determined in the microgreen methanol solution by using the ferric reducing ability of plasma (FRAP) assay, as adapted by [59]. The FRAP reagent was freshly prepared immediately before the analyses and contained 2 mM ferric chloride and 1 mM TPTZ (2,4,6-tris(2-pyridyl)-s-triazine). The following solutions were mixed in a spectrophotometric cuvette: 0.25 M acetate buffer pH 3.6 (2.0 mL); FRAP reagent (900 μL); pure methanol extract (100 μL). A calibration curve was prepared with standard solutions containing ferrous ion (Fe(II); 0–1000 μM), obtained from ferrous ammonium sulfate. The absorbance was read at 593 nm and the results were expressed as μmol Fe (II) g−1 FW.

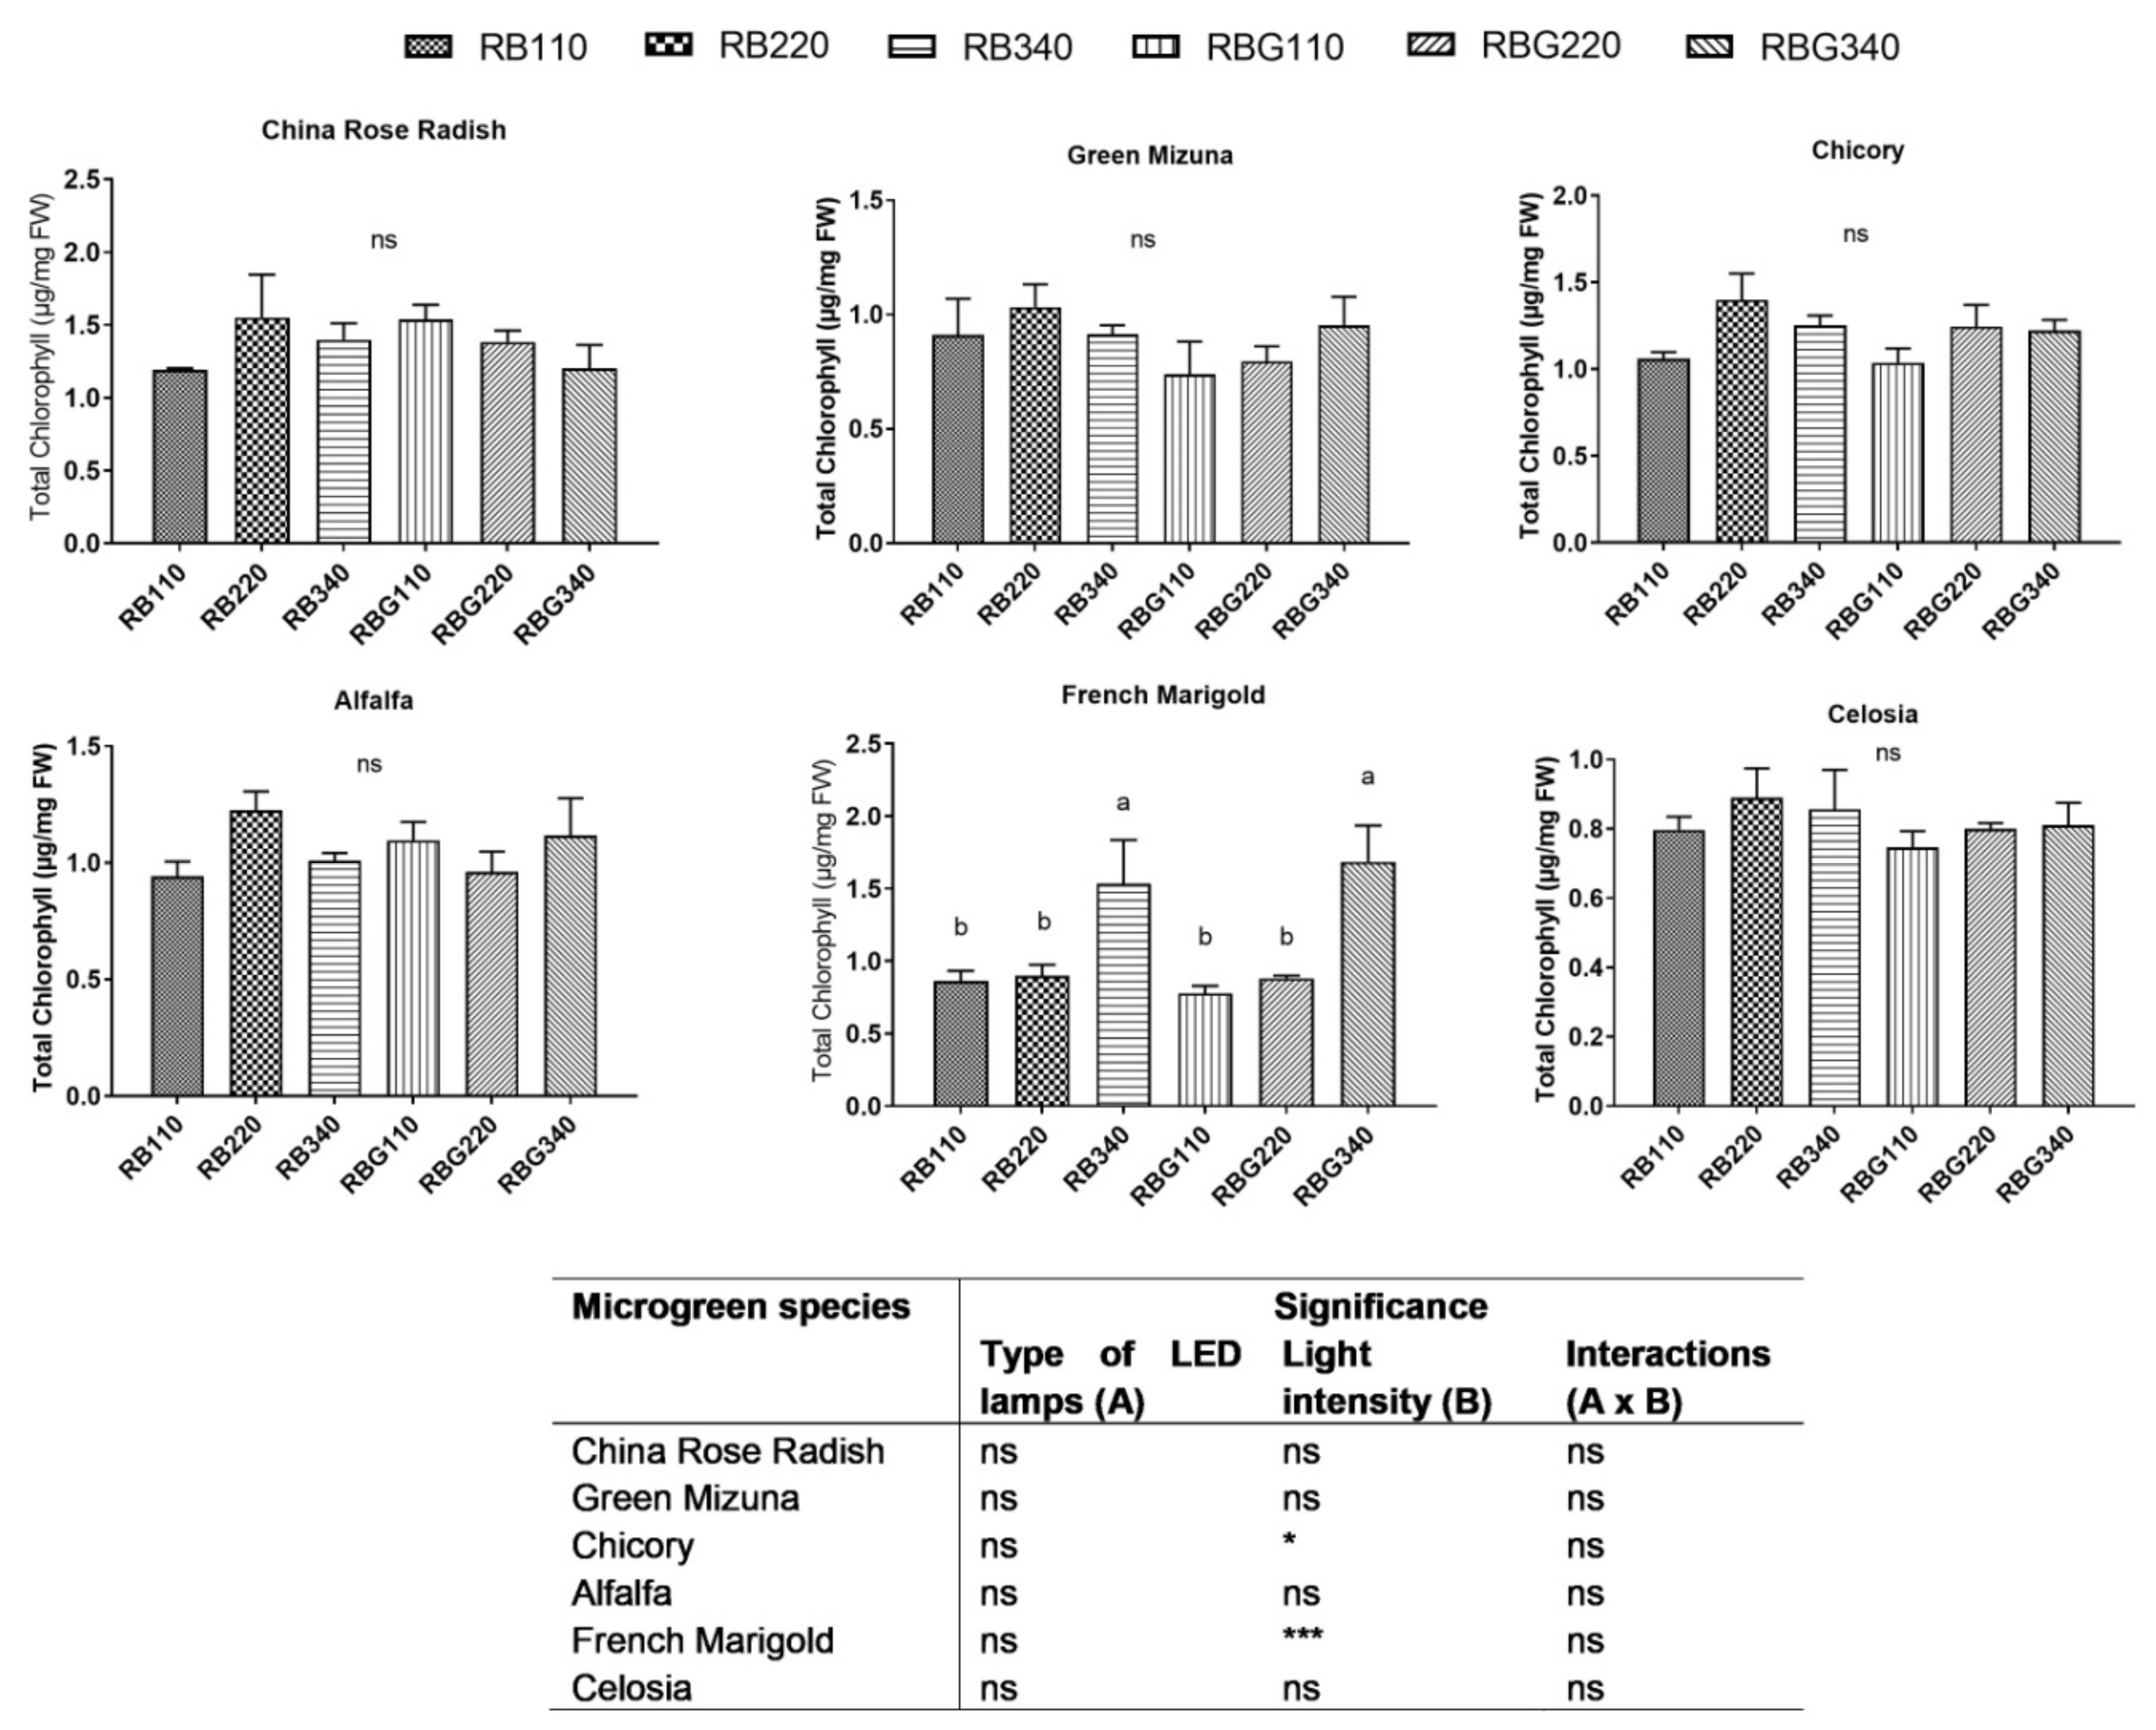
2.6. Chlorophyll and Carotenoid Content

The microgreen methanol extracts were reported above. Absorbance readings were measured at 665.2 and 652.4 nm for chlorophylls and 470 nm for total carotenoids. Pigment levels were calculated by Lichtenthaler’s formula [60] and expressed on a fresh weight basis of microgreen tissue.

2.7. Chroma Index

Just before harvesting, microgreen canopy color was measured for each plastic tray using an 8–10 mm-aperture Minolta CR-10 PLUS Chroma Meter (Minolta Camera Co. Ltd., Osaka, Japan) calibrated with a Minolta standard included and registered in the instrument. Measurements were obtained in the Commission internationale de l’eclairage CIELAB color space parameters: L* (lightness, ranging from 0 = black to 100 = white), a* [chroma component ranging from green (−60) to red (+60)], b* [chroma component ranging from blue (−60) to yellow (+60)]. From the recorded parameters a* and b* the chroma (C*), which denotes the overall color intensity (chromaticity), was calculated using the following formula (a2 + b2)1/2 [35].

2.8. Statistical Analysis

Statistical analysis was performed using PRISM 9 software (GraphPad Software, San Diego, CA, USA). All the parameters were subjected to analysis of variance (ANOVA) and t-test. Differences among means were determined with Tukey’s multiple comparison test at p <0.05. In order to compare the responses of different microgreen species under different irradiance levels (110, 220, 340 µmol m−2 s−1) and spectral combinations (RB and RGB) and the possible interaction between these factors, data were analyzed by two-way ANOVA. Where the interaction between the two factors light spectra and light intensity (A × B) was significant, data were subjected to one-way ANOVA, comparing all treatments with each other. On the contrary, where A × B interaction was not significant, the effect of light spectra (A) and light intensity (B) was evaluated separately using one-way ANOVA and t-test, respectively. Data are means of at least 10 independent biological samples obtained from two independent experiments.

3. Results

3.1. Effects of LED Light Environments on Growth Parameters

Examination of the effect of light quality and intensity on microgreen height was performed with a two-way ANOVA (Table 1). There was a significant interaction between the effects of light spectra and intensity (p < 0.0001). Simple main effects analysis showed that the height of all tested microgreens was significantly influenced by both light quality (p < 0.0001) and light quantity (p < 0.0001). In detail: China Rose Radish and Alfalfa plants showed the highest height at a light intensity of 110 µmol m−2 s−1 under both light spectra treatments (Table 1). The highest height in Green Mizuna, Chicory, and Celosia was reported for the plants that were grown under c110 µmol m−2 s−1 in an RBG light environment compared to an RB light treatment. The heights of French Marigold seedlings were also significantly and positively influenced when the seedlings were grown at light intensities of 110 and 340 µmol m−2 s−1 under RB, and with light intensities of 110 and 220 µmol m−2 s−1 under RGB. In all species the greatest height was measured under the 110 µmol m−2 s−1 light intensity in the RGB light environment (Table 1).
A two-way ANOVA revealed that there was not a statistically significant interaction between the effects of light quality and intensity on fresh weight (FW) in four of the six tested microgreen species (p > 0.05) (Table 1). Simple main effects analysis showed that FW was not significantly influenced by spectral changes (p > 0.05). Simple main effects analysis showed that light intensity did have a statistically significant effect on FW in three of the six microgreen species (p < 0.0001). In detail, China Rose Radish, Green Mizuna, and Celosia did not show any significant difference in terms of FW among different light intensities and between the light spectra used (Table 1, Supplementary Table S1). The FW of Chicory showed the highest values when the seedlings were grown with light intensities of 110 and 340 µmol m−2 s−1 under RB, and with light intensities of 340 µmol m−2 s−1 under RGB. The Alfalfa FW increased under 340 µmol m−2 s−1 in both LED lamps used, whereas an increased FW at light intensity of 340 µmol m−2 s−1 under RGB was observed in French Marigold (Table 1, Supplementary Table S1).
A two-way ANOVA revealed that there was not a statistically significant interaction between the effects of light quality and intensity on dry weight (DW) in five of the six tested microgreen species (p > 0.05) (Table 1). Simple main effects analysis showed that DW was not significantly influenced by spectral changes (p > 0.05). However, simple main effects showed that DW was significantly affected by light intensity (p < 0.01) suggesting a systematic increase of DW as a function of PPFD. Specifically, the dry weights (DW) in China Rose Radish, Green Mizuna, Chicory, and French Marigold were higher in both LED environments applied under both 220 and 340 µmol m−2 s−1 (Table 1, Supplementary Table S1). Alfalfa and Celosia plants showed a higher biomass accumulation under 340-RB (Table 1, Supplementary Table S1). In our study, DW of all six species was generally enhanced as the light intensity increased. On the other hand, FW of three of six species was less influenced by the effect of light intensity.
Overall, the growth parameters’ data revealed that microgreen growth responses to light intensity and light quality may be influenced by the different species.

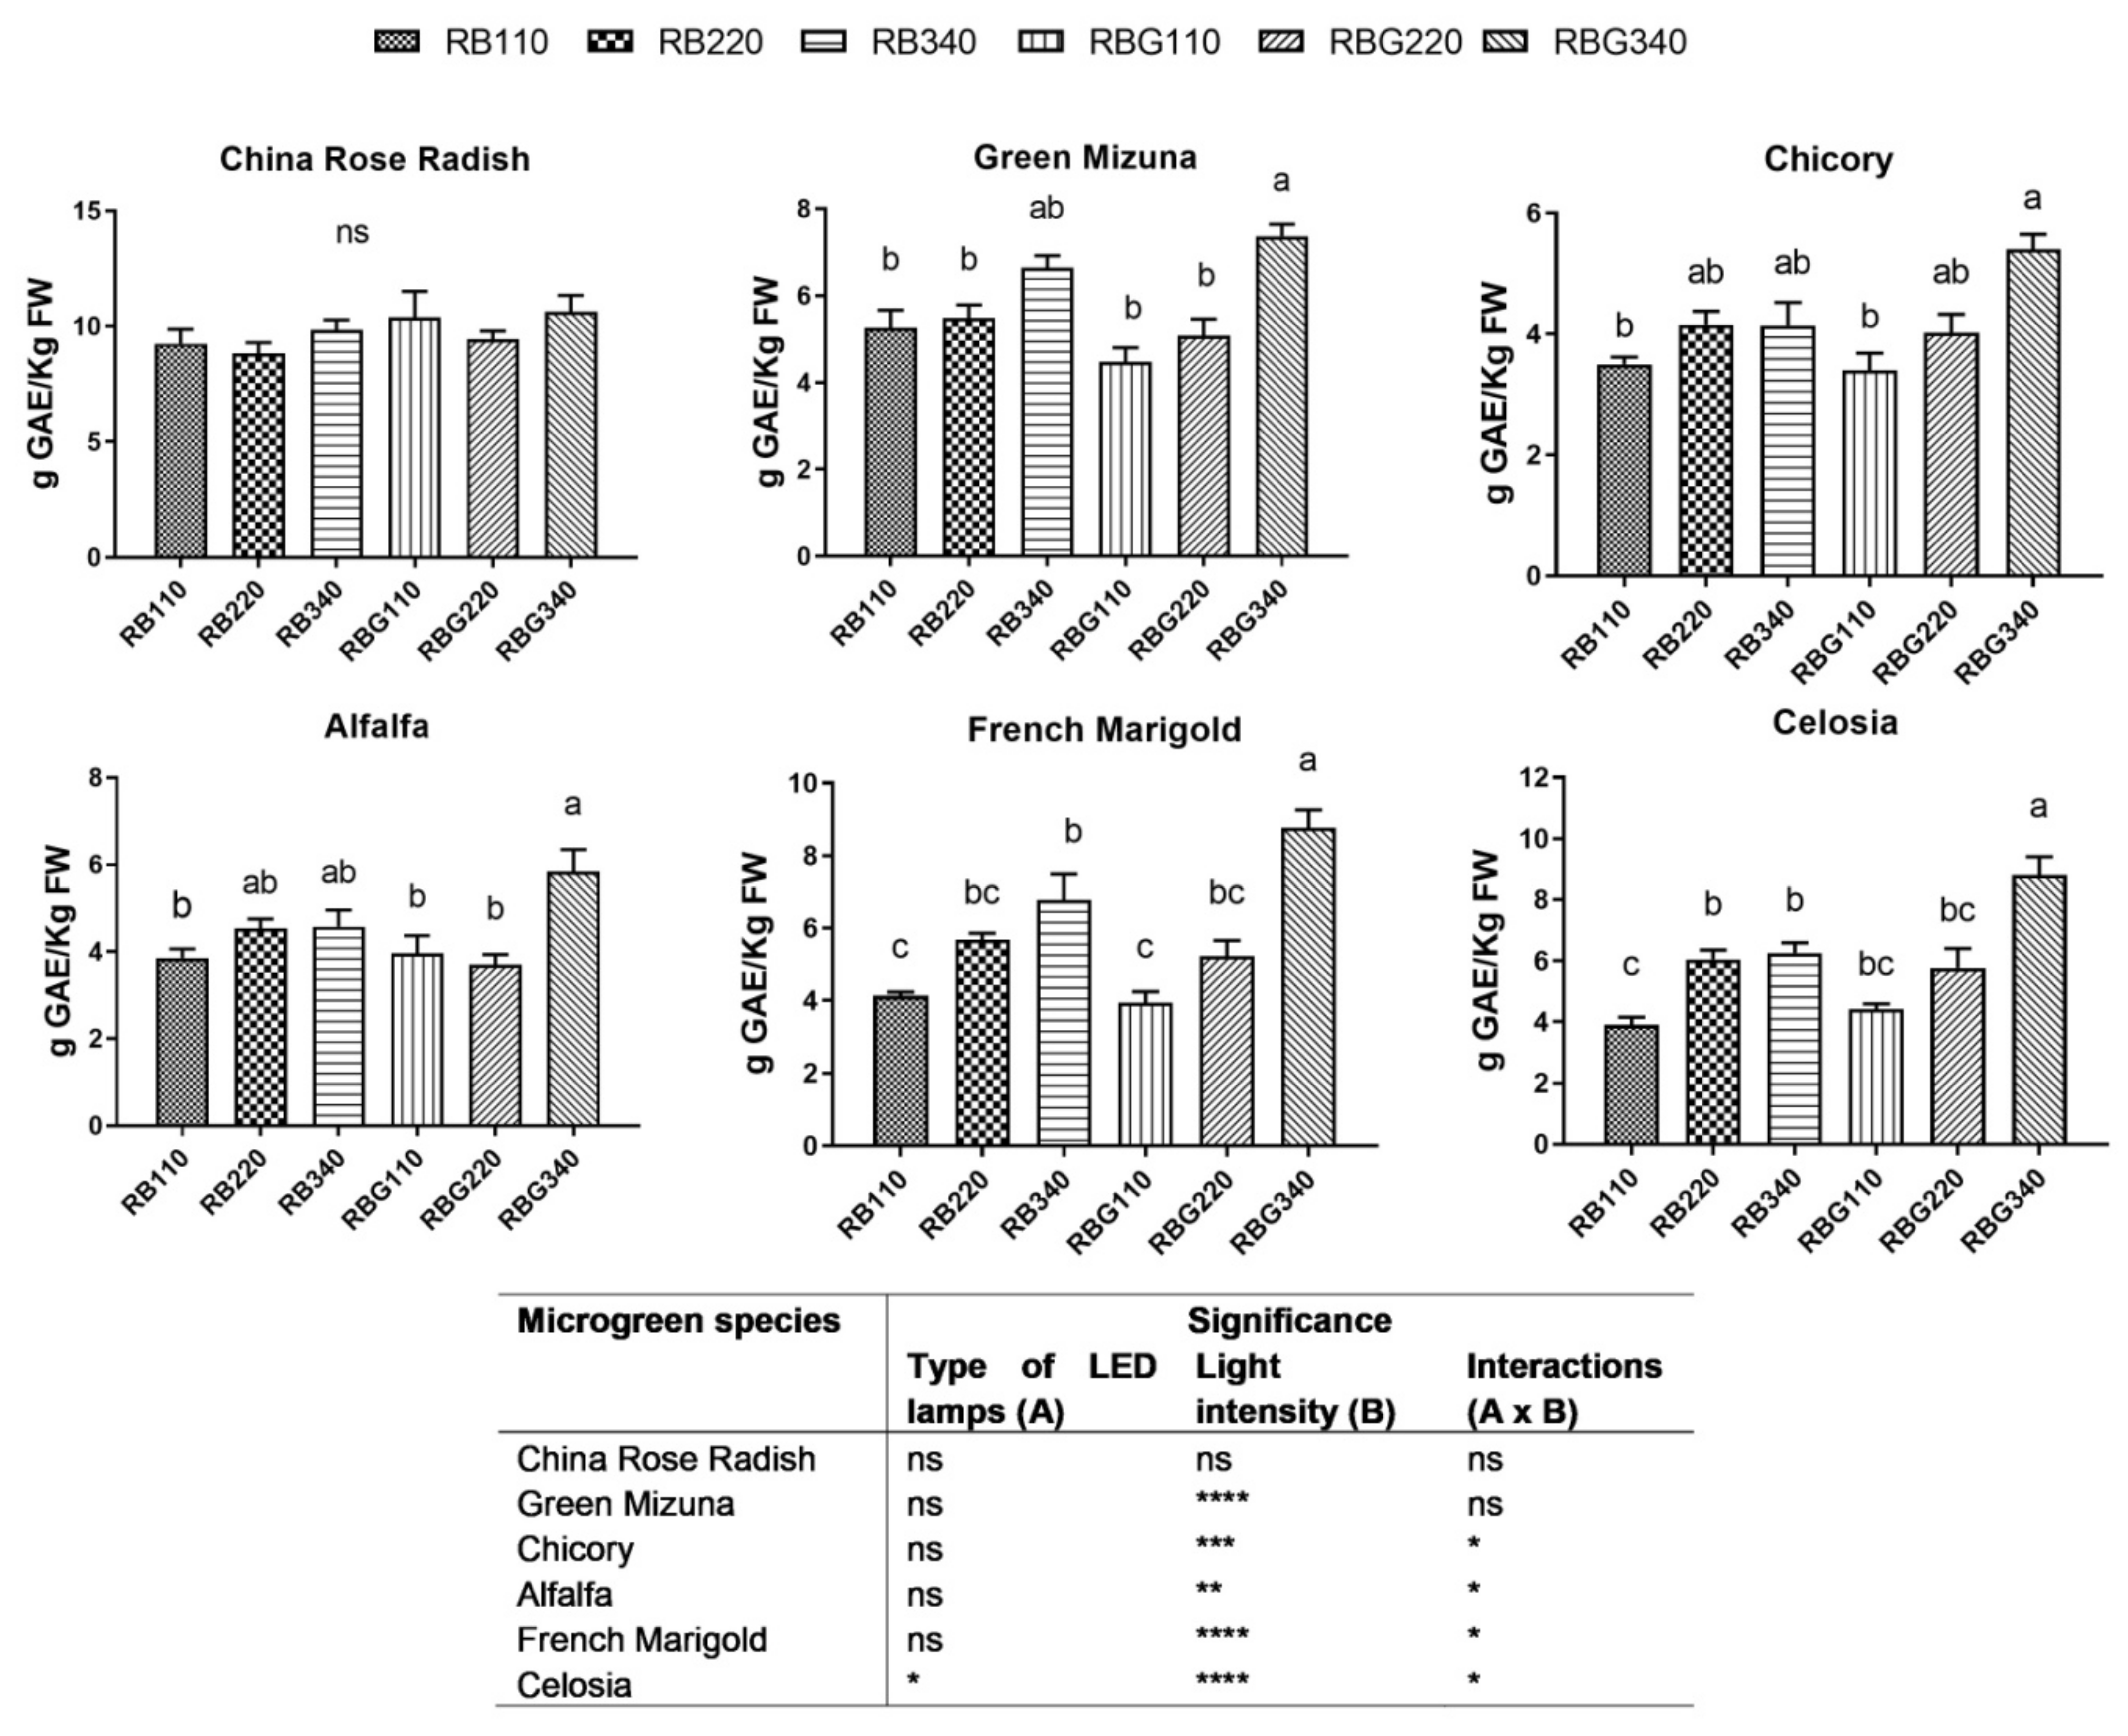
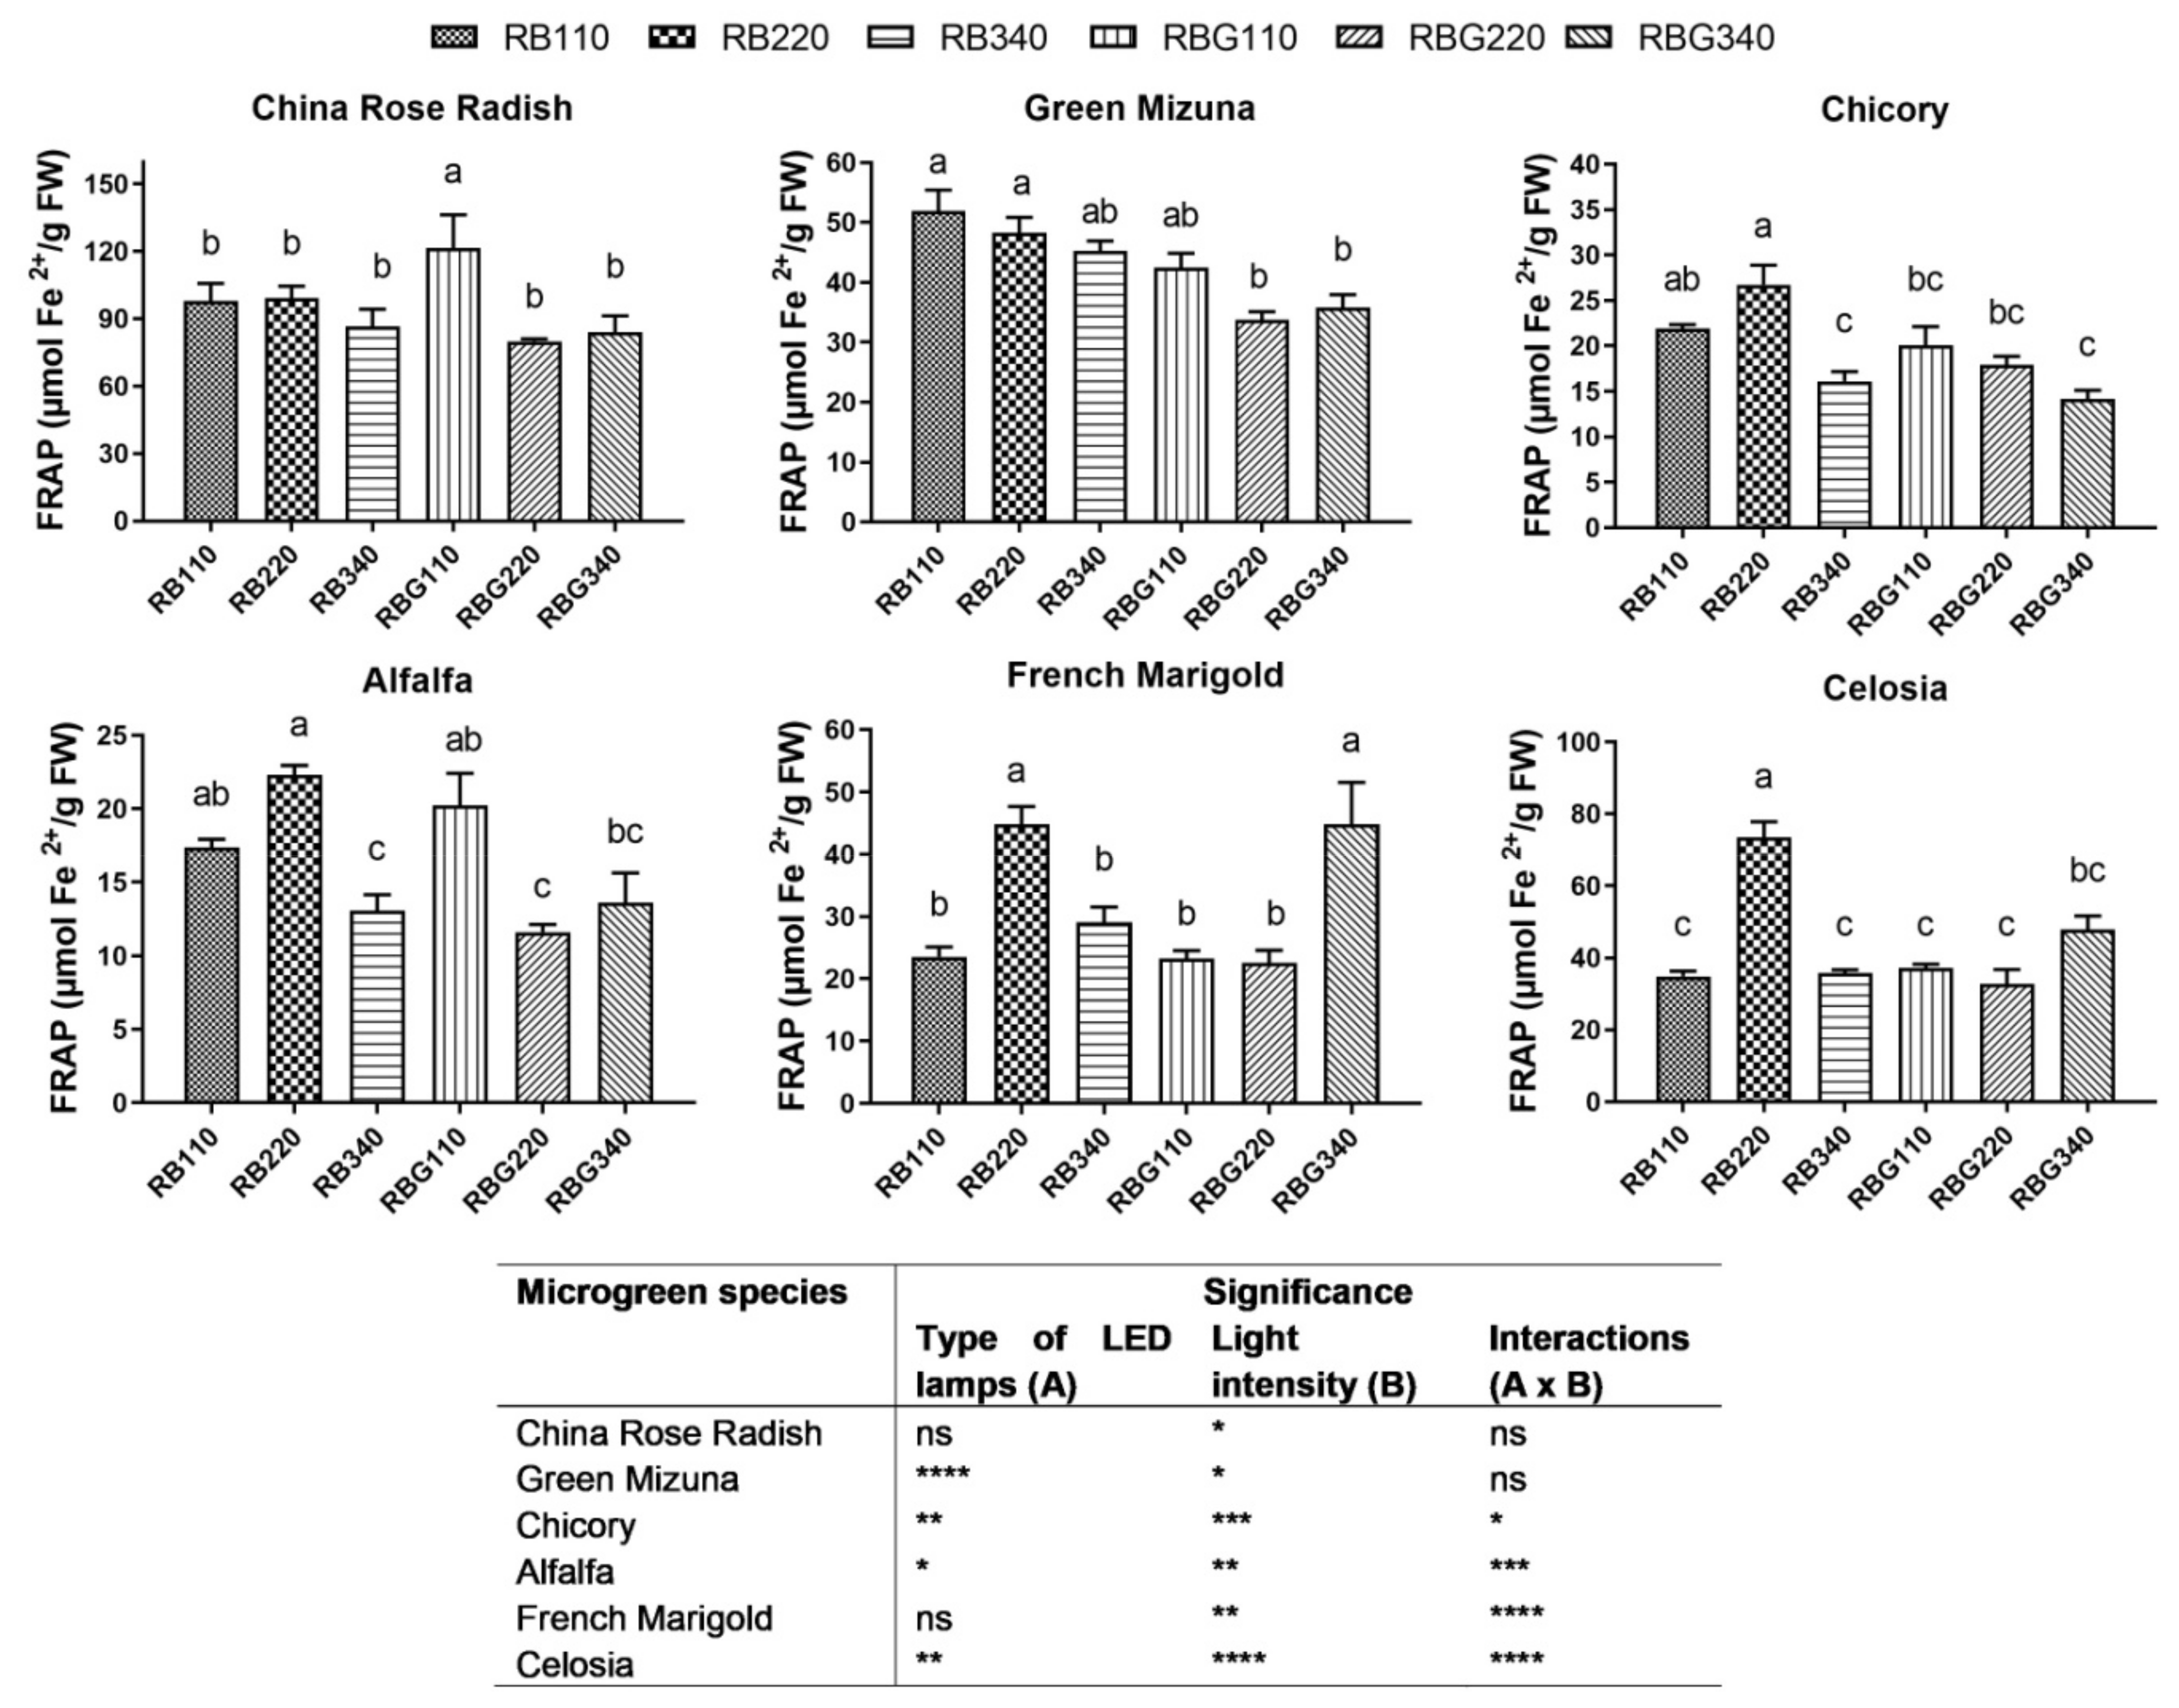
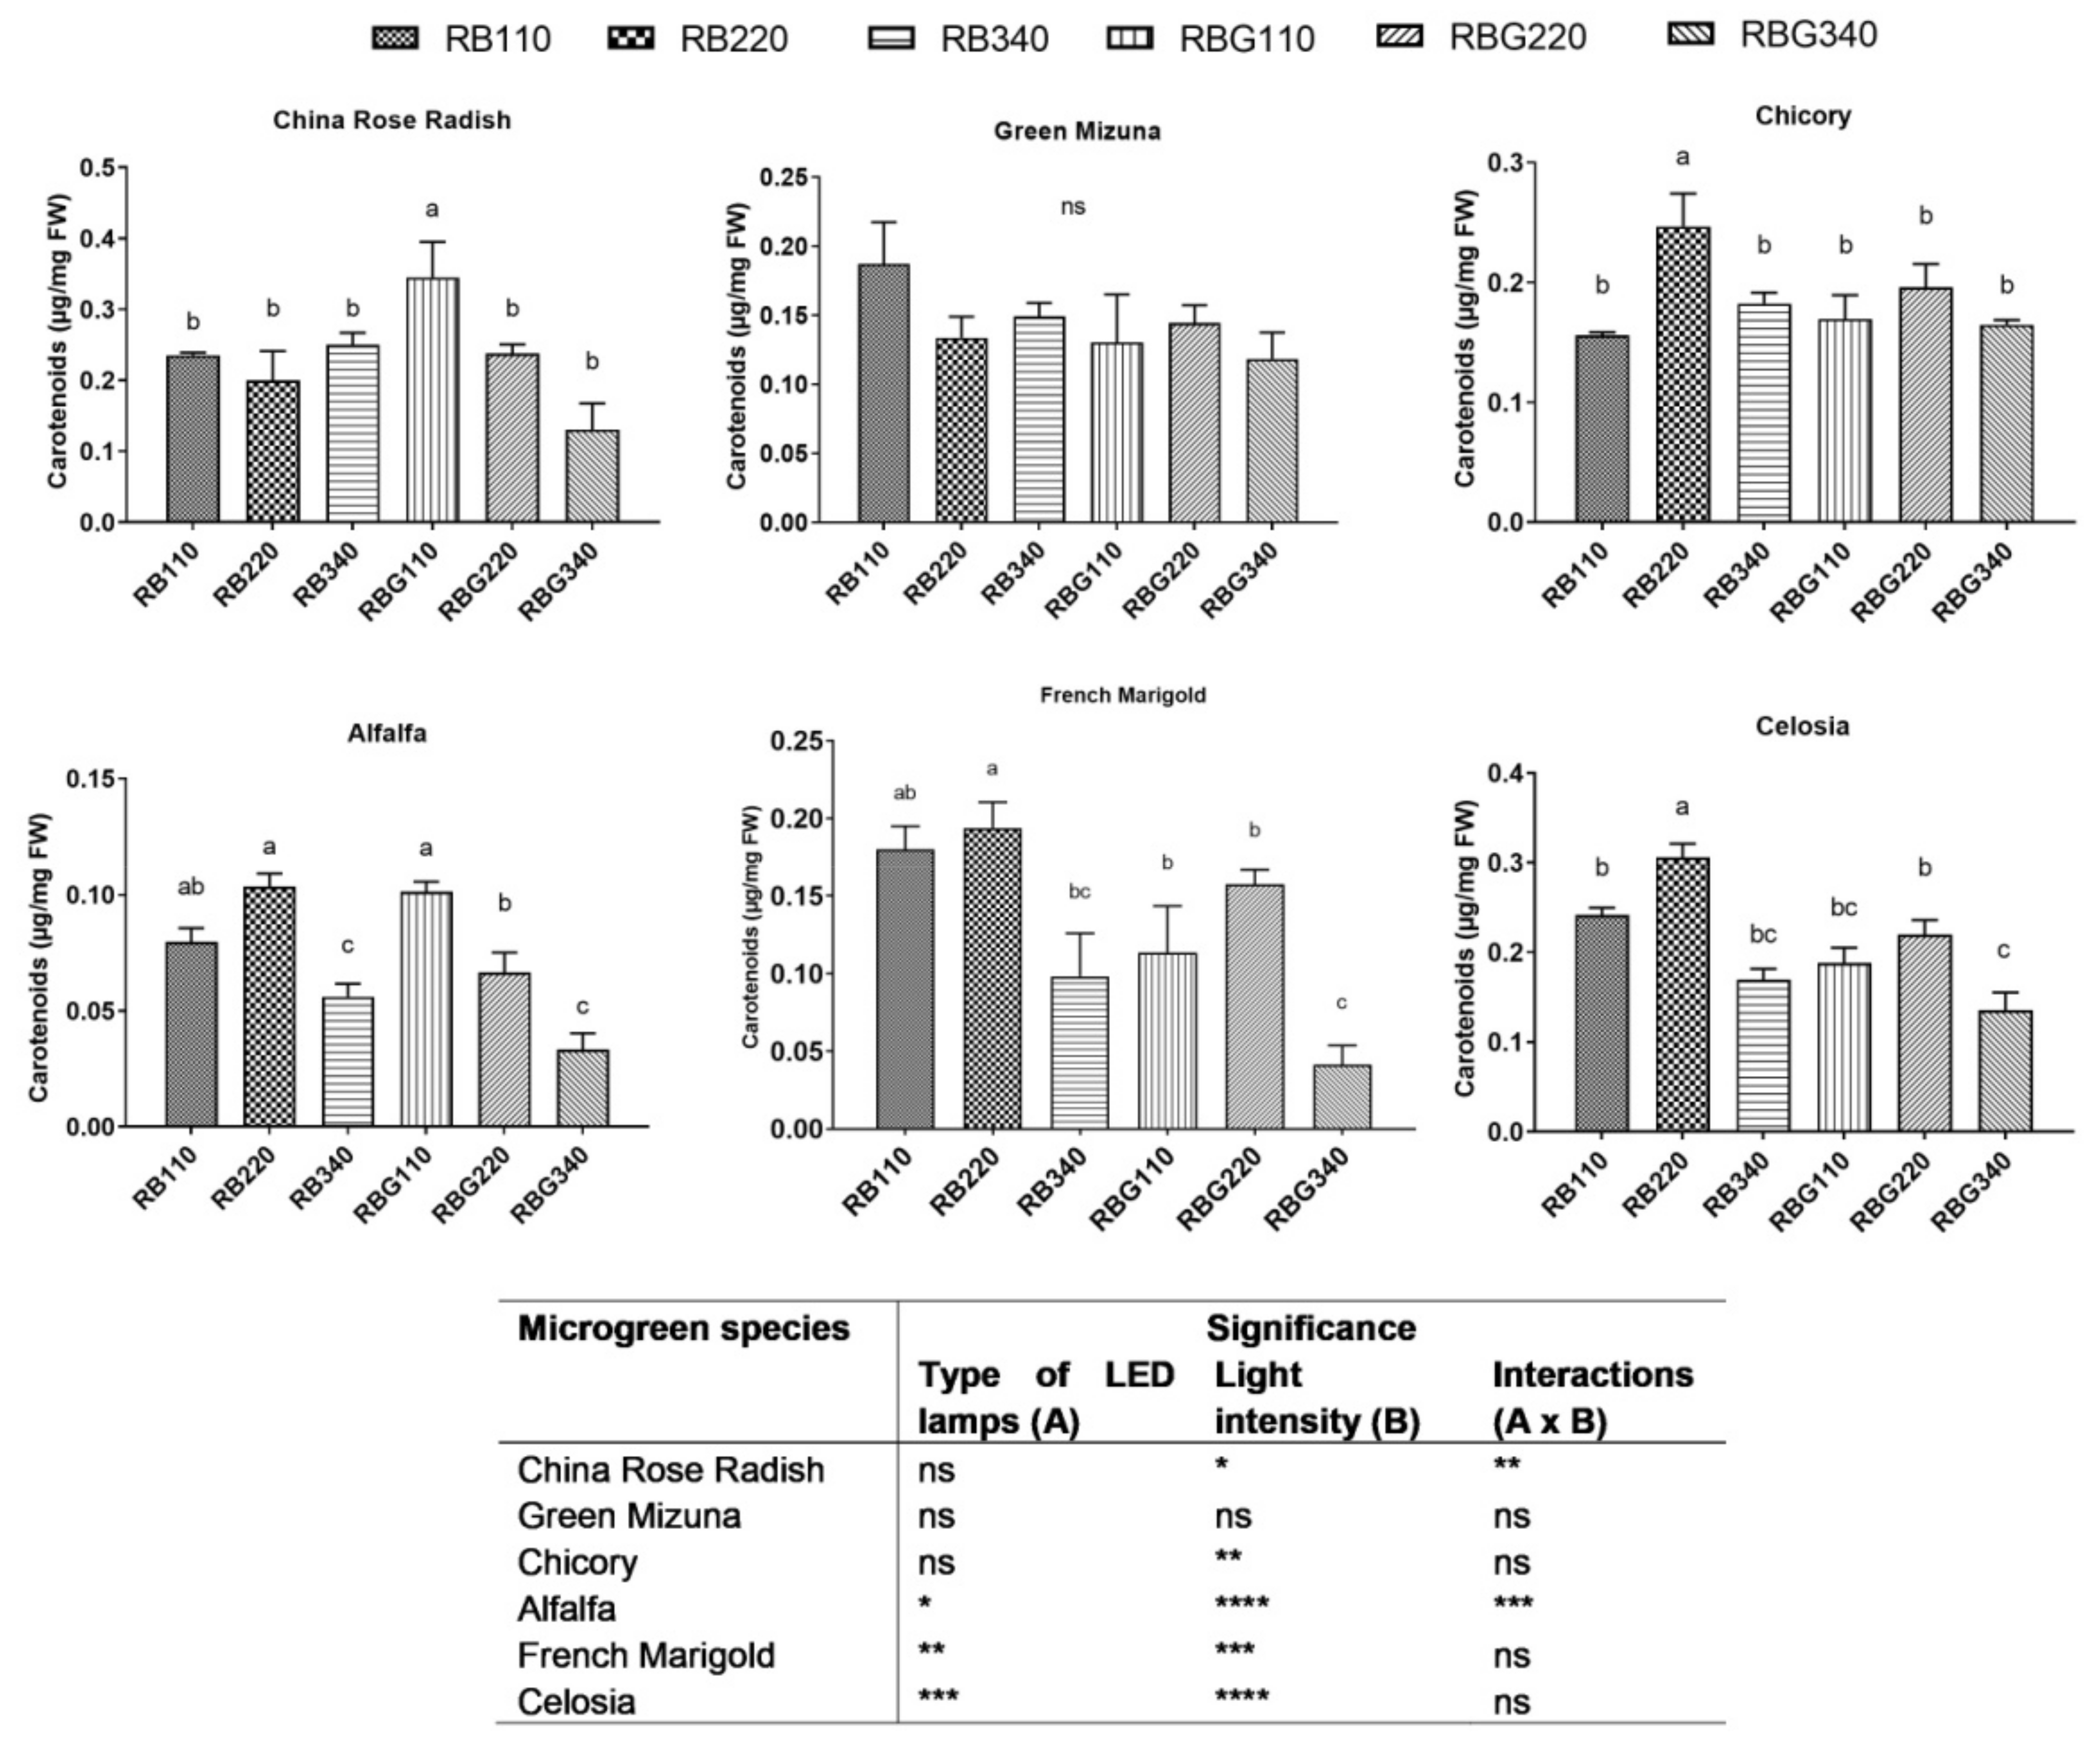
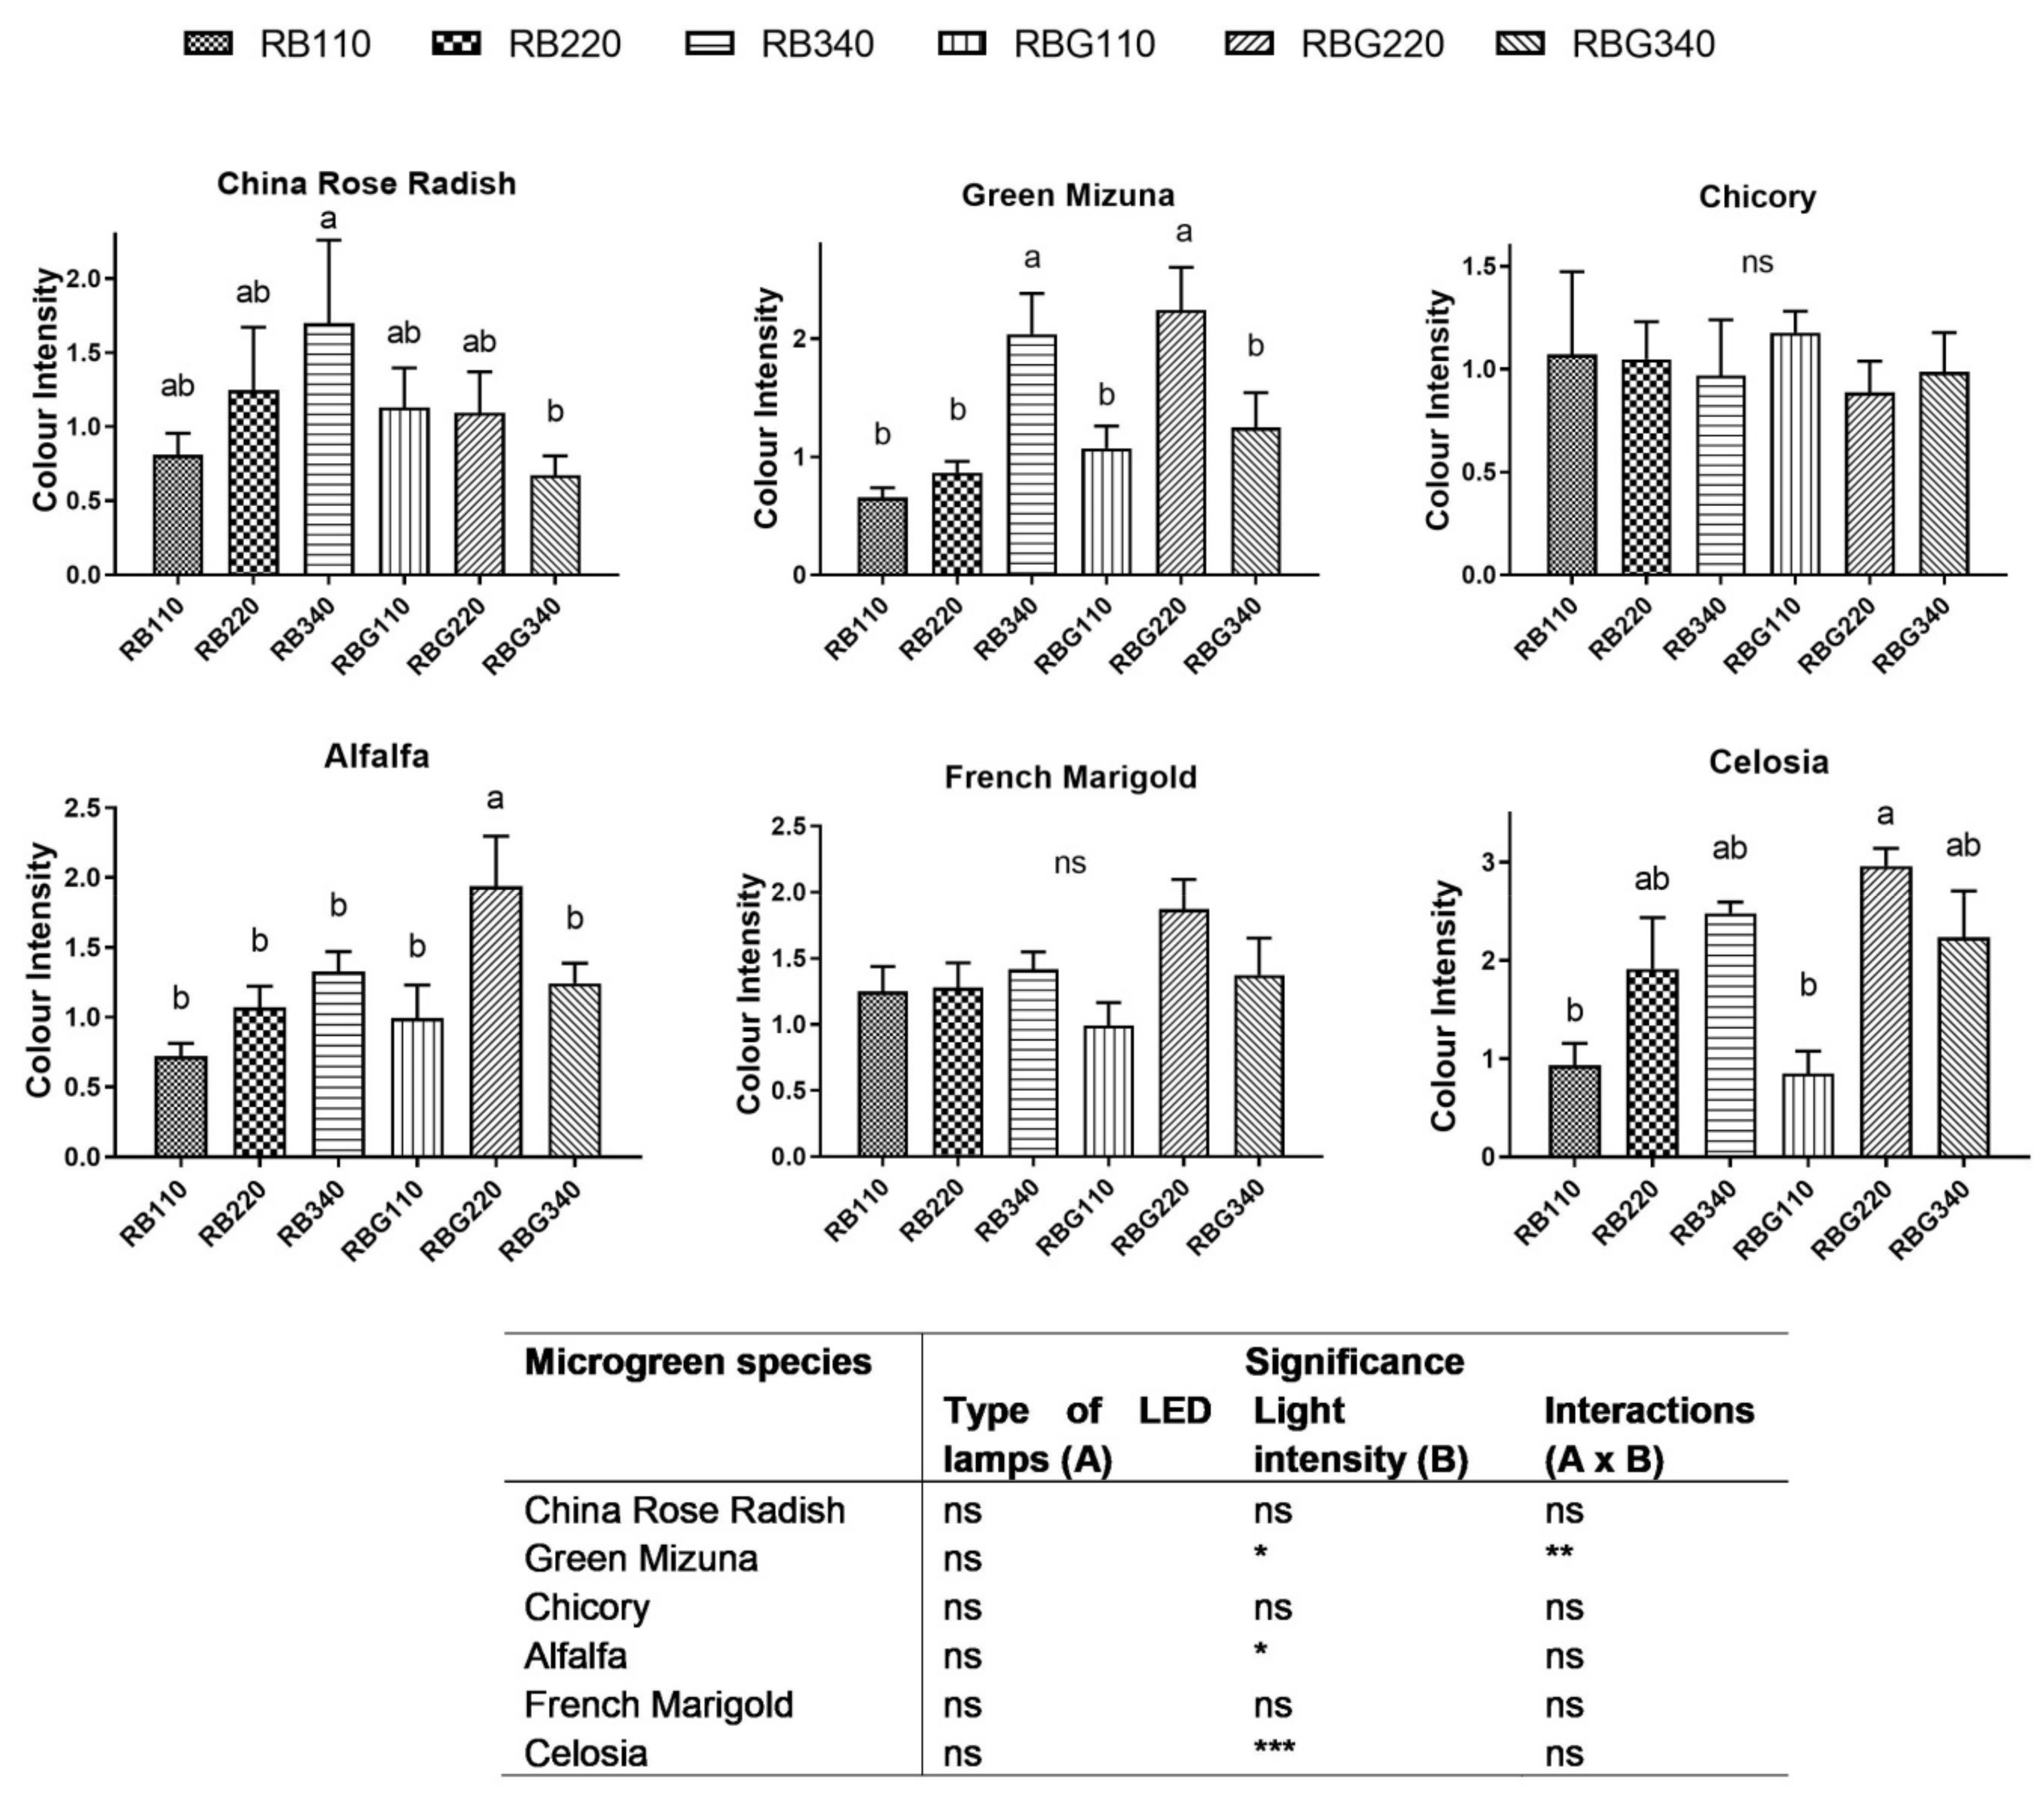
3.2. Effects of LED Light Environments on Nutraceutical Properties

Examination of the effect of light quality and intensity on total phenol content was performed with a two-way ANOVA (Figure 2). There was a significant interaction between the effects of light spectra and intensity (p < 0.05) in four of the six tested microgreen species. Simple main effects analysis showed that total phenols in five of the six tested microgreens were significantly influenced by light quantity (p < 0.001), but the phytochemical content was not affected by light spectra (p > 0.05) in five of the six tested microgreen species. Specifically, photosynthetic photon flux densities from 110 to 340 μmol m−2 s−1 had no apparent effect on the total phenols in China Rose Radish grown under both LED light environments (Figure 2, Supplementary Table S1). The highest total phenols were detected under RGB light environments at a light intensity of 340 µmol m−2 s−1 in five of the six microgreen species tested (Green Mizuna, Chicory, French Marigold, Alfalfa, and Celosia). The lowest phenol contents obtained in five of the six species were found under 110 and/or 220 µmol m−2 s−1.
A two-way ANOVA revealed that there was a statistically significant interaction between the effects of light quality and intensity on the antioxidant capacity measured by the FRAP method in four of the six tested microgreen species (p > 0.05) (Figure 3). Simple main effects analysis showed that antioxidant capacity was significantly influenced by both spectral changes (p < 0.05, in four of the six microgreen species) and light intensity (p < 0.05, in all species tested). In detail, China Rose Radish and Green Mizuna plants grown under 110-RBG LED environment showed significantly higher FRAP activity but no significant differences were observed when these two species were grown under RB light environments (Figure 3, Supplementary Table S1). Chicory, Alfalfa, French Marigold, and Celosia had higher antioxidant capacity especially under 220-RB. Additionally, Alfalfa and French Marigold also showed a higher antioxidant activity when the plants were grown under 110 and 340-RBG, respectively (Figure 3, Supplementary Table S1).
A two-way ANOVA showed that there was not a statistically significant interaction between the effects of light quality and intensity on total chlorophyll content (p > 0.05) (Figure 4). Simple main effects analysis showed that this content was not significantly influenced by spectral changes (p > 0.05). However, in two of the six microgreen tested species, simple main effects showed that total chlorophyll was significantly affected by light intensity (p < 0.05). Specifically, in China Rose Radish, Green Mizuna, Chicory, and Celosia plants the chlorophyll content, did not change under different LED light treatments and between different light intensities (Figure 4, Supplementary Table S1). Alfalfa and French Marigold increased the chlorophyll amount when grown under 220-RB and 340-RBG LED light treatments, respectively (Figure 4, Supplementary Table S1).
Statistically significant interactions between the effects of light quality and intensity on total carotenoid content were observed in two of the six microgreen species (p > 0.05) (Figure 5). Simple main effects analysis showed that this content was significantly influenced by both spectral changes (p < 0.05) in three of the six microgreen tested species, and irradiance levels (p < 0.05) in five of the six microgreen species. In detail, the highest carotenoid content in China Rose Radish was measured under 110-RBG LED light environments. No significant differences in carotenoid content were found in Green Mizuna in both light environments. In Alfalfa, French Marigold, and Celosia the carotenoid content showed significantly higher values when the plants were grown at a light intensity of 110 and 220 m−2 s−1 under both light spectra (Figure 5, Supplementary Table S1). The carotenoid levels in Chicory plants increased under 220-RB (Figure 5, Supplementary Table S1).
There was not a statistically significant interaction between the effects of light quality and intensity on chroma value (p > 0.05) (Figure 6) in five of the six microgreen species tested. Simple main effects analysis showed that chroma was not significantly affected by spectral changes (p > 0.05). However, in three of the six tested microgreen species, simple main effects showed that this value was significantly affected by light intensity (p < 0.05). In detail, China Rose Radish had a higher chroma value under RB light environments at a light intensity of 340 µmol m−2 s−1 (Figure 6, Supplementary Table S1). No significant differences in color intensity were found in Chicory plants grown in all the light environments evaluated. Green Mizuna, Alfalfa, and Celosia showed a higher color intensity when grown at a light intensity of 220 and 340 m−2 s−1 (Figure 6, Supplementary Table S1). Moreover, French Marigold plants grown under 220-RGB showed a significant increase in chroma value (Figure 6, Supplementary Table S1).

4. Discussion

The use of SS-LEDs as artificial lighting systems in the indoor environment has fundamental regulatory effects on morphogenesis, development, and nutritional quality of microgreen species and these effects are likely to be species specific [24,25,39]. Thus, the selection of the appropriate light intensity and wavelengths represent an environmental regulation tool to optimize the morphology and phytochemical composition of crops and produce high quality products based on market preferences [18,19]. Indeed, the growth traits and the phytochemical characteristics of six microgreens species were evaluated using three different irradiance levels and two spectral compositions.

4.1. Microgreen Growth and Yield Is Affected by Irradiance Level

The amount of light a plant receives during germination can greatly affect its growth and morphology. Generally, the increase in photosynthetic photon flux density is associated with an inhibition of elongation leading to a more compact growth in mature vegetative plant tissues [61,62]. In the current study, four of the six microgreen species tested showed a reduced hypocotyl elongation (i.e., height) under higher irradiance levels (340 μmol m−2 s−1 treatment) regardless of which spectral combination was applied (RG and RGB). However, the elongation length of Chicory and French Marigold microgreens represents an exception to this behavior. In these species an increase and no change in the length with increasing light intensity using the RB spectrum combination were observed and probably this behavior may likely be species specific. It is widely accepted that the plant hormone gibberellins have a prominent role in photomorphogenesis, serving as an intermediate between light condition and hypocotyl elongation response [63]. The endogenous content of GAs was significantly reduced by increasing the light intensity, leading to inhibition of hypocotyl elongation in Brassica seedlings [63]. Similar inhibition responses on this growth trait have been reported for kohlrabi, mizuna, and mustard microgreens grown under high light intensity [21,28]. Moreover, combining green light with RB lights, especially at light intensity of 220 and 340 μmol m−2 s−1 caused an increase in plant height in most of the tested species compared with plants grown under the RB light combination. Blue light in combination with red light has been previously reported to inhibit hypocotyl growth of many horticultural species, including microgreens [50,64]. However, the inclusion of green wavelengths in an RB lighting background has been shown to reverse the blue wavelength-induced inhibition of stem growth [50,54]. Evidence indicated that the mechanism responsible for this blue response is mediated by green light absorbed by cryptochrome which interrupts the signaling status of the cryptochrome blue light receptors [49,51] and it is also dependent on its green light percentage [50].
Plant growth is defined as an irreversible increase in the size of the plant driven by the photosynthetic process which leads to biomass accumulation. Thus, as expected in this study, as light intensity was increased, the majority of the tested microgreen species progressively accumulated higher biomass (DW), whereas, under the lowest light intensity the applied plants produced little dry weight. Unlike dry biomass, no significant differences among different light intensities and spectral combination were observed for FW in three of the six microgreen species, indicating a lower water content in the seedlings grown under high light intensity. Moreover, these findings implied that plant biomass accumulation (DW) is predominantly related to plant photosynthetic capacity rather than plant extension growth (i.e., plant height). Our findings are consistent with other studies of different microgreen species grown using a sole-source of LEDs under both low and high light intensities that shows a higher DW accumulation under increasing light intensity [21,29,64]. The carbon balance of crop plants is negatively affected by a decrease in light intensity. When the light intensity decreases, the photosynthetic process declines and therefore also the carbohydrate production, leading to an increase in carbohydrate demand while its production decreases [65]. Taken together, light intensity represents the main factor which drive the rates of the growth process leading to the rapid increase in biomass accumulation when the photosynthetic photon flux density is enhanced [66,67].

4.2. Microgreen Nutritional Quality Is Affected by Spectral Composition and Irradiance Levels

The metabolism of microgreens is affected by light quality and intensity, with the most recent studies demonstrating the efficiency of light-emitting diodes (LEDs) for modulating select groups of secondary metabolites and antioxidants and enriching the nutritional and functional properties of these seedling vegetables [24,35,53,68]
Previous studies indicated that monochromatic red light generally stimulates plant growth leading to an increase in biomass, leaf area, and plant height [69,70,71]. However, when this wavelength was applied alone it also caused negative effects on growth (abnormal leaf shape), phenolics, and antioxidant levels [72]. Although blue light does not have a direct effect on biomass accumulation, the mixture of red and blue has been reported to be more beneficial for many crops since blue wavelengths are known to be effective in promoting photosynthetic function and bioactive compounds’ accumulation [27,70,73,74]. In most cases, an increased proportion of blue light in RB LED arrays promoted the accumulation of phenolics, anthocyanins, and antioxidant capacity in several microgreen species [72,75,76]. The blue wavelength-induced phytochemical accumulation effect is supported by the increased activity of key enzymes in the synthesis of polyphenols such as phenylalanine ammonia-lyase (PAL), chalcone synthase (CHS), and dihydroflavonol 4-reductase (DFR) [69,77]
The two different spectral wavelengths used in this study contain a similar blue light portion (35 and 34% for RB and RGB light environment, respectively) and both light qualities showed very similar results in terms of microgreen development and yield, for the given species and light intensity used. The major effects of using different combined spectral bandwidths were found on microgreen phytochemical content and these responses varied across the species tested. The highest light intensity in combination with green light in the RB light environment significantly increased total phenol content in Chicory, French Marigold, Alfalfa, and Celosia, whereas RB LED treatment was found to be less effective in modulating phenol accumulation in these species. Green light is known to deeply penetrate the plant canopy unlike red or blue light, leading to an increase of carbon fixation and plant yield through the photosynthetic process [48,78,79] and the synthesis of endogenous substances through cryptochrome-dependent and cryptochrome-independent processes [27]. When green light is supplemental for RB LED combination, the effects on plant physiology are reported to be dependent on its proportions. At higher proportion (ranging from 22–44%), the inclusion of green wavelengths tends to reverse the blue wavelength-induced phytochemical accumulation in a range of plant species such as Arabidopsis, basil, and lettuce [49,52]. Instead, when green wavelengths were applied in a percentage ranging from 11 to 22% in RB lighting background was more effective than the combined use of RB light in enhancing the synthesis of bioactive compounds [55,56]. Considering that the blue light percentage basically did not change between the two LED light treatments applied in this study, the positive effect on total phenolics accumulation observed in the RGB light environment might be attributed to the inclusion of green wavelengths. A recent transcriptome analysis revealed that green light has a positive function in alleviating the detrimental effects of drought stress through the accumulation of ABA, triggering the expression of ABA biosynthesis-related genes and the upregulation of genes involved in the phenolic metabolic process [80]. Thus, in this study a stress response pathway through the accumulation of phenolic content may be driven by the inclusion of green light at the highest light intensity used.
Carotenoids are known to play a crucial role in the protection of the photosynthetic mechanism against photooxidative processes caused by excessive light energy by acting as scavengers of reactive oxygen species and their antioxidant properties are effective also in animal models and in humans [81,82,83,84]. In this study, among the two light spectral combinations (RB and RGB) and the three light intensities applied (110, 220, 340 μmol m−2 s−1), the total carotenoid content was in general enhanced by the lower and the middle light intensities and a similar trend was observed also for the antioxidant capacity measured with the FRAP method. Similar results of lower carotenoids accumulation under increasing light intensity have been found in mustard microgreens as the light intensity increased from 275 to 463 μmol m−2 s−1 [20,25,85]. However, with the role of carotenoids in plant photoprotection under higher photosynthetic photon flux density, its content would be expected to increase under higher photosynthetic photon flux density as evidence from other scientific works has shown [84,86,87]. A plausible hypothesis for these contradictory results related to carotenoid concentrations under various light intensities is suggested by Lefsrud et al. [88]. High light intensities may lead to the photodegradation of pigment molecules, such as carotenoids, and in combination with the dilution effect due to increases in water content and/or dry matter may show a decrease in carotenoid and antioxidant capacity.

5. Conclusions

There is widespread agreement that microgreen growth responses to light intensity and light quality vary among different microgreen species. In this study we investigated how different light spectra (RB and RGB) and intensity (110, 220, 340 µmol m−2 s−1) in combination affect the phytochemical contents and growth traits in six microgreen species.
The results reported here demonstrate the ability to manipulate the growth, development, and phytochemical concentrations within microgreen genotypes through changes in light intensity and quality. Broadly, five trends were apparent in the results for the majority of the microgreen species evaluated:
(i)
low and middle light intensity levels had a positive effect on antioxidant capacity and total carotenoid content;
(ii)
high levels of photosynthetically active photon flux (340 µmol m−2 s−1) increased dry biomass accumulation and enhanced the phenolic contents;
(iii)
the inclusion of green light in RB light background at light intensity of 220 and 340 μmol m−2 s−1 caused an increase in plant height compared with plants grown under the RB light combination
(iv)
the highest light intensity in combination with green light in the RB light environment was found more effective in increasing phenolic accumulation;
(v)
Light intensity and quality had significant interactive effects on elongation, total phenols, and antioxidant capacity.
Overall, these results suggest that the primary and secondary metabolism might modulate synergistically the responses, such as plant growth and phytochemical contents, in relation to light intensity and quality. In conclusion to achieve high yield with enriched phytonutrient concentrations the most suitable light environment condition for the majority of tested microgreens species was found to be the inclusion of 19% green light in RB light environments at an irradiance level of 340 µmol m−2 s−1.

Supplementary Materials

The following supporting information can be downloaded at: https://www.mdpi.com/article/10.3390/horticulturae8030217/s1, Figure S1: Relative spectral distributions of RB (A) and RGB (B) LED lighting treatments used in a closed-type microgreen production system; Table S1: Growth traits and phytochemical contents parameters, in which the interaction (A × B) between the two factors, irradiance levels (110, 220, 340 µmol m−2 s−1) and spectral combinations (RB and RGB) (A × B) was not significant. When there was not significant A × B interaction, the effect of light intensity (A) and light spectra (B) was evaluated separately using one-way ANOVA and t-test, respectively. Different letters on the rows within each light spectrum (RB and RGB) indicate significant differences among light intensity (Tukey’s test, p < 0.05). Pairwise comparisons between light spectra (RB and RGB) among different light intensity were performed using a two-tailed unpaired Student’s t tests, assuming equal variances (* p < 0.05; ** p < 0.01);

Author Contributions

Conceptualization, and methodology, A.T. and A.M.; formal analysis, investigation, M.O.; writing—original draft preparation, M.O. and A.T.; writing—review and editing, A.F. and L.I.; supervision, A.M. All authors have read and agreed to the published version of the manuscript.

Funding

This study was supported by the PhD Agrobiosciences program of Scuola Superiore Sant’Anna, 2019/2022.

Conflicts of Interest

The authors declare no conflict of interest.

References

  1. Di Gioia, F.; Leoni, B.; Santamaria, P. The Selection of the Species to Grow. In Microgreens; Di Gioia, F., Santamaria, P., Eds.; Ecologica: Bari, Italy, 2015; pp. 25–40.kkkk. [Google Scholar]
  2. Xiao, Z.; Lester, G.E.; Luo, Y.; Wang, Q. Assessment of Vitamin and Carotenoid Concentrations of Emerging Food Products: Edible Microgreens. J. Agric. Food Chem. 2012, 60, 7644–7651. [Google Scholar] [CrossRef] [PubMed]
  3. Zhang, Y.; Xiao, Z.; Ager, E.; Kong, L.; Tan, L. Nutritional quality and health benefits of microgreens, a crop of modern agriculture. J. Future Foods 2021, 1, 58–66. [Google Scholar] [CrossRef]
  4. Kyriacou, M.C.; Rouphael, Y.; Di Gioia, F.; Kyratzis, A.; Serio, F.; Renna, M.; De Pascale, S.; Santamaria, P. Micro-scale vegetable production and the rise of microgreens. Trends Food Sci. Technol. 2016, 57, 103–115. [Google Scholar] [CrossRef]
  5. Edmondson, J.L.; Cunningham, H.; Tingley, D.O.D.; Dobson, M.; Grafius, D.R.; Leake, J.R.; McHugh, N.; Nickles, J.; Phoenix, G.K.; Ryan, A.J.; et al. The hidden potential of urban horticulture. Nat. Food 2020, 1, 155–159. [Google Scholar] [CrossRef]
  6. Bulgari, R.; Negri, M.; Santoro, P.; Ferrante, A. Quality Evaluation of Indoor-Grown Microgreens Cultivated on Three Different Substrates. Horticulturae 2021, 7, 96. [Google Scholar] [CrossRef]
  7. Martin, M.; Molin, E. Environmental assessment of an urban vertical hydroponic farming system in Sweden. Sustainability 2019, 11, 4124. [Google Scholar] [CrossRef] [Green Version]
  8. Romeo, D.; Vea, E.B.; Thomsen, M. Environmental impacts of urban hydroponics in Europe: A case study in Lyon. Procedia CIRP 2018, 69, 540–545. [Google Scholar] [CrossRef]
  9. Khan, M.M.; Akram, M.T.; Janke, R.; Qadri, R.W.K.; Al-Sadi, A.M.; Farooque, A.A. Urban Horticulture for Food Secure Cities through and beyond COVID-19. Sustainability 2020, 12, 9592. [Google Scholar] [CrossRef]
  10. Corrado, G.; El-Nakhel, C.; Graziani, G.; Pannico, A.; Zarrelli, A.; Giannini, P.; Ritieni, A.; De Pascale, S.; Kyriacou, M.C.; Rouphael, Y. Productive and Morphometric Traits, Mineral Composition and Secondary Metabolome Components of Borage and Purslane as Underutilized Species for Microgreens Production. Horticulturae 2021, 7, 211. [Google Scholar] [CrossRef]
  11. Mir, S.A.; Shah, M.A.; Mir, M.M. Microgreens: Production, Shelf Life, and Bioactive Components. Crit. Rev. Food Sci. Nutr. 2016, 57, 2730–2736. [Google Scholar] [CrossRef]
  12. Butturini, M.; Marcelis, L. Vertical Farming in Europe: Present Status and Outlook. In Plant Factory: An Indoor Vertical Farming System for Efficient Quality Food Production; Kozai, T., Niu, G.G., Takagaki, M., Eds.; Elsevier: London, UK, 2020; pp. 77–91. [Google Scholar]
  13. Di Gioia, F.; Santamaria, P. Microgreens, Agrobiodiversity and Food Security. In Microgreens; Di Gioia, F., Santamaria, P., Eds.; Ecologica: Bari, Italy, 2015; pp. 7–23. [Google Scholar]
  14. AlShrouf, A. Hydroponics, aeroponic and aquaponic as compared with conventional farming. Am. Sci. Res. J. Eng. Technol. Sci. 2017, 27, 247–255. [Google Scholar]
  15. Sharma, N.; Acharya, S.; Kumar, K.; Singh, N.; Chaurasia, O. Hydroponics as an advanced technique for vegetable production: An overview. J. Soil Water Conserv. 2018, 17, 364. [Google Scholar] [CrossRef]
  16. Nicola, S.; Pignata, G.; Ferrante, A.; Bulgari, R.; Cocetta, G.; Ertani, A. Water use efficiency in greenhouse systems and its application in horticulture. AgroLife Sci. J. 2020, 9, 248–262. [Google Scholar]
  17. Khan, S.; Purohit, A.; Vadsaria, N. Hydroponics: Current and future state of the art in farming. J. Plant Nutr. 2020, 44, 1515–1538. [Google Scholar] [CrossRef]
  18. Despommier, D. Farming up the city: The rise of urban vertical farms. Trends Biotechnol. 2013, 31, 388–389. [Google Scholar] [CrossRef] [PubMed]
  19. Kozai, T.; Niu, G. Role of the Plant Factory with Artificial Lighting (PFAL) in Urban Areas. In Plant Factory; Kozai, T., Niu, G., Takagaki, M., Eds.; Academic Press: London, UK, 2020; pp. 7–34. [Google Scholar]
  20. Kraver, J.K.; Gerovac, J.R.; Lopez, R.G.; Kopsell, D.A. Light intensity and light quality from sole-source light-emitting diodes impact phytochemical concentrations within Brassica Microgreens. J. Am. Soc. Hortic. Sci. 2017, 142, 3–12. [Google Scholar] [CrossRef]
  21. Gerovac, J.R.; Craver, J.K.; Boldt, J.K.; Lopez, R.G. Light intensity and quality from sole-source light-emitting diodes impact growth, morphology, and nutrient content of Brassica microgreens. HortScience 2016, 51, 497–503. [Google Scholar] [CrossRef] [Green Version]
  22. Devlin, P.F.; Christie, J.M.; Terry, M.J. Many hands make light work. J. Exp. Bot. 2007, 58, 3071–3077. [Google Scholar] [CrossRef] [PubMed] [Green Version]
  23. Paradiso, R.; Proietti, S. Light-Quality Manipulation to Control Plant Growth and Photomorphogenesis in Greenhouse Horticulture: The State of the Art and the Opportunities of Modern Led Systems. J. Plant Growth Regul. 2021, 41, 742–780. [Google Scholar] [CrossRef]
  24. Turner, E.R.; Luo, Y.; Buchanan, R.L.A. Microgreen nutrition, food safety, and shelf life: A review. J. Food Sci. 2020, 85, 870–882. [Google Scholar] [CrossRef] [Green Version]
  25. Brazaitytė, A.; Sakalauskienė, S.; Samuolienė, G.; Jankauskienė, J.; Viršilė, A.; Novičkovas, A.; Sirtautas, R.; Miliauskienė, J.; Vaštakaitė, V.; Dabašinskas, L.; et al. The effects of LED illumination spectra and intensity on carotenoid content in Brassicaceae microgreens. Food Chem. 2015, 173, 600–606. [Google Scholar] [CrossRef] [PubMed]
  26. Singh, D.; Basu, C.; Meinhardt-Wollweber, M.; Roth, B. LEDs for energy efficient greenhouse lighting. Ren. Sustain. Ener. Rev. 2015, 49, 139–147. [Google Scholar] [CrossRef] [Green Version]
  27. Bian, Z.H.; Yang, Q.C.; Liu, W.K. Effects of light quality on the accumulation of phytochemicals in vegetables produced in controlled environments: A review. J. Sci. Food Agric. 2015, 95, 869–877. [Google Scholar] [CrossRef] [PubMed]
  28. Samuolienė, G.; Brazaitytė, A.; Jankauskienė, J.; Viršilė, A.; Sirtautas, R.; Novičkovas, A.; Sakalauskienė, S.; Sakalauskaitė, J.; Duchovskis, P. LED irradiance level affects growth and nutritional quality of Brassica microgreens. Cent. Eur. J. Biol. 2013, 8, 1241–1249. [Google Scholar] [CrossRef]
  29. Jones-Baumgardt, C.D.; Lewellyn, L.; Ying, Q.; Zheng, Y. Intensity of sole-source light emitting diodes affects growth, yield, and quality of Brassicaceae microgreens. HortScience 2019, 54, 1168–1174. [Google Scholar] [CrossRef] [Green Version]
  30. Ying, Q.; Kong, Y.; Jones-baumgardt, C.; Zheng, Y. Responses of yield and appearance quality of four Brassicaceae microgreens to varied blue light proportion in red and blue light-emitting diodes lighting. Sci. Hortic. 2020, 259, 108857. [Google Scholar] [CrossRef]
  31. Massa, G.D.; Kim, H.H.; Wheeler, R.M.; Mitchell, C.A. Plant productivity in response to LED lighting. HortScience 2008, 43, 1951–1956. [Google Scholar] [CrossRef]
  32. Goto, E. Plant production in a closed plant factory with artificial lighting. Acta Hortic. 2012, 956, 37–49. [Google Scholar] [CrossRef]
  33. Mark, G.L.; Dean, A.K.; Carl, E.S. Irradiance from distinct wavelength light-emitting diodes affect secondary metabolites in kale. HortScience 2008, 43, 2243–2244. [Google Scholar] [CrossRef] [Green Version]
  34. Lin, K.H.; Huang, M.Y.; Huang, W.D.; Hsu, M.-H.; Yang, Z.-W.; Yang, C.-M. The effects of red, blue and white light-emitting diodes (LEDs) on growth, development and edible quality of hydroponically grown lettuce (Lactuca sativa L. var. capitata). Sci. Hortic. 2013, 50, 86–91. [Google Scholar] [CrossRef]
  35. Alrifai, O.; Hao, X.; Marcone, M.F.; Tsao, R. Current review of the modulatory effects of LED lights on photosynthesis of secondary metabolites and future perspectives of microgreen vegetables. J. Agric. Food Chem. 2019, 67, 6075–6090. [Google Scholar] [CrossRef] [PubMed]
  36. Hernández, R.; Kubota, C. Physiological responses of cucumber seedlings under different blue and red photon flux ratios using LEDs Environ. Exp. Bot. 2016, 121, 66–74. [Google Scholar] [CrossRef]
  37. Snowden, M.C.; Cope, K.R.; Bugbee, B. Sensitivity of seven diverse species to blue and green light: Interactions with photon flux. PLoS ONE 2016, 11, e0163121. [Google Scholar] [CrossRef] [PubMed]
  38. Cope, K.R.; Bugbee, B. Spectral effects of three types of white light-emitting diodes on plant growth and development: Absolute versus relative amounts of blue light. HortScience 2013, 48, 504–509. [Google Scholar] [CrossRef]
  39. Bantis, F. Light Spectrum Differentially Affects the Yield and Phytochemical Content of Microgreen Vegetables in a Plant Factory. Plants 2021, 10, 2182. [Google Scholar] [CrossRef]
  40. Jones, M.A. Using light to improve commercial value. Hortic Res. 2018, 5, 47. [Google Scholar] [CrossRef] [Green Version]
  41. Dou, H.; Niu, G.; Gu, M.; Masabni, J.G. Effects of light quality on growth and phytonutrient accumulation of herbs under controlled environments. Horticulturae 2017, 3, 36. [Google Scholar] [CrossRef] [Green Version]
  42. Landi, M.; Zivcak, M.; Sytar, O.; Brestic, M.; Allakhverdiev, S.I. Plasticity of photosynthetic processes and the accumulation of secondary metabolites in plants in response to monochromatic light environments: A review. Biochim. Biophys. Acta Bioenerg. 2020, 1861, 148131. [Google Scholar] [CrossRef]
  43. Ying, Q.; Jones-Baumgardt, C.; Zheng, Y.; Bozzo, G. The Proportion of blue light from light-emitting diodes (RB light environment) alters microgreen phytochemical profiles in a species-specific manner. HortScience 2021, 56, 13–20. [Google Scholar] [CrossRef]
  44. Brazaitytė, A.; Jurga, M.; Viktorija, V.-K.; Rūta, S.; Kristina, L.; Pavelas, D.; Stanisław, M. Effect of Different Ratios of Blue and Red LED Light on Brassicaceae Microgreens under a Controlled Environment. Plants 2021, 10, 801. [Google Scholar] [CrossRef]
  45. Kyriacou, M.C.; El-Nakhel, C.; Pannico, A.; Graziani, G.; Soteriou, G.A.; Giordano, M.; Zarrelli, A.; Ritieni, A.; De Pascale, S.; Rouphael, Y. Genotype-specific modulatory effects of select spectral bandwidths on the nutritive and phytochemical composition of microgreens. Front. Plant Sci. 2019, 10, 1501. [Google Scholar] [CrossRef]
  46. Samuoliene, G.A.; Virisile, A.; Brazaityte, J.; Jankauskiee, S.; Sakalauskiene, V.; Va stakaite, A.; Novickovas, A.; Viskeliene, A.; Sasnauskas, A.; Duchovskis, P. Blue light dosage affects carotenoids and tocopherols in microgreens. Food Chem. 2017, 228, 50–56. [Google Scholar] [CrossRef] [PubMed]
  47. Ouzounis, T.; Parjikolaei, B.R.; Frette, X.; Rosenqvist, E.; Ottosen, C.-O. Predawn and high intensity application of supplemental blue light decreases the quantum yield of PSII and enhances the amount of phenolic acids, flavonoids, and pigments in Lactuca sativa. Front. Plant Sci. 2015, 6, 19. [Google Scholar] [CrossRef] [PubMed] [Green Version]
  48. Sun, J.; Nishio, J.N.; Vogelmann, T.C. Green light drives CO2 fixation deep within leaves. Plant Cell Physiol. 1998, 39, 1020–1026. [Google Scholar] [CrossRef]
  49. Zhang, T.; Folta, K.M. Green light signaling and adaptive response. Plant Signal. Behav. 2012, 7, 267–278. [Google Scholar] [CrossRef] [PubMed] [Green Version]
  50. Dou, H.; Niu, G.; Gu, M.; Masabni, J. Morphological and Physiological Responses in Basil and Brassica Species to Different Proportions of Red, Blue, and Green Wavelengths in Indoor Vertical Farming. J. Am. Soc. Hortic. Sci. 2020, 145, 267–278. [Google Scholar] [CrossRef]
  51. Folta, K.M.; Maruhnich, S.A. Green light: A signal to slow down or stop. J. Exp. Bot. 2007, 58, 3099–3111. [Google Scholar] [CrossRef]
  52. Dou, H.; Niu, G.; Gu, M. Photosynthesis, morphology, yield, and phytochemical accumulation in basil plants influenced by substituting green light for partial red and/or blue light. HortScience 2019, 54, 1769–1776. [Google Scholar] [CrossRef] [Green Version]
  53. Ying, Q.; Kong, Y.; Zheng, Y. Growth and appearance quality of four microgreen species under light-emitting diode lights with different spectral combinations. HortScience 2020, 55, 1399–1405. [Google Scholar] [CrossRef]
  54. Meng, Q.; Kelly, N.; Runkle, E.S. Substituting green or far-red radiation for blue radiation induces shade avoidance and promotes growth in lettuce and kale. Environ. Exp. Bot. 2019, 162, 383–391. [Google Scholar] [CrossRef]
  55. Orlando, M.; Trivellini, A.; Puccinelli, M.; Ferrante, A.; Incrocci, L.; Mensuali, A. Increasing the functional quality of Crocus sativus L. by-product (tepals) by controlling spectral composition. Hortic. Environ. Biotechnol. 2022. [Google Scholar] [CrossRef]
  56. Bian, Z.H.; Cheng, R.F.; Yang, Q.C.; Wang, J. Continuous Light from Red, Blue, and Green Light-emitting Diodes Reduces Nitrate Content and Enhances Phytochemical Concentrations and Antioxidant Capacity in Lettuce. J. Am. Soc. Hortic. Sci. 2016, 141, 186–195. [Google Scholar] [CrossRef] [Green Version]
  57. Maggini, R.; Galluzzo, F.; Pardossi, A. Effect of Nitrogen Nutrition on Growth and Accumulation of Caffeic Acid Deriva-tives in Hydroponically-Grown Echinacea Angustifolia DC. Var Angustifolia. Agrochimica 2013, 57, 22–30. [Google Scholar]
  58. Kang, H.-M.; Saltveit, M.E. Antioxidant Capacity of Lettuce Leaf Tissue Increases after Wounding. J. Agric. Food Chem. 2002, 50, 7536–7541. [Google Scholar] [CrossRef]
  59. Benzie, I.F.F.; Strain, J.J. The Ferric Reducing Ability of Plasma (FRAP) as a Measure of “Antioxidant Power”: The FRAP Assay. Anal. Biochem. 1996, 239, 70–76. [Google Scholar] [CrossRef] [PubMed] [Green Version]
  60. Lichtenthaler, H.K. Chlorophylls and Carotenoids: Pigments Ofphotosynthetic Biomembranes. Methods Enzymol. 1987, 148, 350–382. [Google Scholar] [CrossRef]
  61. Yeh, D.M.; Hsu, P.Y. Differential Growth and Photosynthetic Response of Selected Cultivars of English Ivy to Irradiance. J. Hortic. Sci. Biotechnol. 2004, 79, 633–637. [Google Scholar] [CrossRef]
  62. Zervoudakis, G.; Salahas, G.; Kaspiris, G.; Konstantopoulou, E. Influence of Light Intensity on Growth and Physiological Characteristics of Common Sage (Salvia Officinalis L.). Braz. Arch. Biol. Technol. 2012, 55, 89–95. [Google Scholar] [CrossRef]
  63. Potter, T.I.; Rood, S.B.; Zanewich, K.P. Light Intensity, Gibberellin Content and the Resolution of Shoot Growth in Brassica. Planta 1999, 207, 505–511. [Google Scholar] [CrossRef]
  64. Samuolienė, G.; Sirtautas, R.; Brazaitytė, A.; Sakalauskaite, J.; Sakalauskienė, S.; Duchovskis, P. The Impact of Red and Blue Light-Emitting Diode Illumination on Radish Physiological Indices. Cent. Eur. J. Biol. 2011, 6, 821–828. [Google Scholar] [CrossRef]
  65. Heins, R.D.; Liu, B.; Runkle, E.S. Regulation of Crop Growth and Development Based on Environmental Factors. Acta Hortic. 2000, 511, 13–22. [Google Scholar] [CrossRef]
  66. Yang, F.; Wang, X.; Liao, D.; Lu, F.; Gao, R.; Liu, W.; Yong, T.; Wu, X.; Du, J.; Liu, J.; et al. Yield Response to Different Planting Geometries in Maize-Soybean Relay Strip Intercropping Systems. Agron. J. 2015, 107, 296–304. [Google Scholar] [CrossRef]
  67. Wu, Y.; Gong, W.; Yang, F.; Wang, X.; Yong, T.; Yang, W. Responses to Shade and Subsequent Recovery of Soya Bean in Maize-Soya Bean Relay Strip Intercropping. Plant Prod. Sci. 2016, 19, 206–214. [Google Scholar] [CrossRef] [Green Version]
  68. Alrifai, O.; Mats, L.; Liu, R.; Zhu, H.; Hao, X.; Marcone, M.F.; Tsao, R. Characterization and Profiling of Polyphenolics of Brassica Microgreens by LC-HRMS/MS and the Effect under LED Light. J. Food Bioact. 2021, 14. [Google Scholar] [CrossRef]
  69. Heo, J.W.; Kang, D.H.; Bang, H.S.; Hong, S.G.; Chun, C.; Kang, K.K. Early growth, pigmentation, protein content, and phenylalanine ammonia-lyase activity of red curled lettuces grown under different lighting conditions. Korean J. Hortic. Sci. Technol. 2012, 30, 6–12. [Google Scholar] [CrossRef] [Green Version]
  70. Wang, H.; Gu, M.; Cui, J.; Shi, K.; Zhou, T.; Yu, J. Effects of light quality on CO2 assimilation, chlorophyll-fluorescence quenching, expression of Calvin cycle genes and carbohydrate accumulation in Cucumis sativus. J. Photochem. Photobiol. B 2009, 96, 30–37. [Google Scholar] [CrossRef]
  71. Wu, M.C.; Hou, C.Y.; Jiang, C.M.; Wang, Y.T.; Wang, C.Y.; Chen, H.H.; Chang, H.M. A novel approach of LED light radiation improves the antioxidant activity of pea seedlings. Food Chem. 2007, 101, 1753–1758. [Google Scholar] [CrossRef]
  72. Son, K.H.; Oh, M.M. Leaf shape, growth, and antioxidant phenolic compounds of two lettuce cultivars grown under various combinations of blue and red light-emitting diodes. HortScience 2013, 48, 988–995. [Google Scholar] [CrossRef]
  73. Johkan, M.; Shoji, K.; Goto, F.; Hashida, S.; Yoshihara, T. Blue light-emitting diode light irradiation of seedlings improves seedling quality and growth after transplanting in red leaf lettuce. HortScience 2010, 45, 1809–1814. [Google Scholar] [CrossRef] [Green Version]
  74. Ohashi-Kaneko, K.; Takase, N.; Kon, N.; Fujiwara, K.; Kurata, K. Effects of light quality on growth and vegetable quality in leaf lettuce, spinach and komatsuna. Environ. Control Biol. 2007, 45, 189–198. [Google Scholar] [CrossRef] [Green Version]
  75. Lobiuc, A.; Vasilache, V.; Oroian, M.; Stoleru, T.; Burducea, M.; Pintilie, O.; Zamfirache, M.M. Blue and red LED illumination improves growth and bioactive compounds contents in acyanic and cyanic Ocimum basilicum L. microgreens. Molecules 2017, 22, 2111. [Google Scholar] [CrossRef] [PubMed] [Green Version]
  76. Qian, H.; Liu, T.; Deng, M.; Miao, H.; Cai, C.; Shen, W.; Wang, Q. Effects of light quality on main health-promoting compounds and antioxidant capacity of chinese kale sprouts. Food Chem. 2016, 196, 1232–1238. [Google Scholar] [CrossRef] [PubMed]
  77. Meng, X.; Xing, T.; Wang, X. The role of light in the regulation of anthocyanin accumulation in Gerbera hybrida. Plant Growth Regulat. 2004, 44, 267–278. [Google Scholar] [CrossRef]
  78. Nishio, J. Why are higher plants green? Evolution of the higher plant photosynthetic pigment complement. Plant Cell Environ. 2000, 23, 539–548. [Google Scholar] [CrossRef]
  79. Terashima, I.; Fujita, T.; Inoue, T.; Chow, W.S.; Oguchi, R. Green light drives leaf photosynthesis more efficiently than red light in strong white light: Revisiting the enigmatic question of why leaves are green. Plant Cell Physiol. 2009, 50, 684–697. [Google Scholar] [CrossRef] [PubMed] [Green Version]
  80. Bian, Z.; Wang, Y.; Zhang, X.; Grundy, S.; Hardy, K.; Yanh, Q.; Lu, C. A Transcriptome Analysis Revealing the New Insight of Green Light on Tomato Plant Growth and Drought Stress Tolerance. Front. Plant Sci. 2021, 12, 2325. [Google Scholar] [CrossRef] [PubMed]
  81. Fiedor, J.; Burda, K. Potential Role of Carotenoids as Antioxidants in Human Health and Disease. Nutrients 2014, 6, 466–488. [Google Scholar] [CrossRef] [Green Version]
  82. Nisar, N.; Li, L.; Lu, S.; Khin, N.C.; Pogson, B.J. Carotenoid Metabolism in Plants. Mol. Plant 2015, 8, 68–82. [Google Scholar] [CrossRef] [Green Version]
  83. Swapnil, P.; Meena, M.; Singh, S.K.; Dhuldhaj, U.P.; Harish; Marwal, A. Vital Roles of Carotenoids in Plants and Humans to Deteriorate Stress with Its Structure, Biosynthesis, Metabolic Engineering and Functional Aspects. Curr. Plant Biol. 2021, 26, 100203. [Google Scholar] [CrossRef]
  84. Tuan, P.A.; Thwe, A.A.; Kim, Y.B.; Kim, J.K.; Kim, S.-J.; Lee, S.; Chung, S.-O.; Park, S.U. Effects of White, Blue, and Red Light-Emitting Diodes on Carotenoid Biosynthetic Gene Expression Levels and Carotenoid Accumulation in Sprouts of Tartary Buckwheat (Fagopyrum Tataricum Gaertn.). J. Agric. Food Chem. 2013, 61, 12356–12361. [Google Scholar] [CrossRef]
  85. Kopsell, D.A.; Pantanizopoulos, N.I.; Sams, C.E.; Kopsell, D.E. Shoot tissue pigment levels increase in ‘Florida Broadleaf’ mustard (Brassica juncea L.) microgreens following high light treatment. Sci. Hortic. 2012, 140, 96–99. [Google Scholar] [CrossRef]
  86. Samuoliene, G.; Sirtautas, R.; Brazaityte, A.; Duchovskis, P. LED lighting and seasonality affects antioxidant properties of baby leaf lettuce. Food Chem. 2012, 134, 1494–1499. [Google Scholar] [CrossRef] [PubMed]
  87. Demmig-Adams, B.; Gilmore, A.M.; Adams, W.W. In vivo functions of carotenoids in higher plants. FASEB J. 1996, 10, 403–412. [Google Scholar] [CrossRef] [PubMed]
  88. Lefsrud, M.G.; Kopsell, D.A.; Kopsell, D.E.; Curran-Celentano, J. Irradiance Levels Affect Growth Parameters and Carotenoid Pigments in Kale and Spinach Grown in a Controlled Environment. Physiol. Plant. 2006, 127, 624–631. [Google Scholar] [CrossRef]
Figure 1. Microgreen species used in this study.
Horticulturae 08 00217 g001
Figure 2. Total phenol content from six microgreen species affected by different light environments. Data are shown as means with at least five independent biological replicates and error bars indicate standard error (SE). Data were subjected to two-way analysis of variance and differences were analyzed by Tukey’s post-hoc. Different letters denote significant differences at p < 0.05. Levels of significance of the parameters assessed for each microgreen species considered where: ns, *, **, ***, ****, are not significant, significance at p < 0.05, 0.01, 0.001, and 0.0001 respectively. When there was not significant A × B interaction, the effect of light spectra (A) and light intensity (B) was evaluated separately using one-way ANOVA and t-test, respectively (Supplementary Table S1). Different letters on the histograms within each light spectrum (RB and RGB) indicate significant differences among light intensity (Tukey’s test, p < 0.05).
Horticulturae 08 00217 g002
Figure 3. Reducing capacity of extracts from six microgreen species affected by different light environments determined by FRAP test. Data are shown as means with at least five independent biological replicates and error bars indicate standard error (SE). Data were subjected to two-way analysis of variance and differences were analyzed by Tukey’s post-hoc. Different letters denote significant differences at p < 0.05. Levels of significance of the parameters assessed for each microgreen species considered where: ns, *, **, ***, ****, are not significant, significance at p < 0.05, 0.01, 0.001, and 0.0001 respectively. When there was not significant A × B interaction, the effect of light spectra (A) and light intensity (B) was evaluated separately using one-way ANOVA and t-test, respectively (Supplementary Table S1). Different letters on the histograms within each light spectrum (RB and RGB) indicate significant differences among light intensity (Tukey’s test, p < 0.05).
Horticulturae 08 00217 g003
Figure 4. Total chlorophyll content from six microgreen species affected by different light environments. Data are shown as means with at least five independent biological replicates and error bars indicate standard error (SE). Data were subjected to two-way analysis of variance and differences were analyzed by Tukey’s post-hoc. Different letters denote significant differences at p < 0.05. Levels of significance of the parameters assessed for each microgreen species considered where: ns, *, ***, are not significant, significance at p < 0.05, and 0.001 respectively. When there was not significant A × B interaction, the effect of light spectra (A) and light intensity (B) was evaluated separately using one-way ANOVA and t-test, respectively (Supplementary Table S1). Different letters on the histograms within each light spectrum (RB and RGB) indicate significant differences among light intensity (Tukey’s test, p < 0.05).
Horticulturae 08 00217 g004
Figure 5. Total carotenoids content from the six microgreen species affected by different light environments. Data are shown as means with at least five independent biological replicates and error bars indicate standard error (SE). Data were subjected to two-way analysis of variance and differences were analyzed by Tukey’s post-hoc. Different letters denote significant differences at p < 0.05. Levels of significance of the parameters assessed for each microgreen species considered where: ns, *, **, ***, ****, are not significant, significance at p < 0.05, 0.01, 0.001, and 0.0001 respectively. When there was not significant A × B interaction, the effect of light spectra (A) and light intensity (B) was evaluated separately using one-way ANOVA and t-test, respectively (Supplementary Table S1). Different letters on the histograms within each light spectrum (RB and RGB) indicate significant differences among light intensity (Tukey’s test, p < 0.05).
Horticulturae 08 00217 g005
Figure 6. Chroma index from the six microgreen species affected by different light environments. Data are shown as means with at least five independent biological replicates and error bars indicate standard error (SE). Data were subjected to two-way analysis of variance and differences were analyzed by Tukey’s post-hoc. Different letters denote significant differences at p < 0.05. Levels of significance of the parameters assessed for each microgreen species considered where: ns, *, **, *** are not significant, significance at p < 0.05, 0.01, 0.001, and 0.0001 respectively. When there was not significant A × B interaction, the effect of light spectra (A) and light intensity (B) was evaluated separately using one-way ANOVA and t-test, respectively (Supplementary Table S1). Different letters on the histograms within each light spectrum (RB and RGB) indicate significant differences among light intensities (Tukey’s test, p < 0.05).
Horticulturae 08 00217 g006
Table 1. Plant growth parameters from six microgreen species affected by different light environments. Values are mean ± SE (n =10 plants). Data were subjected to two-way analysis of variance with light spectra (RB and RGB) and light intensity (110, 220, 340 µmol m−2 s−1) as variables and differences were analyzed by Tukey’s post-hoc. Different letters within each row denote significant differences at p < 0.05. Height (H); microgreens fresh weight (FW); microgreens dry weight (DW). Levels of significance of the parameters assessed for each microgreen species considered where: ns, *, **, ***, ****, are not significant, significance at p < 0.05, 0.01, 0.001, and 0.0001 respectively. When there was not significant A × B interaction, the effect of light spectra (A) and light intensity (B) was evaluated separately using one-way ANOVA and t-test, respectively (Supplementary Table S1). Different letters on the rows within each light spectrum (RB and RGB) indicate significant differences among light intensity (Tukey’s test, p < 0.05).
H (cm)
PPFD (µmol m−2 s−1)
RBRBGSignificance
110220340110220340Light Spectra (A)Light Intensity (B)Interaction (A × B)
China Rose Radish5.22 ± 0.05 a3.77 ± 0.04 c3.89 ± 0.03 c5.15 ± 0.03 a4.43 ± 0.06 b4.42 ± 0.05 b************
Green Mizuna1.99 ± 0.04 b1.48 ± 0.02 d1.28 ± 0.02 e2.47 ± 0.03 a1.54 ± 0.03 d1.79 ± 0.02 c************
Chicory1.01 ± 0.02 c0.78 ± 0.01 d1.35 ± 0.02 b1.86 ± 0.04 a1.31 ± 0.01 b1.24 ± 0.01 b************
Alfalfa2.19 ± 0.05 a1.63 ± 0.02 d1.67 ± 0.02 d2.24 ± 0.04 a2.02 ± 0.01 b1.87 ± 0.02 c************
French Marigold2.04 ± 0.02 a1.55 ± 0.01 c2.06 ± 0.03 a2.12 ± 0.02 a2.03 ± 0.03 a1.93 ± 0.02 b************
Celosia1.91 ± 0.01 b1.44 ± 0.01 e1.71 ± 0.02 c2.04 ± 0.03 a1.73 ± 0.01 c1.60 ± 0.02 d************
FW (g)
PPFD (µmol m−2 s−1)
RBRBG
110220340110220340
China Rose Radish15.00 ± 1.1011.00 ± 0.5713.50 ± 0.5010.53 ± 1.0512.03 ± 1.0514.43 ± 1.41nsns*
Green Mizuna4.56 ± 0.52 a3.87 ± 0.23 b3.63 ± 0.24 a4.63 ± 0.26 b 3.90 ± 0.17 b4.70 ± 0.31 ansnsns
Chicory3.00 ± 0.05 a1.90 ± 0.20 b3.13 ± 0.32 a2.67 ± 0.18 b2.57 ± 0.07 b3.33 ± 0.12 ans***ns
Alfalfa5.07 ± 0.34 ab4.00 ± 0.20 b6.10 ± 0.06 a3.20 ± 0.25 b5.27 ± 0.21 ab5.73 ± 0.43 ans*******
French Marigold2.40 ± 0.463.10 ± 0.153.27 ± 0.881.83 ± 0.26 b2.83 ± 0.35 ab4.20 ± 0.67 ans*ns
Celosia *1.10 ± 0.120.80 ± 0.060.87 ± 0.181.07 ± 0.030.83 ± 0.121.43 ± 0.30nsnsns
DW (g)
PPFD (µmol m−2 s−1)
RBRBG
110220340110220340
China Rose Radish1.12 ± 0.01 c1.17 ± 0.06 b1.43 ± 0.05 a0.85 ± 0.07 c1.23 ± 0.001 b1.45 ± 0.12 ans****ns
Green Mizuna0.32 ± 0.06 b0.47 ± 0.04 a0.51 ± 0.05 a0.37 ± 0.02 b0.47 ± 0.01 ab0.58 ± 0.08 ans**ns
Chicory0.18 ± 0.01 c0.23 ± 0.003 b0.31 ± 0.02 a0.17 ± 0.02 c0.25 ± 0.01 b0.35 ± 0.04 ans****ns
Alfalfa0.41 ± 0.01 b0.44 ± 0.007 b0.66 ± 0.02 a0.26 ± 0.01 c0.53 ± 0.02 ab0.59 ± 0.03 a*********
French Marigold0.18 ± 0.03 b0.31 ± 0.01 a0.35 ± 0.08 a0.11 ± 0.02 c0.27 ± 0.02 b0.41 ± 0.05 ans***ns
Celosia0.07 ± 0.010.08 ± 0.010.09 ± 0.010.06 ± 0.01 b0.07 ± 0.006 b0.13 ± 0.02 ans**ns
Publisher’s Note: MDPI stays neutral with regard to jurisdictional claims in published maps and institutional affiliations.

