Abstract
Hydroponic cultivation using nutrient solution (NS) is the main cultivation method employed by plant factories with artificial lighting (PFALs). The electrical conductivity (EC) of NSs influences the yield and quality of vegetables. The purpose of this study was to optimize the yield and antioxidant accumulation of basil in a PFAL by EC management. In experiment 1, basil plants were grown under four different ECs (0.5, 1.0, 3.0, and 5.0 dS m−1) after transplanting. At 18 days after treatment, the highest levels of shoot fresh and dry weights, leaf fresh and dry weights, and leaf area were observed at an EC of 3.0 dS m−1. However, low-EC treatments (0.5 and 1.0 dS m−1) generated total phenolic content (TPC) and antioxidant capacities that were higher than those of other EC treatments (3.0 and 5.0 dS m−1). In experiment 2, basil plants were grown at an EC of 3.0 dS m−1 for 13 or 15 days, then treated with water or NS with low ECs (0.5 and 1.0 dS m−1) for 5 or 3 days before harvest. The short-term low-EC treatments, especially, water for 3 days and 0.5 dS m−1 for 5 days, significantly increased the TPC and antioxidant capacity of leaves without significantly decreasing the yields of basil, compared with the control. In conclusion, yield of basil was optimized with an EC of 3.0 dS m−1; however, the TPC and antioxidant capacity of basil were significantly increased by low ECs of 0.5 and 1.0 dS m−1. Short-term low-EC treatments (0.5 dS m−1 for 5 days or water for 3 days) could be used to promote the TPC and antioxidant capacity in leaves without sacrificing yield of basil significantly.
1. Introduction
Plant factories with artificial lighting (PFALs) are considered a high-end agricultural model that has many advantages over traditional agriculture. These include scheduled production, shorter production cycle, local production, high vegetable quality, etc. In PFALs, environmental conditions such as the nutrient solution (NS), light intensity, photoperiod, and temperature are controlled by the operator, who can thus enhance the yield and content of antioxidants in plants through environmental control. In countries such as Japan, China, America, etc., PFALs have been being used to produce leafy greens, herbs, medicinal plants, and other vegetables [1].
PFALs mainly use hydroponic cultivation with a NS that supplies the plants with fertilizers. Therefore, the composition of the NS is one of the most important environmental factors affecting plant growth and development. The total amount of available ions in the NS can be measured via electrical conductivity (EC) monitoring, which is a relatively simple task [2]. Therefore, EC management is a common and important method widely used in hydroponic cultivation to effectively improve the yield and quality of vegetables [3,4,5,6,7].
In practice, the EC is usually controlled at a target value in a recycling NS manually or automatically by EC control systems [8,9,10,11]. The EC value reflects the concentration of nutrients dissolved in the NS and is changed with the ratio of the volume of nutrients to the volume of water. During plant growth period, the EC level in the NS is influenced by plants because they absorb both nutrients and water from the NS [2]. The rise and fall of EC level, especially when it exceeds the tolerance of the plants, can cause nutrient stresses (excess or deficiency) that inhibit plant growth and development [9,12]. Controlling the EC of NS within an appropriate range is critical for plant production in PFALs. However, different crops have their specific ideal EC values [13], thus the optimal EC level for a certain crop grown in PFALs needs to be determined prior to its commercial production.
Sweet basil is an important labiate plant used to produce essential oil [14,15], and it is also widely consumed as a culinary herb and medicinal plant [16], and the demand for basil is increasing worldwide. Basil is rich in secondary metabolites with antioxidant effects that can reduce the risk of many diseases, such as cardiovascular disease and cancer [17]. Plant-derived antioxidants work by scavenging harmful free radicals derived from unhealthy habits, pollution, smoking, drugs, chemicals, etc., thus reducing the harm of oxidative stress against the human body [18]. Therefore, increasing the content of antioxidants such as phenolic compounds in basil by controlling environmental conditions during cultivation will improve the nutritional value of basil for humans. More and more growers are starting to produce basil in a PFAL because its high environmental controllability and sustainability allows for a reliable and stable supply of basil plants [19,20,21].
There are at least 65 species of basil [22] with numerous botanical varieties and the content of antioxidants and total phenolics varied widely among varieties [23,24,25]. In addition, changes in cultivation conditions, such as potassium supply [26], daily light integral [19], UV-B radiation [20], photosynthetic photon flux density [20,27], red and blue light ratios [21,27], temperature and water stress [28], and salt stresses combined with storage periods [29], affect secondary metabolites accumulation in basil plants, and different basil cultivars also respond differently to the same environmental conditions [20,21,26]. In sweet basil, the antioxidant activity of different cultivars was influenced oppositely under the same EC treatments [30], which showed that the antioxidant activity decreased in cultivar of “Genovese” but increased in cultivar of “Napoletano”, with increase in the EC from 2.0 dS m−1 to 4.0 dS m−1. Another study reported that the accumulations of secondary metabolites including total polyphenols were significantly affected by different ECs (1.0, 2.0, 3.0 dS m−1), and a significant interaction between the cultivars of sweet basil and the ECs was noted for phenolic acids [31].
The concentration of antioxidants and yield in biomass of plants may show opposite trends under the same environmental conditions, especially under stress conditions [3,28]. It is reported that an EC value of 2.0 dS m−1 produces the maximum yield of wrinkled giant hyssop (Agastache rugosa), while producing relatively low levels of antioxidants; however, at an EC value of 0.5 dS m−1, the content of antioxidants reaches the maximum, but at a relatively low yield [32]. Therefore, the optimum EC value of NS often differs according to the purpose, e.g., obtaining either a high yield or high antioxidant content. Although it is sometimes difficult to maximize both yield and antioxidant content under the same environmental conditions, there are compromise methods that can balance these two aims. For instance, short-term root zone environmental control has been used to effectively balance vegetable yield and quality. Adjusting the NO3− content in the NS of lettuce decreased the NO3− content without decreasing the leaf fresh weight before harvest [33]. In coriander, regulating the root zone temperature before harvest dramatically enhanced the content of antioxidants with only a small decline in yield [34].
The effects of EC value of NS on the growth and development of basil [6,35,36]; on the antioxidant activity in basil [30], perilla [37], and wild rocket [38]; and on the phenolic compounds in Agastache rugosa [32] and tomato [39] have been reported. However, there are no studies on the use of short-term regulation of the EC value of NS before harvest to balance yield and accumulation of antioxidants in vegetables and herbs. Therefore, the present study aimed firstly to determine the respective optimal EC values of NS for maximizing yield and accumulation of antioxidants, and then to develop a short-term EC management method that can be applied prior to harvest to balance these two aspects of basil plants grown in PFALs.
2. Materials and Methods
2.1. Plant Material
Sweet basil (Ocimum basilicum L. var. basilicum L. cv. Genovese, Takii & Co., Ltd., Japan) seeds were sown in sponge cubes (2.3 × 2.3 × 2.8 cm, 14.8 cm3) in a cultivation room of a PFAL. The germinated seeds were placed under a photosynthetic photon flux density (PPFD) of 200 µmol m−2 s−1 with a photoperiod of 16 h per day using LED lamps (Plant growth light, 18W, SananBio, Xiamen, China). The seedlings were irrigated with an NS consisting of the following nutrients: N 21%, P2O5 8%, K2O 27%, MgO 4%, CaO 23%, Fe 0.18%, Cu 0.002%, Zn 0.006%, Mo 0.002%, MnO 0.1%, and B2O3 0.1% (Otsuka hydroponic composition, OAT Agrio Co., Ltd., Tokyo, Japan) [40]. The EC and pH of the NS were measured by a multi-parameter meter (Eutech PCTestr 35 multi-parameter pocket tester; Eutech Instruments Pte Ltd., Singapore) and adjusted to 2.0 dS m−1 and 6.5, respectively, during the nursery stage.
2.2. Treatments
Two experiments were conducted starting at 16 days after germination (Figure 1). In the first experiment (Experiment 1), sweet basil seedlings were transplanted into four plastic cultivation containers (70 × 46 × 11 cm, LWH, 35.4 L) containing NS with EC values of 0.5, 1.0, 3.0, and 5.0 dS m−1. The NS composition was the same as mentioned above, and the nutrient concentrations of different ECs are shown in Table 1. The ratio of the concentration of NO3−/NH4+ was 10:1.
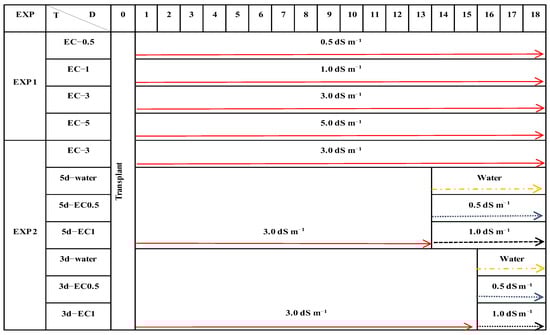
Figure 1.
Schematic diagram of the treatments imposed on basil plants cultivated for 18 days in experiment 1 and experiment 2. Treatment code (T): EC−0.5, EC−1, EC−3, and EC−5 represent nutrient solution with electrical conductivities (ECs) of 0.5, 1.0, 3.0, and 5.0 dS m−1, respectively. 5d−water, 5d−EC0.5, and 5d−EC1 represent treatments with water, EC−0.5, and EC−1 imposed 5 days before harvest, respectively. 3d−water, 3d−EC0.5, and 3d−EC1 represent treatments with water, EC−0.5, and EC−1 imposed 3 days before harvest, respectively. D: days of cultivation. EXP: experiment.

Table 1.
Nutrient concentration of different EC treatments.
After Experiment 1, the second experiment (Experiment 2) was conducted, by transplanting seedlings into seven plastic cultivation containers (same containers as above) containing NS with an EC value of 3.0 dS m−1 and incubating them for 13 or 15 days. Then the plants were treated with water or NS with EC values of 0.5 and 1.0 dS m−1 for another 5 or 3 days, before harvest. The control consisted of seedlings in NS with an EC value of 3.0 dS m−1 and incubated for 18 days after transplanting (Figure 1). Experiment 2 was carried out after the results of Experiment 1 were obtained.
Thirty-two seedlings were grown under each treatment in both experiments, and each container contained 30 L NS. The plant density was 99 plants m−2. To facilitate the replenishment of NS, a 100× concentrated NS was made, and the proportions of all elements in the concentrated NS were the same. The NS was adjusted every two days to maintain the target EC value and NS volume (30 L). At the same time, the pH of the NS was adjusted to 6.5. Light was provided by the same LED lamps as described above, with a PPFD of 200 ± 15 μmol m−2 s−1. The PPFD was measured at the surface of the cultivation panel using a light meter (LI 250A, LI-190R; Li-Cor Inc., Lincoln, NE, USA). The light spectrum is shown in Supplementary Figure S1. Temperature, photoperiod, CO2 concentration, and relative humidity were set to 21 °C/24 °C (dark/light), 8/16 h (dark/light), 1500 ppm, and 60%–80%, respectively. The basil plants were harvested at 34 days after sowing. Both experiments were repeated twice.
2.3. Measurements
2.3.1. Growth Parameters
The basil plants were harvested at 18 days after treatment. Leaf, stem, and root fresh weights were measured immediately after harvesting. To measure dry weights, the leaf, stem, and root samples were oven-dried at 80 °C for 3 days to a constant weight before measurements. Total leaf area was measured with a leaf area meter (Li–3000, Li-Cor, Lincoln, NE, USA). Leaf mass per area (LMA) was determined as leaf dry weight divided by leaf area. Each parameter consisted of measurements from 12 samples from each treatment.
2.3.2. Gas-Exchange Parameters
The net photosynthetic rates (Pn), stomatal conductance (Gs), and transpiration rate (Tr) of basil leaves were determined using a gas-exchange system (LI-6400-40, Li-Cor, Inc., Lincoln, NE, USA) at 34 days after sowing. Water use efficiency of photosynthesis (WUEPn) was calculated as WUEPn = Gs ÷ Pn [41]. The youngest fully expanded leaf from each treatment was used for measurements [42]. Eight samples were measured from each treatment. The light intensity, CO2 concentration, relative humidity, and leaf temperature inside the leaf chamber were set to 200 PPFD, 1500 mmol mol−1, 65%, and 23 °C, respectively.
2.3.3. Measurements of Total Phenolic Content (TPC) and Antioxidant Capacity in Basil Leaves
Extraction. A frozen leaf sample (1 g each) was homogenized with 80% (v/v) methanol (5 mL) for 1 min. The sample was centrifuged (10,000× g, 4 °C) for 30 min. After centrifuging, the supernatant was transferred to a 10 mL graduated cylinder and made up to 6 mL with 80% methanol and then stored at −30 °C for further analysis.
TPC evaluation. The colorimetric analysis of Folin−Ciocalteu [34] was used to determine the TPC of basil leaves, using gallic acid as the calibration standard. An aliquot of 0.25 mL of test sample or gallic acid solution (0, 0.05, 0.10, 0.15, 0.20, 0.25, and 0.30 mg mL−1) was added to 1.25 mL of 10% Folin−Ciocalteu reagent, followed by 1 mL of 7.5% sodium carbonate solution, and then this was mixed thoroughly at room temperature. After 1 h, the absorbance of mixed solution was measured at 765 nm with a spectrophotometer (ASV11D, As One, Corp., Osaka, Japan). The results are expressed as milligram gallic acid equivalents per gram fresh weight (mg GAE g−1 FW).
Total antioxidant capacity evaluation. Free radical scavenging activity was evaluated using a 1,1-Diphenyl-2-picrylhydrazyl (DPPH) assay [43] with some modifications. An aliquot of 50 µL of test sample or Trolox solution (0, 200, 400, 600, 800, and 1000 µM) was added to 2 mL of a DPPH solution (80 µM) in methanol and mixed thoroughly at room temperature. After 30 min under dark condition, the absorbance of mixed solution was measured at 517 nm with a spectrophotometer (ASV11D, As One, Corp., Osaka, Japan), and the results are expressed as milligram Trolox equivalents per gram fresh weight (mg TE g−1 FW).
2.3.4. Measurements of Photosynthesis-Related Pigments in Basil Leaves
The chlorophyll a, chlorophyll b, total chlorophyll, and carotenoid concentrations of basil leaves were determined immediately after harvest, following the methods described previously [34]. The weighted samples were placed into a glass vial containing 2 mL N,N-Dimethylformamide (DMF) and immediately put in darkness at 4 °C for 36 h. A spectrophotometer (SH-1300Lab, Corona Electric Co., Ltd., Ibaraki, Japan) was used to measure the absorbance of the solution at different wavelengths (645, 663, 480 nm) using DMF as a blank. The contents of chlorophyll a, chlorophyll b, total chlorophyll, and carotenoid were calculated by the formula described previously [34].
2.4. Statistical Analysis
For each treatment, four to twelve replicates were obtained to evaluate different parameters. The data were subjected to analysis of variance and the means were compared between treatments using Tukey’s test in SPSS statistical software (IBM SPSS Statistics, Version 19.0. Armonk, NY, USA: IBM Corp.). A p-value < 0.05 was considered significant.
3. Results
3.1. Experiment 1
3.1.1. Plant Growth under Different EC Treatments
The shoot and leaf FW and leaf area increased significantly when the EC value was increased from 0.5 to 3.0 dS m−1 and then decreased slightly when the EC value was further increased to 5.0 dS m−1 (Figure 2A–C). The shoot and leaf DW followed a similar trend as the shoot and leaf FW; however, the differences in shoot DW at EC values of 1.0, 3.0, and 5.0 dS m−1 were not significant (Figure 2D,E). The LMA decreased as EC increased from 0.5 to 3.0 dS m−1 and then increased significantly as EC increased from 3.0 to 5.0 dS m−1 (Figure 2F). The morphological characteristics of basil plants in each treatment before harvest are shown in Supplementary Figure S2.
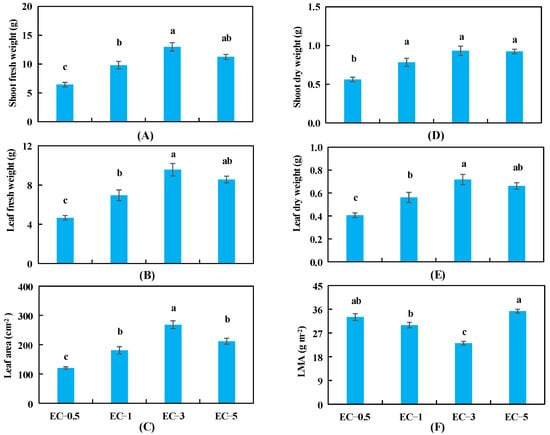
Figure 2.
Shoot fresh weight (A), leaf fresh weight (B), leaf area (C), shoot dry weight (D), leaf dry weight (E), and leaf dry mass per area (LMA) (F) of basil plants under 4 different EC treatments at 34 days after sowing. The error bars represent SEs (n = 12). Different lowercase letters represent significant differences among different EC treatments based on Tukey’s new multiple range test at p < 0.05.
The effects of different EC treatments on other plant growth parameters and the relationship between the plant DW and the leaf area of basil are shown in Supplementary Table S1 and Supplementary Figure S3, respectively. The FW of stems and roots and plant height of basil increased significantly as EC was increased from 0.5 to 3.0 dS m−1 and any further increase in EC produced no further changes in these parameters (Table S1). The statistical analysis showed a positive and highly significant relationship between plant DW and leaf area (Figure S3B).
3.1.2. Net Photosynthetic Rate and Chlorophyll and Carotenoid Concentrations of Basil Leaves under Different EC Treatments
The net photosynthetic rates, chlorophyll a, chlorophyll b, carotenoid contents, the values of chlorophyll a/chlorophyll b and total chlorophyll/carotenoid of basil leaves did not differ significantly among the different EC treatments (Table 2). The stomatal conductance (Gs), transpiration rate (Tr), and water use efficiency of photosynthesis (WUEPn) are shown in Supplementary Table S2, and there were also no significant differences in these parameters under different EC treatments.
Table 2.
The net photosynthetic rate, chlorophyll a (Chl a), chlorophyll b (Chl b), carotenoid contents, the values of Chl a/Chl b, and total Chl/carotenoid of basil leaves under 4 different EC treatments at 34 days after sowing in experiment 1.
3.1.3. Antioxidant Capacity and TPC of Basil Leaves under Different EC Treatments
The antioxidant capacities of basil leaves were significantly higher at ECs of 0.5 and 1.0 dS m−1 compared with those at ECs of 3.0 and 5.0 dS m−1, and no significant differences were observed in this parameter between ECs of 0.5 and 1.0 dS m−1 or between ECs of 3.0 and 5.0 dS m−1 (Figure 3A). The TPC decreased as the EC was increased from 0.5 to 3.0 dS m−1; however, there was no further decrease in the TPC when the EC was increased from 3.0 to 5.0 dS m−1 (Figure 3B). The antioxidant capacity and the TPC in the leaves of the whole plant both increased significantly as EC was increased from 0.5 to 1.0 dS m−1 (mainly due to the difference in leaf FWs, Figure 1B) and then decreased with the increase in EC value at 3.0 and 5.0 dS m−1 (Figure 3C,D).
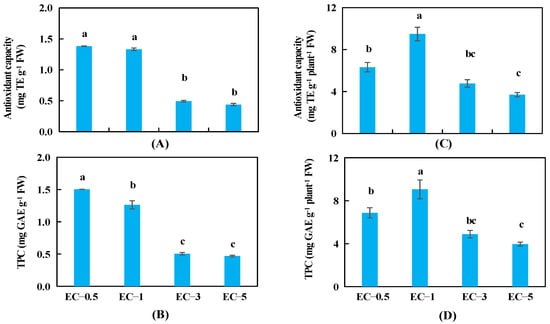
Figure 3.
The antioxidant capacity in basil leaves (A), total phenolic content (TPC) (B) in basil leaves, antioxidant capacity in leaves of the whole plant (C), and TPC in leaves of the whole plant (D) under 4 different EC treatments at 34 days after sowing. The error bars represent SEs (n = 8). Different lowercase letters represent significant differences among different EC treatments based on Tukey’s new multiple range test at p < 0.05.
3.2. Experiment 2
3.2.1. Plant Growth under Different Short-Term EC Treatments
No significant decrease was observed in shoot FW in response to treatments of EC0.5 and EC1 for 3 or 5 days; however, shoot FW did decrease significantly in response to water treatment for 3 and 5 days, compared with the control (Figure 4A). Leaf FW did not decrease significantly in response to all treatments except that of water for 5 days (Figure 4B), compared with the control. Shoot DW did not decrease significantly in response to EC0.5 and EC1 treatments for 5 days; however, shoot DW decreased significantly in response to the other treatments, compared with the control. Leaf DW did not decrease significantly in response to the EC0.5 treatment for 5 days or the EC1 treatment for 3 and 5 days; however, leaf DW decreased significantly in response to the other treatments (Figure 4C,D), compared with the control. Shoot and leaf DWs did not change significantly in response to treatment duration under any of the EC values.
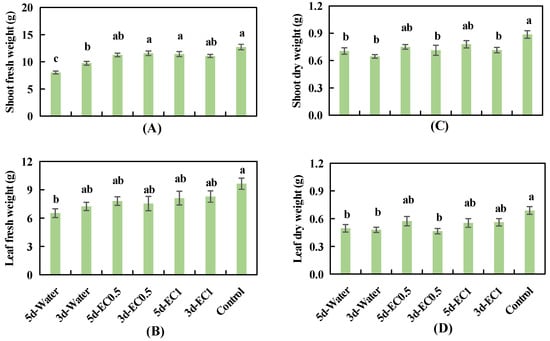
Figure 4.
Shoot fresh weight (A), leaf fresh weight (B), shoot dry weight (C), and leaf dry weight (D) of basil plants under different short-term EC treatments at 34 days after sowing. The error bars represent SEs (n = 12). Different lowercase letters represent significant differences among different EC treatments based on Tukey’s new multiple range test at p < 0.05.
3.2.2. Antioxidant Capacity and TPC under Different Short-Term EC Treatments
Compared with the control, both antioxidant capacity and TPC were significantly improved by the water and EC0.5 treatments for 3 or 5 days but were not influenced by the EC1 treatment for either 3 or 5 days (Figure 5A,B). The highest antioxidant capacity and TPC were achieved with the 5d-water treatment, followed by 3d-water, 5d-EC0.5, 3d-EC0.5, and 3d-, 5d-EC1 treatments (Figure 5A,B). The effect of different treatment durations on antioxidant capacity and TPC varied among the different ECs. In the water treatment, longer treatment duration (5 days) enhanced the antioxidant capacity and TPC significantly more than in the shorter treatment duration (3 days). However, these two parameters were not affected significantly by the treatment duration at ECs of 0.5 and 1.0 dS m−1 (Figure 5A,B).
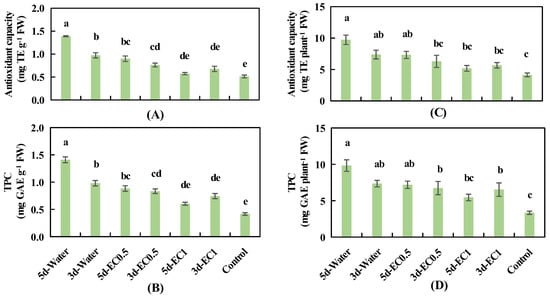
Figure 5.
The antioxidant capacity in basil leaves (A), total phenolic content (TPC) in basil leaves (B), antioxidant capacity in leaves of the whole plant (C), and TPC in leaves of the whole plant (D) under different EC treatments at 34 days after sowing. The error bars represent SEs (n = 8). Different lowercase letters represent significant differences among different EC treatments based on Tukey’s new multiple range test at p < 0.05.
The trends observed for antioxidant capacity and TPC in the leaves of the whole plant as affected by short-term EC treatments were similar (Figure 5C,D). The highest antioxidant capacity and TPC in the leaves of the whole plant were achieved in the 5d-water, 3d-water, and 5d-EC0.5 treatments, and these levels were significantly higher than those of the control (Figure 5C,D).
The effects of different EC treatments on the leaf area and the growth of stems and roots of basil plants are shown in Supplementary Table S3.
Compared with the control, the leaf area did not decrease significantly in response to 3d-EC0.5 and 5d-EC1 treatments (Table S3); the stem FW did not decrease significantly in response to the 5d-EC0.5 and 5d-EC1 treatments; and the stem DW was not decreased significantly in response to the 5d-EC1 treatment (Table S3). The leaf area and stem FW and DW were not significantly affected by the different durations of the EC treatments of water, 0.5, and 1.0 dS m−1. The root FW did not differ significantly among all treatments; however, the root DW did increase significantly in response to the 5d-water and 5d-EC0.5 treatments as compared with the control (Table S3).
Compared with the control, the leaf FW had the highest reduction in percentage under the treatment of 5d-water, followed by 3d-water, 3d-EC0.5, 5d-EC0.5, 5d-EC1, and 3d-EC1. Moreover, the highest percentage increase of the antioxidant capacity (per unit g FW), TPC (per unit g FW), antioxidant capacity in the leaves (per plant g FW), and TPC in the leaves (per plant g FW) were achieved under the treatment of 5d-water, followed by 3d-water, 5d-EC0.5, 3d-EC0.5, and 3d-, 5d-EC1, compared with the control (Table S4).
4. Discussion
4.1. Growth and Yield of Basil under Different EC Treatments
Our results show the highest shoot FW, leaf FW, shoot DW, and leaf DW of basil at an EC of 3.0 dS m−1; and the shoot FW, leaf FW, and leaf DW of basil at ECs of 0.5 and 1.0 dS m−1 were significantly lower than those at an EC of 3.0 dS m−1 (Figure 1A,B,D,E). Similarly, in perilla, the shoot DW, leaf DW, and leaf area were significantly lower at an EC of 1.0 dS m−1 compared with those at an EC of 3.0 dS m−1 [3]. It is reported that the leaf fresh and dry weights of basil plant decreased significantly when the EC value was decreased from 1.2 to 0.5 dS m−1 [5]. These results indicate that EC levels lower than 1.0 dS m−1 may have an adverse effect on basil and perilla plants [3,5]. However, the optimal EC levels for maximizing growth and yield of these plants depend on cultivars and other environmental conditions. For example, an EC of 2.0 dS m−1 was optimal for cultivar of “Aroma 2”, but an EC of 3.0 dS m−1 was optimal for cultivar of “Italiano Classico” in basil plants [31]. The yields of green perilla were similar under EC 2.0 and 3.0 dS m−1 when the PPFD was 100 µmol m−2 s−1, but its yield was significantly higher at an EC of 3.0 dS m−1 than at an EC of 2.0 dS m−1 when the PPFD was increased to 200 or 300 µmol m−2 s−1 [3].
Different vegetables also respond differently to changes in EC values. For instance, the growth and yield of pakchoi are reduced more by low ECs (0, 0.3, 0.6, and 1.2 dS m−1) than by higher ECs (1.8 and 2.4 dS m−1) [44]. Similarly, in Crepidiastrum denticulatum (the common name: e-go-deulppae-gi in Korean), the growth and yield are reduced more by low ECs (0.5, 1.0, and 1.5 dS m−1) than by higher ECs (2.0 and 2.5 dS m−1) [45], while the shoot fresh and dry weights of lettuce decrease significantly in response to increasing the EC of the NS from 1.4 to 3.0 dS m−1 [46]. Moreover, in our study, ECs of 3.0 and 5.0 dS m−1 did not result in significant differences in shoot FW, leaf FW, shoot DW, and leaf DW (Figure 1A,B,D,E); however, the shoot FW and shoot DW of pakchoi at an EC of 4.8 dS m−1 were significantly higher than those at an EC of 2.4 dS m−1 [44]. Even within basil plants, the effects of EC on plant growth and yield could be different. One study has reported that basil plants had the best yield and growth indexes under the EC value of 2.8 dS m−1 (among EC of 2.2, 2.5, 2.8, 3.1 dS m−1) [36]; however, the growth of basil plants was not affected by the EC values (among EC of 0.5, 1.0, 2.0, 3.0, 4.0 dS m−1) [6]; the fresh yield of basil plants under an EC of 1.0 dS m−1 was significantly higher than that under an EC of 3.0 dS m−1 (cultivar “Eleonora”) [31]. The different results may be caused by the difference in growth conditions—for instance, different PPFD values: 378 µmol m−2 s−1 [6] vs. 200 µmol m−2 s−1 in our study and in the Dou et al. report [19]; different plant densities: 317 plants m−2 [31] vs. 99 plants m−2 in our study, which referred to the recommended plant density of 100 plants m−2 in hydroponic basil cultivation [47].
In our study, different ECs produced differences in basil biomass; however, the net photosynthetic rate and the photosynthesis-related pigment levels were not affected by the EC treatments (Table 2). Similarly, in perilla and Crepidiastrum denticulatum, the net photosynthetic rates are unaffected by differences in EC conditions [3,45]. In contrast, the net photosynthetic rate and relative chlorophyll content of pakchoi are significantly affected by different EC conditions [44]. Moreover, plant DW of basil was highly positively related to leaf area (Figure S3). Therefore, at ECs that affected the leaf area of basil (0.5, 1.0, and 3.0 dS m−1), the photo assimilates of the whole plant were influenced. This phenomenon was also observed in tomato plants under different EC conditions (1.3 to 8.8 dS m−1) [48].
4.2. TPC and Antioxidant Capacity of Basil Leaves under Different EC Treatments
Nutrient stress, either insufficient or excessive amounts of essential nutrients that inhibit plant growth and development [49], could enhance accumulation of antioxidants. It is reported that the accumulation of antioxidants in tomato and pepper is significantly higher at ECs of 4.5 and 4.4 dS m−1 compared with that at the lower EC of 3.5 dS m−1 [39,50]. However, in our study, the antioxidant capacity and TPC of basil were significantly higher under low ECs of 0.5 and 1.0 dS m−1 compared with those under high ECs of 3.0 and 5.0 dS m−1 (Figure 3A,B). Specifically, the antioxidant capacity and TPC at EC of 0.5 dS m−1 were increased by 181.6% and 200.0% over those at EC of 3.0 dS m−1, respectively, and similarly, the two parameters at EC of 1.0 dS m−1 were increased by 171.4% and 152.0% over those at EC of 3.0 dS m−1, respectively. Nutrient deficiency stress can promote the accumulation of phenolic compounds, as shown by the relatively high content of rosmarinic acid (a phenolic compound) in basil plants grown in a NS with low N content [51]. The phenolic compound in rice increases significantly in a NS with low levels of N, P, and K [52]. Nutrient limitation also significantly promoted the content of phenolic compounds and the antioxidant capacity in basil [53]. Similarly, the phenolic compounds and antioxidants in lettuce increase significantly in a NS with low levels of N and P [54]. On the other hand, it seems an EC of 5.0 dS m−1 did not cause nutrient excess stress in the present study, as evidenced by the similar antioxidant capacities and TPCs of basil plants grown at ECs of 3.0 and 5.0 dS m−1 (Figure 3A,B). Similarly, the antioxidant enzyme activity of pakchoi plants did not increase [44] when the EC was increased from 1.2 or 2.4 dS m−1 to 4.8 dS m−1 (≈5.0 dS m−1); however, the antioxidant enzyme activity of pakchoi plants did increase significantly when the EC was further increased to 9.6 dS m−1.
The effects of EC on the accumulation of secondary metabolites vary with different cultivars of sweet basil. For example, the total phenolic acids were not affected by different salt stresses (ECs of 1.23, 4.87 and 8.62 dS m−1) in green (var. Green Iranian) and purple (var. Purple Iranian) basils [29]. However, the TPC was significantly enhanced by EC of 3.0 dS m−1, compared with that at EC of 1.0 dS m−1 in cultivar of “Aroma 2”, but showed no changes with different ECs in cultivar of “Eleonora” [31]. The antioxidant activity at high EC (4.0 dS m−1) was higher than that at low EC (2.0 dS m−1) in sweet basil cultivar of “Napoletano” [30]. Different from the results mentioned above, the TPC and antioxidant capacity were significantly improved by low ECs (0.5 and 1.0 dS m−1) compared with high ECs (3.0 and 5.0 dS m−1) in the sweet basil cultivar used in the present study.
From the two aspects of the yield and the accumulation of antioxidants in basil leaves, it is found that the leaf FW of basil at ECs of 0.5 and 1.0 dS m−1 was decreased by 51.3% and 27.3%, compared with that under EC of 3.0 dS m−1, whereas the antioxidant capacity and TPC in the leaves of the whole plant were increased by 32.5% and 40.8% at EC of 0.5 dS m−1 and by 99.0% and 85.7% at EC of 1.0 dS m−1, compared with those at EC of 3.0 dS m−1. These differences were because the antioxidant capacity and TPC at ECs of 0.5 and 1.0 dS m−1 are largely higher than those under ECs of 3.0 dS m−1 (Figure 3C,D). Achieving a balance between yield and the accumulation of antioxidants in vegetables is important but difficult in practice. It has been shown that the yield and quality of vegetables can be controlled using methods of short-term regulation of root zone environment [33,34]; thus, Experiment 2 was conducted, and the results are discussed in the following section.
4.3. Balance of Yield and the Accumulation Antioxidants of Basil under Short-Term EC Treatments
Due to nutrient deficiency, relative long-term low-EC treatment reduced plant biomass in pakchoi [44] and Crepidiastrum denticulatum [45] and increased phenolic compounds in basil [51,53] and rice [52]. In experiment 2, short-term low-EC treatments were applied to find a cultivation method that may balance yield and antioxidant accumulation in basil. The results show that compared with other treatments, the 5d-EC0.5 and 3d-water treatments achieved relative better results: yields were not significantly lower than those of the control, while promoting the accumulation of antioxidants. Specifically, compared with the control, the 5d-EC0.5 treatment did not reduce leaf FW, while increasing the TPC in the leaves (per plant g FW) and antioxidant capacity in the leaves (per plant g FW) by 115.3% and 66.0%, respectively; and the 3d-water treatment increased the same parameters by 119.9% and 67.4%, respectively (Table S4), while maintain leaf FW (Figure 4B). Such degrees of increase in antioxidants production would be a great benefit for improving the market value of the products. In addition, the increase in antioxidant capacity may be attributed to the increase in TPC because total phenolics play a major role in the antioxidant capacity in plants [43,55]. The results indicate that short-term EC treatments in the root zone environment can be used to balance the yield and the accumulation of antioxidants, which is based on the principle that stress promotes the accumulation of antioxidants in plants [56,57,58]. In our study, short-term EC treatments promoted the accumulation of antioxidants without decreasing the yield of basil, which provides a new and relatively simple means of growing basil for PFAL operators.
Table S4 shows that compared with the control, the 5d-water treatment accumulated much higher levels of antioxidants in basil, although the leaf FW was significantly reduced by 24.4%. Based on the results of the 5d-water and 3d-water treatments, a short-term treatment of 4d-water may achieve a higher accumulation of antioxidants compared with 3d-water, while experiencing a lower decline in yield than 5d-water. This hypothesis requires further research in the future.
5. Conclusions
Different electrical conductivity treatments affected the growth, total phenolic content, and antioxidant capacity of basil grown in a plant factory with artificial lighting. An EC of 3.0 dS m−1 significantly promoted the yield of basil, but the level of accumulation of antioxidants was lower compared with those in other EC treatments. ECs of 0.5 and 1.0 dS m−1 significantly increased the antioxidant capacity and TPC of basil, while significantly inhibiting yield. Short-term EC treatments before harvest were imposed to balance the yield and antioxidant accumulation of basil. The treatments with EC of 0.5 dS m−1 for 5 days or water for 3 days before harvest can promote the antioxidant capacity and TPC in basil leaves without sacrificing yield significantly, compared with the control. Our study provides a new and relatively simple method for balancing the yield and the accumulation of antioxidants in basil production in plant factories with artificial lighting.
Supplementary Materials
The following are available online at https://www.mdpi.com/article/10.3390/horticulturae8030216/s1, Figure S1: Spectral distribution of the LED lamp used in the experiments, Figure S2: Basil plants grown under 4 different EC treatments for 18 days after transplanting, Figure S3: The plant dry weight of basil under 4 different EC treatments for 18 days after transplanting and the scatter plots for the relationship between the plant dry weight of basil and the leaf area, Table S1: Growth parameters of basil plants grown under 4 different EC treatments in experiment 1, Table S2: The stomatal conductance (Gs), transpiration rate (Tr), and water use efficiency of photosynthesis (WUEPn) of basil leaves under 4 different EC treatments for 18 days after transplanting in experiment 1, Table S3: Growth parameters of basil plants grown under different EC treatments in experiment 2, Table S4: The percentage decrease in leaf fresh weight of basil compared with the control and the percentage increase in antioxidant capacity, total phenol contents (TPC), antioxidant capacity in leaves of the whole plant, TPC in leaves of the whole plant of basil compared with the control in experiment 2.
Author Contributions
Methodology, X.R., N.L. and M.T.; investigation, X.R.; formal analysis, X.R., N.L., W.X. and Y.Z.; resources, M.T.; writing—original draft, X.R. and N.L.; and writing—review and editing, X.R., N.L., W.X., Y.Z. and M.T. All authors have read and agreed to the published version of the manuscript.
Funding
This research received no external funding.
Data Availability Statement
Not applicable.
Conflicts of Interest
The authors declare no conflict of interest.
References
- Kozai, T. Current status of plant factories with artificial lighting (PFALs) and smart PFALs. In Smart Plant Factory; Kozai, T., Ed.; Springer: Singapore, 2018; pp. 3–13. [Google Scholar]
- Trejo-Téllez, L.I.; Gómez-Merino, F.C. Nutrient solutions for hydroponic systems. In Hydroponics-A Standard Methodology for Plant Biological Researches; Asao, T., Ed.; InTech: Rijeka, Croatia, 2012; pp. 1–22. [Google Scholar]
- Lu, N.; Bernardo, E.L.; Tippayadarapanich, C.; Takagaki, M.; Kagawa, N.; Yamori, W. Growth and accumulation of secondary metabolites in perilla as affected by photosynthetic photon flux density and electrical conductivity of the nutrient solution. Front. Plant Sci. 2017, 8, 708. [Google Scholar] [CrossRef] [PubMed] [Green Version]
- Wortman, S.E. Crop physiological response to nutrient solution electrical conductivity and pH in an ebb-and-flow hydroponic system. Sci. Hortic. 2015, 194, 34–42. [Google Scholar] [CrossRef]
- Hosseini, H.; Mozafari, V.; Roosta, H.R.; Shirani, H.; van de Vlasakker, P.C.; Farhangi, M. Nutrient use in vertical farming: Optimal electrical conductivity of nutrient solution for growth of lettuce and basil in hydroponic cultivation. Horticulturae 2021, 7, 283. [Google Scholar] [CrossRef]
- Walters, K.J.; Currey, C.J. Effects of nutrient solution concentration and daily light integral on growth and nutrient concentration of several basil species in hydroponic production. HortScience 2018, 53, 1319–1325. [Google Scholar] [CrossRef]
- Xu, H.L.; Qin, F.; Gautheir, L.; Gosselin, A. Green house tomato growth and physiological responses to high nutrient solution and electrical conductivity and low substrate water content. Fruits Veg. Cereals Sci. Biotechnol. 2009, 3, 54–61. [Google Scholar]
- Miller, A.; Adhikari, R.; Nemali, K. Recycling nutrient solution can reduce growth due to nutrient deficiencies in hydroponic production. Front. Plant Sci. 2020, 11, 607643. [Google Scholar] [CrossRef]
- Yolanda, D.; Arief, L.; Sundara, T.A.; Deza, M.; Oktavia, D. Control of electrical conductivity for NFT hydroponic systems using fuzzy logic and android environment. In Proceedings of the 2018 International Conference on Information Technology Systems and Innovation (ICITSI), Padang, Indonesia, 22–26 October 2018; pp. 508–514. [Google Scholar]
- Chen, C.H.; Jeng, S.Y.; Lin, C.J. Fuzzy logic controller for automating electrical conductivity and pH in hydroponic cultivation. Appl. Sci. 2022, 12, 405. [Google Scholar] [CrossRef]
- Ibrahim, M.N.R.; Solahudin, M.; Widodo, S. Control system for nutrient solution of nutrient film technique using fuzzy logic. Telkomnika 2015, 13, 1281. [Google Scholar] [CrossRef]
- Pandey, R.; Vengavasi, K.; Hawkesford, M.J. Plant adaptation to nutrient stress. Plant Physiol. Rep. 2021, 26, 583–586. [Google Scholar] [CrossRef]
- Sonneveld, C.; Voogt, W. Nutrient solutions for soilless cultures. In Plant Nutrition of Greenhouse Crops; Sonneveld, C., Voogt, W., Eds.; Springer: Dordrecht, The Netherlands, 2009; pp. 257–275. [Google Scholar]
- Wogiatzi, E.; Papachatzis, A.; Kalorizou, H.; Chouliara, A.; Chouliaras, N. Evaluation of essential oil yield and chemical components of selected basil cultivars. Biotechnol. Biotechnol. Equip. 2011, 25, 2525–2527. [Google Scholar] [CrossRef] [Green Version]
- Nurzyńska-Wierdak, R. Sweet basil essential oil composition: Relationship between cultivar, foliar feeding with nitrogen and oil content. J. Essent. Oil Res. 2012, 24, 217–227. [Google Scholar] [CrossRef]
- Simon, J.E.; Morales, M.R.; Phippen, W.B.; Vieira, R.F.; Hao, Z. Basil: A source of aroma compounds and a popular culinary and ornamental herb. In Perspectives on New Crops and New Uses; ASHS Press: Alexandria, VA, USA, 1999; pp. 499–505. [Google Scholar]
- Filip, S.; Vidović, S.; Vladić, J.; Pavlić, B.; Adamović, D.; Zeković, Z. Chemical composition and antioxidant properties of Ocimum basilicum L. extracts obtained by supercritical carbon dioxide extraction: Drug exhausting method. J. Supercrit. Fluids 2016, 109, 20–25. [Google Scholar] [CrossRef]
- Sen, S.; Chakraborty, R. The role of antioxidants in human health. In Oxidative stress: Diagnostics, Prevention, and Therapy; Andreescu, S., Hepel, M., Eds.; American Chemical Society: Washington, DC, USA, 2011; pp. 1–37. [Google Scholar]
- Dou, H.; Niu, G.; Gu, M.; Masabni, J.G. Responses of sweet basil to different daily light integrals in photosynthesis, morphology, yield, and nutritional quality. HortScience 2018, 53, 496–503. [Google Scholar] [CrossRef]
- Dou, H.; Niu, G.; Gu, M. Pre-harvest UV-B radiation and photosynthetic photon flux density interactively affect plant photosynthesis, growth, and secondary metabolites accumulation in basil (Ocimum basilicum) plants. Agronomy 2019, 9, 434. [Google Scholar] [CrossRef] [Green Version]
- Dou, H.; Niu, G.; Gu, M. Photosynthesis, morphology, yield, and phytochemical accumulation in basil plants influenced by substituting green light for partial red and/or blue light. HortScience 2019, 54, 1769–1776. [Google Scholar] [CrossRef] [Green Version]
- Makri, O.; Kintzios, S. Ocimum sp. (basil): Botany, cultivation, pharmaceutical properties, and biotechnology. J. Herbs Spices Med. Plants 2008, 13, 123–150. [Google Scholar] [CrossRef]
- Moghaddam, M.; Mehdizadeh, L. Variability of total phenolic, flavonoid and rosmarinic acid content among Iranian basil accessions. LWT-Food Sci. Technol. 2015, 63, 535–540. [Google Scholar] [CrossRef]
- Javanmardi, J.; Stushnoff, C.; Locke, E.; Vivanco, J.M. Antioxidant activity and total phenolic content of Iranian Ocimum accessions. Food Chem. 2003, 83, 547–550. [Google Scholar] [CrossRef]
- Kwee, E.M.; Niemeyer, E.D. Variations in phenolic composition and antioxidant properties among 15 basil (Ocimum basilicum L.) cultivars. Food Chem. 2011, 128, 1044–1050. [Google Scholar] [CrossRef]
- Nguyen, P.M.; Kwee, E.M.; Niemeyer, E.D. Potassium rate alters the antioxidant capacity and phenolic concentration of basil (Ocimum basilicum L.) leaves. Food Chem. 2010, 123, 1235–1241. [Google Scholar] [CrossRef]
- Hikosaka, S.; Moriyama, F.; Goto, E. Effects of photosynthetic photon flux density and red/blue light ratio on the leaf shape and concentrations of functional and aromatic compounds in sweet basil (Ocimum basilicum L.). Hort. J. 2021, 273, 357–364. [Google Scholar] [CrossRef]
- Al-Huqail, A.; El-Dakak, R.M.; Sanad, M.N.; Badr, R.H.; Ibrahim, M.M.; Soliman, D.; Khan, F. Effects of climate temperature and water stress on plant growth and accumulation of antioxidant compounds in sweet basil (Ocimum basilicum L.) leafy vegetable. Scientifica 2020, 2020, 3808909. [Google Scholar] [CrossRef] [PubMed] [Green Version]
- Bekhradi, F.; Delshad, M.; Marín, A.; Luna, M.C.; Garrido, Y.; Kashi, A.; Gil, M.I. Effects of salt stress on physiological and postharvest quality characteristics of different Iranian genotypes of basil. Hortic. Environ. Biotechnol. 2015, 56, 777–785. [Google Scholar] [CrossRef]
- Maggio, A.; De Pascale, S.; Barbieri, G.; Raimondi, G.; Orsini, F. Yield and quality of hydroponically grown sweet basil cultivars. Acta. Hort. 2006, 723, 357–360. [Google Scholar]
- Ciriello, M.; Pannico, A.; El-Nakhel, C.; Formisano, L.; Cristofano, F.; Duri, L.G.; Rouphael, Y. Sweet basil functional quality as shaped by genotype and macronutrient concentration reciprocal action. Plants 2020, 9, 1786. [Google Scholar] [CrossRef]
- Lam, V.P.; Kim, S.J.; Park, J.S. Optimizing the electrical conductivity of a nutrient solution for plant growth and bioactive compounds of Agastache rugosa in a plant factory. Agronomy 2020, 10, 76. [Google Scholar] [CrossRef] [Green Version]
- Khan, K.A.; Yan, Z.; He, D. Impact of light intensity and nitrogen of nutrient solution on nitrate content in three lettuce cultivars prior to harvest. J. Agric. Sci. 2018, 10, 99–109. [Google Scholar] [CrossRef]
- Nguyen, D.T.; Lu, N.; Kagawa, N.; Kitayama, M.; Takagaki, M. Short-term root-zone temperature treatment enhanced the accumulation of secondary metabolites of hydroponic coriander (Coriandrum sativum L.) grown in a plant factory. Agronomy 2020, 10, 413. [Google Scholar] [CrossRef] [Green Version]
- Carrasco, G.; Ramírez, P.; Vogel, H. Effect of the electrical conductivity of the nutrient solution on yield and essential oil in basil grown by NFT. Idesia 2007, 25, 59–62. [Google Scholar]
- Morano, G.; Amalfitano, C.; Sellitto, M.; Cuciniello, A.; Maiello, R.; Caruso, G. Effects of nutritive solution electrical conductivity and plant density on growth, yield and quality of sweet basil grown in gullies by subirrigation. Adv. Hortic. Sci. 2017, 31, 25–30. [Google Scholar]
- Nguyen, T.K.L.; Yeom, M.S.; Oh, M.M. Effect of a newly-developed nutrient solution and electrical conductivity on growth and bioactive compounds in perilla frutescens var. Crispa. Agronomy 2021, 11, 932. [Google Scholar] [CrossRef]
- Bonasia, A.; Lazzizera, C.; Elia, A.; Conversa, G. Nutritional, biophysical and physiological characteristics of wild rocket genotypes as affected by soilless cultivation system, salinity level of nutrient solution and growing period. Front. Plant Sci. 2017, 8, 300. [Google Scholar] [CrossRef] [PubMed] [Green Version]
- Moya, C.; Oyanedel, E.; Verdugo, G.; Flores, M.F.; Urrestarazu, M.; Álvaro, J.E. Increased electrical conductivity in nutrient solution management enhances dietary and organoleptic qualities in soilless culture tomato. HortScience 2017, 52, 868–872. [Google Scholar] [CrossRef] [Green Version]
- Sun, J.; Lu, N.; Xu, H.; Maruo, T.; Guo, S. Root zone cooling and exogenous spermidine root-pretreatment promoting Lactuca sativa L. growth and photosynthesis in the high-temperature season. Front. Plant Sci. 2016, 7, 368. [Google Scholar] [CrossRef] [PubMed] [Green Version]
- Prehn, A.E.; Owen, J.S., Jr.; Warren, S.L.; Bilderback, T.E.; Albano, J.P. Comparison of water management in container-grown nursery crops using leaching fraction or weight-based on demand irrigation control. J. Environ. Hort. 2010, 28, 117–123. [Google Scholar] [CrossRef]
- Xu, W.; Lu, N.; Kikuchi, M.; Takagaki, M. Continuous lighting and high daily light integral enhance yield and quality of mass-produced nasturtium (Tropaeolum majus L.) in plant factories. Plants 2021, 10, 1203. [Google Scholar] [CrossRef]
- Gonçalves, S.; Gomes, D.; Costa, P.; Romano, A. The phenolic content and antioxidant activity of infusions from Mediterranean medicinal plants. Ind. Crops Prod. 2013, 43, 465–471. [Google Scholar] [CrossRef]
- Ding, X.; Jiang, Y.; Zhao, H.; Guo, D.; He, L.; Liu, F.; Zhou, Q.; Nandwani, D.; Hui, D.; Yu, J. Electrical conductivity of nutrient solution influenced photosynthesis, quality, and antioxidant enzyme activity of pakchoi (Brassica campestris L. ssp Chinensis) in a hydroponic system. PLoS ONE 2018, 13, e0202090. [Google Scholar] [CrossRef]
- Park, S.Y.; Oh, S.B.; Kim, S.M.; Cho, Y.Y.; Oh, M.M. Evaluating the effects of a newly developed nutrient solution on growth, antioxidants, and chicoric acid contents in Crepidiastrum denticulatum. Hortic. Environ. Biotechnol. 2016, 57, 478–486. [Google Scholar] [CrossRef]
- Samarakoon, U.C.; Weerasinghe, P.A.; Weerakkody, W.A.P. Effect of electrical conductivity [EC] of the nutrient solution on nutrient uptake, growth and yield of leaf lettuce (Lactuca sativa L.) in stationary culture. Trop. Agric. Res. 2006, 18, 13–21. [Google Scholar]
- Abbas, M.S. Assessment of density and cultivation type on growth and yield of two cultivars of basil (Ocimum basilicum L.). Int. J. Agronomy Agric. Res. 2014, 5, 74–79. [Google Scholar]
- Schwarz, D.; Kläring, H.P.; Van Iersel, M.W.; Ingram, K.T. Growth and photosynthetic response of tomato to nutrient solution concentration at two light levels. J. Am. Soc. Hortic. Sci. 2002, 127, 984–990. [Google Scholar] [CrossRef] [Green Version]
- Zeng, H.; Wang, G.; Hu, X.; Wang, H.; Du, L.; Zhu, Y. Role of microRNAs in plant responses to nutrient stress. Plant Soil 2014, 374, 1005–1021. [Google Scholar] [CrossRef]
- Amalfitano, C.A.; Del Vacchio, L.D.V.; Somma, S.; Cuciniello, A.C.; Caruso, G. Effects of cultural cycle and nutrient solution electrical conductivity on plant growth, yield and fruit quality of ‘Friariello’ pepper grown in hydroponics. Hort. Sci. 2017, 44, 91–98. [Google Scholar]
- Kiferle, C.; Maggini, R.; Pardossi, A. Influence of nitrogen nutrition on growth and accumulation of rosmarinic acid in sweet basil (Ocimum basilicum L.) grown in hydroponic culture. Aust. J. Crop Sci. 2013, 7, 321–327. [Google Scholar]
- Chishaki, N.; Horiguchi, T. Responses of secondary metabolism in plants to nutrient deficiency. In Plant Nutrition for Sustainable Food Production and Environment; Ando, T., Fujita, K., Mae, T., Matsumoto, H., Mori, S., Sekiya, J., Eds.; Springer: Dordrecht, The Netherlands, 1997; Volume 43, pp. 987–991. [Google Scholar]
- Jakovljević, D.; Topuzović, M.; Stanković, M. Nutrient limitation as a tool for the induction of secondary metabolites with antioxidant activity in basil cultivars. Ind. Crops Prod. 2019, 138, 111462. [Google Scholar] [CrossRef]
- Galieni, A.; Di Mattia, C.; De Gregorio, M.; Speca, S.; Mastrocola, D.; Pisante, M.; Stagnari, F. Effects of nutrient deficiency and abiotic environmental stresses on yield, phenolic compounds and antiradical activity in lettuce (Lactuca sativa L.). Sci. Hortic. 2015, 187, 93–101. [Google Scholar] [CrossRef]
- Velioglu, Y.; Mazza, G.; Gao, L.; Oomah, B.D. Antioxidant activity and total phenolics in selected fruits, vegetables, and grain products. J. Agric. Food Chem. 1998, 46, 4113–4117. [Google Scholar] [CrossRef]
- Akula, R.; Ravishankar, G.A. Influence of abiotic stress signals on secondary metabolites in plants. Plant Signal. Behav. 2011, 6, 1720–1731. [Google Scholar] [CrossRef]
- Isah, T. Stress and defense responses in plant secondary metabolites production. Biol. Res. 2019, 52, 39. [Google Scholar] [CrossRef] [Green Version]
- Naikoo, M.I.; Dar, M.I.; Raghib, F.; Jaleel, H.; Ahmad, B.; Raina, A.; Naushin, F. Role and regulation of plants phenolics in abiotic stress tolerance: An overview. In Plant Signaling Molecules: Role and Regulation under Stressful Environments; Khan, M.I.R., Ferrante, A., Reddy, P.S., Khan, N.A., Eds.; Elsevier: Gurgaon, India, 2019; pp. 157–168. [Google Scholar]
Publisher’s Note: MDPI stays neutral with regard to jurisdictional claims in published maps and institutional affiliations. |
© 2022 by the authors. Licensee MDPI, Basel, Switzerland. This article is an open access article distributed under the terms and conditions of the Creative Commons Attribution (CC BY) license (https://creativecommons.org/licenses/by/4.0/).