Article

Monitoring Freeze-Damage in Grapefruit by Electric Bioimpedance Spectroscopy and Electric Equivalent Models

by
David Romero Fogué
1,
Rafael Masot Peris
2,
Javier Ibáñez Civera
2,
Laura Contat Rodrigo
2 and
Nicolas Laguarda-Miro
2,*
1
School of Design Engineering, Universitat Politècnica de València, Camí de Vera s/n, 46022 Valencia, Spain
2
Instituto Interuniversitario de Investigación de Reconocimiento Molecular y Desarrollo Tecnológico (IDM), Unidad Mixta Universitat Politècnica de València—Universitat de València, Camí de Vera s/n, 46022 Valencia, Spain
*
Author to whom correspondence should be addressed.
Horticulturae 2022, 8(3), 218; https://doi.org/10.3390/horticulturae8030218
Submission received: 20 January 2022 / Revised: 25 February 2022 / Accepted: 26 February 2022 / Published: 2 March 2022
(This article belongs to the Special Issue Postharvest Management of Citrus Fruit)

Abstract

:
Grapefruit is a cold-sensitive citrus fruit, and freezing can spoil the harvest when the fruit is still on the tree and even later during manufacturing and transport due to inappropriate postharvest management. This study performed a specific Electric Impedance Spectroscopy (EIS) analysis and statistical data treatment to obtain an EIS and Artificial Neural Networks (ANN)-based model for early freeze-damage detection in grapefruit showing a Correct Correlation Rate of 100%. Additionally, Cryo-Field Emission Scanning Electron Microscopy observations were conducted on both fresh and frozen/thawed samples, analyzing the different impedance responses in order to understand the biological changes in the tissue. Finally, a modified Hayden electric equivalent model was parameterized to simulate the impedance response electrically and link the electric behavior of biological tissue to the change in its properties due to freezing. The developed technique is introduced as an alternative to the traditional ones, as it is fast, economic, and easy to carry out.

1. Introduction

Grapefruit (Citrus paradisi) is a citrus fruit of commercial interest due to its highly appreciated organoleptic and functional properties [1,2,3], with more than 9 million tons produced annually around the world. The Mediterranean region is of strategic importance for this product, as it is the third in terms of production, with a total of 613,956 tons, representing 6.61% of global production, and the first in terms of exports with 310,619 tons, 50.59% of Mediterranean production and 26.18% of the world’s grapefruit trade [4,5].
However, freezing temperatures are problematic for grapefruit [6], as it is a cold-sensitive fruit (in fact, it is the second-most cold-sensitive citrus fruit after lemon) [7,8], with slight tolerance variations depending on the cultivar. It has been reported that white cultivars are more sensitive to freezing temperatures than red ones [9,10]. This problem appears both in the maturation phase on the tree and later during manufacture, transport, and storage, as well as in quarantine to control pests such as the Mediterranean fly (Ceratitis capitata) [11,12,13]. Although some authors affirm that refrigerated storage of grapefruit and quarantine have minimal effects on fruit quality [14], inappropriate postharvest treatment, and freezing when the fruit is still on the tree, do have a noteworthy affect [15,16,17].
In fact, grapefruit freezing injuries have been reported in ordinary transport and quarantine processes, affecting not only the skin but altering the commercial value of the product. This damage is usually color change and rind pitting that do not necessarily affect the sensory characteristics of the fruit if the storage conditions are appropriate. However, Biolatto et al. [14] also reported primary alterations such as cell membrane rupture and other secondary ones such as ethylene production, increased respiration and decreased photosynthetic rate, increased concentration of toxic compounds, and cell disruption in controlled transport processes and quarantine for the variety “Rouge la Toma” in Salta (Argentina).
Regarding the fruit still on the tree, the most common freezing injuries are internal discoloration, browning of the flavedo and albedo, rind pitting and lesions, and water-soaked tissues [18]. These occur when, due to an intense freezing phenomenon, the critical freezing temperature is reached. Then, water in the fruit begins to freeze, both the interstitial water and that inside the cells. Depending on the speed and intensity of the freezing phenomenon, the intracellular liquid will permit the cells to recover when thawing or if the phenomenon is sufficiently intense, larger ice crystals will provoke the rupture of the cell wall and the death of the cell without any chance of recovery [19]. As for other citrus fruit, when this occurs, and depending on the intensity and duration of the phenomenon and other factors, the consequences can range from a small loss in productivity to a complete loss of the harvest [15].
Today, there is a wide range of methods to identify freeze-damage in citrus fruit [20], and advances have been reported in observation methods [21,22,23] and laboratory techniques such as near infrared spectroscopy (NIR), nuclear magnetic resonance (NMR), fluorescence, gas chromatography/mass spectroscopy (GC/MS), and ethanol detection [24,25]. Nevertheless, the majority of these techniques need specialized laboratories and personnel, as they are expensive, complex, and time-consuming.
In the search for alternatives to the existing methods and their limitations, electrochemical impedance spectroscopy (EIS) is an emerging technology that provides promising results in the agri-food industry [26,27], where it is used for a wide range of quality control applications such as sorting and assessing vegetables [28,29], fruit [30,31], meat [32], fish [33,34], honey [35], and processed products [36], as well as for pesticide detection [37] and agri-food waste valorization [38,39].
These applications are based on the ability of EIS-based techniques to send an electrical signal to a sample and analyze the received electrical response, linking changes in the signal to one or several specific properties of the analyzed food. It can be carried out easily with a specific EIS device and a sensor, using a PC and a designed software to manage the process. Once the technique is sufficiently implemented and checked, the tests can be carried out immediately, directly on-site, both in the field and in the agri-food industry, with no need for complex specialization and laboratory requirements [40].
Due to the considerable amount of data provided by EIS analyses, a computer-based statistical data treatment is required [41]. Thus, specific software [42] allows us to check the correlation between electric bioimpedance responses and freeze-damage in the fruit by conducting preliminary nonsupervised statistical analyses (PCA) [43] and more complex supervised analyses (PLS-DA) [44,45]. Additionally, artificial neural networks (ANN) can be used to complete the data analyses [46] and later modeling [47], as they are flexible, adaptable, and easily fit nonlinear systems [48]. Comparatively, ANNs have a huge potential for this type of application [49,50], as they are able to provide simpler models that are self-corrective, self-adaptive, and statistically reliable and robust [51]. Additionally, ANNs are easier to implement in microprocessors to be used in portable devices due to their lower computational requirements [52,53]. Additionally, ANNs have been applied in other citrus fruit studies with promising results [54].
Beyond the statistical treatment and ANN model design, changes in the EIS responses due to freezing can be characterized by electric equivalent circuits thus giving an electrical “explanation” to the biological side of the problem. These circuits consist of several electric components such as resistors and capacitors that simulate the cell structure of the biological tissue and its electric behavior [55,56]. They are diverse in complexity, ranging from simple ones such as those introduced by Cole [57] to more complex ones as suggested by Hayden and later evolutions [58]. Some of these models use a specific element called a constant phase element (CPE) [56] to better fit the EIS data to the model and differentiate resistive and capacitive elements in the biological tissue structure as a CPE keeps its phase constant across the entire analyzed frequency range [31]; thus, it is able to explain certain inhomogeneities in tissular electric behavior due to complex biological responses to EIS [59,60].
Finally, the introduced method is able to detect variations in grapefruit bioimpedance, biologically explain these changes, and link them to freeze-damage in the fruit. Thus, it is possible to create a robust, reliable prediction system to detect freeze-damage in grapefruit, identifying those affected in a rapid, easy, low-cost way.

2. Materials and Methods

2.1. Sample Preparation

“Star Ruby” Grapefruit (Citrus paradisi) were selected for this study. The fruit, purchased in a local market (Valencia, Spain), was selected prioritizing the homogeneity of the sample: same size, cultivar, origin and batch, ripeness and physical aspect, and absence of external damage [24].
Once in the laboratory, the fruit were washed and stored at room temperature for at least 12 h prior to the assays. For the assays with frozen fruit, the selected set of grapefruit were placed in a freezer (LG-GBB530PZCFB, LG Electronics Inc ©, Seoul, Korea) controlling the temperature to simulate a freezing night. The evolution of the inner temperature of the fruit in the freezer was measured with a multimeter (FLUKE 16 Multimeter, FLUKE, Everett, WA, USA). The grapefruit were kept in the freezer at −9 °C for 6–7 h until the temperature was in the range −0.9 °C to −1.2 °C exactly in the place where the EIS sensor had to be introduced to carry out the electrochemical measurements (1.5 cm inside the fruit). Then, the set was allowed to thaw at room temperature for at least 12 h. Finally, a couple of fresh and frozen/thawed fruit were separated from the rest of the set and used for microscope observations.

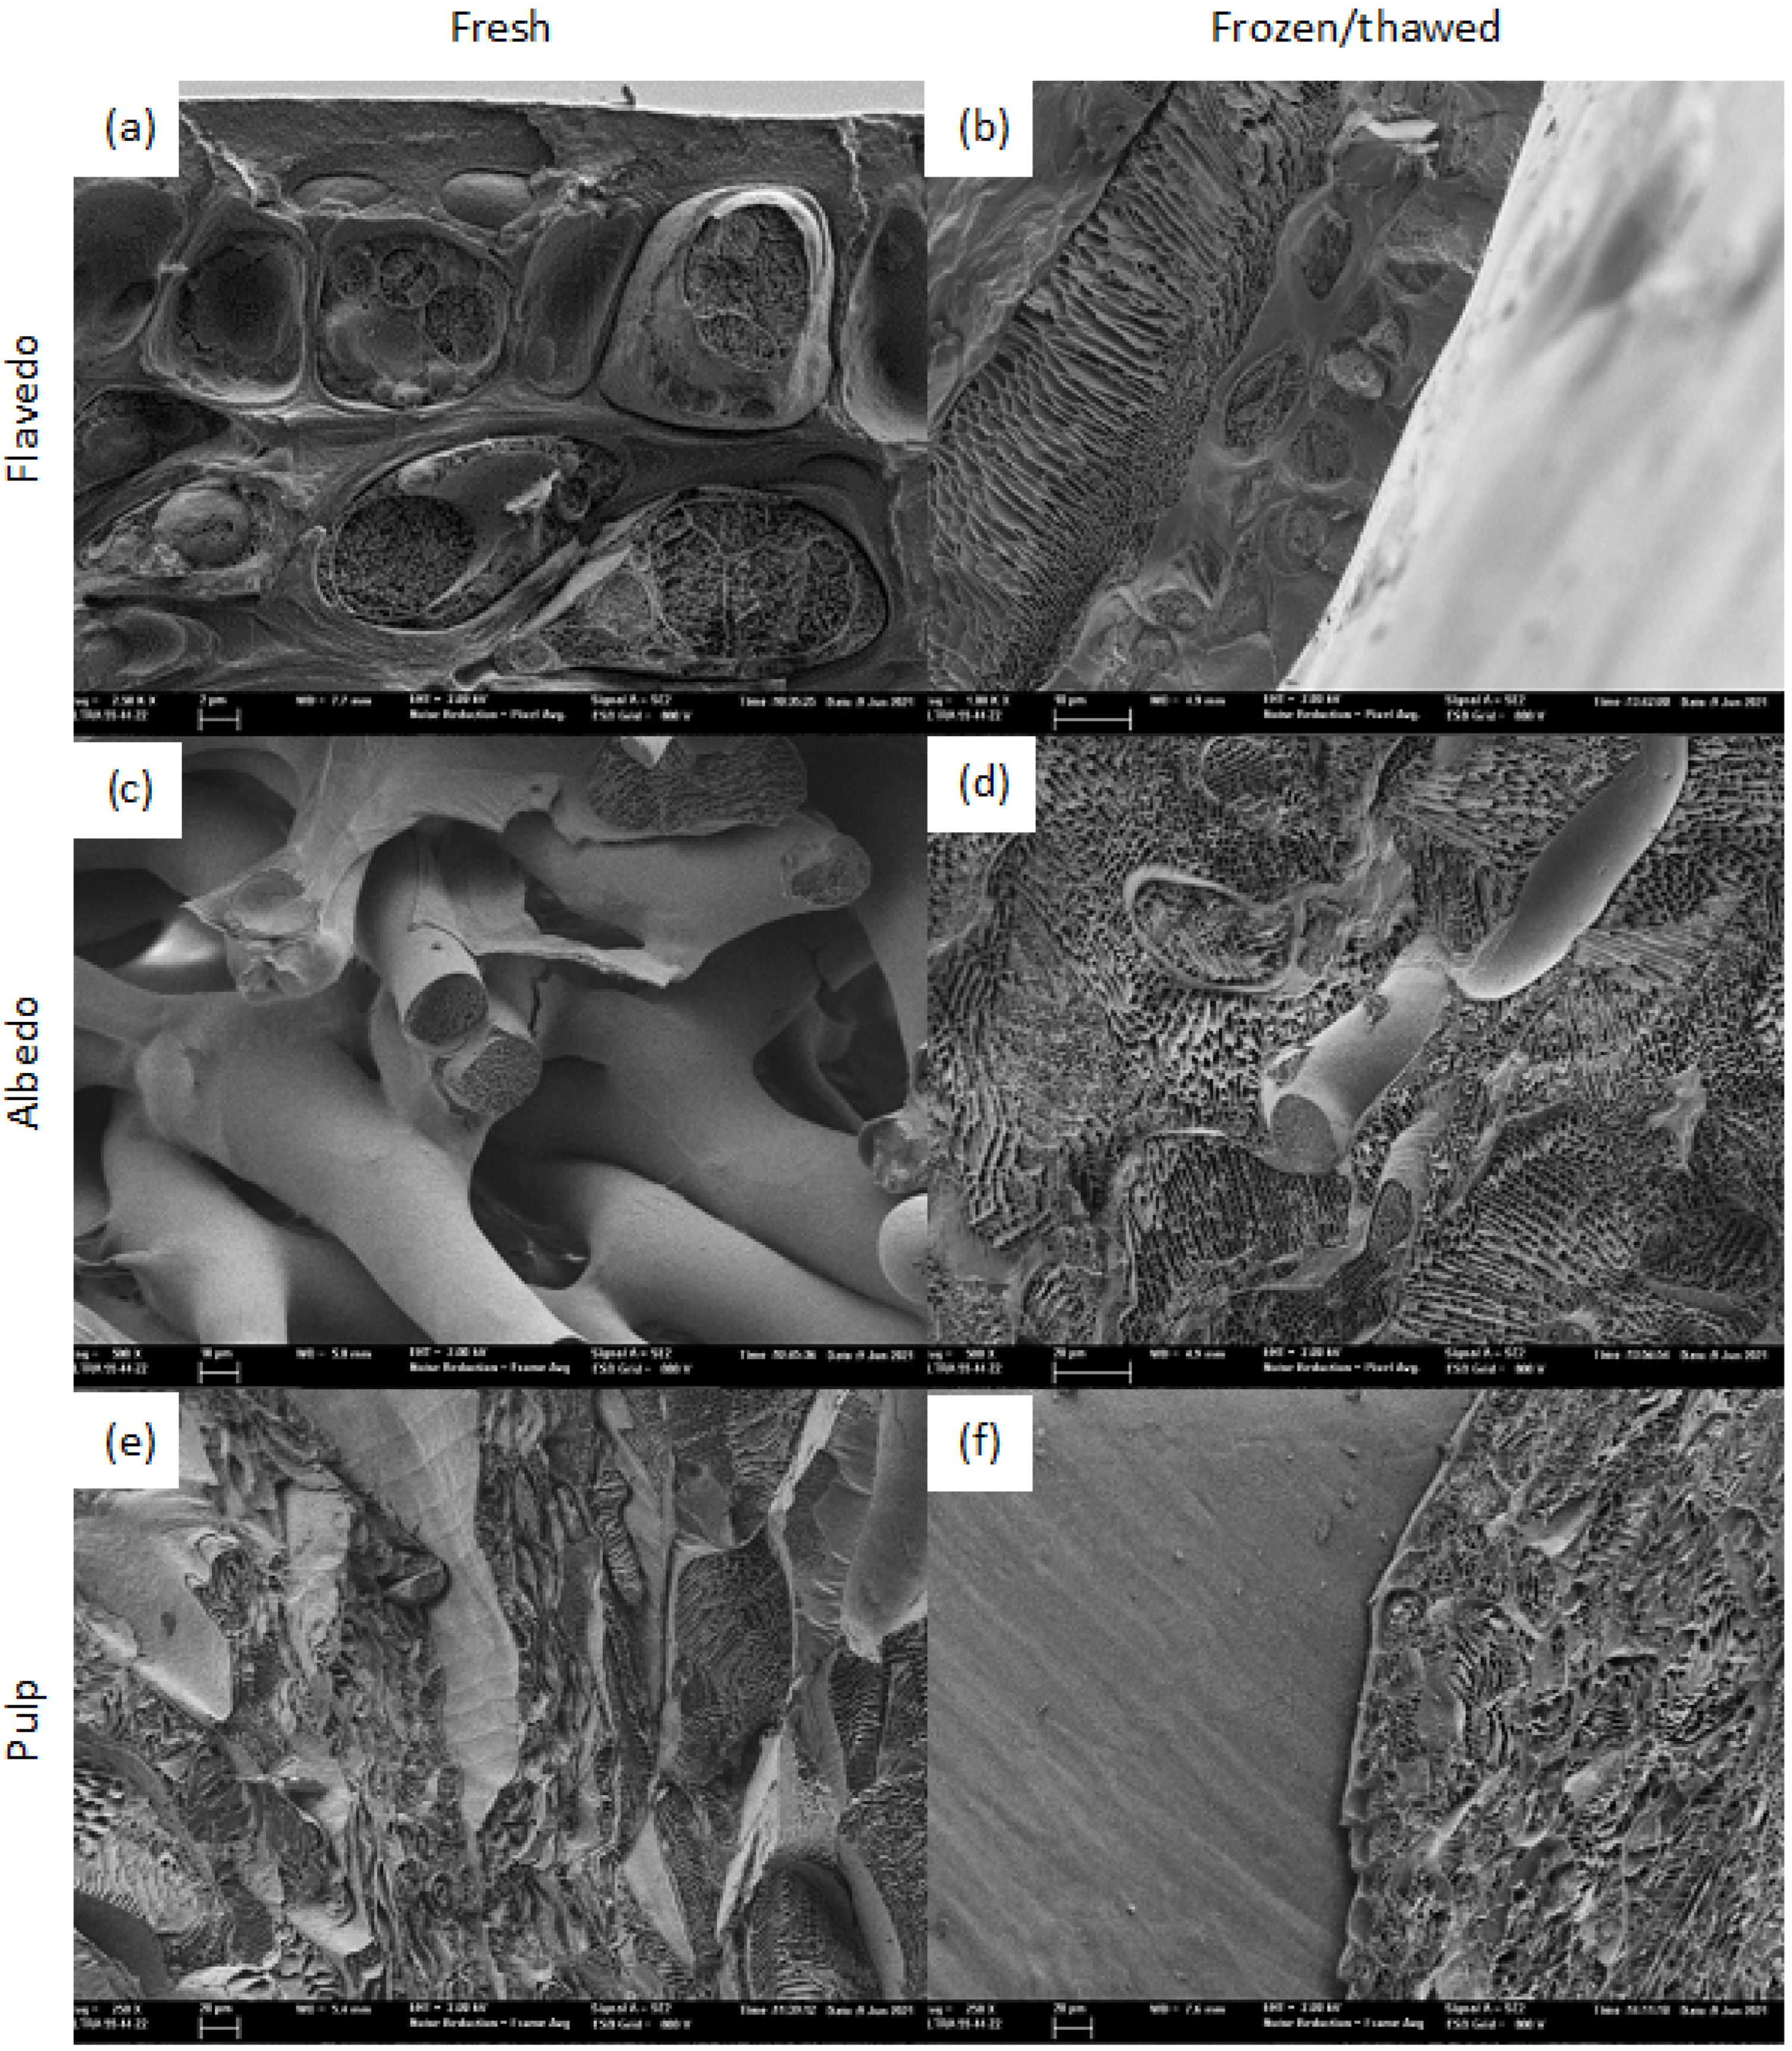
2.2. Cryo-Field Emission Scanning Electron Microscopy (Cryo-FESEM)

A ZEISS ULTRA 5 microscope 5 (Oxford Instruments, Abingdon, UK) from the Electron Microscopy Service at the UPV was used to study microstructural and morphological tissular/cellular changes due to the freezing/thawing process. To do so, samples were mounted on a sample-holder and instantly frozen in slush nitrogen. Then they were placed in the preparation chamber to be fractured and sublimated to show the inner structure (7 min at −90 °C for flavedo and albedo samples and 20 min at −90 °C for pulp) and then were platinum-coated for 15 s. Samples were finally transferred to the microscope chamber to be observed using specific imaging conditions (2 kV acceleration voltage and 4.9 mm to 7.7 mm working distances) [61].

2.3. EIS Measurement System

Electrical impedance spectroscopy measurements of the analyzed biological tissues (grapefruit flavedo, albedo, and pulp) were carried out using a device [62] designed by the Group of Electronic Devices and Printed Sensors (GED + PS) of the Interuniversity Research Institute of Molecular Recognition and Technology Development (IDM) at the Universitat Politècnica de València [24,63]. The bespoke system consists of four interconnected parts: a sensor, a signal generator device, a personal computer as hardware parts, and specifically programmed software to control the whole system (Figure 1).
The bespoke sensor is a double-needle electrode in a parallel-cylinder architecture made of stainless-steel and fixed in a plastic cylindrical structure to hold the different elements of the sensor in a single solid piece. The parallel needles are 1.5 cm in length and 1 mm in diameter, with 1 cm separation, and the plastic structure of the sensor is 3 cm high and 2 cm in diameter. The sensor is connected to the signal generator device by a wire.
The EIS signal generator device was specifically designed to generate alternate sinusoidal voltage signals in the frequency range 1 Hz to 1 MHz and a maximum of 1 Vpp in amplitude. It was also able to receive the electrical responses to the applied pulses in the analyzed samples in the form of current and voltage data. A later impedance calculation using the Discrete Fourier Transform allowed the device to provide up to 100 impedance data results per assay (50 modules and 50 phases).
This device consisted of a series of electronic components: a couple of complex programmable logic devices (CPLD, Altera EPM7160SLC84), a 10-bit digital–analog converter (DAC), two 8-bit analog–digital converters (ADC), and a static 2 KB random access memory (RAM). The first CPLD was associated with the DAC and the RAM memory in order to receive specific instructions from the PC and generate the electric signal on demand. The second CPLD was programmed to receive and sample the signal responses (voltage and current) from the sensor and was associated with the ADC and several analog signal adaption circuits and a modulable current sensor. This device was connected to the PC via a USB port.
A PC consisting of a CPU (Tacens Stella mATX, TACENS EUROPE, Vitoria-Gasteiz, Spain) and an LCD Screen (SDM-S51R, SONY, Tokyo, Japan) is the final part of the hardware for which specific software was designed and installed to control the whole system. The software was conceived to be intuitive and easy to configure by the operator. A series of buttons and selection menus help the user to define the signal (frequencies and amplitude) to be sent to the signal generator and, thus, to the sensor. The software is also designed to receive the voltage and current responses from the analyzed sample and use a Discrete Fourier Transform to calculate the electrical impedance spectroscopy response of the sample in terms of module and phase. Finally, up to 100 data points per assay (50 modules and 50 phases) are stored in the PC memory for further analysis and data treatment.

2.4. EIS Laboratory Analyses and Data Treatment

Once a set of ten samples was selected and prepared, EIS analyses were carried out following a previously defined laboratory protocol and a strict schedule. Each analyzed sample was studied both fresh and frozen/thawed with three different tests: (a) puncturing the sensor directly into the peel, (b) without the peel in just one segment, and (c) without the peel puncturing the sensor between two segments (Figure 1).
Firstly, the EIS system was switched on and checked. Next, the sample to be analyzed was placed on a support and examined, annotating any observations on the corresponding laboratory notebook sheet. The sample had to be in the laboratory at room temperature at least 12 h for tempering. Then, the sample’s temperature was measured with the multimeter and punctured with the sensor. The assay was started by clicking the corresponding button of the software on the PC screen, and the preliminarily defined electric wave was generated by the EIS device and sent to the sample via the puncturing sensor. The test finished when the PC received the EIS response from the sample, which was transformed into module and phase data and stored. The analysis was repeated three times at each puncture point without removing the sensor for statistical purposes. Once finished, the sensor was removed and punctured into another part of the fruit to repeat the assay in at least three different places. When the tests in the fruit were finished (three test punctures with three repetitions each), the sensor was removed from the sample and washed with distilled water and a tissue. The fruit was then stored in the freezer for the freezing/thawing process (6–7 h) and 12 h at room temperature for retempering before repetition 24 h later. Once the protocol was completed, the process could be repeated for the next fruit.
The assay provides a large amount of data for treatment, as the complete analysis for the set of samples (10 fruit) punctured in three places with three repetitions and analyzed twice (fresh and after freezing/thawing) means working with a set of 18,000 data points.
First, Exponential Smoothing was used as a noise filter [64] in the preliminary data preprocessing stage, as shown in Equation (1).
z t = α x t + ( 1 α ) z t 1
Next, a statistical analysis of the data was performed using a double multivariate study (a) a nonsupervised analysis via Principal Component Analysis (PCA) and (b) a supervised one using a Partial Least Squares-Discriminant Analysis (PLS-DA). A PCA was conducted to detect any natural grouping of the raw data indicating a correlation with the samples’ characteristics. PLS-DA was carried out to classify the samples into two categories (fresh vs. frozen/thawed) depending on the studied numerical independent variables [63,65]. To do so, the data were randomly divided into a calibration dataset (67% of the data) and a test dataset (the remaining 33% of the data) [66]. Standardization and mean centering by autoscale were used for preprocessing, and “Venetian blinds” were used for cross-validation. Statistical validity of the models was studied by the coefficient of determination (R2) and the corresponding root mean square errors of cross-validation (RMSCV) and prediction (RMSEP) [67]. Additionally, an ANN-based data treatment was conducted in order to better understand the multivariable dependence of the EIS samples responses and, thus, create simpler and adaptive models suitable for implementation in a microprocessor [48,49]. To do so, a specific ANN-dataset was used. This dataset consisted of 20 values (10 modules and 10 phases) per assay corresponding to those obtained in the frequency range 99.6 Hz–542.56 Hz. Next, it was divided into three different datasets for training (70%), validation (15%), and testing (15%). A preliminary auto-search of the ideal net architecture helped to define the type and structure of the ANN. Further studies permitted the inner definition of the network by fixing layers, number of neurons, neuron functions, and functions within the layers. The risk of overfitting was solved by the proportionality of the net structure, cross-validation, and early stopping [68]. Finally, validation of the obtained neural model was tested by studying the correct classification rate (CCR%) and the confusion matrix [24]. The commercial software SOLO© Eigenvector Research, Ind., Manson, WA, USA) and Alyuda Neurointelligence 2.2.© (Alyuda Research Inc., Cupertino, CA, USA) were respectively used for statistical analyses and ANN modeling.

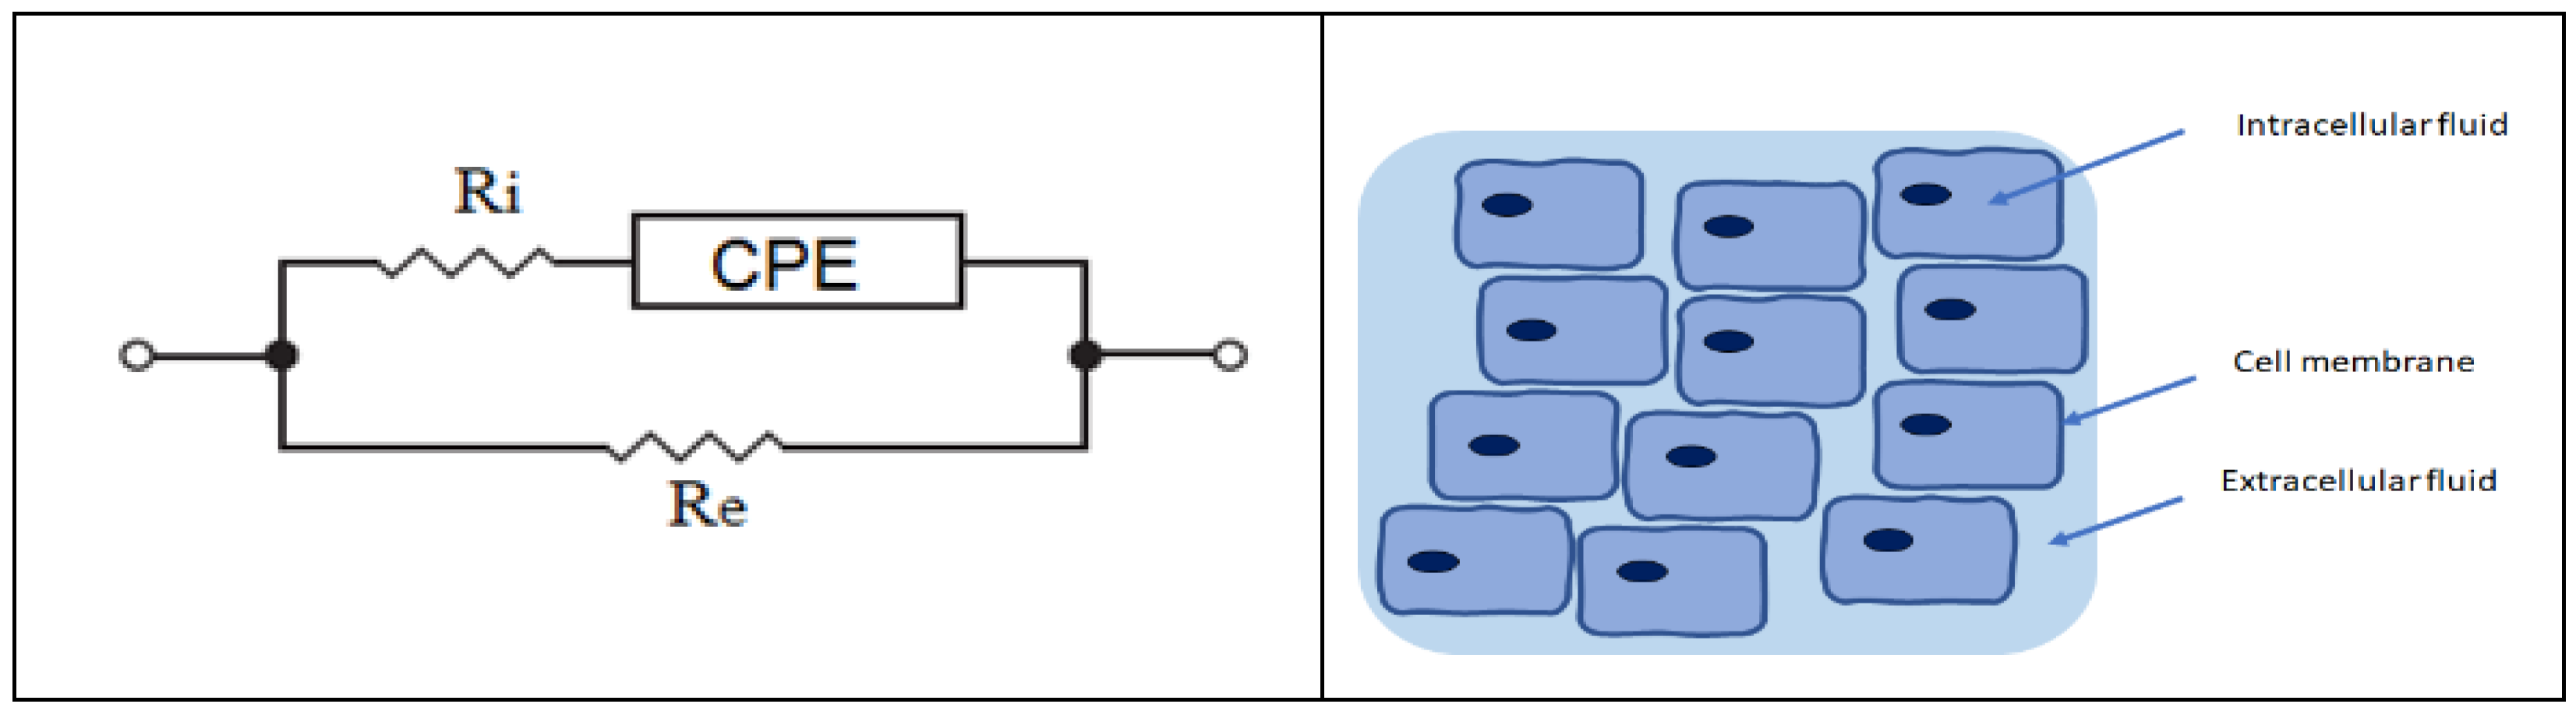
2.5. Electric Equivalent Circuits and Modeling

As for the preliminary statistical treatment, the data were preprocessed using exponential smoothing in order to reduce noise [19]. Next, these data were used to study their fit with a modified Hyden electric equivalent circuit (Figure 2). This was the selected electric model, as there have been several changes in the interpretation of the electric behavior of biological tissues since the first equivalent circuit proposed by Fricke–Morse in 1925. The selected modified Hayden electric equivalent circuit tests the goodness of fit with this kind of tissue and is more complex than other models, but not so much that it makes the simulation processes too difficult [58]. Modified Hayden fitness with biological tissues is better than other models because of the inclusion of a constant phase element (CPE) in the circuit able to assume the dielectric tissular relaxation due to the inhomogeneous cell distribution in the sample tissue [28].
Equations (2) and (3) were used to fit the equivalent model (Zeq), and its statistic validity was studied by R2 and root mean square error (RMSE):
Z e q = R E | | ( R i + Z C P E ) = R e · ( R i + Z C P E ) R e + ( R i + Z C P E )
Z C P E = 1 C P E · ( j w ) α
where w is the angular frequency and α is a dimensionless constant in the range [0,1] related to the nonstrictly capacitive behavior of the CPE.
The software Proteus© (Labcenter Electronics, North Yorkshire, England) was used for the design and parameter determination of the equivalent circuit, and a Generalized Reduced Gradient (GRG) nonlinear algorithm (Excel Solver) was used for model optimization.

3. Results

3.1. Cryo-FESEM Observations

Microscopy pictures were taken at different magnification levels in the range 100×–5000× for the studied grapefruit, both fresh and frozen/thawed, focusing on three different tissues: flavedo (exocarp), albedo (mesocarp), and pulp (juice sacs in a segment) [69]. Figure 3 shows a comparison between fresh and frozen/thawed tissues in the abovementioned parts of the sample to visually explain the structural and inner changes caused by freezing in the cellular tissue.
Fresh flavedo (Figure 3a) is well-structured and organized with joint cells and small intercellular spaces. It is possible to observe the external waxy cuticle, the quality of the cellular walls, and internal organelles such as nuclei and vacuoles. Opposite, frozen/thawed flavedo (Figure 3b) is not so well-structured, with more distant cells and larger intercellular spaces. The cell wall is not as evident, and inner organelles cannot be seen, probably because the cells have been affected by freezing, breaking inner organelles and even cell walls and letting intracellular liquid flow toward the outer interstices.
The differences in the mesocarp are notable, as fresh albedo (Figure 3c) shows its typical “spongy” filamentous structure with huge interstitial spaces full of air. However, frozen/thawed albedo (Figure 3d) appears with a diffused structure in a liquid sea filling all the interstitial spaces. This liquid is probably juice from the segments. Thus, its isolation function has completely disappeared.
Figure 3e,f show the limits of a juice sac in the pulp of a segment, in which we can identify the stalks and the cells inside the sacs containing the juice. Fresh pulp (Figure 3e) seems to be well-structured with no evident vascular bundles among sacs, joint cells with clearly defined cell walls containing the cytoplasm, and very small interstices. In contrast, frozen/thawed pulp (Figure 3f) is not well-organized, except the outer cells in the stalk where a linear organization of the cells is obvious, and the septal vascular bundle is clearly shown, separating the sacs. Inside the sac, the cells have been broken, the cell walls are diffused, or they have disappeared, and the tissue has a smashed appearance. This is probably due to the presence of inner-cell liquid (juice) in the intercellular spaces generating this diffuse texture in the microscope picture. Obviously, frozen/thawed sacs are no longer inner parallel structures in a segment but a pulp amalgam.

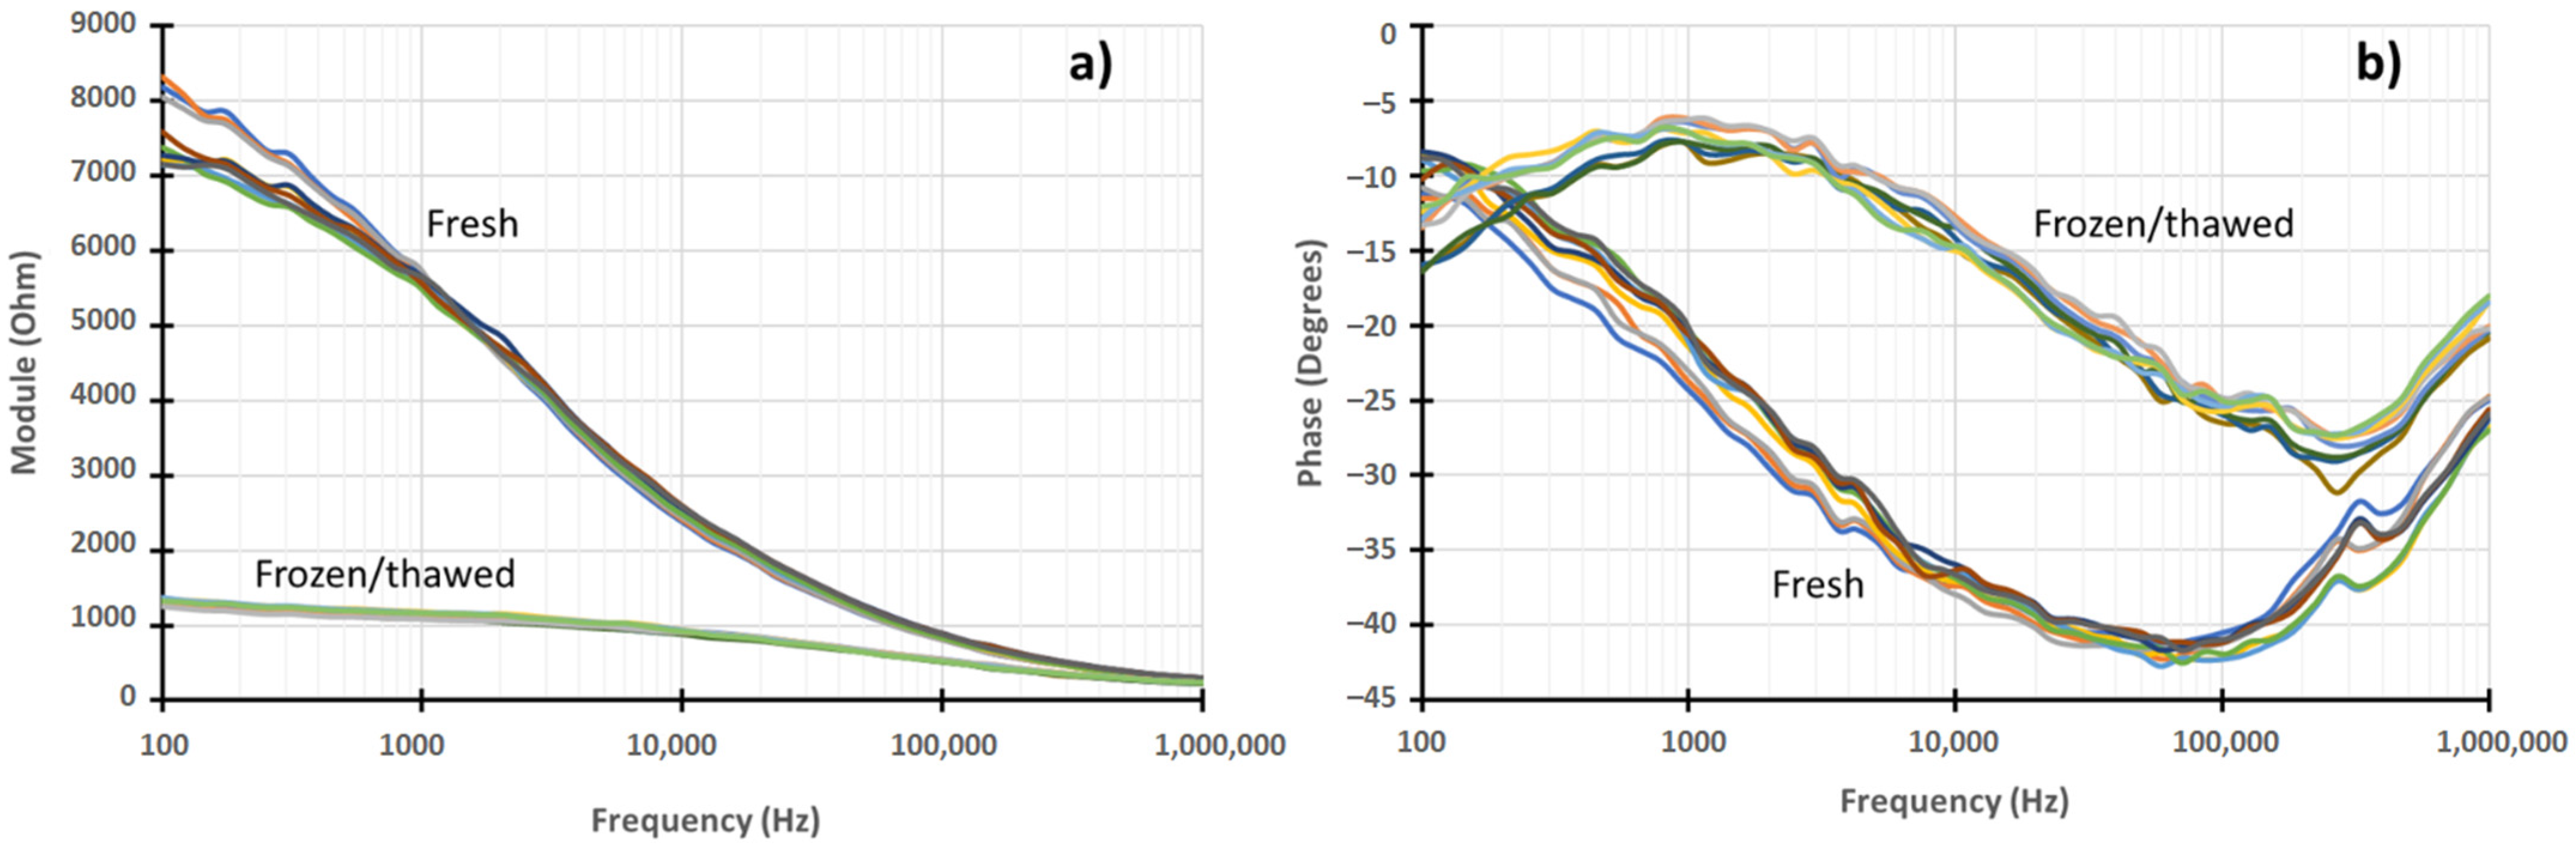
3.2. EIS Laboratory and Data Treatment Results

Sampling, treatment, and visualization of the obtained data from the EIS analyses permitted study of the electrical behavior of the samples. EIS datasets consisted of 100 values (50 modules and 50 phases) per assay showing the evolution of the response over the studied frequency range 100 Hz–1 MHz. As laboratory assays were conducted in three different ways: puncturing the fruit (a) directly on the peel, (b) without the peel, and (c) without the peel and between two sections (Figure 1), authors compared the results, observed that all of the three datasets showed clear differences between fresh and frozen/thawed samples, and decided to carry out further data treatment, statistical analyses, and modeling with the whole fruit directly punctured on the peel.
As a result, it was possible to observe clear differences in behavior between fresh and frozen/thawed samples. These differences were particularly evident in the module values for the lower frequencies, showing fresh sample modules up to 8 kΩ at 100 Hz and frozen/thawed sample modules of 1 kΩ at the same frequency (Figure 4a). On the other hand, the phase data were also different, being particularly obvious from the middle of the studied range to the highest frequency (1–100 kHz) showing lower phases for fresh samples and moderate phases for frozen/thawed samples with differences of up to 20 degrees (Figure 4b).
Statistical treatment of the data allowed us to identify a clear nonsupervised trend to sample classification by type, as stated by the corresponding PCA analysis (Figure 5). The PCA results were obtained using autoscale preprocessing and Venetian blinds cross-validation. Four principal components were needed to explain up to 97.98% of the cumulative variance. Table 1 shows the percentages of variance explained by each principal component.
Next, a supervised discriminant analysis by PLS-DA was performed using the same autoscale and cross-validation options. It is possible to correctly classify 100% of the studied samples (Figure 6), as the obtained model showed the greatest sensitivity and specificity for the three modeling steps (training, validation, and test).
Finally, an ANN model was designed based in a 20-3-1 network architecture as suggested by the preliminary design architecture assays. The designed network has 3 layers including the following node distribution: 20 input nodes in the first one, 3 intermediate nodes in the hidden layer and just 1 node in the output layer. In the nodes, cross-entropy was used as the output error function, hyperbolic tangent as the input activation function, and logistic as the output activation function. As a result, a Correct Correlation Rate (CCR) of 100% was obtained, and the confusion matrix was as shown in Figure 7.

3.3. Electric Equivalent Circuit Results

As a result of the electric parameterization, the values of the different elements for the modified Hayden electric equivalent circuit were obtained. Figure 8 shows the results for the specific case of grapefruit n°10. As observed, the equivalent model (Zeq) completely fits with the obtained data for the EIS module for fresh (R2 = 0.9997 and RMSE = 50.40 Ω) and frozen/thawed sample (R2 = 0.9931 and RMSE = 28.46 Ω), while fitting for the EIS phase data is excellent for the fresh sample (R2 = 0.97 and RMSE = 2.16°), and the central frequency range 1 kHz to 100 kHz for the fresh/thawed sample is not as exact at the extremes of the plot (R2 = 0.858 and RMSE = 3.27°).
The parameterized electric circuit demonstrates that it is possible to model the electric behavior of grapefruit tissues in a relatively simple way with just three main electric elements representing the resistance of the extracellular liquid (Re) in the biologic tissue, the resistance of the inner cell liquids and organelles (Ri), and a constant phase element (CPE) electrically simulating certain inhomogeneities in the tissular behavior due to complex (both capacitive and resistive) biological responses at different frequencies.

4. Discussion

Cryo-FESEM observations show clear biological damage in all the analyzed tissue samples (skin, spongy tissue, and pulp) for frozen/thawed grapefruit, demonstrating the occurrence of the monitored phenomenon. Since freeze-damage is not apparent immediately but takes time to appear visually, the objective of this study is to identify it in a rapid, easy, and economical way to facilitate decision making.
In this regard, the use of EIS in the frequency range 100 Hz to 1 MHz allows us to work in the range corresponding to the end of the α-dispersion and a wide spectrum of the β-dispersion and, therefore, effectively identify bioimpedance differences in the samples in the studied range: (a) at lower frequencies, the capacitance of the cell membranes allows the current to flow through the extracellular fluid since the components of the layers in the cell and organelle membranes (protein, macromolecules, and other constituents) have time to polarize and thus prevent the flux of electric current through them, acting as capacitive components, an, (b) in the higher frequency range, capacitive impedance decreases, since current through the cells (tissues in intracellular fluid) improves as frequency increases, therefore diminishing the electrical resistance of the tissue [70,71].
Consequently, the obtained results in EIS analyses (modules and phases) are in accordance with what was explained above, being able to discriminate fresh and frozen thawed grapefruit samples. It can be observed that the module of the impedance is inversely proportional to the frequency and much higher for fresh grapefruit samples than for frozen/thawed ones (Figure 4). This makes sense considering the biological consequences of freezing: rupture of intracellular and extracellular membranes, leakage of intracellular fluid to the extracellular interstices, amalgamated-like tissue, increased conductivity, and loss of the electrical isolation typical of cell membranes in healthy tissue. As expected, phase values of the impedance are higher for fresh grapefruit samples with intact membranes (capacitive elements) and lower for frozen/thawed ones, as can be seen in the midrange of frequencies. Therefore, the designed ANN is able to discriminate fresh and frozen/thawed grapefruit samples in a robust and reliable way (CRR = 100%), reinforcing the increasing use of these techniques in agri-food applications [72,73].
Finally, the electrical simulation responds to the abovementioned phenomena, showing a slight decrease in the alpha value when freezing is observed. Additionally, Re and Ri values are notably higher for the fresh simulation than for the frozen/thawed model, establishing the Re/Ri relationship as an indicator of cell membrane healthiness. However, the CPE value increases for the frozen/thawed sample simulation as CPE does not represent only the capacitive component of the sample but a complex interaction that corresponds to the nonhomogeneous behavior of the biological tissue. Thus, there is a resistive component which is compensating for the significant decrease in the Ri value on freezing.

5. Conclusions

EIS analyses with fresh and frozen/thawed grapefruit were conducted revealing a clearly differentiated impedance response (both for module and phase) for fresh and frozen/thawed samples. The obtained data were statistically analyzed using PCA to obtain an explanation of 97.98% of the variance with just four principal components and also by PLS-DA being able to correctly classify 100% of the studied samples. The designed ANN model showed that CCR = 100% with no classification mistake in the confusion matrix, thus creating a robust and reliable ANN-based prediction model and reinforcing the increasing use of these techniques in agri-food applications.
The electrical behavior of the analyzed samples was modeled using a modified Hayden electric equivalent model. Parameterization showed an excellent theoretical/experimental fit (the obtained R2 were in the range (0.858–0.999)), biologically corresponding to the observed microscopic characteristics of the fresh tissue and its degradation on freezing.
Thus, it is possible to monitor freeze-damage in grapefruit by means of EIS and ANN-based models as well as by electric equivalent models with sufficient accuracy and robustness. Consequently, the authors present the technique as an alternative to the ones existing today for freeze-damage detection, as it is economic, rapid, and easy, and there is no need for specialized laboratories or personnel.

Author Contributions

Conceptualization of the study, N.L.-M.; investigation, sample preparation and laboratory analyses, D.R.F., L.C.R. and N.L.-M.; data interpretation and modeling R.M.P. and J.I.C.; original draft preparation, N.L.-M. and D.R.F.; writing—review and editing, D.R.F., R.M.P. and N.L.-M.; overall coordination, N.L.-M. All authors have read and agreed to the published version of the manuscript.

Funding

This research was funded by the Spanish Government/FEDER funds, Ministerio de Economía y Empresa (MINECO)/Fondo Europeo de Desarrollo Regional (FEDER), (Grant No. RTI2018-100910-B-C43).

Institutional Review Board Statement

Not applicable.

Informed Consent Statement

Not applicable.

Data Availability Statement

The datasets generated during and/or analyzed during the current study are available from the corresponding author on request.

Acknowledgments

The Electron Microscopy Service of the UPV is acknowledged for technical support during Cryo-FESEM sessions and sample interpretation.

Conflicts of Interest

The authors declare no conflict of interest.

References

  1. Igual, M.; García-Martínez, E.; Camacho, M.M.; Navarrete-Camacho, N. Physicochemical and Sensorial Properties of Grapefruit Jams as Affected by Processing. Food Bioprocess Technol. 2013, 6, 177–185. [Google Scholar] [CrossRef] [Green Version]
  2. Kelebek, H. Sugars, organic acids, phenolic compositions and antioxidant activity of Grapefruit (Citrus paradisi) cultivars grown in Turkey. Ind. Crop Prod. 2010, 32, 269–274. [Google Scholar] [CrossRef]
  3. Mendes, C.; Rocha, J.; Direito, R.; Fernandes, A.; Sepodes, B.; Figueira, M.E.; Ribeiro, M.H. Anti-inflammatory activity of grapefruit juice in an in vivo model of ulcerative colitis: Comparability studies of unprocessed and bioprocessed juices. J. Funct. Foods 2018, 63, 103564. [Google Scholar] [CrossRef]
  4. FAOSTAT. Food and Agriculture Data. Rome, Italy. Available online: http://www.fao.org/faostat/en/#data (accessed on 30 December 2021).
  5. FAO. Citrus Fruit Fresh and Processed Statistical Bulletin 2016; Food and Agriculture Organization: Rome, Italy, 2017; p. 66. [Google Scholar]
  6. Biswas, P.; East, A.; Hewett, E.; Heyes, J.A. Intermittent Warming in Alleviating Chilling Injury—A Potential Technique with Commercial Constraint. Food Bioprocess Technol. 2016, 9, 1–15. [Google Scholar] [CrossRef]
  7. Martínez, L.; Ibacache, A.; Rojas, L. Daños por heladas en frutales. Tierra Adentro 2008, 80, 32–35. [Google Scholar]
  8. Snyder, R.L.; Melo-Abreu, J.P.; Villar-Mir, J.M. Protección Contra Las Heladas: Fundamentos, Práctica y Economía; Food and Agriculture Organization: Rome, Italy, 2010; p. 68. [Google Scholar]
  9. Alférez, F.; Burns, J.K. Postharvest peel pitting at non-chilling temperatures in grapefruit is promoted by changes from low to high relative humidity during storage. Postharvest Biol. Technol. 2004, 32, 79–87. [Google Scholar] [CrossRef]
  10. Lado, J.; Rodrigo, M.J.; Cronje, P.; Zacarías, L. Involvement of lycopene in the induction of tolerance to chilling injury in grapefruit. Postharvest Biol. Technol. 2015, 100, 176–186. [Google Scholar] [CrossRef]
  11. Lado, J.; Cronje, P.; Rodrigo, M.J.; Zacarías, L. Citrus. In Postharvest Physiological Disorders of Fruits and Vegetables; de Freitas, K.S.T., Pareek, S., Eds.; CRC Press: Boca Raton, FL, USA, 2019; pp. 321–341. [Google Scholar]
  12. Lado, J.; Gurrea, A.; Zacarías, L.; Rodrigo, M.J. Influence of the storage temperature on volatile emission, carotenoid content and chilling injury development in Star Ruby red grapefruit. Food Chem. 2019, 295, 72–81. [Google Scholar] [CrossRef]
  13. Ncama, K.; Tesfay, S.Z.; Fawole, O.A.; Opara, U.L.; Magwaza, L.S. Non-destructive prediction of ‘Marsh’ grapefruit susceptibility to postharvest rind pitting disorder using reflectance Vis/NIR spectroscopy. Sci. Hortic-Amst. 2018, 231, 265–271. [Google Scholar] [CrossRef]
  14. Biolatto, A.; Vazquez, D.E.; Sancho, A.M.; Carduza, F.J.; Pensel, N.A. Effect of commercial conditioning and cold quarantine storage treatments on fruit quality of “Rouge La Toma” grapefruit (Citrus paradisi Macf.). Postharvest Biol. Technol. 2005, 35, 167–176. [Google Scholar] [CrossRef]
  15. Aghdam, M.S.; Bodbodak, S. Postharvest Heat Treatment for Mitigation of Chilling Injury in Fruits and Vegetables. Food Bioprocess Technol. 2014, 7, 37–53. [Google Scholar] [CrossRef]
  16. Maul, P.; McCollum, G.; Guy, C.L.; Porat, R. Temperature conditioning alters transcript abundance of genes related to chilling stress in ‘Marsh’ grapefruit flavedo. Postharvest Biol. Technol. 2011, 60, 177–185. [Google Scholar] [CrossRef]
  17. Primo-Capella, A.; Martínez-Cuenca, M.-R.; Forner-Giner, M.Á. Cold Stress in Citrus: A Molecular, Physiological and Biochemical Perspective. Horticulturae 2021, 7, 340. [Google Scholar] [CrossRef]
  18. Chaudhary, P.R.; Jayaprakasha, G.K.; Porat, R.; Patil, B.S. Low temperature conditioning reduces chilling injury while maintaining quality and certain bioactive compounds of ‘Star Ruby’ grapefruit. Food Chem. 2014, 153, 243–249. [Google Scholar] [CrossRef] [PubMed]
  19. Ochandio Fernández, A.; Olguín Pinatti, C.A.; Masot Peris, R.; Laguarda-Miró, N. Freeze-Damage Detection in Lemons Using Electrochemical impedance Spectroscopy. Sensors 2019, 19, 4051. [Google Scholar] [CrossRef] [PubMed] [Green Version]
  20. Kumar Jha, P.; Xanthakis, E.; Chevallier, S.; Jury, V.; Le-Bail, A. Assessment of freeze damage in fruits and vegetables. Food Res. Int. 2019, 121, 479–496. [Google Scholar] [CrossRef]
  21. Cubero, S.; Lee, W.S.; Aleixos, N.; Albert, F.; Blasco, J. Automated Systems Based on Machine Vision for Inspecting Citrus Fruits from the Field to Postharvest—a Review. Food Bioprocess Technol. 2016, 9, 1623–1639. [Google Scholar] [CrossRef] [Green Version]
  22. Lorente, D.; Aleixos, N.; Gómez-Sanchis, J.; Cubero, S.; García-Navarrete, O.L.; Blasco, J. Recent Advances and Applications of Hyperspectral Imaging for Fruit and Vegetable Quality Assessment. Food Bioprocess Technol. 2012, 5, 1121–1142. [Google Scholar] [CrossRef]
  23. Pathare, P.B.; Opara, U.L.; Al-Said, F.A.J. Colour Measurement and Analysis in Fresh and Processed Foods: A Review. Food Bioprocess Technol. 2013, 6, 36–60. [Google Scholar] [CrossRef]
  24. Albelda Aparisi, P.; Fortes Sánchez, E.; Contat Rodrigo, L.; Masot Peris, R.; Laguarda-Miró, N. A Rapid Electrochemical Impedance Spectroscopy and Sensor-Based Method for Monitoring Freeze-Damage in Tangerines. IEEE Sens. J. 2021, 21, 12009–12018. [Google Scholar] [CrossRef]
  25. Magwaza, L.S.; Opara, U.L.; Nieuwoudt, H.; Cronje, P.J.R.; Saeys, W.; Nicolaï, B. NIR Spectroscopy Applications for Internal and External Quality Analysis of Citrus Fruit—A Review. Food Bioprocess Technol. 2012, 5, 425–444. [Google Scholar] [CrossRef]
  26. Lasia, A. Electrochemical Impedance Spectroscopy and its Applications; Springer: New York, NY, USA, 2014; p. 367. [Google Scholar] [CrossRef]
  27. Grossi, M.; Riccò, B. Electrical impedance spectroscopy (EIS) for biological analysis and food characterization: A review. J. Sens. Sens. Syst. 2017, 6, 303–325. [Google Scholar] [CrossRef] [Green Version]
  28. Ando, Y.; Maeda, Y.; Mizutani, K.; Wakatsuki, N.; Hagiwara, S.; Nabetani, H. Impact of blanching and freeze-thaw pretreatment on drying rate of carrot roots in relation to changes in cell membrane function and cell structure. LWT Food Sci. Technol. 2016, 71, 40–46. [Google Scholar] [CrossRef]
  29. Fuentes, A.; Vázquez-Gutiérrez, J.L.; Pérez-Gago, M.B.; Vonasek, E.; Nitin, N.; Barret, D.M. Application of nondestructive impedance spectroscopy to determination of the effect of temperature on potato microstructure and texture. J. Food Eng. 2014, 133, 16–22. [Google Scholar] [CrossRef]
  30. Neto, A.F.; Olivier, N.C.; Cordeiro, E.R.; De Oliveira, H.P. Determination of mango ripening degree by electrical impedance spectroscopy. Comput. Electron. Agr. 2017, 143, 222–226. [Google Scholar] [CrossRef]
  31. Watanabe, T.A. Bio-Electrochemical Calculation Model for Color Decline Kinetics of Bruised “Shine Muscat” Fruit during Storage. Food Bioprocess Technol. 2020, 13, 727–731. [Google Scholar] [CrossRef]
  32. Damez, J.L.; Clerjon, S.; Abouelkaram, S.; Lepetit, J. Beef meat electrical impedance spectroscopy and anisotropy sensing for non-invasive early assessment of meat ageing. J. Food Eng. 2008, 85, 116–122. [Google Scholar] [CrossRef]
  33. Sun, J.; Zhang, R.; Zhang, Y.; Liang, Q.; Li, G.; Yang, N.; Xu, P.; Guo, J. Classifying fish freshness according to the relationship between EIS parameters and spoilage stages. J. Food Eng. 2018, 219, 101–110. [Google Scholar] [CrossRef]
  34. Zhu, S.; Luo, Y.; Hong, H.; Feng, L.; Shen, H. Correlation Between Electrical Conductivity of the Gutted Fish Body and the Quality of Bighead Carp (Aristichthys nobilis) Heads Stored at 0 and 3 °C. Food Bioprocess Technol. 2013, 6, 3068–3075. [Google Scholar] [CrossRef]
  35. Huang, T.-K.; Chuang, M.-C.; Kung, Y.; Hsieh, B.-C. Impedimetric sensing of honey adulterated with high fructose corn syrup. Food Control 2021, 130, 108326. [Google Scholar] [CrossRef]
  36. M’hiri, N.; Veys-Renaux, D.; Rocca, E.; Ioannou, I.; Mihoubi Bourdinova, N.; Ghoul, M. Corrosion inhibition of carbon steel in acidic medium by orange peel extract and its main antioxidant compounds. Corros. Sci. 2016, 102, 55–62. [Google Scholar] [CrossRef]
  37. Malvano, F.; Albanese, D.; Pilloton, R.; Di Mateo, M.; Crescitelly, A. A New Label-Free Impedimetric Affinity Sensor Based on Cholinesterases for Detection of Organophosphorous and Carbamic Pesticides in Food Samples: Impedimetric Versus Amperometric Detection. Food Bioprocess Technol. 2017, 10, 1834–1843. [Google Scholar] [CrossRef]
  38. Conesa, C.; Ibáñez, J.; Seguí, L.; Fito, P.; Laguarda-Miro, N. An Electrochemical Impedance Spectroscopy System for Monitoring Pineapple Waste Saccharification. Sensors 2016, 16, 188. [Google Scholar] [CrossRef] [PubMed] [Green Version]
  39. Conesa, C.; Laguarda-Miró, N.; Fito, P.; Seguí, L. Evaluation of Persimmon (Diospyros kaki Thunb. cv. Rojo Brillante) Industrial Residue as a Source for Value Added Products. Waste Biomass Valori. 2020, 11, 3749–3760. [Google Scholar] [CrossRef]
  40. Conesa, C.; Gil, L.; Seguí, L.; Fito, P.; Laguarda-Miro, N. Ethanol quantification in pineapple waste by an electrochemical impedance spectroscopy-based system and artificial neural networks. Chemom. Intell. Lab. Syst. 2017, 161, 1–7. [Google Scholar] [CrossRef]
  41. MacGregor, J.F.; Bruwer, M.J.; Miletic, I.; Cardin, M.; Liu, Z. Latent Variable Models and Big Data in the Process Industries. IFAC-PapersOnLine 2015, 48, 520–524. [Google Scholar] [CrossRef]
  42. Martinez Gil, P.; Laguarda-Miró, N.; Soto Camino, J.; Masot Peris, R. Glyphosate detection with ammonium nitrate and humic acids as potential interfering substances by pulsed voltammetry technique. Talanta 2013, 115, 702–705. [Google Scholar] [CrossRef]
  43. Ulrich, C.; Petersson, H.; Sundgren, H.; Björefors, F.; Krantz-Rülcker, C. Simultaneous estimation of soot and diesel contamination in engine oil using electrochemical impedance spectroscopy. Sens. Actuators B Chem. 2007, 127, 613–618. [Google Scholar] [CrossRef]
  44. Olivati, C.A.; Riul, A.; Balogh, D.T.; Oliveira, O.N.; Ferreira, M. Detection of phenolic compounds using impedance spectroscopy measurements. Bioprocess Biosyst. Eng. 2009, 32, 41–46. [Google Scholar] [CrossRef]
  45. Górski, Ł.; Sordoń, W.; Ciepiela, F.; Kubiak, W.W.; Jakubowska, M. Voltammetric classifcation of ciders with PLS-DA. Talanta 2016, 146, 231–236. [Google Scholar] [CrossRef]
  46. Garcia-Breijo, E.; Garrigues, J.; Gil Sanchez, L.; Laguarda-Miró, N. An Embedded Simplified Fuzzy ARTMAP Implemented a Microcontroller for Food Classification. Sensors 2013, 13, 10418–10429. [Google Scholar] [CrossRef] [PubMed] [Green Version]
  47. Conesa, C.; Seguí, L.; Laguarda-Miró, N.; Fito, P. Microwaves as a pretreatment for enhancing enzymatic hydrolysis of pineapple industrial waste for bioethanol production. Food. Bioprod. Process. 2016, 100, 203–213. [Google Scholar] [CrossRef]
  48. Rajasekaran, S.; Vijayalakshmi Pai, G.A. Neural Networks, Fuzzy Logic and Genetic Algorithms: Synthesis and Applications; Prentice Hall: New Delhi, India, 2004; p. 456. [Google Scholar]
  49. Kasuba, T. Simplified fuzzy ARTMAP. AI Expert 1993, 8, 18–25. [Google Scholar]
  50. Garcia-Breijo, E.; Atkinson, J.; Gil-Sanchez, L.; Masot, R.; Ibañez, J.; Garrigues, J.; Glanc, M.; Laguarda-Miro, N.; Olguin, C. A comparison study of pattern recognition algorithms implemented on a microcontroller for use in an electronic tongue for monitoring drinking waters. Sens. Actuators A Phys. 2011, 2, 570–582. [Google Scholar] [CrossRef]
  51. Kumar, G.; Buchheit, R.G. Use of Artificial Neural Network Models to Predict Coated Component Life from Short-Term Electrochemical Impedance Spectroscopy Measurements. Corrosion 2008, 64, 241–254. [Google Scholar] [CrossRef]
  52. Eddahech, A.; Briat, O.; Bertrand, N.; Delétage, J.Y.; Vinassa, J.M. Behavior and state-of-health monitoring of Li-ion batteries using impedance spectroscopy and recurrent neural networks. Int. J. Electron. Power Energy Syst. 2012, 42, 487–494. [Google Scholar] [CrossRef]
  53. Garcia Breijo, E.; Olguin Pinatti, C.; Masot Peris, R.; Alcañiz Fillol, M.; Martínez-Máñez, R.; Soto Camino, J. TNT detection using a voltammetric electronic tongue based on neural networks. Sensor. Actuat. A-Phys 2013, 192, 1–8. [Google Scholar] [CrossRef]
  54. Itakura, K.; Saito, Y.; Suzuki, T.; Kondo, N.; Hosoi, F. Estimation of Citrus Maturity with Fluorescence Spectroscopy Using Deep Learning. Horticulturae 2019, 5, 2. [Google Scholar] [CrossRef] [Green Version]
  55. Imaizumi, T.; Tanaka, F.; Hamanaka, D.; Sato, Y.; Uchino, T. Effects of hot water treatment on electrical properties, cell membrane structure and texture of potato tubers. J. Food Eng. 2015, 162, 56–62. [Google Scholar] [CrossRef]
  56. Ando, Y.; Maeda, Y.; Mizutani, K.; Wakatsuki, N.; Hagiwara, S.; Nabetani, H. Effect of air-dehydration pretreatment before freezing on the electrical impedance characteristics and texture of carrots. J. Food Eng. 2016, 169, 114–121. [Google Scholar] [CrossRef]
  57. Cole, K.S. Permeability and impermeability of cell membranes for ions. Cold Spring Harb. Symp. Quant. Biol. 1940, 8, 110–122. [Google Scholar] [CrossRef]
  58. Ibba, P.; Falco, A.; Demelash Abera, B.; Cantarella, G.; Petti, L.; Lugli, P. Bio-impedance and circuit parameters: An analysis for tracking fruit ripening. Postharvest Biol. Technol. 2020, 159, 110978. [Google Scholar] [CrossRef]
  59. Chowdhury, A.; Bera, T.K.; Ghoshal, D.; Chakraborty, B. Electrical Impedance Variations in Banana Ripening: An Analytical Study with Electrical Impedance Spectroscopy. J. Food Process Eng. 2017, 40, 1–14. [Google Scholar] [CrossRef]
  60. Watanabe, T.; Ando, Y. Evaluation of heating uniformity and quality attributes during vacuum microwave thawing of frozen apples. LWT 2021, 150, 111997. [Google Scholar] [CrossRef]
  61. Paredes, A.M. MICROSCOPY|Scanning Electron Microscopy. In Encyclopedia of Food Microbiology, 2nd ed.; Batt, C.A., Tortorello, M.L., Eds.; Academic Press: Cambridge, MA, USA, 2014; pp. 693–701. [Google Scholar] [CrossRef]
  62. Macdonald, J.R.; Barsoukov, E. Impedance Spectroscopy: Theory, Experiment and Applications, 2nd ed.; John Wiley & Sons, Inc.: Hoboken, NJ, USA, 2005; p. 595. [Google Scholar]
  63. Masot, R.; Alcañiz, M.; Fuentes, A.; Schmidt, F.C.; Barat, J.M.; Gil, L.; Baigts, D.; Martínez-Máñez, R.; Soto, J. Design of a low-cost non-destructive system for punctual measurements of salt levels in food products using impedance spectroscopy. Sens. Actuators A Phys. 2010, 158, 217–223. [Google Scholar] [CrossRef]
  64. Mills, T.C. Seasonal and exponential smoothing. In Applied Time Series Analysis; Mills, T.C., Ed.; Academic Press: Cambridge, MA, USA; Elsevier: London, UK, 2019; p. 354. [Google Scholar] [CrossRef]
  65. Wold, S.; Sjostrom, M.; Eriksson, L. PLS-regression: A basic tool of chemometrics. Chemom. Intell. Lab. 2001, 58, 109–130. [Google Scholar] [CrossRef]
  66. Borràs, E.; Ferré, J.; Boqué, R.; Mestres, M.; Aceña, L.; Calvo, A.; Busto, O. Olive oil sensory defects classification with data fusion of instrumental techniques and multivariate analysis (PLS-DA). Food Chem. 2016, 203, 314–322. [Google Scholar] [CrossRef]
  67. Serrano-Pallicer, E.; Muñoz-Albero, M.; Pérez-Fuster, C.; Masot Peris, R.; Laguarda-Miró, N. Early Detection of Freeze Damage in Navelate Oranges with Electrochemical Impedance Spectroscopy. Sensors 2018, 18, 4503. [Google Scholar] [CrossRef] [Green Version]
  68. Del Brío, B.M.; Molina, A.S. Redes Neuronales y Sistemas Borrosos, 2nd ed.; Ra-Ma: Madrid, Spain, 2001; p. 399. (In Spanish) [Google Scholar]
  69. Martínez-Alcántara, B.; Tadeo, F.; Mesejo, C.; Martínez-Cuenca, M.R.; Ruiz, M.; Reig, C.; Former-Giner, M.A.; Iglesias, D.J.; Agustí, M.; Primo-Millo, E. Anatomía de los Cítricos; Universitat Politècnica de València: Valencia, Spain, 2015; p. 173. [Google Scholar]
  70. Magar, H.S.; Hassan, R.Y.A.; Mulchandani, A. Electrochemical Impedance Spectroscopy (EIS): Principles, Construction, and Biosensing Applications. Sensors 2021, 21, 6578. [Google Scholar] [CrossRef]
  71. Zhao, X.; Zhuang, H.; Yoon, S.-C.; Dong, Y.; Wang, W.; Zhao, W. Electrical impedance spectroscopy for quality assessment of meat and fish: A review on basic principles measurement methods, and recent advances. J. Food Qual. 2017, 2017, 6370739. [Google Scholar] [CrossRef] [Green Version]
  72. Lee, J.-W.; Moon, T.; Son, J.-E. Development of Growth Estimation Algorithms for Hydroponic Bell Peppers Using Recurrent Neural Networks. Horticulturae 2021, 7, 284. [Google Scholar] [CrossRef]
  73. Duarte-Carvajalino, J.M.; Silva-Arero, E.A.; Góez-Vinasco, G.A.; Torres-Delgado, L.M.; Ocampo-Paez, O.D.; Castaño-Marín, A.M. Estimation of Water Stress in Potato Plants Using Hyperspectral Imagery and Machine Learning Algorithms. Horticulturae 2021, 7, 176. [Google Scholar] [CrossRef]
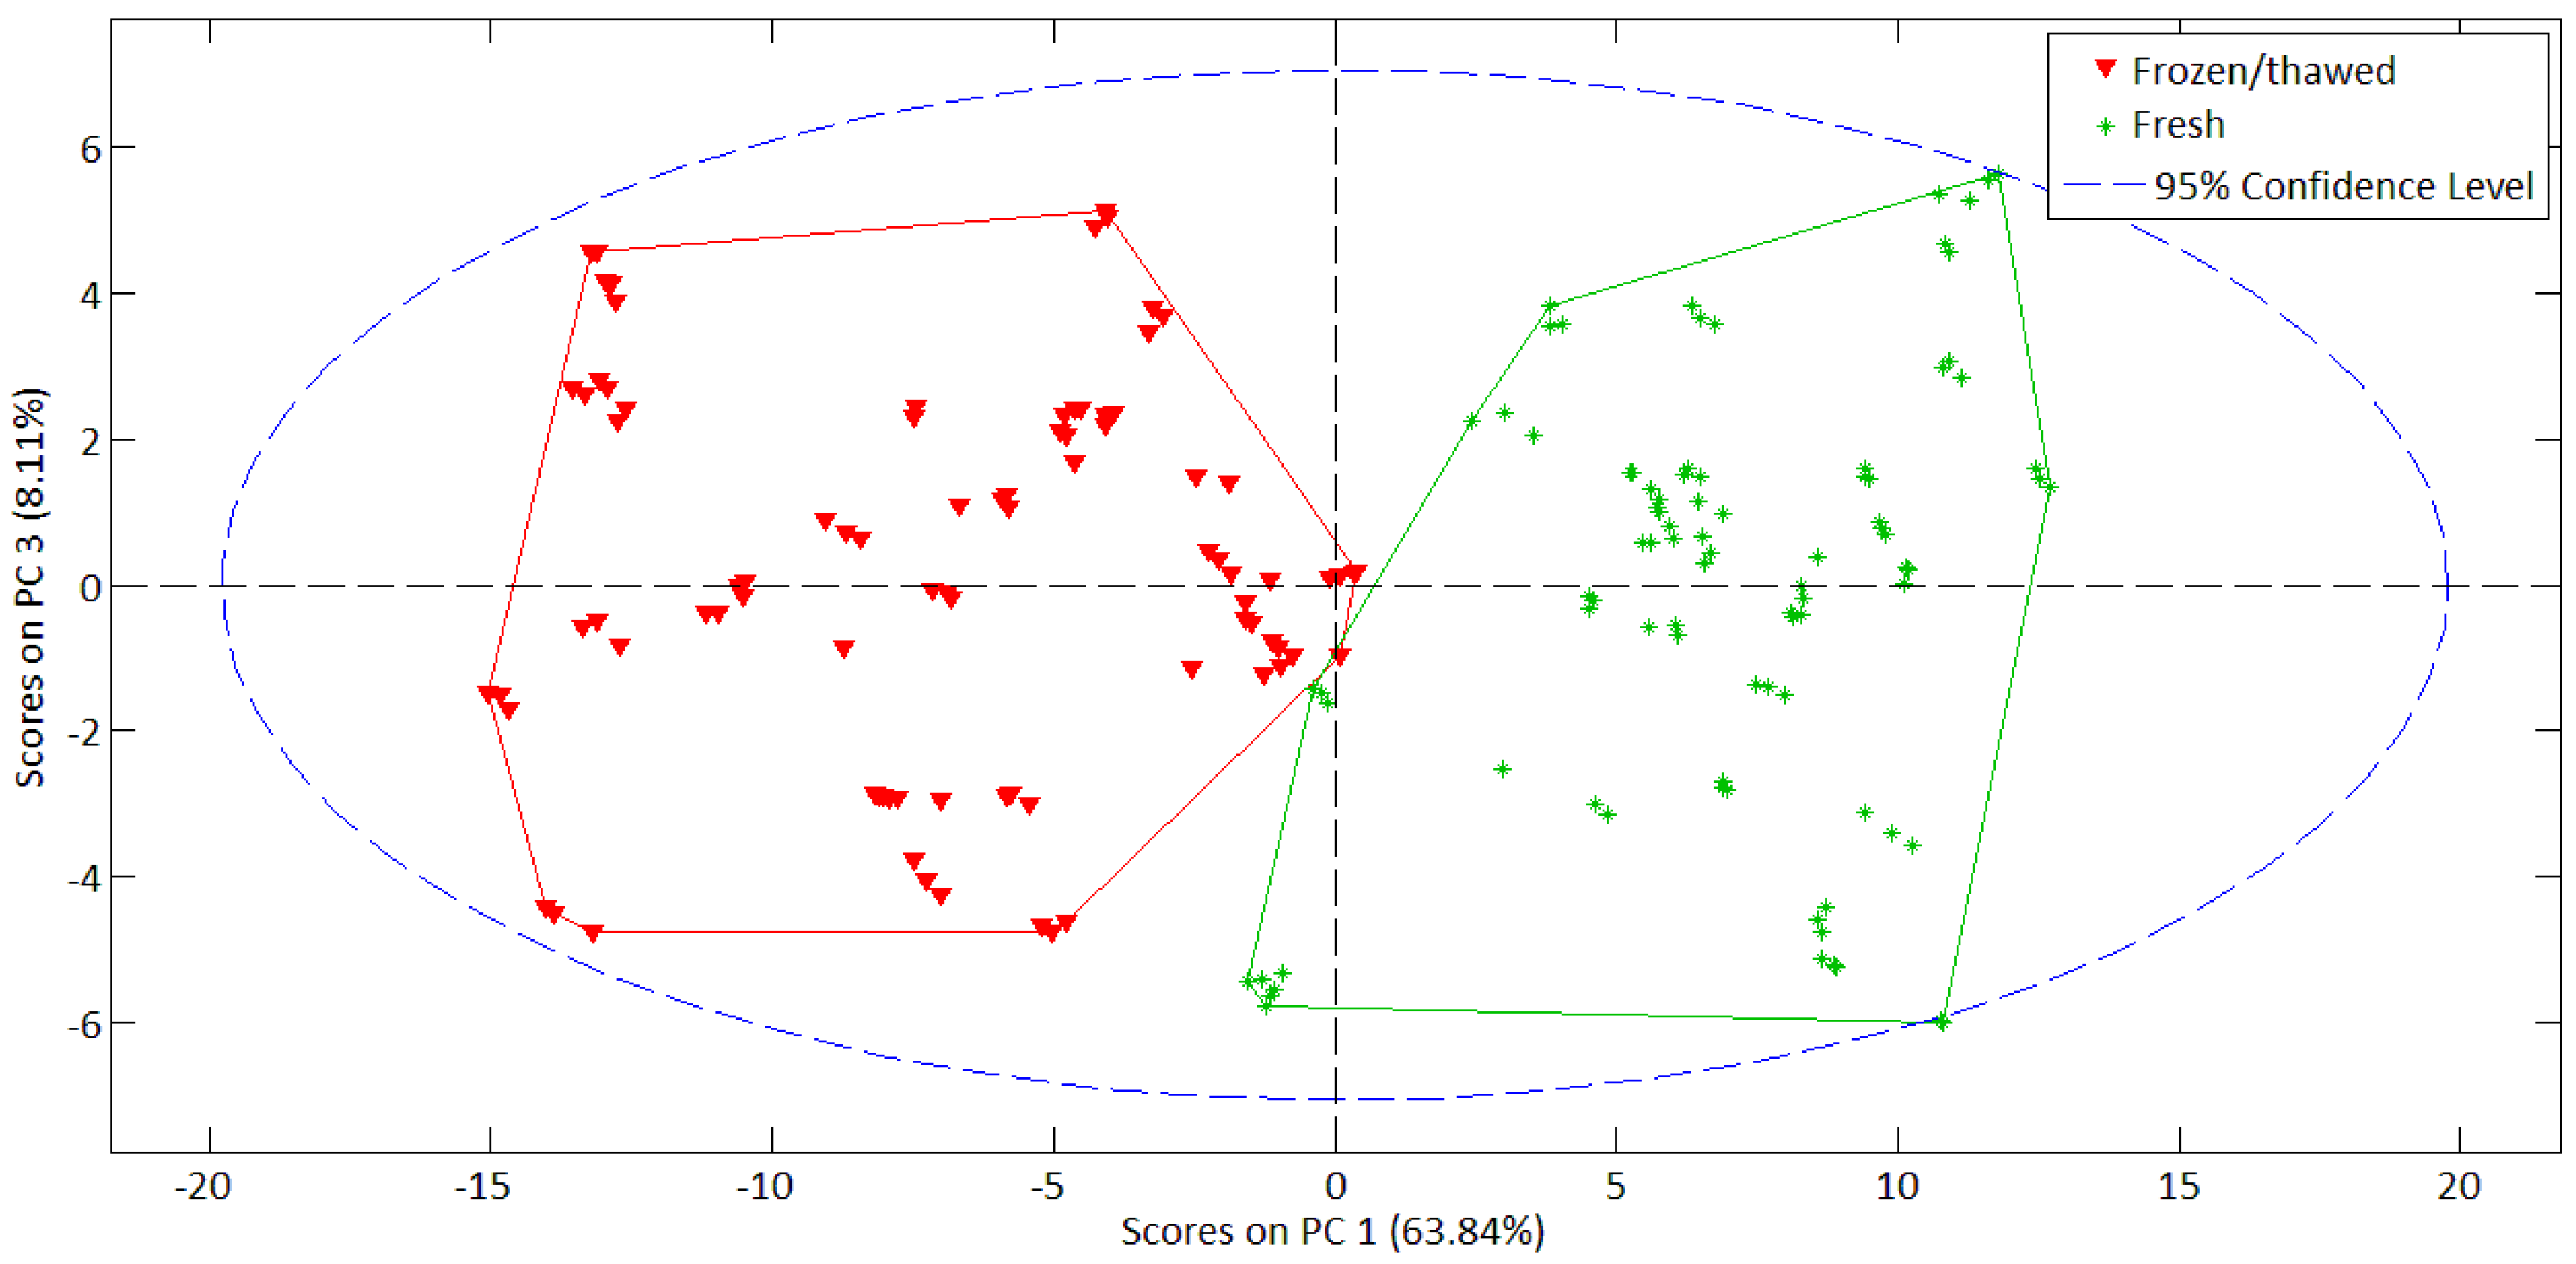
Figure 1. Scheme of the measurement system and detailed sensor puncture in grapefruit: (a) directly on the peel, (b) without the peel, and (c) without the peel between two segments.
Horticulturae 08 00218 g001
Figure 2. The selected modified Hayden electric equivalent circuit for biological tissues composed of three components: an extracellular resistance (Re) related to extracellular fluid, an intracellular resistance (Ri) related to intracellular fluid, and a constant phase element (CPE) related to cell membrane and inhomogeneous cell distribution.
Horticulturae 08 00218 g002
Figure 3. Cryo-FESEM images of different grapefruit tissues: (a) fresh flavedo, (b) frozen/thawed flavedo, (c) fresh albedo, (d) frozen/thawed albedo, (e) fresh pulp, and (f) frozen/thawed pulp.
Horticulturae 08 00218 g003
Figure 4. (a) Module and (b) phase of the EIS results for both fresh and frozen/thawed grapefruit number 10 directly punctured in the peel.
Horticulturae 08 00218 g004
Figure 5. PCA plot for the conducted EIS analyses in grapefruit showing a differentiated trend for frozen/thawed samples (red) and fresh ones (green) directly punctured on the peel.
Horticulturae 08 00218 g005
Figure 6. PLS-DA analysis for the conducted EIS analyses for both frozen/thawed samples (red) and fresh ones (green) directly punctured on the peel.
Horticulturae 08 00218 g006
Figure 7. Structure and detailed information of the designed ANN model for grapefruit freeze-damage detection. Application results given in the form of a confusion matrix and CCRs.
Horticulturae 08 00218 g007
Figure 8. Fitting the electrical model (blue lines) to the EIS experimental data (red lines) for both fresh and frozen/thawed grapefruit and parameterization of the selected modified Hayden equivalent circuit.
Horticulturae 08 00218 g008
Table 1. PCA results for grapefruit EIS analyses directly punctured on the peel for 1 to 4 principal components.
PCA Analysis
N° of PC1234
Variance (%)63.84%22.83%8.11%3.20%
Σ of variance (%)63.84%86.67%94.78%97.98%
Publisher’s Note: MDPI stays neutral with regard to jurisdictional claims in published maps and institutional affiliations.

