Article

Peach, Apple, and Pear Fruit Quality: To Peel or Not to Peel?

by
Michail Michailidis
1,
Evangelos Karagiannis
1,
Elpida Nasiopoulou
1,
Christina Skodra
1,
Athanassios Molassiotis
1 and
Georgia Tanou
2,*
1
Laboratory of Pomology, School of Agriculture, Aristotle University of Thessaloniki, 54124 Thessaloniki, Greece
2
Institute of Soil and Water Resources, ELGO-DEMETER, 57001 Thessaloniki, Greece
*
Author to whom correspondence should be addressed.
Horticulturae 2021, 7(4), 85; https://doi.org/10.3390/horticulturae7040085
Submission received: 6 April 2021 / Revised: 13 April 2021 / Accepted: 14 April 2021 / Published: 17 April 2021
(This article belongs to the Special Issue Improving Quality of Fruit)

Abstract

:
The nutritional value of the peeled and unpeeled fruit (peel plus flesh tissues) was studied using four peach (Prunus persica L.; Red Heaven, Maria Blanca, Big Top, and Queen Giant), two pear (Pyrus communis L.; Santa Maria, Pyrus pyrifolia N.; Nashi), and three apple (Malus domestica Borkh.; Gala, Granny Smith, and Red Chief) cultivars. Based on principal components analysis (PCA) models, there was a clear differentiation among the cultivars’ and the peeled fruits’ nutritional characteristics in comparison to the unpeeled ones. Increased antioxidant capacity and content of total phenols and flavonoids of peaches (Red Heaven and Maria Blanca) versus nectarines (Big Top and Queen Giant) were recorded. In contrast, nectarines were characterized by higher hydroxycinnamates and dry matter. The apples’ cultivar Granny Smith exhibited a high level of titratable acidity (TA), while the Gala displayed a high level of soluble solids concentration (SSC), carotenoids, dry matter, hydroxycinnamic acids, and flavonols at the unpeeled fruit, whereas the Red Chief by increased anthocyanins, antioxidant capacity, total phenols, and flavonoids. Nashi pears with peel were more beneficial due to the strong skin contribution in the fruits’ beneficial compounds content. The peel of the Granny Smith cultivar was associated with an increased level of P, K, Ca, and Mg, whereas that of Red Chief with increased anthocyanins and Mg content.

1. Introduction

Diets high in fruits are widely recommended for their health-promoting properties [1]. Particularly, apple, pear, and peach are economically important fruits that are highly appreciated by consumers worldwide. At the peel tissue of these fruits, bacteria or other microorganisms harmful to human health could be developed as well as high concentrations of pesticide residues might be detected [2,3]. Despite the fact that peel is burdened with these accuses, it plays the role of the physical barrier between the environment and fruits, developing mechanisms of response to different stresses such as the anthocyanin accumulation [4,5].
It is widely accepted that several beneficial substances (e.g., flavonoids, hydroxycinnamic acids, flavonols, anthocyanins, carotenoids) are highly accumulated in the peel compared to flesh tissue of various fruits, including peaches [6,7,8,9], pears [10,11], and apples [12,13,14]. It has been also reported that the peel tissue of these fruit species accumulates higher content of minerals such as Ca, Mg, P, Fe, Mn, Zn than the flesh tissue [15,16,17,18]. Although the increased content of these beneficial compounds at the peel is well documented, the contribution of the peel to the nutritional value has not been fully deciphered at the high commercial fruit species, including peaches, pears, and apples. Thus, the aim of this study was to characterize the differences in quality, antioxidant-related traits, and nutrient elements between peeled and unpeeled fruits of various peach, pear, and apple cultivars.

2. Materials and Methods

2.1. Fruit Material and Sample Processing

Fruits of three different species, namely peach, apple, and pear were collected at the commercial harvest stage and subsequently stored at 1 °C for two weeks (peach) or two months (apple and pear). Regarding the peach study, the cultivars, Red Heaven (yellow-flesh), Maria Blanca (white-flesh), Big Top (yellow-flesh nectarine,) and Queen Giant (white-flesh nectarine) were used. Further, three apple (Gala, Granny Smith, Red Chief) and two pear (Santa Maria (Pyrus communis L.) and Nashi (Pyrus pyrifolia N.)) cultivars were tested. Immediately after the cold storage, ten fruits of each cultivar without any visual defects or decay were selected. Each individual fruit was divided into four quarters, and the two opposite quadrants were peeled (named peeled), and the other two quadrants remained unpeeled (named unpeeled). One part of the two quadrants of the unpeeled or peeled fruit was used for soluble solids concentration (SSC) and titratable acidity (TA) determination, while another part was used for dry matter measurement, and the rest of the part was used for the biochemical analyses.

2.2. Fruit Quality Characteristic

2.2.1. Fruit Soluble Solids Concentration and Titratable Acidity

Fruit soluble solids concentration (SSC) was determined at 1 mL fruit juice supernatant of peeled or unpeeled fruit, after juice centrifugation at 10,000× g for 10 min at 4 °C, using a refractometer (model ATAGO, digital hand-held pocket refractometer PAL-1, ATAGO Japan). Titratable acidity (TA) was determined at unpeeled or peeled fruit juice based on juice acidity neutralization. In a glass jar, 100 mL of dH2O were mixed with 1mL juice supernatant and titrated with 0.01 N NaOH under continuous stirring and pH-measurement (model Hanna inst. HI8424, with probe HI 1230) until the endpoint of pH 8.2. SSC was expressed as percentage Brix and TA as was expressed as percentage malic acid based on the standard curve of known malic acid concentrations.

2.2.2. Dry Weight of Peeled and Unpeeled Fruit

The dry weight of peeled or unpeeled fruit was determined after tissue heating at 65 °C in an oven until full internal water evaporation and constant weight acquisition (at least for three days). Dry weight was expressed as the percentage of fresh fruit tissues.

2.3. Antioxidant-Related Traits of Peeled and Unpeeled Fruits

For the biochemical analysis, peeled or unpeeled tissues were grounded with liquid N2 in a mechanical blender until a fine powder. Polyphenolic antioxidant substances were extracted according to Asami [19]. One gram of ground tissue was homogenized with 10 mL of extraction solution (70% acetone and 0.5% acetic acid). The homogenate was placed at 4 °C in the dark for 48 h; after centrifugation (10,000× g, 4 °C, 10 min), an aliquot of the supernatant was used for the analysis.
Antioxidant capacity based on 1,1-diphenyl-2-picrylhydrazyl (DPPH) assay was determined, according to Karagiannis [20], with slight modifications. In 2.9 mL of the DPPH solution (100 μM DPPH in pure methanol), 100 μL of antioxidant substances extract were added and then incubated for 120 min in the dark. The absorbance was measured at 593 nm (Tecan infinite M200 PRO), and results were expressed in equivalents of mg Trolox 100 g−1 FW based on the standard curve of known Trolox concentrations.
The total phenols content was determined following the Folin–Ciocalteu method [19,21], with slight modifications. The polyphenolic antioxidant extract (0.5 mL) was mixed with 2.5 mL of Folin–Ciocalteu reagent (ratio 1:10, Folin–Ciocalteu: dH2O), and after 2 min, 2 mL of 7.5% w/v Na2CO3 were added, and the mixture was immersed in a water bath for 5 min at 50 °C. Absorbance was measured at 760 nm (Tecan infinite M200 PRO), and results were expressed in the equivalents of mg Gallic acid 100 g−1 FW based on the standard curve of known gallic acid concentrations.
Determination of flavonoids was performed, according to Cvek [22], with slight modifications. In 200 μL of polyphenolic antioxidant extract 540 μL dH2O, 30 μL 5% NaNO2, 30 μL 10% AlCl3 6H2O, and 200 μL of 1 M NaOH were added. The mixture was placed in the dark at room temperature for 90 min. The absorbance was measured at 510 nm (Tecan infinite M200 PRO) and results were expressed in equivalents of mg rutin 100 g−1 FW, according to the standard reference curve.
Total anthocyanins, hydroxycinnamic acids, and flavonols content were determined, according to Obied [23], with modifications. In 100 μL of polyphenolic antioxidant extract, absolute ethanolic solutions of 0.1% HCl (100 μL) and 2% HCl (800 μL) were added. The absorbance was measured at 560 nm for total anthocyanins, at 360 nm for flavonols, and at 320 nm for hydroxycinnamic acids (Tecan infinite M200 PRO). The reference curve was constructed with standard cyanidin, rutin, and caffeic acid, respectively. The results were expressed in equivalents of mg cyanidin, rutin, and caffeic acid 100g−1 FW respectively.
Carotenoids extraction was performed, according to Kuti [24], with modifications from 0.1 g of ground tissue by adding 1.8 mL hexane: acetone:ethanol (50:25:25 v/v) and after incubation for 24 h at 5 °C in darkness. Carotenoid content was measured at 450 nm (model UV–1700 Pharmaspec, Shimadzu, Kyoto, Japan) and the results were expressed in equivalents of μg β-carotene g−1 FW.

2.4. Mineral Analysis of Peeled and Unpeeled Fruits

Total phosphorus (P), potassium (K), calcium (Ca), magnesium (Mg), manganese (Mn), zinc (Zn), iron (Fe), and copper (Cu) contents of peeled and unpeeled fruits were determined as previously described [25,26,27]. Fruit tissues were dehydrated at 65 °C until constant weight, ground to a fine powder under liquid N2, and then was placed at 500 °C overnight (till ash). The ash was dissolved in 10 mL of 3.6 N HCl and 1.4 N HNO3. The filtered solution was filled to a final volume of 25 mL with ddH2O. Total P, K, Ca, Mg, Mn, Zn, Fe, and Cu contents were determined by inductively coupled plasma optical emission spectrometry (ICP-OES) system (Perkin Elmer Optima 2100 DV). The results were expressed as ppm of dry weight (DW).

2.5. Statistical Analysis

For all data, the statistical analysis was conducted using SPSS (SPSS v23.0., Chicago, IL, USA). T-test analysis between peeled and unpeeled fruits with a significance level P ≤ 0.05 was carried out. Fold-change was based on log2 of the ratio of unpeeled to peeled fruit. Additionally, a 95% lower and upper bound of the confidence interval in individual fruits was carried out in a one-way ANOVA. If the ratio of the logarithm was 95% lower, and the upper confidence interval was positive, then increased values of the unpeeled fruit relative to the peeled for this variable and cultivar was indicated, while a negative presence indicated decreased values in this variable and cultivar. In the cases of a positive presence for the 95% upper confidence interval and negative for the lower or the inverse, then there was no clear change of this parameter for this cultivar. The principal components analysis (PCA) was carried out between a peeled and unpeeled peach, apple, and pear fruits, as well as for the ratio of the logarithm of unpeeled to peeled to detect simple patterns and differences. The Kaiser–Meyer–Olkin (KMO > 0.6) measure of sampling adequacy and Bartlett’s test of sphericity (<0.001) were used as indicators in the PCA model’s construction, according to Michailidis [28,29]. Variable with extraction under 0.5 were rejected to avoid the low representation of variables in the PCA model.

3. Results

3.1. Fruit Peeling

The differences between peeled and unpeeled fruit, concerning the soluble solids concentration (SSC), were found only in Santa Maria pear based on SSC fold-change as 95% confidence interval of the lower and upper values were negative (Table 1), indicating a lower level of SSC in unpeeled pear. The titratable acidity (TA) of unpeeled Big Top peach fruits and of both pear cultivars were lower (P ≤ 0.05) in comparison to the peeled. An increased TA was observed for Red Haven peach and Santa Maria pear based on the log-ratio of unpeeled to peeled fruit (Table 1).
The dry weight (DW) of unpeeled Red Heaven peach (P ≤ 0.01), Nashi pear, and Gala apple (P ≤ 0.05) were higher compared to the peeled ones. Increased levels of DW in unpeeled fruits of all cultivars were determined as fold-change that had positive values in both 95% lower and upper confidence intervals, with the only exception of the Santa Maria pear (Table 1). The antioxidant capacity of the unpeeled Red Haven peach (P ≤ 0.01) and Big Top nectarine (P ≤ 0.05), Nashi pear (P ≤ 0.001), and the three apple cultivars (Granny Smith (P ≤ 0.01), Gala, and Red Chief (P ≤ 0.001)) were higher compared to the peeled ones (Table 1). A higher antioxidant capacity of unpeeled fruits of all tested cultivars, except for Santa Maria pear, was noticed (Table 1). Polyphenol content of unpeeled Red Haven (P ≤ 0.05), Granny Smith (P ≤ 0.01), Nashi, Gala, and Red Chief (P ≤ 0.001) fruit was in higher abundance than the corresponding peeled fruits (Table 1).
Compared with the peeled, the unpeeled fruits of Maria Blanca (P ≤ 0.05), Big Top, Queen Giant, Gala, and Red Chief (P ≤ 0.001) had a high anthocyanins content (Table 1). A higher hydroxycinnamate content of unpeeled Santa Maria pears was observed (P ≤ 0.01), while increased hydroxycinnamates at unpeeled Santa Maria, Big Top, and Red Chief fruits were also detected (Table 1). Additionally, an increased content of flavonols in the unpeeled Nashi (P ≤ 0.05), Big Top, Gala (P ≤ 0.01), and Santa Maria (P ≤ 0.001) fruits were recorded. Flavonols presented the highest values at unpeeled Big Top, Queen Giant, Santa Maria, Gala, and Red Chief (Table 1). Carotenoid content was higher at unpeeled Red Chief (P ≤ 0.01), Nashi, and Granny Smith (P ≤ 0.001) fruits. Carotenoids also accounted for higher values at unpeeled Maria Bianca, Nashi, and Granny Smith (Table 1).
Regarding the nutrient composition, data indicated that Santa Maria unpeeled fruits had higher (P ≤ 0.05) P content (Table 2). Further, the unpeeled fruits of both pear cultivars exhibited increased P content. Potassium was higher (P ≤ 0.01) at unpeeled Queen Giant and lower (P ≤ 0.05) at unpeeled Gala (Table 2). Calcium content was higher in unpeeled Maria Bianca, Queen Giant (P ≤ 0.05), Granny Smith (P ≤ 0.01), and Nashi (P ≤ 0.001) fruits. Unpeeled Queen Giant, Nashi, Gala, and Granny Smith fruits accumulated Ca in comparison to the peeled ones (Table 2). Magnesium was higher at unpeeled Nashi, Gala, Red Chief (P ≤ 0.05), Queen Giant (P ≤ 0.01), and Granny Smith (P ≤ 0.001), while increased levels of Mg at unpeeled fruits of the above-mentioned cultivars were also detected due to positive values on the lower and upper bounds (Table 2). In addition, unpeeled Red Heaven, Queen Giant (P ≤ 0.05), Santa Maria, and Gala (P ≤ 0.01) depicted an accumulation of Mn, and likewise, at these cultivars, a higher Mn in unpeeled fruits was observed due to the lower and the upper bounds of the fold-change (Table 2). Moreover, increased Zn was recorded in unpeeled Red Heaven fruits (Table 2). The iron level was higher at unpeeled Red Heaven (P ≤ 0.05) and Santa Maria (P ≤ 0.01) than the peeled ones. Furthermore, an increase in Fe at unpeeled Santa Maria pears was documented (Table 2). Copper content was higher at unpeeled Santa Maria (P ≤ 0.05) but lower at Gala, Granny Smith (P ≤ 0.05), and Nashi (P ≤ 0.01; Table 2).

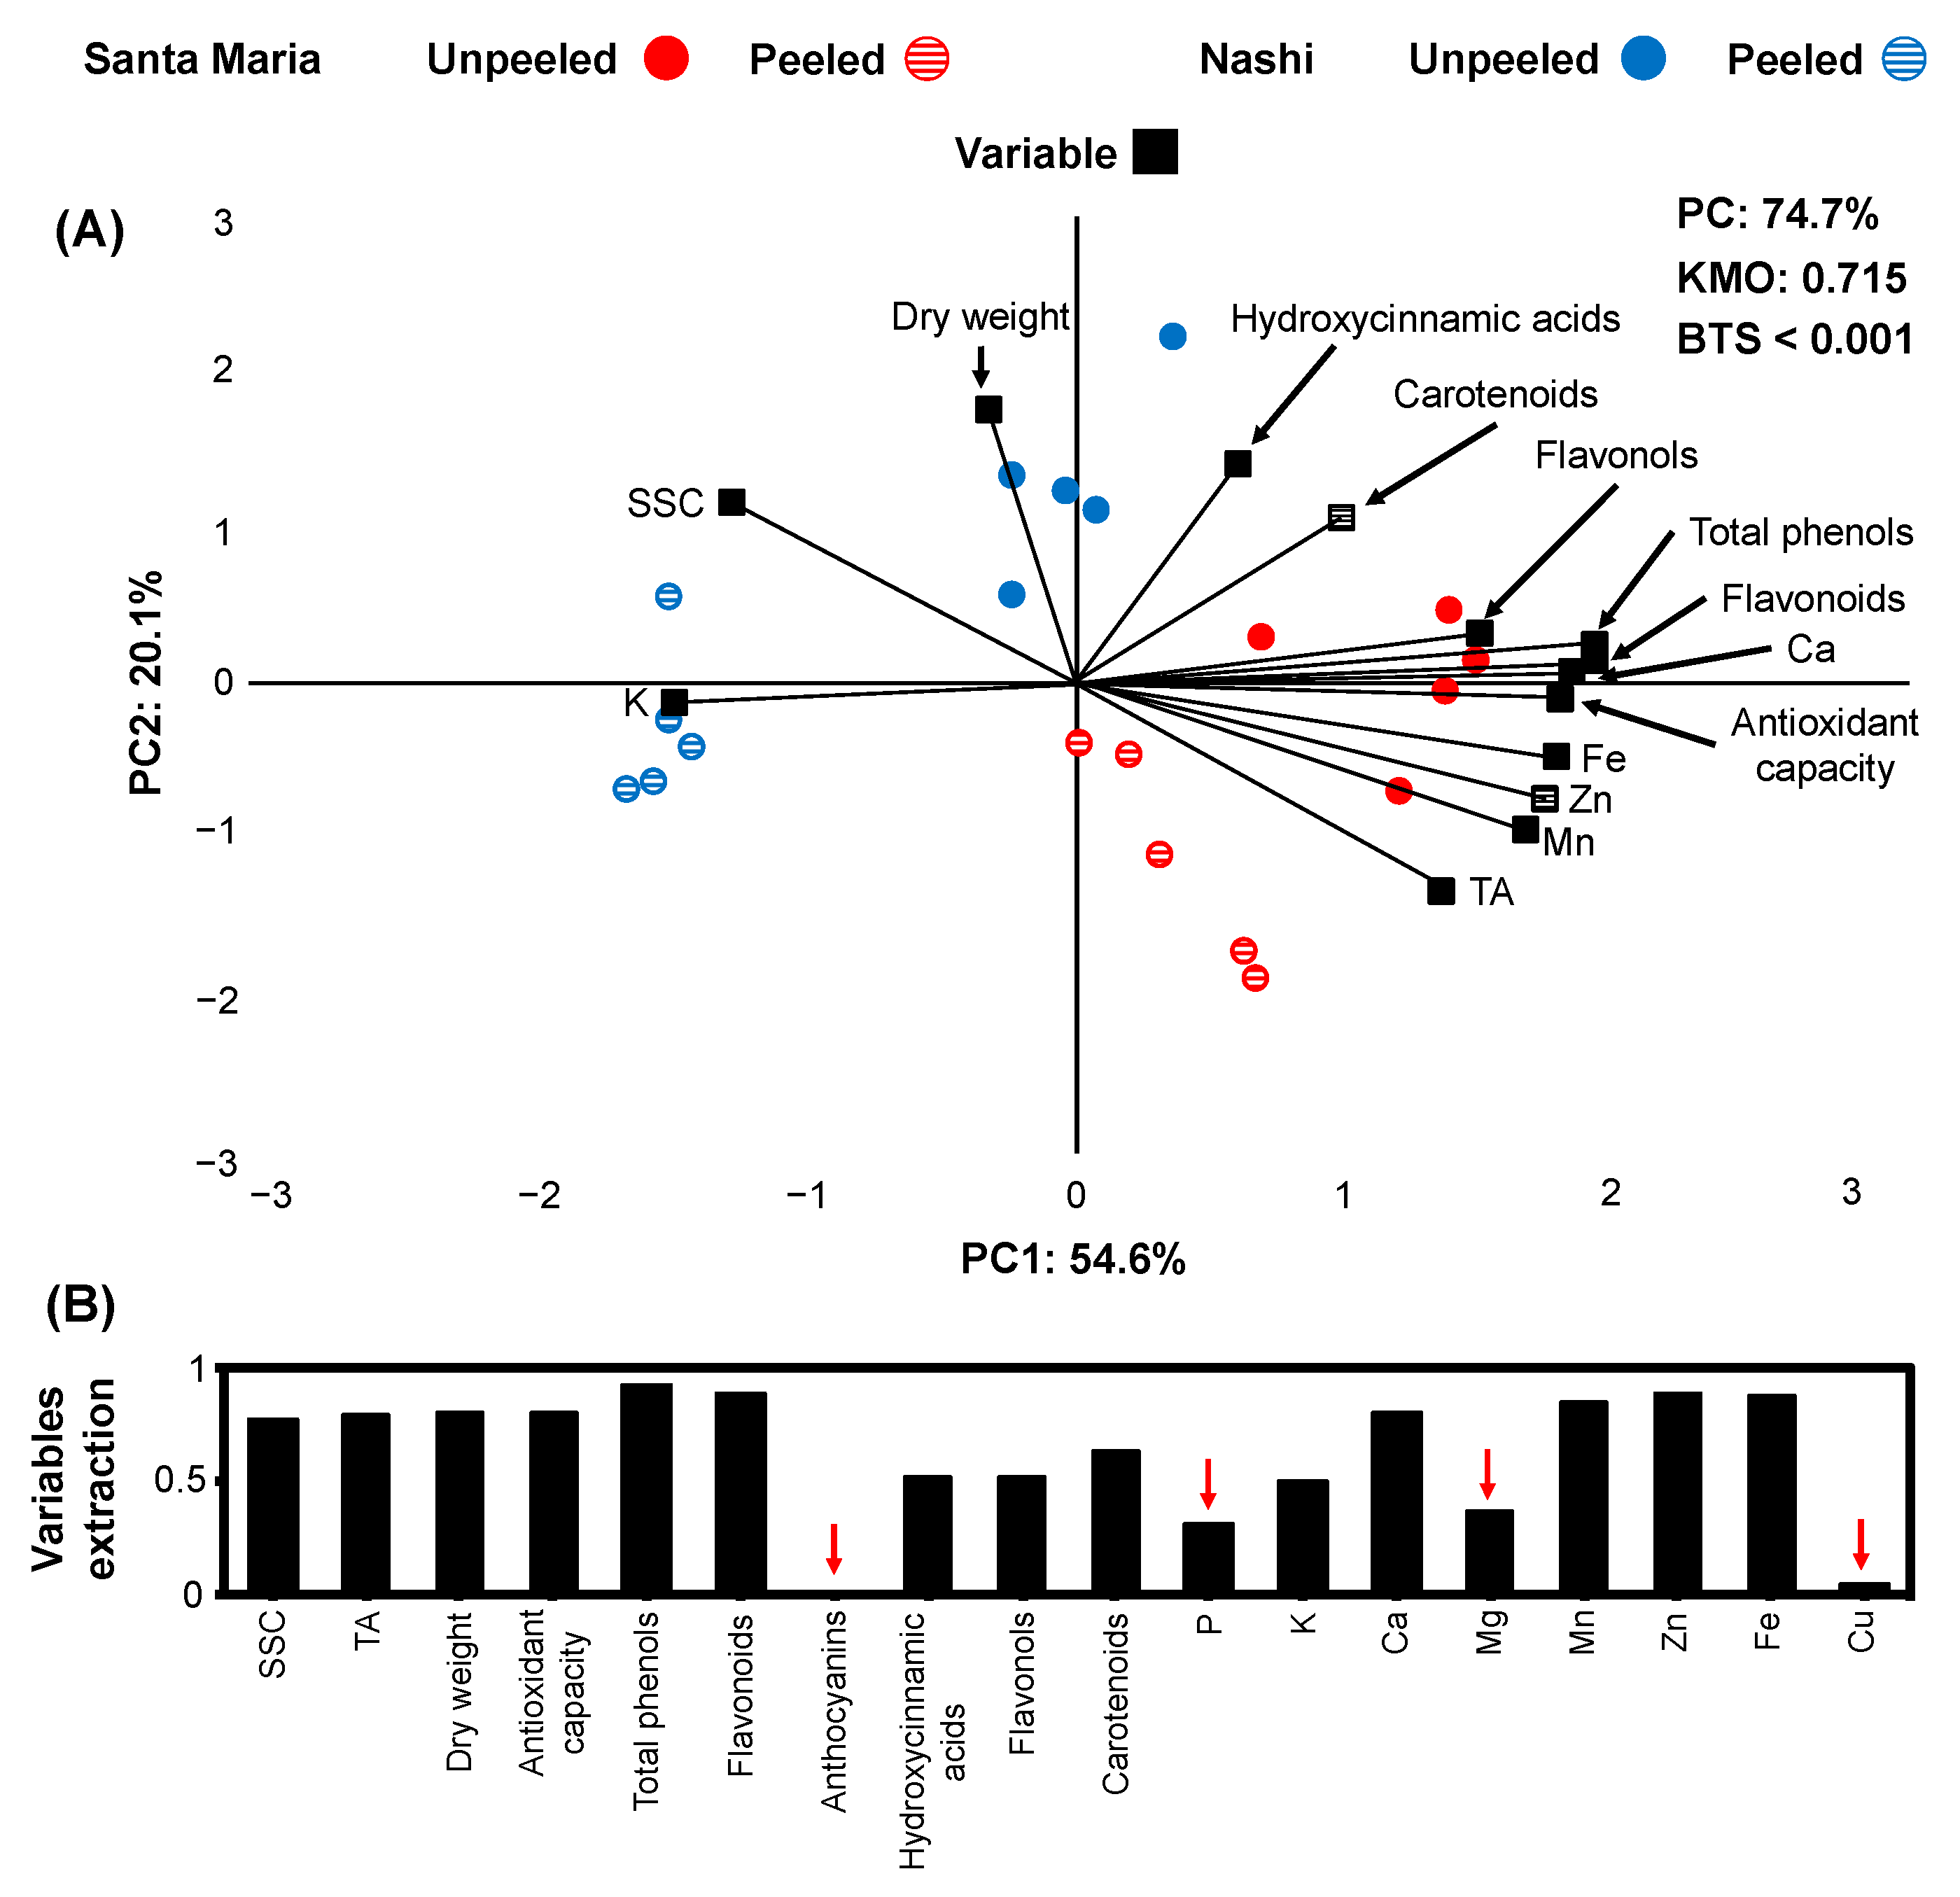
3.2. Contribution of Peeled and Unpeeled Fruits Inter-Genera

In the present study, the principal component analysis (PCA) was performed to identify the relationships between physio-biochemicals traits and nutrient levels between unpeeled and peeled peach, apple, and pear fruits (Figure 1, Figure 2 and Figure 3). At peach fruits, 11 variables (6 physio-biochemical and 5 element variables) fulfilled the criterion of variable extraction (>0.5; Figure 1B) with the total variance, explained by the PCA model, was 71.6%, with 38.7% from PC1 and 32.9% from PC2 (Figure 1A). The KMO score data were 0.761, and BTS was lower than 0.001. Changes in PC1 scores were associated with the separation of the peach cultivars (Red Heaven and Maria Bianca; positive values) from the nectarines (Big Top and Queen Giant; negative values) according to their nutrient status. On the other hand, PC2 was more closely linked to flesh tissue attributes as most of the unpeeled fruits had positive values, while the peeled ones had negative values (Figure 1A) based on biochemical factors such as flavonols, antioxidant capacity, and total phenol content.
There was a clear grouping of peeled and unpeeled Red Heaven fruits; however, peeled fruits were not clearly separated from the rest of the cultivars (Figure 1A). Additionally, unpeeled Red Heaven fruit displayed a higher content of the nutrients (P, K, Mg, Fe, Cu) compared to the peeled ones (Figure 1A). The peach Red Heaven and Maria Bianca showed a higher flavonoids content and lower dry weight and hydroxycinnamate than nectarines since these variables were more closely related to PC1. Furthermore, total phenols, antioxidant capacity, and flavonols at the unpeeled fruits were higher compared to the peeled fruits because these variables were closely related to the PC2 (Figure 1A).
In pear cultivars 14 variables (9 physio-biochemical and 5 element variables) fulfilled the criterion of variable extraction (>0.5; Figure 2B); the total variance of the PCA model was about 74.7%, PC1 explained 54.6%, and PC2 20.1% of the total variance (Figure 2A). The KMO score data were 0.715, and the BTS was lower than 0.001. It was evidenced that PC1 score changes were associated with the separation of the biochemical and nutrient assay in the pear cultivars (peeled or unpeeled), whereas PC2 was more closely linked to the fruit dry weight (Figure 2A). There was a clear separation of the Santa Maria and Nashi pear and between peeled and unpeeled fruits in both cultivars (Figure 2A). The unpeeled Santa Maria fruits exhibited higher Ca, Mn, Fe, Zn contents and antioxidant capacity, total phenols, flavonoids, and flavonols than Nashi pears or the peeled ones (Figure 2A). The unpeeled Nashi pears had a higher dry weight than the Santa Maria pears or than the peeled-ones; in addition, the peeled Nashi pears had a higher K content than the Santa Maria or the unpeeled-ones. Meanwhile, the unpeeled fruit in both pear cultivars had higher carotenoids and hydroxycinnamic acids than the peeled ones (Figure 2A).
At apple cultivars, 15 variables (10 physio-biochemical and 5 element variables) fulfilled the criterion of variable extraction (>0.5; Figure 3B). The PCA model explained a total variance of 68.7%, PC1 explained 37%, and PC2 31.7% of the total variance (Figure 3A). The KMO score data were 0.652, and the BTS lower than 0.001. The PC1 scores were associated with the separation of Gala (positive values) from Granny Smith (negative values), based on nutrients, physiological traits, and non-polar bioactive compounds such as carotenoids. PC2 was more closely linked to unpeeled Red Chief and Gala, as most of the unpeeled fruits had positive values and the peeled ones showed negative values (Figure 3A), based on several biochemical traits (e.g., antioxidant capacity, flavonoids, anthocyanins). A clear separation between peeled and unpeeled Red Chief and Gala fruits was identified (Figure 3A). The unpeeled Gala apples presented greater Ca, Zn content, and physio-biochemical traits such as flavonols, hydroxycinnamic acids, carotenoids than either the rest of the apple cultivars or the peeled ones (Figure 3A). Similarly, the unpeeled Red Chief fruits had higher biochemical factors such as antioxidant capacity, flavonoids, total phenols, and anthocyanins, whereas both Granny Smith samples (peeled and unpeeled apples) displayed higher TA (Figure 3A).

3.3. Physio-Biochemical Attributes and Nutrient Content of the Unpeeled to Peeled Fruits

The physio-biochemical attributes and nutrient content log-ratios between unpeeled and peeled fruits from all cultivars were fitted in a PCA model (Figure 4).
The analysis of the log-ratios (unpeeled to peeled) of all variables (5 physio-biochemical and 5 element variables) among all cultivars (Figure 4B) with the total variance explained by the PCA model to be 79.2%, in the PC1 explained the variance of 39.1%, in the PC2 the variance of 25.5%, and in the PC3 the variance of 14.5 (Figure 4A). Changes in the PC1 scores were associated with the separation of Nashi (positive values) and Santa Maria (negative values) pears according to biochemical factors (e.g., antioxidant capacity, total phenols, flavonoids, and carotenoids) and elements (e.g., Cu, K, Ca; Figure 4A). PC2 was closely linked to P, K, and Mg (positive values; Figure 4A). PC3 scores were associated with anthocyanins and Mg (positive values) and carotenoids (negative values; Figure 4A). There was a clear separation in PC1 between Nashi (positive values) and Santa Maria (negative values), indicating an increase in the variables (i.e., antioxidant capacity, total phenols, flavonoids, carotenoids, Ca) in the unpeeled to peeled fruit, and a decrease in potassium and copper in Nashi pears; (Figure 4A). The Granny Smith fruit was clearly separated from the other apple cultivars based on PC2 having an increase in unpeeled to peeled log-ratio in P, K, Ca, and Mg (Figure 4A). Similarly, the cultivars Red Chief and Gala (positive values) were clearly separated from the other cultivars based on PC3, with Red Chief having a more uniform variance and a better separation than Gala, which depicted an increased log-ratio of unpeeled to peeled in anthocyanins and Mg (Figure 4A).

4. Discussion

The peel of the fruit is the natural barrier between the environment and the flesh [4]. It prevents dehydration and pathogen penetration, provides mechanical support, and protects against external effects (such as ultraviolet radiation [30,31]). All of these benefits that the peel offers to the fruit are due to the existence of the outer, non-polar layer of the cuticle, which varies both qualitatively and quantitatively among the different types of fruits [32]. In peaches, apples, and pears the exocarp consists of small-sized cells of a few layers in comparison to the mesocarp that has large cells during fruit ripening [33,34]. Therefore, the peeling of the aforementioned fruits possibly removes a high amount of dry mass [17], which was clearly evidenced in this study from the positive value of unpeeled to peeled fruit dry weight log-ratio (Table 1). Nonetheless, no significant effect of dry weight on the comparison between unpeeled and peeled fruit within each cultivar was observed due to the high variation among the fruits tested for each cultivar (except for the Red Heaven, Nashi, and Gala; Table 1). The soluble solid concentration and the total acidity of the pears are closely associated with the fruit flavor [35], and, therefore, higher values may imply a stronger taste. At Santa Maria, lower values of SSC and TA of the log-ratio between unpeeled to peeled fruits were determined (Table 1), suggesting an increased sense of flavor when just the flesh of this cultivar was being consumed. Fruit dry weight was associated with the quality and flavor in kiwifruit [36] and with the SSC in apples [37], and there was no association between dry weight and SSC in peaches [38] as it was presented in the current work (Figure 1; Figure 3).
Previous studies noted that the peel contains a higher amount of total phenols than the flesh at various types of fruits, including peaches [7], pears [10], and apples [13]. In this study, the unpeeled fruits of all fruit species tested contained a higher amount of total phenols compared to the peeled ones (Table 1). In addition, we found that the total phenols content was strongly associated with antioxidant activity, as documented by the PCA analysis in peach (Figure 1A) and pear (Figure 2A) fruits as well as by the log-ratio of unpeeled to peeled fruit in all cultivars (Figure 4A). Flavonoids, which are part of total phenols [39], in the unpeeled apple fruits were increased in comparison to the peeled ones (Table 1). PCA analysis further indicated that the flavonoids content was strongly associated with the antioxidant capacity of apples (Figure 3A). It has been also reported that flavonoid substances, such as epicatechin, procyanidin B2, and quarcetin glycosides, had a higher contribution to apple fruit antioxidant capacity than other phytochemicals [40]. In nectarines, anthocyanins were more abundant in unpeeled compared to peeled fruits when calculated both as content or as a log-ratio of anthocyanin content of unpeeled to peeled fruits (Table 1), which coincided with previous observations showing that the peel of peaches and nectarines contained more anthocyanins than the flesh [41]. The results of this research could be attributed to the fact that there was a high variance of anthocyanins in peaches and nectarines (Table 1) due to the red-blushed surface of the peel as well as to the red-blushed flesh around the stone core [20]. The coating of the red color on the peel surface resulted in anthocyanin accumulation at the unpeeled Red Chief in relation to the unpeeled Gala apple (Table 1), since the Gala fruit did not develop a red color across its entire surface [42], and the differentiation throughout its surface was based mainly on anthocyanins. Anthocyanins also contributed to the phenol-associated increase in the antioxidant capacity, with all the above variables being positively correlated in regard to unpeeled apple fruits (Figure 3A). Hydroxycinnamate content was also more abundant at the peel of both peaches [7] and pears [10,11], but it did not alter between unpeeled and peeled fruit (Table 1), apart from Santa Maria pears. The current results also revealed the significant impact of peeling in flavonols of Santa Maria pears (Table 1) and it was similar to that reported earlier by Li [10]. Meanwhile, increased carotenoid content was observed at unpeeled versus peeled Nashi (pear), Granny Smith, and Red Chief (apples) fruits (Table 1), confirming previous observations that apple peel had a higher concentration of carotenoids than the flesh [12]. It was proposed that the consumption of unpeeled Asian pear fruit may effectively increase the antioxidant activity in the human body [43]. In this sense, the results from the PCA model suggested that the consumption of the unpeeled Asian pear (Nashi) was highly linked to an increased source of many health-promoting substances (Figure 4A). On the contrary, the Santa Maria pear displayed an opposite trend (negative values) in the above variables, indicating that the antioxidant properties and the resulting health benefits of this cultivar were unaffected by peeling (Figure 4A). It was proved that consumers could prefer certain foods as good sources of specific minerals, but the mineral composition varied widely among raw fruit species and among cultivars [44]. The main minerals and essential trace elements were very important for biological processes, and played a vital role in fruit development, and were also involved in the prevention of some chronic diseases [45]. In most of the nutrient elements evaluated, their content was significantly different depending on the peeling and the fruit cultivar evaluated. This PCA model suggested that Red Heaven peach and Santa Maria pear fruits should be consumed unpeeled since they contained an increased concentration of nutrients (P, K, Mg, Fe and Ca, Zn, Mn, Fe, respectively; Figure 1A and Figure 2B). It was shown that the pear peel tissue contained higher amounts of P, K, and Mn than the flesh [16]. In our study, these mineral elements were higher in unpeeled Santa Maria pears than at the peeled fruit (Table 2). In three peach cultivars tested, the K flesh content was higher compared to the peel, whereas the minerals Mg, Ca, Zn, Cu, and Mn in the peel were higher in comparison to the flesh [46]. The highest concentration of K in the flesh against the peel had been reported by Başar [18]. We also observed that the K concentration was lower in the unpeeled Big Top peach in comparison to the peeled (Table 2). The result was similar to that reported earlier by Başar [18] and Dabbou [46]. Moreover, the highest average content of several elements such as Mg, Ca, Mn, and Zn was determined at the unpeeled fruits of the peach cultivars Red Heaven, Maria Blanca, and Queen Giant. Therefore, it might be concluded that these nutrients were being accumulated principally at the peel and that lower amounts were in the fruit flesh. In our previous study, it was shown that the Ca and Mg contents at the peels of various apple cultivars were significantly higher than at their flesh parts [15]. These results were in agreement with the current data (Table 2).

5. Conclusions

From the current study, it was suggested that fruits (apart from Santa Maria) would be more beneficial when consumed with their peel, as discarding this part means great beneficial substance loss. The PCA models indicated a clear separation of the cultivars’ inner-genus and between unpeeled and peeled fruits inner-cultivar. In peaches versus nectarines, an increase in antioxidant capacity, total phenols, flavonoids, and minerals was recorded, contrary to nectarines, in which an increase in hydroxycinnamate and dry weight was observed. Santa Maria versus Nashi cultivars exhibited an increase in four biochemical traits, minerals, and TA, in contrast to Nashi, which exhibited an increase in SSC, K, and dry matter. In the Granny Smith cultivar, an increase in TA was observed; in Gala, an increase in SSC, carotenoids, dry weight, hydroxycinnamic acids, flavonols, and minerals were recorded; and in the unpeeled fruit of Red Chief an increase in anthocyanins, antioxidant capacity, total phenols, and flavonoids was observed. We also would propose the consumption of unpeeled pear Nashi, as the peel contribution in unpeeled fruits more effectively increased the beneficial compounds’ uptake than the peeled one. The unpeeled Granny Smith fruits were associated with an increased uptake of mineral elements. The unpeeled fruits of Red Chief were associated with an increased uptake of anthocyanins and Mg.

Author Contributions

Conceptualization, M.M. and G.T.; data curation, M.M., E.K., E.N., and C.S.; formal analysis, M.M.; investigation, M.M.; methodology, M.M.; project administration, G.T.; resources, M.M.; software, M.M.; supervision, G.T.; validation, M.M., E.K., and G.T.; visualization, M.M. and A.M.; writing—original draft, M.M.; writing—review & editing, A.M. All authors have read and agreed to the published version of the manuscript.

Funding

This research received no external funding.

Institutional Review Board Statement

Not applicable.

Informed Consent Statement

Not applicable.

Data Availability Statement

Data is contained within the article.

Conflicts of Interest

The authors declare no conflict of interest.

References

  1. Slavin, J.L.; Lloyd, B. Health Benefits of Fruits and Vegetables. Adv. Nutr. 2012, 3, 506–516. [Google Scholar] [CrossRef] [PubMed] [Green Version]
  2. Bassett, J.; McClure, P. A risk assessment approach for fresh fruits. J. Appl. Microbiol. 2008, 104, 925–943. [Google Scholar] [CrossRef] [PubMed]
  3. Claeys, W.L.; Schmit, J.-F.; Bragard, C.; Maghuin-Rogister, G.; Pussemier, L.; Schiffers, B. Exposure of several Belgian consumer groups to pesticide residues through fresh fruit and vegetable consumption. Food Control. 2011, 22, 508–516. [Google Scholar] [CrossRef] [Green Version]
  4. Gonzalez-Talice, J.; Yuri, J.A.; Del Pozo, A. Relations among pigments, color and phenolic concentrations in the peel of two Gala apple strains according to canopy position and light environment. Sci. Hortic. 2013, 151, 83–89. [Google Scholar] [CrossRef]
  5. Li, D.; Zhang, X.; Li, L.; Aghdam, M.S.; Wei, X.; Liu, J.; Xu, Y.; Luo, Z. Elevated CO2 delayed the chlorophyll degradation and anthocyanin accumulation in postharvest strawberry fruit. Food Chem. 2019, 285, 163–170. [Google Scholar] [CrossRef]
  6. Remorini, D.; Tavarini, S.; Degl’Innocenti, E.; Loreti, F.; Massai, R.; Guidi, L. Effect of rootstocks and harvesting time on the nutritional quality of peel and flesh of peach fruits. Food Chem. 2008, 110, 361–367. [Google Scholar] [CrossRef]
  7. Liu, H.; Cao, J.; Jiang, W. Evaluation and comparison of vitamin C, phenolic compounds, antioxidant properties and metal chelating activity of pulp and peel from selected peach cultivars. LWT 2015, 63, 1042–1048. [Google Scholar] [CrossRef]
  8. Andreotti, C.; Ravaglia, D.; Ragaini, A.; Costa, G. Phenolic compounds in peach (Prunus persica) cultivars at harvest and during fruit maturation. Ann. Appl. Biol. 2008, 153, 11–23. [Google Scholar] [CrossRef]
  9. Muñoz, M.I.G.; Tomás-Barberán, F.A.; Hess-Pierce, B.; Kader, A.A. Antioxidant Capacities, Phenolic Compounds, Carotenoids, and Vitamin C Contents of Nectarine, Peach, and Plum Cultivars from California. J. Agric. Food Chem. 2002, 50, 4976–4982. [Google Scholar] [CrossRef]
  10. Li, X.; Wang, T.; Zhou, B.; Gao, W.; Cao, J.; Huang, L. Chemical composition and antioxidant and anti-inflammatory potential of peels and flesh from 10 different pear varieties (Pyrus spp.). Food Chem. 2014, 152, 531–538. [Google Scholar] [CrossRef]
  11. Lin, L.-Z.; Harnly, J.M. Phenolic Compounds and Chromatographic Profiles of Pear Skins (Pyrusspp.). J. Agric. Food Chem. 2008, 56, 9094–9101. [Google Scholar] [CrossRef] [PubMed]
  12. Delgado-Pelayo, R.; Gallardo-Guerrero, L.; Hornero-Méndez, D. Chlorophyll and carotenoid pigments in the peel and flesh of commercial apple fruit varieties. Food Res. Int. 2014, 65, 272–281. [Google Scholar] [CrossRef] [Green Version]
  13. Drogoudi, P.D.; Michailidis, Z.; Pantelidis, G. Peel and flesh antioxidant content and harvest quality characteristics of seven apple cultivars. Sci. Hortic. 2008, 115, 149–153. [Google Scholar] [CrossRef]
  14. Stone, J.; Marcuse, D. Ultrahigh finesse fiber Fabry-Perot interferometers. J. Light. Technol. 1986, 4, 382–385. [Google Scholar] [CrossRef]
  15. Manzoor, M.; Anwar, F.; Saari, N.; Ashraf, M. Variations of Antioxidant Characteristics and Mineral Contents in Pulp and Peel of Different Apple (Malus domestica Borkh.) Cultivars from Pakistan. Molecules 2012, 17, 390–407. [Google Scholar] [CrossRef] [PubMed] [Green Version]
  16. Faust, M.; Shear, C.B.; Brooks, H.J. Mineral element gradients in pears. J. Sci. Food Agric. 1969, 20, 257–258. [Google Scholar] [CrossRef]
  17. Henríquez, C.; Almonacid, S.; Chiffelle, I.; Valenzuela, T.; Araya, M.; Cabezas, L.; Simpson, R.; Speisky, H. Determinación de la capacidad antioxidante, contenido de fenoles totales y composición mineral de diferentes tejidos de frutos de cinco variedades de manzana cultivadas en Chile. Chil. J. Agric. Res. 2010, 70, 523–536. [Google Scholar] [CrossRef]
  18. Başar, H. Elemental composition of various peach cultivars. Sci. Hortic. 2006, 107, 259–263. [Google Scholar] [CrossRef]
  19. Asami, D.K.; Hong, Y.-J.; Barrett, A.D.M.; Mitchell, A.E. Comparison of the Total Phenolic and Ascorbic Acid Content of Freeze-Dried and Air-Dried Marionberry, Strawberry, and Corn Grown Using Conventional, Organic, and Sustainable Agricultural Practices. J. Agric. Food Chem. 2003, 51, 1237–1241. [Google Scholar] [CrossRef] [PubMed]
  20. Karagiannis, E.; Tanou, G.; Samiotaki, M.; Michailidis, M.; Diamantidis, G.; Minas, I.S.; Molassiotis, A. Comparative Physiological and Proteomic Analysis Reveal Distinct Regulation of Peach Skin Quality Traits by Altitude. Front. Plant Sci. 2016, 7, 1689. [Google Scholar] [CrossRef]
  21. Makkar, H.P.S.; Blümmel, M.; Borowy, N.K.; Becker, K. Gravimetric determination of tannins and their correlations with chemical and protein precipitation methods. J. Sci. Food Agric. 1993, 61, 161–165. [Google Scholar] [CrossRef]
  22. Cvek, J.; Jasprica, I.; Zubčić, S.; Vitali, D.; Mornar, A.; Tomic, S.; Medić-Šarić, M.; Vedrina-Dragojević, I. Optimisation of an extraction procedure and chemical characterisation of Croatian propolis tinctures. Phytochem. Anal. 2007, 18, 451–459. [Google Scholar] [CrossRef] [PubMed]
  23. Obied, H.K.; Allen, M.S.; Bedgood, D.R.; Prenzler, P.D.; Robards, K.; Stockmann, R. Bioactivity and Analysis of Biophenols Recovered from Olive Mill Waste. J. Agric. Food Chem. 2005, 53, 823–837. [Google Scholar] [CrossRef] [PubMed]
  24. Kuti, J.O. Antioxidant compounds from four Opuntia cactus pear fruit varieties. Food Chem. 2004, 85, 527–533. [Google Scholar] [CrossRef]
  25. Michailidis, M.; Karagiannis, E.; Tanou, G.; Sarrou, E.; Adamakis, I.-D.; Karamanoli, K.; Martens, S.; Molassiotis, A. Metabolic mechanisms underpinning vegetative bud dormancy release and shoot development in sweet cherry. Environ. Exp. Bot. 2018, 155, 1–11. [Google Scholar] [CrossRef]
  26. Molassiotis, A.N.; Sotiropoulos, T.; Tanou, G.; Kofidis, G.; Diamantidis, G.; Therios, E. Antioxidant and anatomical responses in shoot culture of the apple rootstock MM 106 treated with NaCl, KCl, mannitol or sorbitol. Biol. Plant. 2006, 50, 61–68. [Google Scholar] [CrossRef]
  27. Sotiropoulos, T.E.; Molassiotis, A.; Almaliotis, D.; Mouhtaridou, G.; Dimassi, K.; Therios, I.; Diamantidis, G. Growth, Nutritional Status, Chlorophyll Content, and Antioxidant Responses of the Apple Rootstock MM 111 Shoots Cultured Under High Boron Concentrations In Vitro. J. Plant Nutr. 2006, 29, 575–583. [Google Scholar] [CrossRef]
  28. Michailidis, M.; Karagiannis, E.; Tanou, G.; Karamanoli, K.; Lazaridou, A.; Matsi, T.; Molassiotis, A. Metabolomic and physico-chemical approach unravel dynamic regulation of calcium in sweet cherry fruit physiology. Plant Physiol. Biochem. 2017, 116, 68–79. [Google Scholar] [CrossRef]
  29. Michailidis, M.; Karagiannis, E.; Tanou, G.; Samiotaki, M.; Tsiolas, G.; Sarrou, E.; Stamatakis, G.; Ganopoulos, I.; Martens, S.; Argiriou, A.; et al. Novel insights into the calcium action in cherry fruit development revealed by high-throughput mapping. Plant Mol. Biol. 2020, 104, 597–614. [Google Scholar] [CrossRef]
  30. Michailidis, M.; Karagiannis, E.; Polychroniadou, C.; Tanou, G.; Karamanoli, K.; Molassiotis, A. Metabolic features underlying the response of sweet cherry fruit to postharvest UV-C irradiation. Plant Physiol. Biochem. 2019, 144, 49–57. [Google Scholar] [CrossRef] [PubMed]
  31. Xu, Y.; Charles, M.T.; Luo, Z.; Mimee, B.; Tong, Z.; Véronneau, P.-Y.; Roussel, D.; Rolland, D. Ultraviolet-C priming of strawberry leaves against subsequent Mycosphaerella fragariae infection involves the action of reactive oxygen species, plant hormones, and terpenes. Plant Cell Environ. 2019, 42, 815–831. [Google Scholar] [CrossRef]
  32. Martin, L.B.B.; Rose, J.K.C. There’s more than one way to skin a fruit: Formation and functions of fruit cuticles. J. Exp. Bot. 2013, 65, 4639–4651. [Google Scholar] [CrossRef] [Green Version]
  33. Li, Z.; Yang, H.; Li, P.; Liu, J.; Wang, J.; Xu, Y. Fruit biomechanics based on anatomy: A review. Int. Agrophysics 2013, 27, 97–106. [Google Scholar] [CrossRef] [Green Version]
  34. Konarska, A. The relationship between the morphology and structure and the quality of fruits of two pear cultivars (pyrus communis L.) during their development and maturation. Sci. World J. 2013, 2013, 1–13. [Google Scholar] [CrossRef]
  35. Rizzolo, A.; Grassi, M.; Vanoli, M. 1-Methylcyclopropene application, storage temperature and atmosphere modulate sensory quality changes in shelf-life of ‘Abbé Fétel’ pears. Postharvest Biol. Technol. 2014, 92, 87–97. [Google Scholar] [CrossRef]
  36. Nardozza, S.; Gamble, J.; Axten, L.G.; Wohlers, M.W.; Clearwater, M.J.; Feng, J.; Harker, F.R. Dry matter content and fruit size affect flavour and texture of novel Actinidia deliciosa genotypes. J. Sci. Food Agric. 2010, 91, 742–748. [Google Scholar] [CrossRef] [PubMed]
  37. Palmer, J.; Harker, F.R.; Tustin, D.S.; Johnston, J. Fruit dry matter concentration: A new quality metric for apples. J. Sci. Food Agric. 2010, 90, 2586–2594. [Google Scholar] [CrossRef]
  38. Wu, B.; Quilot, B.; Kervella, J.; Génard, M.; Li, S. Analysis of genotypic variation of sugar and acid contents in peaches and nectarines through the Principle Component Analysis. Euphytica 2003, 132, 375–384. [Google Scholar] [CrossRef]
  39. Michailidis, M.; Karagiannis, E.; Tanou, G.; Sarrou, E.; Stavridou, E.; Ganopoulos, I.; Karamanoli, K.; Madesis, P.; Martens, S.; Molassiotis, A. An integrated metabolomic and gene expression analysis identifies heat and calcium metabolic networks underlying postharvest sweet cherry fruit senescence. Planta 2019, 250, 2009–2022. [Google Scholar] [CrossRef] [PubMed]
  40. Lee, K.W.; Kim, Y.J.; Kim, D.-O.; Lee, A.H.J.; Lee, C.Y. Major Phenolics in Apple and Their Contribution to the Total Antioxidant Capacity. J. Agric. Food Chem. 2003, 51, 6516–6520. [Google Scholar] [CrossRef]
  41. Tomás-Barberán, F.A.; Gil Muñoz, M.I.; Cremin, P.; Waterhouse, A.L.; Hess-Pierce, B.; Kader, A.A. HPLC−DAD−ESIMS Analysis of Phenolic Compounds in Nectarines, Peaches, and Plums. J. Agric. Food Chem. 2001, 49, 4748–4760. [Google Scholar] [CrossRef]
  42. Iglesias, I.; Echeverría, G.; Soria, Y. Differences in fruit colour development, anthocyanin content, fruit quality and consumer acceptability of eight ‘Gala’ apple strains. Sci. Hortic. 2008, 119, 32–40. [Google Scholar] [CrossRef]
  43. Lee, S.-H.; Cho, J.-Y.; Jeong, H.Y.; Jeong, D.E.; Kim, D.; Cho, S.-Y.; Kim, W.-S.; Moon, J.-H. Comparison of bioactive compound contents and in vitro and ex vivo antioxidative activities between peel and flesh of pear (Pyrus pyrifolia Nakai). Food Sci. Biotechnol. 2015, 24, 207–216. [Google Scholar] [CrossRef]
  44. Florkowski, W.J.; Shewfelt, R.L.; Brueckner, B.; Prussia, S.E. Challenges in Postharvest Handling (Chapter 20). In Postharvest Handling: A Systems Approach; Elsevier: Amsterdam, The Netherlands, 2014; pp. 543–547. [Google Scholar] [CrossRef]
  45. Gorinstein, S.; Zachwieja, Z.; Folta, M.; Barton, H.; Piotrowicz, J.; Zemser, M.; Weisz, M.; Trakhtenberg, S.; Màrtín-Belloso, O. Comparative Contents of Dietary Fiber, Total Phenolics, and Minerals in Persimmons and Apples. J. Agric. Food Chem. 2001, 49, 952–957. [Google Scholar] [CrossRef] [PubMed]
  46. Dabbou, S.; Maatallah, S.; Castagna, A.; Guizani, M.; Sghaeir, W.; Hajlaloui, H.; Ranieri, A. Carotenoids, Phenolic Profile, Mineral Content and Antioxidant Properties in Flesh and Peel of Prunus persica Fruits during Two Maturation Stages. Plant Foods Hum. Nutr. 2016, 72, 103–110. [Google Scholar] [CrossRef] [PubMed]
Figure 1. Principal component analysis (PCA) in a biplot (A) of physio-biochemical traits and nutrients content (as variables: black) of four peach cultivars (Red Heaven: red, Maria Bianca: green, Big Top: orange, Queen Giant: blue) unpeeled (circle filled with color) compared to peeled (circle filled with horizontal lines) after 2 months of cold storage. Eighteen physio-biochemical and nutrient variables extraction (B) based on the representation in the PCA model (red arrows indicate variables with low representation in the PCA model).
Horticulturae 07 00085 g001
Figure 2. Principal component analysis (PCA) in a biplot (A) of physio-biochemical attributes and nutrients content (variables = black) of two pear cultivars (Santa Maria: red, Nashi: blue) unpeeled (circle filled with color) compared to peeled (circle filled with horizontal lines) after 2 months of cold storage. Eighteen physio-biochemical and mineral variables extraction (B) based on the representation in the PCA model (red arrows indicate variables with low representation in the PCA model).
Horticulturae 07 00085 g002
Figure 3. Principal component analysis (PCA) in a biplot (A) of physio-biochemical characteristics and elementary content (variables: black) of three apple cultivars (Gala: red, Granny Smith: green, Red Chief: blue) unpeeled (circle filled with color) compared to peeled (circle filled with horizontal lines) after 2 months of cold storage. Eighteen physio-biochemical and elementary variables extraction (B) based on the representation in the PCA model (red arrows indicate variables with low representation in the PCA model).
Horticulturae 07 00085 g003
Figure 4. Principal component analysis (PCA) (A) for PC1, PC2, and PC3 of physio-biochemical and elementary log-ratios (bars filled with horizontal lines) between unpeeled and peeled fruits expressed as logarithm base two of four peach cultivars (Red Heaven: red, Maria Bianca: green, Big Top: purple, Queen Giant: light blue), two pear cultivars (Santa Maria: yellow, Nashi: orange), and three apple cultivars (Gala: lilac, Granny Smith: blue, Red Chief: brown; bars filled with color). Eighteen physio-biochemical and mineral variables extraction (B) based on the representation in the PCA model (red arrows indicate variables with a low representation in the PCA model).
Horticulturae 07 00085 g004
Table 1. Physio-biochemical properties of unpeeled and peeled fruit.
UnpeeledPeeledp-ValueFold-Change (Unpeeled/Peeled; Log2)
CultivarMeanSDMeanSDMeanLowerUpper
Soluble solids concentration (SSC, % Brix)PeachRed Heaven12.181.0611.881.18 0.038−0.0130.089
Maria Blanka13.490.9313.40.98 0.01−0.060.08
Big Top12.191.5813.451.17 −0.148−0.310.014
Queen Giant13.240.8612.921 0.036−0.0330.105
PearSanta Maria13.440.913.971.02 −0.055−0.076−0.034
Nashi14.841.0314.711.1 0.013−0.0380.064
AppleGala15.421.0315.190.98 0.022−0.0480.092
Granny Smith11.620.5711.840.52 −0.027−0.060.006
Red Chief14.781.2814.851.37 −0.006−0.0940.082
Titratable acidity (TA, % malate)PeachRed Heaven2.380.212.540.15 −0.095−0.174−0.016
Maria Blanka2.210.082.320.17 −0.068−0.1780.042
Big Top2.510.222.730.23*−0.119−0.240.002
Queen Giant2.260.132.290.15 −0.021−0.1580.116
PearSanta Maria0.430.050.50.05*−0.194−0.347−0.041
Nashi0.280.030.320.04*−0.157−0.3370.023
AppleGala0.450.060.460.06 −0.039−0.1750.097
Granny Smith0.940.070.950.12 −0.014−0.190.162
Red Chief0.480.040.440.05 0.132−0.0930.357
Dry weight (%)PeachRed Heaven150.6814.140.46**0.0850.0330.137+
Maria Blanka14.881.0914.070.92 0.0790.0270.131+
Big Top16.371.3315.631.13 0.0660.020.112+
Queen Giant15.460.9114.750.96 0.0680.0130.123+
PearSanta Maria16.311.4515.721.19 0.052−0.0070.111
Nashi17.590.9716.421.14*0.10.0590.141+
AppleGala18.971.4617.621.1*0.1050.0420.168+
Granny Smith16.140.5115.650.64 0.0450.0130.077+
Red Chief17.961.4117.121.51 0.070.010.13+
Antioxidant capacity (DPPH, μg trolox/g)PeachRed Heaven807.54255.96490.04133.82**0.6920.3091.075+
Maria Blanka707.16355.89413.79313.7 1.0530.1391.967+
Big Top719.35188.41503.55225.12*0.6060.3050.907+
Queen Giant519.4226.13391.66210.96 0.480.0530.907+
PearSanta Maria779.05158.18798.14146.78 −0.041−0.2680.186
Nashi664.91164.28125.8359.49***2.5121.7063.318+
AppleGala1189.8170.45617.36117.96***0.9580.7811.135+
Granny Smith1002.8179.79754.9188.91**0.430.2470.613+
Red Chief1369.49137.56763.29158.42***0.8640.5321.196+
Total polyphenols (μg gallic acid/g)PeachRed Heaven1247.45302.25949.91157.66*0.3690.0870.651+
Maria Blanka1122.32532.55884.15517.92 0.4370.0620.812+
Big Top1189.98426.28960.24374.38 0.3260.2040.448+
Queen Giant818.8331.83607.75283.86 0.4480.1250.771+
PearSanta Maria1169.98185.041011.15179.86 0.2150.070.36+
Nashi993.44174.45396.1858.84***1.3221.0091.635+
AppleGala1531.7272.581081.34192.65***0.5030.1440.862+
Granny Smith1297.03205.141065.74208.29*0.2930.1610.425+
Red Chief1628168.011139.82156.13***0.520.3440.696+
Flavonoids (μg rutin/g)PeachRed Heaven912.79220.13722.65198.18 0.342−0.2630.947
Maria Blanka802.22454.13558.86300.57 0.523−0.0291.075
Big Top632.98354.18381.81239.17 0.7960.5121.08+
Queen Giant370.77162.98225.72139.92*0.8240.4421.206+
PearSanta Maria702.65153.99617.61148.7 0.193−0.0220.408
Nashi585.7113.89170.8131.73***1.7781.4122.144+
AppleGala1137.57193.55589.86118.62***0.9540.7771.131+
Granny Smith876198.7692.27203.82 0.3620.1140.61+
Red Chief1312.48201.47649.07122.39***1.0250.6411.409+
Anthocyanins (μg cyanidin/g)PeachRed Heaven889.76704.97371.77473.65 2.494−0.2835.271
Maria Blanka732.83393.18430.28215.42*0.853−0.0551.761
Big Top1138.38495.41160.4995.61***3.2071.7954.619+
Queen Giant2496.81922.18497.85339.33***2.8710.8494.893+
PearSanta Mariand nd 000
Nashind nd 000
AppleGala492.23246.21nd ***4.8444.0175.671+
Granny Smithnd nd 000
Red Chief1393.46443.42nd ***6.4776.0436.911+
Hydroxycinnamate (μg caffeic acid/g)PeachRed Heaven268.9685.96211.6870.8 0.342−0.0810.765
Maria Blanka237.1487.02208.1726.87 0.066−0.6380.77
Big Top342.2687.57277.7853.85 0.2840.0790.489+
Queen Giant310.4663.59309.6167.91 0.007−0.1710.185
PearSanta Maria327.0136.03286.315.57**0.1860.0350.337+
Nashi320.5420.76303.1317.66 0.08−0.0030.163
AppleGala412.9979.89391.4946.87 0.062−0.2750.399
Granny Smith321.4358.62304.6971.75 0.092−0.2250.409
Red Chief406.3975.54355.8637.39 0.1790.0060.352+
Flavonols (μg rutin/g)PeachRed Heaven122.9540.72116.4994.84 0.285−0.3360.906
Maria Blanka103.0533.5579.0413.57 0.33−0.0620.722
Big Top135.0536.8691.330.5**0.5840.4070.761+
Queen Giant111.1940.3377.730.43 0.5180.0870.949+
PearSanta Maria138.9542.7838.5112.02***1.8411.4042.278+
Nashi50.7615.853513.02*0.574−0.1041.252
AppleGala200.3255.11126.2647.04**0.6950.1651.225+
Granny Smith108.3451.89102.4459.7 0.345−0.6331.323
Red Chief154.1140.22123.1246.74 0.3930.0230.763+
Carotenoids (μg b-caroten/g)PeachRed Heaven9.452.028.62.17 0.149−0.3110.609
Maria Blanka0.390.470.090.13 2.1820.2164.148+
Big Top6.382.915.392.52 0.217−0.3780.812
Queen Giant0.030.010.030.02 −0.053−0.7110.605
PearSanta Maria0.310.220.190.15 0.457−2.0342.948
Nashi0.590.260.030.01***4.0942.6125.576+
AppleGala2.650.652.290.78 0.24−0.2750.755
Granny Smith1.150.170.470.13***1.3110.9441.678+
Red Chief2.170.41.590.47**0.487−0.0040.978
* P ≤ 0.05, ** P ≤ 0.01, *** P ≤ 0.001, (−) indicates a decrease in whole fruits, (+) indicates an increase in whole fruits, nd indicates not detected. Fold-change of unpeeled to peeled expressed as logarithm base two with 95% confidence interval of lower and upper bound in four peach cultivars (Red Heaven, Maria Blanca, Big Top, Queen Giant), two pear cultivars (Santa Maria, Nashi), and three apple cultivars (Gala, Granny Smith, Red Chief) after cold storage.
Table 2. Nutrient elements composition of unpeeled and peeled fruit at four peach cultivars (Red Heaven, Maria Blanka, Big Top, Queen Giant), two pear cultivars (Santa Maria, Nashi), and three apple cultivars (Gala, Granny Smith, Red Chief) after cold storage.
UnpeeledPeeledp-ValueFold-Change (Unpeeled/Peeled; Log2)
CultivarMeanSDMeanSDMeanLowerUpper
Phosphorus (P, ppm)PeachRed Heaven4352.5709.064070563.86 0.09−0.140.33
Maria Blanka3955565.043960965.47 0.02−0.30.34
Big Top23401111.672055484.66 0.12−0.811.05
Queen Giant3505484.92950776.11 0.27−0.110.65
PearSanta Maria1500112.851172.5217.12*0.370.110.64+
Nashi805137.1642.584.13 0.320.210.43+
AppleGala1745271.371877.5573.05 −0.04−0.670.58
Granny Smith157073.211310392.15 0.33−0.280.93
Red Chief1472.5246.441552.5364.8 −0.06−0.690.57
Potassium (K, ppm)PeachRed Heaven12650298.4312275418.33 0.04−0.020.11
Maria Blanka11200596.8711700726.72 −0.06−0.250.12
Big Top9700747.9110450855.13 −0.11−0.2−0.02
Queen Giant10625279.59475418.33**0.170.070.26+
PearSanta Maria6650525.895950504.66 0.160.060.26+
Nashi6225445.466575370.81 −0.08−0.14−0.02
AppleGala8175488.948925447.21*−0.13−0.21−0.05
Granny Smith157073.211310392.15 0.190.020.35+
Red Chief7100418.337550890.93 −0.08−0.290.12
Calcium (Ca, ppm)PeachRed Heaven350138.91402.5166.16 −0.18−0.710.35
Maria Blanka44578.3633518.54*0.39−0.010.79
Big Top427.5252.86335121.96 0.29−0.260.83
Queen Giant790148.53470185.53*0.810.051.57+
PearSanta Maria802.5128.51835348.48 0.03−0.60.65
Nashi257.564.717018.96***1.881.092.67+
AppleGala232.5104.4319589.09 1.40.532.27+
Granny Smith13020.927523.39**0.840.251.42+
Red Chief97.562.759532.6 −0.13−0.780.52
Magnesium (Mg, ppm)PeachRed Heaven53068.8149587.77 0.11−0.070.28
Maria Blanka51060.2146080.72 0.16−0.190.51
Big Top357.5158.7530066.73 0.19−0.510.9
Queen Giant597.590.74387.579.55**0.640.221.06+
PearSanta Maria452.573.1390121 0.25−0.10.6
Nashi21056.18132.525.92*0.640.350.94+
AppleGala32034.91202.571.48*0.750.051.46+
Granny Smith2155.5914520.92***0.580.320.84+
Red Chief20530.115031.87*0.470.220.72+
Manganese (Mn, ppm)PeachRed Heaven3.70.5130.29*0.30.170.42+
Maria Blanka4.60.954.321.02 0.1−0.190.4
Big Top2.460.523.552.51 −0.34−1.010.34
Queen Giant3.020.262.470.29*0.290.210.38+
PearSanta Maria3.020.232.310.23**0.390.280.5+
Nashi2.170.31.740.33 0.33−0.210.87
AppleGala2.910.361.980.32**0.570.380.75+
Granny Smith1.670.161.580.33 0.1−0.280.48
Red Chief2.240.261.760.56 0.38−0.130.89
Zinc (Zn, ppm)PeachRed Heaven28.884.3315.43.58**0.920.631.21+
Maria Blanka21.073.6923.243.43 −0.15−0.660.37
Big Top14.373.3914.353.05 0,00−0.20.2
Queen Giant15.794.7210.393.13 0.6−0.111.32
PearSanta Maria11.023.4212.044.75 −0.09−1.070.9
Nashi7.132.987.792.61 −0.18−1.431.07
AppleGala12.762.2512.194.24 0.11−0.710.94
Granny Smith13.636.1413.319.53 0.15−0.320.62
Red Chief15.725.3412.385.15 0.37−0.31.03
Iron (Fe, ppm)PeachRed Heaven10.925.832.951.41*1.76−0.574.09
Maria Blanka3.083.143.654.97 0.1−0.881.08
Big Top0.450.20.310.31 0.93−1.413.26
Queen Giant2.31.241.330.93 0.96−0.092.02
PearSanta Maria1.390.280.630.31**1.260.42.12+
Nashi0.710.240.620.64 0.79−1.292.86
AppleGala1.550.80.80.14 0.850.191.51
Granny Smith0.790.090.860.12 −0.13−0.350.09
Red Chief0.90.130.90.24 0.02−0.680.73
Copper (Cu, ppm)PeachRed Heaven8.622.457.512.44 0.21−0.030.44
Maria Blanka10.412.3410.384.26 0.06−0.250.36
Big Top3.550.824.431.81 −0.26−0.760.25
Queen Giant5.132.513.351.14 0.550.021.09+
PearSanta Maria1.50.280.840.44*0.98−0.142.11
Nashi1.321.525.270.69**−3.08−5.99−0.18
AppleGala4.060.56.151.77*−0.55−1.130.04
Granny Smith6.251.511.73.69*−0.88−1.01−0.76
Red Chief2.460.152.40.25 0.04−0.150.22
* P ≤ 0.05, ** P ≤ 0.01, *** P ≤ 0.001, (−) indicates a decrease in whole fruits, (+) indicates an increase in whole fruits, nd indicates not detected. Fold-change of unpeeled to peeled expressed as logarithm base two with 95% confidence interval of lower and upper bound.
Publisher’s Note: MDPI stays neutral with regard to jurisdictional claims in published maps and institutional affiliations.

