Article

Optimizing Fruit-Thinning Strategies in Peach (Prunus persica) Production

1
Department of Horticulture, University of Georgia, Athens, GA 30602, USA
2
Department of Horticulture, University of Georgia, Griffin, GA 30223, USA
*
Author to whom correspondence should be addressed.
Horticulturae 2020, 6(3), 41; https://doi.org/10.3390/horticulturae6030041
Submission received: 28 May 2020 / Revised: 29 June 2020 / Accepted: 18 July 2020 / Published: 22 July 2020
(This article belongs to the Section Fruit Production Systems)

Abstract

:
Fruit size is a highly valued commercial trait in peach. Competition among fruit and among other sinks on a tree reduces potential growth rate of the fruit. Hence, crop-load management strategies such as thinning (removal of flowers or fruit) are often practiced by growers to optimize fruit size. Thinning can be performed at bloom or during early fruit development and at different intensities to optimize fruit growth responses. Responses to thinning may be cultivar and location specific. The objective of the current study was to fine-tune thinning strategies in the southeastern United States, a major peach producing region. Timing and intensity of thinning were evaluated across multiple cultivars over three years. Thinning at bloom or at 21 d after full bloom (DAFB) improved fruit size in comparison to unthinned trees in ‘Cary Mac’ and ‘July Prince’, respectively, in one year. Bloom-thinning reduced fruit yield (kg per tree) in the above cultivars in one year, suggesting that flower thinning alone may not be a viable option in this region. Intensity of thinning, evaluated as spacings of 15 cm and 20 cm between fruit, did not differentially affect fruit weight or yield. However, fruit diameter decreased quadratically with increasing fruit number per tree in ‘Cary Mac’, ‘July Prince’ and ‘Summer Flame’. Similarly, fruit weight decreased quadratically in response to increase in fruit number per tree in ‘Cary Mac’ and ‘July Prince’. Further, yield-per-tree decreased with increasing fruit size in ‘Cary Mac’ and ‘July Prince’. Importantly, these relationships were cultivar specific. Together, the data suggest that achieving a target fruit number per tree is an effective strategy for crop-load management to optimize fruit size in southeastern peach production. The target fruit number per tree may potentially be achieved through a combination of flower and fruit-thinning during early fruit development. Such an approach may provide flexibility in crop-load management in relation to adverse weather events.

1. Introduction

Fruit size is a major commercial trait in many tree fruits such as the peach. The peach fruit displays double sigmoidal growth, measured as change in fruit diameter [1,2,3,4]. The initial period of rapid growth following bloom, Stage I (S1), is mediated largely by cell division [4,5]. This is followed by Stage II (S2), where fruit diameter does not increase substantially, but fruit development progresses and is associated with lignification of the endocarp [4,5]. Stage III (S3) is a final period of rapid growth and is characterized by extensive cell expansion [5,6]. This is followed by Stage IV (S4), a developmental stage involving further fruit maturation and senescence [4,6]. Final fruit size is largely determined by the number of cells and their size [7,8]. Variation in fruit size across cultivars is associated largely with differences in cell number [9]. Majority of cell division during fruit growth occurs during the S1 stage of early fruit development [4,5].
Following bud break in early spring, growth of the flowers and subsequently the fruit is largely supported by stored reserves of carbon (C) and nitrogen (N) [3,10,11]. Many current peach cultivars were developed to set more fruit than they can support to a commercially acceptable size [2,12]. High fruit number per tree in conjunction with limited resources amplifies competition among young fruit, limits their growth potential and reduces fruit size [4,13,14]. Thinning, removal of flowers or fruit from the tree, reduces competition among flowers/fruit and allows for their optimum growth [12,15]. The earlier this competition is reduced by thinning, the greater the ability of fruit to express their potential growth rate [2,3,15,16,17]. Hence, thinning is a critical crop-load management strategy routinely applied by growers to optimize fruit size [18,19].
Crop-load management in peach can involve dormant pruning and flower bud removal/inhibition strategies to minimize flower number per tree [19]. Flower removal or thinning at bloom greatly minimizes the effects of competition among fruit during a key source-limitation period, thereby maximizing growth potential of the fruit [2,20]. However, such early crop-load management strategies alone can potentially result in excessive reduction of fruit number per tree as some retained flowers may not set fruit, and as natural abscission may further reduce the fruit load [21,22,23]. Further, adverse weather during this period may limit fruit set. In such cases, potential loss in total yield could be more significant than the potential increase in fruit size [12]. Reduction in flower/fruit number per tree also decreases their collective strength as a sink with thinned trees showing more vegetative growth than unthinned trees [14,20]. Fruit-thinning during early development (S1) can minimize these negative aspects of bloom-thinning while allowing for increase in fruit size [18,24]. While fruit growth increases in response to fruit-thinning, this may not completely compensate for the reduction in potential growth rate during the early period of source-limited growth [20]. However, fruit removal before pit hardening (during S1) is a commonly used strategy in peach crop-load management to avoid the issues indicated above with earlier interventions [19]. Thinning after natural abscission is less labor intensive as only excess fruit need removal [16]. However, thinning at late stages of development may not provide significant advantages as resource limitations during early stages severely impact growth [20,25].
Intensity of thinning is another potentially significant factor influencing fruit size. Thinning severity is reflected on the shoot level by spacing between individual fruit, and on the tree level by total fruit number per tree (normalized to tree size). Marini [26] indicated that spacing in the range of 10–20 cm between fruit may not differentially influence fruit size responses and that this response is rather dependent on total fruit number per tree. However, other studies indicated that spacing between fruit on the shoot was a significant factor influencing fruit size [12]. Further, it may be likely that such responses to spacing may be cultivar dependent [12]. Specific recommendations for thinning intensity based on spacing on shoots or as fruit number per tree [per trunk cross sectional area (TCSA)] are not universally available.
Response to thinning treatments may be influenced by genetics of the cultivar [12,16]. Further, climatic conditions unique to a given region may influence thinning responses [27]. Hence, thinning strategies need to be cultivar- and location-specific. The optimum time and intensity of thinning for peach production in the southeastern United States, particularly in Georgia, a leading peach producing state, have not been determined previously. The main objective of the current study was to determine the optimum period of flower/fruit-thinning of peaches in Georgia. Three different times and two intensities of thinning were evaluated across multiple peach cultivars over three years. The effects of these treatments on fruit size, yield and fruit quality characteristics were evaluated.

2. Materials and Methods

2.1. Plant Material and Cultural Practices

Commercial mature peach orchards were used in all studies. In 2017 (Experiment I), trees of ‘Spring Prince’ and ‘June Prince’ (both planted in 2008) at Fort Valley State Orchard and ‘Cary Mac’ (planted in 2010) at Lane’s Southern Orchards, both in Fort Valley, GA, were used. The above cultivars are early season cultivars. In 2018 (Experiment II) and 2019 (Experiment III), ‘Cary Mac’ (planted in 2010), ‘July Prince’ (planted in 2011) and ‘Summer Flame’ (planted in 2010) at Lane’s Southern Orchards, Fort Valley, GA, were used. ‘July Prince’ and ‘Summer Flame’ are mid-season cultivars. Trees were spaced at 6.1 m × 4.6 m (‘Cary Mac’ and ‘Summer Flame’); 6.1 m × 3.7 m (‘July Prince’); and 6.1 m × 5.5 m (‘Spring Prince’ and ‘June Prince’). These orchards were maintained by growers following recommendations in the southeastern peach, nectarine and plum pest management and culture guide [28].

2.2. Thinning Treatments

Thinning treatments were adapted from those described by Njoroge and Reighard [12]. Two spacings (15 cm and 20 cm) were applied at each of three thinning times defined as days after full bloom (DAFB; bloom dates are presented in Table S1). Across all three years, thinning was scheduled to be performed at bloom, early S1 (≤21 DAFB) and late S1 (≥26 DAFB). Within each variety, early S1 and late S1 thinning times were separated by at least 9 d. However, in 2017, the fruit-thinning times were delayed to ~45 DAFB and ~60 DAFB (early and late, respectively) due to inclement weather. Lack of chill hour accumulation and a late freeze (16 March 2017) resulted in ~80% losses in Georgia peach production (Chavez, personal communication). Hence, fruit-thinning was delayed that year until damage from the weather events could be assessed. In 2018 and 2019, thinning proceeded as scheduled, except that in 2019, thinning at bloom could not be performed in ‘July Prince’ due to inclement weather. In all three years, a control (no thinning) treatment was included for each cultivar. The thinning treatments are summarized in Table 1. Each tree was treated as an experimental unit. Seven trees per row were used for each replication in a randomized complete block design (RCBD) with three replications (three rows). Within each row, the row-end trees were not used. Trees of uniform size were selected and randomly assigned to one of thinning treatments.

2.3. Yield and Fruit Quality Measurements

All fruit on the tree were manually harvested at commercial maturity (harvest dates are presented in Table S2), which is defined as firm fruit with a yellow or cream ground color in Georgia [29]. At each harvest date, mature fruit were removed from each tree and placed into separate labeled boxes. These boxes were then weighed on portable scales and the total yield-per-tree recorded. When necessary, fruit were also separated into commercial (>~63.5 mm in diameter) and undersized (<~63.5 mm in diameter) categories. In such cases, measurements on these classes were recorded separately. Around 10–12 fruit per tree were randomly selected and placed into coolers with ice to remove field heat and transported to Athens, GA, for additional analyses. Fruit were stored in a 4 °C walk-in cooler until further analysis.
Fruit weight of ten individual fruit were obtained using a Quintix Precision Balance (Sartorius, Gottingen, Germany). Two fruit diameter measurements were also obtained for each fruit using Digimatic digital calipers (Mitutoyo, Kanagawa, Japan): a cheek-to-cheek diameter (diameter 1) and a suture-to-opposite-side diameter (diameter 2). These measurements were taken at the widest part of the fruit. Total fruit number was estimated by dividing the total yield-per-tree by the average fruit weight of the given tree.
Chill hour accumulation was determined using the chill hour calculator available on the UGA weather network (http://www.georgiaweather.net) using the Fort Valley weather station (Fort Valley State University, 31,030) [30]. Growing degree days (GDD) for the first 30 DAFB (GDD30) were also determined. Daily average temperature data for the first 30 DAFB were retrieved from the UGA weather network’s historical data archive (http://www.georgiaweather.net) [31]. For chill hours and GDD30, a base temperature and upper threshold of 7 °C and 35 °C, respectively, were used [32,33].
For soluble solids content (SSC) and titratable acidity (TA) measurements, three of the ten fruit were chosen randomly for juicing. Fruit were peeled, and the flesh was pureed using a blender. In 2017, 40 ± 1 g of mesocarp tissue was pureed using a Magic Bullet blender. In 2018 and 2019, 80 ± 1 g of the mesocarp tissue was pureed using a Ninja blender (BL456). The pureed flesh was strained through a double layer of cheese cloth to extract juice. The juice was stored at −20 °C until SSC and TA analyses could be performed. Juice samples were thawed at room temperature for two hours prior to testing. For TA analysis, 5 mL of juice was diluted with 45 mL of H2O. Fruit TA was measured as percent malic acid equivalents and determined using a mini titrator (Hanna instruments, Smithfield, RI, USA) in 2017 and a Titrino Plus autotitrator (Metrohm, Herisau, Switzerland) in 2018 and 2019. The TA values were consistent and comparable across the two titrators. With both instruments, samples were titrated to a pH of ~8.1 using 0.1-N NaOH. The SSC was determined using a Palette refractometer (Atago, Tokyo, Japan). The refractometer was cleaned with H2O after each sample.

2.4. Statistical Analyses

All statistical analyses were performed in JMP (Version 14.1.0. SAS Institute, Inc., Cary, NC, USA, 1989–2019). Data from different years and from different cultivars were analyzed separately. When applicable, commercial and noncommercial (undersized) fruit measurements were also analyzed separately. Differences between thinning treatments within a cultivar were analyzed using a linear mixed model (blocks treated as a random effect) followed by mean separation using Tukey’s HSD (honest significant difference). Comparison of the means among the three thinning timings, and between the two spacings of thinning was performed using contrasts. Regression analyses were performed in SigmaPlot (version 11; Systat Software, Inc., San Jose, CA, USA). Data from 2018 and 2019 were used together within each cultivar for regression analyses. Data from 2017 were excluded from regression analyses owing to compromised fruit numbers per tree and higher presence of undersize fruit because of reduced chill accumulation and late spring freeze. As indicated above, ‘July Prince’ bloom-thinning treatments could not be performed in 2019. Fruit number per tree, fruit weight, diameter and yield data from these trees (not thinned) were also included in the regression analyses. Principal components analyses (PCA) were performed separately for 2018 and 2019 data in JMP.

3. Results

3.1. Experiment I (2017)

In 2017, fruit were divided into commercial and undersized fruit size categories at harvest, as described above. No significant differences in fruit weight and yield were observed across treatments in ‘Cary Mac’ and ‘Spring Prince’ (Figure S1). Yield in ‘June Prince’ was significantly different across treatments (p = 0.049), but means were not separable by Tukey’s HSD. Contrasts analysis indicated that yield in the 63 DAFB thinning treatments was higher than that in the 0 and 49 DAFB thinning treatments (p = 0.034 and 0.026, respectively). In ‘Cary Mac’, the 43 DAFB-20-cm-thinning treatment displayed lower yield of undersized fruit than that in the control (data not shown). In addition, yield of undersized fruit in the 43 DAFB thinning treatments was lower than that in the 62 DAFB thinning treatments (p = 0.035; data not shown). Fruit number per tree did not differ significantly across treatments (Table 2). Data for diameter 1 (cheek-to-cheek) only is presented as the two diameter measurements showed the same trends across treatments (Table 2). Across all cultivars, fruit diameter of commercial size fruit did not differ significantly across treatments. Soluble solids content and TA did not differ across treatments for any of the cultivars (commercial size fruit). In the undersized fruit of ‘Cary Mac’, the 15 cm spacing treatment resulted in lower TA than that in the 20 cm treatment (data not shown).

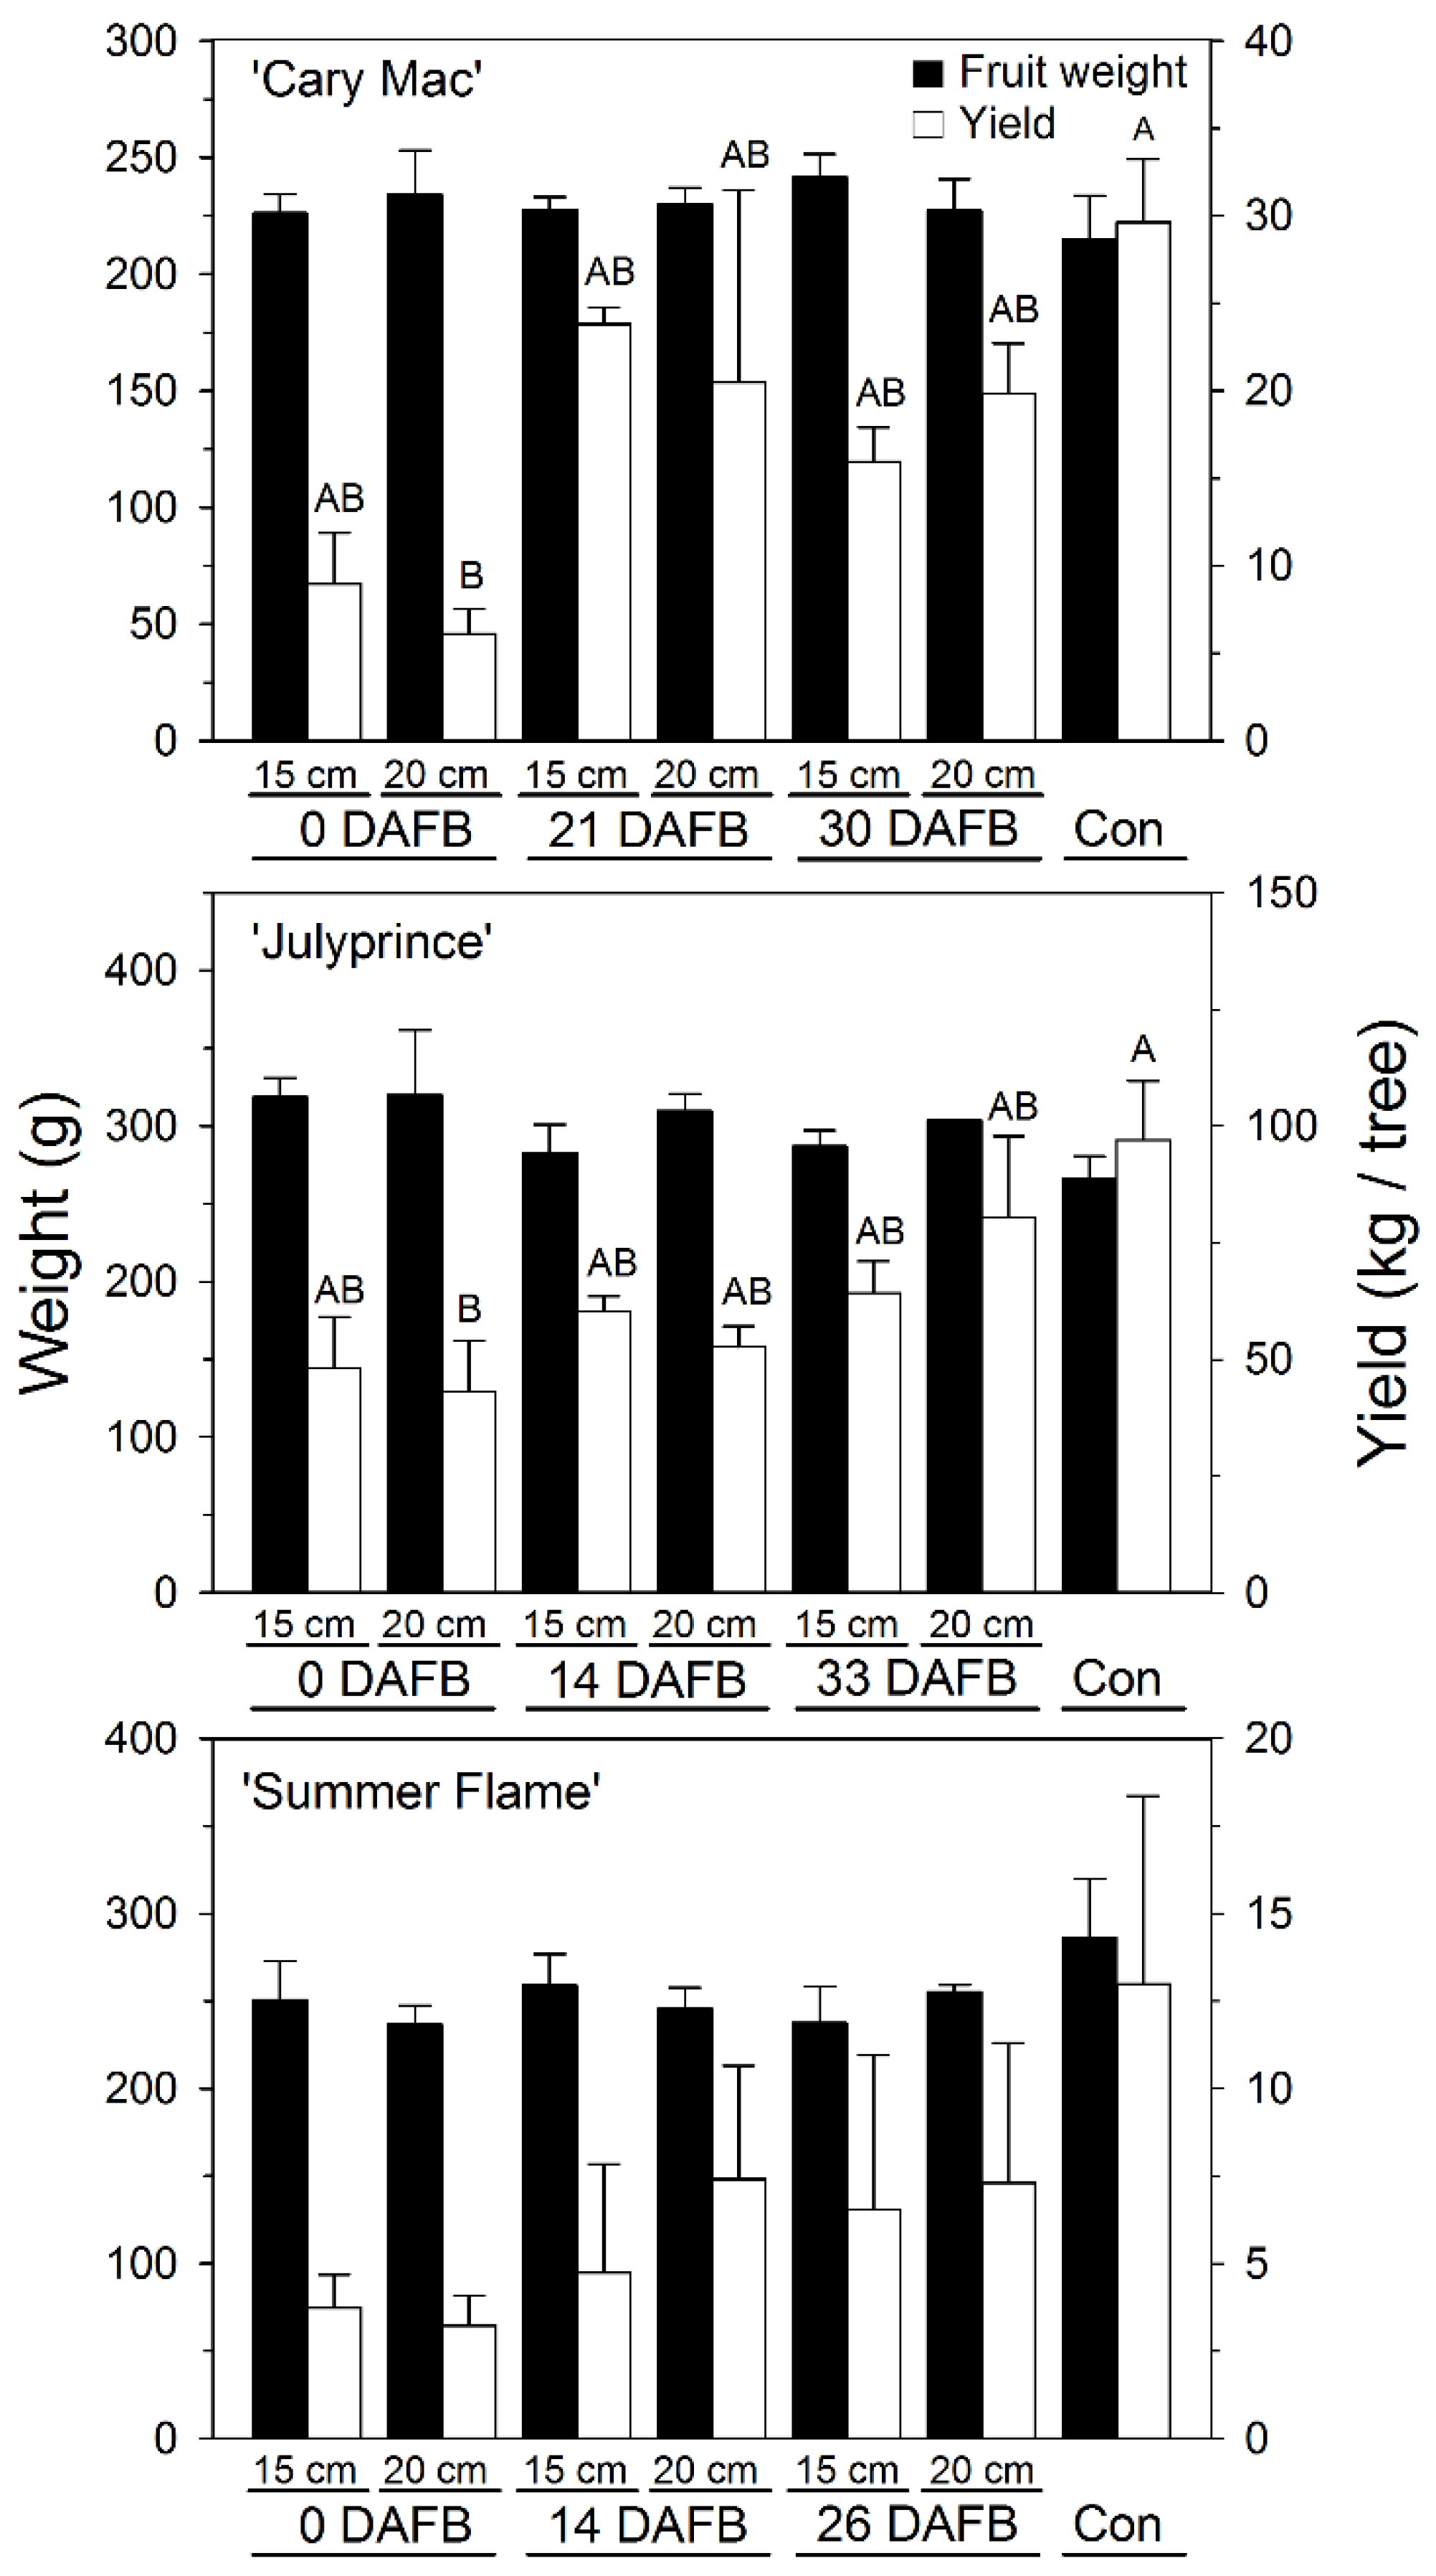
3.2. Experiment II (2018)

Fruit weight and diameter were not significantly different across treatments for any of the three cultivars evaluated (Figure 1; Table 3). In ‘Cary Mac’ and ‘July Prince’, control trees displayed significantly higher yield than that in the 0 DAFB-20 cm spacing treatment by 4.9-fold and 2.2-fold, respectively. Contrasts analysis indicated that yield in the 0 DAFB thinning treatments was lower than that in the 21 and 30 DAFB thinning treatments in ‘Cary Mac’ (p = 0.009 and 0.048, respectively) and the 33 DAFB fruit-thinning treatments in ‘July Prince’ (p = 0.028). In ‘Cary Mac’, fruit number per tree was 5.6-fold lower in the 0 DAFB-20 cm spacing treatment compared to the control (Table 3). It was also lower in the 0 DAFB thinning treatments in comparison to that in the 21 DAFB treatments (p = 0.01). In ‘July Prince’ fruit number per tree in control trees was around 2.5-fold higher than that in the two 0 DAFB thinning treatments (Table 3). Contrasts analysis also indicated that fruit number per tree in the 0 DAFB thinning treatments was lower than that in the 33 DAFB thinning treatments (p = 0.042). Fruit SSC was lower in the 0 DAFB-15 cm spacing treatment in comparison to the 30 DAFB-20 cm spacing treatment in ‘Cary Mac’. It was not different across treatments in the other two cultivars. Fruit TA was not significantly different across the treatments in the three cultivars. Contrasts analysis indicated that ‘Cary Mac’ fruit SSC and TA were higher in the 30 DAFB treatments in comparison to the other two timings of thinning.

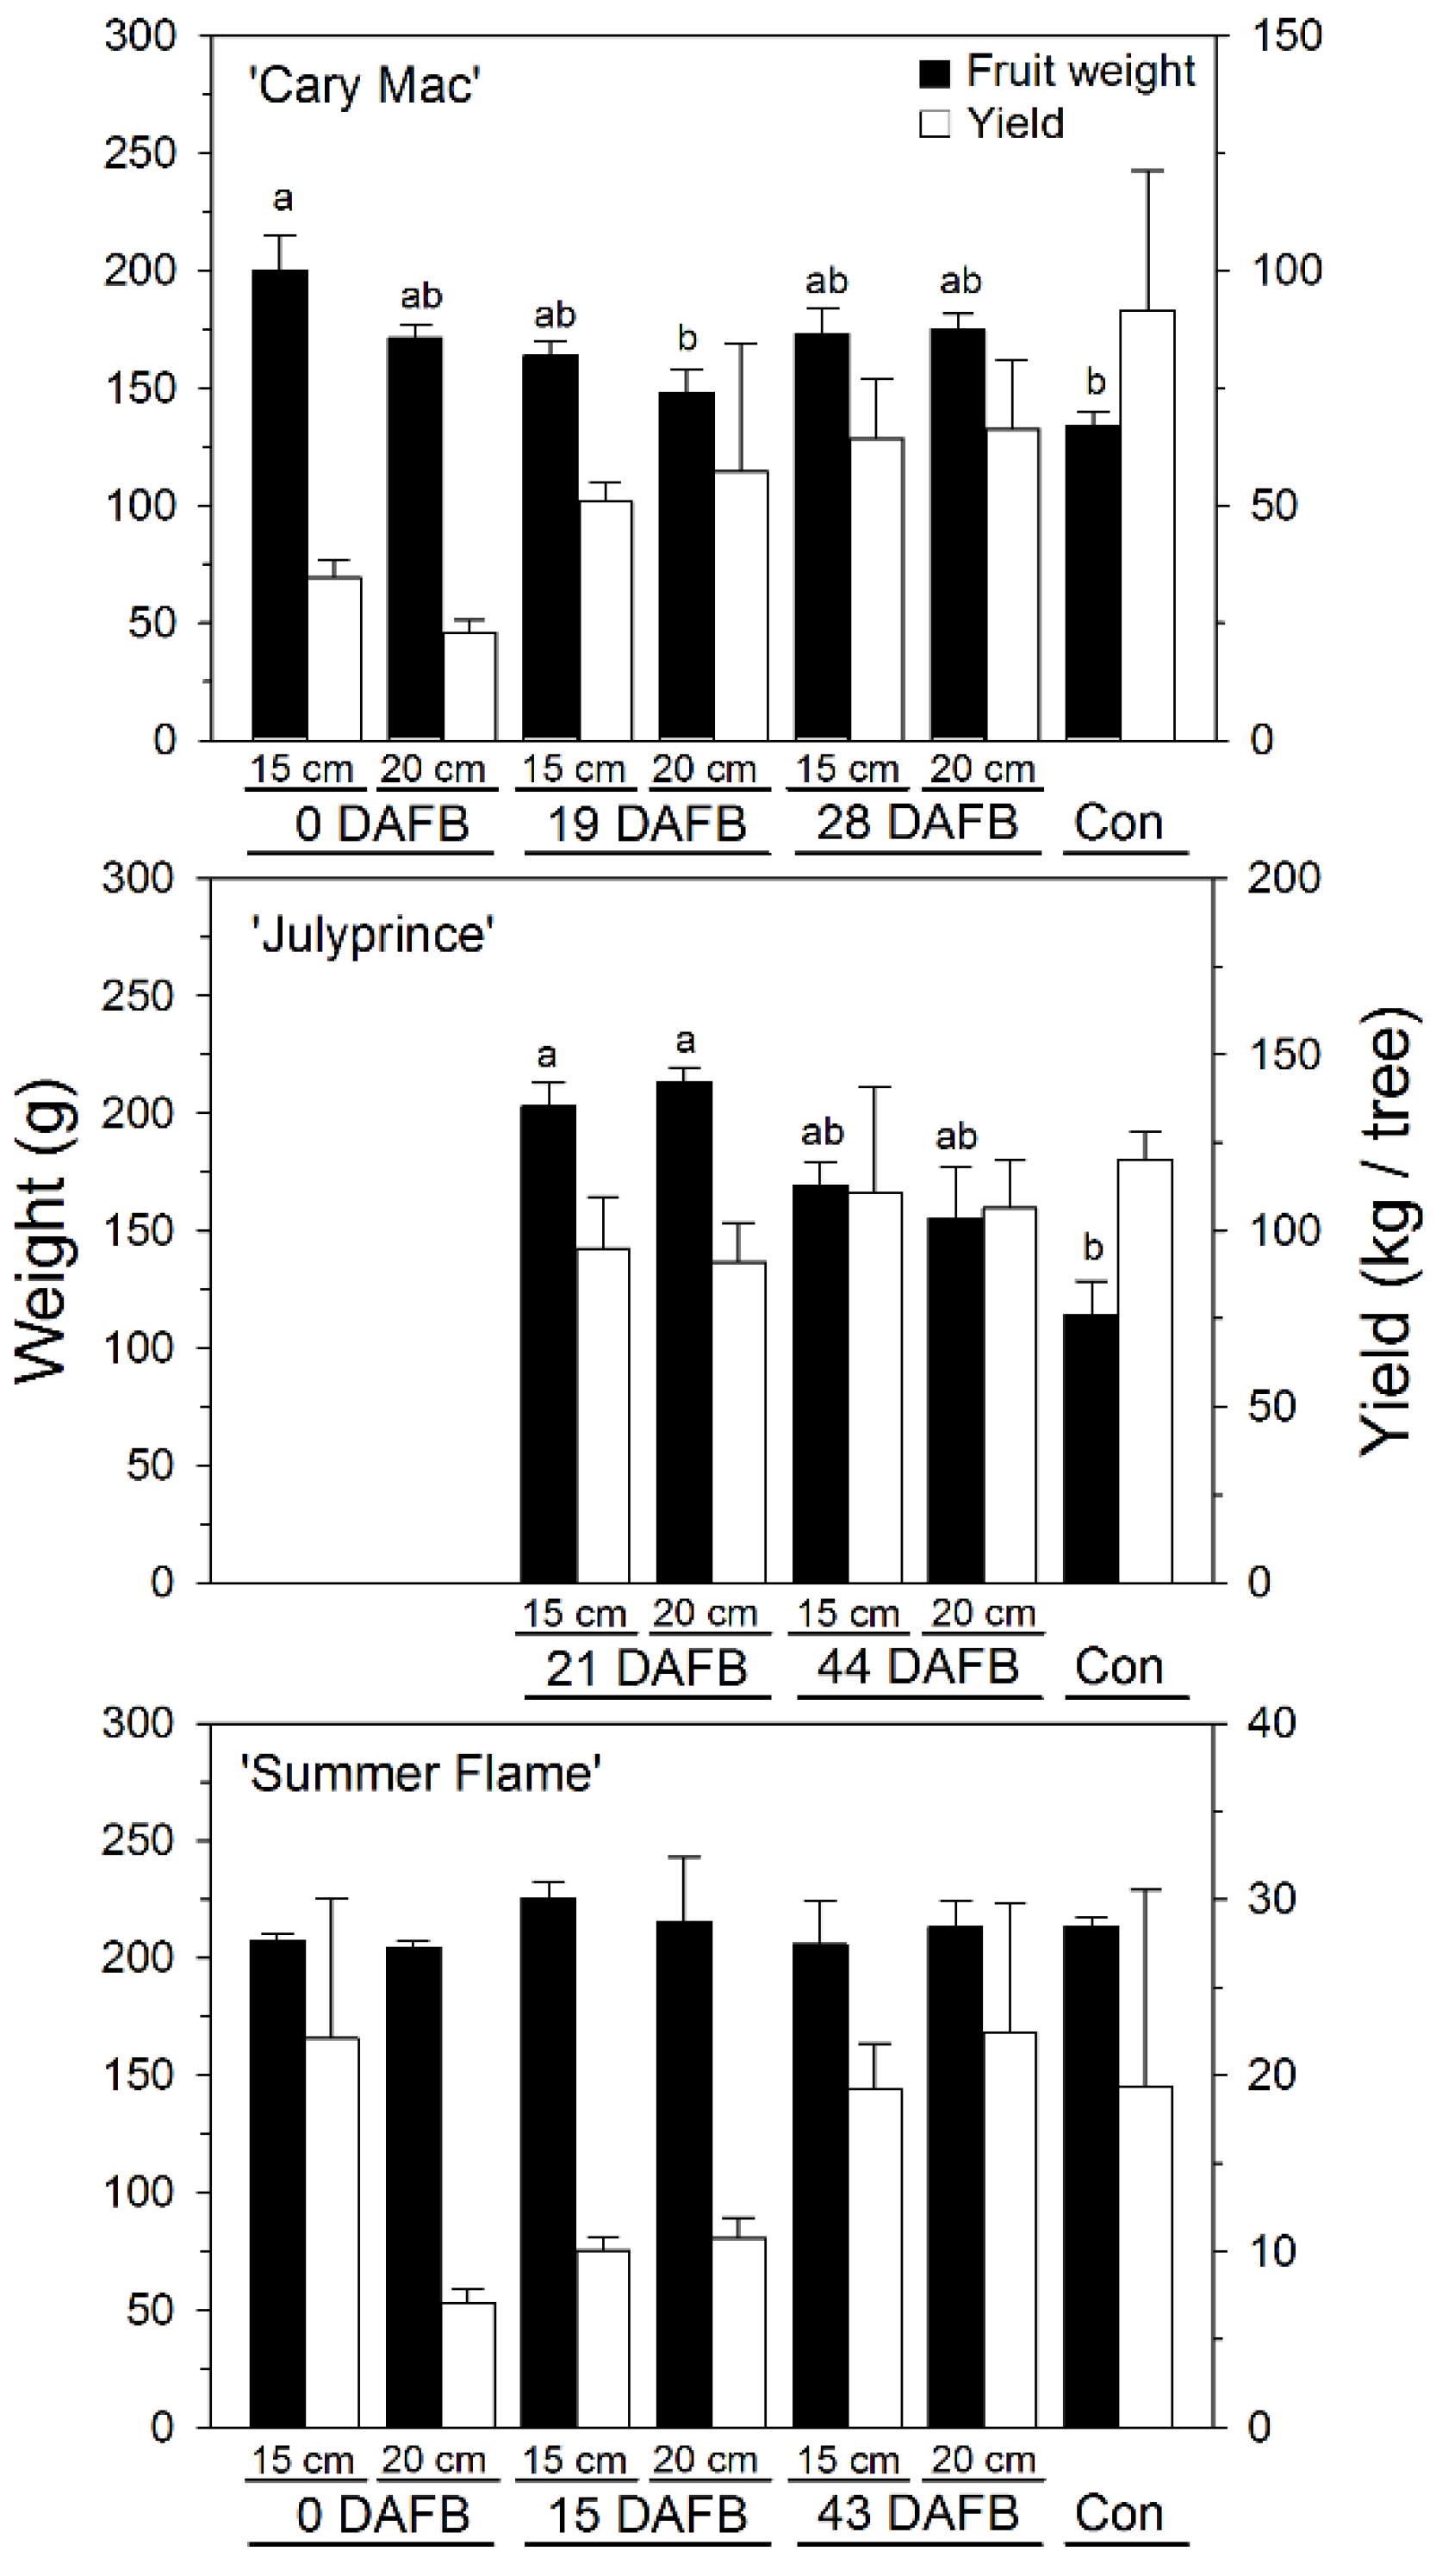
3.3. Experiment III (2019)

The 0 DAFB-15 cm spacing thinning treatment in ‘Cary Mac’ resulted in 1.35- to 1.5-fold higher fruit weight than that in the 19 DAFB-20 cm spacing and control treatments, respectively (Figure 2). This pattern was also reflected in fruit diameter data (Table 4). Fruit diameter in the 0 DAFB-15 cm spacing, treatment was 11% and 15% greater than that in the 19 DAFB-20 cm spacing and control treatments, respectively. Contrasts analysis indicated that 0 DAFB thinning treatments displayed greater fruit weight and diameter than that in the 19 DAFB thinning treatments (p = 0.011 and 0.026, respectively). Thinning at bloom could not be performed for ‘July Prince’. However, fruit-thinning at 21 DAFB resulted in higher fruit weight (1.78- to 1.87-fold) and diameter (25%–27%) than that in the control in this cultivar (Figure 2; Table 4). Fruit weight and diameter were greater in the 21 DAFB thinning treatments than those in the 44 DAFB treatments (p = 0.008 and 0.012, respectively). Fruit weight and diameter did not differ across the thinning treatments in ‘Summer Flame’ (Figure 2; Table 4). In all cultivars, fruit yield and fruit number per tree did not differ across treatments. In ‘Cary Mac’, fruit SSC was higher in the 0 DAFB than in the 28 DAFB thinning treatments and fruit TA in the 0 DAFB treatments was lower than that in the 19 DAFB thinning treatments (p = 0.047 and p = 0.031, respectively). In ‘July Prince’ fruit-thinning at 21 DAFB with 15 cm spacing resulted in higher TA than later thinning and control treatments (Table 4). In addition, fruit in the 21 DAFB thinning treatments displayed higher TA than those in the 44 DAFB treatments (p = 0.024). In ‘Summer Flame’, SSC and TA did not differ across treatments.

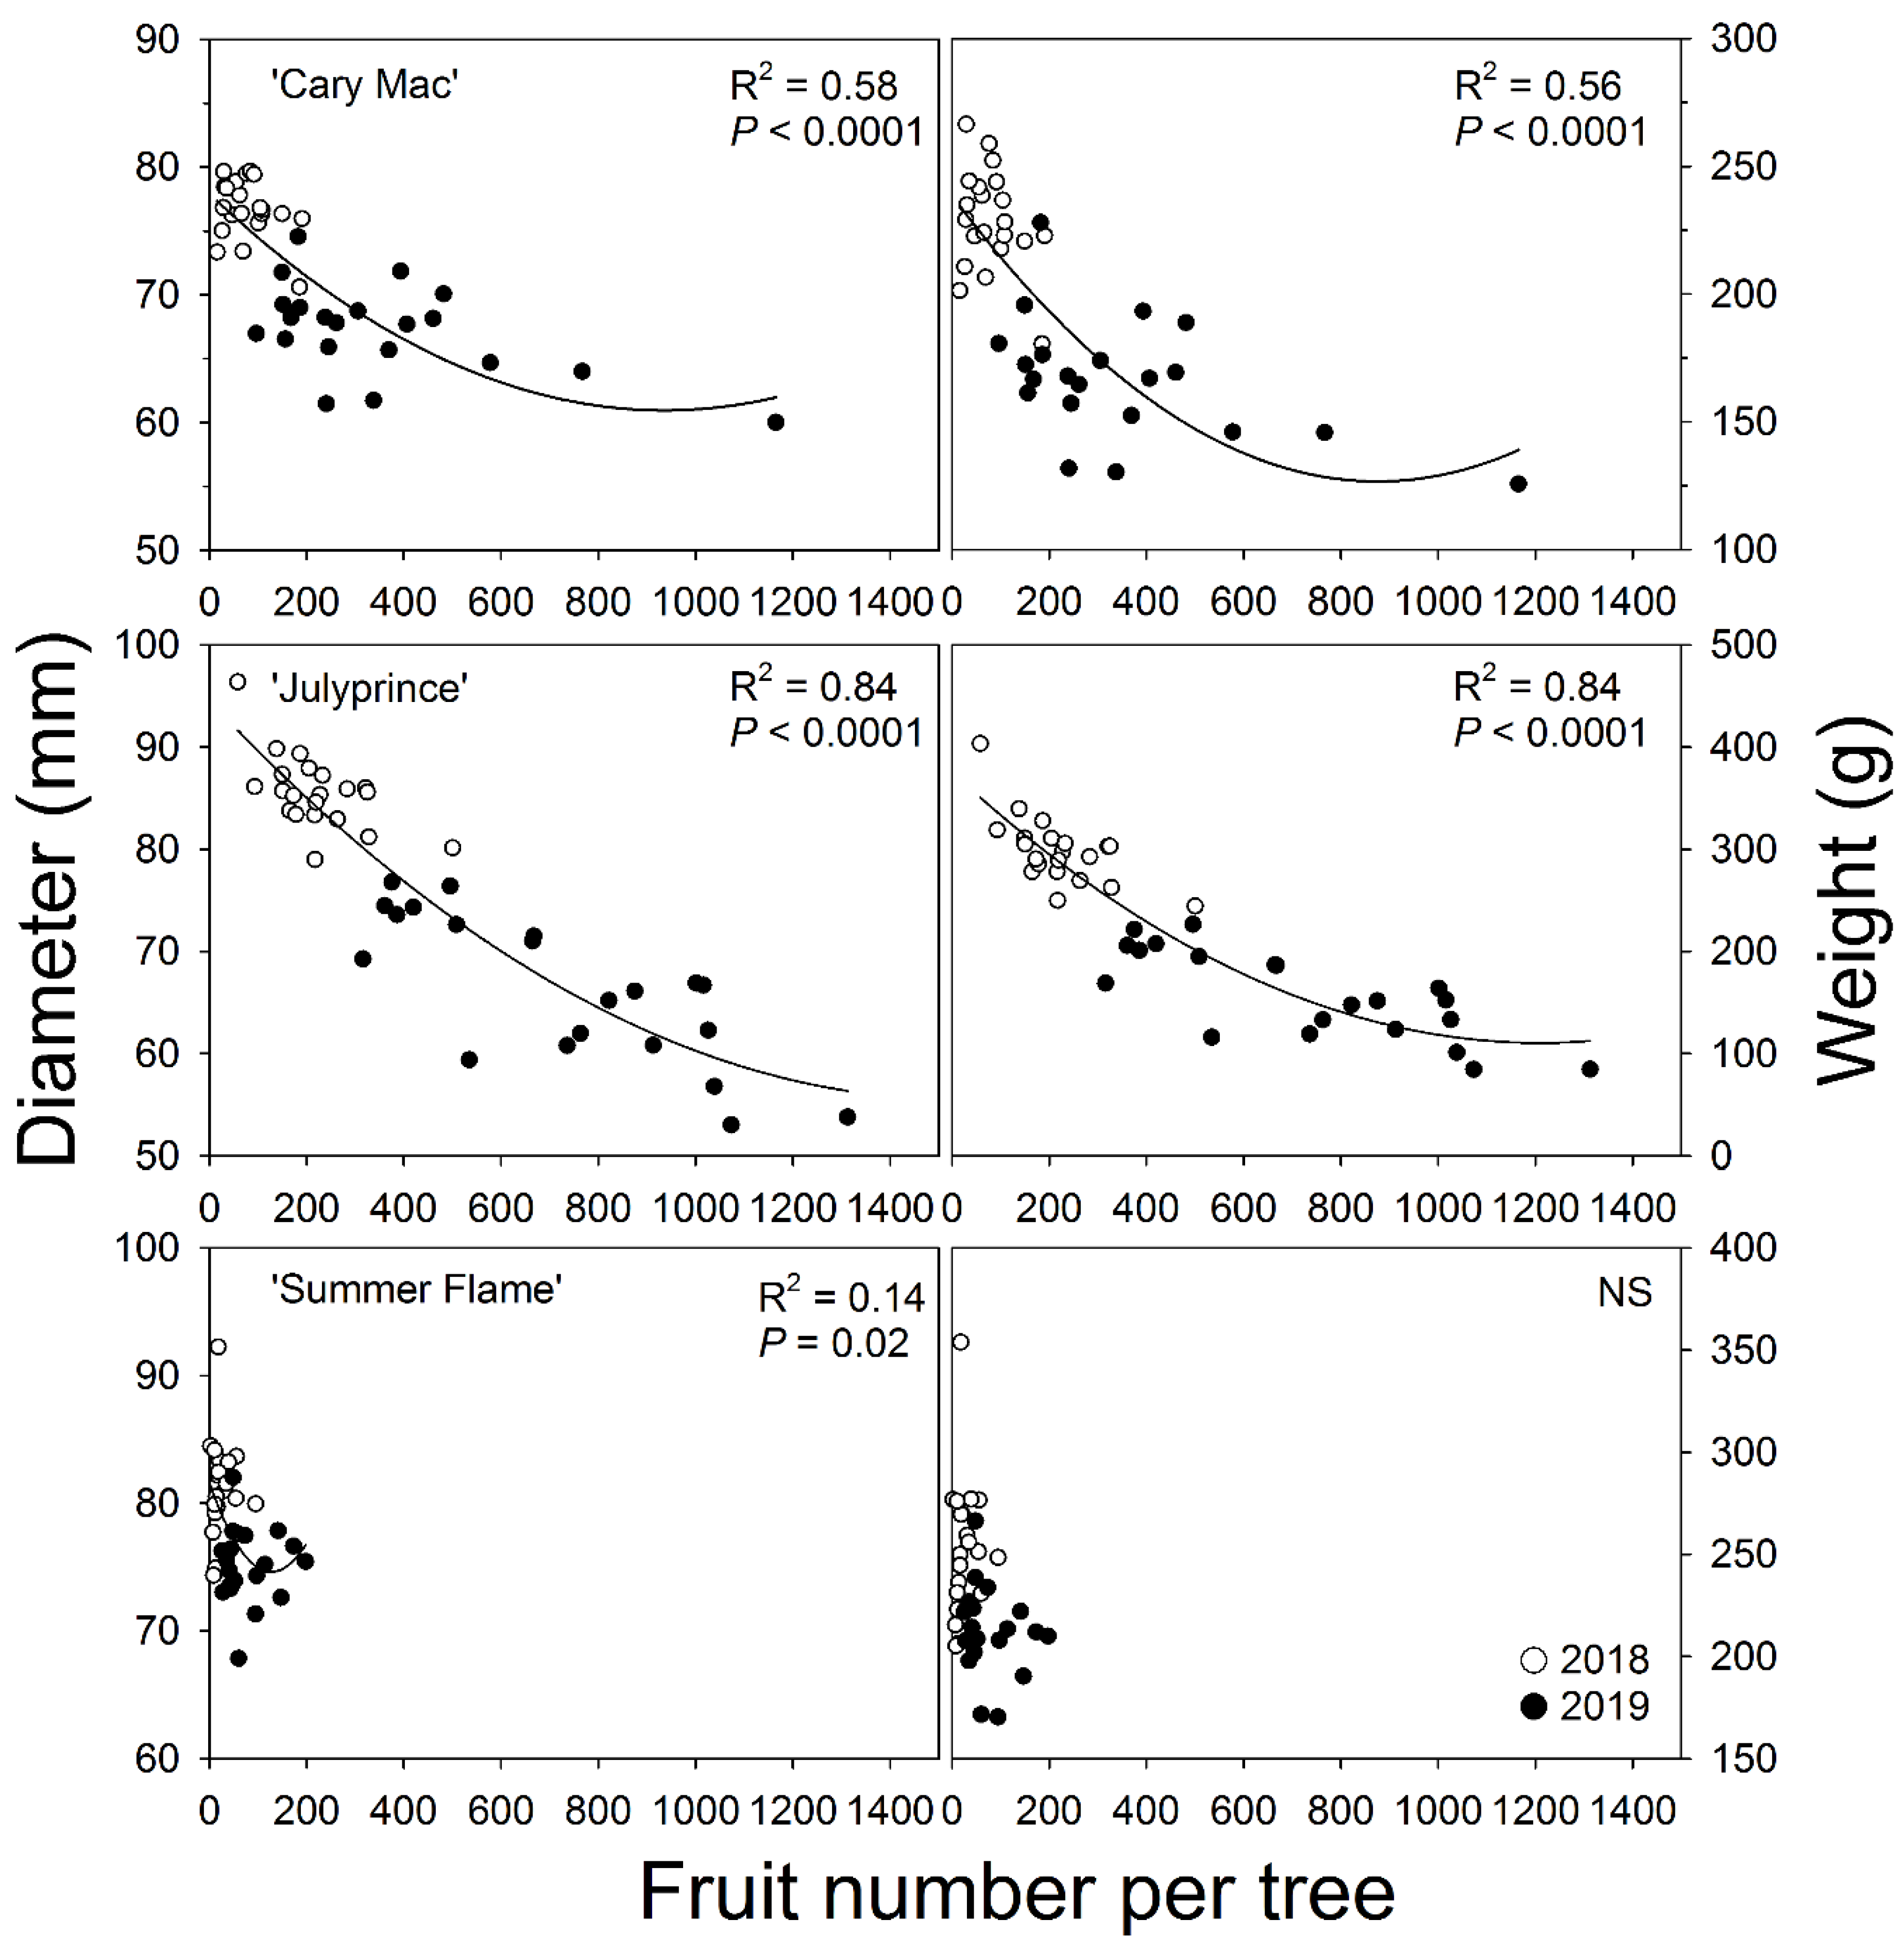
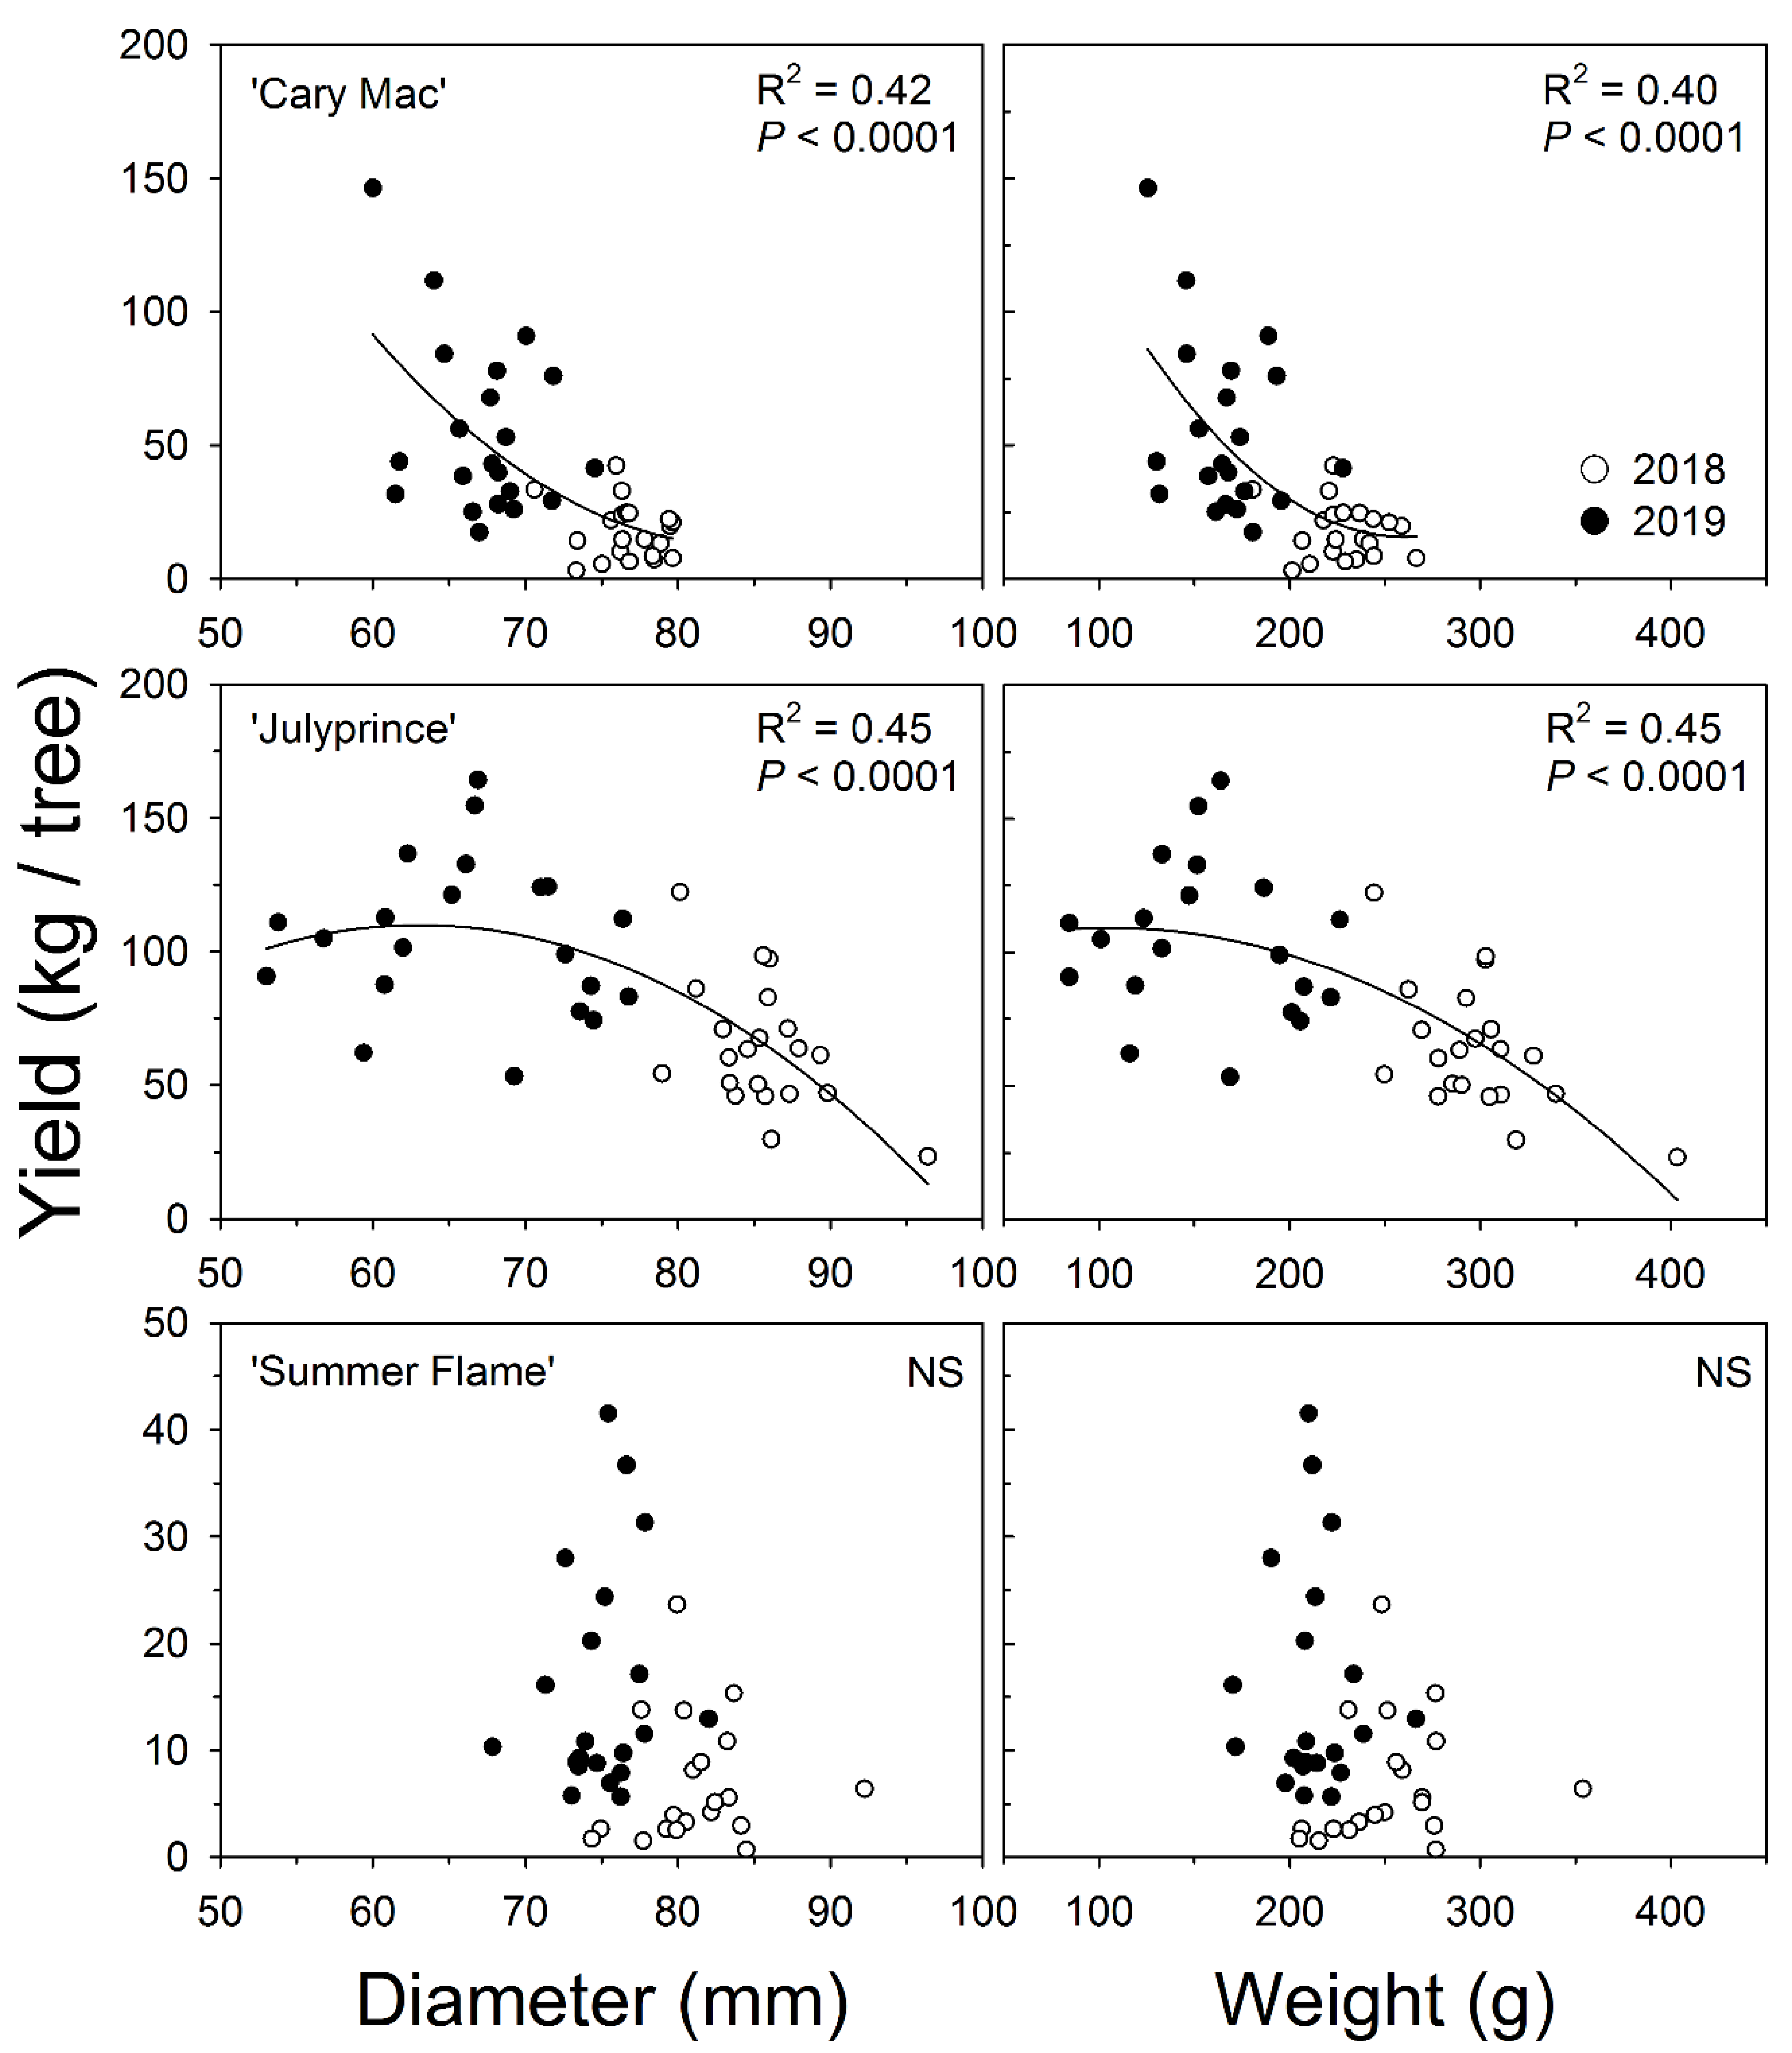
3.4. Relationships among Fruit Number per Tree, Yield and Fruit Size

Data from 2018 and 2019 were analyzed together within each cultivar to determine relationships among fruit number, fruit size and yield parameters. Fruit diameter and fruit weight were strongly and positively related within each cultivar (data not shown). The three cultivars displayed negative relationships between fruit number per tree and fruit diameter and fruit weight (Figure 3; Figure S2). Variation in fruit number per tree contributed to around 58%, 84% and 14% of the variation in fruit diameter in ‘Cary Mac’, ‘July Prince’ and ‘Summer Flame’, respectively (Figure 3). Similarly, it contributed to 56% and 84% of the variation in fruit weight in ‘Cary Mac’ and ‘July Prince’, respectively. Variation in fruit size contributed to around 40% and 45% of the variation in fruit yield in ‘Cary Mac’ and ‘July Prince’, respectively (Figure 4). It did not significantly contribute to variation in fruit yield in ‘Summer Flame’ (Figure 4). Regression equations are presented in Table S3.

4. Discussion

‘Cary Mac’, ‘June Prince’, ‘Spring Prince’, ‘July Prince’ and ‘Summer Flame’ require chilling accumulation of around 750, 650, 650, 850 and 650 units, respectively [34,35]. Hence, low chilling unit accumulation (438 units) in 2017 likely resulted in reduced fruit set in that year [3]. Further, a freeze occurred on 16 March 2017. Early season cultivars (‘Cary Mac’, ‘June Prince’ and ‘Spring Prince’) are more susceptible to spring freeze damage than mid-(‘July Prince’ and ‘Summer Flame’) or late-season cultivars as these freeze events often coincide with bloom [36]. Georgia peach growers reported around 80% losses in fruit production that year due to the above events. This was evident in the low total yield for the control treatment in different cultivars in 2017 (Table 3). Under such circumstances, thinning had no effect on total yield, fruit weight or fruit quality. These data suggest that when fruit load is reduced by lack of chilling accumulation and/or late freeze events, thinning is unlikely to provide benefits in fruit weight improvement as fruit growth is no longer source-limited [20,37]. Despite the lack of source-limitations on fruit growth, fruit size was generally lower in 2017 (comparison of fruit size in ‘Cary Mac’ across years). The GDD30 was higher in 2017 (320) than in 2018 and 2019 (160 and 191, respectively). Higher temperatures during early growth tend to decrease peach fruit size largely due to limitations in the availability of resources to support increased growth and developmental rates [10,27]. Therefore, warmer temperatures during early fruit growth in 2017 may have resulted in smaller fruit size. Alternatively, severe reduction in fruit number per tree may have greatly diminished the role of fruit as a major sink and altered resource partitioning such that growth of other sinks (e.g., vegetative growth) was prioritized [14,20]. This is supported by reports of increased shoot growth and leaf to fruit ratio in bloom-thinned trees compared to fruit-thinned or unthinned trees [18,38].
Thinning at bloom often results in larger fruit size at harvest in comparison to thinning at later stages [12,39,40]. Bloom-thinning has also been reported to substantially alter fruit size distribution at harvest in favor of larger fruit size [18,19]. In the current study, fruit weight and diameter were enhanced by bloom-thinning in ‘Cary Mac’ in 2019 by up to 50% (weight), but it was not significantly affected in other cultivars or years. Further, bloom-thinning resulted in significantly lower yield-per-tree in ‘Cary Mac’ and ‘July Prince’ in 2018, indicating that severe thinning during bloom can potentially reduce yields. This was consistent with previous reports that indicated a reduction in yield in response to bloom-thinning [12,18,39,40]. However, partial bloom-thinning has been reported to increase fruit size without negatively affecting yield [18,37,41,42,43]. Together, these data suggest that bloom-thinning alone may not provide consistent and desirable results in relation to improvement in fruit size and may potentially reduce yields. However, partial bloom-thinning followed by fruit-thinning may be a viable option and will need further evaluation in Georgia. Early fruit-thinning resulted in an increase in fruit weight only in ‘July Prince’ in 2019. Fruit number per tree was generally higher in 2019 (Figure 3), suggesting that fruit size improvement in response to early fruit-thinning was only obtained when natural fruit load was higher. Fruit size distribution was not evaluated in this study. Hence, it remains unclear if bloom or early fruit-thinning treatments altered fruit size distribution in favor of larger size fruit. Intensity of thinning, as evaluated by the two spacing treatments, did not significantly affect fruit weight or yield. This was further supported by contrasts analyses. These data are consistent with previous studies which indicated that other factors such as the number of fruit on the tree, were more influential in determining final size and yield [12,21,26].
Regression analyses indicated significant quadratic relationships between fruit number per tree and fruit size parameters and between fruit size parameters and yield. This was also supported by principal components analyses (PCA; Figure S2). These relationships underline the importance of achieving a target fruit number per tree through thinning to optimize fruit size and yield and support previous reports [12,26]. Further, these relationships were cultivar-specific, as fruit number per tree explained up to 58% of the variation in fruit size in ‘Cary Mac’, 84% of the variation in ‘July Prince’ and 14% of the variation in ‘Summer Flame’ (fruit diameter). Additionally, PCA indicated separation of cultivars within each year (Figure S2), supporting the idea that responses to thinning are cultivar-specific. Commercially, fruit size greater than around 64 mm is considered of higher quality and is often associated with a premium [12,18,19]. In ‘Cary Mac’, a fruit load of 500 fruit per tree allowed for a fruit size of 64.65 mm (diameter) and 136 g (weight). This translates to an overall yield of 64–67 kg per tree. In ‘July Prince’ which tended to produce larger fruit, a fruit load per tree of 800 fruit allowed for a fruit size of 64.5 mm and 153 g. Regression analyses between fruit size parameters and yield indicated that such a fruit load translated to 108–109 kg of fruit per tree. In ‘Summer Flame’, fruit number per tree generally did not exceed 200 in the two years of study allowing for fruit size to be greater than 65 mm, although the relationship was weaker. These data support previous conclusions [12,20,44,45] that target fruit number per tree is an effective approach for crop-load management in peach production. The current study further suggests that target fruit number per tree is substantially cultivar dependent [37,45]. Evaluation of fruit size distribution in response to varying levels of fruit load per tree across cultivars can help determine these genotype-specific relationships.
Perceived flavor of the fruit is also important for consumer acceptability [46,47]. In peach, the perceived sweetness of the fruit is especially important and is dependent on the sugar content and acidity of the fruit [47,48]. In this study, PCA indicated that ‘July Prince’ was separable from the other cultivars due, in part, to its lower TA (Figure S2). However, SSC and TA did not consistently differ between different thinning times and intensities. This is consistent with previous reports indicating inconsistent or minor effects of thinning treatments on fruit SSC [12,41,49,50]. Altogether, thinning times and intensities did not consistently affect fruit flavor in this study.

5. Conclusions

Thinning at bloom or during early fruit development at varying intensities did not consistently increase fruit size, and partly had a negative effect on yield-per-tree. However, analysis of relationships among fruit number per tree, yield-per-tree, and fruit size parameters, underlined the importance of thinning to adjust total fruit number per tree. Further, these relationships were cultivar-specific, suggesting that fruit load management strategies need to be tailored to individual cultivars. Hence, achieving a target fruit number per tree suitable for a given cultivar through thinning presents a reasonable approach for crop-load management in southeastern peach production. A combination of bloom and early fruit-thinning to achieve the desired fruit number per tree may present a viable option for optimizing fruit number per tree and thereby, fruit size and yield. Such a crop-load management strategy would also allow for flexibility in thinning practices in relation to adverse weather events. Following a freeze event, fruit density within the canopy may be reassessed and the target fruit number per tree may be achieved through fruit-thinning. These approaches need to be evaluated in future studies.

Supplementary Materials

The following are available online at https://www.mdpi.com/2311-7524/6/3/41/s1, Table S1: Bloom dates during 2017–2019 for peach trees used in this study, Table S2: Harvest dates during 2017–2019 for peach trees used in this study, Table S3: Polynomial regression equations for relationships among fruit size, fruit number and yield in peach, Figure S1: Fruit weight and yield-per-tree in response to thinning timing and intensity in experiment I (2017), Figure S2: Principal components analysis (PCA) of data from 2018 (A) and 2019 (B).

Author Contributions

Conceptualization, D.C. and A.M.; data curation, M.S. and J.D.; formal analysis, M.S. and A.M.; funding acquisition, D.C. and A.M.; methodology, M.S., D.C. and A.M.; project administration, D.C. and A.M.; resources, D.C.; supervision, D.C. and A.M.; writing—original draft, M.S. and A.M.; writing—review & editing, M.S., D.C. and A.M. All authors have read and agreed to the published version of the manuscript.

Funding

This project was supported by the U.S. Department of Agriculture’s (USDA) Agricultural Marketing Service through grant 16SCBGPGA0010. Its contents are solely the responsibility of the authors and do not necessarily represent the official views of the USDA.

Acknowledgments

The authors thank Lane Southern Orchards, Georgia, for access to peach trees, tree maintenance and their overall cooperation in this study.

Conflicts of Interest

The authors declare no conflicts of interest.

References

  1. Conners, C.H. Growth of fruits of peach. N. J. Agric. Exp. Stn. Annu. Rep. 1919, 40, 82–88. [Google Scholar]
  2. Day, K.R.; DeJong, T.M. Improving fruit size: Thinning and girdling nectarines, peaches, and plums. University of California. Presented at the Curso Internacional de Fruticultura de Clima Templado-Frio, Mendoza, Argentina. 1998. Available online: http://virtualorchard.com/idfta/cft/1999/april/day2/04_Day_fruit_size.html (accessed on 15 May 2019).
  3. Lockwood, D.W.; Coston, D.C. Peach tree physiology. In Southeastern Peach Growers’ Handbook; Georgia Experiment Station Handbook No. 1; Horton, D., Johnson, D., Eds.; University of Georgia: Athens, GA, USA, 2005; pp. 5–10. [Google Scholar]
  4. Lopresti, J.; Goodwin, I.; McGlasson, B.; Holford, P.; Golding, J. Variability in size and soluble solids concentration in peaches and nectarines. Hort. Rev. 2014, 42, 253–311. [Google Scholar]
  5. Masia, A.; Zanchin, A.; Rascio, N.; Ramina, A. Some biochemical and ultrastructural aspects of peach fruit development. J. Am. Soc. Hort. Sci. 1994, 117, 808–815. [Google Scholar] [CrossRef]
  6. Zanchin, A.; Bonghi, C.; Casadoro, G.; Ramina, A.; Rascio, N. Cell enlargement and cell separation during peach fruit development. Int. J. Plant Sci. 1994, 155, 49–56. [Google Scholar] [CrossRef]
  7. Yamagushi, M.; Haji, T.; Miyake, M.; Yaegaki, H. Varietal differences in cell division and enlargement periods during peach (Prunus persica Batsch) fruit development. J. Japan. Soc. Hort. Sci. 2002, 71, 155–163. [Google Scholar] [CrossRef]
  8. Wu, B.H.; Mimoun, M.B.; Génard, M.; Lescourret, F.; Besset, J.; Bussi, C. Peach fruit growth in relation to the leaf-to-fruit ratio, early fruit size and fruit position. J. Hort. Sci. Biotech. 2005, 80, 340–345. [Google Scholar] [CrossRef]
  9. Scorza, R.; May, L.G.; Purnell, B.; Upchurch, B. Differences in number and area of mesocarp cells between small- and large-fruited peach cultivars. J. Am. Soc. Hort. Sci. 1991, 116, 861–864. [Google Scholar] [CrossRef]
  10. Lopez, G.; DeJong, T.M. Spring temperatures have a major effect on early stages of peach fruit growth. J. Hort. Sci. Biotechnol. 2007, 82, 507–512. [Google Scholar] [CrossRef]
  11. Bassi, D.; Monet, R. Botany and taxonomy. In The Peach: Botany, Production, and Uses; Layne, D.R., Bassi, D., Eds.; CAB International: Cambridge, MA, USA, 2008; pp. 1–16. [Google Scholar]
  12. Njoroge, S.M.; Reighard, G. Thinning time during stage I and fruit spacing influences fruit size of ‘Contender’ peach. Sci. Hort. 2008, 115, 352–359. [Google Scholar] [CrossRef]
  13. Pavel, E.; DeJong, T.M. Source- and sink-limited growth periods of developing peach fruits indicated by relative growth rate analysis. J. Am. Soc. Hort. Sci. 1993, 118, 820–824. [Google Scholar] [CrossRef] [Green Version]
  14. DeJong, T.M.; Grossman, Y.L. Quantifying sink and source limitations on dry matter partitioning to fruit growth in peach trees. Physiol. Plant. 1995, 95, 437–443. [Google Scholar] [CrossRef]
  15. Grossman, Y.L.; DeJong, T.M. Maximum fruit growth potential and seasonal patterns of resource dynamics during peach growth. Ann. Bot. 1995, 75, 553–560. [Google Scholar] [CrossRef]
  16. Costa, G.; Vizzotto, G. Fruit thinning of peach trees. Plant Growth Regul. 2000, 31, 113–119. [Google Scholar] [CrossRef]
  17. Dennis, F.G., Jr. The history of fruit thinning. Plant Growth Regul. 2000, 31, 1–16. [Google Scholar] [CrossRef]
  18. Myers, S.C.; Savelle, A.T.; Tustin, D.S.; Byers, R.E. Partial flower thinning increases shoot growth, fruit size, and subsequent flower formation of peach. HortScience 2002, 37, 350–647. [Google Scholar] [CrossRef] [Green Version]
  19. Byers, R.E.; Costa, G.; Vizzotto, G. Flower and fruit thinning of peach and other Prunus. Hort. Rev. 2003, 28, 351–392. [Google Scholar]
  20. Grossman, Y.L.; DeJong, T.M. Maximum fruit growth potential following resource limitation during peach growth. Ann. Bot. 1995, 75, 561–567. [Google Scholar] [CrossRef]
  21. Byers, R.E.; Marini, R. Influence of blossom and fruit thinning on peach flower bud tolerance to an early spring freeze. HortScience 1994, 29, 146–148. [Google Scholar] [CrossRef]
  22. DeJong, T.M.; Johnson, R.S.; Day, K.R.; Beede, R. Feasibility of increasing cling peach yields by early thinning 1991 cling peach report. California Cling Peach Advisory Board Annual Research Report; University of California: Sacramento, CA, USA, 1991; pp. 1–5. Available online: https://ucanr.edu/sites/fruitreport/files/109964.pdf (accessed on 15 May 2019).
  23. Costa, G.; Botton, A.; Vizzotto, G. Fruit thinning: Advances and trends. Hort. Rev. 2019, 46, 185–226. [Google Scholar]
  24. Grossman, Y.L.; DeJong, T.M. Maximum vegetative growth potential and seasonal patterns of resource dynamics during peach growth. Ann. Bot. 1995, 76, 473–482. [Google Scholar] [CrossRef]
  25. DeJong, T.M.; Day, K.; Doyle, J.F.; Johnson, R.S. Evaluation of the physiological efficiency of peach, nectarine, and plum trees in different orchard systems. Annual Res. Rpt. California Tree Fruit Agreem. Reedley, VA, USA, 1990; pp. 1–10. Available online: https://ucanr.edu/sites/ctfa/category/Orchard_Design/?repository=46344&a=95028 (accessed on 15 May 2019).
  26. Marini, R.P. The perfect peach. Fruit Grow. News 2001, 40, 52. [Google Scholar]
  27. Lopez, G.; Johnson, R.; Dejong, T. High spring temperatures decrease peach fruit size. Calif. Agri. 2007, 61, 31–34. [Google Scholar] [CrossRef]
  28. Foshee, W.; Patterson, M.; Sikora, E.; Melgar, J.C.; Reighard, G.; Schnabel, G.; Anderson, P.; Harmon, P.; Mizell, R.; Johnson, D.; et al. 2020 Southeastern Peach, Nectarine, and Plum Pest Management and Culture Guide; Blaauw, B., Brannen, P., Lockwood, D., Schnabel, G., Ritchie, D., Eds.; Bulletin 1171; UGA Extension Publication; University of Georgia: Athens, GA, USA, 2020; 76p. [Google Scholar]
  29. Chavez, D.; Florkowska, M.; Cook, J.; Little, E. Home garden peaches. UGA Ext. Publ. 2015, 1063, 1–7. [Google Scholar]
  30. UGA Weather Network. Average Chilling Hours Calculator for Fort Valley, GA. Available online: http://www.georgiaweather.net/?content=calculator&variable=ch&type=cd (accessed on 15 May 2019).
  31. UGA Weather Network. Historical Weather Data for Fort Valley, GA. 2019. Available online: http://www.georgiaweather.net/?variable=HI&site=FTVALLEY (accessed on 15 May 2019).
  32. Day, K.; Lopez, G.; DeJong, T. Using growing degree hours accumulated thirty days after bloom to predict peach and nectarine harvest date. Acta Hort. 2008, 803, 163–166. [Google Scholar] [CrossRef] [Green Version]
  33. Reighard, G.; Rauh, B.L. Predicting peach fruit size potential from GDD 30 days post-bloom. Acta Hort. 2015, 1084, 753–758. [Google Scholar] [CrossRef]
  34. Dave Wilson Nursery. Peaches. Available online: https://www.davewilson.com/product-information/product/peaches (accessed on 15 May 2019).
  35. UGA. Peaches: Cultivars. Available online: https://peaches.caes.uga.edu/cultivars.html (accessed on 15 May 2018).
  36. Simnitt, S.; Borisova, T.; Chavez, D.; Olmstead, M. Frost protection for Georgia peach varieties: Current practices and information needs. HortTechnology 2017, 27, 344–353. [Google Scholar] [CrossRef]
  37. Reighard, G.L. Manipulating flower bud density and bloom in peaches. In Proceedings of the Mid Atlantic Fruit and Vegetable Convention and Trade Show, Hershey, PA, USA, 31 January 2008. [Google Scholar]
  38. Byers, R.E. Response of peach trees to bloom thinning. Acta Hort. 1989, 254, 125–132. [Google Scholar] [CrossRef]
  39. Deshmukh, N.A.; Rymbai, H.; Jha, A.K.; Lyngdoh, P.; Malhotra, S.K. Effect of thinning time and fruit spacing on fruit maturity, yield, size, peel colour and quality attributes of peach cv. Flordasun. Indian J. Hort. 2017, 74, 45–50. [Google Scholar] [CrossRef]
  40. Oliveira, P.D.; Marodin, G.A.B.; Almeida, G.K.; Gonzatto, M.P.; Darde, D.C. Heading of shoots and hand thinning of flowers and fruits on ‘BRS Kampai’ peach trees. Pesquisa Agropecuária Brasileira 2017, 52, 1006–1016. [Google Scholar] [CrossRef] [Green Version]
  41. Southwick, S.M.; Weis, K.G.; Yeager, J.T. Bloom thinning ‘Loadel’ cling peach with a surfactant. J. Am. Soc. Hort. Sci. 1996, 121, 334–338. [Google Scholar] [CrossRef]
  42. Myers, R.E.; Deyton, D.E.; Sams, C.E. Applying soybean oil to dormant peach trees alters internal atmosphere, reduced respiration, delays bloom, and thins flower buds. J. Am. Soc. Hort. Sci. 1996, 121, 96–100. [Google Scholar] [CrossRef] [Green Version]
  43. Moran, R.E.; Deyton, D.E.; Sams, C.E.; Cummins, J.C. Applying soybean oil to dormant peach trees thins flower buds. HortScience 2000, 35, 615–619. [Google Scholar]
  44. Alcobendas, R.; Mirás-Avalos, J.M.; Alarcón, J.J.; Pedrero, F.; Nicolás, E. Combined effects of irrigation crop load and fruit position on size, color and firmness of fruits in an extra-early cultivar of peach. Sci. Hort. 2012, 142, 128–135. [Google Scholar] [CrossRef]
  45. Marini, R.P.; Sowers, D.L. Peach fruit weight is influenced by crop density and fruiting shoot length but not position on the shoot. J. Am. Hort. Soc. 1994, 119, 180–184. [Google Scholar] [CrossRef] [Green Version]
  46. Echeverria, G.; Cano, J.; López, L.; Alins, G. Influence of volatile compound emissions and standard quality on consumer acceptance of peaches and nectarines. Acta Hort. 2012, 934, 1075–1081. [Google Scholar] [CrossRef]
  47. Belisle, C.; Phan, Y.T.X.; Adhikari, K.; Chavez, D.J. A fruit quality survey of peach cultivars growth in the southeastern united states. HortTechnology 2018, 28, 189–201. [Google Scholar] [CrossRef]
  48. Predieri, S.; Ragazzini, P.; Rondelli, R. Sensory evaluation and peach fruit quality. Acta Hort. 2006, 713, 429–434. [Google Scholar] [CrossRef]
  49. Barreto, C.F.; de Mello Farias, R.; Zandoná, R.R.; Martins, C.R.; Malgarim, M.B. Influence of the period of peach tree chemical thinning on fruit quality. J. Agric. Sci. 2019, 11, 141–147. [Google Scholar] [CrossRef]
  50. Link, H. Significance of flower and fruit thinning on fruit quality. Plant Growth Regulat 2000, 31, 17–26. [Google Scholar] [CrossRef]
Figure 1. Fruit weight and yield-per-tree in response to thinning timing and intensity in experiment II (2018). Thinning by flower removal was performed at bloom (0 d after full bloom (DAFB)) and by fruit removal at two stages of early development in three cultivars. At each stage, thinning was performed to a spacing of 15 cm or 20 cm between flowers/fruit. Control (Con) trees were not thinned. Mean ± S.E. of the mean are presented for fruit weight and yield data (n = 3). Similar letters above the bars indicate no significant difference in fruit yield between treatments.
Horticulturae 06 00041 g001
Figure 2. Fruit weight and yield-per-tree in response to thinning timing and intensity in experiment 3 (2019). Thinning was performed by flower removal at bloom (0 days after full bloom (DAFB)) and by fruit removal at two stages of early development in three cultivars. ‘July Prince’ was not thinned at bloom. At each stage, thinning was performed to 15 cm or 20 cm spacing between flowers/fruit. Control (Con) trees were not thinned. Mean ± S.E. of the mean are presented for fruit weight and yield data (n = 3). Similar letters above the bars indicate no significant difference in fruit weight between treatments.
Horticulturae 06 00041 g002
Figure 3. Relationship between fruit number per tree and fruit size. Relationship between fruit number per tree and fruit diameter (mm) and between fruit number per tree and fruit weight (g) is presented for three cultivars. Data from all treatments in 2018 and 2019 were used together within each cultivar for these analyses. Quadratic relationships were determined in SigmaPlot 11. NS: not significant.
Horticulturae 06 00041 g003
Figure 4. Relationship between fruit size and yield-per-tree. Relationship between fruit diameter (mm) and fruit yield and between fruit weight (g) and fruit yield is presented for three cultivars. Data from all treatments from 2018 and 2019 were used together within each cultivar for the analyses. Quadratic relationships were determined using SigmaPlot 11. NS: not significant.
Horticulturae 06 00041 g004
Table 1. Summary of peach-thinning treatments evaluated in 2017–2019.
Cultivar‘Cary Mac’‘June Prince’‘Spring Prince’
2017 z Spacing
10 DAFB y0 DAFB0 DAFB15 cm
20 DAFB0 DAFB0 DAFB20 cm
343 DAFB49 DAFB49 DAFB15 cm
443 DAFB49 DAFB49 DAFB20 cm
562 DAFB62 DAFB62 DAFB15 cm
662 DAFB62 DAFB62 DAFB20 cm
7 xNo ThinningNo ThinningNo ThinningNo Thinning
2018‘Cary Mac’‘July Prince’‘Summer Flame’Spacing
10 DAFB0 DAFB0 DAFB15 cm
20 DAFB0 DAFB0 DAFB20 cm
321 DAFB14 DAFB14 DAFB15 cm
421 DAFB14 DAFB14 DAFB20 cm
530 DAFB33 DAFB26 DAFB15 cm
630 DAFB33 DAFB26 DAFB20 cm
7No ThinningNo ThinningNo ThinningNo Thinning
2019‘Cary Mac’‘July Prince’‘Summer Flame’Spacing
10 DAFB0 DAFB15 cm
20 DAFB0 DAFB20 cm
319 DAFB21 DAFB15 DAFB15 cm
419 DAFB21 DAFB15 DAFB20 cm
528 DAFB44 DAFB43 DAFB15 cm
628 DAFB44 DAFB43 DAFB20 cm
7No ThinningNo ThinningNo ThinningNo Thinning
z Poor chill accumulation and a late freeze resulted in delayed thinning treatments; y DAFB—days after full bloom; x No thinning served as the control.
Table 2. Fruit diameter, number per tree and quality parameters in response to thinning treatments in 2017.
TreatmentDiameter (mm) zSSCTAFPT v
‘Cary Mac’Commercial yUndersized y(% Brix) x(% MA) w
0 DAFB-15 cm62.02 ± 0.38 u55.65 ± 2.0310.3 ± 0.2 0.92 ± 0.04 460 ± 111
0 DAFB-20 cm62.81 ± 0.4056.08 ± 0.829.8 ± 1.11.05 ± 0.05436 ± 85
43 DAFB-15 cm62.09 ± 1.4556.60 ± 0.979.6 ± 0.60.97 ± 0.05416 ± 14
43 DAFB-20 cm63.48 ± 0.7656.99 ± 0.5810.7 ± 0.20.98 ± 0.00319 ± 70
62 DAFB-15 cm62.32 ± 1.4256.36 ± 1.0410.5 ± 0.41.00 ± 0.03500 ± 95
62 DAFB-20 cm62.62 ± 1.0055.08 ± 0.4210.3 ± 0.31.08 ± 0.07524 ± 65
Control62.22 ± 0.1257.12 ± 1.469.9 ± 0.20.94 ± 0.03607 ± 47
‘June Prince’
0 DAFB-15 cm66.54 ± 1.3748.82 ± 0.4411.3 ± 0.30.88 ± 0.0387 ± 1
0 DAFB-20 cm66.98 ± 1.2449.42 ± 1.2210.8 ± 0.10.82 ± 0.0654 ± 9
49 DAFB-15 cm68.19 ± 2.2050.36 ± 1.3410.8 ± 0.30.88 ± 0.0455 ± 8
49 DAFB-20 cm67.06 ± 0.7851.23 ± 1.4510.6 ± 0.20.73 ± 0.0463 ± 13
62 DAFB-15 cm67.95 ± 1.0351.37 ± 1.5711.0 ± 0.40.79 ± 0.0280 ± 15
62 DAFB-20 cm70.34 ± 1.3050.64 ± 0.7711.4 ± 0.10.90 ± 0.1172 ± 1
Control67.55 ± 0.8650.38 ± 3.099.8 ± 0.50.81 ± 0.08125 ± 36
‘Spring Prince’
0 DAFB-15 cm59.65 ± 0.6443.40 ± 1.1011.3 ± 0.30.72 ± 0.05127 ± 27
0 DAFB-20 cm60.98 ± 1.6845.05 ± 2.2010.4 ± 0.20.69 ± 0.0855 ± 11
49 DAFB-15 cm59.69 ± 3.1243.63 ± 1.5410.9 ± 0.40.81 ± 0.1173 ± 9
49 DAFB-20 cm58.54 ± 0.2141.20 ± 2.719.5 ± 0.60.72 ± 0.0382 ± 17
62 DAFB-15 cm59.16 ± 2.4345.73 ± 1.8911.9 ± 0.30.79 ± 0.0269 ± 13
62 DAFB-20 cm60.97 ± 1.0045.47 ± 0.7011.3 ± 0.70.76 ± 0.1866 ± 9
Control61.15 ± 0.2545.08 ± 1.4410.5 ± 0.70.68 ± 0.03111 ± 7
z Diameter refers to the cheek-to-cheek diameter, y Commercial and undersize fruit are those with diameters>and <~63.5 mm, respectively. x % Brix is a measure of the soluble solids content (SSC) of commercial size fruit. w TA refers to titratable acidity and is presented as % malic acid equivalent of commercial size fruit. v Fruit number per tree (FPT) was calculated using average fruit weight and the total yield data (commercial and undersize fruit). u Mean ± S.E (n = 3).
Table 3. Fruit diameter, number per tree and quality parameters in response to thinning treatments in 2018.
TreatmentDiameter (mm) zSSCTAFPT w
‘Cary Mac’(% Brix) y(% MA) x
0 DAFB-15 cm76.55 ± 0.82 v11.7 ± 0.5 b u0.96 ± 0.02 39 ± 11 ab
0 DAFB-20 cm77.15 ± 1.9312.6 ± 1.5 ab0.93 ± 0.08 25 ± 5 b
21 DAFB-15 cm76.35 ± 0.3712.5 ± 1.3 ab0.89 ± 0.02105 ± 2 ab
21 DAFB-20 cm76.85 ± 0.7512.7 ± 1.9 ab1.01 ± 0.06 91 ± 50 ab
30 DAFB-15 cm78.24 ± 0.9516.0 ± 1.3 ab1.05 ± 0.0166 ± 6 ab
30 DAFB-20 cm76.46 ± 1.8016.7 ± 0.8 a1.09 ± 0.06 87 ± 11 ab
Control75.45 ± 2.5915.7 ± 0.7 ab1.00 ± 0.02142 ± 27 a
‘July Prince’
0 DAFB-15 cm87.09 ± 1.3912.1 ± 1.00.81 ± 0.04153 ± 39 b
0 DAFB-20 cm87.83 ± 4.2712.9 ± 1.30.80 ± 0.07147 ± 47 b
14 DAFB-15 cm83.82 ± 2.6113.0 ± 1.60.86 ± 0.04214 ± 4 ab
14 DAFB-20 cm87.30 ± 1.1814.1 ± 1.00.85 ± 0.03 170 ± 11 ab
33 DAFB-15 cm84.52 ± 1.3613.5 ± 1.20.81 ± 0.06 225 ± 25 ab
33 DAFB-20 cm85.76 ± 0.1214.5 ± 2.10.82 ± 0.03 265 ± 58 ab
Control82.41 ± 1.7714.2 ± 1.00.79 ± 0.05371 ± 66 a
‘Summer Flame’
0 DAFB-15 cm80.80 ± 2.9513.0 ± 0.61.04 ± 0.0815 ± 3
0 DAFB-20 cm79.87 ± 1.2922.5 ± 3.61.06 ± 0.0913 ± 3
14 DAFB-15 cm82.32 ± 1.5714.1 ± 1.41.13 ± 0.0918 ± 11
14 DAFB-20 cm80.18 ± 1.4116.0 ± 1.90.95 ± 0.0131 ± 15
26 DAFB-15 cm79.31 ± 2.7014.6 ± 0.70.99 ± 0.0425 ± 15
26 DAFB-20 cm80.68 ± 0.3013.7 ± 1.81.08 ± 0.0043 ± 12
Control84.57 ± 3.8614.6 ± 0.71.08 ± 0.0749 ± 23
z Diameter refers to the cheek-to-cheek diameter, y % Brix is a measure of the soluble solids content (SSC), x TA—titratable acidity, measured as % malic acid equivalents., w Fruit number per tree was estimated using average fruit weight and the total yield., v Mean ± S.E (n = 3). u p ≤ 0.05. Similar letters within each column indicate that values are not significantly different.
Table 4. Fruit diameter, number per tree and quality parameters in response to thinning treatments in 2019.
TreatmentDiameter (mm) zSSCTAFPT w
‘Cary Mac’(% Brix) y(% MA) x
0 DAFB-15 cm71.76 ± 1.60 v a u12.4 ± 0.10.92 ± 0.02173 ± 12
0 DAFB-20 cm67.58 ± 0.84 ab12.2 ± 0.10.99 ± 0.02135 ± 19
19 DAFB-15 cm67.41 ± 0.90 ab12.0 ± 0.31.07 ± 0.07312 ± 31
19 DAFB-20 cm64.56 ± 1.97 b12.0 ± 0.21.03 ± 0.03392 ± 189
28 DAFB-15 cm68.62 ± 1.73 ab11.8 ± 0.21.04 ± 0.03366 ± 64
28 DAFB-20 cm68.66 ± 0.72 ab11.6 ± 0.30.93 ± 0.05375 ± 72
Control62.14 ± 1.36 b11.3 ± 0.31.00 ± 0.01694 ± 246
‘July Prince’ t
21 DAFB-15 cm73.95 ± 1.54 a11.6 ± 0.60.80 ± 0.01 a476 ± 96
21 DAFB-20 cm75.05 ± 0.67 a10.7 ± 0.60.70 ± 0.02 ab425 ± 39
44 DAFB-15 cm68.98 ± 1.26 ab11.5 ± 0.40.63 ± 0.04 b666 ± 202
44 DAFB-20 cm66.49 ± 3.42 ab11.1 ± 0.40.67 ± 0.02 b706 ± 107
Control58.96 ± 2.63 b11.0 ± 0.70.66 ± 0.02 b1084 ± 119
‘Summer Flame’
0 DAFB-15 cm74.84 ± 0.9313.2 ± 0.90.86 ± 0.09106 ± 37
0 DAFB-20 cm74.03 ± 0.7813.8 ± 0.40.75 ± 0.0735 ± 4
15 DAFB-15 cm76.30 ± 0.9011.8 ± 0.40.75 ± 0.0844 ± 2
15 DAFB-20 cm74.40 ± 4.1313.7 ± 0.10.87 ± 0.0351 ± 5
43 DAFB-15 cm74.67 ± 1.7913.4 ± 0.60.89 ± 0.0294 ± 12
43 DAFB-20 cm75.58 ± 1.5512.7 ± 0.50.86 ± 0.06108 ± 36
Control75.21 ± 0.6813.5 ± 1.30.79 ± 0.1192 ± 54
z Diameter refers to the cheek-to-cheek diameter. y% Brix is a measure of the soluble solids content (SSC). x TA—titratable acidity, measured as % malic acid equivalents. w Fruit per tree was estimated using average fruit weights and the total yield. v Mean ± S.E (n = 3). u p ≤ 0.05. Similar letters within each column indicate that values are not significantly different. t bloom-thinning treatments were not performed

