Article

Alterations in the Chemical Composition of Spinach (Spinacia oleracea L.) as Provoked by Season and Moderately Limited Water Supply in Open Field Cultivation

by
Christine Schlering
1,2,*,†,
Jana Zinkernagel
2,
Helmut Dietrich
1,
Matthias Frisch
3 and
Ralf Schweiggert
1
1
Department of Beverage Research, Geisenheim University, 65366 Geisenheim, Germany
2
Department of Vegetable Crops, Geisenheim University, 65366 Geisenheim, Germany
3
Department of Biometry and Population Genetics, Justus Liebig University, 35392 Giessen, Germany
*
Author to whom correspondence should be addressed.
Present address: Department of Soil Science and Plant Nutrition, Department of Microbiology and Biochemistry, Geisenheim University, 65366 Geisenheim, Germany.
Horticulturae 2020, 6(2), 25; https://doi.org/10.3390/horticulturae6020025
Submission received: 6 March 2020 / Revised: 26 March 2020 / Accepted: 7 April 2020 / Published: 10 April 2020

Abstract

:
The current use and distribution of agricultural water resources is highly prone to effects of global climate change due to shifting precipitation patterns. The production of vegetable crops in open field cultivation often requires demanding water applications, being impaired in regions where climate change will increasingly evoke water scarcity. To date, increasingly occurring precipitation-free periods are already leading to moderate water deficits during plant growth, e.g., in southern Europe. Among all vegetable crops, leafy vegetables such as spinach (Spinacia oleracea L.) are particularly vulnerable to limited water supply, because leaf expansion is highly dependent on water availability. Besides biomass production, water limitation might also affect the valuable nutritional composition of the produce. Therefore, we investigated the impact of moderately reduced water supply on the chemical composition of spinach, cultivated in the open field in three consecutive years. Two different water supply treatments, full and reduced irrigation, were used in a randomized block design consisting of three sets of six plots each. In the reduced water supply treatment, the total amount of supplied water, including both irrigation and natural precipitation, amounted to 90%, 94% and 96% in 2015, 2016 and 2017, respectively, of the full, optimal water supply treatment. Spinach grown under limited water supply showed significantly higher fresh biomass-based contents of polyols (e.g., inositol, glycerol), ascorbic acid, potassium, nitrogen, phosphorous, zinc and manganese, as well as total flavonoids and carotenoids. Increased dry biomass-based levels were found for total inositol, zinc and manganese, as well as decreased levels for malic acid, fumaric acid, phosphate and chloride. Furthermore, we report a high seasonal variation of several minor phytochemicals, such as single flavonoids. Spinacetin derivatives, spinatoside-glucoside as well as a rather unusual hexuronylated methylenedioxy flavonoid showed highest amounts when grown under relatively low irradiation in autumn. Levels of patuletin derivatives tended to increase under high irradiation conditions during spring. In summary, the chemical composition of spinach was shown to be highly sensitive to moderately reduced water supply and seasonal variation, but the overall nutritional quality of fresh marketable spinach was only marginally affected when considering health-related constituents such as minerals, trace elements, flavonoids and carotenoids.

Graphical Abstract

1. Introduction

The ongoing climate change as well as the associated side effects, such as rising temperatures and substantial shifts in precipitation patterns, may lead to less favorable conditions for the cultivation of the respective, currently grown crop plants. Future projections of precipitation indicate even more severe conditions for almost the entire European continent [1]. Changing climatic conditions do not only boost temperature and rainfall fluctuations, but also consequently influence soil evaporation and plant transpiration [2]. Adverse distributions of rainfall during the cultivation period are already likely to create short-term water deficiencies in horticultural crops, which lead to sub-optimal conditions for plant growth. These temporary stress-related conditions may induce complex interactions in plant metabolism, especially under heterogenic requirements in open-field cultivation, where a combination of different stress factors simultaneously occurs. The results in terms of physiological and biochemical responses can be very different as a function of growth stage, severity and duration of stress [3].
In addition, plant responses to stress are dependent on the tissue or organ affected by the stress [4]. The reaction of plants to drought consists of numerous coordinated processes to alleviate both cellular hyperosmolarity and ion disequilibria [5]. Plants respond to drought stress with physiological and biochemical changes, aiming at the retention of water against a high external osmotic pressure and the maintenance of photosynthetic activity, while stomatal opening is reduced to counteract water loss [5]. While severe drought stress often results in clearly unmarketable crops, mild and moderate limitations in water supply induce more subtle changes and have earlier been considered to even enhance the formation of health-promoting antioxidant constituents in leafy vegetables [6]. However, this effect is highly plant-specific. For instance, experiments with moderately induced drought stress towards the end of the cultivation period followed by re-watering did not lead to significant increases in the concentrations of antioxidant compounds such as carotenoids and tocopherols in spinach (Spinacia oleracea L.), but did increase the levels of the aforementioned compounds in rocket [7]. Therefore, smart irrigation strategies are already used in horticultural systems to reduce the consumed irrigation water and even improve harvest quality [8]. However, severe water deficits evoked by fewer precipitation events or scarcity of irrigation water can be hard to manage and thereby cause short-term stress events during plant development.
Leafy vegetables such as spinach are usually highly sensitive to water deficits, because transpiration is affected due to stomatal closure. Stomatal closure as well as leaf growth inhibition are among the earliest responses to drought, protecting the plants from extensive water loss [3]. Since the biological function of plant leaves, i.e., photosynthesis, requires their exposure to sunlight and air, they might be expected to most sensitively react to a number of stress factors. The sensitivity of the photosynthetic apparatus is the basis of chlorophyll fluorescence measurements for recognizing plant stress prior to other physiological and even macroscopically visible stress responses [9]. Among the latter, the total leaf area is determinative for biomass accumulation and crop yield and also represents a factor highly correlated with detrimental effects on crop growth under stressful conditions [10]. Mild environmental stress was shown to lead to a significant decrease in the yield of freshly harvested spinach due to diminution of the relative water content, which recovered to control values within three days after re-watering [7]. However, plant growth remained affected. Thus, attempts to enhance levels of health-promoting phytochemicals like antioxidants by manipulating environmental factors may be burdened by a drop in yield [7]. Water deficit inhibits plant growth by reducing water uptake into the expanding cells, and enzymatically alters the robustness and plastic properties of the cell wall [4]. A crop’s need for water varies considerably among species, but water requirements for horticultural crops are generally high [11]. Especially in the case of leafy vegetables, constant amounts of available water are crucial [11].
Spinach is a leafy vegetable belonging to the long-day plants, which flower, or bolt, if the light period is as long as or longer than a ‘critical day length’ [11]. In northern regions, spinach is usually grown under short-day conditions in spring or fall in order to avoid bolting [11] and unfavorable textural alterations like fibrousness and stringiness. In brief, bolting renders spinach unmarketable. Similar to other leafy vegetables like lettuce or cabbage, spinach can tolerate lower light levels than fruiting vegetable crops [11]. Spinach is viewed as a vegetable with high nutritional quality [12], providing many health-promoting antioxidant constituents like carotenoids, flavonoids and other phenolic compounds [13], as well as considerable amounts of minerals, trace elements and vitamins, like vitamin C [14]. As compared to other flavonoid-rich vegetables such as Swiss chard (2.700 mg/kg fresh matter (FM) [15]) or red lettuce (1.400 mg/kg FM [16]), spinach showed similarly high contents of flavonoids (1.000 mg/kg FM [17]). Spinach is also known to accumulate high levels of rather undesired substances such as nitrate (547–3.350 mg/kg FM) and oxalate (2.309–10.108 mg/kg FM) [18]. With respect to its high nutritional quality, we studied how moderately reduced water supply might influence the chemical composition and, thus, the product quality of field-grown spinach. By evaluating this during three different cultivation years, this study also demonstrated the seasonal variability of the above-mentioned nutritionally relevant substances in spinach.

2. Materials and Methods

2.1. Chemicals

All reagents and solvents used were at least of analytical or HPLC quality, unless specified differently. Folin–Ciocalteu’s phenol reagent and sodium carbonate were purchased from Merck (Darmstadt, Germany), L-(+)-ascorbic acid from Carl Roth (Karlsruhe, Germany), (+)-catechin-hydrate, myo-inositol (>99.5%, HPLC), anhydrous glycerol (≥99.5%) and meso-erythritol (≥99%) from Sigma Aldrich (Steinheim, Germany). Quercetin-4′-O-glucoside (spiraeoside), (all-E)-lutein and (all-E)-β-carotene were obtained from Extrasynthese (Genay Cedex, France). L-aspartic acid (Ph. Eur., USP) was received from AppliChem (Darmstadt, Germany).

2.2. Plant Material and Field Experimental Design

Spinach cv. ‘Silverwhale’ seeds were purchased from Rijk Zwaan Welver (Welver, Deutschland) and were grown under open field conditions on a sandy loam at Geisenheim University, Germany (49°59′ N, 7°58′ E). The experimental field design has been reported earlier in detail by Schlering et al. [19]. In brief, one cultivation set per year was conducted in a plot installation between the years 2015 and 2017, resulting in three years, i.e., cultivation replicates, being grown as shown in Table 1. Each set consisted of six circular plots (marked by A, C, F, H, M and P) with an inner diameter of 11.9 m. Each plot was subdivided into four quarters (subplots) for the simultaneous cultivation of different vegetable crops with an annual crop rotation. Each subplot quarter was again divided into two further segments for the implementation of the different irrigation treatments following a randomized block design (cf. Schlering et al. [19]). The size of each segment was at least 6.5 m2, respectively. A third segment located outwardly was not harvested to avoid boundary effects but cultivation and irrigation took place as described in the next section. The irrigation levels of the subplots described below remained unchanged during the full experimental period, irrespective of the annual crop rotation.

2.3. Cultivation and Water Supply

Spinach seeds were sown by a manual seed-drilling machine with row spacing of ca. 0.25 m and a sowing distance of ca. 0.013 m, corresponding to a sowing density of ca. 308 seeds per m2. Uniform fertilization with calcium ammonium nitrate was carried out according to commercial standard specifications for the cultivation of standard-quality spinach for the fresh food market (135 kg/N ha−1) based on mineralized N (NO3-N) in 0–30 cm soil depth.
Crop protection was applied equally to all plots, whereby application depended on the growing set, described as follows: Chemical and biological insecticides were used depending on pest occurrence. NeemAzal®-T/S (Trifolio-M GmbH, Lahnau, Germany) was used against leafminer flies (Agromyzidae) and Fastac ME (BASF-SE, Limburgerhof, Germany) was applied against aphids (Sternorrhyncha). Goldor® Bait (BASF, Ludwigshafen, Germany) had been brought into the soil before sowing once per cultivation set against wireworms (Elateridae). Weed control was done manually.
Water supply by drip irrigation was generally activated when the soil suction tension fell below −20 kPa at a 10 cm depth, as controlled by a tensiometer with an electronic pressure sensor (Tensio-Technik, Bambach, Geisenheim and Deutschland). During the initial growth stages, i.e., until the appearance of the seedlings, the soil moistures of both the well-watered control (CTR) and the reduced water supply (RWS) treatments were kept evenly moist by irrigation. Depending on the year, this period of identical water supply lasted for 19 days (2015), 20 days (2016) and 17 days (2017). Then, the well-irrigated CTR segments were provided 6.2 L/m2 per irrigation, whereas the RWS treatment was reduced to ca. 50% of that of the CTR treatment. Because of the natural precipitation, both the volume of irrigation water and also the ultimate total water volume varied strongly between years. As a result, the total water volume of the RWS was 90% (2015), 94% (2016) and 96% (2017) of that of the CTR treatments during the respective years (Table 1).

2.4. Harvest

A total of 40 plants per segment was harvested randomly when most of the leaves were unfolded, representing the commercially targeted maturation stage for fresh-marketed spinach. To avoid border effects, outer rows were omitted from harvest. Specifically, harvest dates were 51, 44 and 39 days after sowing years in 2015, 2016 and 2017, respectively (Table 1). After harvest, plants were cleaned twice manually with fresh tap water to remove adhered soil particles and roots were removed with a knife, before leaves were spun using a commercial salad spinner to remove remaining water. Subsequently, the fresh spinach leaves were frozen at −80 °C until further analyses.

2.5. Climatic Data

Local climate data were supplied by the local weather station, which was located at 100 m distance from the experimental field site in Geisenheim. Climatic parameters for each cultivation period are summarized in Table 1, while detailed weather conditions can be obtained from Figures S1–S4 in the Supplementary Materials. Based on global irradiation and total water amount (Table 1), the three different growing periods were characterized and assigned as follows: 2015 (less irradiation, dry), 2016 (more irradiation, moist) and 2017 (more irradiation, dry). More precisely, the cultivation periods 2016 and 2017 were characterized by high global irradiation and evapotranspiration (Supplementary Figures S2 and S4), but relative air humidity was considerably lower during the vegetation period in 2016 (Supplementary Figure S3) and the temporal development of the temperature profiles were opposite between the cultivation periods. While the temperature constantly decreased in 2015, it increased substantially during the growth periods in 2016 and 2017. Altogether, temperature sum and mean air humidity did not differ strongly between years, whereas their profiles during plant growth varied strongly (Supplementary Figures S1–S4). In addition, the precipitation profiles were quite different between years (data not shown). While natural precipitation was relatively high during the first half of the growing period in 2015 and 2017, when additional irrigation was mainly initiated in the last two weeks of cultivation, the opposite was true for the cultivation set in 2016, when natural precipitation was very high in the second half of the cultivation period.

2.6. Sample Preparation

For all analyses, except for the determination of ascorbic acid, 150–200 g frozen spinach leaves of each sample were lyophilized (BETA 2-8 LDplus, Martin Christ Gefriertrocknungsanlagen GmbH, Osterode am Harz, Germany) prior to grinding with a laboratory mill (IKA M 20; IKA-Werke, Staufen, Germany). Dry biomass content was determined gravimetrically using fresh and freeze-dried material. D-Glucose, D-fructose, titratable acidity, L-malic acid and fumaric acid, as well as inorganic anions like nitrate, phosphate, sulfate and chloride, were determined from aqueous extracts prepared from the lyophilized powder. For this purpose, an aliquot of 8–10 g of lyophilized plant material was thoroughly homogenized with 500 mL ultrapure water at room temperature and rigorously mixing for ca. 10 s using a stainless-steel food blender (setting 2, Waring Blender, Waring Commercial, Torrington, CT 06790, USA). After transferring the extract including solids into an 800 mL beaker using another 150 mL of added ultrapure water, extraction continued for 10 min under continuous magnetic stirring, followed by a single ultrasound-assisted extraction step in an ultrasound water bath for another 5 min. After centrifuging for 5 min at 4596× g to separate liquid and solid phases, the supernatants were collected, filtered and stored at −25 °C until analyses. Extraction procedures for all other target analytes are given below.

2.7. Chemical Analyses

Unless otherwise noted, IFU-methods (International Fruit Juice Union, Paris, France) were used for determination of routine parameters in aqueous extracts, such as sugars, total acidity, organic acids and inorganic anions.

2.7.1. Sugars and Polyols

D-Glucose and D-fructose were determined spectrophotometrically using enzymatic kits (R-Biopharm, Darmstadt, Germany) and a Konelab 20 Xti analyzer (ThermoFisher, Dreieich, Germany).
Determination of polyols excluding the aforementioned sugars was carried out in duplicates as described by Schlering et al. [19]. Quantitation was carried out with linear external calibrations of myo-inositol, glycerol and erythritol.

2.7.2. Organic Acids

Titratable acidity, calculated as citric acid, was measured potentiometrically after titration to pH 8.1 with 0.3 M NaOH (Titroline alpha, Schott, Mainz, Germany). L-malic acid was determined spectrophotometrically using enzymatic kits (R-Biopharm, Darmstadt, Germany). Fumaric acid was determined by HPLC with UV detection and ascorbic acid by iodometric titration, as previously described [19].

2.7.3. Inorganic Anions

Nitrate, sulfate and phosphate were determined by ion chromatography and chloride by potentiometric titration with an AgCl-electrode, as described previously [19].

2.7.4. Total Carbon and Nitrogen

Elemental analyses of spinach samples for carbon and nitrogen were carried out in duplicate by the Dumas combustion method (Vario MAX CNS, Elementar Analysensysteme GmbH, Langenselbold, Germany), combusting 300 mg of lyophilized and powdered plant material at 950 °C. L-aspartic acid was used as a reference substance.

2.7.5. Minerals and Trace Elements

Minerals and trace elements were analyzed by inductively coupled plasma optical emission spectrometry (ICP-OES) (SPECTRO ARCOS, SPECTRO Analytical Instruments, Kleve, Germany) after Kjeldahl digestion with the Gerhardt Turbotherm rapid digestion unit (C. Gerhardt GmbH & Co. KG, Königswinter, Germany), as reported earlier [19].

2.7.6. Total Phenols

An aliquot of 500 mg of lyophilized powdered plant material was extracted twice with 12 mL of 70% aqueous methanol under ultrasonication for 30 min. After centrifuging for 10 min at 12,857× g, the combined supernatants were made up to 25 mL with extraction solvent and stored at −28 °C until spectrophotometric analyses with the Folin–Ciocalteu reagent. A linear (+)-catechin calibration was used as described previously [20].

2.7.7. Flavonoids

Flavonoids were extracted from lyophilized powdered material as described for total phenols (see above) in duplicates. Extracts were filtered through a 0.2 µm membrane using a polytetrafluoroethylene (PTFE) syringe filter (Macherey-Nagel, Düren, Germany), before extracts were analyzed with reversed-phase HPLC equipped with a photodiode array detector (RP-HPLC/PDA) with negative electrospray ionization mass spectrometry (ESI-MS) on an Accela/LXQ system (ThermoFisher, Dreieich, Germany). Chromatographic separation was achieved on a 150 × 2 mm, 3 mm C18 (2) Luna column (Phenomenex, Aschaffenburg, Germany) protected with a guard cartridge of the same material. Injection volume was 4 µL and elution conditions were the following: flow rate 250 mL/min at 40 °C, solvent A was water/formic acid (95:5, v/v), solvent B was methanol, 1 min isocratic conditions with 10% B, linear gradient from 10% to 55% B in 25 min, followed by washing with 100% B and re-equilibrating the column. MS scan range was set at m/z 250–1050 (negative mode). The MS settings were: ESI source voltage +4.5 kV, capillary voltage 32 V, capillary temperature 275 °C, collision energy for MSn experiments 30%. Flavonoids were identified by comparison of their retention times, UV/Vis and mass spectral data with those of authentic standards or published data [21,22]. Flavonoids were quantified at 360 nm using an external spiraeoside standard (Extrasynthese, Lyon, France) in a linear range of 5–100 mg/L.

2.7.8. Carotenoids

An aliquot of 75 mg of lyophilized powdered spinach was combined with ca. 0.4 g of NaHCO3 in a glass tube prior to extraction with 4 mL of a mixture of n-hexane/acetone (2:3, v/v) using vortex stirring for 10 s. Then, the extracts were stored on ice in the dark for 10 min using an intermediate stirring step after 5 min. After centrifuging at 4596× g for 10 min at 4 °C, the supernatant was collected in 25 mL amber glass volumetric flasks previously flushed with N2. The remaining solids were extracted further four times and the obtained extracts were combined and then transferred quantitatively to amber round-bottomed flasks prior to evaporation to dryness under reduced pressure at 25 °C (Rotavopar R-210, Büchi, Switzerland). The dried extract was re-dissolved in HPLC solvent A (see below), transferred to a 10 mL volumetric flask, made up to 10 mL, and filtered through a 0.2 µm membrane filter (Chromafil O-20/25 PTFE syringe filter; Macherey-Nagel, Düren, Germany) into an HPLC vial. Carotenoids contained in the extract were separated with a HPLC-PDA system consisting of a Dionex P 680 HPLC pump, a Dionex STH 585 column oven and Dionex PDA-100 Photodiode Array Detector (Dionex/Thermo Fisher Scientific, Germany), which was mounted with a YMC Carotenoid (C30)-column (4.6 × 250 mm, 5 µm particle size, YMC, Kyoto, Japan) protected with a guard column of the same material. Column temperature was 20 °C. Solvent A was a quaternary mixture of methanol (MeOH), methyl tert-butyl ether (MTBE), water and a 1 M ammonium acetate solution (AAc) (MeOH/MTBE/H2O/AAc, 88:5:2:5, v/v/v/v) and solvent B a ternary mixture of MeOH/MTBE/AAc (20:78:2, v/v/v). A linear gradient from 0% to 85% B in 45 min followed by a linear gradient to 100% B in 5 min was applied, followed by an isocratic equilibration step with 100% B for 10 min. Flow rate was 1 mL/min. Total run time was 60 min. Injection volume was 20 µL. Compounds were identified by comparing their retention times and UV/Vis absorption spectra to those of authentic reference compounds ((all-E)-lutein, (all-E)-β-carotene) and literature (violaxanthin, neoxanthin, (Z)-isomers of β-carotene, Britton [23]). Carotenoids were quantified at 450 nm. An external linear calibration of authentic (all-E)-lutein was used for quantitation of violaxanthin, neoxanthin and (all-E)-lutein, while authentic (all-E)-β-carotene calibrations were used for quantitating (9Z)-β-carotene and (all-E)-β-carotene.

2.8. Statistical Analyses

Analytical results were calculated based on both dry and fresh biomass (i) to enable evaluations regardless of different water contents in the plant material by dry biomass-related data and (ii) to assess the nutritional values of the harvested edible plant material by fresh biomass-related data. Data were analyzed by fitting a linear mixed-effect model using the lmer-function within the lme4-package [24] of the statistical software R [25] in RStudio [26]. The evaluation of the single years was based on a model which aimed at correcting for random plot-effects (Equation (1)), while the total dataset was evaluated with respect to the interaction of plot and year (Equation (2)):
y ~ H2O + (1|plot)
y ~ H2O + (1|plot:year)
Comparisons of means derived from different treatments were considered significantly different if p < 0.10. Pairwise comparison of least-squares means was carried out with lsmeans-package [27] to estimate fixed-effects of the treatment as well as random effects for the plot and season. Significances of random effects were calculated by the lmer test-package [28]. The results for the treatment (CTR: control, RWS: reduced) were evaluated on the basis of adjusted data generated from the model mentioned above. Principal Component Analysis (PCA) was carried out by using the R-packages FactoMineR [29] and factoextra [30]. Within PCA analysis, individual samples were visualized in a score plot, while corresponding chemical components were represented in a loading plot inside a correlation circle presenting the relationship between the variables. To avoid an overweight of flavonoids and carotenoids by representation of individual components, only total amounts were considered for PCA.

3. Results and Discussion

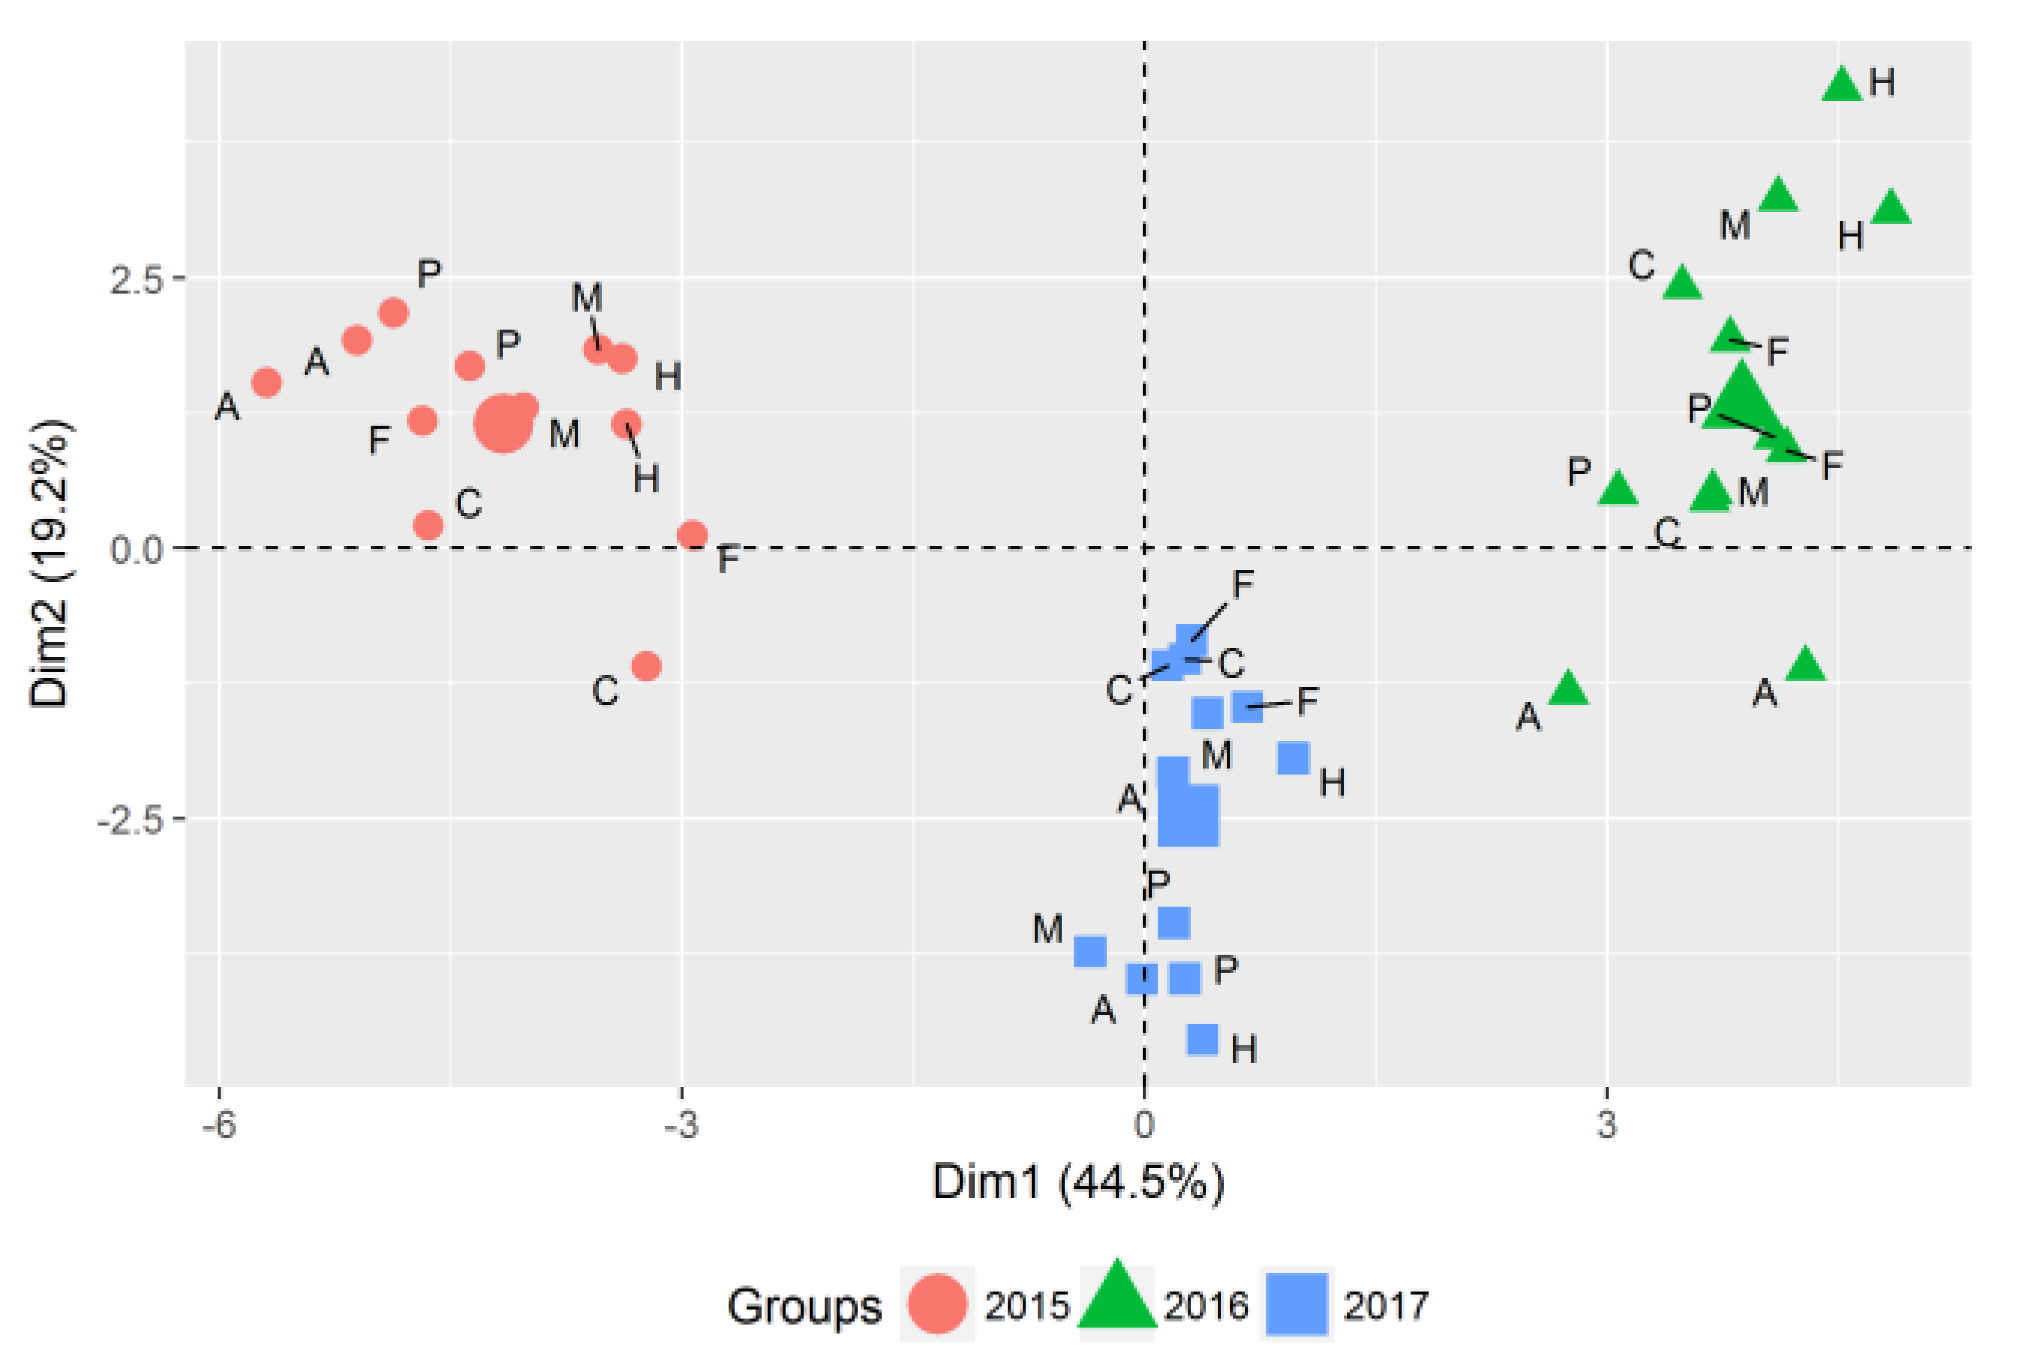
3.1. Evaluation of Years and Season

According to the PCA of data that had been corrected for plot effects (Equation (1)), the three years derived from three consecutive growing years (2015, 2016 and 2017) were clearly differentiated by their chemical composition, highlighting the strong influence of the year on the product quality. Similar results were already shown for radish grown within the same experimental field site [19]. The first two principal components (PCs) accounted for 63.7% of the total variance considering dry biomass-related data (Figure 1) and for 65.6% considering fresh biomass-related data (data not shown). Similar year-to-year variations have been reported earlier for other vegetable crops [31,32]. While the two sets from 2015 and 2016 were clearly distinguishable over the first principal component (Dim1, Figure 1), the set from 2017 was additionally separated over the second principal component (Dim 2). The year 2015 was characterized by comparably low sunlight exposure (global irradiation: 453.5 MJ/m2) as compared to 2016 (799.9 MJ/m2) and 2017 (756.9 MJ/m2). Consequently, evapotranspiration was higher in 2016 (126.9 mm) and 2017 (126.6 mm) in contrast to 2015 (68.7 mm). The years 2016 and 2017 were different when considering the total water amount the plants received. In 2016, total water supply was higher (184 mm) than 2017 (113 mm), with the latter being similar to that in 2015 (104 mm, Table 1).

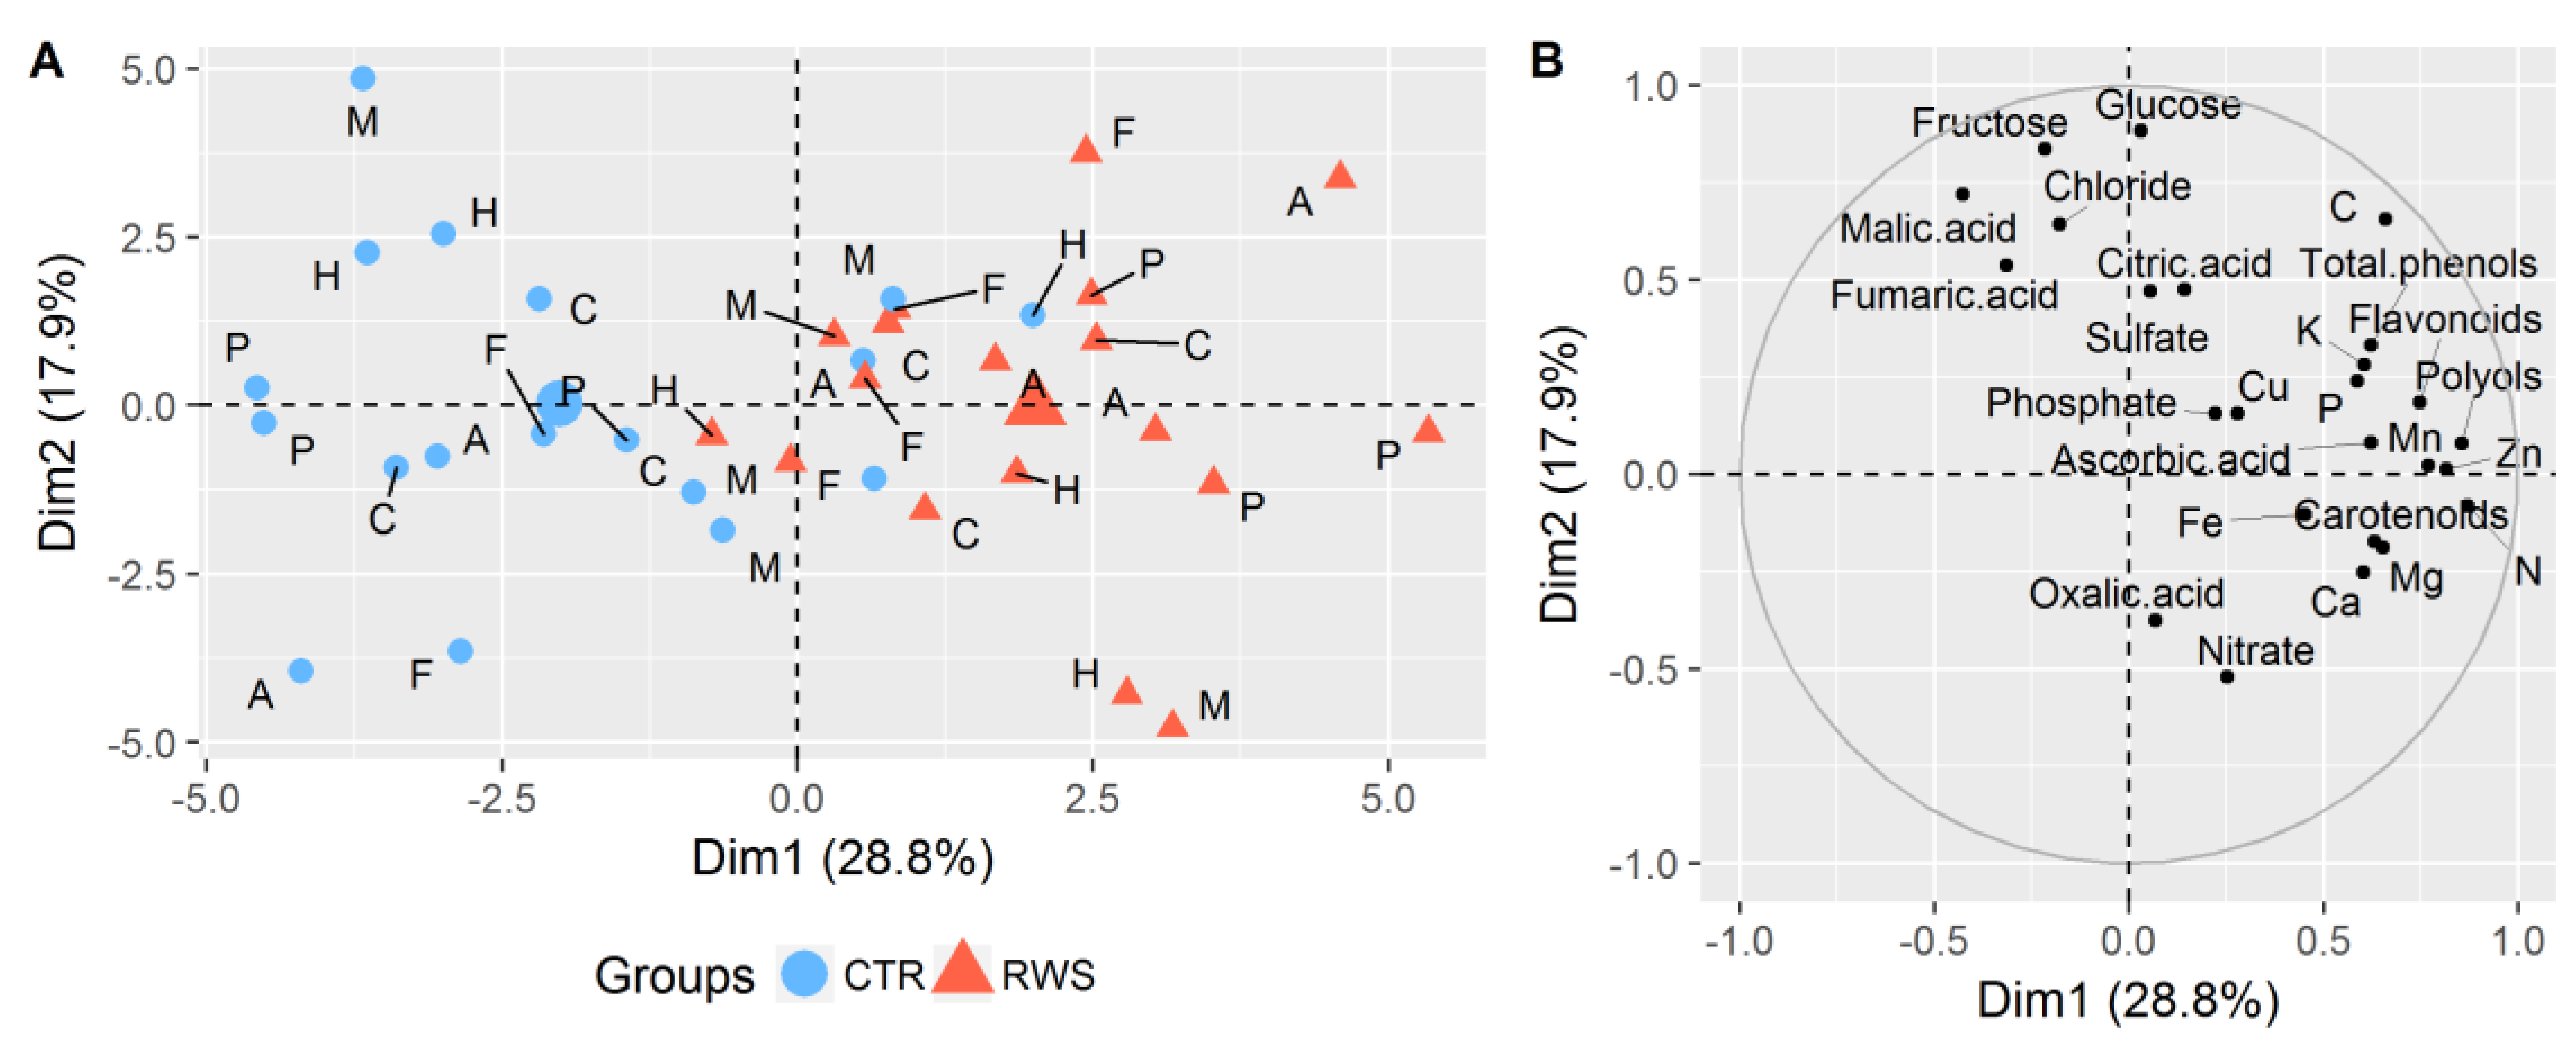
3.2. Effects of Reduced Water Supply on the Chemical Composition of Spinach Biomass

The PCA of the entire dataset adjusted by the interaction of plot and year (Equation (2)) revealed that well-irrigated spinach samples were mainly clustered in sectors with negative PC2, while those grown under mildly reduced water supply were mainly located in sectors with positive PC2 (Figure 2A). Most of the individuals were separated by the second principal component PC2 (Dim2), which, however, accounted for only 14.1% of the total variance. The first two principal components (Dim1 + Dim2) accounted for 38.7% of the total variance in the dataset. As shown in the corresponding loading plot (Figure 2B), the most important variables with high contribution to Dim2 were dry-matter-based contents in trace elements like manganese (Mn), zinc (Zn), iron (Fe), total phenols, flavonoids, polyols, as well as nitrate, nitrogen (N), potassium (K) and carotenoids. Dim1 was mainly influenced by contents of sugars (glucose, fructose), organic acids (malic acid, fumaric acid) and anions (chloride, sulfate). Apart from these multivariate analyses, a univariate statistical evaluation shown in Table 2 was conducted to underpin the multivariate estimate. While CTR samples were characterized by higher contents of organic acids like malic and fumaric acid, as well as certain anions like chloride, phosphate and sulfate, the content of inositol and trace elements such as Zn and Mn as well as flavonoids was lower than in samples derived from RWS treatments (Table 2). However, the univariate results also pointed out that the levels of glucose, fructose, quantitatively abundant elements (K, N, P, Ca and Mg) and carotenoids remained widely unaffected by mild water reduction. Only in 2015, when the highest relevant water reduction was achieved, i.e., 10% less than the well-watered control, did some minerals and carotenoids show increased dry biomass-based contents in the RWS samples (Table 2). In our earlier study on red radish root tubers, the identical environmental conditions had not led to an increase in the corresponding levels [19]. In this study, leaves of spinach reacted to the identical water deficits by both the increase of polyols and the accumulation of certain trace elements such as Mn and Zn.
The distinction of both water supply treatments by PCA with fresh biomass-related data was significantly clearer (Figure 3A) than that based on dry biomass-related data (Figure 2A). With very few exceptions, fresh biomass-based data allowed for distinguishing both groups clearly over the first principal component (Dim1), explaining 28.8% of the total variance. Upon addition of the second principal component (Dim2), a share of 46.7% of the total variance was explained. In contrast to red radish root tubers grown under control and reduced water supply conditions [19], the fresh biomass-based discrimination of spinach from well-watered versus reduced water treatments was not mainly based on primary metabolites like polyols, total carbon and ascorbic acid, but also on secondary metabolites such as total phenols, flavonoids and carotenoids, as well as selected minerals and trace elements (Figure 3). In brief, fresh biomass-related contents of most of the targeted chemical components, especially those of polyols, minerals, trace elements and secondary metabolites such as flavonoids and carotenoids, were increased in spinach samples grown under reduced water supply. The univariate evaluation shown in Table 3 confirmed these results. The fresh biomass-based contents of all of the studied carotenoids, i.e., violaxanthin, lutein and ß-carotene, showed significant and rather uniform increases (Table 3, Supplementary Table S1).
It is noteworthy that the ratio of individual carotenoids in chloroplast-containing plant tissues is rather constant due to their pivotal role in photosynthesis, commonly 20%–25% β-carotene, 40%–45% lutein, 10%–15% violaxanthin and 10%–15% neoxanthin [33]. Occasionally, the levels of xanthophyll cycle carotenoids, such as antheraxanthin, were reported to be increased upon exposure of the plant to abiotic stress [34]. Findings similar to those of our study were found earlier for antioxidant compounds such as carotenoids and tocopherols in rocket (E. sativa Mill. var. Golden line) in the case of moderate drought stress followed by re-watering at the end of the cultivation period [7]. However, the same experiment did not result in higher levels of such antioxidants in spinach [7]. Altogether, fresh biomass-based contents of many other constituents in spinach showed a significant increase, possibly being related to higher dry biomass content of reduced watered plants (Table 2), which was also shown for cabbage (Brassica oleracea L.) subjected to drought stress just during head development [35].

3.3. Sugars and Polyols

The content of sugars such as glucose and fructose was hardly affected by moderate water reduction, but was characterized by high variations between the years irrespective of the water supply treatment. The dry biomass-related data emphasized that glucose was highest in 2016 (62.70–72.92 mg/g dry matter (DM)) in contrast to other years (50.92–59.55 mg/g DM), while fructose levels were highest in 2015 (43.35–43.59 mg/g DM) compared to 2016 (30.94–37.58 mg/g DM) and 2017 (27.70–29.41 mg/g DM, Table 2). As shown in Table 1, the 2015 set was characterized by comparably low irradiation (453.5 MJ/m2) in contrast to 2016 (799.9 MJ/m2) and 2017 (756.9 MJ/m2), but the growing period was considerably longer in 2015 (51 days) in contrast to 2016 (44 days) and 2017 (39 days). These conditions, typically occurring during late growing seasons in autumn, resulted in the highest levels of fructose in 2015, while high light intensities, which are known to increase soluble carbohydrates in spinach [36], led to the highest contents of glucose in 2016. While both tended to decrease with mild water reduction in 2016 (p = 0.1521 and p = 0.0721 respectively, Table 2), when global irradiation and evapotranspiration were high, values were unaffected or increased in 2015 and 2017 due to mild water reduction. These trends were found for both dry and fresh biomass-related data.
In general, contents of dry biomass were significantly higher in 2015 (8.54%–8.60%) compared to other years (5.40%–6.83%), which automatically leads to enhanced values in the fresh biomass-related results (Table 3). By analogy, the overall glucose and fructose levels were higher in 2015 (537–564 mg and 410–413 mg per 100 g FM, respectively) than in other sets (318–403 mg glucose and 171–208 mg fructose per 100 g FM) (Table 3) without significant differences between the treatments.
Analogous to glucose and fructose contents, inconsistent effects of mild water reduction were found regarding the content of polyols in spinach dry biomass. Interestingly, the levels of polyols, particularly those of myo-inositol and glycerol, were lowest in 2016, although glucose levels were highest. These findings were in contrast to those found for radish, which showed congruently high levels of glucose and polyols [19]. Total polyols were generally lowest in 2016 (3.87 mg/g DM), being significantly increased to 4.09 mg/g DM upon reduced water supply (p = 0.0302) (Table 2). In contrast, levels in 2015 were higher (5.91 mg/g DM), but no changes in concentration were observed upon reduced water supply, although total water reduction was highest (−10%). These findings indicated that factors other than water supply had overruled a potential, marginal effect of the water supply. In our earlier study on red radish, a water reduction of 15%–20% led to significant increases of polyols [19]. Probably, reduced photosynthesis and the associated lowered growth under comparably “low light” conditions in 2015 (daily mean global irradiation: 8.7 MJ/m2) have not influenced the assimilation and allocation of photosynthetic products as much as in 2016 and 2017, when plant growth was accelerated by higher levels of daily irradiation (17.8 and 18.9 MJ/m2, respectively). In this context, Quick et al. [37] has shown that the levels of soluble carbohydrates in leaves of two annual crops (Lupinus albus L. and Helianthus annuus L.) were maintained when exposed to water stress under field conditions, even though photosynthesis was strongly inhibited. Maintenance of soluble sugars probably occurs because partitioning was altered in water-stressed plants [37]. In brief, the accumulation of polyols in spinach leaves seemed to be more sensitive to moderately reduced water supply than that in radish root tubers, which only showed increased levels after more severe reductions in water supply (≥15% lower than full water supply), as described in Schlering et al. [19].

3.4. Organic Acids

Organic acids’ contents in spinach were inconsistently influenced by moderate water reduction, depending on the cultivation period (year). While dry biomass-based contents of ascorbic acid significantly increased in 2015, those of oxalic and fumaric acid decreased (Table 2). Differences in malic acid contents were insignificant comparing the treatments in 2015, but they were significantly reduced by RWS in 2016. Significant differences for malic acid were also found considering the entire dataset. Cutler and Rains [38] observed significantly increased accumulations of malic acid in leaves of cotton (Gossypium hirsutum L.) exposed to water stress, explained by osmotic adjustment and the importance of malate in turgor regulation of stomatal guard cells [38,39]. However, in our study on spinach, rather inconsistent changes in malic acid levels were observed, presumably because mild water reduction applied in this experiment had not been severe enough to cause sufficient stress to alter the plants’ metabolism.
The significant increase of dry biomass-related ascorbic acid levels in spinach grown in 2015 (p = 0.0493) was in agreement with findings of Koyama et al. [6], who demonstrated an augmentation of ascorbic acid by lower water supply in hydroponically grown leafy vegetables such as lettuce and spinach. In contrast to our study, Koyama et al. [6] did not observe significant alterations in the water content. In our study, by analogy to polyols, ascorbic acid levels were highest in the relatively “low light, dry” cultivation set in 2015, both in dry and fresh biomass, possibly being related to lower global irradiation, which has previously been shown to enhance ascorbic acid contents in spinach [40]. The comparably high content of dry biomass in 2015 contributed to the increased fresh biomass-based levels of ascorbic acid (80.49–85.30 mg/100 g FM) as compared to other years (23.62–46.02 mg/100 g FM).

3.5. Inorganic Anions

The dry biomass-related contents of anions such as phosphate (PO43−) and sulfate (SO42−) were significantly decreased by RWS in 2015. By analogy, red radish root tubers studied within the same field experiment exhibited significant decreases of PO43− upon similar water reduction, i.e., to 80% of full water supply [19]. Phosphate uptake into the roots might have been diminished under RWS [41], because its mobility depends on soil moisture [10]. On the other hand, the mineralization of organic matter by microbial activity, responsible for the release of ions such as H2PO4 and HPO42− [11], might have been negatively affected due to water reduction. A significant decrease of dry biomass-related levels of SO42− was measurable in 2015 (p = 0.0192), when total water reduction was highest compared to other years, but the contents of SO42− (p = 0.0910) and chloride (Cl) (p = 0.0692) were also reduced in 2016, when water reduction was lower (Table 2). When considering the overall dataset, a dry biomass-related decline of PO43− (p = 0.0594) and Cl (p = 0.0053) was observed in plants that had received slightly reduced water amounts, but the content of SO42− also declined (p = 0.1151). In contrast, Abdel Rahman et al. [42] observed an accumulation of Cl in grasses and legumes as a result of decreasing soil moisture.
In contrast to the above-mentioned anions, the influence of RWS on the dry biomass-related nitrate (NO3) levels in spinach was insignificant. However, an unexpected increase of NO3 in fresh biomass-based levels upon limited water supply was observed in 2016 (p = 0.0238, Table 3). The opposite was found in previously reported studies of fresh biomass-related nitrate levels of lettuce (Lactuca sativa) [6] and carrots (Daucus carota L.) [43] exposed to drought stress. In principle, NO3-flux from roots to leaves is believed to generally decrease during drought stress [44], being accompanied by a reduced expression of the nitrate reductase enzyme [45]. This did not apparently occur in spinach grown under RWS in our study, since dry biomass-related levels did not differ between water supply treatments. It is noteworthy that there was also a strong impact of the cultivation year. NO3 contents were substantially higher in the moist year 2016 (28.16–28.60 mg/g DM) compared to other comparably drier years 2015 and 2017 (7.73–12.98 mg/g DM), as shown in Table 2. Presumably due to frequent and high precipitation events towards the end of the cultivation period in 2016 (data not shown), a high absorption of NO3 might have led to higher NO3 levels. This hypothesis warrants further study. Nevertheless, in agreement with our study, a positive correlation was found between NO3 and water contents in spinach [46]. Ćustić et al. [47] also observed increased NO3 accumulation under warm and wet conditions in chicory (Cichorium intybus). It is known that NO3 accumulation varies with the season [47] and is greatly affected by environmental factors [48]. Santamaria et al. [49] observed more than doubled NO3 levels in rocket, accompanied by a decrease in dry biomass, when temperature increased from 10 to 20 °C. An inverse correlation of fresh biomass-based NO3 and oxalate levels with those of dry biomass content was also confirmed by our results. Therefore, the markedly increased NO3 levels in 2016 might have occurred due to high temperature (Supplementary Figure S1) and a simultaneously high water supply (data not shown) along with decreasing irradiation (Supplementary Figure S2) by the end of the cultivation period. It is well known that low irradiation promotes NO3 accumulation in spinach [11,50].

3.6. Carbon

The dry biomass-related content of total carbon (C) remained unaffected by RWS in spinach, as shown in Table 2. Fresh biomass-related levels were significantly higher in less irrigated plants (2.48 mg/g FM) in contrast to well-irrigated samples (2.20 mg/g FM) only in 2017, when, simultaneously, the dry biomass content also significantly increased, despite the comparably low water reduction (by 4%). Nevertheless, multivariate analysis supports the contribution of C to the separation of both groups in the PCA plot on a fresh biomass basis (Figure 3).

3.7. Nitrogen

Dry biomass-related total nitrogen (N) was not affected, but fresh biomass-related data was significantly influenced by RWS when considering the data across all three years (Table 2 and Table 3). For instance, dry biomass-related N levels remained unchanged in 2016 and 2017, irrespective of the water supply treatment (p = 0.7042 and 0.7088, respectively), but they only marginally increased from 50.92 to 51.64 mg/g DM in 2015 (p = 0.0682). Upon reduced water supply, fresh biomass-related N levels significantly increased from 176.2 to 202.6 mg/100 g FM in 2016 (p = 0.0065) and from 238.58 to 262.42 mg/100 g FM in 2017 (p = 0.0097). A similar increase from 273.99 to 291.73 mg/100 g FM was found considering the whole dataset (p = 0.0013), but not when considering data of 2015 only (407.22 versus 410.14 mg/100 g FM for CTR and RWS respectively, Table 3). Multiple irrigation events in 2015 might have evoked drying–re-wetting conditions, which are known to increase soil-available N and, therefore, might have alleviated the negative effect of drought on reduced N mineralization [51].
In agreement with our fresh biomass-related data, dry biomass-related total N levels were highest in 2015 (50.92–51.64 mg/g DM) as compared to the other years (38.07–42.47 mg/g DM). These findings might be explained by the fact that, in 2015, spinach was cultivated in autumn and therefore harvested after a longer growth period (51 days) as compared to 2016 and 2017 (44 and 39 days, respectively), as caused by lower irradiation in 2015. The lowest N levels were found in 2016 when total water amount as well as irradiation sum and temperature sum were highest compared to other years (Table 1) and precipitation was more frequent just before harvest (data not shown). Different results were found earlier for red radish with highest contents of nitrogen under moist conditions [19].

3.8. Potassium

Water supply limitation resulted in significantly increased levels of potassium (K+) in spinach dry biomass in 2015 only (Table 2), when water reduction was most pronounced. According to fresh biomass-related PCA analyses (Figure 3), where most of the minerals were contributing to the separation of the treatments, significantly higher levels of K+ were found in spinach grown under reduced water conditions in 2015 and 2017 (Table 3). While dry biomass content of reduced watered spinach was significantly higher in 2017, which might explain the increase in K+ based on fresh biomass, the dry biomass content did not differ in 2015 with reduced water supply. Anyway, the availability of K+ from the soil was shown to decrease with declining soil water content due to decreasing mobility of K+ [52]. Our results indicated that K+ uptake, which is often reduced under drought conditions [53,54], was not significantly affected by moderate water reduction. The highest absolute K+ levels in spinach were found in 2016 (85.60–87.88 mg/g DM) and 2017 (89.89–90.68 mg/g DM), when global irradiation and evapotranspiration rates were high and temperatures continuously increased during the cultivation period (Supplementary Figures S1, S2, S4).

3.9. Phosphorous

In accordance with other macronutrients, dry biomass-related levels of phosphorous (P) were higher in less irrigated than in well-watered spinach in 2015 (p = 0.0596), but not in other years (Table 2). Similar to N, fresh biomass-related P levels were significantly increased in all years as well as in the overall dataset (p = 0.0004, Table 3), which probably can be traced back to higher contents of dry biomass in samples obtained from the reduced watered plants. This result was also visible in the PCA on fresh biomass-based data, where P clearly contributed to the differentiation of both treatments. In contrast, red radish root tubers grown within the same experimental field site revealed a significant decrease of P based on dry biomass, while fresh biomass-related data showed no effect [19]. In general, the fresh biomass-based P levels differed strongly between the cultivation set of 2015 (47.65–50.96 mg/g DM) and those of 2016 and 2017 (29.77–34.09 mg/g DM). One possible explanation might be the prolonged cultivation time in 2015 (51 days) and the associated high content of dry biomass (8.54%–8.60%) in contrast to other years (5.40%–6.83%). The shortened cultivation times in 2016 (44 days) and 2017 (39 days) might have resulted in lower absolute nutrient uptake from the soil.

3.10. Calcium

Calcium (Ca2+) content of spinach was independent of the water supply. Generally, lower Ca2+ levels were found in 2015 (10.85–11.69 mg/g DM) compared to the other years 2016 and 2017 (13.78–14.94 mg/g DM). This result is in contrast to those found for N, which displayed the highest levels in 2015. Since Ca2+ is a readily available element for plant uptake from the soil, high Ca2+ levels have earlier been suggested to be associated with high concentrations in the soil rather than with potential relationships with uptake efficiency or transpiration velocity of the plant [41,55]. In agreement with our findings, Sánchez-Rodríguez et al. [56] did not find any difference in the Ca2+ accumulation of tomato leaves exposed to moderate drought stress, even though its uptake was significantly reduced. These findings are in further agreement with those from Hu and Schmidhalter [57], stating that Ca2+ accumulation was much less sensitive to drought than that of K and phosphate. Basically, Ca2+ has structural functions and acts as an important second messenger [58]. Since important plant functions are controlled by very small, but physiologically active pools of Ca2+ within the cytoplasm [59], the observed insignificant effects of moderate water reduction on the Ca2+ levels in spinach had been expected.

3.11. Magnesium

The dry biomass-based content of magnesium (Mg2+) in spinach was significantly reduced by RWS in 2015, but not in 2016 and 2017. Thus, multivariate analysis by PCA did not show a strong contribution of Mg2+ to the differentiation of both groups (Figure 2). The same result was found for fresh biomass-based analyses (Table 3). In agreement with our findings, effects of moderate water reduction had no effects on Mg2+ levels in leaves of cherry tomatoes and were dependent on the cultivar [56]. In contrast, Pulupol et al. [60] found higher fresh biomass-based Mg2+ levels in tomato fruits grown under deficit irrigation, while dry biomass-related amounts were influenced insignificantly. Also, radish cultivated under RWS within the same experiment exhibited no significant changes in fresh biomass-related Mg2+ levels [19].

3.12. Micronutrients (Fe, Zn, Mn, Cu)

Significant effects on the dry biomass-related contents of iron (Fe) and copper (Cu) were not observed in our study, irrespective of water supply and cultivation year. However, dry biomass-based zinc (Zn) and manganese (Mn) contents were significantly increased by limited water supply (Table 2). PCA analyses supported the contribution of these micronutrients to variant differentiation (Figure 2). Similar findings were evident during analyses of fresh biomass-related data (Table 3, Figure 3). In contrast, moderate water reduction resulted in significantly decreased contents of Mn in radish root tubers grown within the same field experiment [19]. By analogy, water deficit-conditions have been shown to lead to lower Mn levels in leaves of cherry tomatoes [56].

3.13. Phenolic Compounds

In spinach dry biomass, total polyphenol content, including flavonoids, remained unchanged with RWS considering both the single datasets as well as the total dataset across all cultivation years. The levels of total flavonoids, as derived by summing up levels of individually quantitated flavonoids (Supplementary Tables S2 and S3), remained highly similar within a narrow range in all individual years (9.82–10.56 mg/g DM), while the amount of total polyphenol contents were marginally higher in 2016 (11.26–11.80 mg/g DM) and 2017 (11.38–11.42 mg/g DM) as compared to 2015 (10.09–10.31 mg/g DM).
In contrast to the quite stable dry biomass-related contents, fresh biomass-based contents displayed a much higher variability, particularly considering total flavonoids ranging from 54.45 to 86.93 mg/100 g FM. Fresh biomass-related levels of total flavonoids were significantly higher in reduced watered spinach than in well-watered spinach in 2017, which, however, was obviously based on significantly higher levels in dry biomass (Table 3). The levels found were in accordance with those of a previous study of Gil et al. [17], who found ca. 1000 mg/kg total flavonoids in fresh cut spinach. Because of generally higher contents of dry biomass in 2015, the fresh biomass-related levels of total flavonoids (86.52–86.93 mg/100 g FM) were substantially greater in 2015 as compared to those found in other years, reaching the lowest levels in 2016 (54.45–59.17 mg/100 g FM, Table 3). In accordance, strong seasonal variations in the levels of flavonoids such as quercetin and kaempferol were found in leafy vegetables such as lettuce (1.9–30 mg/kg quercetin) and endive (15–95 mg/kg kaempferol), based on fresh biomass-analyses [61]. Apart from fresh biomass-based variations, flavonoid levels in our study did not show any differences if compared on a dry biomass basis, even if there were strong differences in the global irradiation levels during the cultivation periods (Table 1, Supplementary Figures S1–S4). A rather low dependence or even independence of flavonoid contents from climatic factors such as temperature and global irradiation were reported previously in kale (Brassica oleracea var. sabellica) by Schmidt et al. [62].
Focusing on flavonoids, Bergquist et al. [22] observed the highest concentrations in baby spinach at early growth stages accompanied by high variations as associated with different sowing times. Furthermore, Hertog et al. [61] showed quite strong seasonal variations in the flavonoid levels of leafy vegetables such as lettuce and endive, which were 3 to 5 times higher in summer than in other seasons. In our study, the highest amounts of flavonoids in spinach fresh biomass were found in 2015 (86.52–86.93 mg/g FM), when cultivation took place in autumn with relatively low global irradiation in contrast to other years which had been sown at springtime (54.45–73.40 mg/ FM).
For individual flavonoids, RWS did not induce any clear effect in spinach. Univariate analyses indicated a dry biomass-related increase of some minor patuletin-derivatives in 2015 as well as an increase in the levels of a few more abundant flavonoids in 2016 upon moderate water limitation (Supplementary Table S3). For example, levels of specific patuletin- and spinatoside-derivatives (e.g., compounds 3, 5 and 11, Supplementary Table S2) were partly increased by RWS in 2015 and 2016. Among the other flavonoid-derivatives, the content of spinatoside, which represented one of the most abundant flavonoid-compounds in spinach according to a comparison of our mass spectral data to those reported previously by Aritomi et al. [63], tended to increase by RWS in 2016 (p = 0.0677). Apart from that, the study of Bergquist et al. [22] demonstrated that flavonoid profiles of baby spinach were highly similar during all growth stages, although the relative amounts of the individual flavonoids were prone to changes. Similar results were found in our study when comparing the different years, with hardly any difference in total flavonoids years, but individual flavonoids varied widely (Supplementary Table S3). The contents of individual flavonoids were almost the same when grown during early 2016 and 2017, while the proportions were markedly different when grown in late 2015. While an apparent methylenedioxyflavone-glucuronide (5,3′,4′-trihydroxy-3-methoxy-6:7-methylene-dioxyflavone-4′-β- D-glucuronide [21,22]) was the main flavonoid in 2016 and 2017 (30.0%–30.4%, Supplementary Table S4), the spinatoside accounted for the largest proportion in 2015 (20.2%–20.5%, Supplementary Table S4). A clear causal relationship between moderate limitations in water supply and changes in single or total flavonoids could not be established, which might indicate that the RWS effect on the levels of these compounds was rather low. Nevertheless, further studies in more controlled environments and, possibly, with more severe reductions in water supply, should be encouraged.

3.14. Carotenoids

In general, (all-E)-lutein was the major carotenoid found in spinach, followed by β-carotene and violaxanthin, which is in accordance with what had been expected in photosynthetically active plant tissues [33]. Moderately reduced water supply did not show clear effects on the contents of total carotenoids in spinach when evaluating the dry biomass-related dataset (Table 2). There was a slight increase of β-carotene, (9Z)-β-carotene and total carotenoids in 2015, not reaching statistical significance. In contrast, fresh biomass-related levels of all carotenoids significantly increased with RWS in all three cultivation years (Table 3). In contrast to the lack of effect of water supply, a seasonal variation was observed. For instance, total carotenoid levels in spinach dry biomass were ca. two-fold higher in 2017 (7.22–7.25 mg/g DM) than in 2015 and 2016 (3.03–4.11 mg/g DM). The high level of global irradiation in 2017 (756.9 MJ/m2) had been expected to lead to comparably high levels of carotenoids, because increased radiation has been shown to enhance the accumulation of carotenoids in green vegetables [7]. This hypothesis would have explained the low carotenoid levels in 2015 with a global irradiation of 453.5 MJ/m2, but not the low carotenoid levels in 2016 (3.03–3.05 mg/g DM) which were characterized by a high global irradiation (799.9 MJ/m2). Carotenoid synthesis and accumulation must have been impacted by other, yet unknown, factors, such as the occurrence of multiple short-time drought events during the plant growth in 2016. By analogy to the levels of flavonoids, a clear effect of moderate water limitation and season on the levels of carotenoids was not observed in our open filed cultivation experiment.

4. Conclusions

In this study, the chemical composition of both dry and fresh biomass of spinach was shown to be strongly influenced by climatic conditions and/or water supply. The effects were highly dependent on the type of nutrient. Even moderately reduced water supply led to significant increases of dry biomass, which in turn often led to increased levels of numerous constituents and, thus, apparently enhanced the nutritional value of the vegetable product. For instance, fresh biomass-related levels of ascorbic acid, potassium, nitrogen, phosphorous as well as total flavonoids and carotenoids increased upon limiting water supply. Our results indicated that changes in levels of characteristic flavonoids might depend on seasonal variations, although further study is needed in this regard. Considering the composition of the dry biomass itself, we demonstrated that even mild water supply reductions led to significant increases of inositol, zinc and manganese levels, while malic acid, phosphate and chloride levels decreased. It is likely that such climate-related reductions in water supply will occur more frequently in the future, as is already occurring more and more due to the presumably accelerating climate change. In summary, our results indicate that the nutritional composition of spinach is sensitive to even moderately reduced water supply, but the overall quality of fresh spinach did not suffer regarding the levels of health-promoting constituents such as minerals, trace elements, flavonoids and carotenoids.

Supplementary Materials

The following are available online at https://www.mdpi.com/2311-7524/6/2/25/s1: Figure S1–S4: Daily mean weather conditions during the different spinach cultivation periods of 2015, 2016 and 2017: (1) Mean air temperature (°C), (2) global irradiation sum (W/m2), (3) daily mean relative humidity (%) and (4) daily mean evapotranspiration (mm). DAS: Days after sowing. Figure S5: HPLC-DAD chromatogram of spinach flavonoids at 350 nm. Flavonoid peaks assigned by comparing retention times, UV/Vis-spectra and mass spectral data to those reported by literature as shown in Table S2. Table S1: Proportion of single carotenoids on the total amount of carotenoids in spinach fresh biomass from three years (2015, 2016 and 2017). CTR: Control treatment with full water supply, RWS: Reduced water supply treatment. Table S2: Peak assignment to flavonoid-compounds as detected in spinach from years 2015, 2016 and 2017 by comparing retention time (RT), UV/Vis-spectra and negative ion m/z and important MS/MS-fragments to the literature. An exemplary chromatogram is shown in Figure S5. Table S3: Influence of reduced water supply on the dry biomass (DM)-related levels of single flavonoid compounds in spinach leaves from three years (2015, 2016 and 2017). Linear mixed model, t-test, p-values: < 0.1, < 0.05 (*), < 0.01 (**) and < 0.001 (***); CTR: Control treatment with full water supply, RWS: Reduced water supply treatment. Compound to peak number assignment is provided in Table S2. Table S4: Proportion of single flavonoids on the total amount of flavonoids in spinach dry biomass from three years (2015, 2016 and 2017). CTR: Control treatment with full water supply, RWS: Reduced water supply treatment. Compound to peak number assignment is provided in Table S2.

Author Contributions

Conceptualization, H.D. and J.Z.; methodology, C.S. and H.D.; software, M.F. and C.S.; formal analysis, C.S. and M.F.; investigation, C.S.; resources, H.D., R.S. and J.Z.; data curation, C.S.; writing—original draft preparation, C.S.; writing—review and editing, C.S., J.Z., H.D., M.F. and R.S.; visualization, C.S.; supervision, R.S., H.D., M.F. and J.Z.; project administration, H.D. and J.Z.; funding acquisition, H.D. and J.Z. All authors have read and agreed to the published version of the manuscript.

Funding

This research was funded by the LOEWE excellence cluster FACE2FACE from the Hessian State Ministry of Higher Education, Research and Arts (Wiesbaden, Germany).

Conflicts of Interest

The authors declare no conflict of interest.

References

  1. Kundzewicz, Z.; Radziejewski, M.; Pińskwar, I. Precipitation Extremes in the Changing Climate of Europe. Clim. Res. 2006, 31, 51–58. [Google Scholar] [CrossRef]
  2. Kang, Y.; Khan, S.; Ma, X. Climate change impacts on crop yield, crop water productivity and food security—A review. Prog. Nat. Sci. 2009, 19, 1665–1674. [Google Scholar] [CrossRef]
  3. Chaves, M.M.; Maroco, J.P.; Pereira, J.S. Understanding plant responses to drought—From genes to the whole plant. Funct. Plant Biol. 2003, 30, 239. [Google Scholar] [CrossRef]
  4. Cramer, G.R.; Urano, K.; Delrot, S.; Pezzotti, M.; Shinozaki, K. Effects of abiotic stress on plants: A systems biology perspective. BMC Plant Biol. 2011, 11, 163. [Google Scholar] [CrossRef] [Green Version]
  5. Parida, A.K.; Dagaonkar, V.S.; Phalak, M.S.; Umalkar, G.V.; Aurangabadkar, L.P. Alterations in photosynthetic pigments, protein and osmotic components in cotton genotypes subjected to short-term drought stress followed by recovery. Plant Biotech. Rep. 2007, 1, 37–48. [Google Scholar] [CrossRef]
  6. Koyama, R.; Itoh, H.; Kimura, S.; Morioka, A.; Uno, Y. Augmentation of Antioxidant Constituents by Drought Stress to Roots in Leafy Vegetables. HortTechnology 2012, 22, 121–125. [Google Scholar] [CrossRef] [Green Version]
  7. Esteban, R.; Fleta-Soriano, E.; Buezo, J.; Míguez, F.; Becerril, J.M.; García-Plazaola, J.I. Enhancement of zeaxanthin in two-steps by environmental stress induction in rocket and spinach. Food Res. Int. 2014, 65, 207–214. [Google Scholar] [CrossRef]
  8. Costa, J.M.; Ortuño, M.F.; Chaves, M.M. Deficit Irrigation as a Strategy to Save Water: Physiology and Potential Application to Horticulture. J. Integr. Plant Biol. 2007, 49, 1421–1434. [Google Scholar] [CrossRef]
  9. Pérez-Bueno, M.L.; Pineda, M.; Barón, M. Phenotyping Plant Responses to Biotic Stress by Chlorophyll Fluorescence Imaging. Front. Plant Sci. 2019, 10, 1135. [Google Scholar] [CrossRef]
  10. Taiz, L.; Zeiger, E. Plant Physiology, 5th ed.; Ainauer Associates Inc.: Sunderland, MA, USA, 2010; ISBN 978-0-87893-866-7. [Google Scholar]
  11. Preece, J.E.; Read, P.E. The biology of horticulture. In An Introductory Textbook, 2nd ed.; John Wiley & Sons: Hoboken, NJ, USA, 2005; ISBN 0471465798. [Google Scholar]
  12. Bergquist, S.A.M.; Gertsson, U.E.; Olsson, M.E. Influence of growth stage and postharvest storage on ascorbic acid and carotenoid content and visual quality of baby spinach (Spinacia oleracea L.). J. Sci. Food Agric. 2006, 86, 346–355. [Google Scholar] [CrossRef]
  13. Toivonen, P.M.A.; Hodges, D.M. 10 Leafy Vegetables and Salads. In Health-Promoting Properties of Fruit and Vegetables, [Enhanced Credo Edition]; Terry, L.A., Ed.; CABI: Wallingford, UK; Cambridge, MA, USA; Boston, MA, USA, 2013; pp. 171–195. ISBN 978-1-78064-422-6. [Google Scholar]
  14. Herrmann, K. Inhaltsstoffe von Obst und Gemüse. 50 Tabellen und Übersichten, 97 Formeln; Ulmer: Stuttgart, Germany, 2001; ISBN 3-8001-3139-0. [Google Scholar]
  15. Gil, M.I.; Ferreres, F.; Tomás-Barberán, F.A. Effect of Modified Atmosphere Packaging on the Flavonoids and Vitamin C Content of Minimally Processed Swiss Chard (Beta vulgaris Subspecies cycla). J. Agric. Food Chem. 1998, 46, 2007–2012. [Google Scholar] [CrossRef]
  16. Gil, M.I.; Castañer, M.; Ferreres, F.; Artés, F.; Tomás-Barberán, F.A. Modified-atmosphere packaging of minimally processed “Lollo Rosso” (Lactuca sativa): Phenolic metabolites and quality changes. Z Lebensm Unters Forsch A 1998, 206, 350–354. [Google Scholar] [CrossRef]
  17. Gil, M.I.; Ferreres, F.; Tomás-Barberán, F.A. Effect of Postharvest Storage and Processing on the Antioxidant Constituents (Flavonoids and Vitamin C) of Fresh-Cut Spinach. J. Agric. Food Chem. 1999, 47, 2213–2217. [Google Scholar] [CrossRef]
  18. Santamaria, P.; Elia, A.; Serio, F.; Todaro, E. A survey of nitrate and oxalate content in fresh vegetables. J. Sci. Food Agric. 1999, 79, 1882–1888. [Google Scholar] [CrossRef]
  19. Schlering, C.B.; Dietrich, H.; Frisch, M.; Schreiner, M.; Schweiggert, R.; Will, F.; Zinkernagel, J. Chemical composition of field grown radish (Raphanus sativus L. var. sativus) as influenced by season and moderately reduced water supply. J. Appl. Bot. Food Qual. 2019, 343–354. [Google Scholar] [CrossRef]
  20. Singleton, V.L.; Rossi, J.A. Colorimetry of Total Phenolics with Phosphomolybdic-Phosphotungstic Acid Reagents. Am. J. Enol. Vitic. 1965, 16, 144. [Google Scholar]
  21. Koh, E.; Charoenprasert, S.; Mitchell, A.E. Effect of Organic and Conventional Cropping Systems on Ascorbic Acid, Vitamin C, Flavonoids, Nitrate, and Oxalate in 27 Varieties of Spinach (Spinacia oleracea L.). J. Agric. Food Chem. 2012, 60, 3144–3150. [Google Scholar] [CrossRef]
  22. Bergquist, S.A.M.; Gertsson, U.E.; Knuthsen, P.; Olsson, M.E. Flavonoids in baby spinach (Spinacia oleracea L.): Changes during plant growth and storage. J. Agric. Food Chem. 2005, 53, 9459–9464. [Google Scholar] [CrossRef]
  23. Britton, G. UV/visible spectroscopy. In Carotenoids: Volume 1B, Spectroscopy; Britton, G., Liaaen-Jensen, S., Pfander, H., Eds.; Birkhäuser: Basel, Switzerland, 1995; pp. 13–62. ISBN 3-7643-2909-2. [Google Scholar]
  24. Bates, D.; Maechler, M.; Bolker, B.; Walker, S. Fitting Linear Mixed-Effects Models Using {lme4}. J. Stat. Softw. 2015, 67, 1–48. [Google Scholar] [CrossRef]
  25. R Core Team. R: A Language and Environment for Statistical Computing; R Foundation for Statistical Computing: Vienna, Austria, 2016. [Google Scholar]
  26. RStudio Team. RStudio: Integrated Development Environment for R.; RStudio, Inc.: Boston, MA, USA, 2016. [Google Scholar]
  27. Lenth, R.V. Least-Squares Means: The R Package lsmeans. J. Stat. Softw. 2016, 69, 1–33. [Google Scholar] [CrossRef] [Green Version]
  28. Kuznetsova, A.; Brockhoff, P.B.; Christensen, R.H.B. lmerTest Package: Tests in Linear Mixed Effects Models. J. Stat. Softw. 2017, 82. [Google Scholar] [CrossRef] [Green Version]
  29. Le, S.; Josse, J.; Husson, F. FactoMineR: An R Package for Multivariate Analysis. J. Stat. Softw. 2008, 25, 1–18. [Google Scholar] [CrossRef] [Green Version]
  30. Kassambara, A.; Mundt, F. Factoextra: Extract and Visualize the Results of Multivariate Data Analyses, R package version 1.0.5; 2017; Available online: https://CRAN.R-project.org/package=factoextra (accessed on 27 March 2018).
  31. Mercadante, A.Z.; Rodriguez-Amaya, D.B. Carotenoid composition of a leafy vegetable in relation to some agricultural variables. J. Agric. Food Chem. 1991, 39, 1094–1097. [Google Scholar] [CrossRef]
  32. Schreiner, M. Vegetable crop management strategies to increase the quantity of phytochemicals. Eur. J. Nutr. 2005, 44, 85–94. [Google Scholar] [CrossRef]
  33. Britton, G. Functions of Intact Carotenoids. In Carotenoids: Volume 4: Natural Functions; Britton, G., Liaaen-Jensen, S., Pfander, H., Eds.; Birkhäuser Basel: Basel, Switzerland, 2008; pp. 189–212. ISBN 978-3-7643-7499-0. [Google Scholar]
  34. Schweiggert, R.; Ziegler, J.; Metwali, E.; Mohamed, F.; Almaghrabi, O.; Kadasa, N.; Carle, R. Carotenoids in mature green and ripe red fruits of tomato (Solanum lycopersicum L.) grown under different levels of irrigation. Arch. Biol. Sci. 2017, 69, 305–314. [Google Scholar] [CrossRef]
  35. Radovich, T.J.K.; Kleinhenz, M.D.; Streeter, J.G. Irrigation Timing Relative to Head Development Influences Yield Components, Sugar Levels, and Glucosinolate Concentrations in Cabbage. J. Am. Soc. Hortic. Sci. 2005, 130, 943–949. [Google Scholar] [CrossRef]
  36. Proietti, S.; Moscatello, S.; Giacomelli, G.A.; Battistelli, A. Influence of the interaction between light intensity and CO2 concentration on productivity and quality of spinach (Spinacia oleracea L.) grown in fully controlled environment. Adv. Space Res. 2013, 52, 1193–1200. [Google Scholar] [CrossRef]
  37. Quick, W.P.; Chaves, M.M.; Wendler, R.; David, M.; Rodriguez, M.L.; Passaharinho, J.A.; Pereira, J.S.; Adcock, M.D.; Leegood, R.C.; Stitt, M. The effect of water stress on photosynthetic carbon metabolism in four species grown under field conditions. Plant Cell Environ. 1992, 15, 25–35. [Google Scholar] [CrossRef]
  38. Cutler, J.M.; Rains, D.W. Effects of Water Stress and Hardening on the Internal Water Relations and Osmotic Constituents of Cotton Leaves. Physiol. Plant. 1978, 42, 261–268. [Google Scholar] [CrossRef]
  39. Raschke, K. Stomatal Action. Annu. Rev. Plant Physiol. 1975, 26, 309–340. [Google Scholar] [CrossRef]
  40. Lester, G.E.; Makus, D.J.; Hodges, D.M.; Jifon, J.L. Summer (subarctic) versus winter (subtropic) production affects spinach (Spinacia oleracea L.) leaf bionutrients: Vitamins (C, E, folate, K1, provitamin A), lutein, phenolics, and antioxidants. J. Agric. Food Chem. 2013, 61, 7019–7027. [Google Scholar] [CrossRef] [PubMed]
  41. Da Silva, E.C.; Nogueira, R.J.M.C.; Silva, M.; Albuquerque, M. Drought Stress and Plant Nutrition. Plant Stress 2010, 5, 32–41. [Google Scholar]
  42. Abdel Rahman, A.A.; Shalaby, A.F.; El Monayeri, M.O. Effect of moisture stress on metabolic products and ions accumulation. Plant Soil 1971, 34, 65–90. [Google Scholar] [CrossRef]
  43. Sørensen, J.N.; Jørgensen, U.; Kühn, B.F. Drought Effects on the Marketable and Nutritional Quality of Carrots. J. Sci. Food Agric. 1997, 74, 379–391. [Google Scholar] [CrossRef]
  44. Dubey, R.S.; Pessarakli, M. Physiological mechanisms of nitrogen absorption and assimilation in plants under stressful conditions. In Handbook of Plant and Crop Physiology, 2nd ed.; Pessarakli, M., Ed.; Dekker: New York, NY, USA, 2002; pp. 637–655. ISBN 0-8247-0546-7. [Google Scholar]
  45. Morilla, C.A.; Boyer, J.S.; Hageman, R.H. Nitrate reductase activity and polyribosomal content of corn (Zea mays L.) having low leaf water potentials. Plant Physiol. 1973, 51, 817. [Google Scholar] [CrossRef] [Green Version]
  46. Qiu, W.; Wang, Z.; Huang, C.; Chen, B.; Yang, R. Nitrate accumulation in leafy vegetables and its relationship with water. J. Soil Sci. Plant Nutr. 2014, 14, 761–768. [Google Scholar] [CrossRef]
  47. Ćustić, M.; Poljak, M.; Čoga, L.; Ćosić, T.; Toth, N.; Pecina, M. The influence of organic and mineral fertilization on nutrient status, nitrate accumulation, and yield of head chicory. Plant Soil Environ. 2003, 49, 218–222. [Google Scholar] [CrossRef]
  48. Anjana, S.U.; Iqbal, M. Nitrate accumulation in plants, factors affecting the process, and human health implications. A review. Agron. Sustain. Dev. 2007, 27, 45–57. [Google Scholar] [CrossRef]
  49. Santamaria, P.; Gonnella, M.; Elia, A.; Parente, A.; Serio, F. Ways if reducing rocket salad nitrate content. Acta Hortic. 2001, 529–536. [Google Scholar] [CrossRef]
  50. Proietti, S.; Moscatello, S.; Colla, G.; Battistelli, Y. The effect of growing spinach (Spinacia oleracea L.) at two light intensities on the amounts of oxalate, ascorbate and nitrate in their leaves. J. Hortic. Sci. Biotech. 2004, 79, 606–609. [Google Scholar] [CrossRef]
  51. He, M.; Dijkstra, F.A. Drought effect on plant nitrogen and phosphorus: A meta-analysis. New Phytol. 2014, 204, 924–931. [Google Scholar] [CrossRef] [PubMed]
  52. Rouphael, Y.; Cardarelli, M.; Schwarz, D.; Franken, P.; Colla, G. Effects of Drought on Nutrient Uptake and Assimilation in Vegetable Crops. In Plant Responses to Drought Stress: From Morphological to Molecular Features; Aroca, R., Ed.; Springer: Berlin/Heidelberg, Germany, 2012; pp. 171–195. ISBN 978-3-642-32653-0. [Google Scholar]
  53. Junjittakarn, J.; Pimratch, S.; Jogloy, S.; Htoon, W.; Singkham, N.; Vorasoot, N.; Toomsan, B.; Holbrook, C.C.; Patanothai, A. Nutrient uptake of peanut genotypes under different water regimes. IJPP 2013, 7, 677–692. [Google Scholar] [CrossRef]
  54. Ashraf, M.; Shahbaz, M.; Qasim, A. Drought-induced modulation in growth and mineral nutrients of canola (Brassica napus L.). Pak. J. Bot. 2013, 45, 93–98. [Google Scholar]
  55. Utrillas, M.J.; Alegre, L.; Simon, E. Seasonal changes in production and nutrient content of Cynodon dactylon (L.) Pers. subjected to water deficits. Plant Soil 1995, 175, 153–157. [Google Scholar] [CrossRef]
  56. Sánchez-Rodríguez, E.; del Mar Rubio-Wilhelmi, M.; Cervilla, L.M.; Blasco, B.; Rios, J.J.; Leyva, R.; Romero, L.; Ruiz, J.M. Study of the ionome and uptake fluxes in cherry tomato plants under moderate water stress conditions. Plant Soil 2010, 335, 339–347. [Google Scholar] [CrossRef]
  57. Hu, Y.; Schmidhalter, U. Drought and salinity: A comparison of their effects on mineral nutrition of plants. J. Plant Nutr. Soil Sci. 2005, 168, 541–549. [Google Scholar] [CrossRef]
  58. Maathuis, F.J.M. Physiological functions of mineral macronutrients. Curr. Opin. Plant Biol. 2009, 12, 250–258. [Google Scholar] [CrossRef]
  59. McLaughlin, S.B.; Wimmer, R. Tansley Review No. 104 Calcium physiology and terrestrial ecosystem processes. New Phytol. 1999, 142, 373–417. [Google Scholar] [CrossRef]
  60. Pulupol, L.U.; Behboudian, M.H.; Fisher, K.J. Growth, Yield, and Postharvest Attributes of Glasshouse Tomatoes Produced under Deficit Irrigation. HortScience 1996, 31, 926–929. [Google Scholar] [CrossRef] [Green Version]
  61. Hertog, M.G.L.; Hollman, P.C.H.; Katan, M.B. Content of potentially anticarcinogenic flavonoids of 28 vegetables and 9 fruits commonly consumed in the Netherlands. J. Agric. Food Chem. 1992, 40, 2379–2383. [Google Scholar] [CrossRef]
  62. Schmidt, S.; Zietz, M.; Schreiner, M.; Rohn, S.; Kroh, L.W.; Krumbein, A. Genotypic and climatic influences on the concentration and composition of flavonoids in kale (Brassica oleracea var. sabellica). Food Chem. 2010, 119, 1293–1299. [Google Scholar] [CrossRef]
  63. Aritomi, M.; Komori, T.; Kawasaki, T. Flavonol glycosides in leaves of Spinacia oleracea. Phytochemistry 1985, 25, 231–234. [Google Scholar] [CrossRef]
Figure 1. Principal Component Analysis (PCA) of the original, plot-adjusted dataset including all spinach years from 2015 (red circles), 2016 (green triangles) and 2017 (blue squares). Score plot represents the individual samples of each cultivation set (separated by color) and plot (marked by the letters A, C, F, H, M and P) based on dry biomass-related data.
Horticulturae 06 00025 g001
Figure 2. Multivariate evaluation by PCA (PC1 + PC2) of the total spinach dataset including all years (2015, 2016 and 2017) based on dry biomass-data. Score plot (A) represents all individual plot samples (marked by the letters A, C, F, H, M and P) classified according to the control (CTR, blue circles) and reduced water supply (RWS, red triangles). The corresponding loading plot (B) shows the related variables determined by the chemical analyses.
Horticulturae 06 00025 g002
Figure 3. Multivariate evaluation by PCA (PC1 + PC2) of the total spinach dataset including all years (2015, 2016 and 2017) based on fresh biomass-data. Score plot (A) represents all individual plot samples (marked by the letters A, C, F, H, M and P) classified according to the control (CTR, blue circles) and reduced water supply (RWS, red triangles). The corresponding loading plot (B) shows the related variables, i.e., contents of constituents as determined by the chemical analyses.
Horticulturae 06 00025 g003
Table 1. Cultivation and climate data of the spinach years during the different experimental periods. DAS: days after sowing. Irrigation (mm): Total irrigation amount including irrigation during initial stage. Total water amount (%) RWS: water amount (%) of the reduced variants including watering after sowing.
Growing Season201520162017
Sowing date (Year-month-day)2015-09-072016-04-192017-04-20
Beginning of water supply differentiation (DAS)232326
Harvest date (DAS)514439
Temperature sum (°C) 626.0593.2549.8
Daily mean air temperature (°C)12.013.213.8
Mean relative air humidity (%)78.868.767.8
Global irradiation sum (MJ/m2)453.5799.9756.9
Daily mean global irradiation (MJ/m2)8.717.818.9
Wind speed sum (m/s) at height of 2 m46.069.350.8
Evapotranspiration sum (mm) z68.7126.9126.6
Precipitation sum (mm)6510168
Number of differentiated irrigation events452
Total irrigation (mm) y399545
Total water amount (mm) incl. precipitation104184113
Total water amount of RWS (% of CTR)90%94%96%
z Reference evapotranspiration (ETo) using grass and the FAO56 Penman–Monteith method. y Includes irrigation during the treatment period (6.2 L/m2 x irrigation events) and the irrigation during initial growth stages.
Table 2. Influence of reduced water supply on the dry biomass (DM)-related levels of constituents of spinach leaves from different years (2015, 2016 and 2017). Linear mixed model, t-test, p-values: < 0.1, < 0.05 (*), < 0.01 (**) and < 0.001 (***); nd = not determined, CTR: Control treatment with full water supply, RWS: Reduced water supply treatment.
Spinach 2015Spinach 2016Spinach 2017Spinach Total
CTRRWSp-ValueCTRRWSp-ValueCTRRWSp-ValueCTRRWSp-Value
Leaf water potential Ψ (-MPa)ndndnd0.140.180.11360.070.0930.0842ndndnd
Dry biomass (%)8.548.600.61865.405.480.67366.136.830.0032 **6.696.970.0216 *
Sugars and Polyols (mg/g)
Glucose 56.7159.550.334272.9262.700.152150.9257.260.390260.1859.840.9207
Fructose 43.3543.590.907337.5830.940.072127.7029.410.602836.2134.650.3965
Polyols total 5.915.910.95653.874.090.0302 *4.964.910.43314.914.970.2929
Inositol 1.661.680.34610.991.060.08301.481.540.16471.381.420.0119 *
Glycerol 2.562.580.37241.671.700.22362.312.280.39842.182.190.7136
Polyol unknown 1.371.380.73430.710.790.05300.670.610.12240.910.930.5387
Erythritol 0.330.280.51100.510.550.22180.500.470.26760.440.430.6779
Organic acids (mg/g)
Oxalic acid 49.8944.510.086362.5662.561.000053.7052.460.873455.3853.180.4438
Total acidity 16.7318.730.127017.2015.710.545216.8718.260.251416.9317.570.5028
Malic acid 12.8112.630.789622.0818.470.0103 *14.0813.310.620616.3314.800.0389 *
Ascorbic acid 9.419.900.0493 *4.424.840.46426.856.700.70876.897.150.2866
Citric acid 6.196.140.88493.183.150.86472.943.400.12194.114.230.4872
Fumaric acid 0.610.570.07612.261.690.15301.301.110.50261.391.120.0803
Anions (mg/g)
Nitrate 8.577.730.229128.1628.600.537312.9812.530.816916.5716.290.6854
Phosphate 13.6511.080.0377 *16.6917.130.191313.1212.440.299514.4913.550.0594
Sulfate 3.442.640.0192 *7.736.560.09103.303.880.10404.824.360.1151
Chloride 5.384.950.12687.285.830.06928.617.980.14307.096.250.0053 **
Elements (mg/g)
Carbon 381.17380.380.7578360.43356.700.3442359.68362.830.3491367.09366.640.8316
Macronutrients
Potassium 78.2781.380.0297 *87.8885.600.254090.6889.890.735485.6185.620.9932
Nitrogen 50.9251.640.068238.9838.070.704242.4741.910.708844.1243.870.7769
Phosphorous 5.595.930.05965.585.720.40965.225.000.12055.465.550.3650
Calcium 11.6910.850.155314.7814.940.840014.0313.780.726813.5013.190.4079
Magnesium 7.777.220.0196 *6.206.290.72547.577.450.77847.186.990.2684
Micronutrients (µg/g)
Iron 323.89273.680.2516300.40406.830.0586348.97336.950.6028324.42339.150.5711
Zinc 73.6380.850.0234 *127.00142.330.0245 *101.87111.030.0458 *100.83111.400.0001 ***
Manganese 60.9358.300.154985.46100.410.0039 **76.3181.830.071174.2380.180.0138 *
Copper 15.2115.750.824012.9213.700.0112 *13.7012.640.212113.9414.030.9141
Phenolic compounds (mg/g)
Total phenols 10.3110.090.456511.2611.800.363011.4211.380.929411.0011.080.7317
Flavonoids 9.9110.080.94909.9110.560.19199.8210.160.488610.089.8810.27
Carotenoids (mg/g)
Violaxanthin 1.131.180.10670.820.840.52671.781.710.59541.241.240.9793
Neoxanthin 0.380.390.11060.270.260.38370.650.640.85150.430.430.8136
Lutein 1.351.390.14310.940.900.63992.532.540.94921.611.610.9091
ß-Carotin 1.001.040.05580.910.950.34292.052.090.70921.321.360.2836
9-cis-ß-Carotin 0.110.120.07560.0970.1020.20310.2480.2500.90310.150.160.3772
Total carotenoids 3.984.110.09723.033.050.86777.257.220.95874.754.800.7542
Table 3. Influence of reduced water supply on the fresh biomass (FM)-related levels of constituents of spinach leaves from different years (2015, 2016 and 2017). Linear mixed model, t-test, p-values: < 0.1, < 0.05 (*), < 0.01 (**) and < 0.001 (***); nd = not determined, CTR: Control treatment with full water supply, RWS: Reduced water supply treatment.
Spinach 2015Spinach 2016Spinach 2017Spinach Total
CTRRWSp-ValueCTRRWSp-ValueCTRRWSp-ValueCTRRWSp-Value
Leaf water potential Ψ (-MPa)ndndnd0.140.180.11360.070.0930.0842ndndnd
Dry biomass (%)8.548.600.61865.405.480.68246.136.830.0032 **6.696.970.0216 *
Sugars and Polyols (mg/100 g)
Glucose 536.71563.580.3345402.68346.220.1522318.31357.980.3903345.00372.500.4335
Fructose 410.34412.520.9085207.51170.870.0721173.19183.830.6033223.89240.560.3937
Polyols total 49.8349.990.877720.6623.290.0065 **32.8134.800.0408 *34.4336.030.0048 **
Inositol 14.1614.290.52325.266.020.0127 *9.0910.530.0170 *9.5010.280.0013 **
Glycerol 21.7321.970.52878.919.670.0022 **14.1615.560.0115 *14.9315.730.0013 **
Polyol unknown 11.6311.760.71033.784.480.0088 **4.094.220.57826.506.820.0476 *
Erythritol 2.321.960.47042.723.120.08095.464.490.0264 *3.503.190.2038
Organic acids (mg/100 g)
Oxalic acid 472.07421.230.0863345.47345.471.0000335.73327.990.8732384.42364.900.3067
Total acidity 158.32177.210.127194.9786.740.5455105.46114.170.2515119.58126.040.3662
Malic acid 121.21119.540.7926121.93101.960.0103 *88.0583.210.6203110.39101.570.0528
Ascorbic acid 80.4985.300.056823.6227.500.274541.9646.020.182248.6952.940.0093 **
Citric acid 58.6158.100.888017.5717.420.877118.3921.290.121931.5232.270.5873
Fumaric acid 5.725.120.120211.919.480.26847.817.620.91698.487.410.2225
Anions (mg/100 g)
Nitrate 72.0865.800.2778150.48162.490.0238 *79.1784.780.6029100.58104.350.4025
Phosphate 115.9795.260.0421 *88.9297.020.0027 **80.2584.770.320195.0492.350.5248
Sulfate 29.1222.640.0189 *41.2837.070.223420.1826.390.0371 *30.2028.700.4426
Chloride 46.1343.020.180039.0032.690.155652.8254.480.651545.9843.400.1913
Elements (mg/100 g)
Carbon 3.263.280.81511.941.950.90712.202.480.0105 *2.472.570.0687
Macronutrients
Potassium 662.16694.890.0185 *468.56485.030.1523555.12613.090.0103 *561.95597.670.0002 ***
Nitrogen 407.22410.140.7606176.17202.640.0065 **238.58262.420.0097 **273.99291.730.0013 **
Phosphorous 47.6550.960.098429.7732.390.0135 *31.9434.090.0297 *36.4539.150.0004 ***
Calcium 99.7693.890.186079.1384.880.244186.1294.280.115288.3491.020.3357
Magnesium 66.7162.630.0117 *33.1635.670.115646.4850.920.176048.7849.740.4889
Micronutrients (mg/100 g)
Iron 2.752.340.27681.602.310.0314 *2.142.300.28562.162.310.4017
Zinc (µg/100 g)632.02699.590.0021 **678.36807.780.0030 **625.07760.620.0064 **645.15756.000.0001 ***
Manganese (µg/100 g)519.79501.320.2620456.93568.910.0009 ***467.35558.300.0112 *481.35542.840.0022 **
Copper (µg/100 g)128.94135.430.766568.9677.630.0004 ***84.0286.300.688393.9799.790.4075
Phenolic compounds (mg/100 g)
Total phenols 88.0086.230.417260.7864.930.438870.0977.850.135472.9576.340.1695
Flavonoids 86.5286.930.860754.4559.170.319262.8173.400.0495 *67.9373.170.0308 *
Carotenoids (mg/100 g)
Violaxanthin 9.6610.050.18355.135.990.0462 *11.1512.090.37748.659.380.0439 *
Neoxanthin 3.183.280.18261.701.860.12314.074.550.14842.983.230.0289 *
Lutein 11.5211.870.25745.836.390.292015.9118.000.155311.0912.090.0474 *
ß-Carotene 8.548.880.11665.686.730.0311 *12.8514.810.10229.0210.140.0074 **
9-cis-ß-Carotene 0.981.000.49620.600.710.0123 *1.551.770.11281.041.160.0138 *
Total carotenoids 33.8835.070.186618.9421.680.068045.5351.210.172832.7835.990.0233 *

