Article

Analyzing the Export Performance of the Horticultural Sub-Sector in Ethiopia: ARDL Bound Test Cointegration Analysis

1
Department of Agricultural Economics, Faculty of Agriculture, Akdeniz University, Antalya 07070, Turkey
2
Department of Agricultural, Food and Resource Economics, School of Environmental and Biological Sciences, Rutgers-The State University of New Jersey, New Brunswick, NJ 07102, USA
*
Author to whom correspondence should be addressed.
Horticulturae 2018, 4(4), 34; https://doi.org/10.3390/horticulturae4040034
Submission received: 28 August 2018 / Revised: 7 October 2018 / Accepted: 12 October 2018 / Published: 16 October 2018
(This article belongs to the Special Issue Marketing Strategies of the Horticultural Production Chain)

Abstract

:
High dependency on traditional primary agricultural commodities and recurrent world market price fluctuations had exposed Ethiopia to foreign earnings instability. To reduce the high dependence on primary agricultural commodities and the associated vulnerability of negative price declines, diversification of trade from primary agricultural commodities into high-value horticultural commodities has attracted the attention of policy makers. The developments made in this area have brought the sector to the position of fifth largest foreign revenue generator for the country. However, given the comparative advantage in marketing and the potential to achieve trade gains that the country possesses, the benefit from the horticultural sub-sector is far below its potential. In this regard, knowledge of the determinants of the industry’s development is very important. So far, no attempt was made to examine factors influencing the export performance of the sector, taking the long period performance of the sector into consideration. Consequently, this study was proposed to examine the factors that have influenced the horticultural export performance of Ethiopia for the period from 1985–2016. Secondary data collected from National Bank of Ethiopia, Ethiopia Horticulture Producer Exporter Association, Ministry of Agriculture of Ethiopia, FAOSTAT, UNCTAD, and the World Bank were used in this study. The short-run and long-run relationships among the series were investigated using the autoregressive-distributed lag (ARDL) bound test cointegration approach. The model result of the Error Correction Model (ECM (-1)) was revealed as negative and significant, whereby it confirmed the existence of cointegration among the series. Its coefficient value was 0.472, which showed 47% of the adjustment will be made in the first year and it will return to its long-run equilibrium after 2.12 years. The model results also showed that the real effective exchange rate, the real GDP of Ethiopia, foreign direct investment (FDI), prices, and the structural break had significantly influenced the horticultural export performance both in the short-run and the long-run. Foreign GDP and real interest rates were revealed significant only in the long-run. Finally, important policy measures deemed to improve the horticultural export performance of Ethiopia were recommended.

1. Introduction

Developing countries are highly dependent on export earnings to satisfy their import requirements and for the development of their economy [1,2]. Consequently, instability of such proceeds will significantly influence output by constraining input and production planning. Furthermore, fluctuations in quantity and price of exports could create a serious problem in balance-of-payments, national income, investment, as well as the overall growth of less developed countries [2]. Susceptibility to this problem is high in SSA (Sub-Saharan African) countries as their international trades are mainly based on exporting primary agricultural commodities, whey they possess comparative advantages due to cheap labor [3].
Similarly, in Ethiopia, the export structure is highly concentrated to a few traditional agricultural commodities, such as coffee, hides, skins, oilseeds, and pulses. Over a long period of time, coffee was the dominant export earning commodity, followed by non-coffee commodities such as hides, skins, oilseeds, pulses, and chat. Over two-thirds of the export earnings were obtained from the export of these few commodities [4]. However, since the mid-1990s, the relative importance of these commodities, particularly coffee, in total export revenue has declined drastically. Coffee’s contribution to export earnings declined to 45% in 2003, from a high of 70% in the mid-1990s, due to the high volatility of coffee prices. This would have a detrimental effect on the economic planning and economic development of the country. From this, it can be understood that export earnings instability was one of the chronic economic problems facing Ethiopia. Since the 1970s, many other Less Developed Countries (LDC) have also experienced strong volatility and declines in the international prices of their primary commodities exports [5]. Therefore, high dependence on a few agricultural export commodities added with the high volatility of prices left the countries’ export earnings extremely vulnerable.
In countries like Ethiopia, that mainly depend on primary agricultural commodities for their export earnings, vertical diversification through establishing agricultural processing industries which produce value-added quality export products is difficult. However, diversification horizontally into the export of non-traditional high-value agricultural commodities was one of the possible ways to reduce over-reliance on a few low-value traditional products and tackle the problem of export income instability.
Consequently, due to the declining export earnings from traditional exports, horticulture and other non-traditional, high-value, agricultural export expansions represent an important area of potential income growth [5]. In this regard, Ethiopia was considered to have the potential to achieve trade gains in these sub-sectors [6]. This is because Ethiopia has diverse agro-ecological zones that can easily fit the production of different agricultural export commodities, with minimum adjustment to the existing production systems [1,7]. As a result, promoting the production and export of horticultural products (fruits, vegetables, and flowers) has caught the attention of the federal government of Ethiopia. These high-value and labor-intensive cash crops can contribute to the fast and successful diversification of the export base towards non-traditional agricultural commodities to attain export earnings stability.
Production of horticultural products is a new sector in Ethiopia, as the production of these crops has been undertaken for decades. The sector comprises of large state farms supplying fruits and vegetables to the local market and for export [8]. Fruit and vegetable crops with a significant potential for domestic consumption, export markets, and industrial processing are produced in the country [6]. In this regard, the Ethiopian government, sector organizations, and donors have played a great role to identify potential for the further development of the fruits and vegetable sector in Ethiopia, both for the domestic and export market [8].
The export destination of Ethiopia’s fruits and vegetables are mostly neighboring countries like Djibouti, Sudan, and Somalia. High-value fresh vegetables were exported to the United Kingdom, the United Arab Emirates, and the Netherlands, which may create an opportunity for the improvement of the fruit and vegetable sectors in the country [6]. According to statistics in Reference [9], in 2004/2005, export income generated from the subsector was 28.55 million USD. In 2015/16, the sector provided employment opportunities for approximately 183,000 persons and generated earnings of about 274.62 million USD, making the sector the fifth largest foreign revenue generator for the country.
Given Ethiopia’s endowment of natural resources and other competitive advantages, the export performance was still low despite the existence of blooming prospects for the development of the sub-sector. Consequently, although export diversification through horticultural produce was advocated as an alternative export promotion strategy, the performance of this sector has been generally unsatisfactory. In this regard, knowledge of the determinants of industry’s development has paramount importance. However, so far different empirical works [2,3,10,11,12,13,14,15] have mostly emphasized the export performance of traditional export commodities, with less consideration on examining the factors affecting the export performance of the horticulture sub-sector. Some others had tried to describe [4,16] and analyze the production and marketing aspects [1] of the sector in a limited part of the country. Effective policy intervention to promote the performance of this potential and promising sub-sector needs knowledge of the determinants of the industry’s development. Consequently, the objective of this study was to assess factors affecting the export performance of the Ethiopian horticulture sub-sector, which in turn will enable the sector to be competitive in the global horticulture market and stabilize export earnings of the country.

2. The Ethiopia’s Horticulture Export Share

Ethiopia’s economy heavily depends on agriculture leading to the structure of Ethiopian exports to be dominated by agricultural products for a long period of time. Consequently, Ethiopia’s external trade was characterized by high sectoral (agriculture) and commodity concentration (coffee) dependence. This is clearly seen in Table 1, where the contribution of coffee to foreign earnings played a great role. There were limited attempts to diversify both the commodity concentration and high geographic concentration. Such commodity and geographic concentration were the major causes for the instability of Less Developed Countries’ (LDC’s) export earnings to which Ethiopia is not an exception. The vulnerability to external shocks was exacerbated by recurrent weather changes, swinging the export value and volume. Consequently, diversification of both commodities and markets for the country are an urgent issue. With regards to commodity diversification, the horticultural sub-sector had recently attracted the attention of policy makers, and had been performing well. In this regard, the export performance of horticulture, on average, nearly accounted for 258.44 million USD over the last five to six years [17]. This had propelled the sub-sector to be the fifth most important generator of foreign earnings [7].

3. Literature Review

Analyzing the export performance of the horticultural sub-sector, with a special focus on the determinants of horticultural exports, had attracted the attention of both policymakers and researchers in different parts of the world, particularly in developing countries. This is because the export of horticultural products provides a good opportunity to diversify the export base of many developing countries, which are mainly dependent on exports of tea, coffee, and cocoa [18]. This, in turn, will reduce dependence on a narrow range of primary products by developing countries.
The prospects for export diversification in Ethiopia were assessed empirically to investigate the main determinants of the country’s exports (dominated by traditional commodities). Using the Error Correction Model (ECM), the estimation of the export determination model revealed that the real exchange rate was the significant determinant of the country’s exports in the long-run [1]. The findings of this study were inconsistent with the results of Reference [11]. However, the work of many researchers in different part of the world had confirmed that the real exchange rate was among the most important determinants of export performance [3,18,19,20,21,22,23,24]. In addition, the study by Reference [10] had also stressed the existence of promising opportunities for export diversification in the country. References [3] and [11] had also stressed the need and importance for diversifying the export base of the country and breaking away from the export of traditional agricultural commodities.
The study by Reference [2] analyzed Ethiopia’s export earnings instability by employing country-specific models, taking advantage of a sufficiently large sample period from 1962 to 2008. The study tried to identify the contributions of major traditional agricultural export commodities, such as coffee, hides, skins, oilseeds, and pulses. Attempts have also been made to make comparisons between the sub-periods of the Imperial, Derg, and Post-Derg periods, since these sub-periods experienced distinct trade and foreign policies. The study finds that the Post-Derg period was characterized by a higher level of instability and diversification of exports. This calls for the reconsideration of the direction of the diversification policy towards commodities that are negatively correlated with the traditional export commodities of the country.
The study by Reference [11] examined the performance and trend of merchandise (and manufacturing) exports, and its determinants during the period from 1981–2008 in Ethiopia. The findings of the study indicated that merchandise export volumes were significantly influenced by gross capital formation (proxy for production capacity) and share of trade in GDP (proxy for trade liberalization). In addition, manufacturing exports supply was found to be negatively and significantly affected by foreign income and positively affected by gross capital formation. The impact of foreign income was also revealed as negative in References [21,25]. However, many empirical works had obtained a positive impact of trading partners’ income on the export performance of the exporting country [20,26,27].
Using cross-sectional data, Reference [16] also described the export performance of fruit and vegetable exporters and found that the sector was in its infancy and there was much to be done to increase gains from the sector. Ethiopian fruit and vegetable exporters were challenged by the lack of managerial and technical skills, and lack of commitment by employees, respectively. Externally, fruit and vegetable exporters were hindered by lack of credit facilities, supply of inputs, followed by lack of infrastructure. Finally, it was recommended that policymakers should design different schemes to enhance export performance, especially of fruits and vegetables. However, for the effectiveness of policy measures, an empirical work on the factors affecting the export performance of sub-sectors is still missing.
In the empirical work, Reference [18] analyzed the export performance of the horticultural sub-sector in Kenya. The findings of the study indicated that agricultural GDP and real interest rates were the important factors that influenced horticultural exports from Kenya. Agricultural GDP had a positive influence on Kenyan horticultural exports, whilst real interest rates had a negative influence on horticultural exports. The implication of the findings were that since real interest rates had a negative relationship with horticultural exports, an increase in real interest rates would lead to a decrease in Kenya’s horticultural exports by increasing the cost of borrowing. In addition, it was emphasized that the significance of the cost of borrowing in influencing horticultural exports can be attributed to the fact that the horticultural sub-sector is relatively more capital intensive, compared to other agricultural sub-sectors. A significant amount of capital is required to set up greenhouses, cooling facilities, pack houses, irrigation systems, as well as the purchase of fertilizers, agrochemicals, and other inputs. The result was consistent with the findings of Reference [28], wherein real interest rates were found to have a significant impact on the volume of cotton exports.
Using the cointegration test, Reference [28] examined factors that affected tobacco and cotton exports in Zambia. The results of the study revealed that the factors that affected the growth of exports were crop specific. For instance, foreign direct investment had a significant impact on the volume of tobacco exports, both in the short-run and long-run, though tobacco exports were more responsive to movements in this factor in the long-run, than in the short-run. Consequently, policy measures like scaling up incentives in the form of tax holidays, should be taken to attract foreign direct investment. This result was consistent with References [21,25]. Furthermore, Reference [29] stated that the impact of foreign direct investment (FDI) depends on its motive, whereby export-oriented FDI will promote the export performance of the exported commodities. In addition, the uni-directional Granger causality of agricultural exports to the share of agricultural gross domestic product for both tobacco and cotton in Zambia, implied that the two sectors should be prioritized in terms of increased budgetary allocations, which will raise agricultural GDP and drive the economy towards export diversification [28].

4. Econometric Method

4.1. Description of Data

The study used time series data from References [9,17,30]. Data on real exchange rates, foreign direct investment, real GDP of Ethiopia, real GDP of trading partners, price, and real interest rates were obtained from References [27], whilst data on horticultural exports was obtained from References [9,17]. These data were analyzed using Eviews Version 9.0 (IHS Global Inc., Englewood, CO, USA).

4.2. Cointegration Test

Cointegration is a powerful way of detecting the presence of long-run relationships or steady-state equilibrium between variables [31]. Different cointegration techniques were developed to determine the long-run relationships between the time series [32,33,34]. In all these cointegration techniques, the most important restriction is that all the series must be of the same ordered integrations. However, a recently developed cointegration approach, namely the autoregressive-distributed lag (ARDL), also known as the bounds test, eliminates this restriction [35]. The ARDL approach allows the regressors to be stationary in levels (I (0)) or the first-differenced (I (1)). Owing to this convenience, the ARDL method has been used in many empirical works, and it was also used to obtain the long-run relationship among the series in this study. The long-run ARDL equation was specified as follows:
ln exp t = β 0 + i = 0 m β 1 i ln exp t 1 i + i = 0 n β 2 i ln E R t i + i = 0 o β 3 i ln R D G P t i + i = 0 p β 4 i ln F D I t i i = 0 q β 5 i ln F G D P t i + i = 0 r β 6 i ln Pr i c e t i + i = 0 r β 8 i ln R I R t i + ω D U t ( T b ) + ε t
where exp: represents horticultural exports, FDI: foreign direct investment, ER: real effective exchange rate, RGDP: real GDP of Ethiopia, FGDP: foreign GDP, Price: world average price of fresh fruits and vegetables, DUt: Dummy variable representing the Structural break (Tb (break year) = 2005 in this case), and RIR: real interest rate.
The F-test was employed to test co-integration among the variables, where the null hypothesis that the betas were jointly equal to zero (i.e., β 1 = β 2 = β 3 = β 4 = β 5 = β 6 = β 7 = β 8 = 0 ) was tested. Reference [32] provided critical F-values; one for the lower bound and the other for the upper bound, for testing whether there was co-integration. If the computed F-value was less than the F-value for the lower bound, then the null hypothesis cannot be rejected. If the computed F-value exceeded the F-value for the upper bound, then the null hypothesis of no co-integration was rejected, otherwise the test was inconclusive.
To select the lag values m, n, o, p, q, and r in Equation (1), model selection criteria, such as AIC, SIC, Hannan-Quinn information criteria, Adjusted R-squared were used. The short-run dynamics of the variables was described by employing the Error Correction Model (ECM) [24]. The ECM representation was specified as follows:
Δ ln exp = α 0 + i = 0 m λ i Δ ln exp t 1 i + i = 0 0 φ i Δ ln E R t i + i = 0 n θ i Δ ln R G D P t i + i = 0 n γ i Δ ln F D I t i + i = 0 p ψ i Δ ln F G D P t i + i = 0 q η i Δ ln R I R t i + Δ Pr i c e t i + ω Δ D U t ( T b ) + λ E C M t 1 + ε t
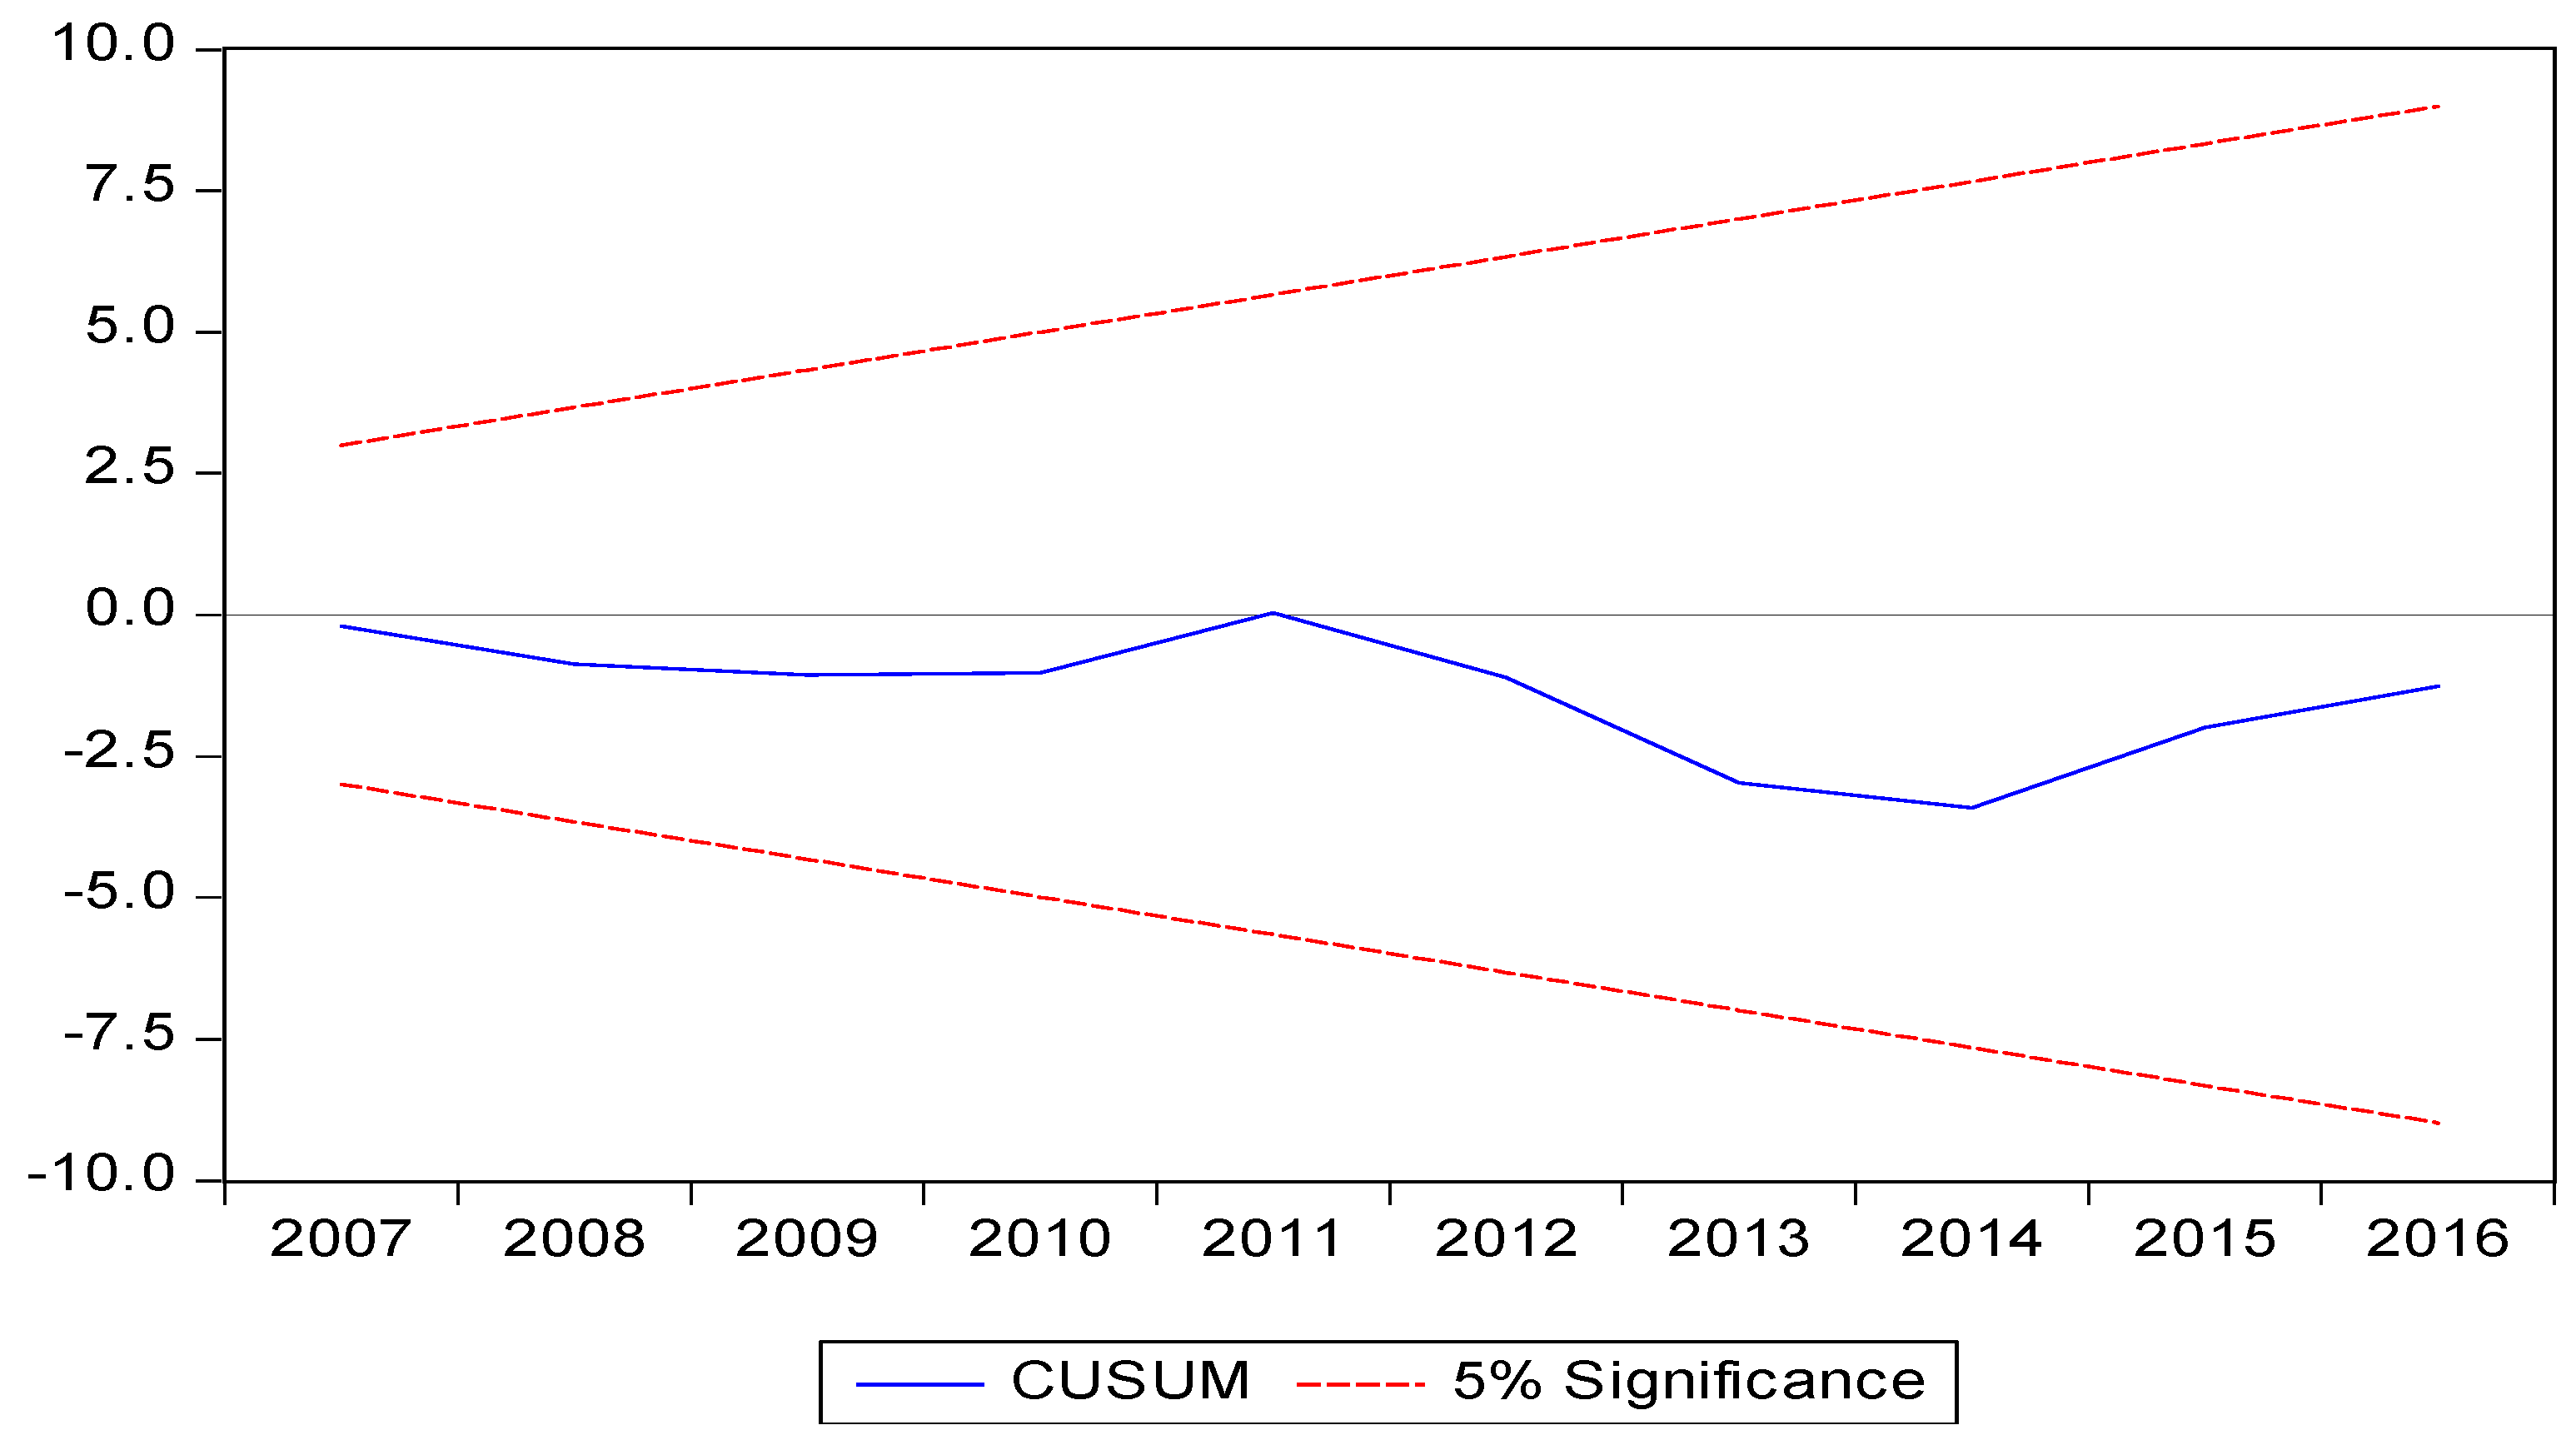
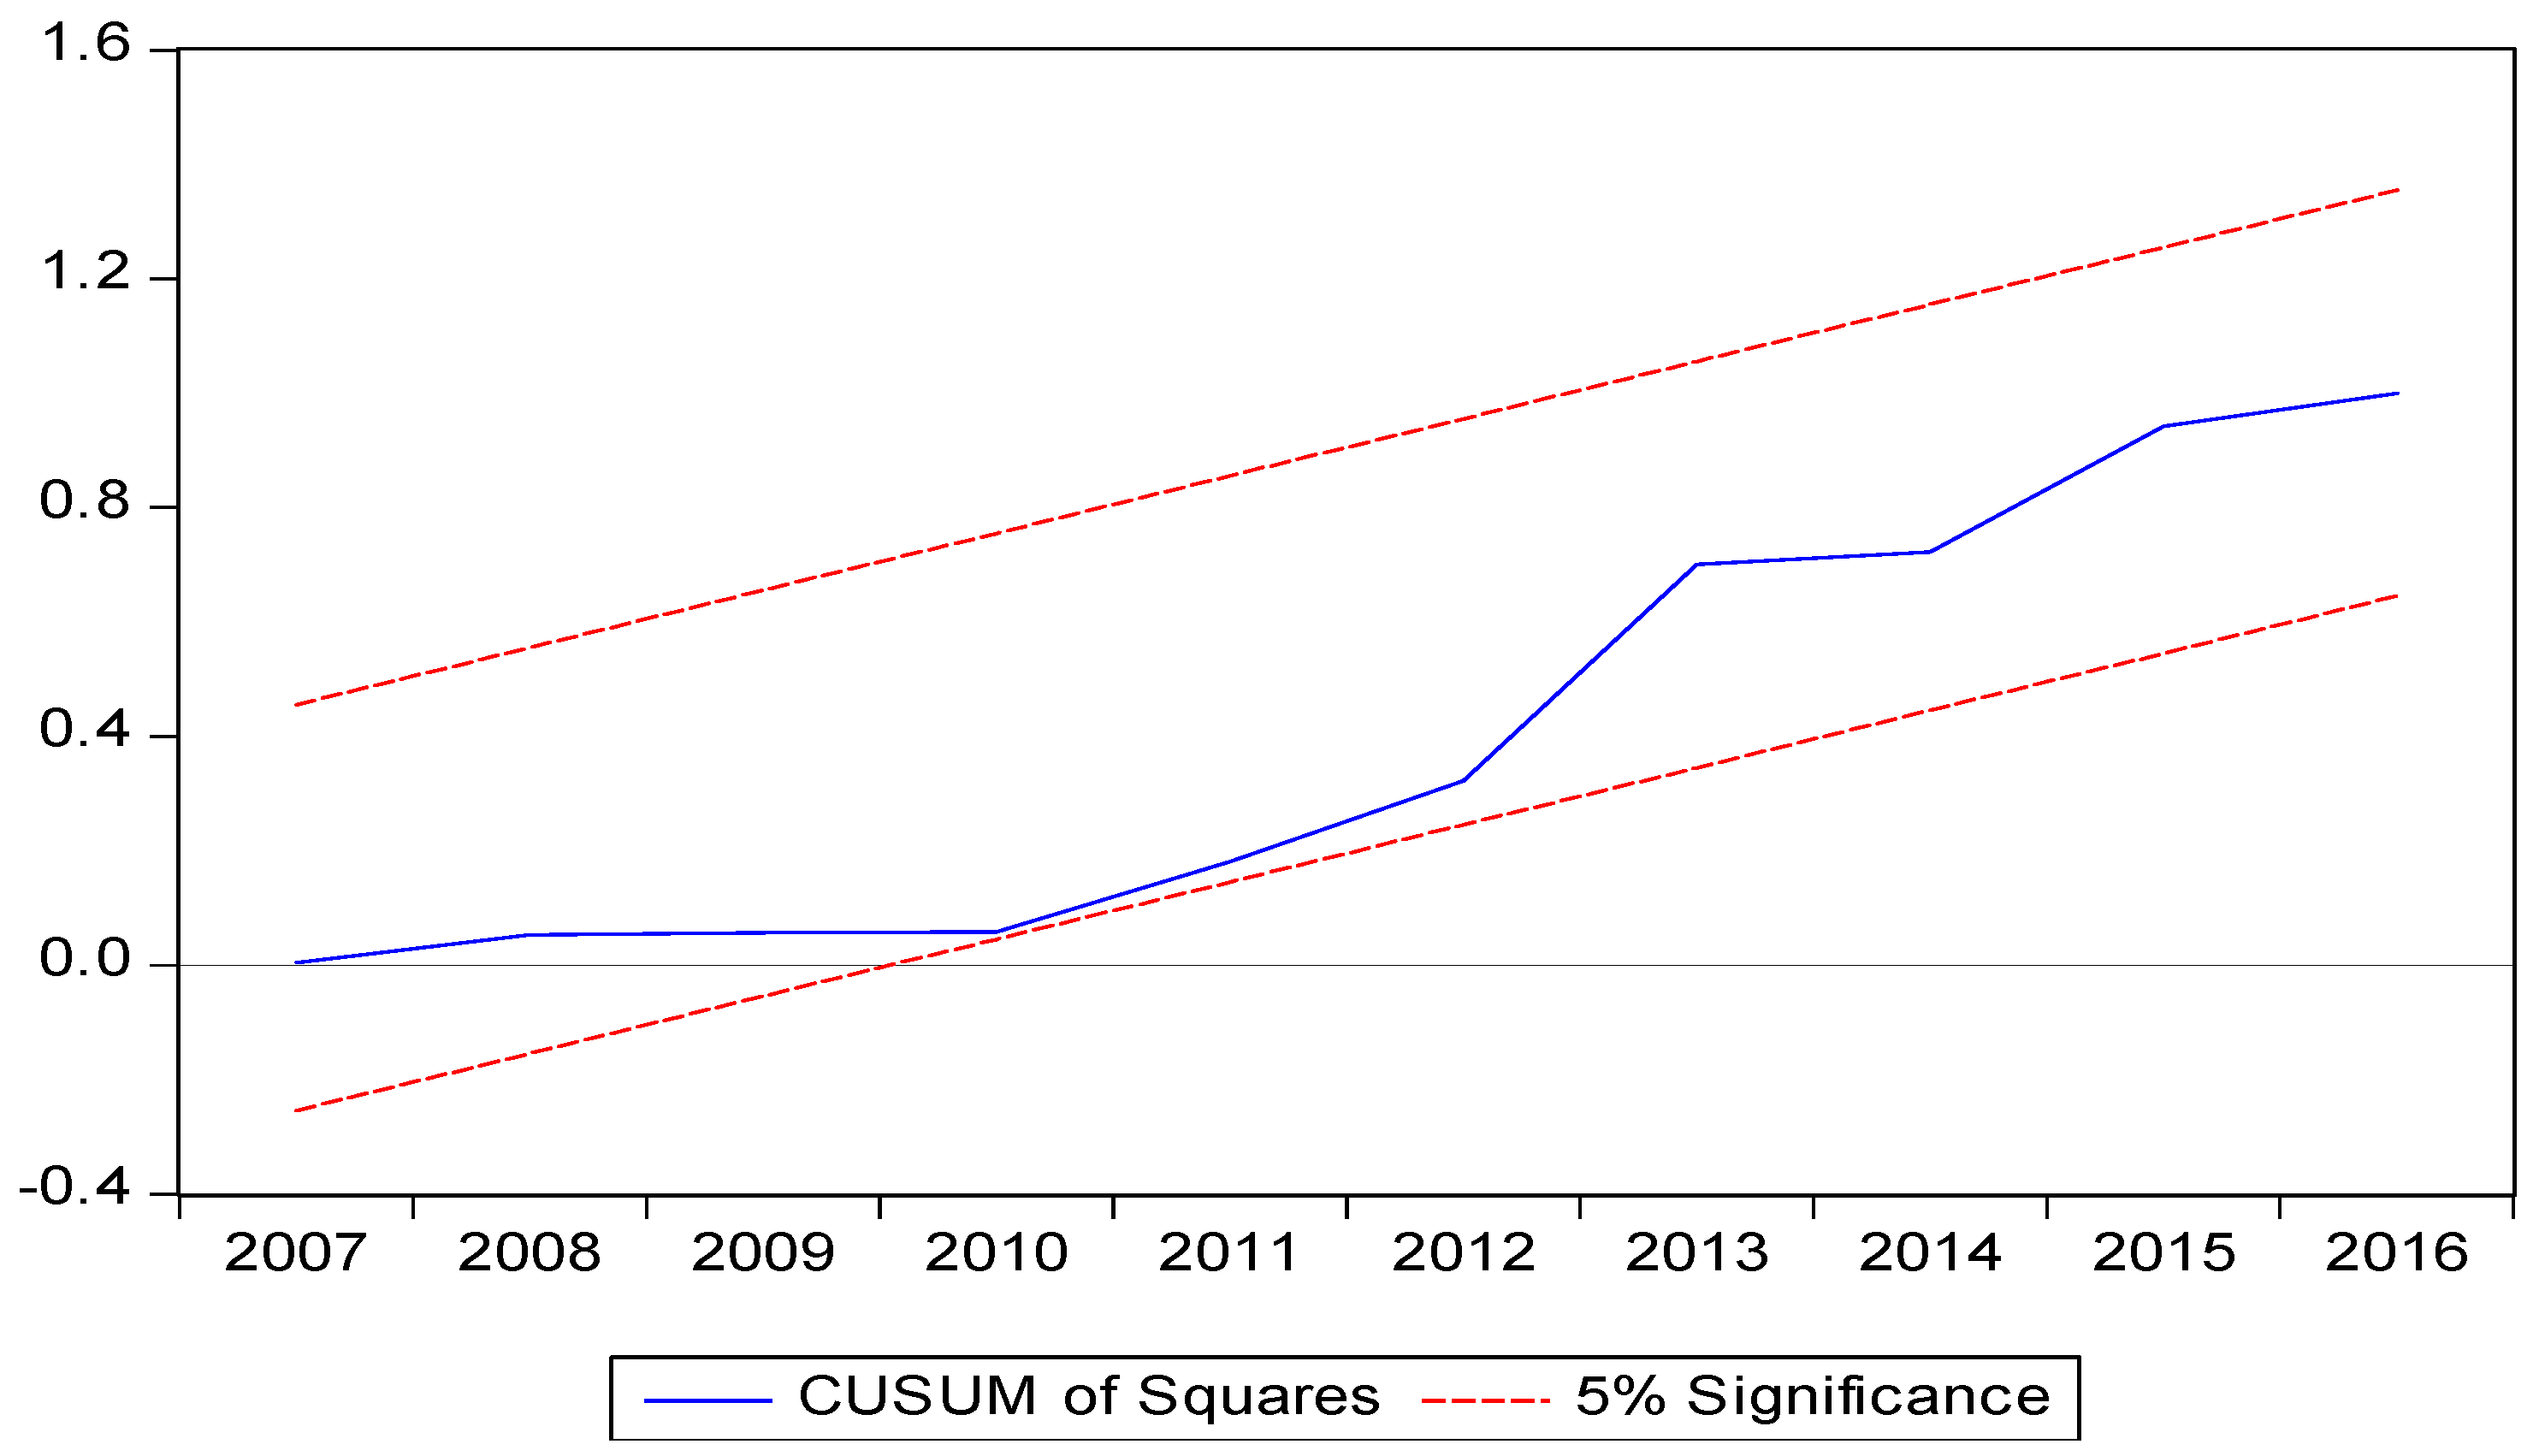
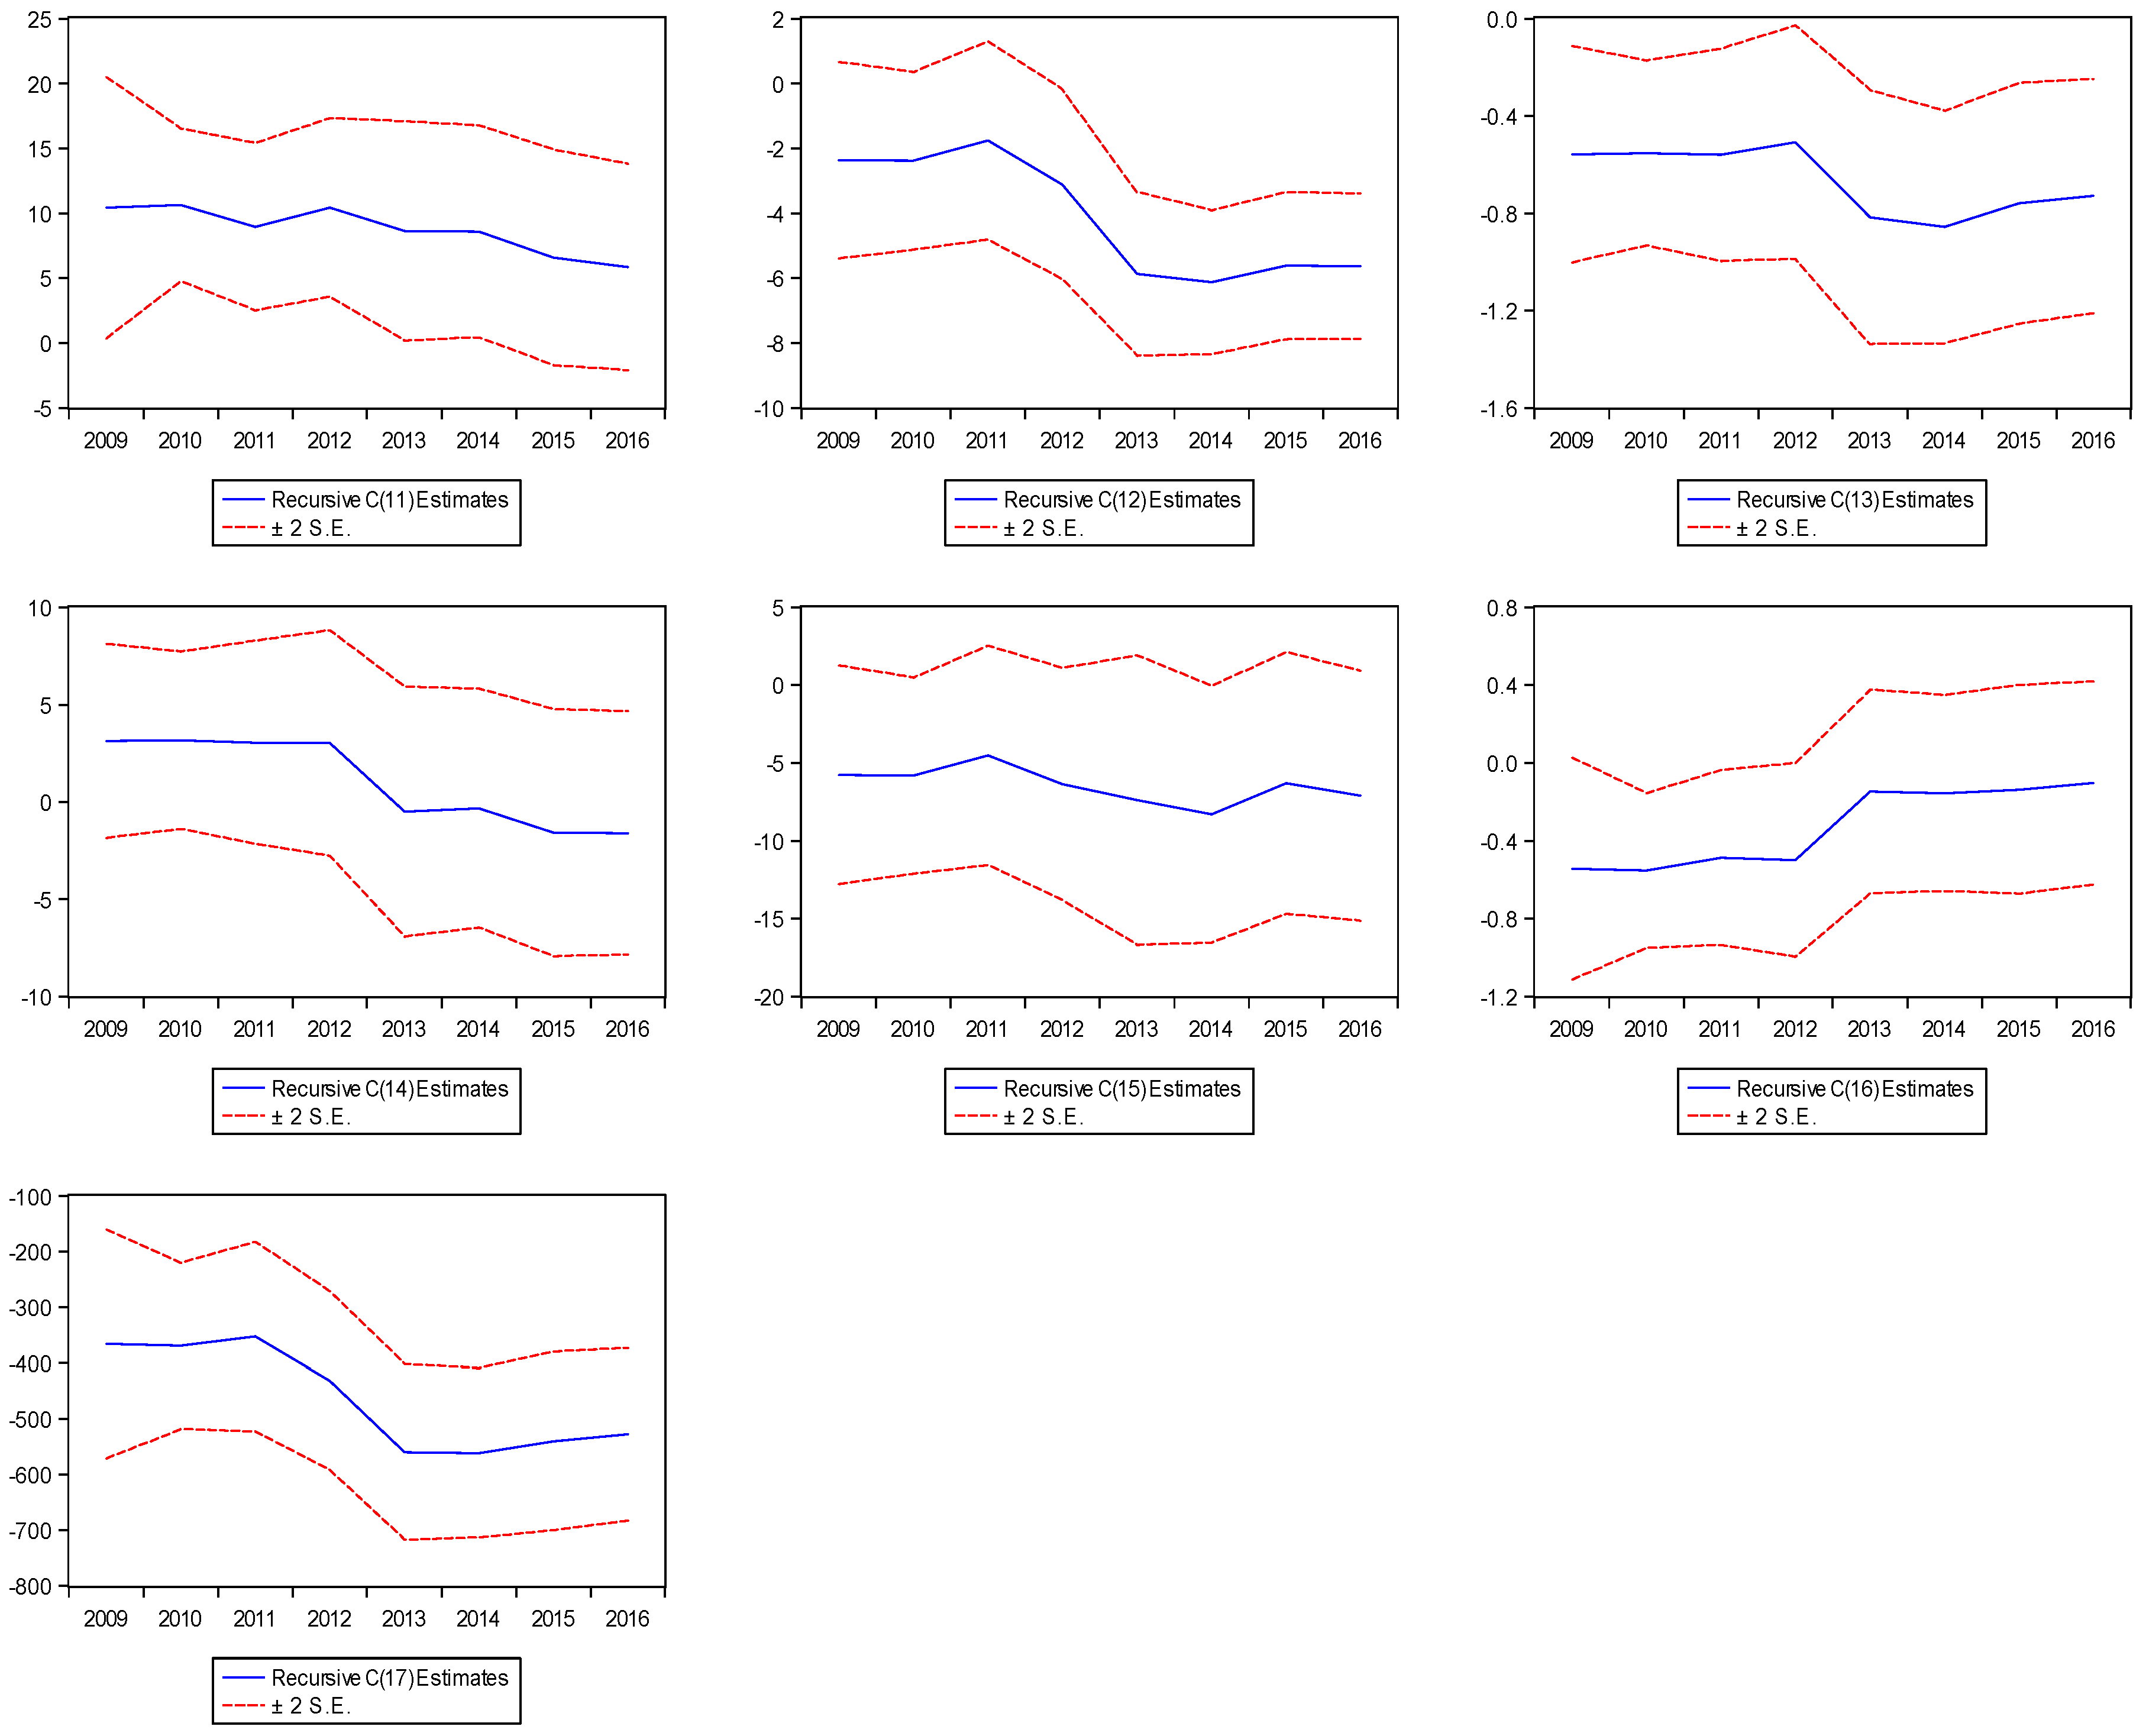
The coefficient of the ECMt−1, λ in Equation (2) shows the speed of adjustment of a parameter, indicating how quickly the series can come back to its long-run equilibrium. The sign of the coefficient must be negative and significant. Diagnostic tests which include serial correlation and heteroscedasticity tests were conducted to ensure the acceptability of the model. In addition, cumulative sum (CUSUM), the cumulative sum of squares (CUSUMQ), and recursive coefficient estimates were also applied to the series to assess stability of the coefficients and this was illustrated using graphics.

4.3. Independent Variables Included in the Model and their Expected Signs

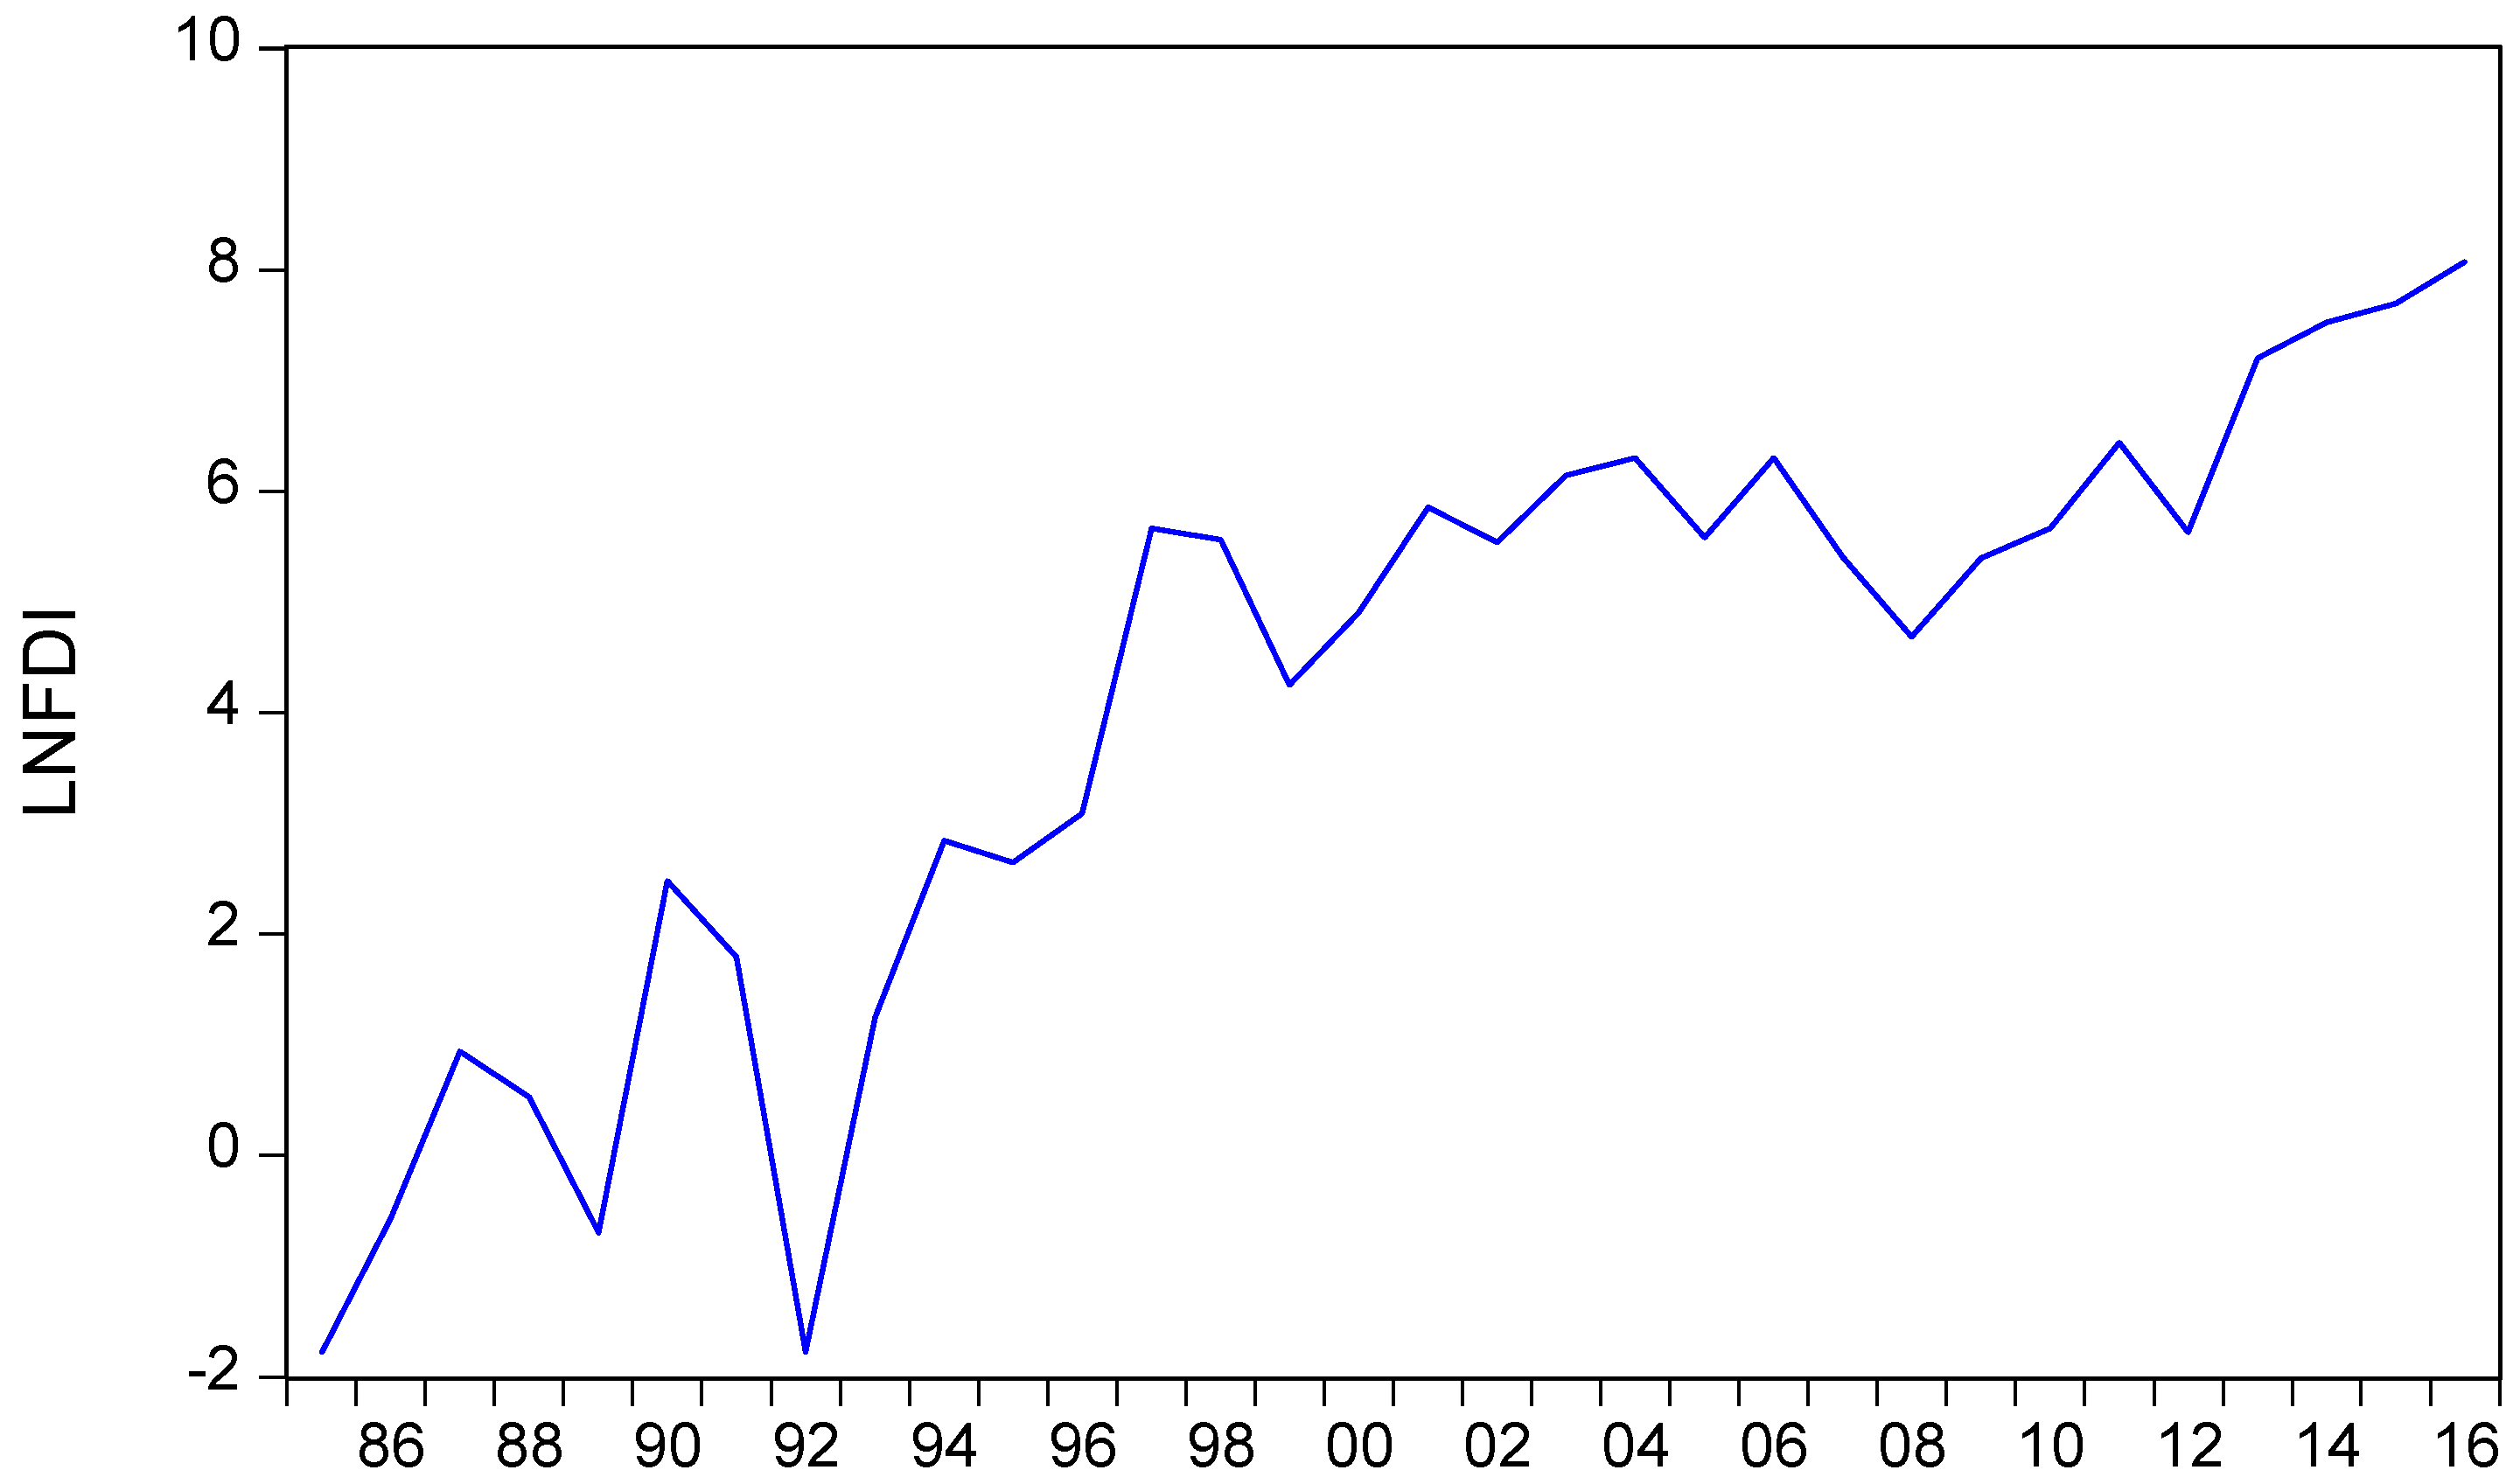
Foreign direct investment (FDI): It was defined as new investment made by foreign investors in horticultural sub-sectors. The results of the reviewed literature show varied results with regards to the impact of FDI on export performance. However, in Ethiopia, the government have given due attention to attract foreign investors into this potential sub-sector. Consequently, the expected sign of FDI in this study was expected to be positive.
ER: the real effective exchange rate was defined as the product of the nominal effective exchange rate and domestic consumer price index divided by the foreign consumer price index. An increase in the real effective exchange rate (depreciation) makes the exports cheap in the international market, thereby increasing the exports of the country. The opposite happens when it increases. Consequently, in this study, the expected sign of the real effective exchange rate was positive.
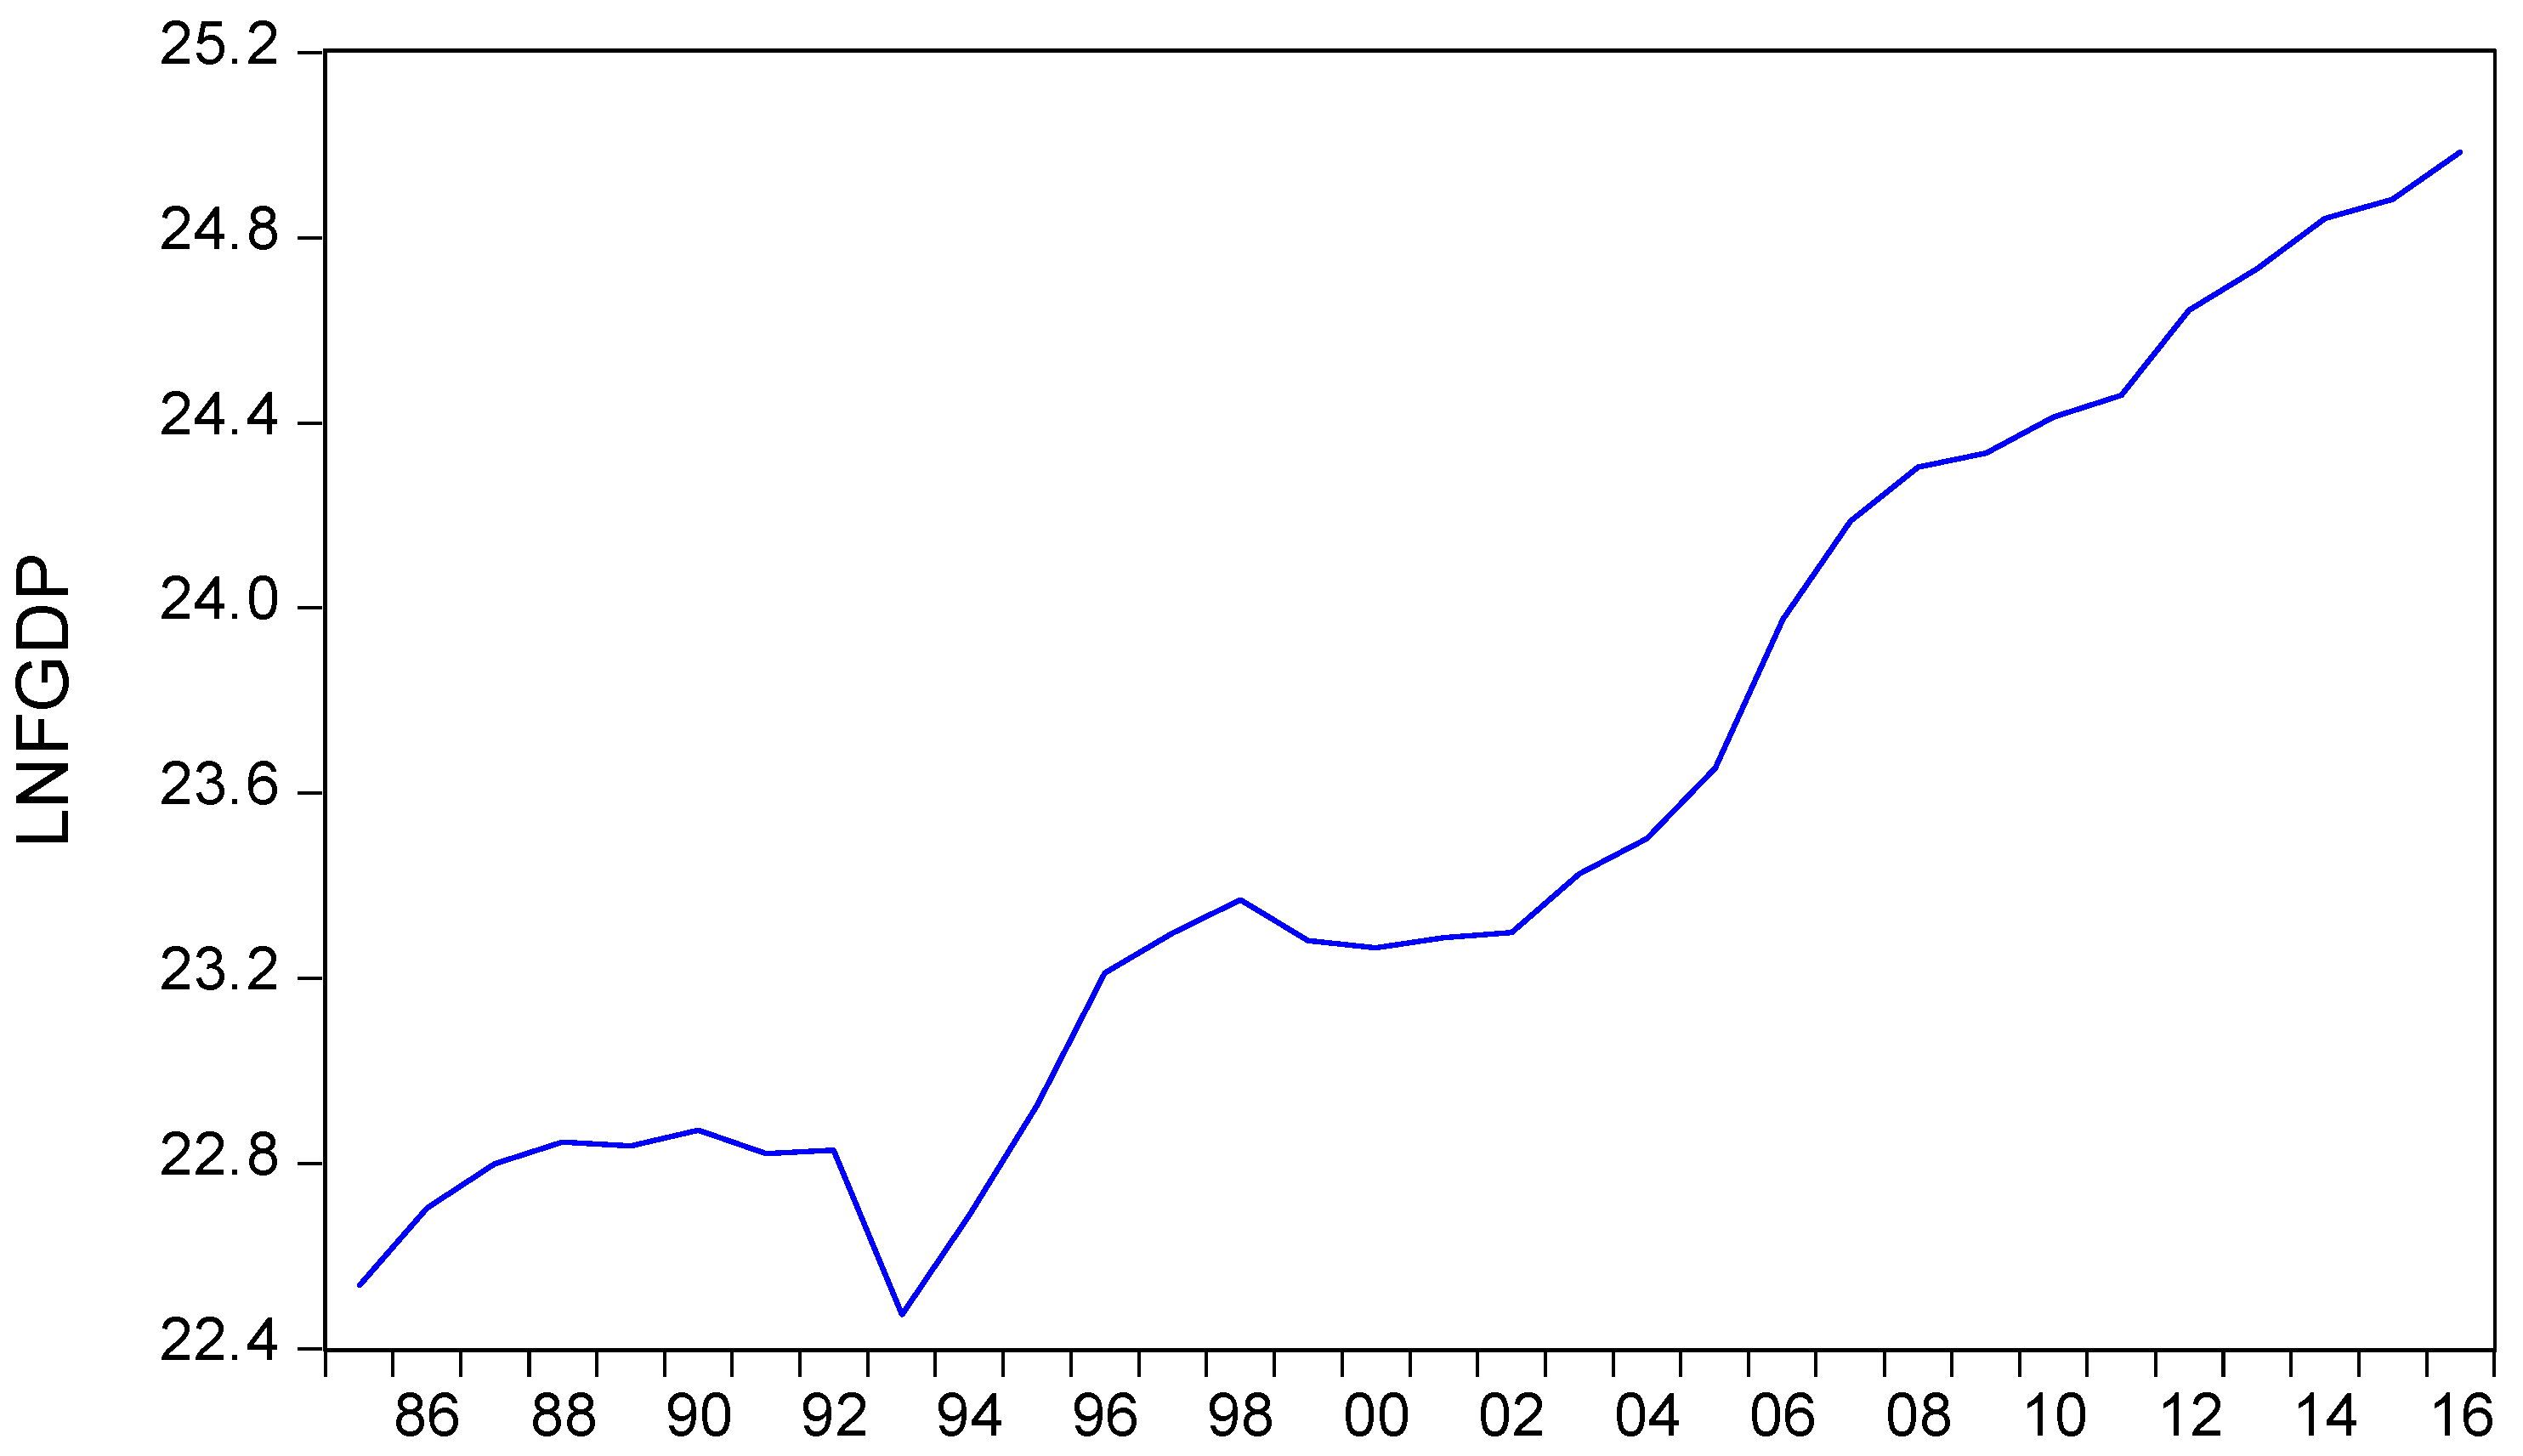
FGDP: Foreign GDP was defined as the average real GDPs of the major importers of horticultural crops. Diversification of both commodities exported and importing countries were considered by many as an important means of improving export performance in developing economies. Consequently, foreign income was hypothesized to influence horticulture export performance positively.
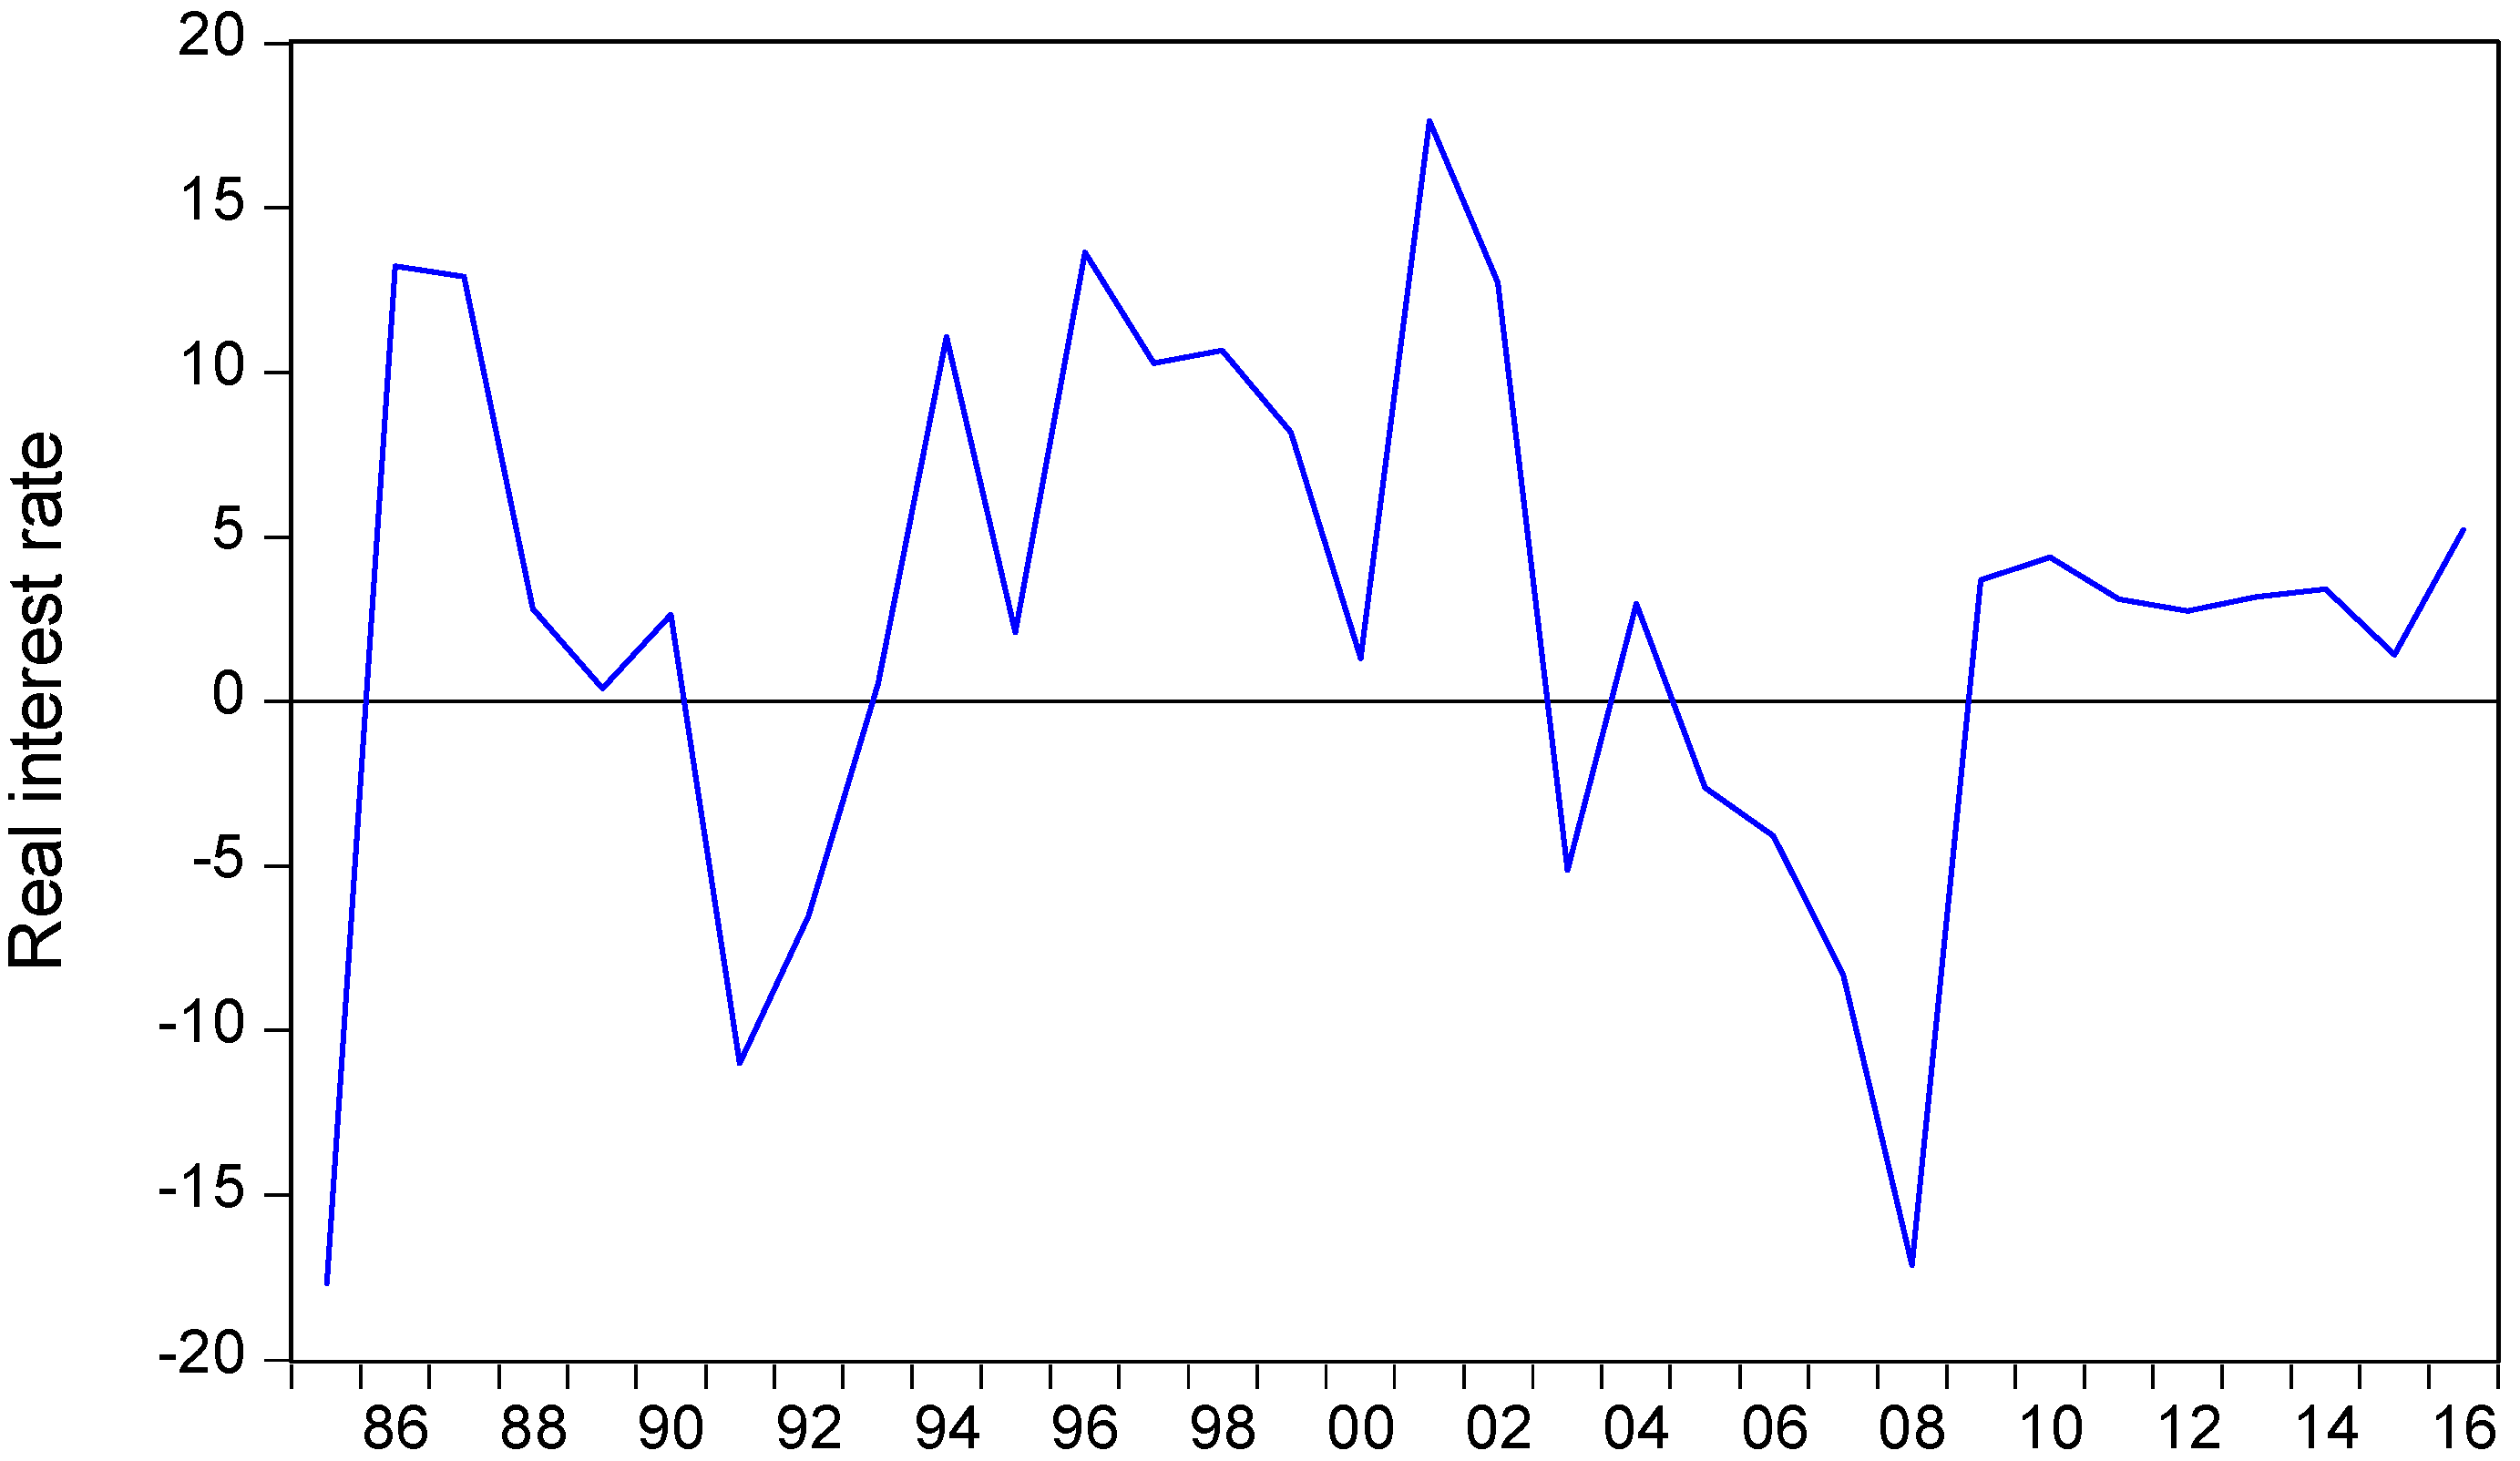
RIR: Real interest rate was defined as the nominal lending rate adjusted for inflation. The higher the interest rate, the lower the investment in production of horticultural crops and the less will be the volume of exports. Consequently, a negative relationship was expected between horticultural exports and the real interest rate.
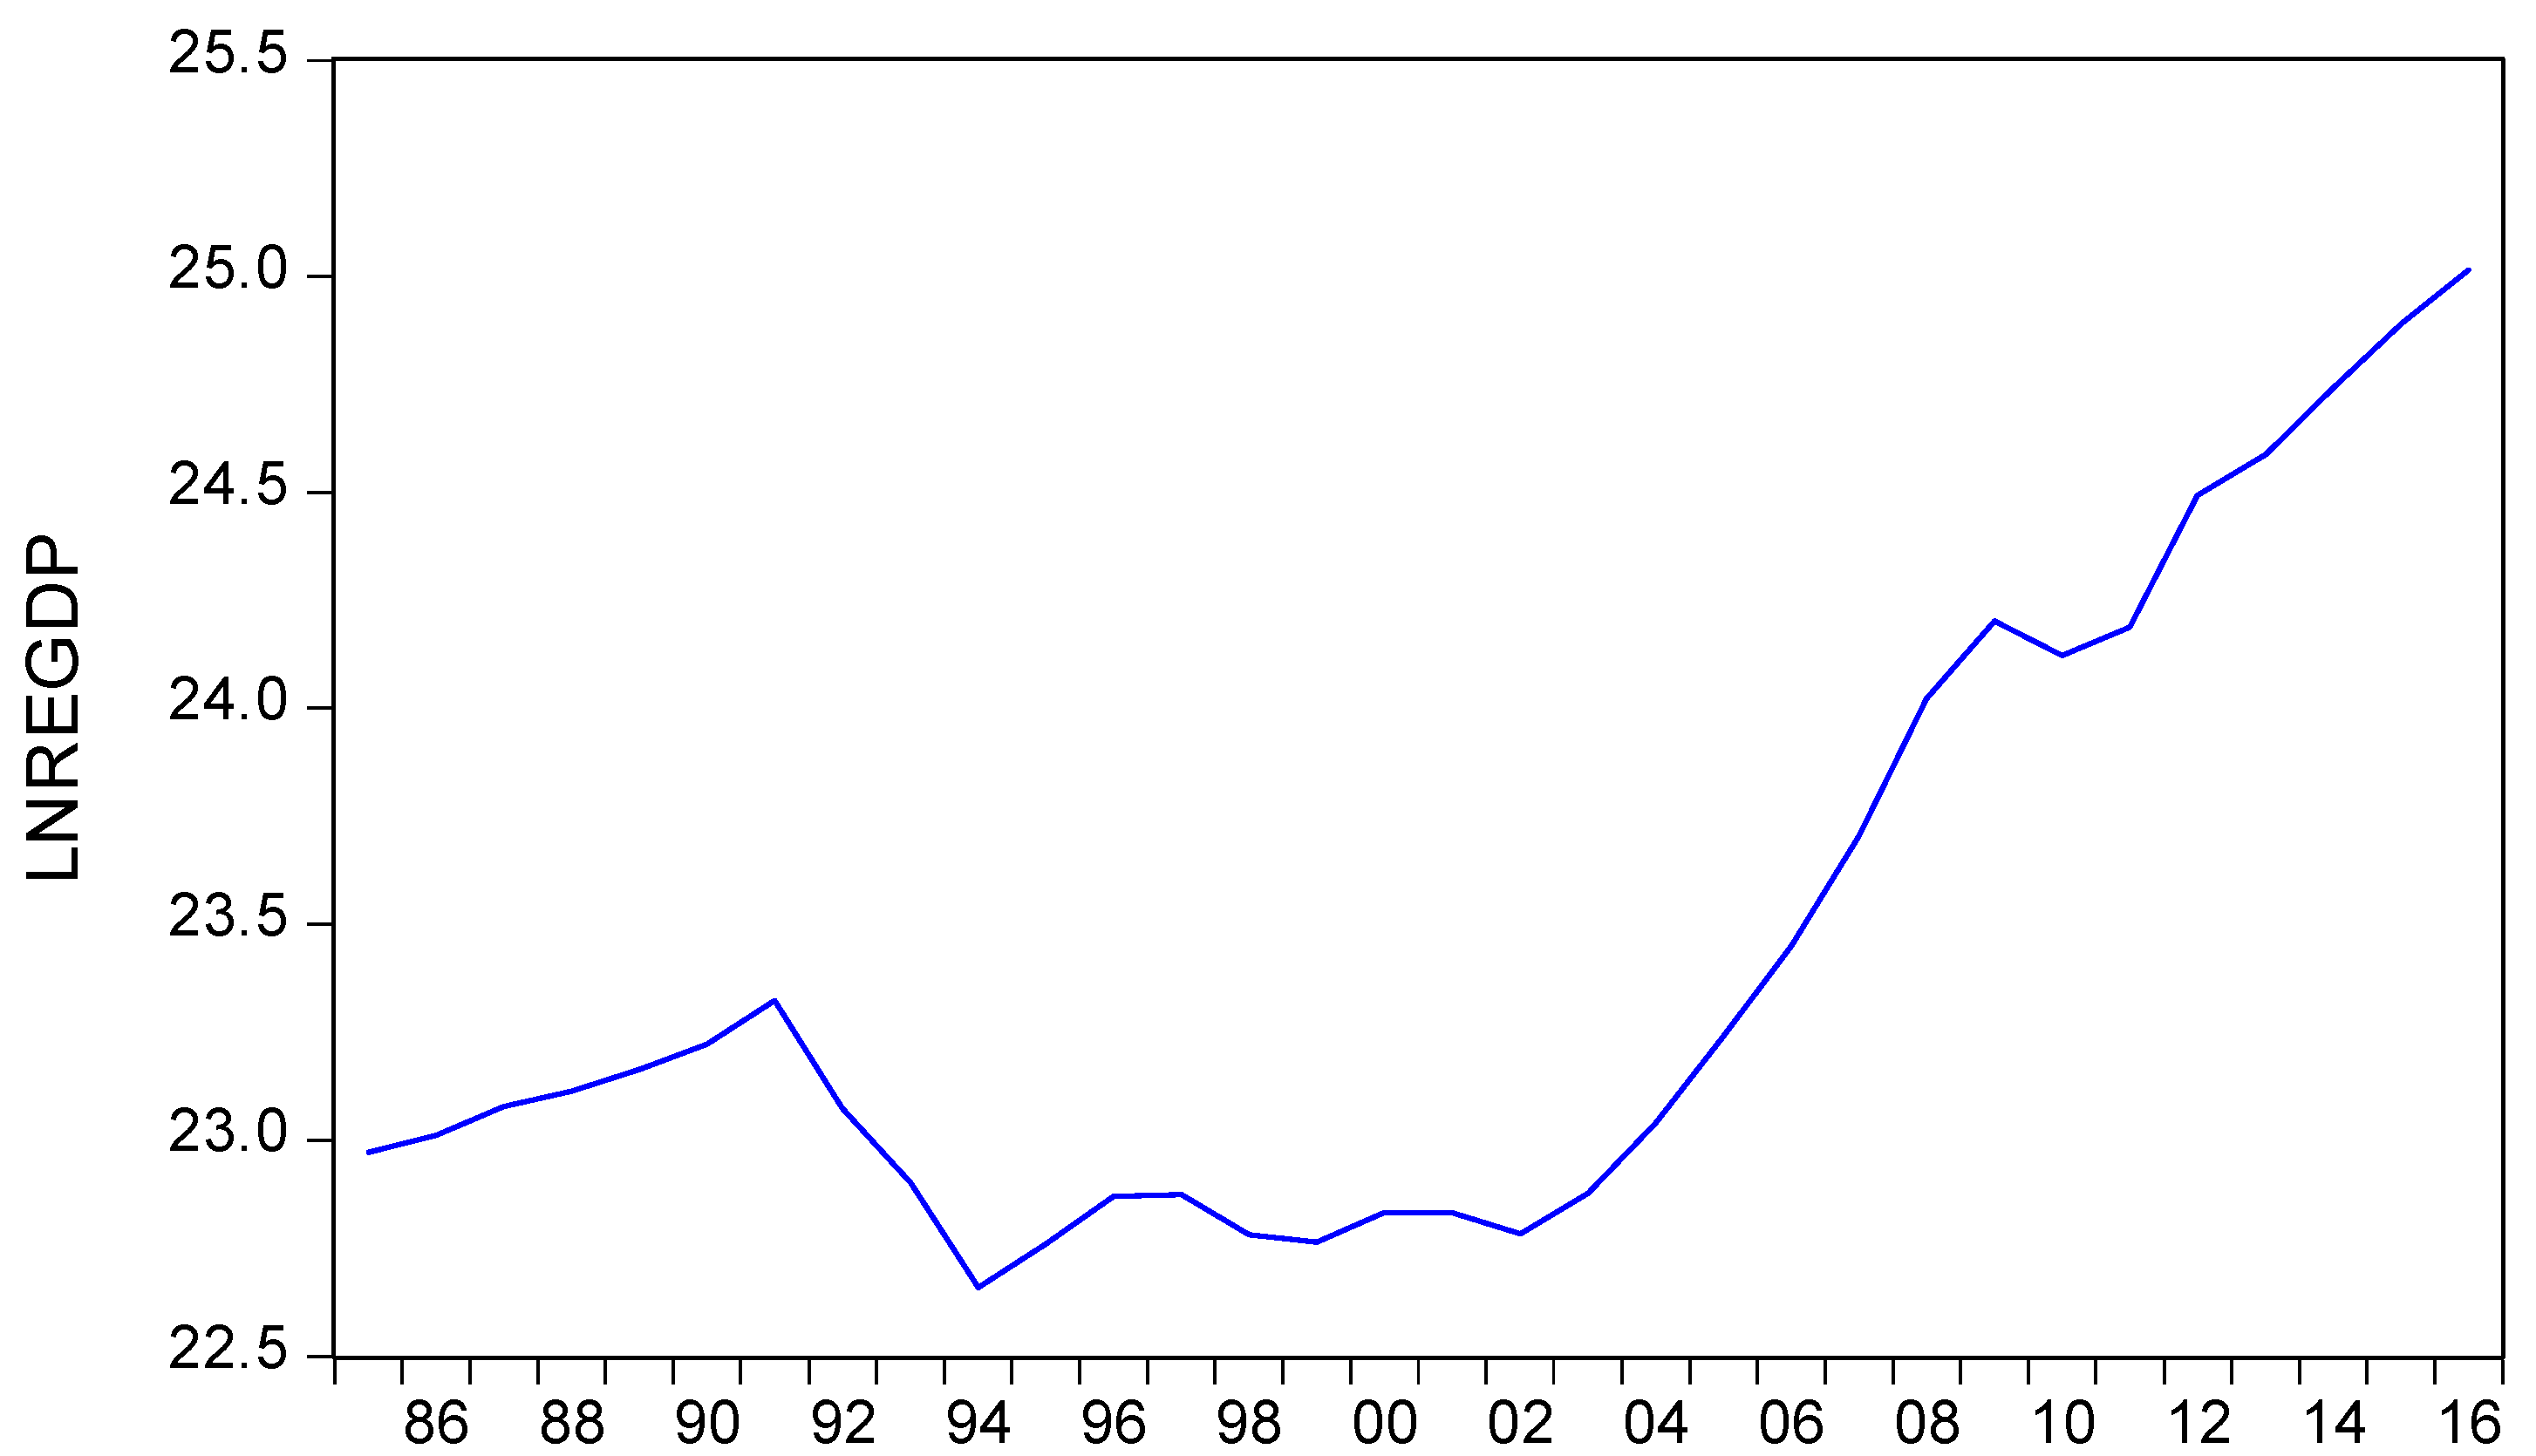
RGDP: It was defined as the real GDP of the exporting country which was Ethiopia in this case. The higher the real GDP of the country, the higher will be its export performance. Consequently, real GDP of the exporting country was expected to influence export performance positively.
PRICE: It was the average world price of fresh fruits and vegetables (dollars/kg) sourced from the World Bank and FAO statistics. It was hypothesized to have positive effects on horticultural export performance, since increases in output prices will lead to increased revenues.
BREAK: This was a dummy variable included in the model to capture the impact of the structural break that occurred in 2005. It was expected to have a positive impact on the export performance of the horticultural sub-sectors.

5. Results and Discussion

5.1. Trend Analysis of Independent Variables

The trend of real interest rates from 1985–2016 is shown in Figure 1. In this period, the value of real interest rates recorded both negative and positive values. According to NBE (2013/14), in recent years, despite the negligible change in nominal interest rates, the rate of real interests showed a significant improvement from the past year because of the drop in year-on-year headline inflation. In addition, despite the recent uptick, inflation has been kept within single digit levels largely aided by tight monetary and prudent fiscal policy stances.
Despite some fluctuation, the trend of foreign direct investment was increasing in Ethiopia throughout the period. In this regard, different actors like the Ethiopian government (MoARD), the sector organizations (EHPEA), and donors (USAID, SNV) have played a great role by identifying areas for further development of the fruits and vegetable sector in Ethiopia, both for the domestic and export market. Furthermore, in addition to the comparative advantage that the country possesses due to its proximity to the Middle Eastern and European markets, supportive government policies and favorable investment incentives had attracted foreign investors to invest in the growing sectors of the country. The trend of LnFDI is shown Figure 2.
Over a long period of time, the export performance of the horticultural sector was unsatisfactory. This by itself demonstrates the fact that the country’s foreign earnings were dominated by a few agricultural commodities. In this regard, coffee remained the largest contributor to foreign earnings of the country. However, there has recently been a positive move by both government and donor countries to diversify the export base of the country. The horticulture sub-sector attracted the attention of policy intervention. As a result, export earnings from the horticultural sub sector had shown improvement in recent years, as shown by its trends in Figure 3.
The trend of LnRGDP shown in Figure 4 was rising over the last two decades. There was rapid and sustainable economic growth, especially over the last 15 years, as shown by the trends in Figure 4. This emanated from the fact that even though there was a gradual and steady shift in the structure of the economy by developing the manufacturing sectors; government policies of promoting export-led growth had focused on modernizing agricultural sectors which have long dominated the country’s economic base. LnFGDP shown in Figure 5 was also rising throughout the period.

5.2. Stationarity Tests

The values of all economic variables were transformed into logarithmic values and tested for the stationarity of the series. The test results of the Augmented Dickey-Fuller (ADF) and Phillips Perron (PP) tests presented in Table 2 show that there was no stationarity in the level data for export, real exchange, Real GDP, price, and foreign direct investment. The absolute value of their test statistics was less than the absolute value of 5 percent critical value of −2.927. However, the first differences of the series (Table 3) were stationary, implying that they were all integrated of degree 1 (I (1)). Foreign GDP and real interest rate were stationary at the level data (I (0)). This indicated that the series were integrated of different levels, such that the Auto Regressive Distributed Lagged (ARDL) bounds test approach proposed by Reference [32] is an appropriate method for analyzing the long-run relationship between the series. Consequently, the ARDL bound test approach was used for this study.

5.3. Structural Break Analysis

Production and processing of horticultural crops, vegetables, and fruits have been placed by the Government of Ethiopia on the list of high priority areas, and various incentives have been provided for investors. A package of incentives under regulation No. 84/2003 was developed for both foreign and domestic investors engaged in new enterprises and expansions. This includes a 100 percent exemption from import customs duty and other tax levied on imports on investment capital goods and construction materials necessary for the establishment of a new enterprise. In addition, the Ethiopia Horticulture Producers and Exporters Association (EHPEA) was established in 2002 to facilitate private sector horticultural exports. It represents the horticulture sector in the country, as well as internationally, and it also organizes trade fairs. The Ethiopian Development Bank (EDB), the key institution financing the expansion of the sector, provides loans with a grace period and at relatively low interest rates. Furthermore, to boost the horticultural sector further, the Ethiopian Horticulture Development Agency was established on 6 June 2008, as an autonomous Federal Government Agency under the Ministry of Agriculture [36].
The cumulative effect of these policy measures were tested to check whether it had brought any significant structural break in the performance of the horticultural sub-sector. In this regard, the Zivot-Andrew test of structural break analysis was applied to the series to examine the structural break in horticultural export performance (Figure 6). The results of the test presented in Table 4 showed that there was a structural break in the year 2005. The test statistic for 2005 (−5.21) was at a minimum level in the graph. This test statistic was less than the 5% critical value. Therefore, it can be concluded that the structural break that occurred in the year 2005 was a significant structural break. Thus, this confirms that developments that had occurred before and after 2005 had resulted in the structural break in 2005, with regards to the performance of the horticultural sub-sector.

5.4. Co-Integration Tests

The presence of cointegration among the series was tested by employing the bound test approach. Accordingly, the results presented in Table 5 show that the computed F-statistic (7.105) was greater than the F-critical value at 1%, 5%, and 10%, respectively. Consequently, the result supported the rejection of the null hypothesis, which indicated the existence of a long-run relationship between the variables. This implies that there is cointegration among the series in the model. The existence of cointegration among the series aids in analyzing the short-run and long-run relationship of the factors that affected the growth of horticulture exports in the country.
Using AIC, SIC, and Hannan-Quinn information criteria, ARDL (2, 2, 2, 0, 1, 0, 0, 2) was revealed as the best model for the series. The Breusch-Godfrey Serial Correlation LM Test results presented in Table 6 show that there were no problems of serial autocorrelation. In addition, the diagnostic test for heteroscedasticity also showed the absence of such problem (Table 7). This indicates that the model was good enough for the study of cointegration among the variables.

5.5. Factors Affecting the Growth of Horticultural Crops

Based on ARDL (2, 2, 2, 0, 1, 0, 0, 2), the model results of the short-run and long-run estimates of factors affecting the growth performance of horticultural crops were presented in Table 8 and Table 9, respectively. Accordingly, real effective exchange rate, real GDP, FDI, price, and structural break (which occurred in 2005) were revealed as significant, both in the short-run and the long-run. In addition, the result also showed that Foreign GDP was insignificant in the short-run, but significant in the long-run. However, the real interest rate was revealed as insignificant, both in the short-run and long-run.
Exchange rate affects the performance of the exports through volatility and depreciation or appreciation in its value. Depreciation in the value of the local currency makes the exports of a country relatively cheaper such that more revenue will be obtained. Consequently, according to the results presented in Table 8, the partial elasticity of horticulture exports to the change in the real effective exchange rate was positive and significant at the 10% probability level. The long-run coefficient value of 9.232 for the real effective exchange rate showed that a 1% increase (depreciation in the value of local currency) in the real effective exchange rate increased the export of horticultural crops by 9.232%. In the short-run, the responsiveness of exports to a 1% increase in the real effective exchange rate was an increase of 14.286%. The lag of the variable also had a significant impact on horticulture exports. This implies that policy measures regarding the exchange rate have paramount importance in improving horticulture exports in both the short- and long-run. Contrasting to the findings of this study, other researchers have found that the impact of the exchange rate in explaining the export performance was revealed as insignificant or weak [10,11,37,38]. However, the findings of several researchers were consistent with the results of this study [3,13,14,19,20,21,22,23,26]. They all concluded that depreciation in the value of money had significantly affected export performance of the respective country. Furthermore, other groups of researchers confirmed that volatility in exchange rates had negatively affected the export performance in both the short-run and long-run [39,40].
The real GDP was another important variable which had significantly affected the horticultural export performance of the country, both in the short-run and long-run. İts partial elasticity was 9.447 and 25.927 in the short-run and long-run, respectively. This showed that a 1% increase in real GDP of the country will increase the export performance of the horticultural sub-sector by 9.447% and 25.927% in the short-run and long-run, respectively. The lag of the variable also had a significant role in explaining the export performance of the sector. This confirmed that as the real GDP of a country grows, more horticultural exports will be produced which will increase the possibilities of increasing horticultural exports. The results of this study were consistent with the empirical works of different researchers [11,13,18].
The partial elasticity of foreign direct investment was 0.743 and 0.605 in the short-run and long-run, respectively. It was revealed to be significant in both the short-run and long-run. The sign of the coefficient was also positive in both periods in line with the hypothesis of the study. In the short-run, a 1% increase in foreign direct investment will increase horticultural exports by 0.743%. However, the results of the literature reviewed indicate conflicting results regarding the impact of FDI on export performance. The findings of References [21,25] were positive, whilst References [11] and [19] were insignificant, and the results of Reference [29] were negative. However, Reference [29] emphasized that the impact of FDI depends on its motive. Export-oriented investments would generally contribute to export growth, whilst investments aimed at capturing domestic markets would dampen trade.
The income of the importing country was also among the important variables hypothesized to influence the horticultural export performance of the country. Even though it was revealed as insignificant in the short-run, it had influenced the export performance of the country positively at a 10% probability level in the long-run. The long-run coefficient indicated that a 1% increase in foreign income of the importing country would increase the export of horticulture by 7.221% in the long-run. The findings of many researchers are consistent with the results of this study [20,26,27]. However, some researchers had obtained a negative impact [21,25], whilst others obtained an insignificant impact of foreign income on export performance [11,14].
The real interest rate was revealed insignificant in the short-run but significant in the long-run. The price elasticity of export to one percent change in the real interest rate was 0.738% in the long-run. The sign of variable was shown negative in both periods similar to the hypothesis of the study. This result was inconsistent with the result of [21]. However, in the study by [18], real interest rate had negatively influenced the horticulture export performance of Kenya.
The significant structural break that had happened in the year 2005 was also included in the model to test the significance of the break on horticultural export performance of the country. The model results summarized in Table 8 and Table 9 showed that the structural break was significant. This shows the importance of policy intervention for the improvement of the sub-sector both in the short and long-run. Thus, it can be inferred that policy development in horticultural sub-sector that had occurred before and after 2005 resulting in structural break in 2005 had significantly affected the export performance of the sub-sector.
The price coefficient was also shown as significant and positive, both in the short-run and in the long-run. An increase in international prices of horticulture exports will increase the export performance of the horticulture sub-sector by 5.539% and 8.614% in the short-run and in the long-run, respectively. The result was consistent with the results obtained in Zambia [21] and in Ghana [19].
According to the model results presented in Table 9, the coefficient of the Error Correction Model (ECM (-1)) was negative and significant confirming the existence of cointegration among variables in the model. The coefficient value of 0.472 showed that a 47% of adjustment will be made in the first year and it takes 2.12 years to return to its long-run equilibrium. After these years, the series will be at its long-run equilibrium. Finally, the stability test results of the cumulative sum of recursive residuals (CUSUM) and the cumulative sum of squares of recursive residuals (CUSUMSQ) showed that the model was correctly specified and stable. The result is shown using Figure 7 and Figure 8. The recursive least squares graphs for the long-run model (Figure 9) also showed that the individual parameters are stable.

6. Conclusions

High dependency on traditional primary agricultural commodities and recurrent world market price fluctuations have exposed Ethiopia to export earnings instability. To overcome this problem of detrimental export earning fluctuations, different policy measures were taken to diversify the export base of the country. More importantly, horizontal diversification of trade from primary agricultural commodities into production and processing of high-value horticultural commodities have been placed by the Government of Ethiopia on the list of high priority areas. Various incentives have been provided for both foreign and domestic investors engaged in new enterprises and expansions. In addition, different institutions working in the sub-sector like the Ethiopia Horticulture Producers and Exporters Association (EHPEA) and the Ethiopian Horticulture Development Agency have been established to boost the horticultural sector. These institutions represented the sub-sector in the country, as well as internationally, and they also organized trade fairs. Furthermore, the key institution (Development Bank of Ethiopia) financing the expansion of the sector provided loans with a grace period and at relatively low interest rates. Consequently, this growing sector had recently become the fifth most important foreign earnings source for the country. However, the performance of the sector is far below its potential given the comparative advantage of the country in the region. Consequently, this study had attempted to empirically examine the factors that affected the horticulture export performance of Ethiopia, using the data for the period 1985–2016. The Autoregressive Distributed Lag (ARDL) bound test approach proposed by [35] was chosen to analyze the cointegration between horticultural exports and hypothesized variables. The results of the model showed that the real effective exchange rate, the real GDP of Ethiopia, foreign direct investment (FDI), prices, and the structural break had significantly influenced the horticultural export performance both in the short-run and the long-run. Foreign GDP and real interest rates were revealed significant only in the long-run. These significant variables have an important policy implication in improving the horticultural export performance of the country. The important policy implications of this study included: Flexibility in the exchange rate movements in line with the fundamentals of the economy, strengthening the performance of the domestic economy, attracting export-oriented investments which would contribute to export growth, and diversification of both commodities and importing countries. These are considered important policy measures to improve the horticultural export performance of Ethiopia.

Author Contributions

Conceptualization, Methodology, and Investigation of the study were by A.K.D. and B.O.; Writing—Original Draft Preparation by A.K.D.; Writing—Review and Editing by A.K.D., B.O., and R.G. Supervision by B.O. and R.G.

Funding

This research received no external funding.

Conflicts of Interest

The authors declare no conflict of interest.

References

  1. Debello, M.J. Econometric Analyses of Horticultural Production and Marketing in Central and Eastern Ethiopia. Ph.D. Thesis, Wageningen University, Wageningen, The Netherlands, 2007. [Google Scholar]
  2. Mulugeta, F.Z. The Contribution of Major Export Commodities of Ethiopia to the Instability of the Country’s Export Earnings; Ethiopian Economics Association—Ethiopian Economic Policy Research Institute (EEA/EEPRI): Addis Ababa, Ethiopia, 2009. [Google Scholar]
  3. Allaro, H.B. Export Performance of Oilseeds and İts Determinants in Ethiopia. Am. J. Econ. 2011, 1, 1–14. [Google Scholar] [CrossRef]
  4. Keno, K. Challenges and Opportunities of Horticulture Industry and its Contribution to the Ethiopian Export Diversification: The Case of Sebeta Area Farms, Finfinne Surrounding Special Zone. Ph.D. Thesis, Addis Ababa University, Addis Ababa, Ethiopia, 2011. [Google Scholar]
  5. WB (World Bank). Analysis of High Value Exports: A Review of Manufacturing Activities with High Value Export Growth Potential in Ethiopia; World Bank: Addis Ababa, Ethiopia, 2004. [Google Scholar]
  6. EIA (Ethiopia Investment Authority). Investment Opportunity Profile for the Production of Fruits and Vegetables in Ethiopia; Ethiopia Investment Authority: Addis Ababa, Ethiopia, 2012. [Google Scholar]
  7. EHDA. Exporting Fruits and Vegetables from Ethiopia: Assessment of Development Potentials and Investment Options in the Export-Oriented Fruit and Vegetable Sector; Ethiopian Horticultural Producers and Exporters Association (EHPEA): Addis Ababa, Ethiopia, 2011. [Google Scholar]
  8. Wiersinga, R.; Jager, A. Identification of Opportunities and Setting Agenda of Activities in the Ethiopian Fruits and Vegetables Sector; Ethiopian-Netherlands Horticulture Partnership. DRAFT-2 Mission Report; February 10–21 2007; Wageningen University and Research: Wageningen, The Netherlands, 2007. [Google Scholar]
  9. EHPEA (Ethiopia Horticulture Producer Exporter Association). Export Horticulture in Ethiopia; EHPEA: Addis Ababa, Ethiopia, 2017. [Google Scholar]
  10. Lakew, B. Prospects for Export Diversification in Ethiopia; National Bank of Ethiopia Economic Research Department NBE Staff Working Paper ERD/SWP/007/2003; National Bank of Ethiopia: Addis Ababa, Ethiopia, 2003.
  11. Manji, S. Export Performance and Determinants in Ethiopia. MPRA Paper No. 29427. 2010. Available online: https://mpra.ub.uni-muenchen.de/29427/ (accessed on 26 August 2018).
  12. Chala Zelalem, T. Economic Significance of Selective Export Promotion on Poverty Reduction and Inter-Industry Growth of Ethiopia. Ph.D. Thesis, Faculty of the Virginia Polytechnic Institute and State University, Blacksburg, VA, USA, 2010. [Google Scholar]
  13. Anagaw, B.K.; Demissie, W.M. Determinants of Export Performance in Ethiopia: VAR Model Analysis. Natl. Mon. Refereed J. Res. Commer. Manag. 2013, 2, 5–94. [Google Scholar]
  14. Sawore, A. Determinants of Export Trade in Econometric Study with Special Reference to Ethiopia. Int. J. Sci. Res. Index Copernic. Value 2015, 78, 132–137. [Google Scholar]
  15. Zeray, N.; Demie, A. Agricultural Food Export Performance in Ethiopia: An Error Correction Approach. NAF International Working Paper Series, No. 16/5. 2016. Available online: http://economia.unipv.it/naf/ (accessed on 22 August 2018).
  16. Delelegne, Y.T. Assessment of Fruit and Vegetable Export Performance in Ethiopia. Ph.D. Thesis, Mekelle University, Mekelle, Ethiopia, 2014. [Google Scholar]
  17. National Bank of Ethiopia (NB). Annual Report, Domestic Economic Analysis and Publication Directorate; National Bank of Ethiopia: Addis Ababa, Ethiopia, 2016/2017.
  18. Meme, S.M. Export Performance of the Horticultural Subsector in Kenya—An Empirical Analysis. Ph.D. Thesis, University of Nairobi, Nairobi, Kenya, 2015. [Google Scholar]
  19. Boansi, D. Competitiveness and determinants of cocoa exports from Ghana. Int. J. Agric. Policy Res. 2013, 1, 236–254. [Google Scholar]
  20. Karamuriro, H.T.; Karukuza, W.N. Determinants of Uganda’s Export Performance: A Gravity Model Analysis. Int. J. Bus. Econ. Res. 2015, 4, 45–54. [Google Scholar] [CrossRef]
  21. Mabeta, J.; Bett, H.K.; Kiprop, S.K.; Gutema, T.Y. Growth of Tobacco Exports in Zambia: An ARDL Approach. J. Econ. Sustain. Dev. 2015, 6, 178–188. [Google Scholar]
  22. Abolagba, E.O.; Abolagba, O.O.; Omokhafe, K.O.; Musa, E.; Mesike, S.C.; Osazuwa, S.; Ogwuche, P. The Performance of Rubber Exports in Nigeria. Glob. Adv. Res. J. Manag. Bus. Stud. 2016, 5, 347–353. [Google Scholar]
  23. Epaphra, M. Determinants of Export Performance in Tanzania. J. Econom. Libr. 2016, 3, 470–487. [Google Scholar]
  24. Lütkephol, H. Introduction to Multiple Time Series Analysis; Springer: New York, NY, USA, 2005. [Google Scholar]
  25. Bhavan, T. The Determinants of Export Performance: The Case of Sri Lanka. Int. Res. J. Soc. Sci. 2016, 5, 8–13. [Google Scholar]
  26. Maureen, W.; Ndungu, N.S.; Geda, A.; Karingi, S.N. Analysis of Kenya’s Export Performance: An Empirical Evaluation; KIPPRA (Kenya Institute for Public Policy Research and Analysis) Discussion Paper No. 22 November 2002; KIPPRA: Nairobi, Kenya, 2002. [Google Scholar]
  27. Sayeeda, B.; Frank, S. New Zealand Kiwifruit Export Performance: Market Analysis and Revealed Comparative Advantage; Working Paper in Economics 08/11; University of Waikato: Hamilton, NZ, USA, 2011. [Google Scholar]
  28. Mabeta, J. Determinants of Non-Traditional Agricultural Exports Growth in Zambia: A Case of Cotton and Tobacco. Ph.D. Thesis, Egerton University, Nakuru, Kenya, 2015. [Google Scholar]
  29. Boansi, D.; Lokonon, B.O.K.; Appah, J. Determinants of Agricultural Export Trade: Case of Fresh Pineapple Exports from Ghana. Br. J. Econ. Manag. Trade 2014, 4, 1736–1754. [Google Scholar] [CrossRef]
  30. UNTCAD Data File. Available online: http://unctadstat.unctad.org/wds/ReportFolders/reportFolders.aspx?sCS_ChosenLang=en (accessed on 15 August 2018).
  31. Nkoro, E.; Uko, A.K. Autoregressive Distributed Lag (ARDL) cointegration technique: Application and interpretation. J. Stat. Econom. Methods 2016, 5, 63–91. [Google Scholar]
  32. Engle, R.F.; Granger, C. Cointegration and Error Correction: Representation, Estimation and Testing. Econometrica 1987, 55, 251–276. [Google Scholar] [CrossRef]
  33. Johansen, S. Statistical analysis of cointegration vectors. J. Econ. Dyn. Control. 1988, 12, 231–254. [Google Scholar] [CrossRef]
  34. Johansen, S.; Juselius, K. Maximum Likelihood Estimation and Inference on Cointegration-with Applications to the Demand for Money. Oxf. Bull. Econ. Stat. 1990, 52, 169–210. [Google Scholar] [CrossRef]
  35. Pesaran, M.H.; Shin, Y.; Smith, R.J. Bounds testing approaches to the analysis of level relationships. J. Appl. Econom. 2001, 16, 289–326. [Google Scholar] [CrossRef] [Green Version]
  36. Wiersinga, R.; Jager, A. Business Opportunities in the Ethiopian Fruit and Vegetable Sector; Final Version, February 2009; Wageningen University and Research Centre: Wageningen, The Netherlands, 2009. [Google Scholar]
  37. Jongwanich, J. Determinants of Export Performance in East and Southeast Asia; Working Paper Series, No.106; Economic and Research Department, Asian Development Bank: Mandaluyong, Philippines, 2007. [Google Scholar]
  38. Mwinuka, L.; Mlay, F. Determinants and Performance of Sugar Export in Tanzania. J. Finance Econ. 2015, 3, 6–14. [Google Scholar] [CrossRef]
  39. Musonda, A. Exchange Rate Volatility and Nontraditional Exports Performance: Zambia, 1965–1999; AERC (African Economic Research Consortium) Research Paper 185; African Economic Research Consortium: Nairobi, Kenya, 2008. [Google Scholar]
  40. Reuben, R.; Alala, O. Impact of Exchange Rate Volatility on Kenya’s Tea Exports. Int. J. Econ. Commer. Manag. 2014, 2, 1–8. [Google Scholar]
Figure 1. Trends in real interest rates in Ethiopia, 1985–2016.
Horticulturae 04 00034 g001
Figure 2. Trends in LnFDI in Ethiopia, 1985–2016.
Horticulturae 04 00034 g002
Figure 3. Trends in Lnexp in Ethiopia, 1985–2016.
Horticulturae 04 00034 g003
Figure 4. Trends in LnRGDP in Ethiopia, 1985–2016.
Horticulturae 04 00034 g004
Figure 5. Trends in LnFGDP
Horticulturae 04 00034 g005
Figure 6. Zivot-Andrew breakpoints test results.
Horticulturae 04 00034 g006
Figure 7. Cumulative sum (CUSUM).
Horticulturae 04 00034 g007
Figure 8. Cumulative sum of squares (CUSUMQ).
Horticulturae 04 00034 g008
Figure 9. Recursive least squares graphs for the long-run model.
Horticulturae 04 00034 g009
Table 1. Average value of export earnings from major export commodities (in Millions of USD).
Period1985/86–1989/901990/91–1994/951995/96–1999/002000/01–2004/052005/06–2008/092009/10–2012/132013/14–2015/16
Coffee247.07265.99149.8318.21419.725737.075739.2
Oil Seeds10.315.693.5826.26243.425398.625546.4
Hides & Skins44.2159.7438.8844.8784.77597.675125.57
Pulses11.688.656.0112.8185.4165.05234.33
Meat & Meat Products3.061.70.343.6320.37562.5587.93
Horticulture5.916.7210.9813.9995.55220.05258.44
Live animals6.619.781.221.1839.5152.925161
Chat12.148.4514.846.62107.175239.675277.4
Goldn.a27.4425.9941.3484.575482.475355.2
Others44,0328.5132.2976.1794.3188.4261.4
Grand Total export397.43399.26274.675171274.752744.5253047.27
Source: NBE and authors own computations.
Table 2. Unit root tests at the levels of the variables.
VariablesADF Test StatisticPhilips Perron Test StatisticOrder of Integration
Lnexp−1.654927−1.625208
lnER−0.964869−0.477526
LnFDI−0.987362−1.737795
lnRGDP0.4496841.224389
LnPrice −1.083376−1.264349
lnRIR−5.052738 ** 0
lnFGDP−3.480684 ** 0
Note: ** are significance at 0.05 significance level for the critical value of −2.960411.
Table 3. Unit root tests at the first differences of the variables.
VariablesADF Test StatisticPhilips Perron Test StatisticOrder of Integration
Lnexp−5.531821 **−5.329959 ***1
lnRGDP−3.549835 **−3.233472 **1
lnER−3.320375 **−3.102866 **1
LnPrice −4.963577−4.9649731
LnFDI−8.629207 **−6.919586 **1
Note: *** and ** are significance level at 1% and 5% respectively. Critical value at 0.05 level, −2.967767.
Table 4. Zivot-Andrews Unit Root Test results.
Chosen Break Point: 2005
t-StatisticProb. *
Zivot-Andrews test statistic−5.209580 7.13 × 10⁻⁵
1% critical value:−5.34
5% critical value:−4.93
10% critical value:−4.58
* Probability values are calculated from a standard t-distribution and do not take into account the breakpoint selection process.
Table 5. ARDL bounds test results for Cointegration.
KFCritical Values at 1% Level of SignificantCritical Values at 5% Level of SignificantCritical Values at 10% Level of Significant
I (0)I (1)I (0)I (1)I (0)I (1)
77.105 ***2.733.92.173.211.922.89
Note: *** is the significance level at 1%.
Table 6. Breusch-Godfrey Serial Correlation LM Test.
F-statistic0.878345Prob. F(2,11)0.4427
Obs*R-squared4.131220Prob. Chi-Square(2)0.1267
Table 7. Heteroskedasticity Test: Breusch-Pagan-Godfrey.
F-statistic0.771213Prob. F(16,13)0.6927
Obs*R-squared14.60895Prob. Chi-Square(16)0.5534
Scaled explained SS1.698353Prob. Chi-Square(16)1.0000
Table 8. Long-run estimates.
VariableCoefficientStd. Errort-StatisticProb.
LNER9.232 ***2.2384.1250.0012
LNEGDP25.927 ***3.7286.9540.0000
LNFDI0.605 **0.2172.7940.0152
LNFGDP7.221 *3.2072.2510.0423
LNRIR−0.738 *0.374−1.9750.0604
DU4.672 ***0.7276.4250.0000
LNPRICE8.614 **2.9692.9010.0124
C−437.313 ***51.730−8.4540.0000
Note: ***, ** and * are significance level at 1%, 5% and 10% respectively.
Table 9. Short-run estimation.
Selected Model: ARDL(2, 2, 2, 0, 1, 0, 0, 2)
Dependent Variable: Δlnexp
VariableCoefficientStd. Errort-StatisticProb.
D(LNEXP (-1))0.263 ***0.0683.8600.0020
D(LNER)14.286 ***2.0816.8660.0000
D(LNER (-1))20.738 ***3.4765.9660.0000
D(LNEGDP)9.447 ***2.1054.4880.0006
D(LNEGDP (-1))13.505 ***2.0656.5400.0000
D(LNFDI)0.743 ***0.1236.0140.0000
D(LNFGDP)1.1792.0560.5730.5761
D(LNRIR)−0.1360.159−0.8540.4084
D(DU)5.297 ***0.7337.2240.0000
D(LNPRICE)5.539 *3.0171.8360.0893
D(LNPRICE (-1))5.623 *2.6102.1540.0506
CointEq (-1)−0.472 ***0.057−8.2810.0000
Note: *** and * are significance level at 1% and 10% respectively.

