1. Introduction
Abiotic stress is the result of the action of external environmental factors that affect growth, development, and reproduction of crops. In the first part of this review published last year, we analyzed stressful conditions due to drought, water excess, salinity, and lodging [
1]. In this part, high-low values of solar radiation, temperature, and relative humidity will be considered as well as agronomic strategies that can be used for lowering the stressful conditions.
Crop yield is the result of the interaction of multiple factors such as genotype, agronomic management, and environmental conditions. Different genotypes have different yield capabilities, depending on their ability to adapt. Agricultural cropping systems are continuously evolving due to innovation in agronomic tools and to identification of high-performance cultivars coming from traditional or biotechnological genetic improvements. Nevertheless, the major causes of agricultural production losses are due to abiotic stresses such as low water availability, high salinity, high or low temperatures, hypoxia/anoxia, and nutrient deficiency.
Crops exposed to these abiotic stresses respond by activating defense mechanisms. Therefore, in an early stress stage, no visible symptoms are exhibited. The energy used by the crop to counteract or cope with the abiotic stresses is called “fitness cost”, and this energy does not contribute to production. While the visual appearance of plants in an early stress stage does not change, the physiology can undergo deep changes, including the accumulation of bioactive compounds able to counteract the stress conditions.
Plants are able to perceive environmental stimuli and to adapt to different environments. However, the degree of tolerance and adaptability to abiotic stresses varies among species and varieties. The global weight of biotic stresses on yield losses was estimated to be 70% by Boyer [
2], and 13–94% by Farooq et al. [
3]. A more detailed analysis of yield losses associated with some abiotic stresses was presented by Mariani and Ferrante [
1].
In this paper, a review of agronomic strategies aimed to optimize the resilience of crops exposed to abiotic stresses due to sub-optimal values of solar radiation, temperature, and relative humidity is presented. It is, however, necessary to remember that agronomic strategies hereafter presented and discussed can be adopted only if sustainable, not only socially and environmentally but also economically. This is because agriculture is an economic activity that cannot be done without adequate remuneration of the production factors.
2. Solar Radiation as Resource and Limitation for Crops
The sun provides the energy that moves the climate system (ocean and atmosphere circulation), drives the water cycle and feeds the food chains by means of the photosynthetic process. Moreover, an energy balance is in place for which the Earth emits towards space the same quantity of energy received from the sun.
Some basic physical laws rule the energy fluxes at all scales. More specifically the emission of energy by all bodies is ruled by Planck’s Law, while the Stefan-Boltzmann Law and Wien’s Law state that the total emission and the wavelength of the maximum emission are a function of the temperature of a blackbody, respectively. Moreover, the radiative flux (I) intercepted by a surface is determined by the sine law I = I
0 * sin (α) where I
0 is the maximum radiative flux intercepted by a surface perpendicular to it and α is the elevation angle (the angle of the sun above the surface) [
4]. The cosine law explains, for example, the high quantity of energy received by south-facing slopes at mid-latitudes during spring and autumn when the sun at noon is still low in the sky.
The radiation that comes directly from the sun is defined as beam radiation. The scattered and reflected radiation that arrives at the earth’s surface from all directions (reflected from other bodies, molecules, particles, droplets, etc.) is defined as diffuse radiation. The sum of the beam and diffuse components is defined as total (or global) solar radiation (GSR). The fraction of the GSR re-irradiated toward space is named albedo A. Moreover, the surface of the planet emits radiation toward the sky in the far infrared (LR
1) and in its turn, the sky emits radiation in the far infrared towards the surface (LR
2). Consequentially, net radiation for a given surface is expressed with the following equation:
Solar radiation is a source of energy and information for plants [
5]. The relation between plants and light takes place through a series of pigments, which can be classified into four broad categories, namely chlorophylls, carotenoids, anthocyanins and phytochromes. Photosynthesis is the set of two phases, namely luminous and dark phase. In relation to the dark phase of photosynthesis, crops can be classified as C3, C4, and Crassulacean Acid Metabolism (CAM) plants [
6].
For C3 plants the whole process of photosynthesis takes place in the mesophyll cells and the first products of photosynthesis catalyzed by Rubisco are two molecules with 3 atoms of carbon (Calvin cycle). In the case of C4 plants, the mesophyll is the site of CO
2 absorption by phosphoenolpyruvate (PEP), a reaction that is catalyzed by the enzyme PEP-carboxylase, which unlike Rubisco, is very efficient—even at low CO
2 levels. From the evolutionary point of view, C4 plants appeared on our planet much later than C3 plants (between 25 and 32 million years ago, according to Osborne and Beerling [
7]) and were the product of the adaptation to high temperatures and water shortages.
CAM plants show a nocturnal phase in which, with open stomata, cells of the mesophyll produce OAA starting from PEP, and then malic acid is produced from OAA and is stored in the vacuolar juice that becomes increasingly acidic. During the day, when the stomata are closed, the malic acid returns to the cytoplasm where CO2 is released from it which enters the Calvin cycle.
The relevance of C3 and C4 plants for global food security is indicated by the fact that about the 70% of the global calories required by humans is fulfilled by three C3 crops (wheat (Triticum aestivum L.), rice (Oryza sativa) and soybean (Glycine max L.) and two C4 crops (maize (Zea mays), sorghum (Sorghum bicolor)). On the other hand, CAM plants have lower importance and the only species subject to extensive cultivation are the pineapple (Ananas comosus (L.) Merr.) and the Indian-fig (Ficus benghalensis). For the C3 species, the lower efficiency of the Calvin cycle causes light saturation to occur at values between 30 and 80,000 lux (ex: 30–50,000 lux for grape (Vitis vinifera L.), while in the C4 saturation occurs at higher values at 80,000 lux. Therefore, on very bright days, when 100,000 lux is exceeded, the C3 species can exploit only a limited part of the available light energy. As far as light radiation is concerned, the compensation point is defined as the level of radiation at which photosynthesis and respiration reach equal values. Radiation values that coincide with this point are not significantly different between C3 and C4. At the level of general morphology, it is observed that leaves in the shade are wider and thinner (in particular the palisade layer appears less developed than that of leaves in the sun) and often have a greater concentration of chlorophyll in the upper surface. Added to this are a series of characteristic effects of the lack of radiation, i.e., yellowing and abscission of the lower leaves, a lack of branching, excessive elongation of stems and shoots and low or no fertility.
Photosynthesis is a key determinant of yield and quality of crops which in their turn are the pillar to the economic sustainability of farm activity. Therefore, all aspects of agronomic management should focus on crop photosynthesis with the objective of maximizing it even under stressful conditions. This objective can be achieved by selecting the best crops (species and varieties) for the selected environment, combining them in suitable crop successions and optimizing management techniques.
Making good choices of species and varieties are essential to making optimal use of the available solar radiation, avoiding at the same time problems due to radiation excess and water limitation. From this point of view, environments characterized by high temperatures, high values of global solar radiation, and water limitation are in general more suited to C4 plants, because these plants appeared some millions of years ago as an adaptation to savannas and tropical grasslands [
8]. An important exception to this general rule is provided by maize, which in the presence of severe water stress shows a decrease in leaf area index (LAI), intercepted photosynthetically active radiation (PAR), and Radiation Use Efficiency (RUE) [
9]. These drawbacks are usually associated with reduced competitiveness with weeds and proterandry that creates sterility. Such phenomena are only partially compensated by the increase of water use efficiency (WUE) and, consequently, a relevant reduction in maize biomass production and harvest index is generally observed.
Possible solutions for environments characterized by high temperatures and high levels of solar radiation could be use of C4 species such as sorghum, millet and panicum (Poaceae spp.) and sugarcane (
Saccharum officinarum) or tropical C3’s such as rice, oil palm (
Elaeis guineensis), common bean (
Phaseolus vulgaris) and cassava (
Manihot esculenta). Some mesothermal C3 crops such as wheat and grapevine have shown significant injuries to photosystem II due to high temperatures [
10].
Environments characterized by high values of cloud coverage have a greater presence of diffuse radiation that penetrates deeper into the canopy reaching the lower leaf layers. This explains why in these environments there is an increase in the RUE, which partially compensates for the decrease of intercepted PAR.
Obviously, the contrasting effects of the abovementioned factors (temperature, global solar radiation, LAI, intercepted PAR, RUE, soil water content, WUE) could be fully analyzed only through a dynamic crop simulation model [
11,
12,
13] with a suitable time step (daily or hourly). This could be driven by weather data and run for a number of years sufficient to describe the climate of the selected environment (about 30 years is prescribed by the World Meteorological Organization to describe the climate for a given site).
Agronomic techniques (sowing density, plant nutrition, irrigation, integrated pest management, etc.) can promote the achievement of optimal values of LAI (for crops like maize, rice, sorghum, wheat, tomato (
Solanum lycopersicum), and soybean the ideal values are 4–6), and should be adopted to maximize the light intercepted by crop canopies. Moreover, plants should be distributed as regularly as possible in the surface unit. From this point of view, an analysis carried out for apple (
Malus domestica) orchards with the same LAI showed that square plantings (same distance between rows and along rows—1:1 ratio) intercept up to 20% more light than 3:1 system (3 times distance between rows than along rows) for a range of densities between 3000 and 20,000 trees per ha [
14]. Other experiments have shown 10% higher yields at a 12% lower tree density than more rectangular single rows [
15] (Wertheim, 1985). Moreover, square plantings give better coloration of red fruit than 3:1 plantings due to a more uniform light distribution. Despite these advantages, square plantings are rarely applied on a commercial scale because such plantings need higher capital investment for equipment adapted for over-the-row spraying and transport at harvest that may not compensate for higher yields, particularly with small-scale orchards [
14].
Another relevant factor for optimizing light interception is the orientation of rows. In this regard, regardless of any other consideration (e.g., specific guidelines imposed by the effects of slope on mechanization or the presence of strong dominant winds able to break down rows perpendicular to them), in mid latitudes a north−south orientation is optimal for most crops, as it gives the maximum amount of intercepted radiation. In the specific case of grapevines, the east−west orientation of rows is preferable as it guarantees a greater radiation intercepted in coincidence with maximum daily temperatures, which for specific varieties is particularly appreciated in the late phase of sugar accumulation (September−October).
Specific interventions like pruning or choice of species/varieties with a suitable inclination of leaves can be adopted to enhance the penetration of light into the canopy so that each foliar level can ideally receive the same quantity of light. By this point of view, dicotyledon canopies (with almost planar leaves) are farther from this ideal than graminaceous canopies with a suitable inclination of leaves. Furthermore, in the specific case of maize, current cultivars, unlike traditional ones, have fully erect leaves able to enhance penetration of light inside the canopy and homogenize its vertical profile. Light extinction in canopies can be effectively simulated by adopting Lambert-Beer’s law as stated by Monsi and Saeki in 1953 [
16].
The sunlight intercepted by canopies is a fundamental driver of crop water consumption as expressed by the Priestley-Taylor equation for calculation of reference crop evapotranspiration (ET0) on the basis of net radiation. The sunlight intercepted by a canopy is also directly correlated with water consumption expressed as percentage of reference crop needs. For vineyards with row training systems, Williams and Ayars [
17] found that the area shaded by the canopy at noon expressed as the percentage of the surface allotted to a single plant (sh%) multiplied by the empirical coefficient 0.017 gives a reliable estimate of crop coefficient (kc). This latter value can be multiplied by reference crop evapotranspiration ET0 to obtain the maximum evapotranspiration (ETM).
Moreover, solar radiation is a source of information for living beings and a series of morphogenetic effects derive from it. In many plants, initiation of flowering is driven by perception of changes in day length (photoperiodism). Plants adapted to temperate climates (e.g., photoperiodic varieties of wheat) often perceive the lengthening days of spring as a signal to initiate reproduction. Such plants are known as long-day plants, while in short day species (e.g., many varieties of chrysanthemum (
Chrysanthemum indicum) and poinsettia (
Euphorbia pulcherrima)) flowering is induced with hours of light below the critical threshold. Moreover photo-indifferent crops (e.g., many fruit tree species) are not sensitive to the length of the day [
18].
Light signals such as light quality and length of day are perceived by several types of photoreceptors including phytochromes and cryptochromes. More specifically, phytochromes detect the levels and ratio of red (R) and far-red (FR) light in the environment [
17,
18]. Phytochromes are blue photosynthetic pigments present in the leaves and sensitive to very low light intensity (even lower than 0.01 W m
−2), which explains the effects of full moon light on flowering of some plant species [
19,
20].
Photoperiodic effects give rise to precautions in moving a plant species from one latitudinal band to another or the agronomic practices useful to induce flowering in flower species in protected cultivations.
2.1. High Light Intensity Stress
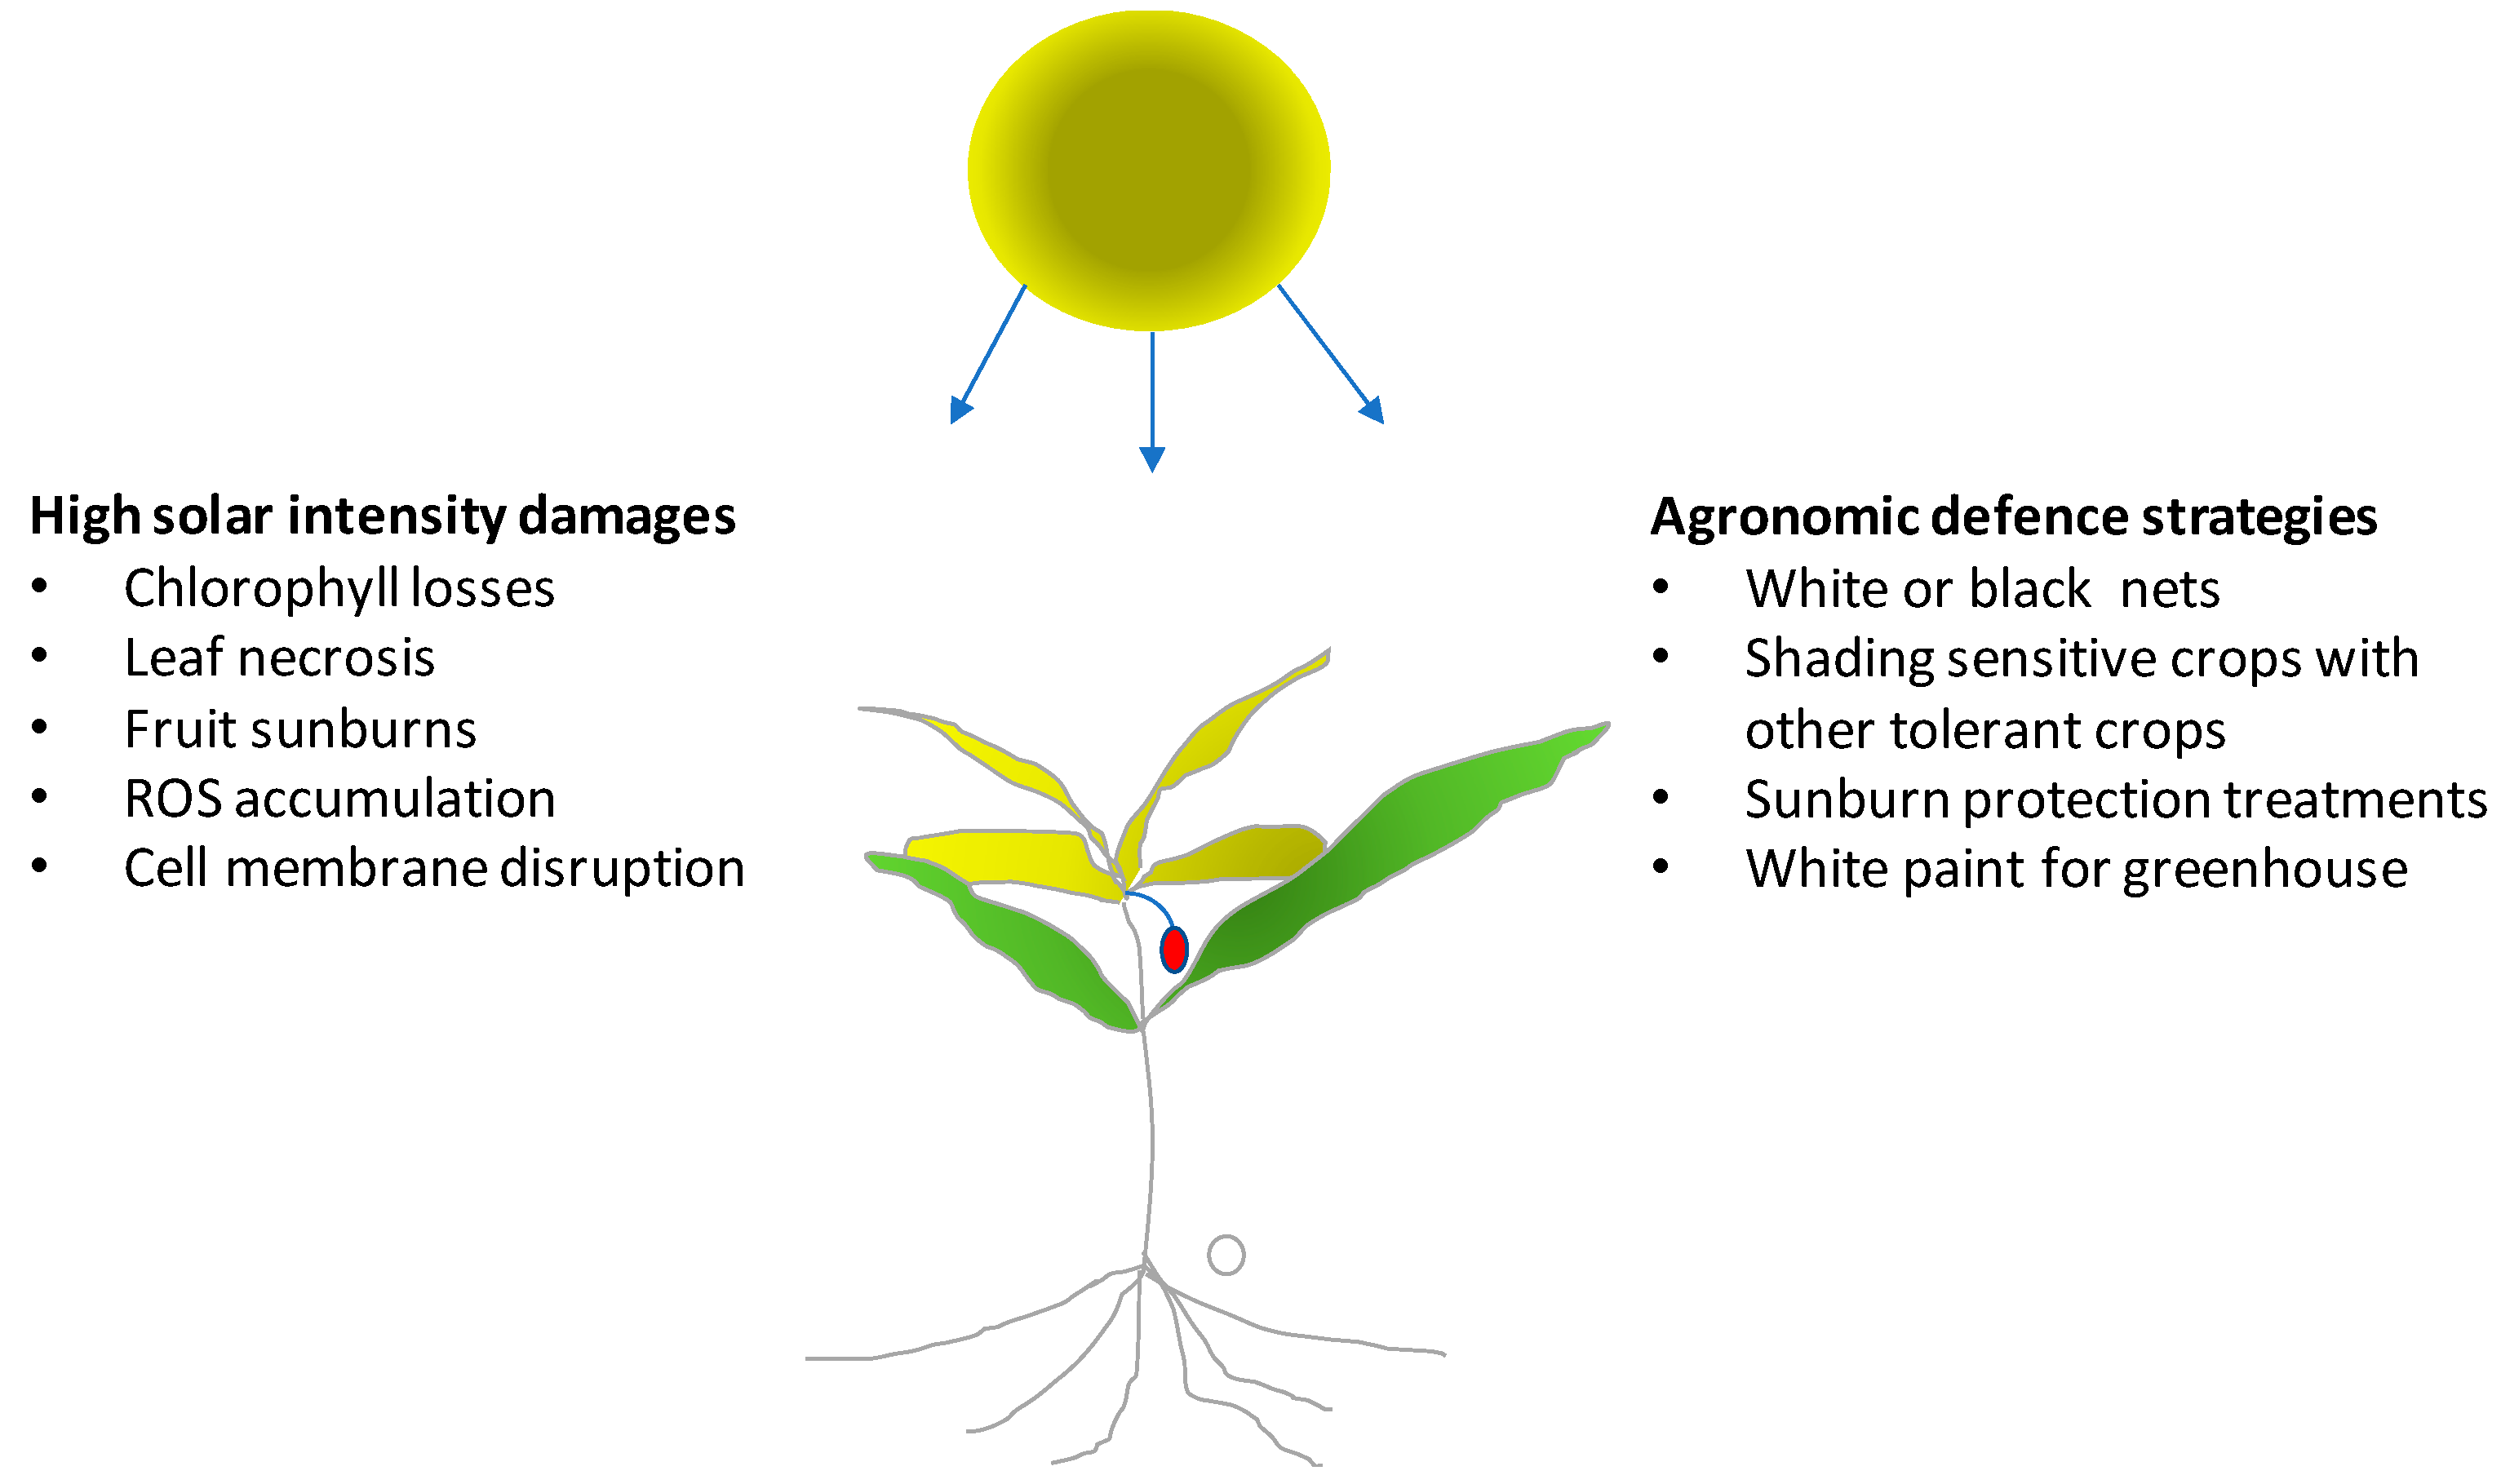
Solar radiation has a fundamental importance for crop growth, yield, and quality in agricultural systems. Light intensity and duration cannot be modified in the open field. Therefore, plants must adapt to light stress, while they can be modulated and optimized in a greenhouse. More specifically, crops in the open field during summer must protect themselves from high light intensity which can damage leaves, young shoots or even the fruits. Plants may protect chlorophyll molecules by increasing the biosynthesis and the concentration of carotenoids. These antioxidant compounds act as shields avoiding photo-oxidation of chlorophyll from excessive light intensity (
Figure 1). High light intensity also leads to the formation of reactive oxygen species (ROS), which increase photo-damage [
21,
22]. Leaf damage from high light conditions can be determined by monitoring the lipid peroxidation of leaf cell membranes and the functionality of photosystem II. The most dangerous radiation of the light spectrum that induces severe damage is UV-B radiation (280–320 nm) that has short wavelengths and high energy. The damage from UV-B radiation is especially notable on the vital macromolecules such DNA with negative effects on cellular processes. Light stress reduces the light use efficiency (LUE) and photosynthetic activity and can be observed in both the open field and in protected cultivation.
In the open field, light stress is particularly severe if associated with high temperature and drought. Agronomic strategies for reducing the negative effects of an excess of light include adequate irrigation systems, with support of sensors able to evaluate soil moisture and crop water requirements. Sufficient water availability can guarantee transpiration and, thus, thermoregulation by the evaporation of water at the leaf level which lowers leaf temperature.
In mixed crops, species with different light stress tolerances and heights can be cultivated together to provide shading of the most sensitive crop species. This strategy can be used to protect young seedlings of sensitive species against damage by strong solar radiation but can give protection against other stress factors like strong winds, low temperatures or salt. Once seedlings are sufficiently developed the crop used to protect them can be eliminated manually or by means of a selective herbicide treatment.
A high light intensity can reduce the yield and quality of young fruit directly exposed to sunlight. This is mostly important for fruit of species whose stomata no longer allow evapotranspiration with the approach of maturation, which makes them unable to thermoregulate fruit temperature. Therefore, fruit temperature shows an increase, especially with dark-colored fruit (e.g., grapevine berries of red varieties after veraison), when temperature in the presence of direct solar radiaton can exceed 45–50 °C. In these cases, damage can be direct (sunburn with cell membranes that lose their integrity) or indirect (slowing or interruption of the biosynthesis of compounds favorable to quality). Temperature of fruit can be measured directly by means of thermocouples or simulated by energy balance models [
23].
Recently several products have become commercially available that can be sprayed on plants or fruit for avoiding sun damage. Kaolin containing compounds have been successfully applied to reduce sunburn in pomegranate [
24]. Good results can be also obtained using shading nets. In apple trees, transparent and black nets were able to reduce sunburn incidence on fruit [
25]. The nets reduced the direct sun light on fruit avoiding the excessive temperature of the exposed tissue and localized physiological disorders. Moreover, in vineyards, canopy management techniques (e.g., winter or green pruning) have protected clusters by covering them with a layer of leaves, which in many cases has enhanced berry quality [
26].
In greenhouses during summer, high temperature associated with high light intensity can induce direct damage on plants. Therefore, to avoid the high temperature and light intensity, greenhouses are covered with shading nets or sprayed with white paint. As an alternative, white shading nets can also be placed inside the greenhouse. The aim of these strategies is to avoid excess heat in the greenhouse through the reduction of direct light. Water running along the roof and walls of the greenhouse in special interspaces also has potential application, since water reduces the radiation entering the greenhouse.
2.2. Low Light Intensity Stress
Some plant species are able to grow at low light conditions (termed shade plants) such as under vegetation or in areas with low solar radiation (e.g. valley bottoms, entering of caves). Most agricultural crops need high light intensity and are classified as sun plants. Shade plants have low light compensation and saturation points, while sun plants in contrast have high light compensation and saturation points. However, most plants can adapt to a range of low light conditions. The adaptation induces physiological and morphological changes in plants exposed to such conditions. In general, low light intensities induce stem elongation to overcome the shade conditions. Leaves of shaded plants increase their size and reduce their thickness and have a higher chlorophyll concentration. At a physiological level, the plants lower their light compensation point for balancing the reduced photosynthetic activity.
Low light conditions present in greenhouses during winter can be overcome by supplemental lighting using fluorescent lights, metal halide lights, high-pressure sodium lamps (HPS), or light emitting diodes (LEDs). The outputs of these lamps ideally must match the crop light utilization spectra. If the lamps have a higher emission in the regions of the leaf absorbance spectra, the LUE as well as the yield and quality are higher. LEDs can provide precise outputs and emission spectra (wavelengths) and can be readily adjusted based on the species requirements. Few studies have been performed on the effects of light intensity and quality on plant morphological and developmental processes [
27]. Plants sense and translate environmental light signals, which interfere directly or indirectly with metabolism [
28]. Light can modify auxin transport and gibberellin (GA) biosynthesis [
29,
30]. These changes can affect many aspects of plant development, including seed germination, stem elongation, and floral initiation. Light quality can modify the profile of carbon and nitrogen metabolites and those of organic acids and aromatic amino acids [
27,
31]. An alteration of the organic acids level, in particular of α-ketoglutarate, can affect amino acid biosynthesis, plant growth, and crop yield [
27]. Supplemental lighting is often very expensive, and its application is only used for the most lucrative crops such as tomato or rose.
3. Thermal Resources and Limitations for Crops
3.1. Temperature and Agriculture
Typically, in agriculture we refer to surface air temperature, which is the temperature measured with a thermometer placed about 1.50–1.80 m above a soil with a regularly mowed lawn and protected by an anti-radiation screen that ensures a suitable circulation of air around the sensor. This measure is used to estimate thermal resources and limitations for cultivated and spontaneous plants.
The temperature that would be most useful to know is that of the organs of plants. The leaf temperature is mitigated by the transpiration process, which transfers to the atmosphere 2450 J g−1 via transpired water. Consequently, the leaf temperature of well-watered plants is close to that of the air. However, when soil water is insufficient, plants close their leaf stomata, and the leaf temperature rises to levels significantly higher than the air.
Another important variable is the temperature of the soil layer explored by roots. It can be measured at different depths, although usually for agricultural purposes it is only gauged at 10 cm in depth because the most superficial soil layer is also the only one that shows a significant daily cyclicity.
3.2. Temperature and Some Physical Presuppositions
Temperature values and variability in space and time obey physical presuppositions that are briefly summarized here. Hot and cold air behave as non-miscible fluids and cold air, being denser, flows downward along the sides of hills and mountains and gathers in valleys, depressions and concavities of the ground. Moreover, during the day, the sun warms the ground and this warms the air layers over it while, during the night, the ground cools radiating energy toward space and cools the layers of air over it. The strength of the ground radiative cooling towards space is directly proportional to the fraction of sky visible from it (sky view factor (SVF)), and it is at a maximum for a flat plain without surrounding obstacles (mountains, trees, walls, buildings, etc.) or for the tops of hills and mountains. These latter locations have a higher SVF than the bottom of the valleys, which also cool indirectly due to the cooler dense air that descends from higher elevations along the slopes with cold air accumulation in the lowlands (cold lake effect).
Above the cold lake there is a milder area called a thermal belt, which is an area of thermal optimum. Historically, villages of the European Alps and Italian Apennines were often built in the thermal belt mainly because the need for winter heating is lower.
The most favorable exposure, from the perspective of thermal resources, is the south face, while the north face is the least favored. In an intermediate position with respect to these two extremes are the sides facing west and east, the latter being thermally more favored because the eastward-side is the first to receive the sun in the morning, when light energy must warm the surfaces that are cold after the night and are often dew-covered (informally described as “the sun works on the cold”) before the air is heated. When the sun illuminates the west facing slopes in the afternoon, it heats already warm slopes.
Maximum and minimum daily air temperatures are mainly determined by:
The energy balance of the underlying surface;
The short distance transport by downslope and upslope air movement;
The advection of air masses from more distant areas; for example, in Europe, the advection of subtropical air masses from the intertropics, Arctic air masses from the polar region and polar continental air masses from Siberia;
The rising of air from the surface resulting in cooling (convection);
The compressional effect typical of dynamic anticyclones where air masses are animated by a vertical descending motion of high pressure.
In addition, soil covered by vegetation heats up less than a bare soil during the day and cools less during the night, and soil covered with a sufficiently thick snow layer shows a constant temperature near the surface close to 0 °C, which also maintains some microbial activity.
3.3. Quantitative Approach to Temperature Resources and Limitations for Plants
Temperature is a primary driver for plant growth and development (G&D). Therefore, the objective of the grower is to optimize thermal resources and minimize limitations, to meet the business objectives (i.e., quantity and quality of crop production). Given specific values of daily or hourly temperature, to discriminate between resources and limitations, adequate G&D happen only in a specific thermal range delimited by the two reference values, the lower cardinal (LC) and the upper cardinal (UC) temperatures [
32]. Furthermore, in this primary thermal range it is possible to detect a sub-optimal range (delimited by lower optimal (LO) and upper optimal (UO) temperatures) where G&D happens without thermal limitation. Below the LC and above the UC values, there are mortality thresholds for low (CL) and high (CH) temperatures [
25].
Values of cardinal temperatures for various species are shown in
Table 1. However, it should be noted that cardinal temperatures for each species and variety may vary with phenological stage. For wheat, the values of LC, LO, UO, and UC are 3.5, 20, 24, and 33 °C, respectively, from sowing to emergence; −1.5, 4, 6, and 15.7 °C for vernalization; 1.5, 9, 12, and >20 °C for terminal spikelet; and 9.5, 19, 23, 31 °C for anthesis and 9.2, 19, 22, 35.4 °C for caryopsis development until ripening. On the other hand, LC, LO, UO and UC for some general processes of wheat are −1, 21.5, 22.5, 24 °C, respectively, for leaf initiation; 3, 20, 21, >21 °C for shoot growth; and 2, 12.5, 20, >25 °C for root growth [
27,
33].
If T
m is the daily average temperature, daily thermal resources useful for G&D can be expressed as growing degree days (GDD) or normal heat hours (NHH). GDD are calculated by the following equation:
where GDD = 0 for T
m < LC. Moreover, to evaluate the depleting effect of high temperatures on G&D, the following alternative truncated conditions are adopted: If T
m > UC then T
m = UC or T
m = UC − (T
m − UC).
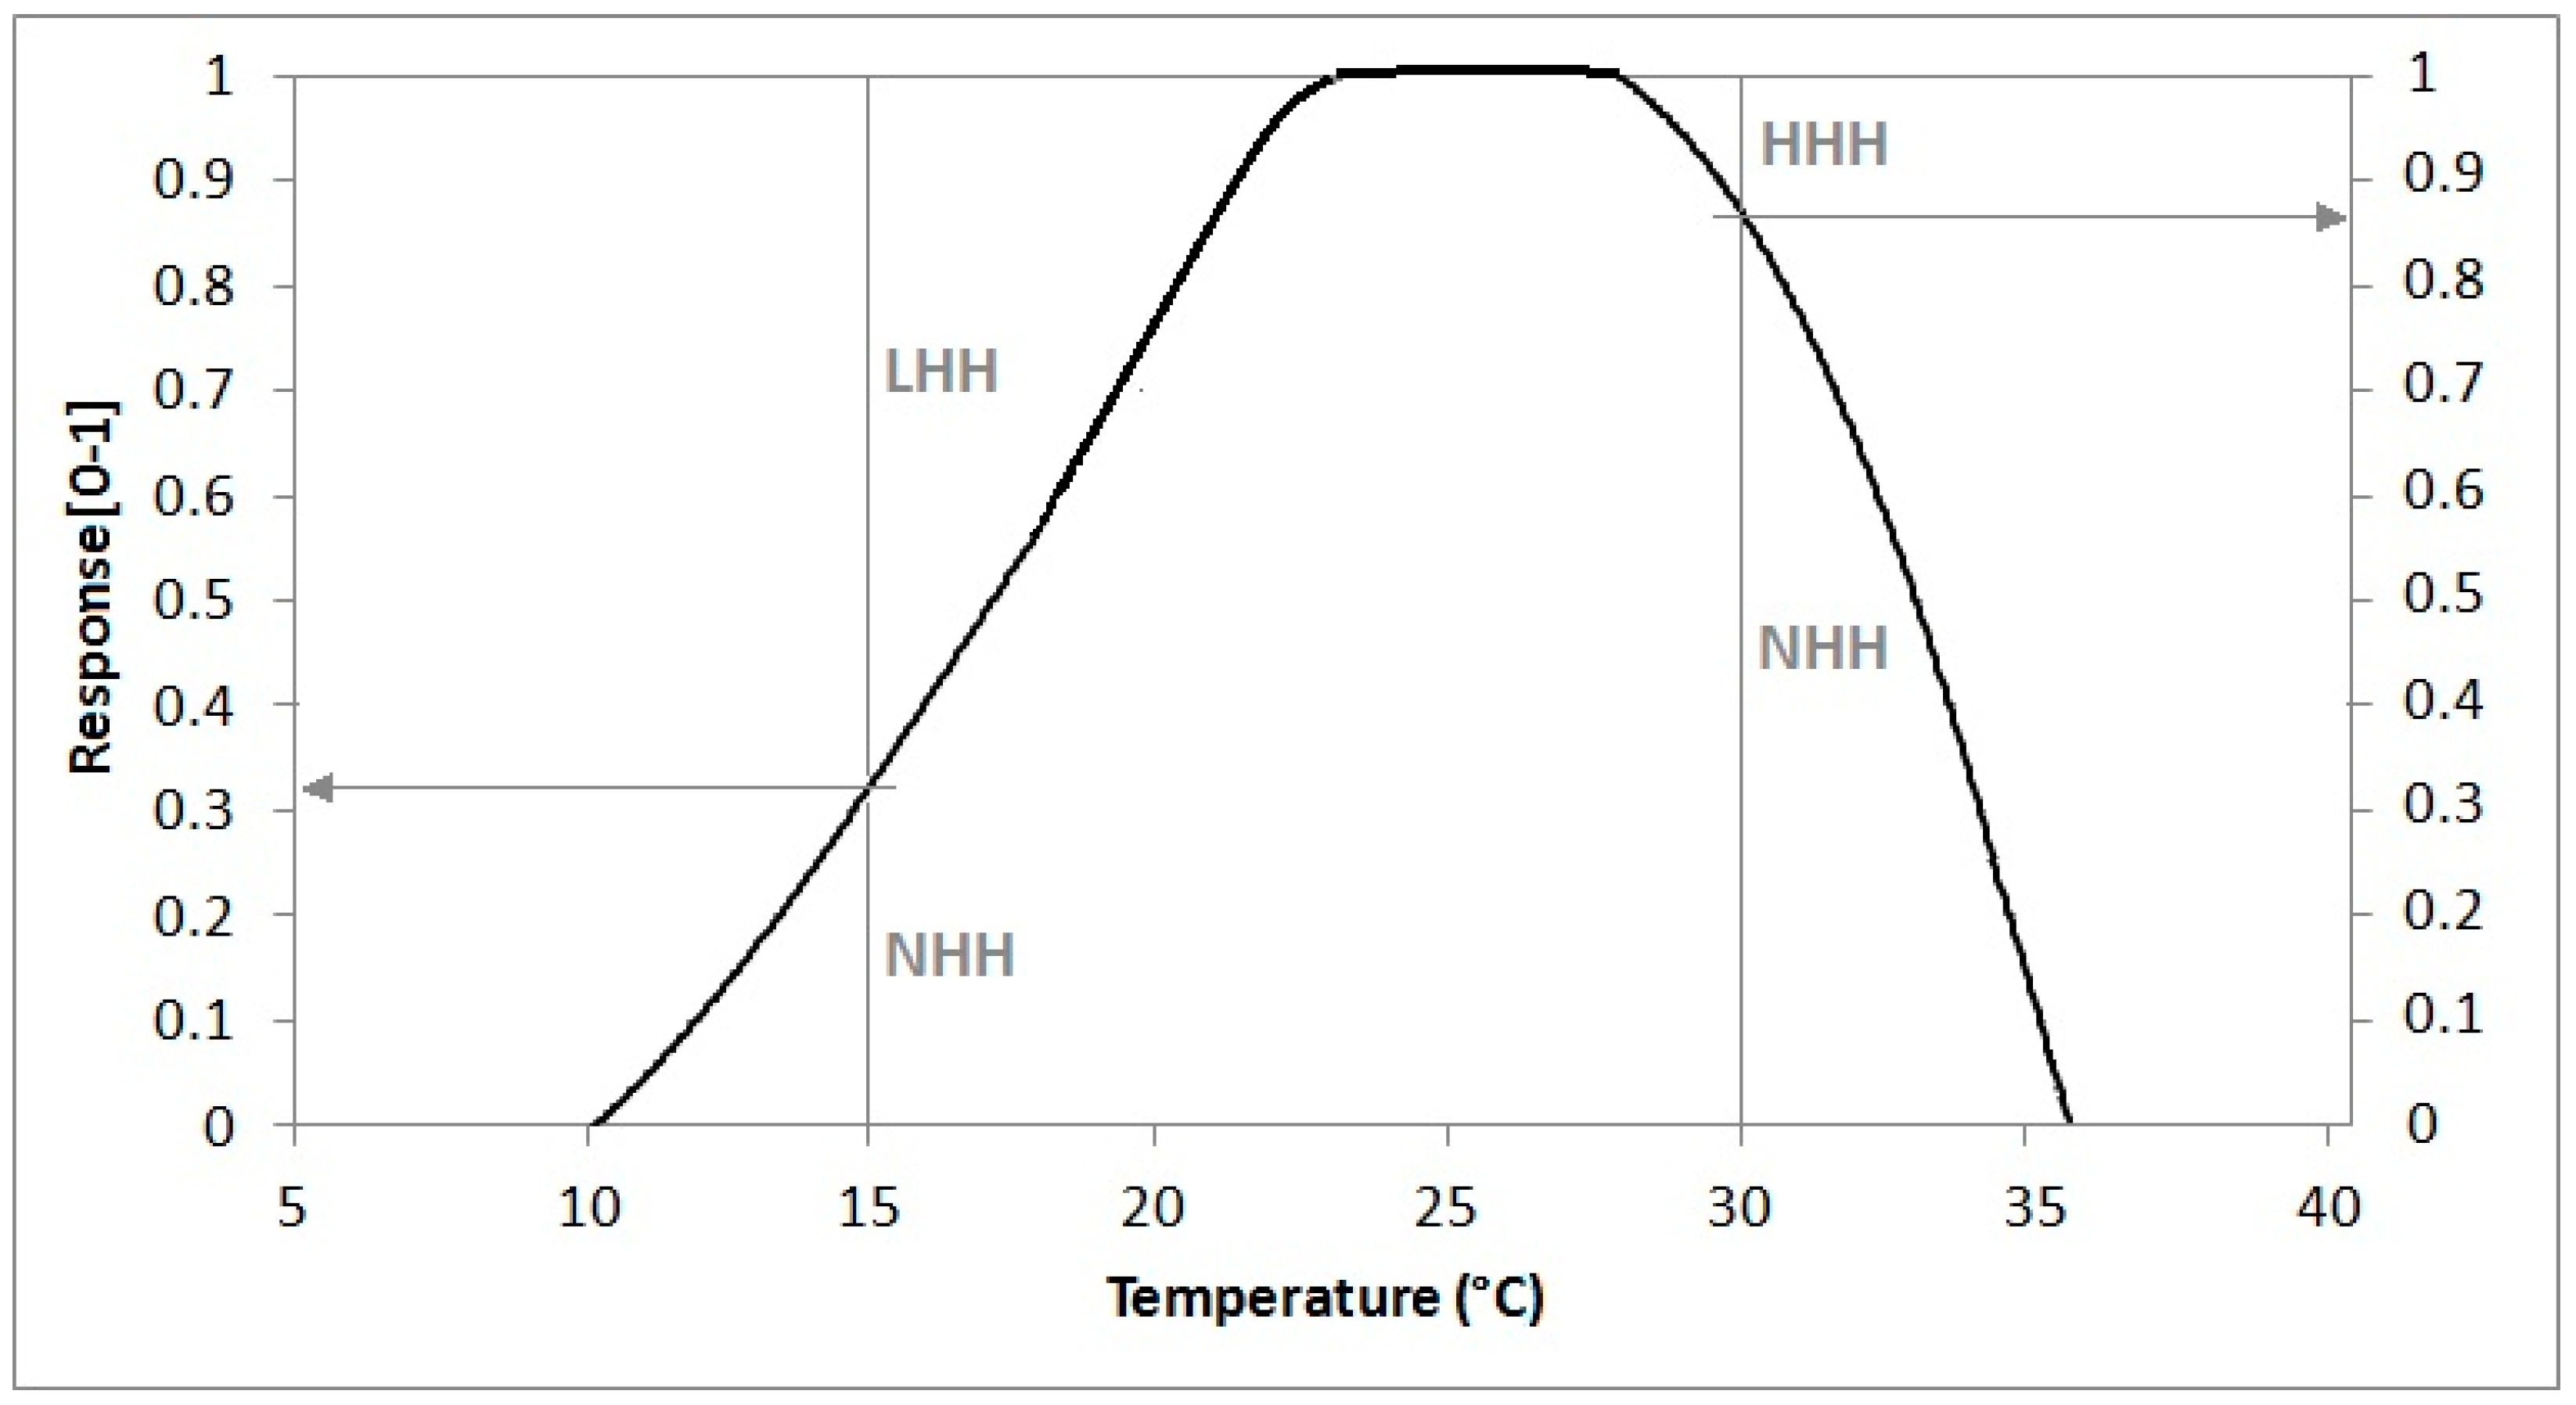
A more physiologically-based way to simulate thermal resources, taking into account the effect of sub-optimal or supra-optimal temperatures, is provided by the NHH method that converts hourly average temperatures to a normal value in the range 0–1 by means of a suitable response curve like that shown in
Figure 2, growing from 0 to 1 between LC and LO, equal to 1 between LO and UO and linearly decreasing from 1 to 0 between UO and UC [
34]. This method enables quantification of thermal limitation by low temperatures, when normal hours are useless because they are sub-optimal (LHH), and by high temperatures, when normal hours are useless because they are supra-optimal (HHH), respectively expressed as a complement to 1 for the NHH value.
NHH, LHH and HHH values for a given mean hourly temperature (ATH) can be obtained by means of the following simple algorithm (statements are given in Pascal pseudo-language code).
| if (ATH ≤ LC) or (ATH ≥ UC) then NHH = 0 else |
| if (ATH ≥ LO) and (ATH ≤ UO) then NHH = 1 else |
| if (ATH > LC) and (ATH < LO) then |
| begin |
| m: = 1/(LO − LC); |
| q: = 1 − LO/(LO − LC) |
| NHH = m * ATH + q |
| end else |
| if (val1 > UO) and (val1 < UC) then |
| begin |
| m: = −1/(UC − UO) |
| q: = 1 + UO/(UC − UO) |
| NHH = m * ATH + q |
| end |
| if ATH < LO then LHH = 1 − NHH |
| if ATH > UO then HHH = 1 − NHH |
This algorithm is based on a theoretical response curve with a trapezoidal shape. The real curve is the result of the whole set of physiological processes ruled by temperature, which means that the availability of experimental curves could be important for enhancing the proposed approach.
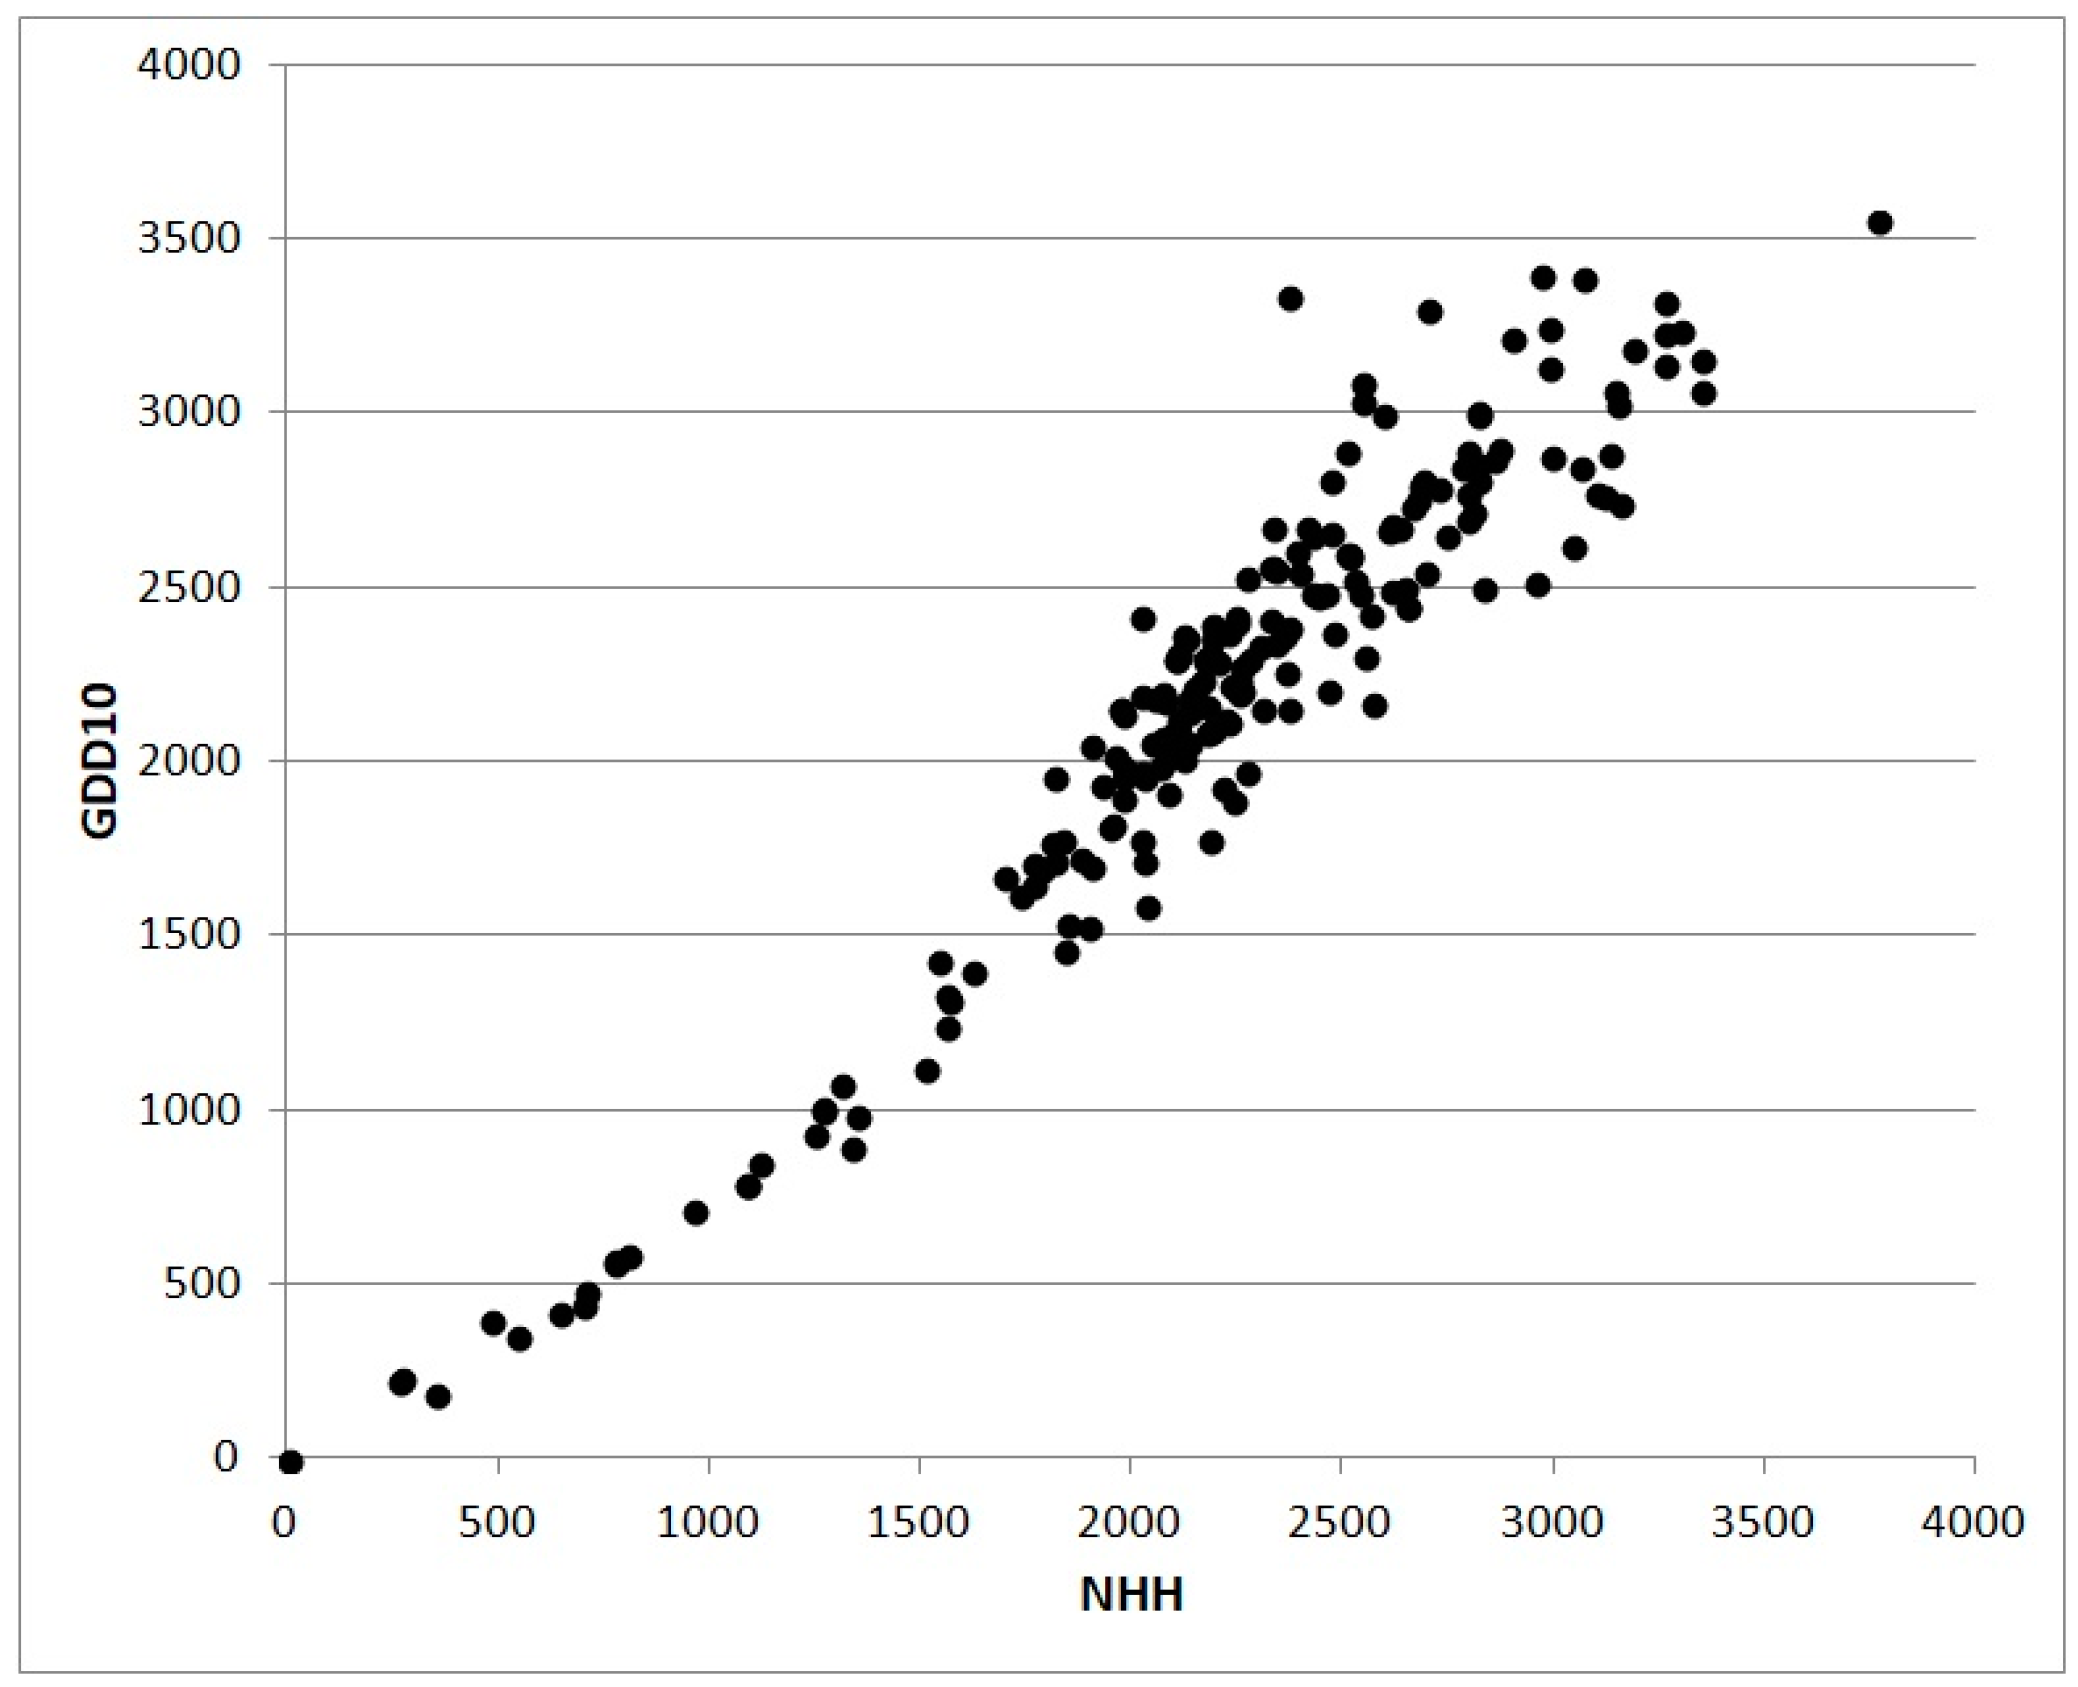
GDD or NHH cumulated from the sowing date to a given day can be used to simulate the phenological stage (flowering, fruit-set, ripening and so on), cumulative biomass, or some derived indexes such as the LAI [
35]. The scatterplot in
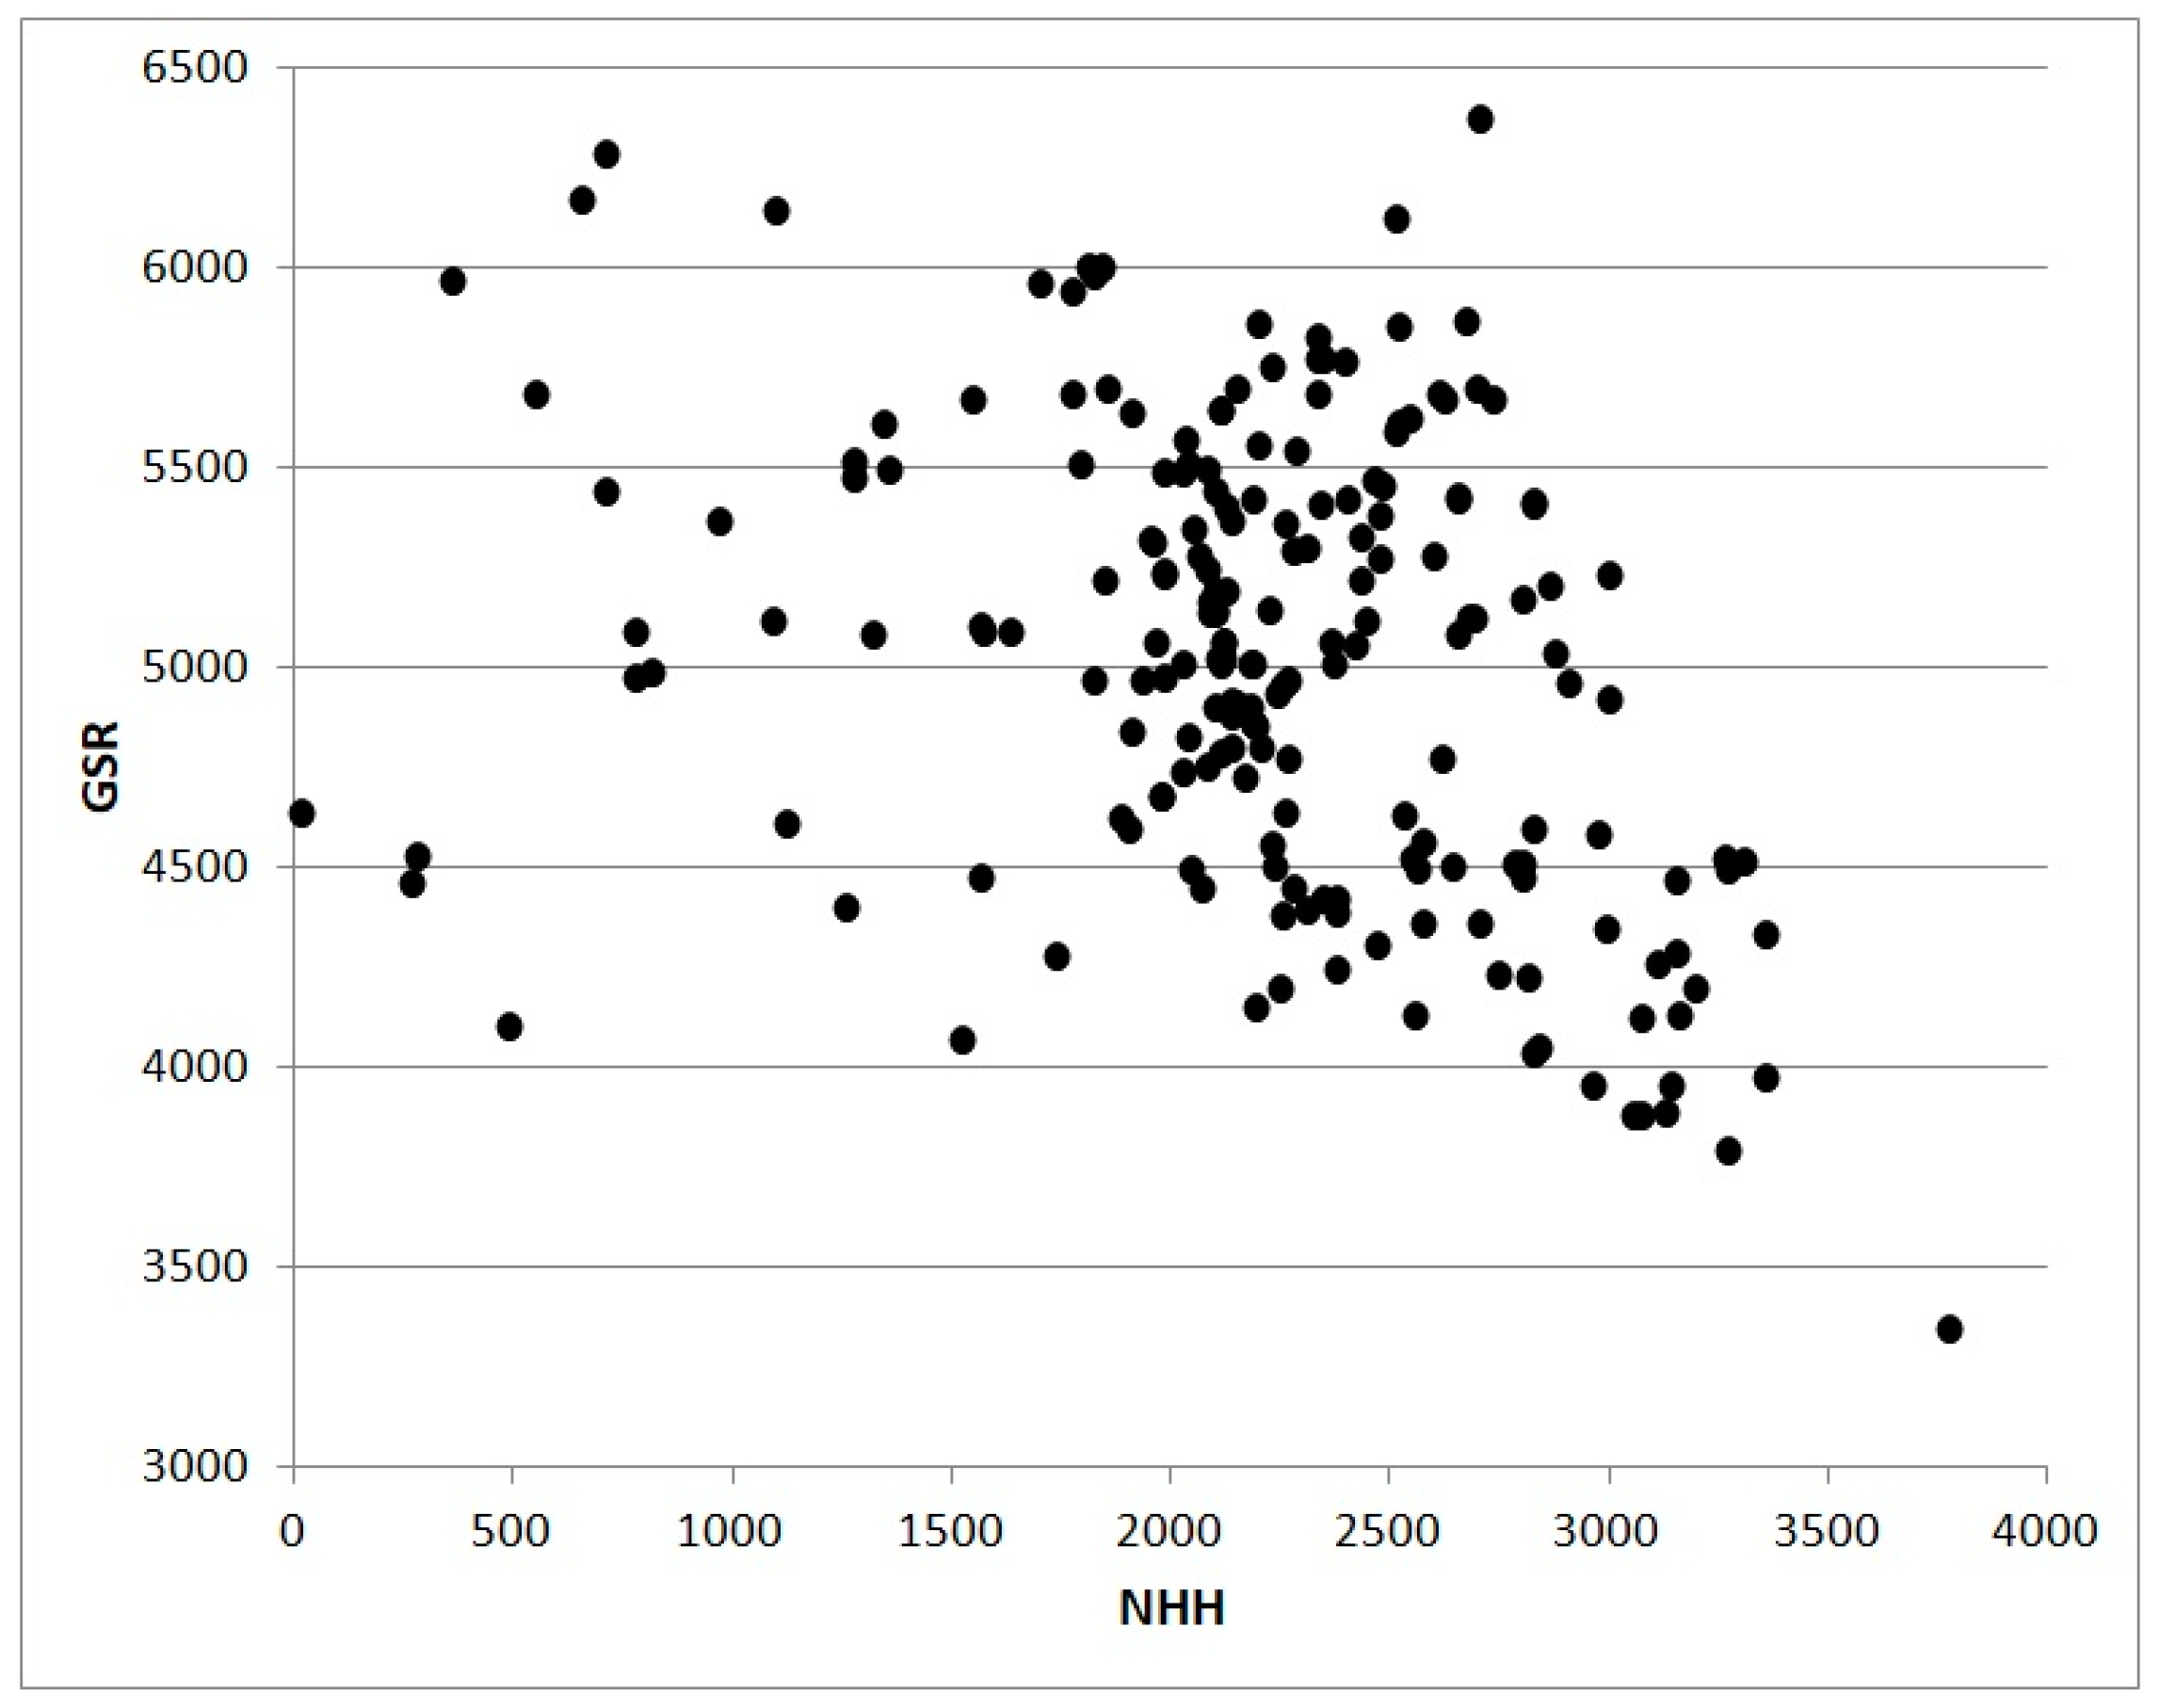
Figure 3 shows the relation between values of NHH and GDD without truncation calculated for 202 Italian stations in 2017. The shape of the cloud of points are the consequence of the less physiological approach based on GDD subject to an overestimation growing with the increase of thermal resources. The scatterplot in
Figure 4 also from 2017 shows the relation between NHH and Global Solar Radiation for the same stations analyzed in
Figure 3. The poor correlation is a result of high altitude stations characterized by high values of radiative resources in coincidence with low or null NHH.
Temperature is also an important source of information for plants because it indicates the season, allowing optimization of their phenological rhythm in relation to thermal, radiative, and pluviometric features. An example of this is the vernalization process to which several species of medium-high latitudes are subjected. Exposure to low temperatures for a certain period of time, is essential for spring vegetative recovery and the development of vegetative and reproductive organs. Chilling is expressed as chill units (CU), and calculated in the same way as NHH, but by adopting an LC = 0 °C, LO = UO = 7 °C, and UC = 14 °C. CU can be obtained with the same algorithm previously described for NHH calculation. In many species vernalization and photoperiod cooperate to induce flowering in periods suitable for thermal and water resources [
36].
Particular attention should be paid to temperatures below the critical threshold CL. By this, frost tolerant species when in full vegetative rest (tissues hardened which means low water content and high concentrations of cellular soluble solids) are able to withstand very low temperatures, such as critical low temperatures of −9/−10 °C for olive (
Olea europaea L.), −15/−18 °C for grapevine and −20/−22 °C for wheat. It is more difficult to establish the upper critical threshold CH because heat stress from high temperatures depends primarily on canopy temperature rather than on air temperature. So, the interplay between various environmental variables (soil water content, relative humidity, wind speed and global solar radiation) and the stomatal response of plants affects leaf temperatures which can vary substantially for the surrounding air temperature. In general, as stated by De Boeck et al. [
37], leaves tend to heat up when stomatal conductance is low (drought conditions) and this effect is strengthened by high solar radiation and high relative humidity, while high wind speeds brings the leaf temperature closer to the air temperature, which can imply either cooling or warming (i.e., abating or reinforcing heat stress) depending on other prevailing conditions. Furthermore, the effect of wind is more relevant with small leaves which have a reduced boundary layer and oscillate easily, enhancing the exchanges of heat with air. For this reason, plants affected by heat stress tend to develop more small leaves than plants growing in environments without stress.
Higher temperatures change root architecture, acting on primary root elongation rate and the overall shape of the root system giving a shallower and broader root distribution and a general increase in lateral root branching as stated by Gray and Brady [
38]. The same authors noted that reproductive growth was altered by heat stress for rice which showed an optimum at 33 °C for vegetative growth, while grain formation and yield were negatively affected by temperatures above 25 °C. Moreover temperatures above 33 °C reduced viability of pollen which reached zero for temperatures of 40 °C with a similar phenomenon for sorghum (optimum at 26–34 °C for vegetative growth and at 25–28 °C for reproductive growth) and for Arabidopsis (
Arabidopsis thaliana), where the abortion of the whole inflorescence was observed at a temperature of 36 °C. Gray and Brady [
39] emphasized the cellular response to temperature stress which includes altered organization of organelles, cytoskeleton, and membrane structure. To maintain membrane stability and normal cellular functions in the presence of heat stress, plants synthesize heat shock proteins (HSPs), molecular chaperones that prevent protein misfolding or aggregation, as well as other co-chaperones, hormones, and other protective molecules. Expression of HSPs is induced by heat-stress transcription factors (HSFs) that bind to heat shock elements in the promoters of HSPs. There are many steps of regulation allowing dynamic control of the heat stress response, as the HSFs themselves can be post-transcriptionally modified. In addition to the constitutive role that HSPs play in heat stress responses across cell types, these proteins can acquire specialized functions that regulate developmental responses of organs to environmental stress.
3.4. Agronomic Approach to Thermal Resources and Limitations
The choice of agronomic solutions should be based on a sufficiently detailed territorial agroclimatic analysis, and finalized to quantify thermal resources and limitations for different environments. In such an analysis, it is appropriate to consider the traditional agronomic choices typical of the selected territory because in many cases they are the consequence of a secular adaptation that has discarded fewer effective solutions. In this sense, for example, the Italian alpine territories have a traditional use for forestry and pasture for the slopes exposed to the north, while those exposed to the south are primarily used for fruiting or viticulture which are concentrated in the thermal belt, as in great valleys such as the Valtellina, Valle d’Aosta, and Adige River Valleys, which are located between 250 and 750 m above sea level (asl). Similarly, the Apennine territories have a typical summer crops of maize, sunflower (Helianthus annuus), and tobacco (Nicotiana tabacum) in the valley bottoms, most exposed to winter and spring frost, while grapevines are located on the lower slopes, at intermediate risk of frost, and finally olive, most sensitive to frost, is traditionally located in the thermal belt which in the Apennines is often between 150 and 350 m asl.
Agroclimatic analysis must be founded on meteorological data of at least 20–30 years close to the present time to provide information representative of the current climate. In the light of resources and limitations (not only the average but also the absolute minimum and maximum and the probability of yearly values lower or higher than specific thresholds), agronomic practices useful for optimizing resources and minimizing limitations can be employed.
Almost the entire set of agronomic practices (soil cultivation, pruning, weeding, fertilization, irrigation, and so on) influence temperatures by interfering with the terms of the energy balance of the field. Thus, only the most important decisions for optimizing thermal resources and minimizing thermal limitations in a given field/territory will be reported. They can be subdivided into strategic decisions (that involve farm activity for many years) and tactical actions (that involve the farm activity only for the current year). Obviously, all these decisions should be founded on both technical and economic evaluation.
The first fundamental decision is the right choice of species and varieties best suited to the planting area, and this should be done after evaluating the length of the growing season and the mean and extreme dates of the beginning of the main phenological stages (e.g., dates of bud-break and ripening must be compatible with the dates of the last killing frost), and the compatibility with the temperature resources (chill units for vernalization, NHH or GDD needed to close the crop cycle), and limitations (LTL, HTL).
The prevention of cold damage should be founded on the uniformity of field morphology to prevent cold air storage which may occur due to the presence of depressions and irregularities in the field slope. It is also important to have suitable openings in barriers (drywalls, compact rows of trees or bushes, etc.) that limit the drainage of cold air enhancing the risk of frost. The adoption of active frost protection systems (low volume sprinkler irrigation over or under-canopy, stoves, candles, etc.) is a relevant decision that should be taken with a careful evaluation of the installation and handling costs and staffing requirements related to system operability.
For poorly drained fields, where a relevant limitation is water excess during winter that slows the spring warming of soils, the hydraulic arrangement of the terrain with ditches or subsurface drains is of paramount importance.
The choice of suitable training systems is important, both for the prevention of cold and heat damage. In fact, the height of the canopies of grapevines and fruit trees is directly related to the risk of frost damage because the coldest layers are closest to the ground. Furthermore, fruit damage from heat should be avoided by adopting training systems that protect fruit with a layer of leaves mitigating thermal extremes.
The risk of high temperatures should be evaluated during planning of harvest activities to prevent loss of quantity and quality of products. In this regard, consideration of options may include harvest machinery, work organization and machinery utilization. For example, harvesting grapes at night, use of refrigerated bins for transport of harvested clusters, and a quick crushing soon after harvesting are solutions sometimes adopted for hot climate viticulture to prevent unwanted fermentation.
Among the tactical decisions, making a rational choice regarding the sowing or transplanting periods for annual herbaceous species and of the planting times for perennial crops (trees, shrubs and herbaceous species) is also important. This decision should be founded on weather forecast information derived from good quality climatological data.
It should not be forgotten that, in conditions of water scarcity, plants close their stomata and the cooling of the foliar tissue are entrusted to the air. In this case, it is useful to plant the crops in rows parallel to the dominant winds to favor the penetration of air into the canopies.
The appropriate use of irrigation is also important in order to limit the negative effects of high temperatures on field crops. The mitigating effect of irrigation on maximum temperatures at a territorial scale was described by Lobell and Bonfils [
39] who, working on a long time series of air temperatures for California (1934–2002), highlighted the strong mitigating effect of irrigation that was quantified in a 5 °C reduction in maximum temperature of the entire surface of the State had it been irrigated.
A melon (
Cucumis melo L.) crop is transplanted early in spring when air and soil temperatures reach 14 °C in order to harvest the fruit early to get the highest price on the market. Lower temperatures can induce chilling injury and delay the recovery and the production of the plants [
40]. The agronomic strategy to reduce low temperature damage is to use mulches or rowcovers [
41]. Mulches with black or white plastic films can reduce thermal excursion. A black film can increase the soil temperature and increase G&D shortening the production cycle. Rowcovers can increase the soil and air temperature around the transplanted plants.
In summer, high temperatures can accelerate G&D of the plants too much, inducing a fast ripening of fruits with a shortened growing cycle. Such fast growth usually reduces the quality of fruis since the photosynthetic period is short and the sugar loading in fruit is reduced, resulting in low quality fruit. The best strategy is to avoid this problem is to identify the best genotype, cultivar or variety, since there are differences in sugar accumulation during ripening related to sucrose phosphate synthase and acid invertase activities [
42]. In the open field, another agronomic strategy to reduce the negative effect of high temperature is to improve thermoregulation by keeping the soil water content high, if there is adequate water availability.
Thermal stress conditions can be detected by measurements carried out with thermal infrared cameras managed by hand or installed on drones or satellites. Symptoms of thermal stress can also occur in the presence of pests and diseases that alter stomatal functionality which is essential for plant thermal regulation.
5. Future Prospective and Conclusions
Understanding the sources of abiotic stresses, how plants respond to them for improving tolerance, and the use of specific agronomy strategies for stress alleviation is essential. With reference to the scheme of the production model in
Figure 2 of Mariani and Ferrante [
1], the present analysis of resources and limitations related to light radiation, temperature, and RH has been performed. This analysis follows the analysis of abiotic factors carried out in Mariani and Ferrante [
1].
It is important to consider that crop management needs an overall view of the atmospheric variables and the meteorological events that occur in a given year. For example, in the case of the temperate rice cropping areas (about the 35% of the total rice world area), it is well known that:
Low values of global solar radiation and suboptimal/supra-optimal temperatures reduce photosynthesis, while low daily thermal ranges reduced the translocation of biomass from leaves to storage organs:
Water for paddy rice submersion can be insufficient in years with low levels of water resources;
Long rainy periods are serious obstacles to the rational management of weeds, pests, and pathogens, preventing timely spraying of pesticides, fungicides, and herbicides;
Low temperatures during floral differentiation enhance rice male sterility with drastic reduction of yields. The critical threshold for rice sterility is 12 °C and farmers generally counteract this problem by increasing the water level in rice ponds;
Long periods of high temperatures (mean daily values above the 26 °C threshold) enhance rice cracking and rice chalking, phenomena that reduce significantly the quality of the final product and that are also strictly related to varieties and nutrient management;
Meteorological variables like temperature, relative humidity, and rainfall have a strong influence on rice pests, weeds, and pathogens.
Diseases impose a series of strategic and tactical choices suitable for preventing and controlling them, ranging from the choice of varieties and sowing periods to the strategies of water, pest, and weed management. These strategies have evolved over the centuries, and have been refined based on the available technologies and the experience acquired by the farmers, in response to the constant interaction with the climate which characterizes the area under examination. For the main European rice cropping area, located in the north of Italy (where rice has been cultivated since the 15th century), an historical document of great value for appreciating this aspect is provided by the correspondence between Camillo Benso, Count of Cavour, and his partner Giacinto Corio [
58,
59] who managed the three large farms of Leri, Torrone, Montarucco with a total area of more than 400 hectares. From these letters emerge the profound agronomic culture that characterizes not only Giacinto Corio, but also Camillo Benso who was then prime minister of the kingdom of Piedmont and the main father of the unification of Italy. Today, this agronomic culture derived from constant interaction of the farmer with atmospheric phenomena is a key element of global food security, and the task of science is to make it more rational and based on qualitative data and interpretative and predictive models. The mitigation of stressful conditions can be achieved using appropriate agronomic management practices that have to be chosen harmonizing all production factors in a specific area with well known pedo-climatic conditions.
In this two part review, we have analyzed some relevant abiotic stress factors (drought, hypoxia, and lodging in the first part [
1], and temperature, light intensity, and relative humidity in this second part). We have described the stress factors, and the agronomic strategies for mitigation and adaptation to them. From this we can derive some suggestions to guide future approaches to such abiotic stresses.
Firstly, it is necessary to improve our knowledge of the main stress factors in each production area, including their average incidence, and their variability in space and time. These analyses are now feasible by the availability of monitoring tools for agroclimatic conditions, soils, and crops. For the future a more systematic approach to these analyses is needed. It is of paramount importance that a more general adoption of techniques for timely monitoring of crop performance and pedoclimatic conditions (e.g., agrometeorological stations and remote sensing techniques based on satellites and drones) that allow defining the mesoscale and microscale variability of the various stress factors be established. In addition, the availability of time series of meteorological, phytopathological and productive data is also essential. These series at the regional level should be available to farmers and technicians by authorities. Farmers should take care of collection and archiving of time series within their farm.
Another essential factor to promote is the knowledge of the ability of different species and varieties to adapt to stress factors to be able to counteract the stress with a suitable varietal choice and crop succession. Genetic improvement of crops must be accompanied by the adoption of suitable and innovative cultivation techniques (mechanization, training systems for orchards and vineyards, hydraulic-agrarian arrangements, tillage, irrigation, fertilization, weeding, pest control, etc.).
The choice of the optimal times for the execution of the different field activities (times for soil cultivation, seeding periods, and harvesting) is another crucial factor to limit the negative effects of stress.
The adoption of precision farming techniques is useful for dominating the microscale variability of the different stress factors. Moreover, the adoption of conservative agriculture practices allows maintaining the levels of the resources within the limits of acceptability for different crops (e.g., dry farming).
Use of computerized decision support systems (DSS), and extension activities, are essential for engaging farmers in the process of innovation in genetics and crop production techniques. This aspect is more important considering that at the world level agriculture is carried out by 590 million farms with characteristics that are extremely diversified by size, number of workers, levels of mechanization, and openness to the market.
It is also important to maintain a central role for agronomy seen as the science of cultivation. This discipline should maintain its own centrality as a science that guides the producer to optimize their results in terms of quantity and quality of the products obtained.
A further element worthy of comment is the interaction between agronomic techniques and genetic innovation aimed at the improvement of the resistance to abiotic stresses. A complementary relationship should generally be desirable because every new variety needs to be embedded in an agronomic context favorable to the full expression of its potential resistance to abiotic stresses. Furthermore, agronomic techniques can be a realistic way to mitigate the negative effects of abiotic stresses while strategic actions of genetic improvement are carried out and the new varieties are available to farmers. In conclusion, we hope that this analysis, obviously somewhat brief given the vastness of the topic, can help those who for different purposes are concerned with the determinants of agricultural production.


