Article

Light Intensity Drives Species-Specific Growth and Phytochemical Accumulation in Microgreens

by
Tatiana P. L. Cunha-Chiamolera
1,2,
Tarik Chileh-Chelh
3,
Miguel Urrestarazu
1 and
José Luis Guil-Guerrero
3,*
1
Department of Agronomy, University of Almeria, La Cañada de San Urbano s/n, 04120 Almeria, Spain
2
Department of Agricultural Production, Faculty of Agronomic Sciences, University of Tarapacá, Arica 11315, Chile
3
Food Technology Division, ceiA3, University of Almeria, La Cañada de San Urbano s/n, 04120 Almeria, Spain
*
Author to whom correspondence should be addressed.
Horticulturae 2026, 12(2), 200; https://doi.org/10.3390/horticulturae12020200
Submission received: 27 December 2025 / Revised: 30 January 2026 / Accepted: 2 February 2026 / Published: 5 February 2026
(This article belongs to the Special Issue New Advances in Green Leafy Vegetables)

Abstract

Microgreens are nutrient-dense functional foods whose yield and phytochemical composition can be regulated through light management in controlled-environment agriculture. This study evaluated species-specific responses to light intensity by analysing growth, nutrient uptake, and phytochemical accumulation in carrot, basil, arugula, and radish microgreens grown under LED lighting at four photosynthetic photon flux densities (PPFD: 67, 100, 140, and 174 μmol·m−2·s−1). Drainage pH and electrical conductivity remained stable across treatments, indicating consistent fertigation conditions. Increasing light intensity enhanced water, nitrate, and potassium uptake and promoted biomass accumulation in all species, although responses varied in magnitude. Phytochemical profiles were strongly modulated by irradiance. Intermediate PPFD levels (100–140 μmol·m−2·s−1) generally maximised carotenoid, sterol, and squalene accumulation, whereas lower irradiance (67 μmol·m−2·s−1) increased vitamin C and tocopherol contents, indicating activation of antioxidant defence mechanisms. Principal component analysis showed that species identity was the primary driver of phytochemical variability, with light intensity acting as a secondary modulator. Carrot and basil responded most strongly to intermediate irradiance, while arugula and radish exhibited greater vitamin C accumulation under lower light. These results support the use of species-specific light strategies to optimise microgreen yield and nutritional quality.

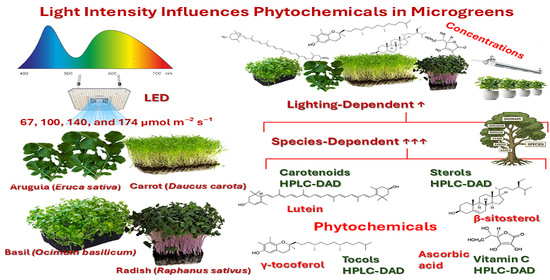
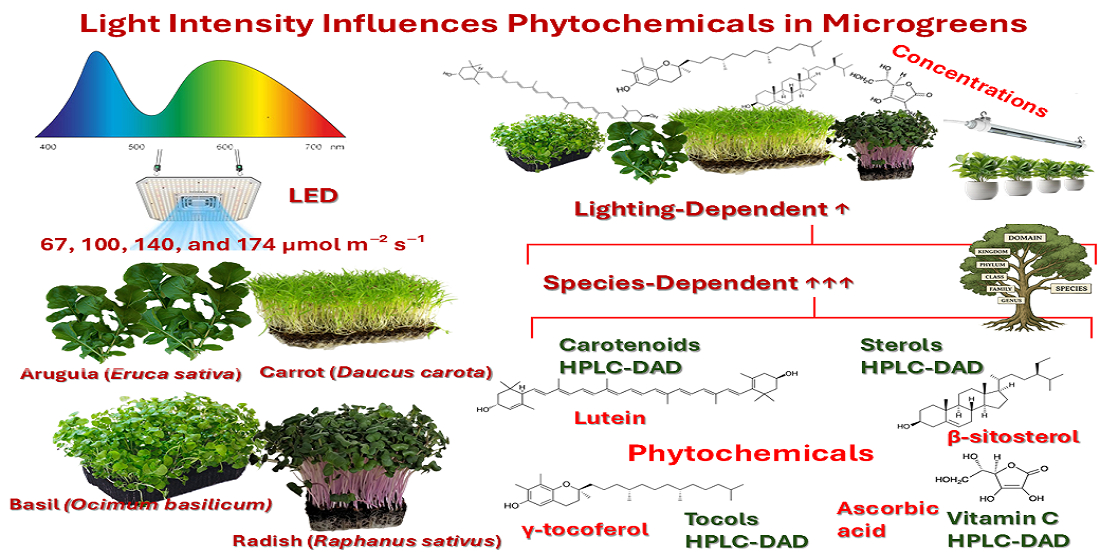
Graphical Abstract

1. Introduction

Microgreens are young, tender plants harvested at an early developmental stage, typically between 7 and 21 days after germination, when cotyledons are fully expanded and the first true leaves may begin to emerge. In recent years, microgreens have gained substantial attention in nutrition science and sustainable agriculture due to their high nutrient density, short production cycle, and suitability for controlled-environment agriculture (CEA) systems [1,2]. Their capacity to be cultivated in small spaces with limited resource inputs has positioned microgreens as promising crops for urban farming, vertical agriculture, and localised food production.
A growing body of research highlights the significant health-promoting potential of microgreens. These young plants are rich sources of vitamins, minerals, antioxidants, and bioactive phytochemicals, including flavonoids, carotenoids, and phenolic compounds, often occurring at higher concentrations than in their mature counterparts [1,3,4]. Consumption of microgreens has been associated with a range of beneficial physiological effects, such as anti-inflammatory, anti-carcinogenic, anti-hyperglycemic, and immunomodulatory activities, suggesting their potential role in reducing the risk of chronic non-communicable diseases [2,5]. In addition to their nutritional value, microgreens are highly appreciated for their vivid colours, delicate textures, and distinctive flavours, which have facilitated their widespread adoption in gourmet cuisine and functional food development [6,7].
From an agronomic standpoint, microgreens are particularly well-suited to CEA due to their rapid growth, low space requirements, and compatibility with hydroponic and soilless cultivation systems [1,8]. Advances in indoor farming technologies, including precision nutrient management and artificial lighting, have enabled year-round production while minimising water use and environmental impact [9,10,11]. These characteristics have contributed to the expansion of the microgreens market and to their increasing relevance in addressing urban food insecurity and nutritional inequality [4,12].
Among the environmental factors governing microgreen production, light intensity—commonly expressed as photosynthetic photon flux density (PPFD) or daily light integral (DLI)—and light quality are central regulators of plant growth, morphology, and secondary metabolite biosynthesis. Light intensity determines the total amount of photosynthetically active radiation available for carbon assimilation and biomass accumulation, thereby setting the upper limits for growth and yield. In contrast, light quality, defined by spectral composition, governs how plants perceive and respond to light through specific photoreceptors, modulating photomorphogenesis, photosynthetic efficiency, carbohydrate partitioning, and the synthesis of nutritionally relevant phytochemicals. While these two components of the light environment are conceptually distinct, they are functionally interconnected, as the effectiveness of a given light spectrum is strongly dependent on the intensity at which it is delivered [13,14,15].
In controlled-environment agriculture (CEA), precise regulation of light intensity is particularly critical, as deviations from optimal irradiance can either limit photosynthesis or induce photooxidative stress, leading to species- and compound-specific metabolic responses. Microgreens exhibit pronounced interspecific variability in light-use efficiency and acclimation capacity, resulting in divergent growth and phytochemical outcomes under identical lighting regimes. The adoption of light-emitting diode (LED) technology has enabled accurate control of both light intensity and spectral composition, allowing targeted adjustment of irradiance levels to match species-specific physiological requirements. This technological advance provides new opportunities to optimize yield, nutritional quality, and resource-use efficiency in CEA systems, while highlighting the need to define precise light intensity thresholds for individual microgreen species [13,14,15].
Previous studies have demonstrated that red, blue, and far-red wavelengths exert species-specific effects on plant development and metabolism. In carrot (Daucus carota), spectral composition regulates floral initiation, morphogenesis, and storage root development, with blue–red LED combinations promoting root thickening and carbohydrate accumulation [13,14,16]. Basil (Ocimum basilicum) exhibits pronounced sensitivity to light intensity (PPFD/DLI), as variations in red-to-blue ratios influence biomass production, photosynthetic performance, phenolic biosynthesis, and volatile compound profiles [15,17,18]. In arugula (Eruca sativa) and radish (Raphanus sativus), exposure to blue–violet wavelengths and continuous lighting regimes has been shown to enhance biomass accumulation, antioxidant activity, and the synthesis of flavonoids and anthocyanins [15,19].
Considering microgreens, light intensity regulates development by driving photosynthesis, carbon allocation, and redox balance. While higher irradiance generally increases photosynthetic rates and biomass up to a saturation point, low light restricts yield but triggers morphological adjustments to maximize light capture [20,21]. These intensity shifts alter reactive oxygen species (ROS) signaling, prompting metabolic trade-offs; moderate to high light typically enhances photoprotective compounds like carotenoids, whereas lower irradiance can favour the accumulation of vitamin C and tocopherols in specific species such as Brassica rapa [22,23]. Ultimately, signals perceived by photoreceptors coordinate gene expression, creating a species-specific balance between growth and secondary metabolite accumulation [24,25].
Despite the growing literature on light-mediated responses in individual species, comparative assessments of multiple vegetable microgreens grown under uniform controlled conditions remain limited. In particular, there is insufficient understanding of how light intensity manipulation influence both growth performance and nutritional quality across species with contrasting morphophysiological characteristics. Therefore, the present study was designed to test the hypothesis that different light intensities elicit species-specific responses in growth and phytochemical accumulation and that targeted spectral manipulation can enhance the nutritional quality of microgreens. Accordingly, the objective of this work was to evaluate the effects of distinct light intensity on growth, yield-related traits, and key quality attributes of carrot, basil, arugula, and radish microgreens cultivated under controlled environmental conditions.

2. Materials and Methods

2.1. Reagents and Chemicals

All chemicals and solvents utilised in this study were of analytical grade, with detailed information provided in the Supplementary File S1. L-Ascorbic acid was obtained from Labkem (Barcelona, Spain). The water purification process was carried out using a Milli-Q system (Millipore, Burlington, MA, USA). All chemicals and solvents utilised in this study were of analytical grade.

2.2. Samples and Growth Conditions

The effect of lighting technology was evaluated on microgreens of four species: basil (Ocimum basilicum), carrot (Daucus carota sativus), arugula (Eruca sativa), and radish (Raphanus sativus). All these species exhibit representative differences in botanical classification, growth habits, and known secondary metabolite accumulation characteristics, making them suitable for studying species-specific responses to light intensity.
The experiments were conducted in controlled growth chambers (10 × 2.5 m) between March and July 2024 at the University of Almería (Almería, Spain). Environmental conditions were maintained with a photoperiod of 16/8 h light/dark, temperatures of 20–22 °C and relative humidity of 80–85%. In all trials, the effect of different light intensities was evaluated: 174 μmol·m−2·s−1 (T1), 140 μmol·m−2·s−1 (T2), 100 μmol·m−2·s−1 (T3), and 67 μmol·m−2·s−1 (T4). Lighting was provided by a B100 spectrum AP67 LED lamp (Valoya, Helsinki, Finland) at different intensities. The spectra of each treatment were measured with a UPRtek MK350S LED (UPRtek, Miaoli County, Taiwan). LP471-PHOT and LP471-PAR sensors (Delta OHM®, Padua, Italy) were used to measure luminance (lux) and photosynthetic photon flux, PPF (μmol·m−2·s−1), as described by Ferrón-Carrillo et al. [26]. The seeds were planted in trays, which were filled with a 2 cm thick layer of coconut fiber substrate, whose physical characteristics are described in Rodríguez et al. [27].
Fertigation management was carried out in the same way in all experiments, following the criteria of Peçanha et al. [28] and Urrestarazu and Carrasco [29]. The nutrient solution used was based on Sonneveld and Straver [30], maintaining a pH of around 5.8 using nitric acid, and the electrical conductivity (EC) was maintained at around 2.0 dS·m−1 for basil and 1.5 dS·m−1 for the remaining species (Supplementary Table S1). New fertigation was applied when the water in the growing unit reached 10% of the available water, and the necessary volume was added to obtain between 15% and 25% drainage [28]. The pH, EC, nitrate and potassium content of the nutrient solution, and drainage volume (fraction between the inflow volume and the outflow volume of the growing unit in relation to the fertigation applied) were measured with a Crison MM40+ pH meter (Hach® LPV2500.98.0002, Loveland, CO, USA), a Crison BASIC 30 conductivity meter (Hach® LPV2500.98.0002, Loveland, CO, USA), and a LAQUATwin B-742 and B-731 EC analyzer (Horiba®, Moulton, Northampton, UK), respectively. The drainage ratio was measured using a graduated test tube with an accuracy of one hundredth of a millimeter.
Growth parameters were evaluated at harvest time. Plants were classified according to their different organs; the fresh weight (fw) of roots, stems, and leaves was obtained, and the dry weight was subsequently determined by placing the material in an oven (Thermo Scientific Heratherm, Langenselbold, Germany) at 85 °C until a constant weight. A precision analytical balance (Adventurer Analytical OHAUS Model AX 124/E, OHAUS, Parsippany, NJ, USA) was used, expressing the result in g·m−2. After harvest, they were stored in thermal bags and frozen at −24 °C until processing. Once in the laboratory, the plants were labelled, weighed, measured, and placed in a glass desiccator until analysis.

2.3. Determination of Moisture Content

The moisture content was determined gravimetrically by subjecting the samples to oven drying. For each species, three independent replicates weighing approximately 5 g fw were taken and placed on watch glasses that had previously been weighed. The samples were then subjected to a drying process in an oven at 105 °C for 24 h. Subsequently, the samples were cooled and re-weighed to calculate the moisture content based on the weight loss.

2.4. Extraction and Quantification of Vitamin C

The analysis of vitamin C (L-ascorbic acid) was conducted in accordance with the protocol outlined by Volden et al. [31], with minor adjustments. The quantification of vitamin C concentrations was performed using a Finnigan Surveyor HPLC system (Thermo Finnigan, San Jose, CA, USA) equipped with a diode-array detector (DAD) and a reverse-phase column (Luna® Omega, 250 mm × 4.6 mm i.d., 3 µm particle size (Phenomenex, Torrance, CA, USA). A 254 nm-HPLC-DAD chromatogram of a typical sample is shown in Supplementary Figure S1. The quantification process involved external calibration, with the results expressed in mg of ascorbic acid per 100 g of fw.

2.5. Carotenoids Analysis

The extraction of carotenoids was conducted using acetone, as described by Kimura & Rodríguez-Amaya [32], and is outlined in the Supplementary File S1. Subsequently, High-Performance Liquid Chromatography (HPLC) analyses of carotenoid profiles were conducted utilising a Finnigan Surveyor chromatograph equipped with a diode-array detector (DAD) and a reverse-phase C18 column. A 450 nm-HPLC-DAD chromatogram of a typical sample is shown in Supplementary Figure S1. Quantification of the compounds was accomplished by employing external calibration curves constructed using pure β-carotene.

2.6. Tocopherol and Tocotrienol Analysis

The extraction and quantification of tocopherols (Tp) and tocotrienols (T3) was conducted in accordance with the procedure outlined by Fabrikov et al. [33]. The methodology is outlined in detail in the Supplementary Materials (File S1). HPLC analyses of Tp and T3 were conducted using the previously described HPLC-DAD system at a constant temperature of 30 °C. The mobile phase was composed of methanol:acetonitrile (95:5, v/v, phase A) and 2-propanol:n-hexane (50:50, v/v, phase B), with a flow rate of 0.5 mL·min−1. The total chromatogram run was 60 min. A 290 nm-HPLC-DAD chromatogram of a typical sample is shown in Supplementary Figure S1.

2.7. Sterols and Squalene Analysis

The quantification of St and Sq was conducted according to the methodology outlined by Fabrikov et al. [33], as specified in the Supplementary File S1. The results were expressed in mg per 100 g fw.
The analysis of phytosterols and squalene was conducted using the previously described HPLC system at a constant temperature of 30 °C. An isocratic elution system was employed with a binary solvent mixture (methanol:acetonitrile, 70:30, v/v), and the flow rate was 0.4 mL·min−1 for 45 min. A 210 nm-HPLC-DAD chromatogram of a typical sample is displayed in Supplementary Figure S1. The quantification of compounds was performed using external calibration curves prepared with pure standards, including stigmasterol, β-sitosterol (+campesterol), and squalene.

2.8. Statistical Analysis

The experiment followed a completely randomised design with four replicates per treatment, each experimental unit consisting of four plants. Chemical analyses were performed as three independent biological replicates, and the results are presented as mean ± standard deviation. Subsequently, a one-way ANOVA was performed, and the separation of means was performed using the Duncan Multiple Range test, and the statistical significance was determined as p < 0.05. Linear and quadratic polynomial regressions and their R2 were performed.
Principal Component Analysis (PCA) was conducted to investigate multivariate relationships among phytochemical variables and to evaluate the combined influence of species identity and light intensity. Prior to PCA, a variable selection procedure was applied to reduce redundancy and enhance biological interpretability. Summed variables (e.g., total carotenoids, total sterols, total tocopherols) were excluded to avoid duplication of information, and only individual compounds were considered. In addition, pairwise Pearson correlation analysis was performed, retaining variables showing moderate to strong linear associations (|r| ≥ 0.30) with at least one other variable. The resulting pairwise Pearson correlation matrix for the PCA-selected variables is provided in Supplementary Table S2.
All selected variables were autoscaled (Z-score normalised) prior to PCA according to the following equation:
Z i j = X i j X ¯ j s j
where
  • X i j is the raw value of variable j in sample i ;
  • X ¯ j is the mean of variable j across all samples;
  • s j is the standard deviation of variable j .
This transformation centres each variable to a mean of zero and scales it to unit variance, ensuring equal contribution of all variables regardless of their original units or magnitude. The complete autoscaled (Z-score normalised) data matrix used for PCA, expressed as dimensionless values, is reported in Supplementary Table S3.
PCA was performed on the correlation matrix using Statgraphics® Centurion XVI (StatPoint Technologies, Warrenton, VA, USA). Principal components were extracted based on eigenvalues and cumulative explained variance. The eigenvalues, percentage of variance explained, and cumulative variance of the extracted components are presented in Supplementary Table S4.

3. Results

3.1. Effect of Light on Growth Parameters in Cultivated of Microgreens

3.1.1. Fertigation Parameters

The volume fraction of fertigation to drainage was maintained between 0.2 and 0.3 to ensure that the matric potential of water in the substrate remained constant [28]. Drainage pH showed only slight variations in response to light intensity across all microgreen species evaluated (Supplementary Figure S2). In basil, drainage pH remained relatively stable across treatments, with values close to 6.4 and no significant differences. In carrot microgreens, drainage pH exhibited a gradual increase with increasing light intensity, ranging from approximately 7.1 to 7.3; however, no significant differences among treatments were detected. The fitted regression indicated a strong positive relationship between light intensity and pH. Radish showed slightly higher drainage pH values compared to the other species, with a decreasing trend at the highest light intensity. Nevertheless, no statistically significant differences were observed among treatments. Similarly, arugula exhibited minor variations in drainage pH across light intensities, with values remaining around 7.3–7.4 and no significant differences among treatments.
Drainage EC showed limited variation in response to light intensity across the four microgreen species evaluated (Supplementary Figure S3). In basil, drainage EC remained stable across all treatments, with values close to 2.1 dS·m−1 and no significant differences detected among light intensities. In carrot microgreens, drainage EC exhibited a slight decreasing trend with increasing light intensity, ranging from approximately 2.15 to 2.10 dS·m−1. However, no statistically significant differences were observed among treatments. Radish showed higher drainage EC values compared to the other species, with a moderate increase at intermediate light intensities, followed by a slight decrease at the highest intensity. Nevertheless, EC differences among treatments were not statistically significant. Similarly, arugula exhibited a gradual increase in drainage EC with increasing light intensity, with values ranging from approximately 3.0 to 3.3 dS·m−1. Despite this trend, no significant differences were detected among treatments. The average pH and EC values recorded in the present study remain within the acceptable range for optimal crop development [29].

3.1.2. Fertigation Uptake and Growth Parameters

Table 1 shows the total absorption of water, nitrate, and potassium by basil, carrot, radish, and arugula microgreens. In general, absorption of all three parameters decreased significantly as light intensity decreased, although the magnitude of the response varied among species. Basil showed the highest absorption of water, nitrate, and potassium at T1, with values of 3.89 L·m−2, 62.28 mmol·m−2, and 69.04 mmol·m−2, respectively. A progressive reduction in light intensity caused significant decreases in all parameters, with the lowest values recorded at T4. In carrots, water uptake did not differ significantly between T1 and T2, but decreased significantly at lower light intensities. Nitrate and potassium uptake showed a steady decrease as light intensity decreased. Radishes showed significantly higher water absorption values compared to the other species. The highest light intensity resulted in water absorption of 11.54 L·m−2, which decreased significantly as the light level decreased. Similar trends were observed in nitrate and potassium absorption, with significant differences between all treatments. In arugula, water, nitrate, and potassium absorption were highest among the species evaluated. Maximum values of T1 were recorded, especially in potassium uptake (114.92 mmol·m−2). The reduction in light intensity caused significant decreases in all three parameters, with the most pronounced decreases recorded at T4.
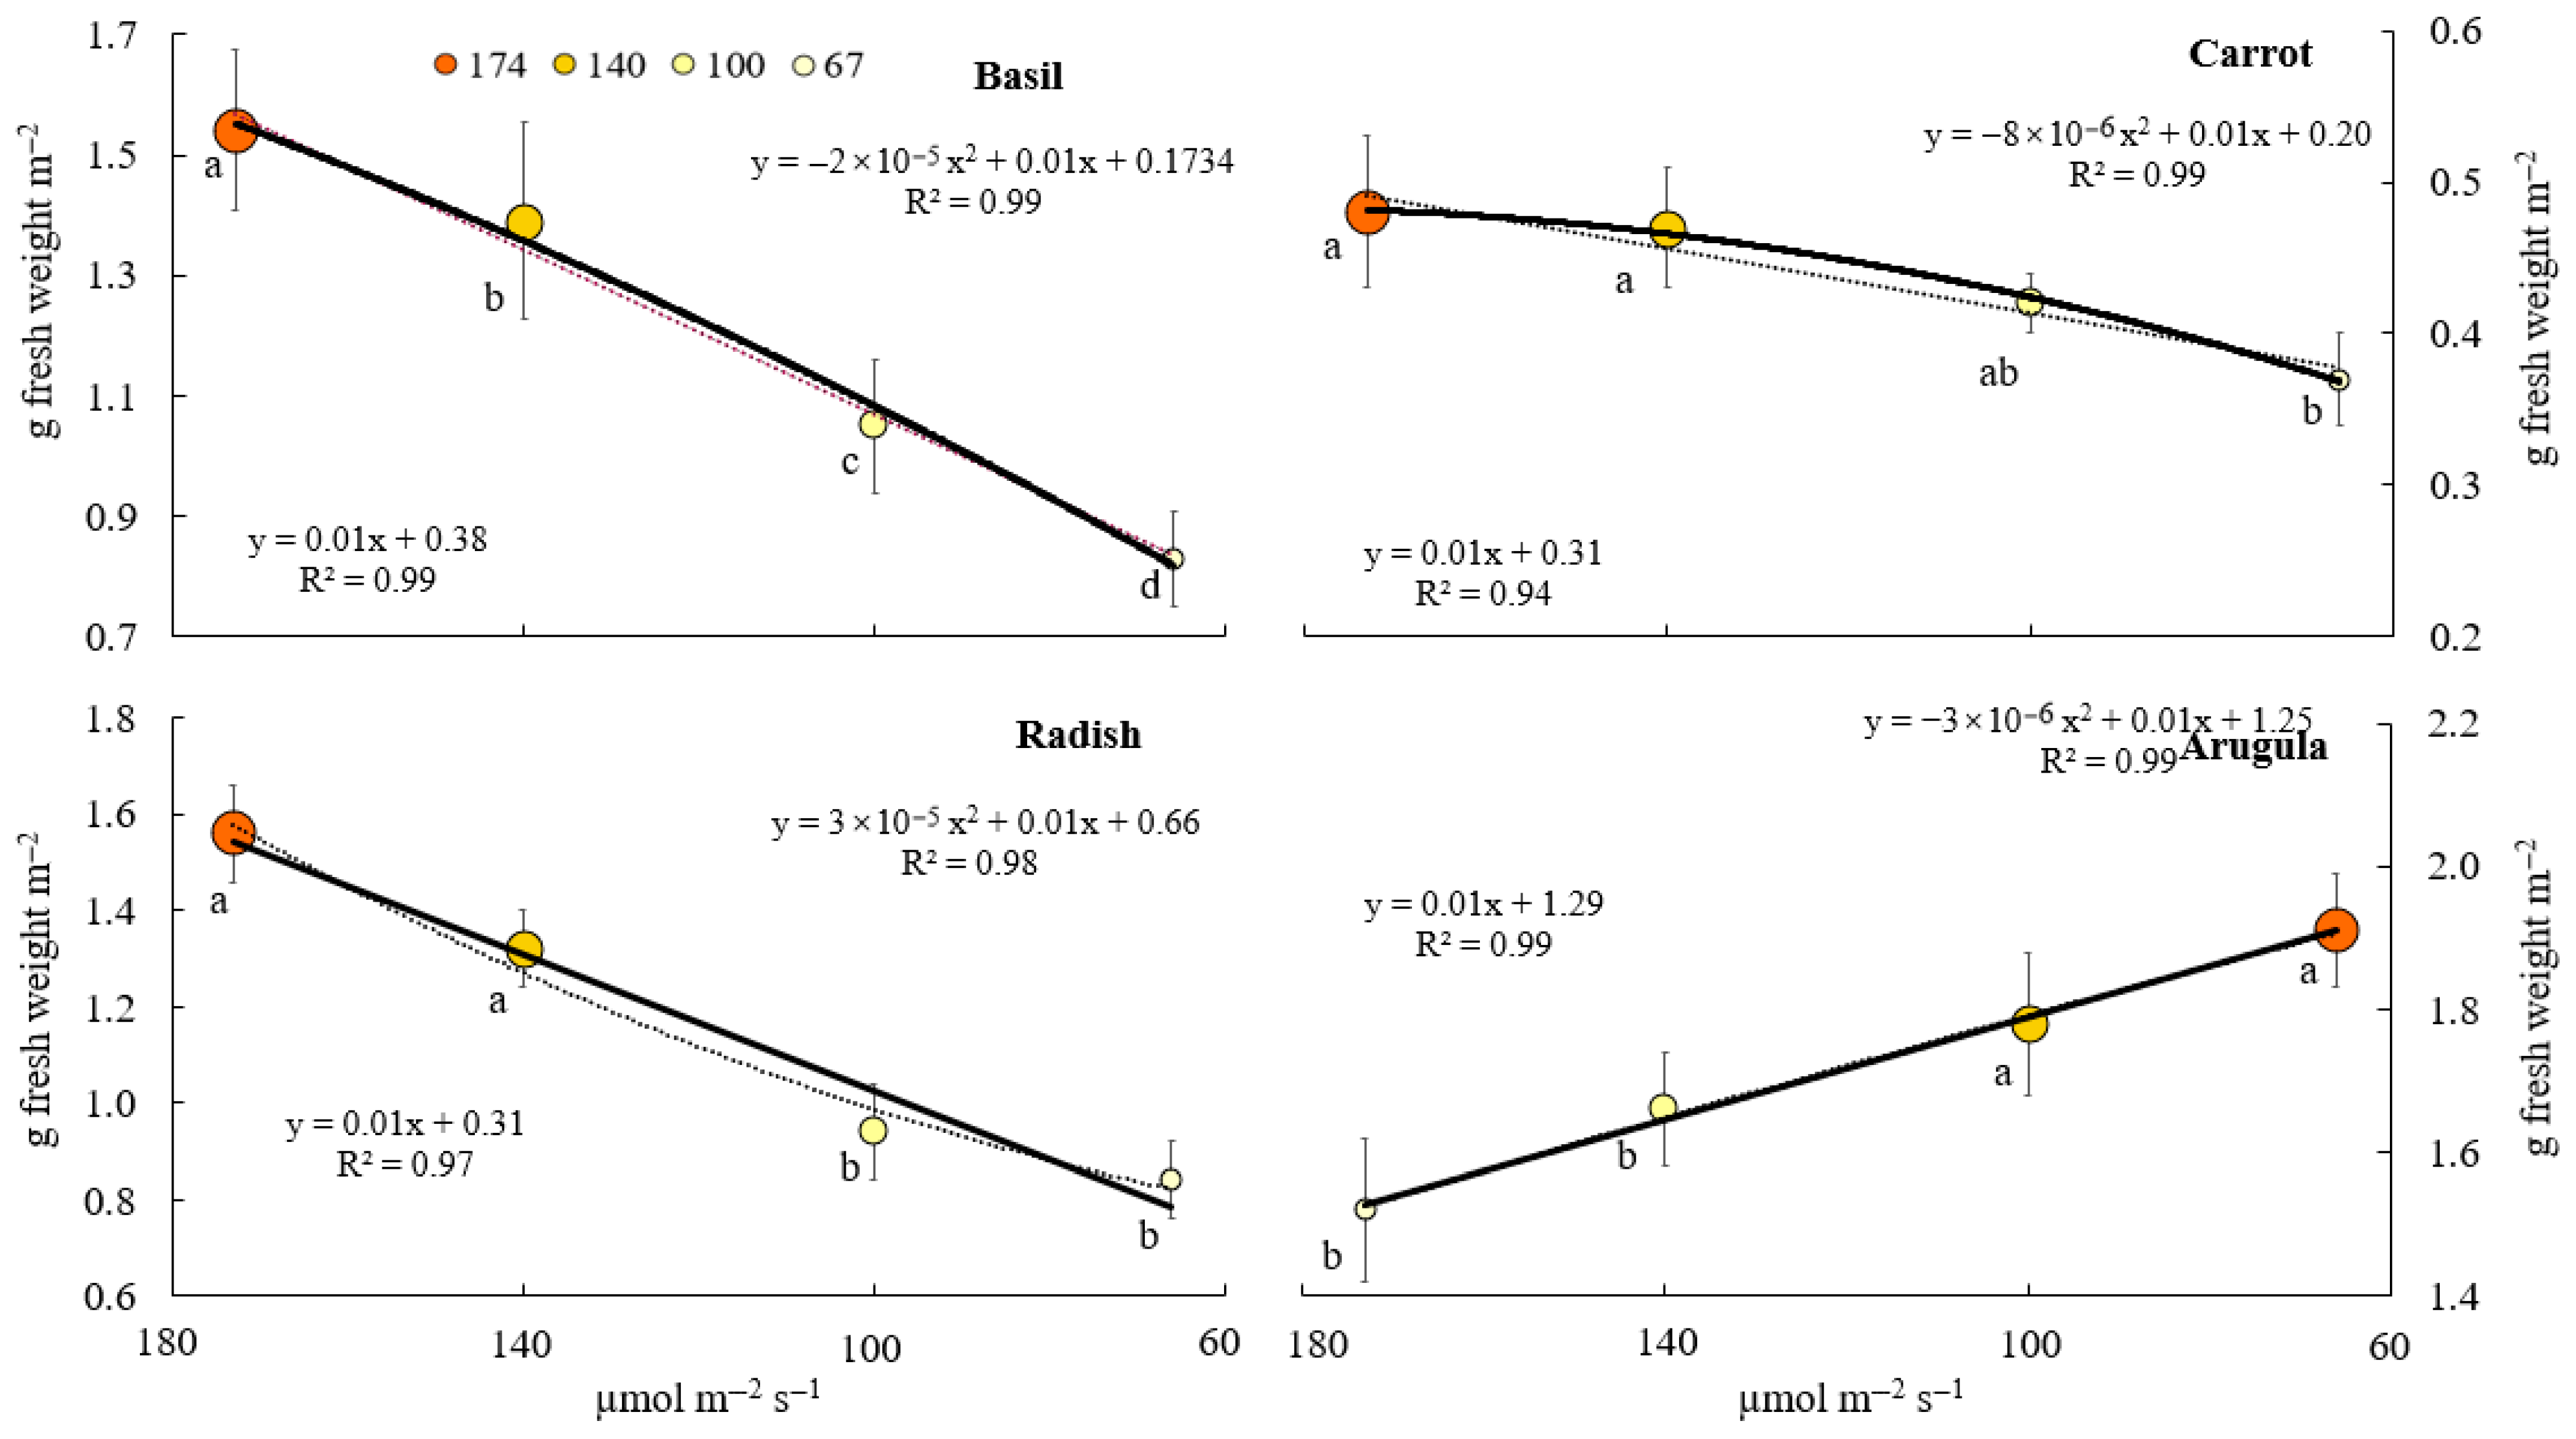
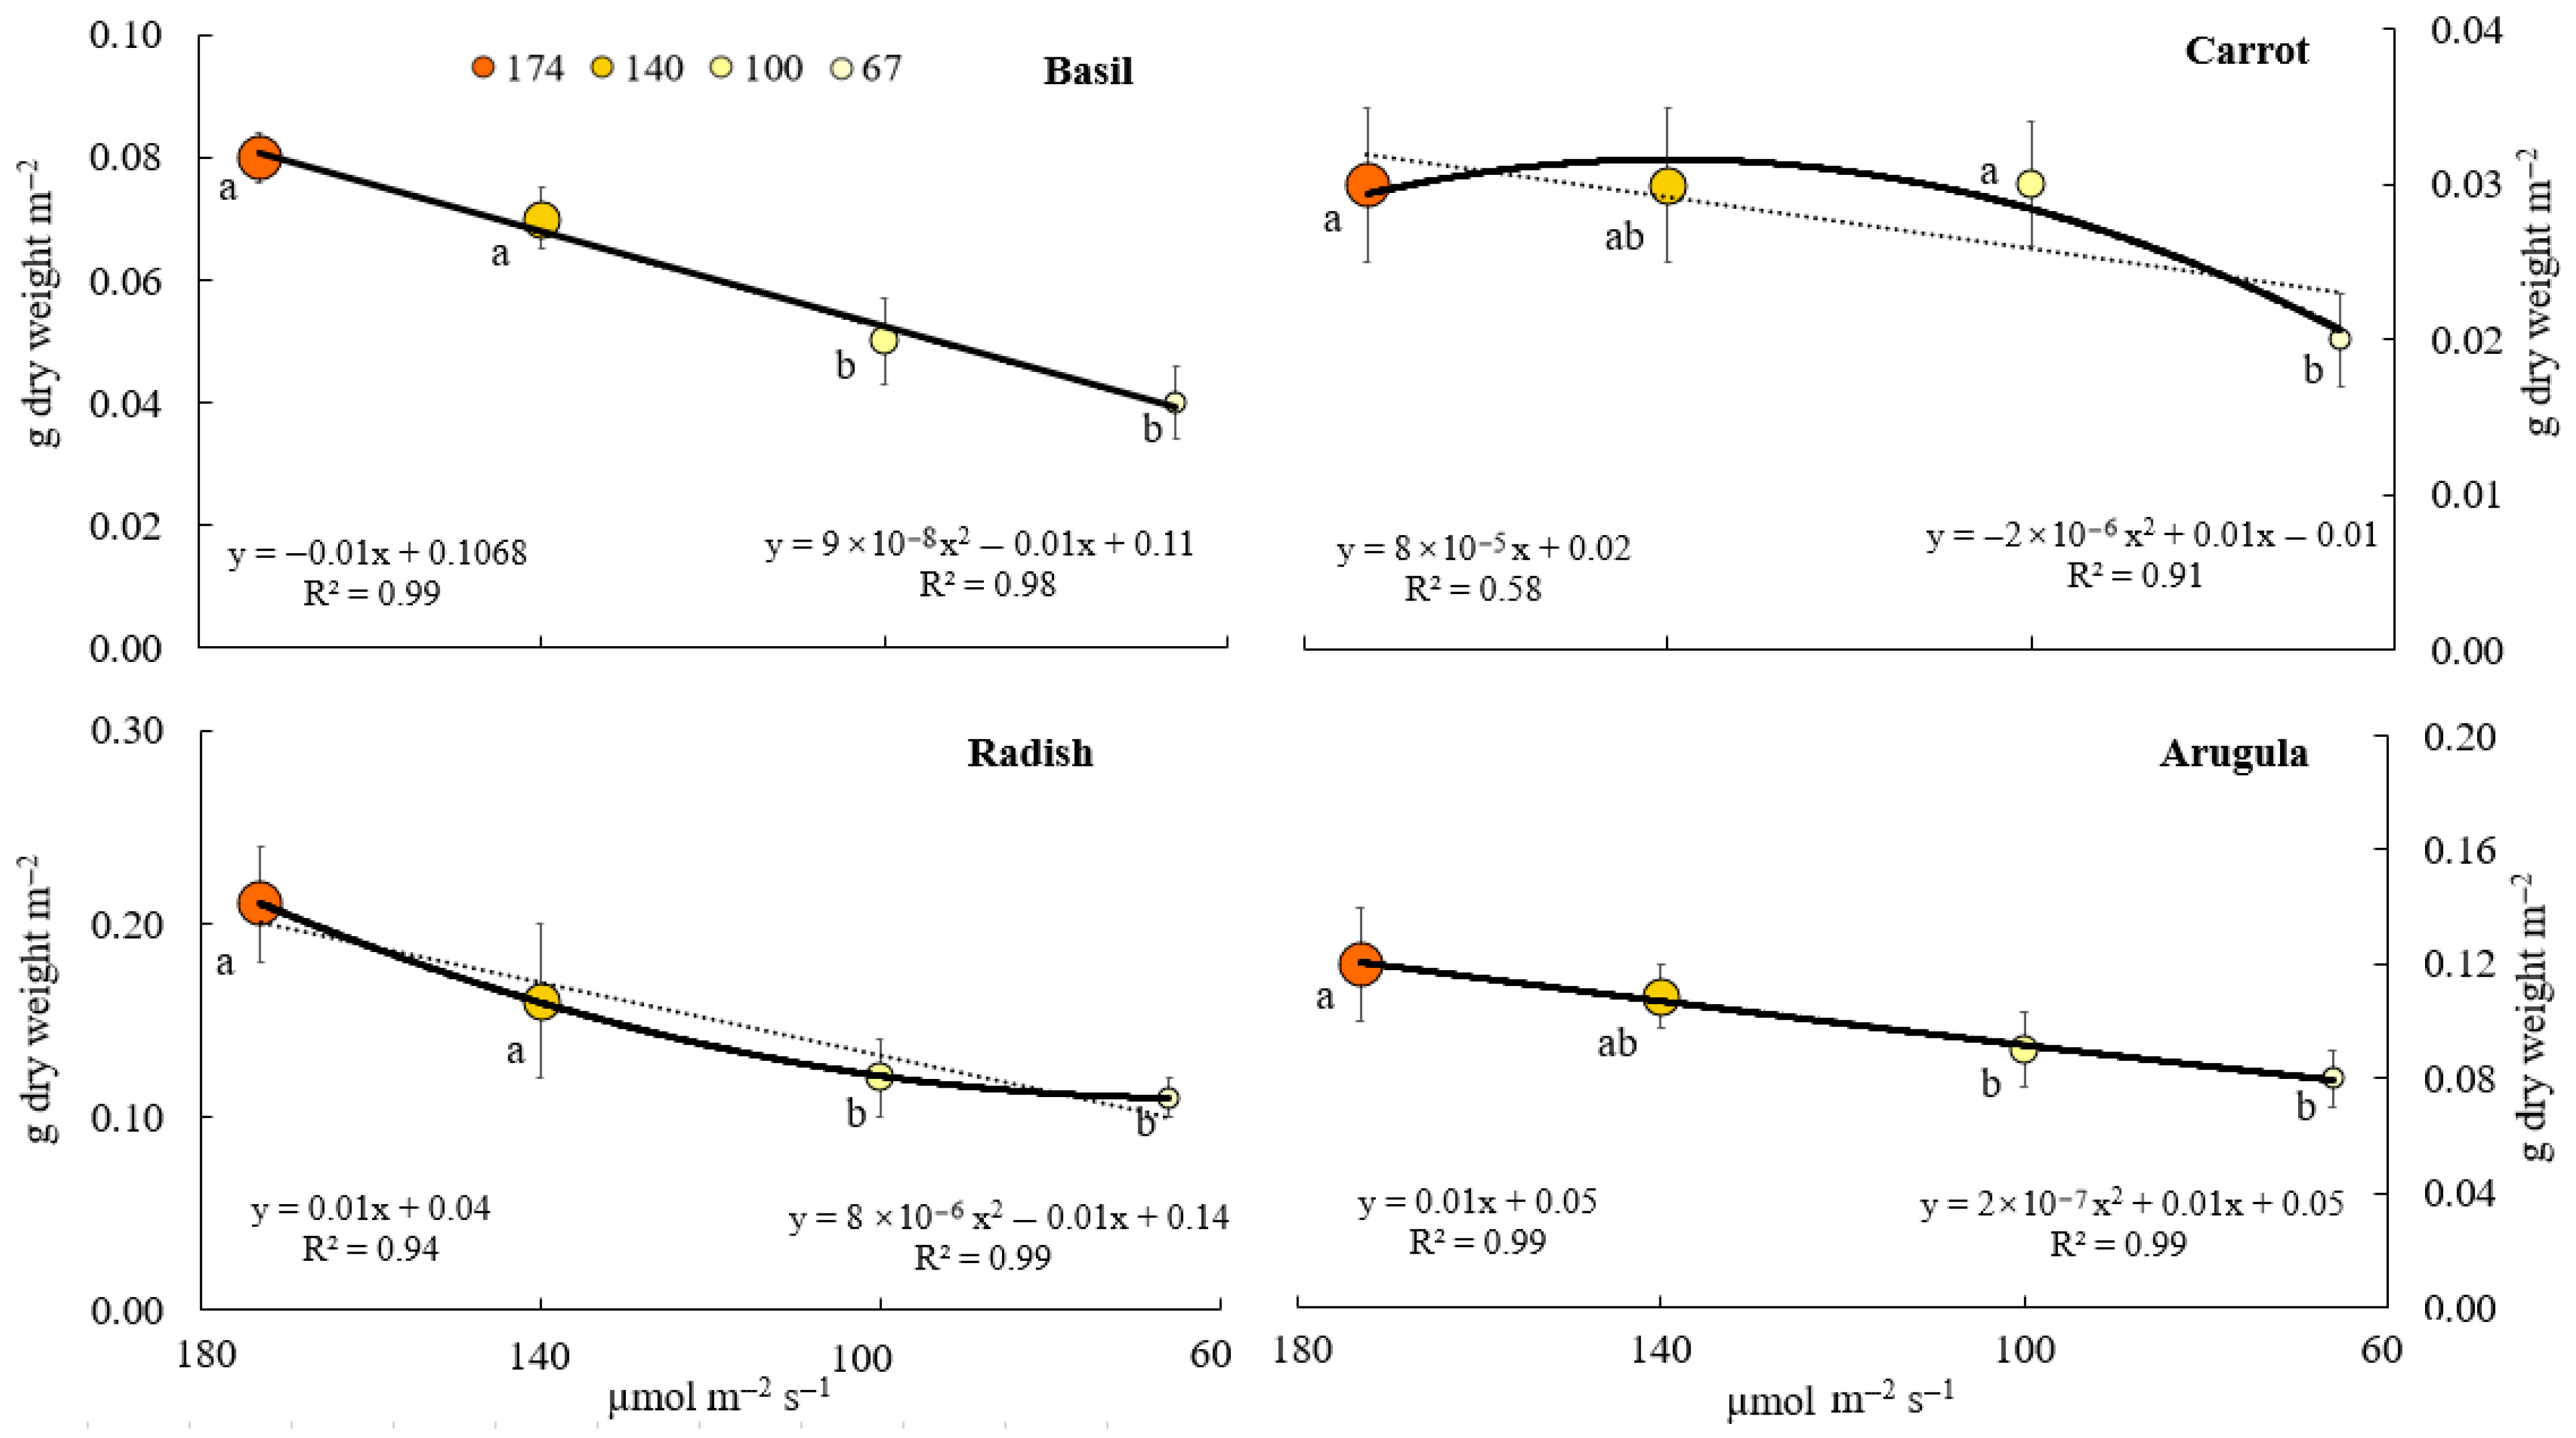
Figure 1 and Figure 2 show the effects of light intensity on fresh and dry weight production of basil, carrot, radish, and arugula microgreens. In general, increasing light intensity enhanced biomass accumulation in all species; however, fresh and dry weight responses differed in magnitude and pattern among crops. In basil, fresh and dry weight increased linearly with all light intensities evaluated, from the lowest value, 67 µmol·m−2·s−1, to the highest, 174 µmol·m−2·s−1. In carrots, fw also increased with increasing light intensity, although the response was less pronounced compared to the other species. fw at 67 µmol·m−2·s−1 was significantly lower than at higher light intensities, while no significant differences were observed between 140 and 174 µmol·m−2·s−1. On the other hand, dry weight showed a moderate response to light intensity. Values that increased from 67 to 100 µmol·m−2·s−1 remained relatively stable at higher light intensities, with no significant differences between treatments above 100 µmol·m−2·s−1.
In radishes, fresh and dry weight showed a clear positive response to increased light intensity, with significantly higher values at 140 and 174 µmol·m−2·s−1 compared to lower intensities. The relationship between light intensity and fw was well described by linear and quadratic regressions (R2 ≥ 0.97 and R2 ≥ 0.94, respectively). In arugula, fw showed the highest absolute values among the species evaluated and increased significantly with light intensity. fw at 67 µmol·m−2·s−1 was markedly lower than at higher light levels, while the maximum value was observed at 174 µmol·m−2·s−1. Dry weight showed a nonlinear response to light intensity. The highest dry weight was observed at an intermediate light intensity (100–140 µmol·m−2·s−1), while a significant decrease occurred at 174 µmol·m−2·s−1.

3.2. Moisture and Vitamin C Contents

Moisture content was primarily species-dependent and exhibited limited variation across light treatments (Table 2). In carrot microgreens, the highest moisture content was recorded under T4 (94.0 g·100 g−1 fw). Arugula microgreens reached peak moisture levels under T1 (95.0 g·100 g−1 fw), while basil maintained consistently high moisture values (approximately 95.0 g·100 g−1 fw) across all light intensities. Radish microgreens reached their maximum moisture content under T2 and T3 (87.0 g·100 g−1 fw).
Vitamin C concentration was strongly affected by light intensity in all species. Radish microgreens reached their highest vitamin C content under T3, attaining 205.2 mg·100 g−1 fw. In arugula, vitamin C accumulation increased progressively with decreasing light intensity, with a pronounced peak under T4 (99.6 mg·100 g−1 fw). Basil microgreens exhibited lower vitamin C concentrations, but the maximum value was observed under T3 (35.8 mg·100 g−1 fw). Carrots microgreens consistently increased vitamin C levels along with light intensity, with a clear peak under T3 (58.3 mg·100 g−1 fw).

3.3. Carotenoid Composition and Total Carotenoid Content

Carotenoid composition was highly species-specific and markedly influenced by light intensity (Table 3). Lutein represented the dominant carotenoid across all species and treatments, followed by β-carotene, although their relative contributions varied.
In carrot microgreens, total carotenoid content increased markedly from T1 to T3, reaching a maximum of 525.9 mg·100 g−1 fw under T3. This peak coincided with the highest concentrations of lutein, β-cryptoxanthin, and all-trans-β-carotene. Both higher and lower irradiance levels resulted in significantly reduced carotenoid accumulation.
Arugula microgreens displayed a more moderate response to light intensity, with total carotenoid content peaking under T3 at 264.1 mg·100 g−1 fw. Basil microgreens underscore a pronounced light-dependent response, with the highest total carotenoid concentration recorded under T3 (445.0 mg·100 g−1 fw), driven by maximal levels of lutein and β-carotene. In contrast, T4 resulted in the lowest carotenoid accumulation in basil. Radish microgreens exhibited comparatively lower total carotenoid contents, with the highest value observed under T1 (289.1 mg·100 g−1 fw), followed by a gradual decline at lower light intensities.

3.4. Tocopherols, Sterols, and Squalene

3.4.1. Tocopherols and Tocotrienols

Tocol composition and concentration varied substantially among species and light treatments (Table 4). In carrot microgreens, total tocol content reached its maximum value under T1 (1630 µg·100 g−1 fw), mainly due to elevated α-tocopherol levels. Arugula microgreens had their highest total tocol concentration under T4 (1670 µg·100 g−1 fw), reflecting a strong increase in γ-tocopherol.
Basil microgreens exhibited the highest tocol concentrations among all species. The maximum total tocol content was recorded under T1 (3040 µg·100 g−1 fw), largely driven by high γ-tocopherol accumulation. A secondary peak was observed under T4. In radish microgreens, total tocol concentration peaked under T2 and T3 (1520 µg·100 g−1 fw), corresponding to increased α- and γ-tocopherol contents.

3.4.2. Sterol Profiles

Sterol composition was strongly species-dependent and significantly modulated by light intensity (Table 4). β-Sitosterol was the predominant sterol in all species, followed by campesterol and stigmasterol, while brassicasterol was mainly detected in Brassicaceae microgreens.
Carrot microgreens reached their highest total sterol concentration under T3 (388 mg·100 g−1 fw), coinciding with peak levels of β-sitosterol and campesterol. In arugula microgreens, total sterol content increased markedly with decreasing light intensity, reaching a maximum under T3 (193 mg·100 g−1 fw), largely driven by a pronounced accumulation of β-sitosterol.
Basil microgreens showed their highest total sterol concentration under T3 (176 mg·100 g−1 fw), with β-sitosterol representing the dominant sterol fraction. Radish microgreens exhibited peak total sterol levels under T3 (317 mg·100 g−1 fw), associated with elevated β-sitosterol and stigmasterol concentrations.

3.4.3. Squalene

Squalene was detected at low concentrations across all species and light treatments (Table 4). In carrot microgreens, squalene was present only at trace levels, except under T4, where a measurable value was detected. Arugula microgreens exhibited a clear peak in squalene concentration under T3 (0.11 mg·100 g−1 fw). Basil microgreens showed their highest squalene concentration under T1 (0.05 mg·100 g−1 fw), with progressively lower levels at reduced light intensities. In radish microgreens, squalene concentrations were consistently low, with the highest value observed under T3 (0.03 mg·100 g−1 fw).

3.5. Principal Component Analysis (PCA)

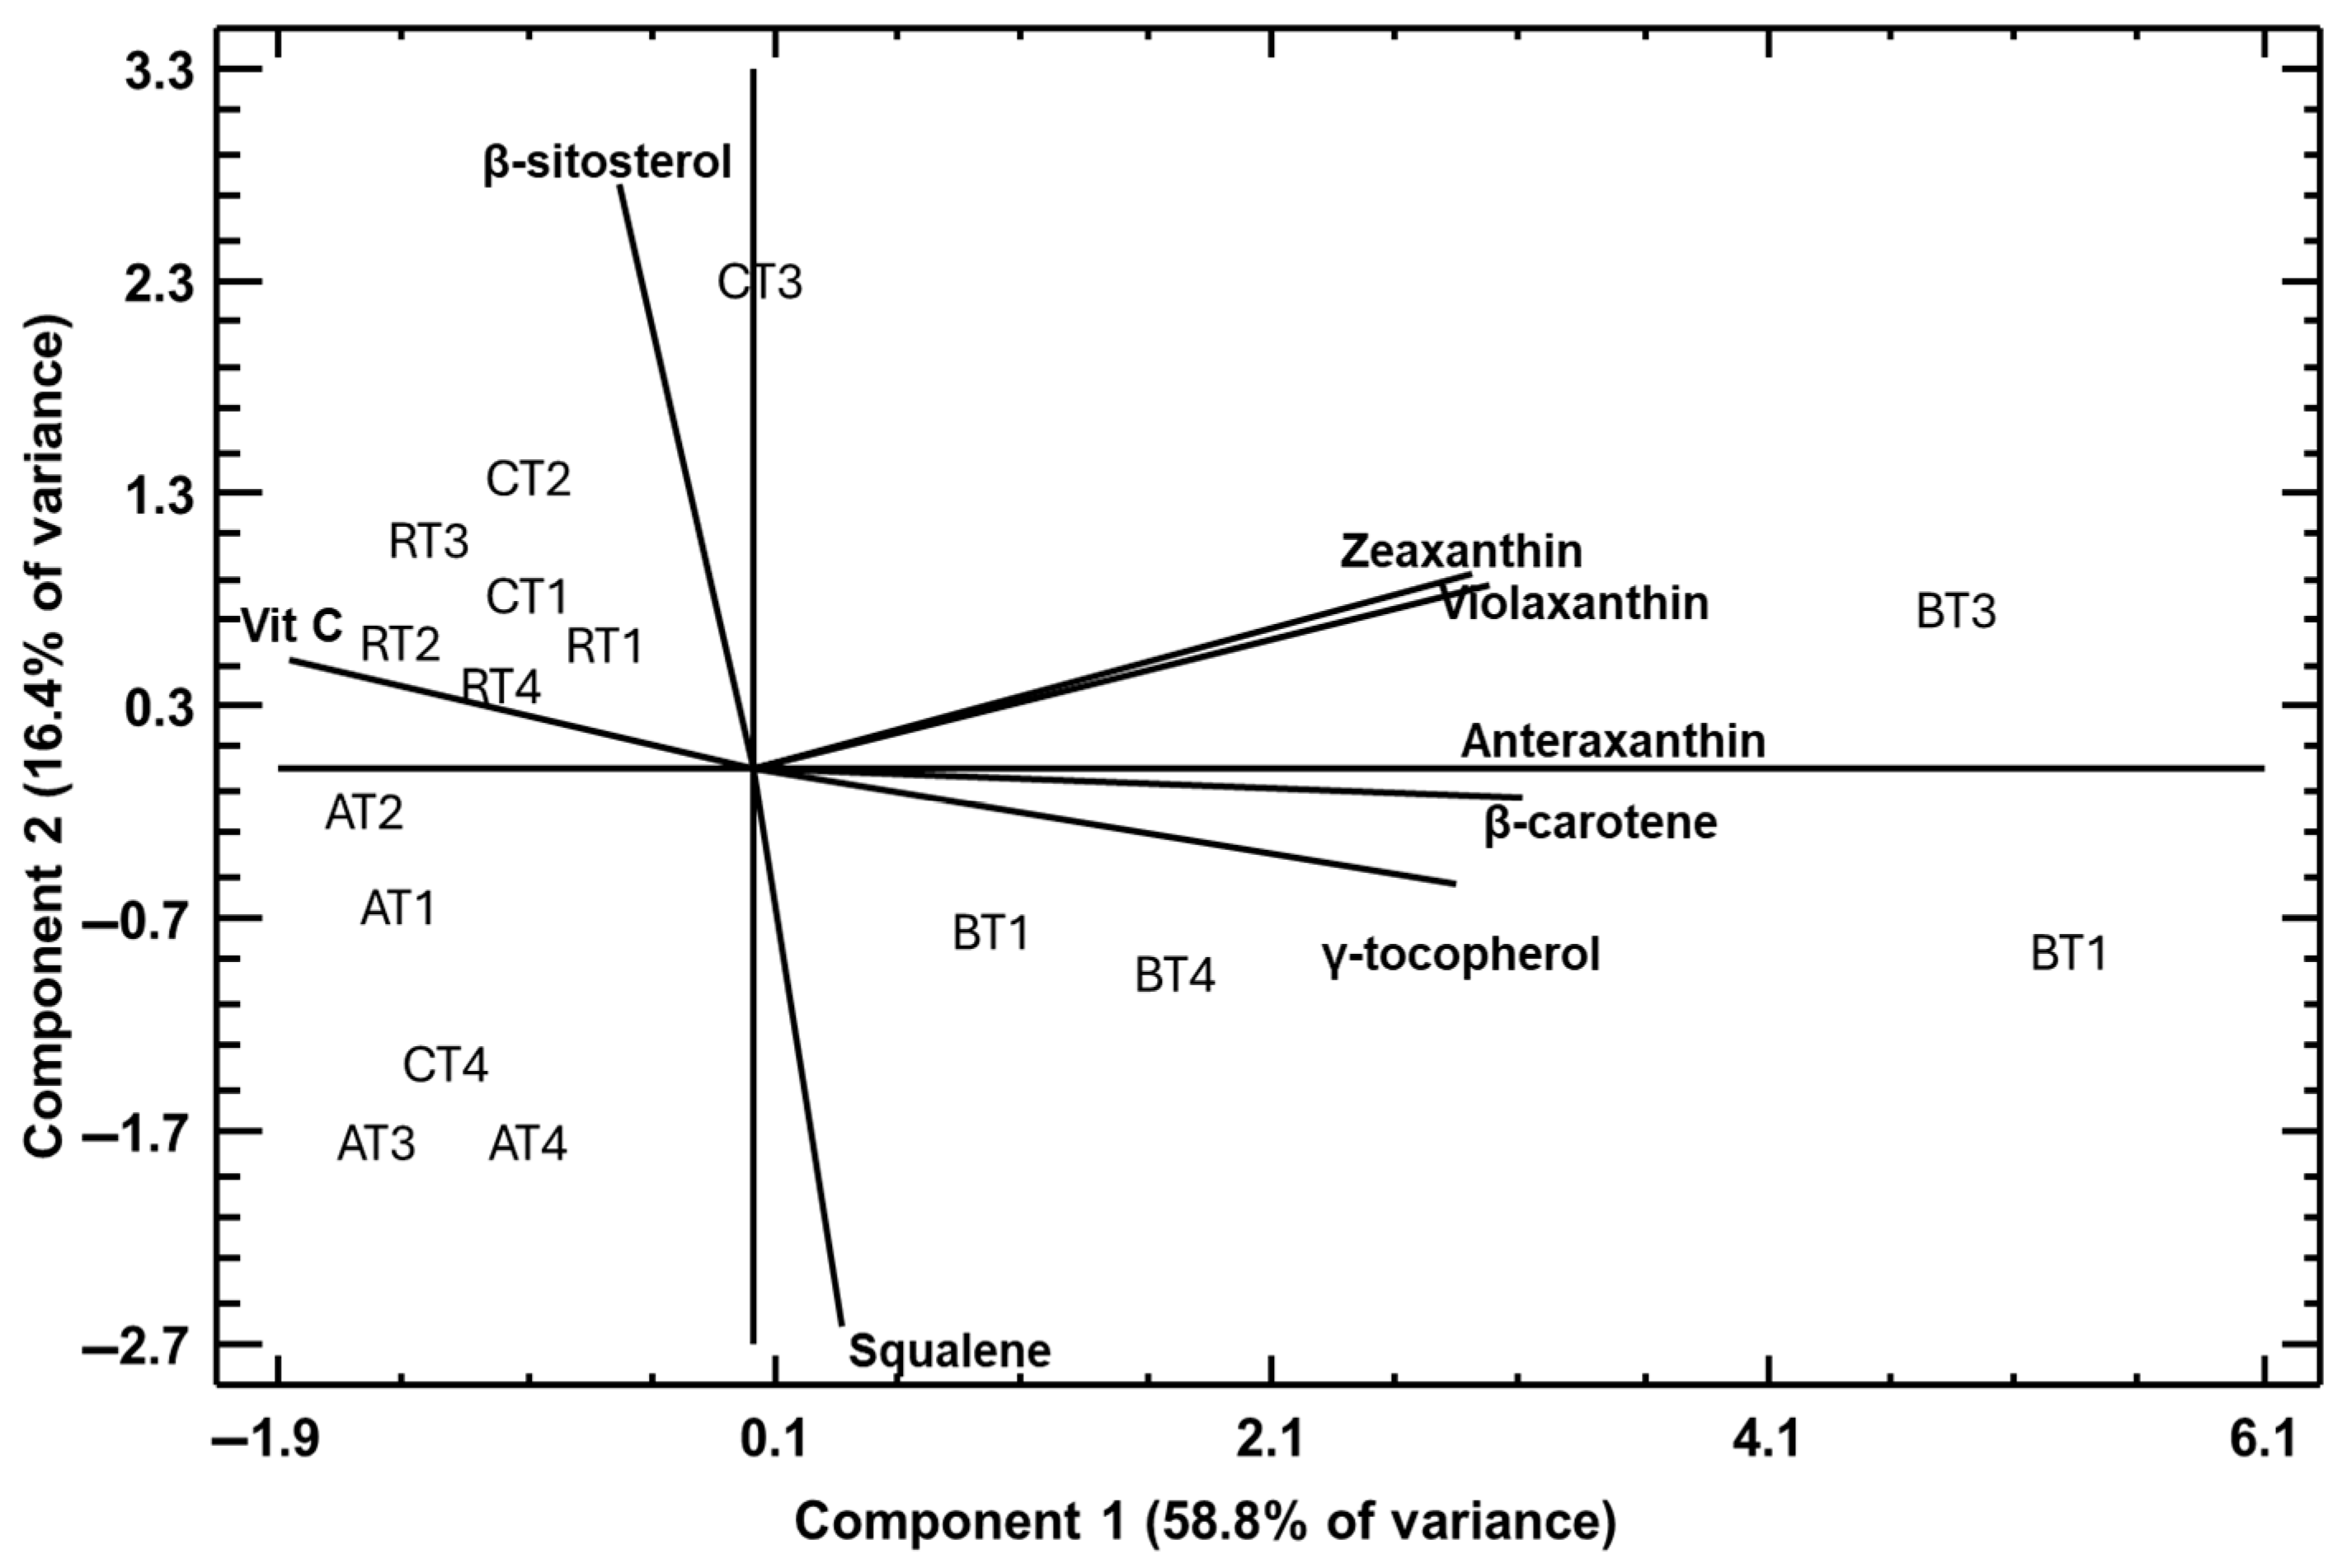
This analysis was conducted to identify potential relationships among the analysed variables and sample characteristics. Principal component analysis (PCA) was applied to a subset of selected variables, and the results are presented in the corresponding graphical output. Pairwise Pearson correlation coefficients were calculated among all variables prior to PCA. Variables presenting consistently low correlations with all other variables (|r| < 0.30) were excluded to avoid the inclusion of noise and to enhance the interpretability of the principal components. This criterion ensured that PCA was applied only to variables sharing meaningful common variance. A total of 8 principal components were extracted, cumulatively explaining 100.0% of the variance in the dataset. The first two principal components, PC1 and PC2, accounted for 58.8% and 16.4% of the total variance, respectively, together explaining 75.1% of the overall variability. Among the PCA graphical representations, the biplot provided the most informative visualisation of the multivariate structure of the data. In this biplot, PC1 and PC2 are represented on the horizontal and vertical axes, respectively. The spatial distribution of samples indicates clustering patterns based on similarities among the measured variables. Figure 3 illustrates the PCA biplot projected onto the plane defined by PC1 and PC2.

4. Discussion

4.1. Effect of Light on Growth Parameters in the Cultivated Microgreens

4.1.1. Fertigation Parameters

Drainage volume fraction, EC, and pH are key parameters for nutrient solution monitoring and for guiding fertigation management decisions [28]. Drainage pH and EC remained relatively stable across the range of light intensities evaluated in all microgreen species, indicating that light intensity had a limited influence on root-zone chemical properties under the conditions of this study [34]. In all cases, pH and EC values were maintained within ranges considered suitable for microgreen production in soilless systems, reflecting the effectiveness of the fertigation strategy and drainage management applied [29].
Slight species-specific trends were observed in drainage pH. In basil and carrot, pH tended to increase marginally with increasing light intensity, which may be associated with enhanced nitrate uptake under higher irradiance, leading to rhizosphere alkalinization. In contrast, radish showed a slight decrease in pH at the highest light intensity, possibly related to differences in nutrient uptake patterns characteristic of Brassicaceae species [35]. Arugula exhibited minimal pH variation across treatments, further supporting the notion that short-cycle microgreens are relatively insensitive to light-induced pH changes when fertigation is properly controlled. However, none of these trends resulted in statistically significant differences among treatments.
Similarly, drainage EC showed only minor variations in response to light intensity. Basil and carrot maintained relatively stable EC values, whereas radish and arugula exhibited higher EC levels and greater variability, likely reflecting species-specific differences in nutrient demand, water uptake, and transpiration rates [34]. In radish, EC increased slightly at intermediate light intensities, whereas arugula showed a gradual increase in EC with increasing irradiance. Despite these trends, no significant differences were observed among treatments, suggesting that nutrient uptake and solution concentration remained balanced throughout the growing cycle [36].
In general, the lack of significant differences among light intensity treatments suggests that, within the tested range, light management can be optimised for biomass production or quality traits without compromising root-zone pH and EC stability. These findings are consistent with previous studies reporting limited pH and EC variability when fertigation composition and drainage fractions are properly controlled [36]. Therefore, drainage pH and EC appear to be more strongly influenced by nutrient solution composition and substrate properties than by light intensity in coconut coir-based microgreen production systems [28].

4.1.2. Fertigation Uptake and Growth Parameters

The present study demonstrates that light intensity strongly influences water, nitrate, and potassium uptake in microgreens, with responses differing among species. Overall, higher light intensities promoted greater uptake of all measured parameters, highlighting the central role of light in regulating physiological activity and nutrient acquisition in microgreen production systems [26,34]. The observed increase in water uptake at higher light intensities is likely associated with higher transpiration rates driven by increased photosynthetic activity [34]. Species such as radish and arugula showed substantially higher water uptake than basil and carrot, suggesting differences in canopy structure, leaf area development, and growth rate. These traits may contribute to higher transpiration demand and, consequently, higher nutrient flux through the root system under high-light conditions [34,37].
Nitrate uptake followed a similar trend across all species, decreasing progressively as light intensity decreased. This pattern is consistent with the close relationship between nitrate assimilation and photosynthesis, as nitrate reduction requires the reducing power generated during light-driven processes. The greater decrease in nitrate uptake at low light intensities, especially in radish and arugula, indicates that insufficient light may limit nitrogen use efficiency in fast-growing microgreen species [37]. Potassium uptake was also significantly affected by light intensity, with the highest values recorded under the highest light level for all species. Potassium plays a key role in stomatal regulation, enzyme activation, and osmoregulation, all of which are closely related to photosynthetic performance. The particularly high potassium uptake observed in arugula suggests a greater demand for this nutrient to maintain rapid growth and physiological regulation under high light irradiation [2,26].
The specific response of each species underscores the importance of adapting light management strategies according to crop type. While basil and carrots showed a more moderate decrease in nutrient uptake at intermediate light levels, radishes and arugula were more sensitive to reductions in irradiance. This indicates that optimal light intensity requirements can vary substantially among microgreen species, especially when the goal is to maximise nutrient uptake efficiency [37,38]. In practical terms, these findings suggest that maintaining relatively high light intensities may improve water and nutrient uptake in microgreens grown on coconut coir, which could enhance growth performance and nutrient use efficiency. However, the differential responses between species emphasise the need to optimise species-specific lighting conditions in controlled environment agriculture [26,39].
The results shown in Figure 1 and Figure 2 demonstrate a strong positive relationship between light intensity and fresh and dry weight production in microgreens, confirming the fundamental role of irradiance in biomass accumulation under controlled growing conditions [26]. In all species evaluated, increased light intensity consistently improved fw, although the magnitude and shape of the response varied between species.
The linear increase in fresh and dry weight observed in basil suggests that biomass production in this species is very sensitive to light availability within the range evaluated. The lack of saturation at the highest light level indicates that basil microgreens can benefit from relatively high irradiance without reaching a plateau in their growth, at least under the conditions of this study [26,38]. This response is consistent with the high photosynthetic capacity normally observed in basil during the early stages of growth. In carrot microgreens, the response to increased light intensity was less pronounced, especially at higher irradiance levels. This pattern could be related to the particular physiology of carrots, which may not be as optimised for high light intensities as basil. Lower values at lower light intensities could also indicate a limitation in photosynthesis, possibly due to the carrot’s adaptation to more moderate light conditions [38,39].
Radish microgreens showed a marked increase in fresh and dry weight as light intensity increased, with significant gains at intermediate and high irradiance levels. This response reflects the rapid growth rate and high photosynthetic demand characteristic of radish microgreens. Strong regression fits indicate that biomass accumulation in radish is tightly regulated by light availability, making this species particularly sensitive to changes in irradiance [38]. Arugula showed the highest fw values among all species and a strong positive response to increased light intensity. The continuous increase in biomass up to the maximum light level suggests that arugula microgreens have a high capacity to utilise additional light for growth. This could be related to greater leaf expansion and increased light interception efficiency, which improves carbon assimilation under high-irradiance conditions [38]. On the other hand, dry weight showed a different trend, with a notable increase as light increased, although the response was more moderate compared to fw.

4.2. Influence of Lighting Treatments on Phytochemical Content

4.2.1. Moisture Content and Its Relationship with Phytochemical Accumulation

Moisture content showed limited sensitivity to light intensity and was primarily determined by species-specific morphological and physiological traits. This stability across treatments suggests that the observed variations in phytochemical concentrations cannot be attributed to dilution or concentration effects related to tissue water content, but rather to genuine metabolic regulation driven by light availability. Similar findings have been reported for short-cycle leafy crops and microgreens, where water content remains relatively constant across moderate irradiance ranges when fertigation is well controlled [26,40]. The decoupling of moisture content from phytochemical responses strengthens the interpretation that light intensity directly modulated secondary metabolite biosynthesis rather than indirectly influencing concentration through biomass or hydration effects.

4.2.2. Vitamin C (Ascorbic Acid)

Vitamin C accumulation was strongly affected by light intensity in all species, although the direction and magnitude of the response were species dependent. In radish and carrot microgreens, vitamin C content peaked at intermediate light intensity (T3), whereas in basil and arugula, the highest concentrations were observed under the lowest irradiance (T4). This pattern suggests that moderate light limitation may act as a mild abiotic stress, triggering antioxidant defences and stimulating ascorbic acid biosynthesis. Ascorbic acid plays a central role in photoprotection, reactive oxygen species scavenging, and redox homeostasis, and its accumulation under suboptimal light conditions has been widely documented [15,34].
In Brassicaceae microgreens, particularly radish, the exceptionally high vitamin C levels confirm their strong antioxidant potential and agree with previous studies reporting enhanced ascorbic acid accumulation under controlled light stress or reduced irradiance [19,41]. In basil, the comparatively lower vitamin C concentrations reflect inherent species differences in antioxidant metabolism, although the pronounced increase under reduced light indicates that basil microgreens remain responsive to light-driven metabolic regulation [18,38]. Overall, these results support the concept that vitamin C accumulation in microgreens is optimised at light intensities that balance photosynthetic activity with oxidative signalling rather than at maximum irradiance.

4.2.3. Carotenoids

Carotenoid composition and total carotenoid content were highly responsive to light intensity, with a clear optimum at intermediate irradiance (T3) for carrot, basil, and arugula microgreens. Carotenoids are directly involved in light harvesting and photoprotection, and their biosynthesis is tightly linked to photosynthetic demand and excitation pressure within chloroplasts [39]. The observed decline in total carotenoids at both the highest (T1) and lowest (T4) light intensities suggests that the highest tested irradiance may promote carotenoid turnover or photooxidative degradation, while insufficient light limits precursor availability and biosynthetic enzyme activity.
In carrot microgreens, the strong increase in lutein, β-cryptoxanthin, and β-carotene under T3 indicates that moderate light intensities favour carotenoid accumulation without inducing photoinhibition, in agreement with previous findings in carrot seedlings and microgreens [13,16]. Basil exhibited a particularly pronounced response, with maximal carotenoid accumulation under T3, highlighting its high plasticity and capacity to modulate pigment synthesis in response to light availability [17,38]. In contrast, radish microgreens showed their highest carotenoid levels at the highest light intensity, reflecting a greater tolerance to elevated irradiance and a distinct photoprotective strategy typical of Brassicaceae species [39].
These results confirm that carotenoid biosynthesis in microgreens follows a non-linear response to light intensity, with species-specific optima that should be considered when designing lighting strategies aimed at maximising nutritional quality rather than biomass alone.

4.2.4. Tocopherols and Tocotrienols

Tocol accumulation was markedly influenced by light intensity and showed strong species specificity. In arugula and carrot microgreens, total tocol content increased under lower light intensities, particularly T4, whereas basil exhibited maximum tocol accumulation under the highest irradiance (T1). Tocopherols are lipid-soluble antioxidants that protect membrane integrity by scavenging lipid peroxyl radicals, and their synthesis is often stimulated under conditions that alter redox balance [34].
The increase in γ-tocopherol in arugula under reduced light suggests an adaptive antioxidant response to altered photosynthetic electron flow, consistent with reports in Brassicaceae microgreens grown under continuous or modified lighting regimes [19]. Basil’s exceptionally high tocol levels under high light indicate a strong photoprotective mechanism that supports sustained photosynthetic activity at elevated irradiance, aligning with its high growth responsiveness to light observed in the present study. In carrot and radish microgreens, intermediate light intensities favoured balanced accumulation of α- and γ-tocopherols, reinforcing the concept that moderate irradiance optimizes antioxidant efficiency without excessive oxidative stress.

4.2.5. Sterols

Sterol profiles were strongly modulated by light intensity, with β-sitosterol dominating across all species. In carrot and radish microgreens, total sterol content peaked at intermediate irradiance (T3), whereas arugula showed maximal sterol accumulation under the lowest light intensity (T4). Phytosterols are structural components of plant membranes and play a key role in maintaining membrane fluidity, permeability, and functionality under changing environmental conditions [26].
The pronounced accumulation of brassicasterol in arugula under reduced light may reflect adaptive membrane remodelling to maintain cellular stability when photosynthetic energy input is limited. Basil, by contrast, accumulated the highest sterol concentrations under high light, likely supporting rapid cell expansion and membrane synthesis associated with enhanced growth rates. These divergent patterns highlight the dual structural and regulatory roles of sterols and their sensitivity to light-mediated metabolic cues.

4.2.6. Squalene

Squalene was detected at low concentrations in all species and treatments, consistent with its role as a transient intermediate in sterol biosynthesis rather than a major storage compound in leafy tissues. Nonetheless, its accumulation pattern mirrored that of sterols in several species, with peaks at intermediate light intensity in arugula and radish and at high light in basil. This association suggests that light intensity regulates the sterol biosynthetic pathway upstream, influencing flux through squalene toward end-product sterols. Although quantitatively minor, the presence of squalene reinforces the notion that lighting conditions modulate the entire isoprenoid pathway, with potential implications for both nutritional quality and plant stress resilience.

4.3. Principal Component Analysis

PCA provided an integrated view of the relationships between phytochemical composition, species identity, and light intensity in vegetable microgreens. By analysing individual bioactive compounds, the PCA effectively resolved interspecific differences while simultaneously highlighting light-dependent modulation of metabolic profiles. The autoscaled dataset ensured that all variables contributed equally to the analysis, allowing subtle yet biologically meaningful patterns to emerge.
The first principal component (PC1) was mainly associated with species-specific biochemical traits and was strongly influenced by carotenoid-related variables, including violaxanthin, antheraxanthin, zeaxanthin, and β-carotene. This axis clearly separated species according to their inherent pigment composition and photoprotective capacity. Carrot and radish microgreens clustered in regions characterized by higher carotenoid contributions, reflecting a metabolic strategy oriented toward pigment-based light harvesting and photoprotection. In contrast, basil and arugula were positioned in regions associated with lower carotenoid influence, indicating alternative strategies for managing light energy and oxidative balance.
The second principal component (PC2) captured variation associated with light intensity and was primarily driven by vitamin C, γ-tocopherol, and squalene. These compounds are key components of antioxidant and membrane-protective systems, suggesting that this axis represents adjustments in redox regulation in response to irradiance. Species differed in their dispersion along PC2, with basil and arugula showing greater sensitivity to changes in light intensity, while carrot and radish exhibited more constrained responses.
β-Sitosterol contributed to both principal components, reflecting its dual role in membrane structure and stress adaptation. Its intermediate loading position highlights its importance in linking pigment composition and antioxidant defense across species.
Overall, the PCA demonstrates that phytochemical composition in microgreens is primarily structured by species-specific metabolic characteristics, with light intensity acting as a modulating factor that shapes antioxidant and pigment accumulation. These results emphasize the need for tailored light management strategies in controlled-environment agriculture to optimize both growth and nutritional quality in different microgreen species.

5. Conclusions

This study demonstrates that light intensity is a key regulator of both physiological performance and phytochemical composition in microgreens cultivated under controlled conditions, while was accompanied by minimal influence on the chemical stability of the root zone when fertigation is properly managed. Across all species evaluated, drainage pH and electrical conductivity remained within optimal ranges, confirming that variations in irradiance can be implemented without compromising nutrient solution balance in coconut coir-based systems.
In contrast, water, nitrate, and potassium uptake were strongly and consistently enhanced by increasing light intensity, reflecting higher photosynthetic activity and transpiration demand. These responses were markedly species dependent, with fast-growing Brassicaceae microgreens, particularly arugula and radish, showing greater sensitivity to reductions in irradiance. Biomass accumulation followed a similar trend, with fresh and dry weight increasing with light intensity in all species, although carrot microgreens exhibited a more moderate growth response, indicating lower irradiance requirements or physiological constraints under high light.
Beyond growth, light intensity exerted a profound influence on phytochemical accumulation, and these effects were highly compound and species-specific. Intermediate irradiance levels generally optimised carotenoid biosynthesis in carrot, basil, and arugula microgreens, whereas both the highest tested irradiance and insufficient light resulted in reduced pigment accumulation. Vitamin C and tocols displayed contrasting responses, always increasing under reduced light intensities, suggesting that mild light limitation may activate antioxidant defence pathways. Sterol profiles were also modulated by light, with distinct accumulation patterns reflecting species-specific membrane and metabolic adaptations.
PCA confirmed that phytochemical composition in microgreens is predominantly structured by species-specific metabolic traits, while light intensity acts as a secondary but significant modulator within each species. The multivariate separation highlighted carotenoids as the main drivers of interspecific differentiation, whereas vitamin C, tocopherols, and squalene were more closely associated with light-dependent antioxidant responses. These results demonstrate that microgreens exhibit distinct biochemical strategies for coping with irradiance, reinforcing the importance of species-specific optimization of light intensity in controlled-environment production to maximize nutritional quality.
Overall, these findings underscore the importance of tailoring light intensity not only to maximise biomass production but also to target specific nutritional and functional attributes in microgreens. Optimising irradiance according to species and desired phytochemical profiles offers a powerful strategy for enhancing the nutritional quality of microgreens in controlled-environment agriculture, supporting their role as high-value functional foods in sustainable food systems.

Supplementary Materials

The following supporting information can be downloaded at: https://www.mdpi.com/article/10.3390/horticulturae12020200/s1, Supplementary File S1. Material and Methods; Supplementary Table S1. Nutrient solution used to fertilise the crop; Supplementary Table S2. Pearson correlation matrix for PCA-selected variables (|r|); Supplementary Table S3. Autoscaled (Z-score normalised) data matrix used for Principal Component Analysis (values are dimensionless); Supplementary Table S4. Extracted components of the PCA analysis; Supplementary Figure S1. HPLC-DAD chromatograms of (A) Ascorbic acid, (B) Carotenoids, (C) Tocols, (D) Sterols, and Squalene; Supplementary Figure S2. pH of drainage of microgreens grown in coconut coir under different light intensities; Supplementary Figure S3. Electrical conductivity (EC, dS·m−1) of drainage of microgreens grown in coconut coir under different light intensities.

Author Contributions

Conceptualization, T.P.L.C.-C. and J.L.G.-G.; methodology, T.P.L.C.-C., T.C.-C., M.U. and J.L.G.-G.; software, T.P.L.C.-C., T.C.-C., M.U. and J.L.G.-G.; validation, T.P.L.C.-C., M.U. and J.L.G.-G.; formal analysis, T.P.L.C.-C., T.C.-C., M.U. and J.L.G.-G.; investigation, M.U. and J.L.G.-G.; resources, M.U. and J.L.G.-G.; data curation, T.P.L.C.-C., T.C.-C., M.U. and J.L.G.-G.; writing—original draft preparation, T.P.L.C.-C., T.C.-C., M.U. and J.L.G.-G.; writing—review and editing, J.L.G.-G.; visualization, T.P.L.C.-C., T.C.-C., M.U and J.L.G.-G.; supervision, J.L.G.-G.; project administration, J.L.G.-G.; funding acquisition, M.U. and J.L.G.-G. All authors have read and agreed to the published version of the manuscript.

Funding

This work has not received specific funding for its development.

Data Availability Statement

The original contributions presented in this study are included in the article/Supplementary Materials. Further inquiries can be directed to the corresponding author.

Conflicts of Interest

The authors declare no conflicts of interest.

References

  1. Rasmi, P.K.; Dalbhagat, C.G.; Venugopal, A.P.; Mishra, S.; Gowda, N.; Kambhampati, V. A comprehensive review of herb microgreens as emerging functional foods: Insights into their nutritional potential and health benefits. Prep. Biochem. Biotechnol. 2026, 56, 1–13. [Google Scholar] [CrossRef]
  2. Zhang, Y.; Xiao, Z.; Ager, E.; Kong, L.; Tan, L. Nutritional quality and health benefits of microgreens, a crop of modern agriculture. J. Future Foods 2021, 1, 58–66. [Google Scholar] [CrossRef]
  3. Gunjal, M.; Singh, J.; Kaur, J.; Kaur, S.; Nada, V.; Sharma, A.; Rasane, P. Microgreens: Cultivation practices, bioactive potential, health benefits, and opportunities for its utilization as value-added food. Food Biosci. 2024, 62, 105133. [Google Scholar] [CrossRef]
  4. Seth, T.; Mishra, G.P.; Chattopadhyay, A.; Deb Roy, P.; Devi, M.; Sahu, A.; Sarangi, S.K.; Mhatre, C.S.; Lyngdoh, Y.A.; Chandra, V.; et al. Microgreens: Functional food for nutrition and dietary diversification. Plants 2025, 14, 526. [Google Scholar] [CrossRef] [PubMed]
  5. Vučetić, A.; Šovljanski, O.; Pezo, L.; Gligorijević, N.; Kostić, S.; Vulić, J.; Čanadanović-Brunet, J. A comprehensive antioxidant and nutritional profiling of Brassicaceae microgreens. Antioxidants 2025, 14, 191. [Google Scholar] [CrossRef] [PubMed]
  6. Ferreira, M.E.; Henschel, J.M.; Olivoto, T.; Batista, D.S.; Zeist, A.R. Research on microgreens: A bibliometric analysis. Vegetos 2024, 37, 1589–1601. [Google Scholar] [CrossRef]
  7. Sanyal, M.; Chowdhury, D.; Ghosh, A.; Bandyopadhyay, S. Bio-stimulating Role of Plant Growth Promoting Microorganisms in the Sustainable Production of Micro Greens. In Recent Trends and Applications of Leguminous Microgreens as Functional Foods; Mathur, P., Gupta, A., Eds.; Springer: Cham, Switzerland, 2025; pp. 315–337. [Google Scholar] [CrossRef]
  8. Di Gioia, F.; Petropoulos, S.A.; Ferreira, I.C.F.R.; Rosskopf, E.N. Microgreens: From trendy vegetables to functional food and potential nutrition security resource. Acta Hortic. 2021, 1321, 235–242. [Google Scholar] [CrossRef]
  9. Mathur, P.; Gupta, A. Recent trends and applications of leguminous microgreens as functional foods. In Recent Trends and Applications of Leguminous Microgreens as Functional Foods; Springer: Cham, Switzerland, 2025; pp. 1–20. [Google Scholar] [CrossRef]
  10. Sanyukta, N.; Brar, D.S.; Pant, K.; Kaur, S.; Nanda, V.; Nayik, G.A.; Ramniwas, S.; Rasan, P.; Ercisli, S. Comprehensive analysis of physicochemical, functional, thermal, and morphological properties of microgreens from different botanical sources. ACS Omega 2023, 8, 9012–9024. [Google Scholar] [CrossRef]
  11. Mangla, S.; Pathak, G.; Bhan, V. Leguminous Microgreens as a Sustainable Source of Essential Nutrients. In Recent Trends and Applications of Leguminous Microgreens as Functional Foods; Mathur, P., Gupta, A., Eds.; Springer: Cham, Switzerland, 2025; pp. 103–122. [Google Scholar] [CrossRef]
  12. Talley, J.; Martin, L.L.; Oates, V.J.; Peng, J. Using an agricultural supply chain to train the next generation of STEM professionals. In Proceedings of the ASEE Annual Conference and Exposition, Conference Proceedings, Baltimore, MD, USA, 25–28 June 2023. [Google Scholar] [CrossRef]
  13. Samuolienė, G.; Duchovskis, P.; Šikšnianienė, J.; Brazaityté, A.; Ulinskaité, R.; Tamulaitis, G.; Bliznikas, Z.; Kurilcik, G.; Žukauskas, A. Flowering initiation in carrots by tailoring the illumination spectrum. Acta Hortic. 2006, 711, 245–250. [Google Scholar] [CrossRef]
  14. Samuolienė, G.; Sabajevienė, G.; Viršilė, A.; Duchovskis, P. Carrot flowering initiation: Light effect, photosynthetic pigments, carbohydrates. Acta Biol. Szeg 2007, 51, 39–42. [Google Scholar]
  15. Taulavuori, K.; Pyysalo, A.; Taulavuori, E.; Julkunen-Tiitto, R. Responses of phenolic acid and flavonoid synthesis to blue and blue-violet light depends on plant species. Environ. Exp. Bot. 2018, 150, 183–187. [Google Scholar] [CrossRef]
  16. Gonzalez-Calquin, C.; Munizaga, F.; Salvatierra, A.; Villalobos, L.; Pimentel, P.; Stange, C. LED lighting enhances early storage root development and sucrose accumulation in carrot (Daucus carota L.) without altering carotenoid content. Sci. Hortic. 2025, 348, 114220. [Google Scholar] [CrossRef]
  17. Lin, K.H.; Huang, M.Y.; Hsu, M.H. Morphological and physiological response in green and purple basil plants (Ocimum basilicum) under different proportions of red, green, and blue LED lightings. Sci. Hortic. 2021, 275, 109677. [Google Scholar] [CrossRef]
  18. Kelly, N.; Oehler, M.A.; O’Brien, R.; Park, E.; Bai, J.; Fonseca, J.; Luo, Y. Supplemental light differentially regulates indoor-grown basil (Ocimum basilicum) growth, volatile compounds, and sensory attributes. Horticulturae 2025, 11, 963. [Google Scholar] [CrossRef]
  19. Shibaeva, T.G.; Rubaeva, A.A.; Sherudilo, E.G.; Titov, A.F. Continuous lighting increases yield and nutritional value and decreases nitrate content in Brassicaceae microgreens. Russ. J. Plant Physiol. 2023, 70, 118. [Google Scholar] [CrossRef]
  20. Jones-Baumgardt, C.; Llewellyn, D.; Ying, Q.; Zheng, Y. Intensity of sole-source light-emitting diodes affects growth, yield, and quality of Brassicaceae microgreens. HortScience 2019, 54, 1168–1174. [Google Scholar] [CrossRef]
  21. Kyriacou, M.C.; De Pascale, S.; Kyratzis, A.; Rouphael, Y. Microgreens as a Component of Space Life Support Systems: A Cornucopia of Functional Food. Front. Plant Sci. 2017, 8, 1587. [Google Scholar] [CrossRef]
  22. Samuolienė, G.; Urbonavičiūtė, A.; Brazaitytė, A.; Šabajevienė, G.; Sakalauskaitė, J.; Duchovskis, P. The impact of LED illumination on antioxidant properties of sprouted seeds. Cent. Eur. J. Biol. 2011, 6, 68–74. [Google Scholar] [CrossRef]
  23. Liu, K.; Gao, M.; Jiang, H.; Ou, S.; Li, X.; He, R.; Li, Y.; Liu, H. Light Intensity and Photoperiod Affect Growth and Nutritional Quality of Brassica Microgreens. Molecules 2022, 27, 883. [Google Scholar] [CrossRef]
  24. Alrifai, O.; Hao, X.; Marcone, M.F.; Tsao, R. Current review of the modulatory effects of LED lights on photosynthesis of secondary metabolites and future perspectives of microgreen vegetables. J. Agric. Food Chem. 2019, 67, 6075–6090. [Google Scholar] [CrossRef]
  25. Bian, Z.H.; Yang, Q.C.; Liu, W.K. Effects of light quality on the accumulation of phytochemicals in vegetables produced in controlled environments: A review. J. Sci. Food Agric. 2014, 95, 869–877. [Google Scholar] [CrossRef]
  26. Ferrón-Carrillo, F.; Guil-Guerrero, J.L.; González-Fernández, M.J.; Lyashenko, S.; Battafaro, F.; Cunha-Chiamolera, T.P.L.; Urrestarazu, M. LED enhances plant performance and both carotenoids and nitrates profiles in lettuce. Plant Foods Hum. Nutr. 2021, 76, 210–218. [Google Scholar] [CrossRef]
  27. Rodríguez, D.; Reca, J.; Martínez, J.; Lao, M.T.; Urrestarazu, M. Effect of controlling the leaching fraction on the fertigation and production of a tomato crop under soilless culture. Sci. Hortic. 2014, 179, 153–157. [Google Scholar] [CrossRef]
  28. Peçanha, D.A.; Cunha-Chiamolera, T.P.L.; Chourak, Y.; Martínez-Rivera, E.Y.; Urrestarazu, M. Effect of the matric potential on growth and water, nitrate and potassium absorption of vegetables under soilless culture. J. Soil Sci. Plant Nutr. 2021, 21, 3493–3501. [Google Scholar] [CrossRef]
  29. Urrestarazu, M.; Carrasco, G. Soilless Culture and Hydroponics; Mundi-Prensa: Madrid, Spain, 2023; 279p. [Google Scholar]
  30. Sonneveld, C.; Straver, N.B. Nutrient Solution for Vegetables and Flowers Grown in Water or Substrates, 10th ed.; Glasshouse Crops Research Station: Naaldwijk, The Netherlands, 1994; pp. 1–33. [Google Scholar]
  31. Volden, J.; Bengtsson, G.B.; Wicklund, T. Glucosinolates, L-ascorbic acid, total phenols, anthocyanins, antioxidant capacities and color in cauliflower (Brassica oleracea L. ssp. botrytis); effects of long-term freezer storage. Food Chem. 2009, 112, 967–976. [Google Scholar] [CrossRef]
  32. Kimura, M.; Rodríguez-Amaya, D.B. A scheme for obtaining standards and HPLC quantification of leafy vegetable carote-noids. Food Chem. 2002, 78, 389–398. [Google Scholar] [CrossRef]
  33. Fabrikov, D.; Guil-Guerrero, J.L.; González-Fernández, M.J.; Rodríguez-García, I.; Gómez-Mercado, F.; Urrestarazu, M.; Lao, M.T.; Rincón-Cervera, M.A.; Álvaro, J.E.; Lyashenko, S. Borage oil: Tocopherols, sterols and squalene in farmed and endemic-wild Borago species. J. Food Compos. Anal. 2019, 83, 103299. [Google Scholar] [CrossRef]
  34. Rincón-Cervera, M.A.; Cunha-Chiamolera, T.P.L.; Chileh-Chelh, T.; Carmona-Fernández, M.; Urrestarazu, M.; Guil-Guerrero, J.L. Growth parameters, phytochemicals, and antitumor activity of wild and cultivated ice plants (Mesembryanthemum crystallinum L.). Food Sci. Nutr. 2024, 12, 6548–6562. [Google Scholar] [CrossRef]
  35. Partap, M.; Sharma, D.; Deekshith, H.N.; Thakur, M.; Verma, V.; Ujala, B.B. Microgreen: A tiny plant with superfood potential. J. Funct. Foods 2023, 107, 105697. [Google Scholar] [CrossRef]
  36. Cunha-Chiamolera, T.P.L.; Chileh-Chelh, T.; Urrestarazu, M.; Ezzaitouni, M.; López-Ruiz, R.; Gallón-Bedoya, M.; Rincón-Cervera, M.Á.; Guil-Guerrero, J.L. Crop Productivity, Phytochemicals, and Bioactivities of Wild and Grown in Controlled Environment Slender Amaranth (Amaranthus viridis L.). Agronomy 2024, 14, 2038. [Google Scholar] [CrossRef]
  37. Zang, X.; Bian, Z.; Li, S.; Chen, X.; Lu, C. Comparative analysis of phenolic compound profiles, antioxidant capacities, and expressions of phenolic biosynthesis-related genes in soybean microgreens grown under different light spectra. J. Agric. Food Chem. 2019, 67, 13577–13588. [Google Scholar] [CrossRef]
  38. Lobiuc, A.; Vasilache, V.; Oroian, M.; Stoleru, T.; Burducea, M.; Pintilie, O.; Zamfirache, M.M. Blue and red LED illumination improves growth and bioactive compounds contents in acyanic and cyanic Ocimum basilicum L. microgreens. Molecules 2017, 22, 2111. [Google Scholar] [CrossRef]
  39. Brazaitytė, A.; Sakalauskienė, S.; Samuolienė, G.; Jankauskienė, J.; Viršilė, A.; Novičkovas, A.; Sirtautas, R.; Miliauskienė, J.; Vaštakaitė, V.; Dabašinskas, L.; et al. The effects of LED illumination spectra and intensity on carotenoid content in Brassicaceae microgreens. Food Chem. 2015, 173, 600–606. [Google Scholar] [CrossRef]
  40. Mendes, F.Q.; Purquerio, L.F.V.; Carvalho, R.F.; Cecílio Filho, A.B. White light intensities for maximum yield and quality of arugula microgreens. Pesqui. Agropecu. Trop. 2024, 54, e74009. [Google Scholar] [CrossRef]
  41. Mlinarić, S.; Piškor, A.; Melnjak, A.; Mikuška, A.; Gajdošik, M.S.; Begović, L. Antioxidant capacity and shelf life of radish microgreens affected by growth light and cultivars. Horticulturae 2023, 9, 76. [Google Scholar] [CrossRef]
Figure 1. Fresh weight (g·m−2) of microgreens grown in coconut coir under different light intensities. Different letters indicate significant differences for each parameter as determined by one-way ANOVA followed by Duncan Multiple Range test (p < 0.05). Linear and quadratic polynomial regressions and their R2 values were performed.
Horticulturae 12 00200 g001
Figure 2. Dry weight (g m−2) of microgreens grown in coconut coir under different light intensities. Different letters indicate significant differences for each parameter as determined by one-way ANOVA followed by Duncan Multiple Range test (p < 0.05). Linear and quadratic polynomial regressions and their R2 values were performed.
Horticulturae 12 00200 g002
Figure 3. Biplot representing the first two principal components. Data points correspond to microgreens (A, arugula; B, basil; C, carrot; R, radish), at different light intensities: 174 (T1), 140 (T2), 100 (T3), and 67 μmol·m−2·s−1 (T4).
Horticulturae 12 00200 g003
Table 1. Total water, nitrate, and potassium uptake by microgreen plants grown in coconut coir under different light intensities ab.
Species/LightsbL·m−2Mmol·m−2
WaterNitratePotassium
Basil
BT13.89 a62.28 a69.04 a
BT23.24 a59.15 a66.63 ab
BT32.69 b53.07 b63.40 b
BT41.89 c44.59 c59.13 c
Carrot
CT13.79 a44.14 a51.88 a
CT23.42 a40.52 b50.19 a
CT32.85 ab37.08 c48.43 ab
CT42.47 b34.18 d47.34 b
Radish
RT111.54 a66.61 a67.40 a
RT210.35 a57.91 b56.40 b
RT38.56 b46.26 c43.27 c
RT46.99 c35.89 d31.13 d
Arugula
AT115.28 a64.91 a114.92 a
AT214.00 a57.39 b98.78 b
AT312.80 ab49.78 c85.51 c
AT411.58 b39.81 d68.40 d
a Means followed by different superscript letters within the same column indicate significant differences among samples according to the Multiple Range Test of Duncan (p < 0.05); b T1 174 μmol·m−2·s−1, T2 140 μmol·m−2·s−1, T3 100 μmol·m−2·s−1, T4 67 μmol·m−2·s−1.
Table 2. Moisture and vitamin C contents of selected microgreens cultivated under light-treatment conditions a,b.
Species/Lights cMoisture
g·100 g−1
Total Vitamin C
mg·100 g−1 fw
Arugula
AT195.0 ± 0.8 a83.8 ± 1.2 g
AT293.0 ± 0.6 bc90.5 ± 2.5 f
AT392.0 ± 0.5 c98.0 ± 1.8 e
AT494.0 ± 0.4 ab99.6 ± 2.6 e
Basil
BT195.0 ± 0.3 a12.5 ± 0.2 k
BT295.0 ± 0.4 a30.6 ± 0.8 j
BT395.0 ± 0.6 a35.8 ± 0.8 i
BT495.0 ± 0.8 a32.6 ± 0.6 ij
Carrot
CT193.0 ± 0.4 bc36.1 ± 0.4 i
CT293.0 ± 0.5 bc36.3 ± 0.7 i
CT392.0 ± 0.7 c58.3 ± 0.4 h
CT494.0 ± 0.5 ab57.2 ± 0.1 h
Radish
RT186.0 ± 0.7 d178.3 ± 0.7 d
RT287.0 ± 0.6 d188.5 ± 0.3 c
RT387.0 ± 0.5 d205.2 ± 1.7 a
RT486.0 ± 0.5 d194.7 ± 2.8 b
a Data represent means ± standard deviation of samples analyzed in triplicate; b In a column means followed by different letters are significantly different according to Ducan Multiple Range test (p < 0.05); c T1 174 μmol·m−2·s−1, T2 140 μmol·m−2·s−1, T3 100 μmol·m−2·s−1, T4 67 μmol·m−2·s−1.
Table 3. Carotenoid content (mg·100 g−1 fw) of selected microgreens cultivated under different light-treatment conditions a,b,c.
Species/
Lights d
All-Trans-
Violaxanthin
9′-Cis-NeoxanthinLuteoxanthinAntheraxanthinLuteinAll-Trans-Zeaxanthinα-Cryptoxanthinβ-CryptoxanthinAll-Trans-β-CaroteneTotal Carotenoids
Arugula
AT13.6 ± 0.2 hi1.9 ± 0.3 g2.2 ± 0.5 hij0.4 ± 0.0 i181.4 ± 0.3 i4.1 ± 0.3 hij10.0 ± 0.6 b3.4 ± 0.0 h15.2 ± 0.8 h222.2 ± 1.2 j
AT23.4 ± 0.1 hi2.5 ± 0.0 g3.0 ± 0.2 fgh0.6 ± 0.0 hi184.2 ± 8.7 i4.2 ± 0.0 ghi11.7 ± 0.3 a2.6 ± 0.0 i10.7 ± 0.5 ij222.7 ± 8.8 j
AT3 4.3 ± 0.8 hi2.3 ± 0.1 g3.2 ± 0.6 efgh0.5 ± 0.1 i213.3 ± 9.4 cdef4.9 ± 0.1 efgh4.8 ± 0.3 ef2.7 ± 0.0 hi28.2 ± 0.5 e264.1 ± 9.5 gh
AT43.9 ± 0.2 hi1.8 ± 0.3 g2.7 ± 0.2 ghi0.5 ± 0.0 i198.9 ± 1.6 gh3.3 ± 0.0 ij5.6 ± 0.2 de3.2 ± 0.1 hi18.8 ± 1.0 g238.7 ± 1.9 ij
Basil
BT114.4 ± 0.9 b24.7 ± 0.9 a4.4 ± 0.6 cd7.6 ± 0.8 a208.9 ± 1.6 efg10.2 ± 0.8 b3.0 ± 0.2 g32.8 ± 0.8 d103.4 ± 3.1 b409.4 ± 4.1 c
BT29.4 ± 0.7 d19.4 ± 0.2 c2.7 ± 0.7 ghi0.9 ± 0.1 ghi223.2 ± 8.2 cd4.8 ± 0.7 fgh4.4 ± 0.2 f13.1 ± 0.1 e58.8 ± 2.9 c336.6 ± 8.8 d
BT3 17.1 ± 0.7 a22.5 ± 0.8 b9.0 ± 0.8 a4.2 ± 0.4 b247.2 ± 6.7 b13.6 ± 0.5 a5.7 ± 0.5 d10.5 ± 0.1 f115.1 ± 3.8 a445.0 ± 7.8 b
BT47.5 ± 0.8 e10.6 ± 0.8 e3.9 ± 0.3 def3.1 ± 0.2 c210.9 ± 3.5 defg3.8 ± 0.4 ij2.9 ± 0.1 g12.6 ± 0.6 e61.9 ± 1.2 c317.0 ± 3.9 e
Carrot
CT16.2 ± 0.8 f5.3 ± 0.2 f1.1 ± 0.4 k0.9 ± 0.1 ghi188.4 ± 2.0 hi5.0 ± 0.1 efg4.5 ± 0.3 f45.3 ± 0.2 c13.8 ± 0.8 hi270.4 ± 2.4 gh
CT25.7 ± 0.3 fg10.0 ± 0.5 e1.9 ± 0.3 ijk1.1 ± 0.3 fgh226.4 ± 7.6 c5.1 ± 0.5 ef6.9 ± 0.3 c50.6 ± 0.3 b24.1 ± 1.7 f331.9 ± 7.8 de
CT312.3 ± 0.3 c12.4 ± 0.8 d2.4 ± 0.2 hij1.9 ± 0.2 d363.1 ± 9.9 a8.9 ± 0.3 c10.0 ± 0.1 b82.2 ± 0.2 a32.7 ± 1.4 d525.9 ± 10.0 a
CT43.0 ± 0.5 i2.9 ± 0.6 g1.7 ± 0.2 jk0.8 ± 0.2 ghi155.0 ± 9.7 j3.3 ± 0.2 j7.7 ± 0.5 c9.6 ± 0.5 g7.7 ± 0.6 j191.7 ± 9.8 k
Radish
RT17.5 ± 0.1 e5.2 ± 0.8 f5.9 ± 0.1 b1.6 ± 0.1 def218.4 ± 6.7 cde6.6 ± 0.1 d7.6 ± 0.7 c2.6 ± 0.1 i33.7 ± 1.8 d289.1 ± 7.0 f
RT24.5 ± 0.5 gh2.9 ± 0.9 g4.0 ± 0.1 de0.5 ± 0.0 i203.7 ± 0.6 fg5.5 ± 0.8 ef10.4 ± 0.5 b3.3 ± 0.5 hi20.5 ± 0.8 fg255.3 ± 1.8 hi
RT35.9 ± 0.7 f5.9 ± 0.8 f3.7 ± 0.5 defg1.2 ± 0.1 efg184.4 ± 6.5 i5.7 ± 0.1 e9.7 ± 0.6 b2.9 ± 0.1 hi22.7 ± 0.5 f242.2 ± 6.6 i
RT46.5 ± 0.9 ef5.9 ± 0.8 f5.3 ± 0.6 bc1.7 ± 0.3 de209.3 ± 6.4 efg5.5 ± 0.1 ef7.6 ± 0.4 c2.7 ± 0.1 hi32.9 ± 0.7 d277.5 ± 6.6 fg
a Data represent means ± standard deviation of samples analyzed in triplicate; b In a column, means followed by different letters are different according to Duncan Multiple Range test (p < 0.05); c Individual carotenoids are expressed as β-carotene equivalents; d T1 174 μmol·m−2·s−1, T2 140 μmol·m−2·s−1, T3 100 μmol·m−2·s−1, T4 67 μmol·m−2·s−1.
Table 4. Tocols, sterols, and squalene contents of selected microgreens cultivated under light-treatment conditions a,b,c.
Species/
Lights d
Tocols (µg·100 g−1 fw)Total Tc
µg·100 g−1 fw
Sterols (mg·100 g−1 fw)Total St
mg·100 g−1 fw
Squalene
mg·100 g−1 fw
α-T3α-Tpγ-Tpδ -TpBrassicasterolStigmasterolCampesterolβ-Sitosterol
Arugula
AT150 ± 4 de480 ± 10 f270 ± 10 k90 ± 10 c890 ± 10 g18 ± 1 ghi8 ± 1 i14 ± 1 j34 ± 5 j74 ± 2 htraces
AT240 ± 3 ef380 ± 30 hi240 ± 10 k50 ± 10 def710 ± 10 h29 ± 3 cdef12 ± 3 hi29 ± 1 gh76 ± 3 h146 ± 3 ftraces
AT350 ± 7 de560 ± 40 de220 ± 10 k40 ± 10 ef870 ± 30 g22 ± 2 fgh20 ± 2 fg38 ± 2 def113 ± 2 de193 ± 7 d0.11 ± 0.02 a
AT460 ± 7 cd460 ± 10 fg1020 ± 30 e120 ± 10 b1670 ± 30 c58 ± 4 a13 ± 2 ghi22 ± 1 i53 ± 1 i146 ± 3 f0.05 ± 0.00 c
Basil
BT170 ± 4 bc660 ± 10 c2210 ± 60 a90 ± 10 c3040 ± 60 a17 ± 1 hi12 ± 1 hi24 ± 2 hi79 ± 3 h132 ± 5 g0.05 ± 0.01 c
BT240 ± 4 ef320 ± 20 ij1130 ± 10 d30 ± 10 f1520 ± 20 d12 ± 1 i19 ± 2 fgh32 ± 2 fg76 ± 1 h139 ± 3 fg0.04 ± 0.00 cd
BT340 ± 4 ef470 ± 20 fg1890 ± 50 c70 ± 10 cd2480 ± 60 b24 ± 2 fgh23 ± 2 ef38 ± 3 def91 ± 2 g176 ± 4 e0.02 ± 0.00 e
BT440 ± 4 ef410 ± 10 gh2110 ± 50 btraces2570 ± 50 b25 ± 2 efg19 ± 2 fgh31 ± 2 g74 ± 3 h149 ± 3 f0.03 ± 0.01 de
Carrot
CT1120 ± 2 a770 ± 40 b710 ± 20 h40 ± 10 ef1630 ± 50 c32 ± 2 bcde30 ± 2 cde50 ± 2 bc120 ± 4 cd232 ± 5 ctraces
CT270 ± 3 bc580 ± 20 de550 ± 20 i150 ± 10 a1360 ± 30 e23 ± 3 fgh62 ± 3 b54 ± 3 b174 ± 5 b313 ± 5 btraces
CT360 ± 8 cd560 ± 10 de590 ± 30 i90 ± 0 c1290 ± 40 e32 ± 3 bcde72 ± 4 a71 ± 3 a213 ± 6 a388 ± 4 atraces
CT4110 ± 5 a930 ± 30 a420 ± 10 j50 ± 10 def1510 ± 30 d36 ± 4 bc30 ± 4 cde38 ± 2 def101 ± 5 fg205 ± 6 d0.07 ± 0.00 b
Radish
RT150 ± 5 de470 ± 20 fg520 ± 10 itraces1050 ± 30 f17 ± 1 hi32 ± 3 cd19 ± 2 ij77 ± 3 h145 ± 4 fgtraces
RT250 ± 4 de520 ± 20 ef900 ± 20 f60 ± 0 de1520 ± 30 d33 ± 3 bcd34 ± 3 c34 ± 2 efg128 ± 5 c229 ± 6 c0.02 ± 0.00 e
RT380 ± 6 b590 ± 10 d800 ± 10 g50 ± 0 def1520 ± 20 d38 ± 3 b73 ± 3 a39 ± 3 de167 ± 3 b317 ± 5 b0.03 ± 0.00 de
RT430 ± 3 f270 ± 20 j520 ± 10 itraces830 ± 20 g26 ± 2 def26 ± 3 def44 ± 3 cd106 ± 3 ef202 ± 4 d0.02 ± 0.00 e
a Data represent means ± standard deviation of samples analyzed in triplicate; b Differences in Tc, St and Sq amounts were tested according to one-way ANOVA followed by Duncan’s test; c In a column, means are followed by a different letter; d LT1 174 μmol m−2 s−1, LT2 140 μmol m−2·s−1, LT3 100 μmol m−2·s−1, LT4 67 μmol m−2·s−1.
Disclaimer/Publisher’s Note: The statements, opinions and data contained in all publications are solely those of the individual author(s) and contributor(s) and not of MDPI and/or the editor(s). MDPI and/or the editor(s) disclaim responsibility for any injury to people or property resulting from any ideas, methods, instructions or products referred to in the content.