Article

Effects of Basal Fertilization Supplemented with Graphene and/or Microbial Inoculants on Growth and Fruit Quality of Winter Jujube Based on Metabolomics Analysis

1
College of Horticulture and Forestry, Tarim University, Alar 843300, China
2
National-Local Joint Engineering Laboratory of High Efficiency and Superior Quality Cultivation and Fruit Deep Processing Technology on Characteristic Fruit Trees, Alar 843300, China
*
Author to whom correspondence should be addressed.
These authors contributed equally to this work.
Horticulturae 2026, 12(2), 133; https://doi.org/10.3390/horticulturae12020133
Submission received: 17 December 2025 / Revised: 17 January 2026 / Accepted: 22 January 2026 / Published: 25 January 2026
(This article belongs to the Special Issue New Insights into Breeding and Genetic Improvement of Fruit Crops)

Abstract

Winter jujube is highly favored by consumers, and improving both the fruit quality and yield during cultivation is a key issue in horticultural research. Fertilization is a critical measure regulating growth. This study aimed to evaluate the effects of basal fertilizer combined with two novel synergistic additives—graphene and microbial inoculants—on the growth, fruit quality, and metabolic profiles of winter jujube, providing new fertilization strategies. The selected doses of graphene (0.38 g/plant) and microbial inoculant (0.26 g/plant) were based on the previous literature to balance efficacy, cost, and environmental safety. The graphene used was functionalized graphene oxide provided by Shanxi Datong University, chosen for its enhanced dispersibility and plant compatibility. Although this study focused on physiological and metabolic responses, the economic feasibility and potential environmental implications of these additives are discussed in the context of sustainable jujube production. Six-year-old winter jujube trees were treated with four fertilization regimes: basal fertilizer + graphene (T1), basal fertilizer + microbial fertilizer (T2), basal fertilizer + graphene + microbial fertilizer (T3), and basal fertilizer only (CK). Growth indices, mineral element contents in different organs, and fruit quality traits were measured. Widely targeted metabolomics was used to analyze metabolic variations among treatments. Compared with CK, all three synergistic fertilizer treatments tended to promote growth, increasing leaf area, chlorophyll content, and jujube bearing shoot length; contributed to the accumulation of P, K, Ca, Mg, and other minerals in various organs; and helped improve fruit quality by increasing the total sugars and flavonoids. T1 and T3 exhibited relatively better overall performance. Metabolomic analysis revealed significant differences in the metabolite profiles of winter jujube fruits across different treatments. Phenolic acids and flavonoids were closely associated with the improvement in fruit quality; further screening identified seven differential metabolites, predominantly belonging to phenolic acids. Basal fertilizer combined with graphene alone or with microbial inoculants may effectively promote growth and improve fruit quality by optimizing mineral uptake and regulating metabolic processes. These findings provide potential theoretical and practical support for high-quality, high-yield fertilization strategies for winter jujube.

1. Introduction

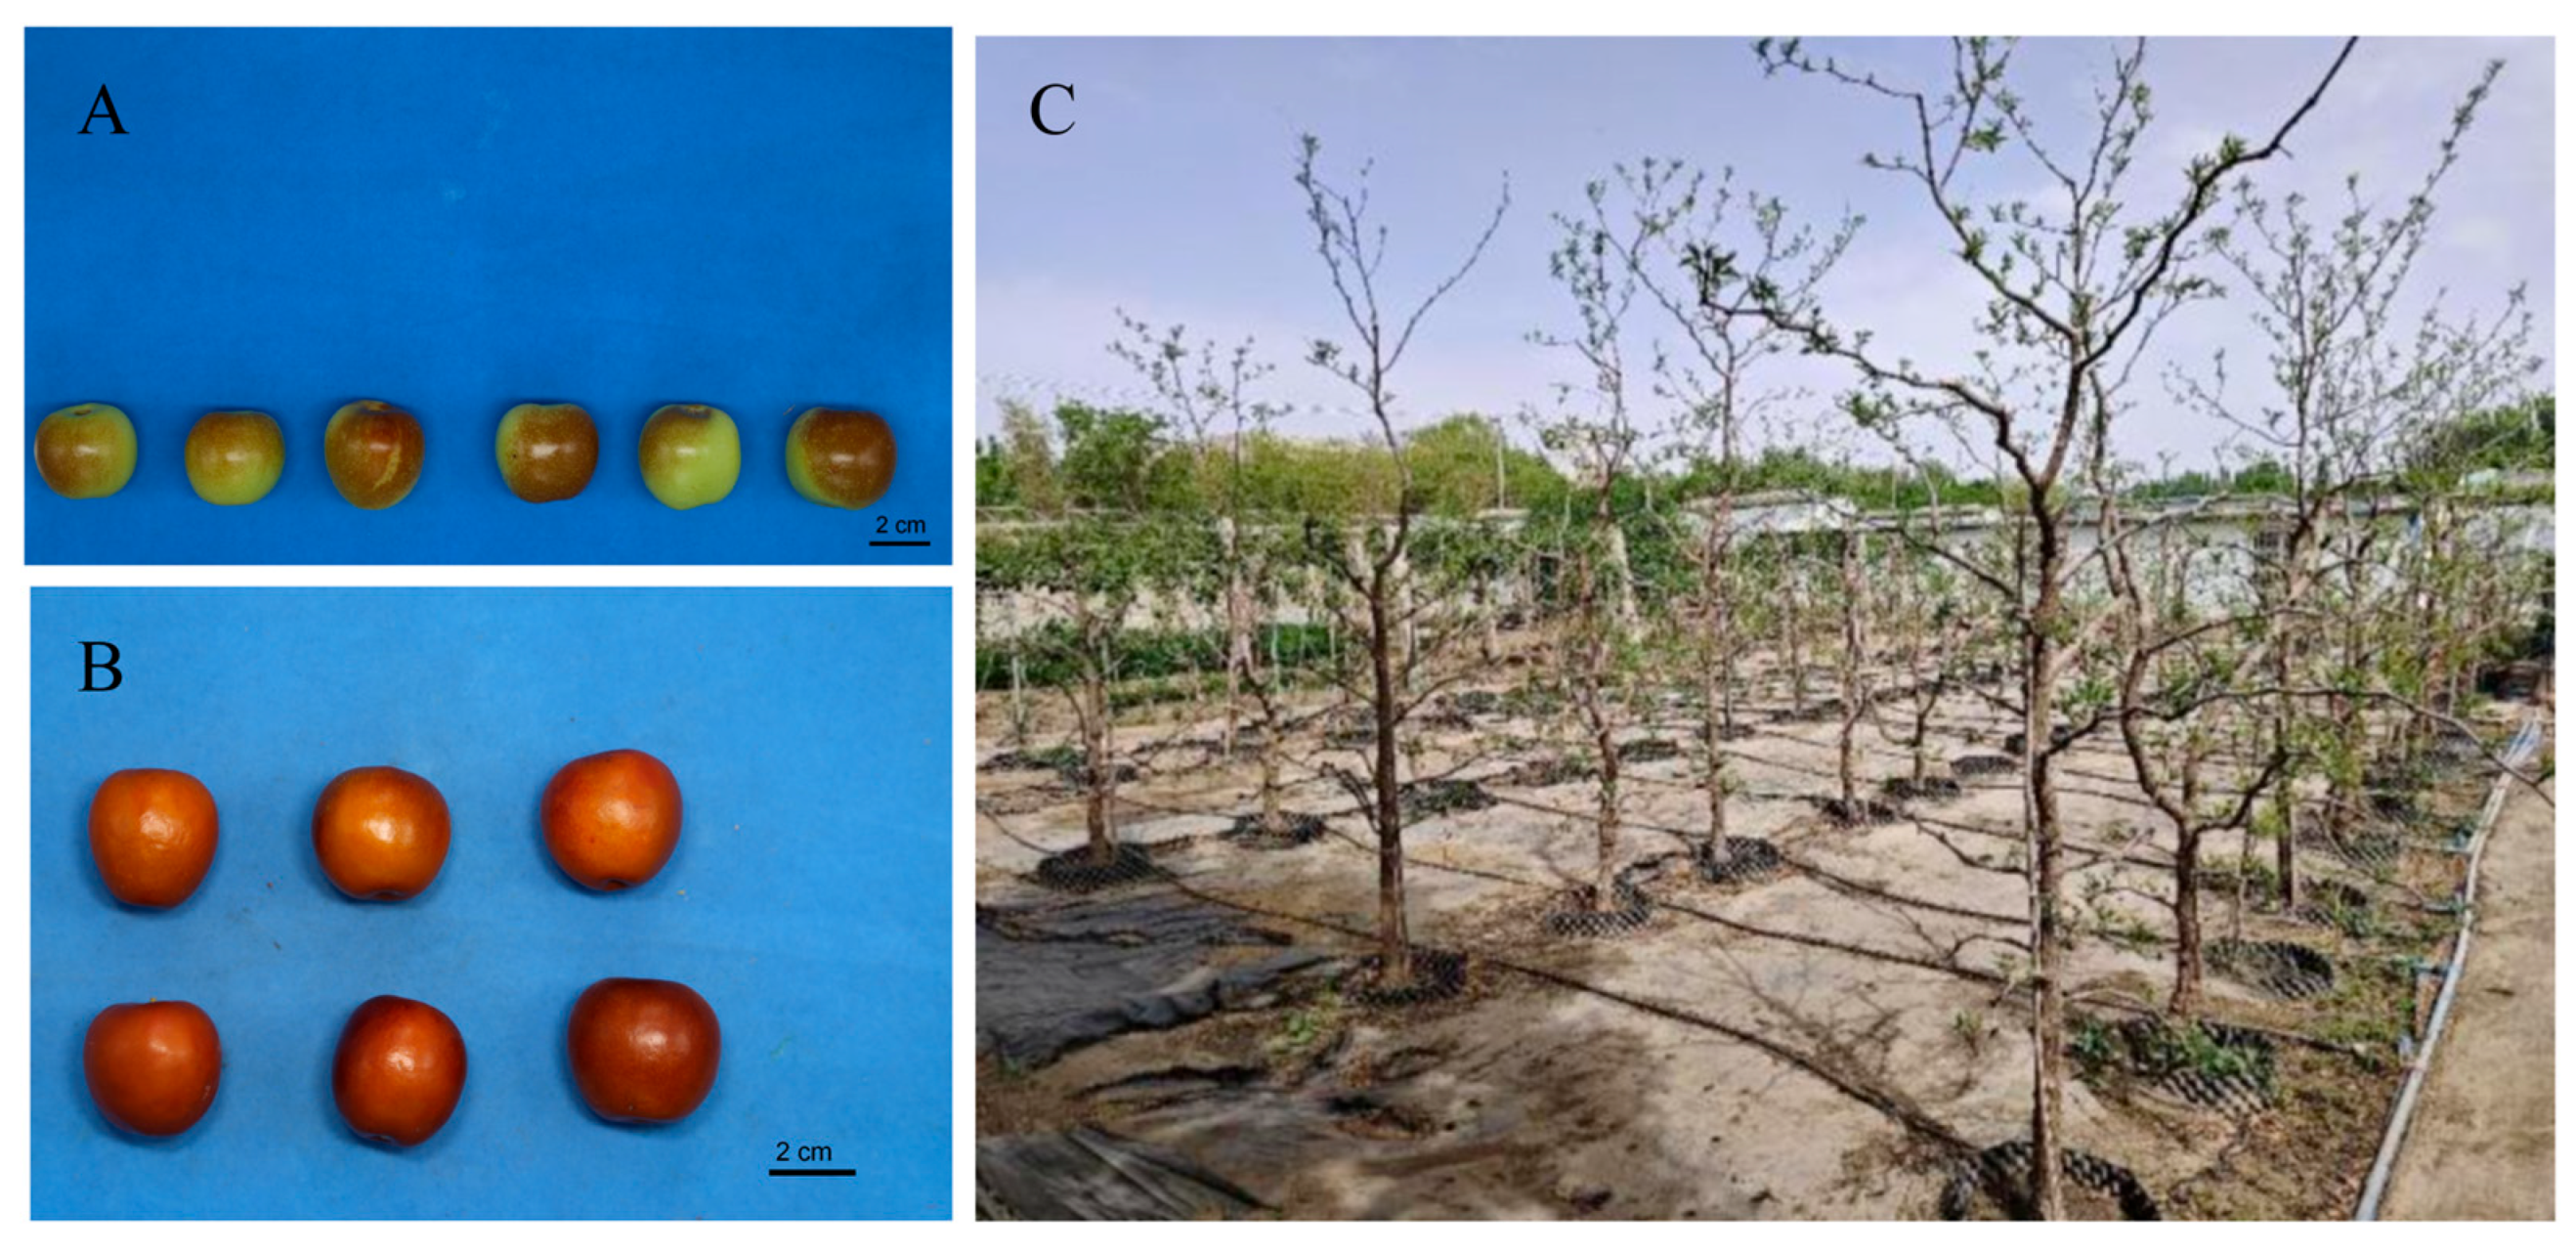
Winter jujube (Ziziphus jujuba Mill. cv. Dongzao) is a Chinese native fruit crop with distinct morphological changes during ripening (Figure 1A,B): unripe fruits are green, small, and firm, while ripe fruits turn bright red with expanded size and crisp flesh. It is popular among consumers due to its unique taste and flavor, holding substantial commercial value in the fruit market [1,2]. However, achieving simultaneous improvement in yield and fruit quality remains a major challenge in current horticultural research [3].
Rational fertilizer application is a key agronomic practice regulating the growth and productivity of winter jujube [4]. Fertilizer supplementation with functional additives has become a research hotspot due to its strong potential to enhance plant growth [5,6]. Studies have shown that such supplementation strategies can regulate physiological processes and alter vegetative growth patterns and leaf vigor, thereby reshaping canopy structure and vitality [7,8]. They also influence the availability of soil mineral nutrients and subsequently affect the absorption, transport, and distribution of mineral elements among plant organs [9,10], which directly impacts the fruit quality and yield formation [11]. Additionally, fertilizer supplementation with functional additives can improve both external and internal fruit quality as well as sensory attributes, collectively enhancing commercial value [12,13]. Microbial fertilizers have been shown to promote plant growth by improving soil microecology and stimulating nutrient activation in both soil and fertilizers [14,15]. Graphene, a representative nanomaterial, possesses high electrical conductivity, large specific surface area, and strong adsorption capacity, showing great potential in agricultural applications [16]. However, its agricultural use requires careful consideration of its physicochemical forms (e.g., graphene oxide, reduced graphene oxide, or nanoplatelets), soil persistence, and potential ecotoxicological impacts, which vary significantly with structure and functionalization. While graphene-based materials can improve stress resistance, increase yield, reduce production costs, and enhance soil ecological conditions [17], a critical understanding of its environmental behavior and regulatory frameworks is essential to ensure its safe and sustainable application in agroecosystems. Notably, while the individual effects of graphene and microbial fertilizers have been studied, their combined supplementation with basal fertilizer, which may leverage complementary effects between nanomaterial properties and microbial activity, remains largely unexplored in perennial fruit crops such as winter jujube.
The rapid development of metabolomics provides strong support for elucidating the mechanisms by which fertilizer supplementation with functional additives regulates fruit quality [18]. This technique enables the systematic analysis of small-molecule metabolites and offers metabolic evidence for plant responses to cultivation practices such as fertilization [19]. In winter jujube research, widely targeted metabolomics can clarify how fertilizer supplementation strategies regulate fruit metabolomes, thereby uncovering metabolic mechanisms underlying quality formation.
Although previous studies have explored the effects of different fertilization treatments on winter jujube growth and fruit quality [20,21], there remains limited research on the combined supplementation of basal fertilizer with both graphene and microbial inoculants, which may represent a new approach for achieving high-quality, high-yield production. Notably, existing studies on graphene in agriculture have reported inconsistent outcomes regarding its effects on nutrient uptake and plant physiology, partly due to variations in graphene forms, application methods, and plant species [16]. Furthermore, the interaction mechanisms between nanomaterials and microbial inoculants in fruit trees remain poorly understood, and previous investigations often lack integrated metabolomic profiling to elucidate underlying metabolic shifts. We hypothesize that this novel combined additive supplementation strategy will enhance mineral nutrient uptake and transport in plants, and induce beneficial reprogramming of the fruit metabolome, thereby improving fruit quality. Therefore, this study employed widely targeted metabolomics to systematically investigate the effects of basal fertilizer supplemented with graphene and microbial inoculants on winter jujube growth, mineral accumulation, and fruit quality. The findings aim to provide theoretical and practical guidance for the development of scientific fertilization systems.

2. Materials and Methods

2.1. Materials

The experiment was conducted on six-year-old winter jujube trees with a central-leader structure grown in restricted-root cultivation at the Horticultural Experiment Station of Tarim University, located in Alar City, Aksu Prefecture (81°17′56″ E, 40°32′27″ N). This region belongs to a warm temperate extreme continental arid desert climate, with key climate parameters as follows: extreme high temperature of 42.10 °C, extreme low temperature of −24.0 °C, annual total solar radiation ranging from 133.7 to 146.3 kcal/cm2, annual sunshine duration of 2556.3–2991.8 h, annual precipitation of 40.1–82.5 mm, and annual evaporation of 1876.6–2558.9 mm. During the experimental period, the key growth stages of winter jujube closely related to fertilization and sample collection were clearly defined as: young fruit stage (28 July), fruit expansion stage (23 August), and white ripening stage (16 September), which are consistent with the local seasonal climate characteristics and winter jujube growth rhythm. The row spacing was 1.5 m × 3 m (Figure 1C). The root-restricting containers were made of PVC polyethylene, with both a height and diameter of 50 cm. The soil substrate consisted of Changbai Mountain soil and peat (1:1). Total N, P, and K were 11.6 g/kg, 5.32 g/kg, and 5.67 g/kg, respectively, available N, P, and K were 233.47 mg/kg, 177.21 mg/kg, and 31.23 mg/kg, respectively; pH was 7.10; total soluble salt content was 4.7 g/kg.

2.2. Experimental Design

A single-factor completely randomized design was used, with each treatment assigned to an independent experimental plot (consistent with the “one treatment per plot” layout) and three uniform single plants planted intensively within each plot as replicate plants of the plot. To mitigate potential environmental gradients in container cultivation and ensure experimental rigor, all plots were randomly arranged in the field via a random number table, and the fixed root-restricting containers were placed according to the standard planting density of 1.5 m × 3 m to ensure consistent environmental exposure among plots. Treatments consisted of basal fertilizer alone or in combination with microbial fertilizer and graphene fertilizer. Four treatments were established: each treatment had three independent repetitions, with each repetition consisting of three uniform single plants. All plants were uniform and pest-free. Drip irrigation was applied every 3 days with 10 L water per plant, and all other field management practices were identical. The mode of fertilizer application was as follows: the specified dosage of basal fertilizer and corresponding additives for each plant per application were fully dissolved in 1 L of water, then applied to the root zone via irrigation to ensure uniform nutrient distribution. Fertilization details are shown in Table 1.
Basal fertilizer consisted of urea (N ≥ 46.4%), monoammonium phosphate (P2O5 ≥ 61%), and potassium sulfate (K2O ≥ 51%). Microbial fertilizer contained ≥ 1.0 × 10⁹ CFU/mL of Bacillus subtilis, Bacillus amyloliquefaciens, Bacillus licheniformis, and B. pumilus (BIOWISH Co., Ltd., Hangzhou, China). Fertilizer dosages were based on previous studies on winter jujube fertilization [22,23] with optimization. Specifically, the graphene used in this study was multilayer graphene (approximately 5 layers) with a purity of ≥99.0%, characterized by an average sheet diameter of 40 nm, a sheet thickness of about 3 nm, and surface functional groups including carboxyl (-COOH) and hydroxyl (-OH) groups—these functional groups enable it to stably disperse in water to form graphene sol. The graphene dosage (0.38 g per plant per application) refers to the effective concentration range for woody fruit crops reported in relevant reviews [16,24]. Quality control for graphene was performed before application: particle size distribution was verified via a laser particle size analyzer, and surface functional groups were confirmed by Fourier transform infrared spectroscopy (FTIR); dispersibility was tested by observing the stability of the graphene sol in water for 24 h to ensure consistency with the specified parameters. The microbial inoculant dosage (0.26 g per plant per application) is consistent with the recommended rate for similar Bacillus-based biofertilizers in fruit tree cultivation [25,26]. Fertilization was applied at young-fruit, fruit-expansion, and half-red stages.

2.3. Sample Collection and Measurements

2.3.1. Growth Measurements

In early October (when shoot growth had completely ceased), growth parameters of the winter jujube trees were measured. The lengths of the secondary shoots and fruiting shoots were determined using a steel tape with an accuracy of 1 mm, with each plot replicate (statistically independent unit) measured three times, and three plot replicates per treatment, resulting in a total of nine measurements for each shoot length parameter (cm). Thirty healthy, pest-free leaves were randomly selected from the east, south, west, and north directions of each tree, and leaf area was measured using a leaf image analyzer (LA-S series, Hangzhou Wanshen Detection Technology Co., Ltd., Hangzhou, China) (mm2). Chlorophyll content in leaves was determined via the ethanol extraction method [27], with ten measurements taken per plot replicate and three plot replicates per treatment, resulting in a total of 30 measurements for chlorophyll content (mg/g). After all determinations, the remaining leaf samples were promptly stored at −80 °C for subsequent experiments.

2.3.2. Mineral Element Analysis

At the full red ripening stage of winter jujube fruits, 30 uniformly developed fruits free of mechanical damage, pests, and diseases were randomly sampled from the eastern, southern, western, and northern aspects of the outer canopy. Fruits were randomly divided into three biological replicates (10 fruits per replicate). Immediately after harvest, samples were placed in clearly labeled polyethylene bags and transported to the laboratory promptly for subsequent quality and nutrient analyses.
Sample pretreatment was performed on secondary shoots, jujube bearing shoots, leaves, and fruits following a standardized protocol. Briefly, samples were rinsed three times with deionized water to remove surface-adhered dust and contaminants, then blotted dry with absorbent filter paper to eliminate residual moisture. Processed samples were transferred to a blast drying oven (Model: DHG-9070A, Shanghai Yiheng Scientific Instruments Co., Ltd., Shanghai, China) for sequential treatments: initial preliminary low-temperature drying at 65 °C for 2 h to inactivate endogenous enzymes, followed by drying at 80 °C to a constant weight (defined as a mass variation ≤ 0.001 g between consecutive weighings at 24 h intervals). Dried samples were ground into a fine powder using a plant sample grinder (Model: FW100, Tianjin Taisite Instruments Co., Ltd., Tianjin, China) and sieved through a 60-mesh standard test sieve (aperture: 0.25 mm). The sieved fractions were collected in polyethylene vials, labeled, and stored in a desiccator under dark conditions for elemental analysis.
N and C contents were determined using an elemental analyzer (Model: Vario EL III, Elementar GmbH, Hanau, Germany) [28]. Approximately 0.02 g of each sample (precision: 0.0001 g) was accurately weighed into tin capsules, hermetically sealed, and loaded into the automatic sampler tray. For the determination of P, K, Ca, Mg, Fe, Mn, and Zn, 0.1 g of sieved sample (precision: 0.0001 g) was weighed into a polytetrafluoroethylene (PTFE) digestion tube, and 5 mL of concentrated nitric acid (HNO3, 68%, guaranteed reagent) and 1 mL of hydrogen peroxide (H2O2, 30%, guaranteed reagent) were added. The mixture was allowed to stand at room temperature for 30 min for pre-digestion, then processed using a microwave digestion system (Model: Mars 6, CEM Corporation, Matthews, NC, USA) with the following program: ramp to 120 °C at 5 °C/min and hold for 5 min, ramp to 180 °C at 3 °C/min and hold for 15 min, then natural cooling to room temperature. After digestion, the solution was transferred to a 50 mL volumetric flask and diluted to volume with deionized water, then filtered through a 0.45 μm organic phase filter membrane for ICP-OES analysis. Concentrations were quantified via inductively coupled plasma optical emission spectrometry (ICP-OES) [29] using an ICP-OES 730 spectrometer (Agilent Technologies, Inc., Santa Clara, CA, USA). All samples were analyzed in triplicate to ensure data reliability.
Instrument Calibration and Determination: Standard stock solutions (1000 mg/L) for each element were prepared separately and serially diluted to create a series of working standards at concentrations of 0.1, 1, 5, 10, and 50 mg/L. Calibration curves were established using ICP-OES, with all curves exhibiting a correlation coefficient (R2) of ≥0.999. Each sample was measured in triplicate alongside a blank control. The blank was processed following the identical procedure using the digestion reagents instead of the sample. The final results were calculated as the mean of the triplicate measurements after subtracting the blank value.

2.3.3. External Fruit Quality

The single fruit weight was measured using a one-hundredth electronic balance (Model: FA2004, Shanghai Precision Scientific Instruments Co., Ltd., Shanghai, China) with a precision of 0.01 g. The longitudinal and transverse diameters of the fruits were determined using a vernier caliper with an accuracy of 0.02 mm, and the fruit shape index was calculated as the ratio of the longitudinal diameter to the transverse diameter. Fruit firmness was measured with a GY-1 fruit firmness tester (Zhejiang Top Cloud-Agri Technology Co., Ltd., Hangzhou, China) equipped with an 8 mm diameter flat probe. Measurements were performed on the equatorial region of each fruit without removing the peel; the probe was slowly inserted vertically to a fixed penetration depth of 5 mm, and three measurements were taken at evenly spaced positions per fruit to avoid data bias. The unit of firmness was expressed as N, and the final value for each fruit was the average of the three measurements.

2.3.4. Internal Fruit Quality

The soluble solid content (SSC) was determined using a PAL-1 digital refractometer (Atago Co., Ltd., Tokyo, Japan) with the unit expressed as %. Total sugar content was quantified via the anthrone-sulfuric acid method (mg/g). Total acid content was measured by acid–base titration (mg/g). Vitamin C content was assayed using the molybdenum blue colorimetric method (mg/100 g). Total flavonoid content was determined by ultraviolet (UV) spectrophotometry (mg/g). Total phenolic content was quantified via UV spectrophotometry [30] (mg/g). All of the above colorimetric and spectrophotometric methods strictly followed the operational procedures described in the cited literature [30].

2.3.5. Metabolomics Analysis

Jujube fruit samples from each treatment group (three biological replicates per treatment) were subjected to widely targeted metabolomics analysis by Wuhan MetWare Biotechnology Co., Ltd., Wuhan, China. Sample preparation of jujube fruits was performed following the method described by Feng et al. [31]. Data acquisition was carried out using an ultra-high-performance liquid chromatography (UHPLC) system (ExionLC™ AD, Sciex, Framingham, MA, USA) coupled with a tandem mass spectrometry (MS/MS) system (QTRAP® 6500+, Sciex, Framingham, MA, USA). The UHPLC conditions were referenced to the protocol established by Wang et al. [32].

2.3.6. Clustering Analysis

Metabolite content data were processed using unit variance scaling (UV scaling). Hierarchical cluster analysis (HCA) was performed to characterize the accumulation patterns of metabolites across different samples, and heatmaps were generated using the ComplexHeatmap package in R software (Version 4.3.1).

2.3.7. PCA

Unsupervised PCA (principal component analysis) was performed by statistics function prcomp within R (www.r-project.org, accessed on 21 November 2023). The data was unit variance scaled before unsupervised PCA.

2.3.8. Differential Metabolites Selected

For two-group analysis, differential metabolites were determined by VIP (VIP > 1) and absolute Log2FC (|Log2FC| > 2.0). VIP values were extracted from the OPLS-DA result, which also contain score plots and per-mutation plots, was generated using R package MetaboAnalystR (Version 4.3.1). The data were log transformed (log2) and mean centered before OPLS-DA. In order to avoid overfitting, a permutation test (200 permutations) was performed.

2.3.9. K-Means

To investigate the variation trends of metabolite relative contents across different groups, the relative contents of all differential metabolites identified based on the screening criteria in all comparison groups were subjected to unit variance scaling (UV scaling). Subsequently, K-means clustering analysis was performed.

2.3.10. Data Processing

Statistical analyses were performed using IBM SPSS Statistics 26.0, and significant differences were determined using Duncan’s multiple range test at the p < 0.05 level. Figures and charts were generated using Microsoft Excel 2019 and GraphPad Prism 8.4.3.

3. Results and Analysis

3.1. Effects of Different Treatments on the Growth of Jujube Trees

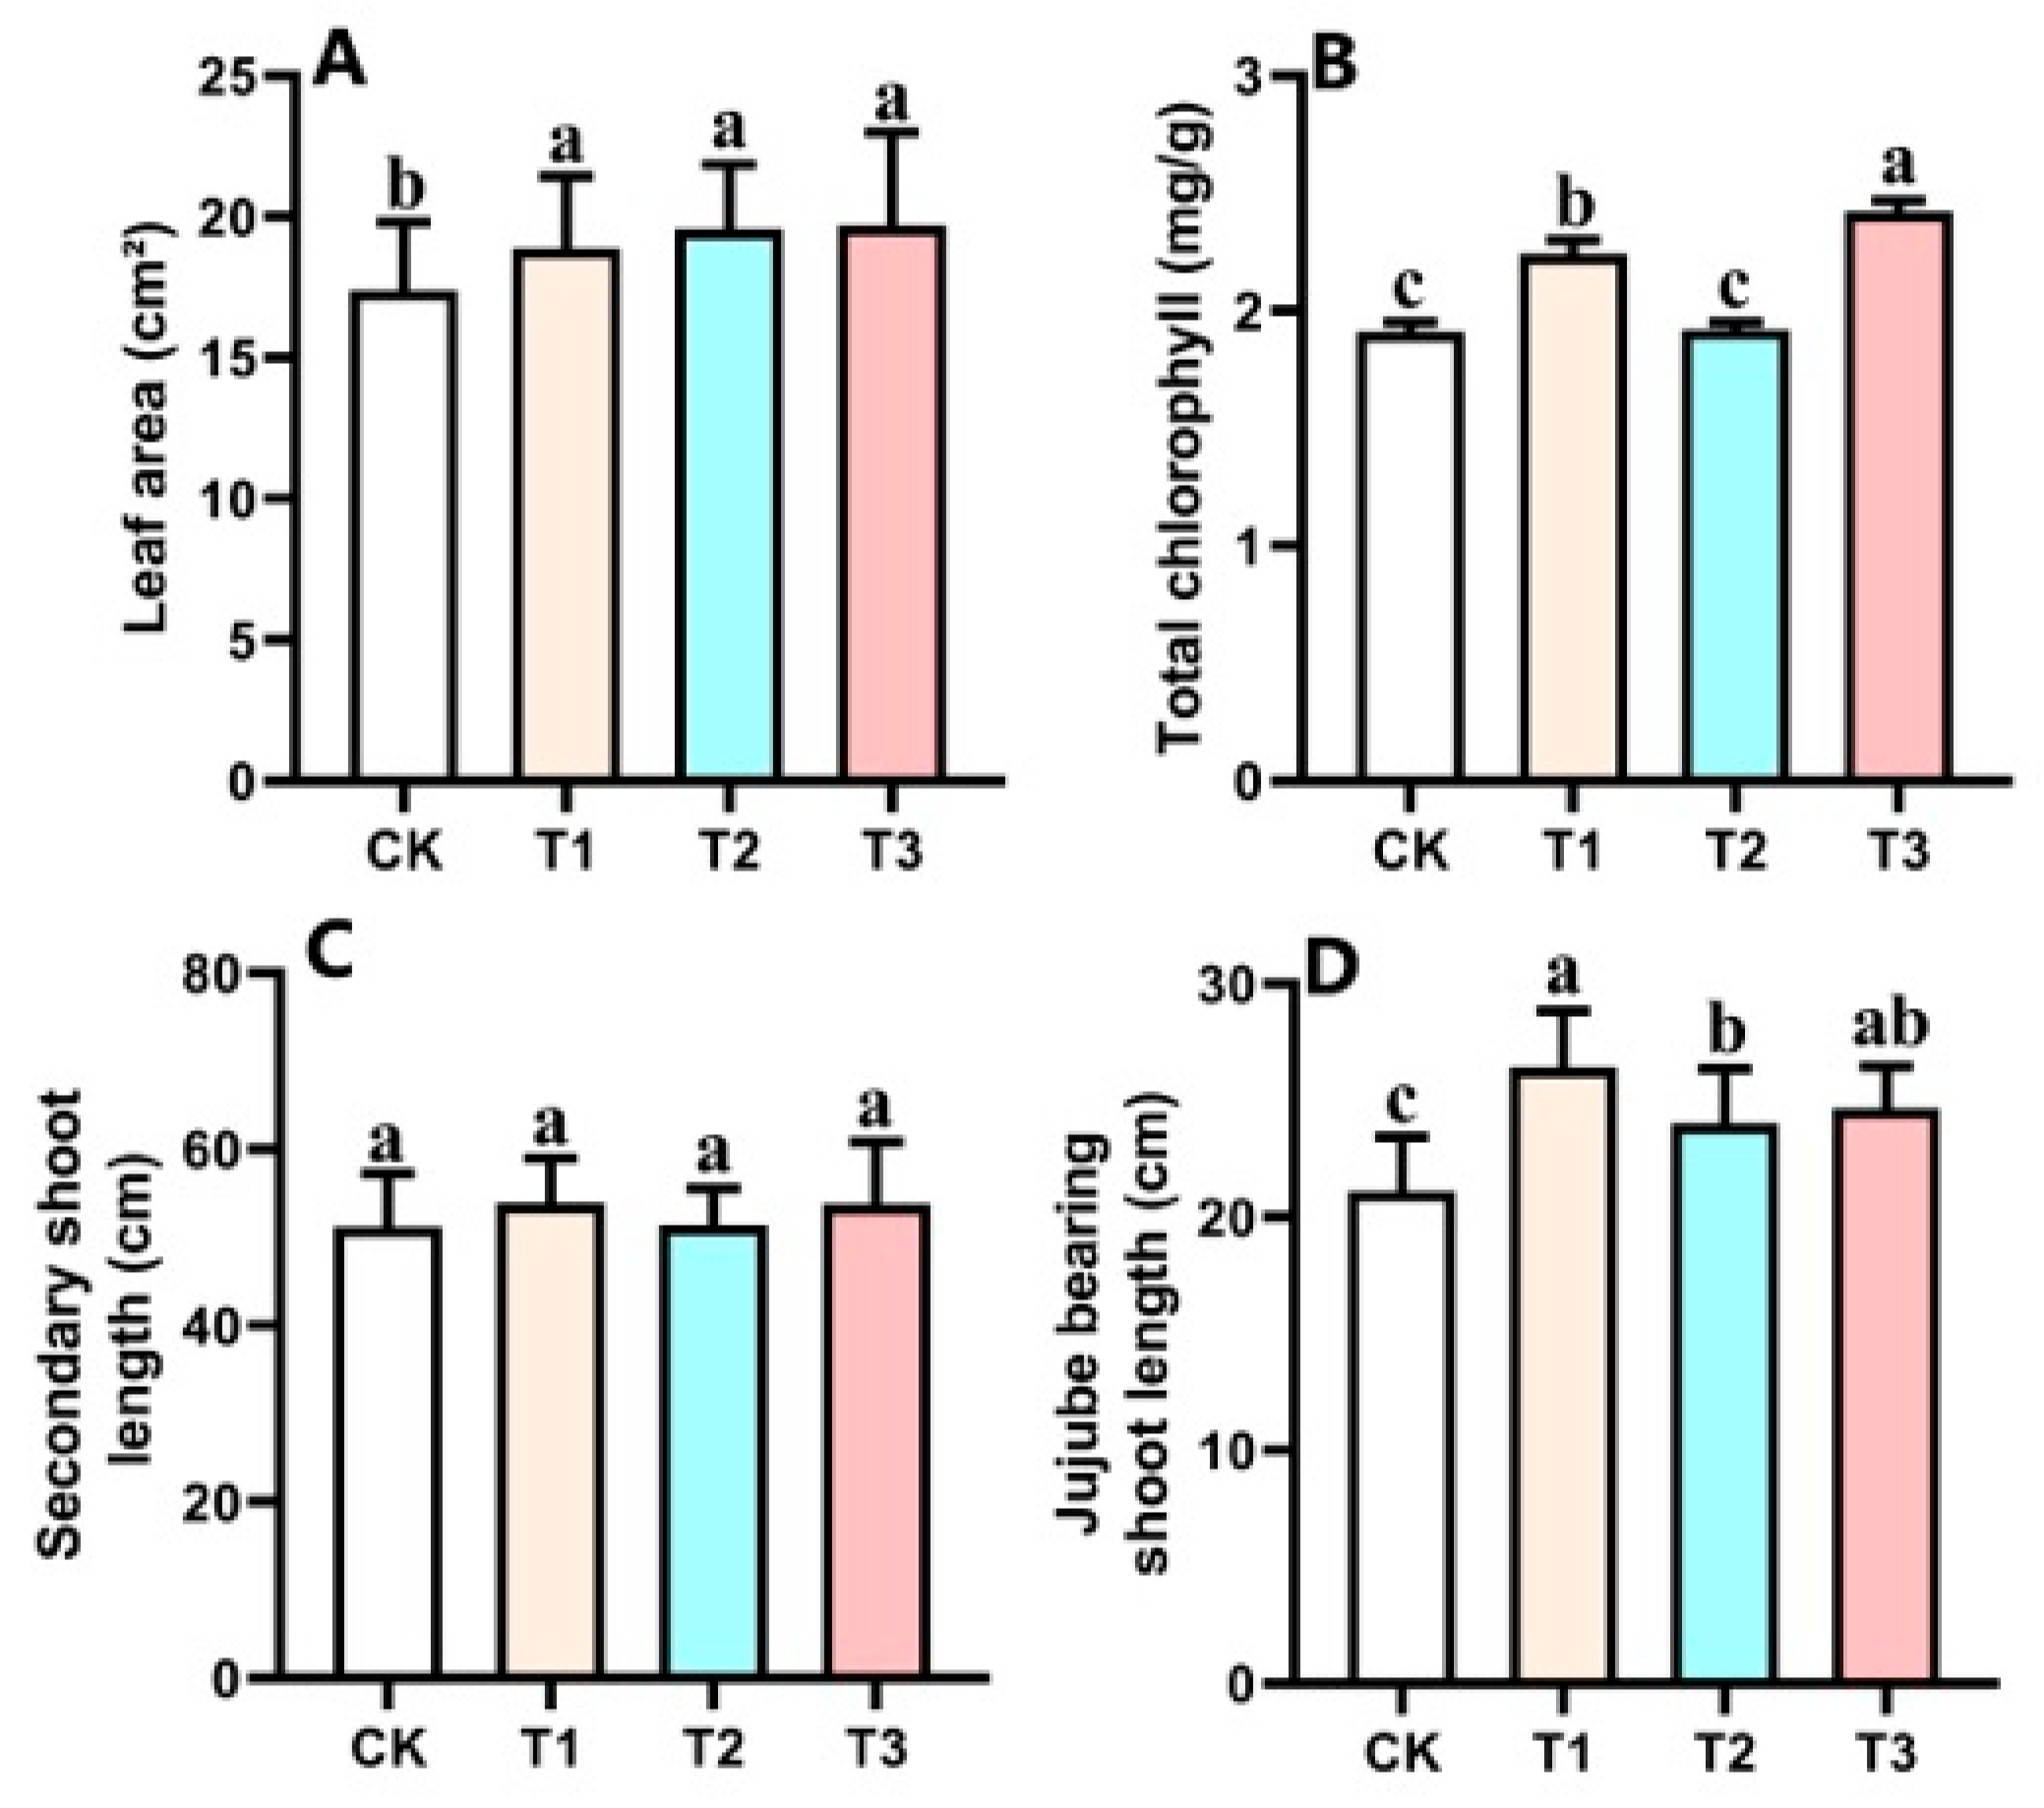
Significant differences in leaf area were observed among treatments. Leaf area under T1, T2, and T3 treatments was significantly higher than CK, while no significant differences were detected among T1, T2, and T3 (Figure 2A). The total chlorophyll content was lowest under CK (1.91 mg/g), whereas T1 and T3 were significantly higher than CK, with T3 showing the highest value, increased by 26% compared with CK (Figure 2B). The secondary shoot length under all treatments was higher than CK but not significantly different, while the jujube bearing shoot length under all treatments was significantly higher than CK, with T1 being 25.25% higher than CK (Figure 2C,D).

3.2. Effects of Different Treatments on Mineral Elements in Jujube Leaves

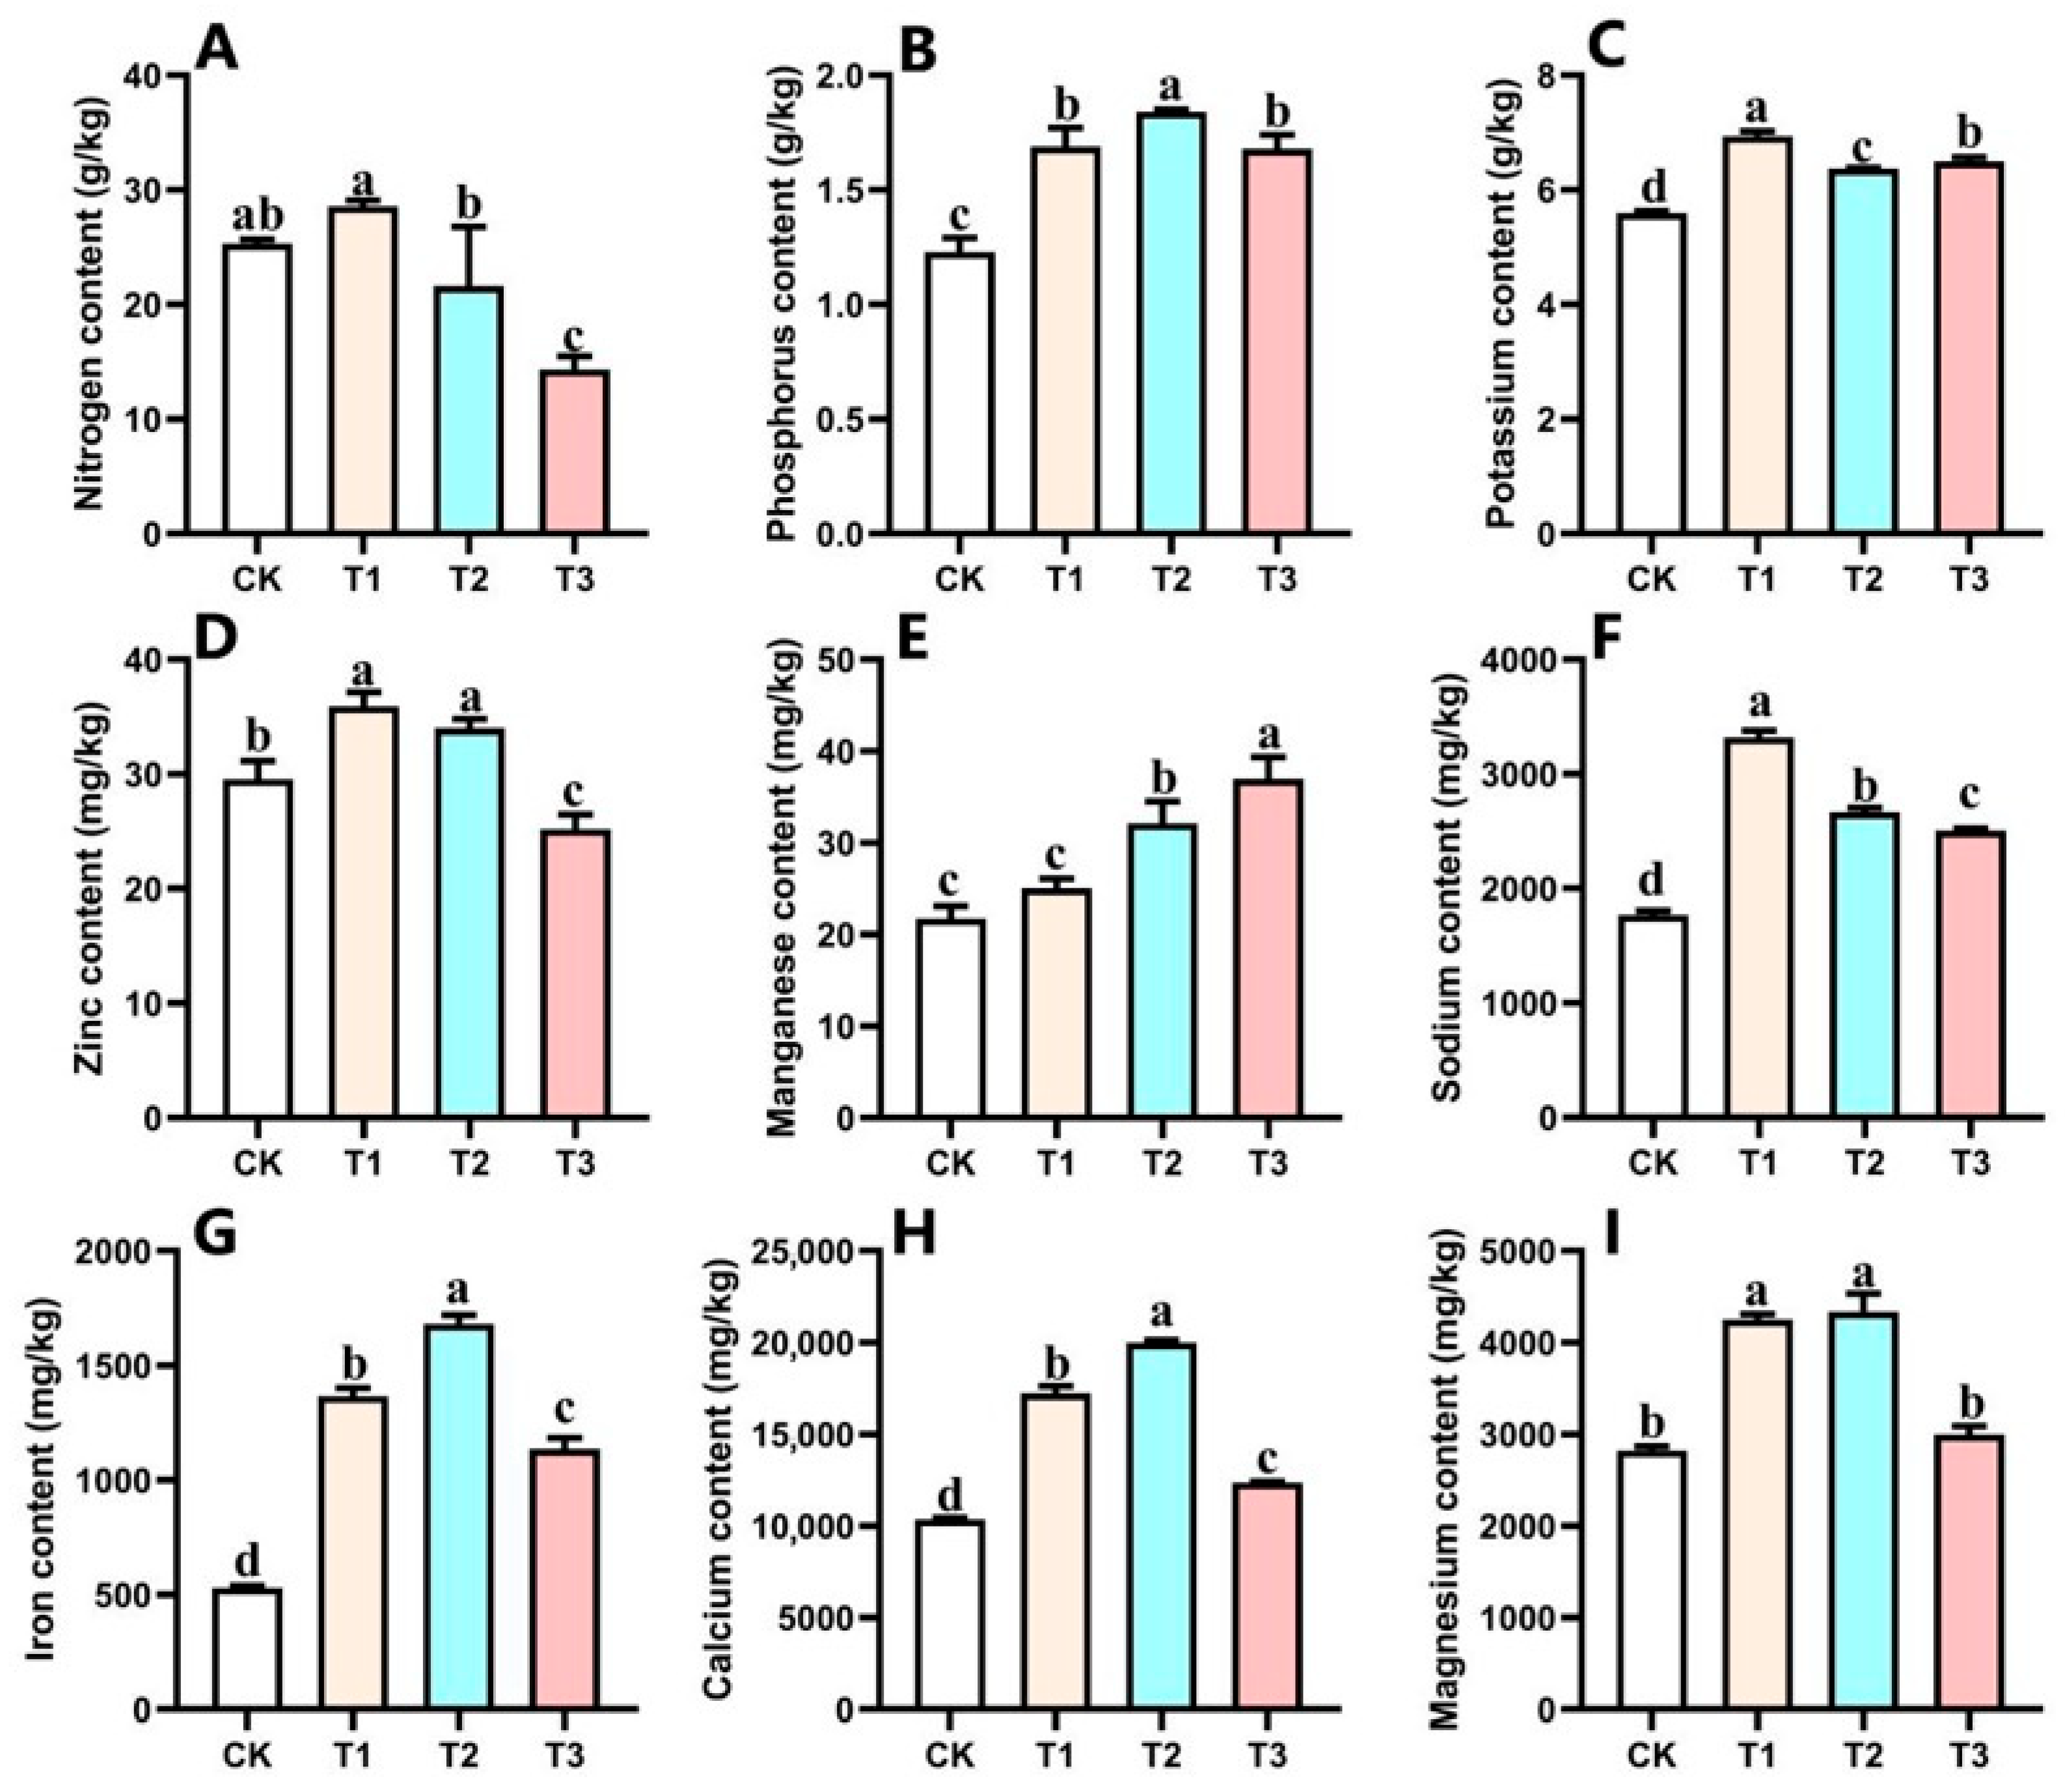
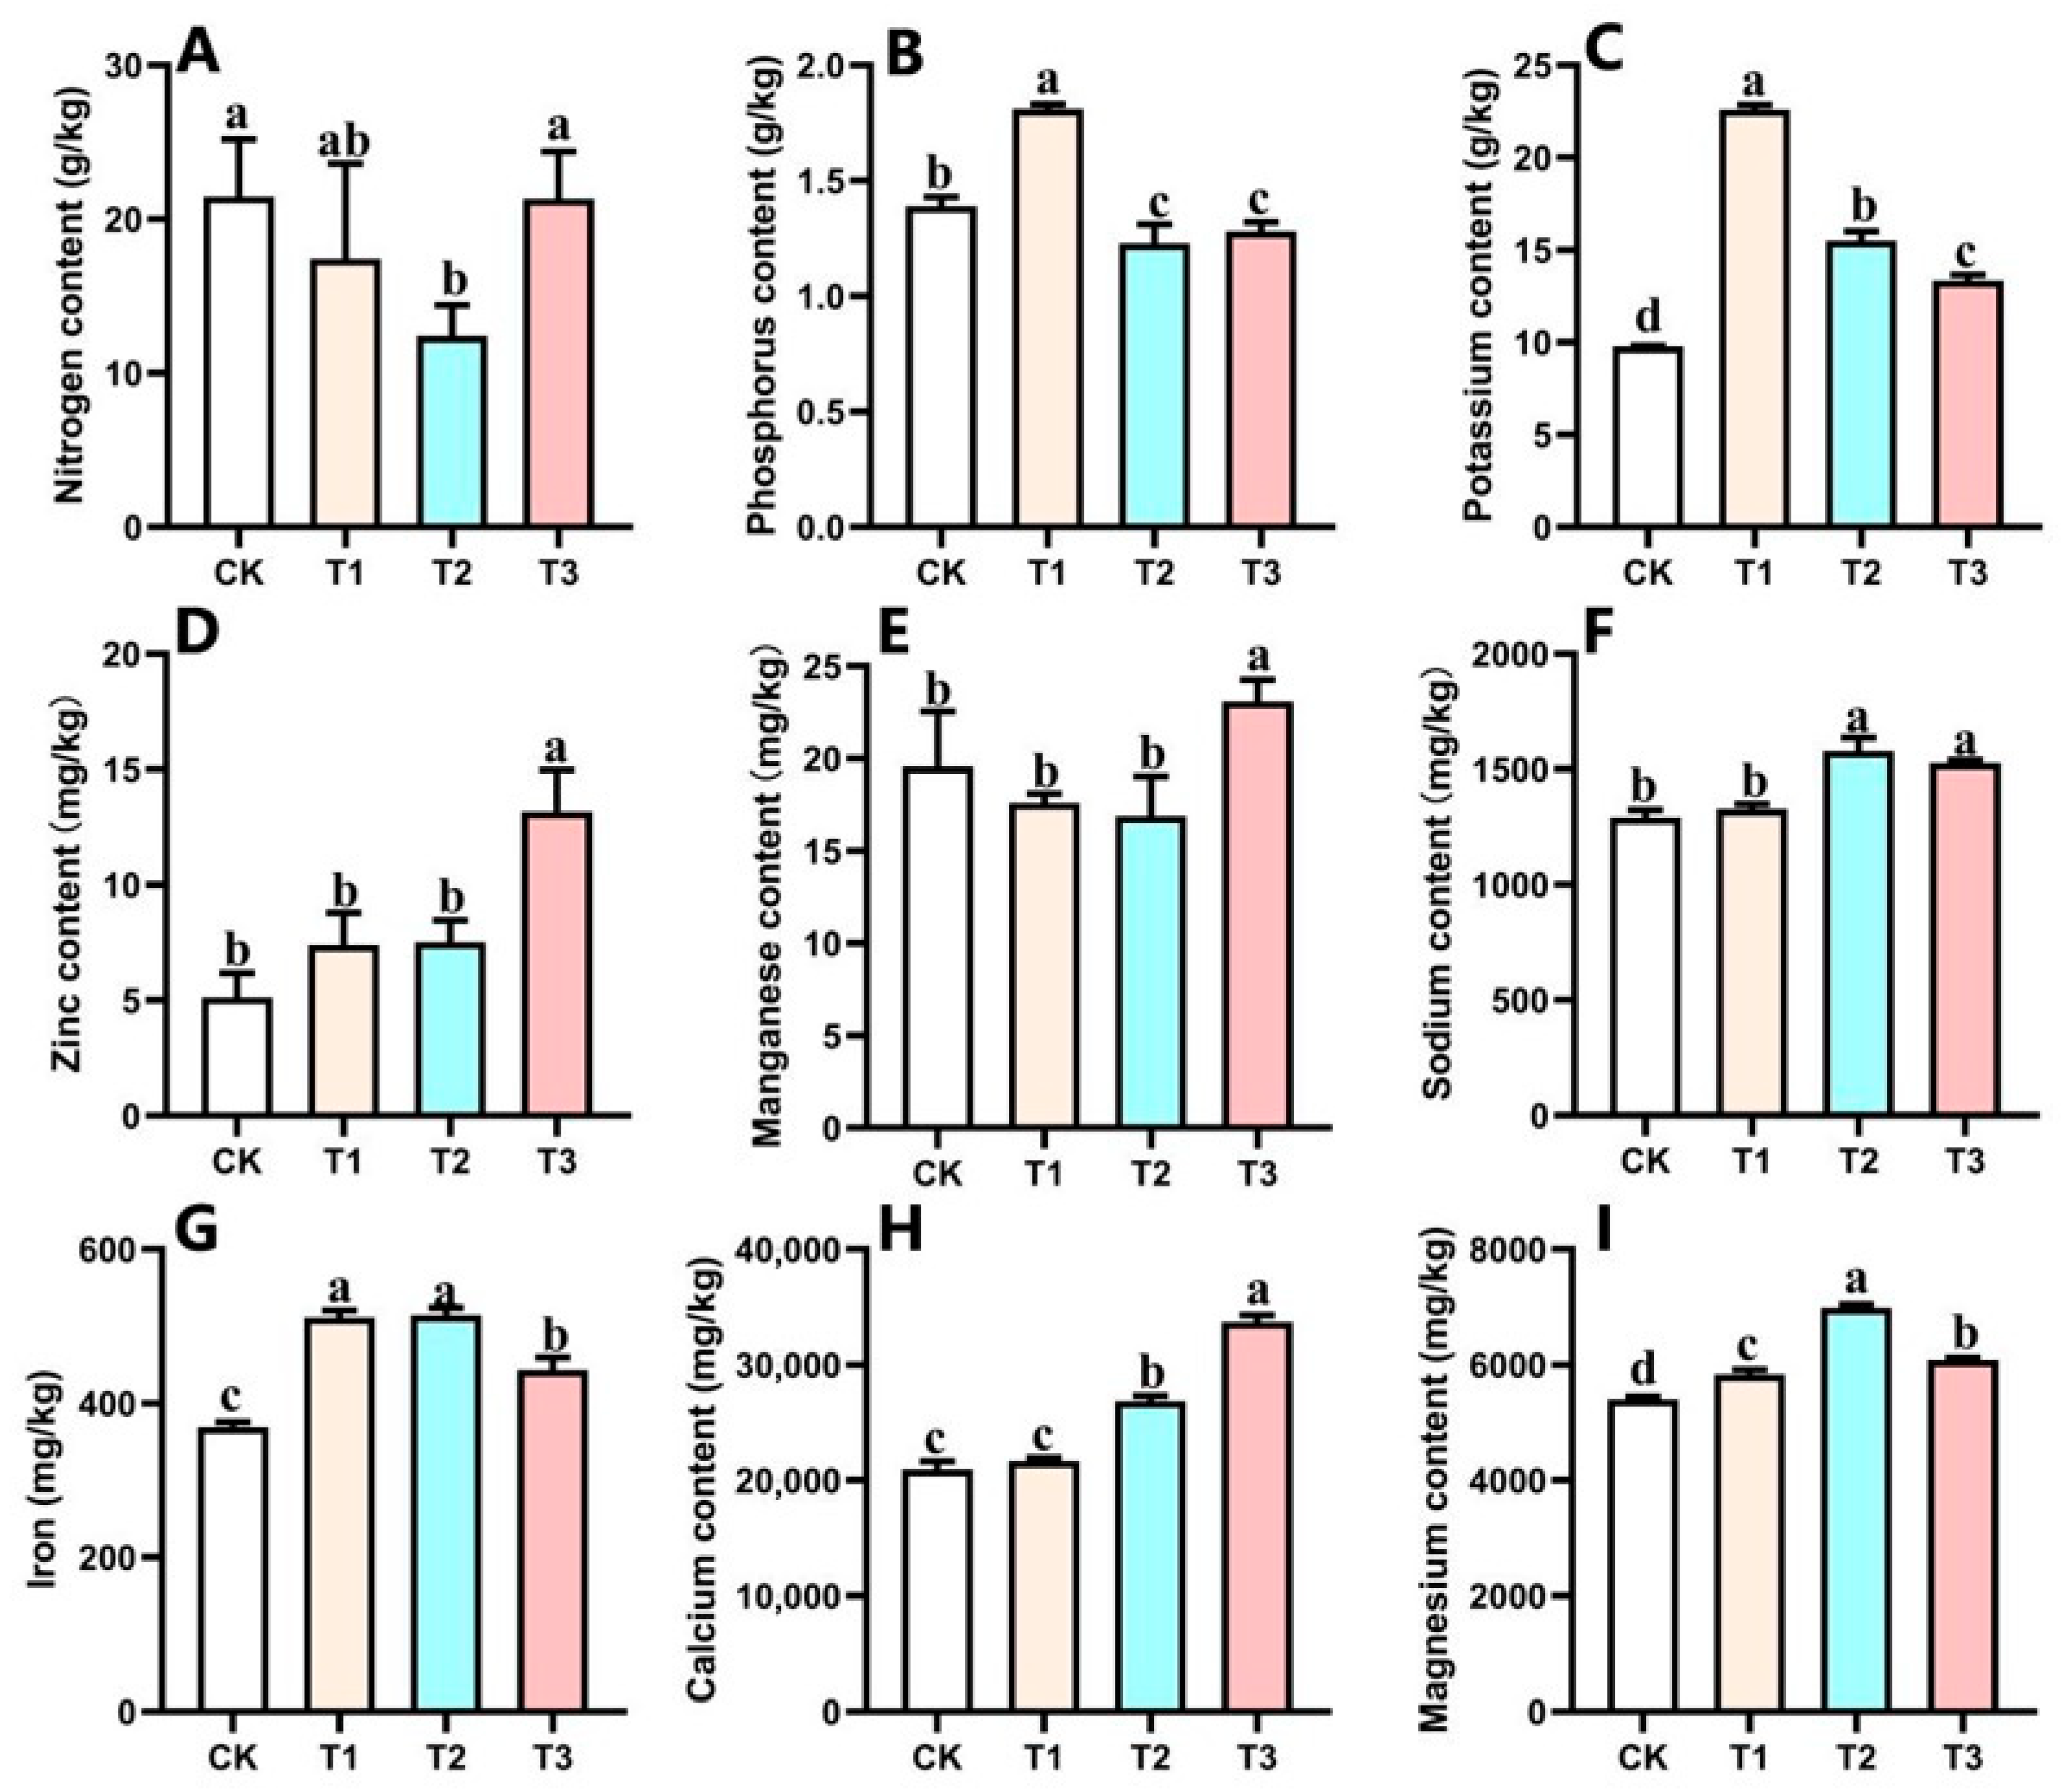
As shown in Figure 3, the P, K, Na, Fe, and Ca contents were significantly higher than CK under all treatments, with T2 exhibiting the highest P, Fe, and Ca contents at 1.84 g/kg, 1682.95 mg/kg, and 19,992.32 mg/kg, respectively. N contents in T1 and T2 were not significantly different from CK, whereas T3 showed significantly lower N content (Figure 3A). Zn content in T1 and T2 was significantly higher than CK, while T3 was significantly lower (Figure 3D). Mn and Mg contents were higher in all treatments compared with CK, with Mn in T2 and T3 significantly higher than CK (Figure 3E), and Mg in T1 and T2 significantly higher than CK (Figure 3I).

3.3. Effects on Mineral Elements in Secondary Shoots

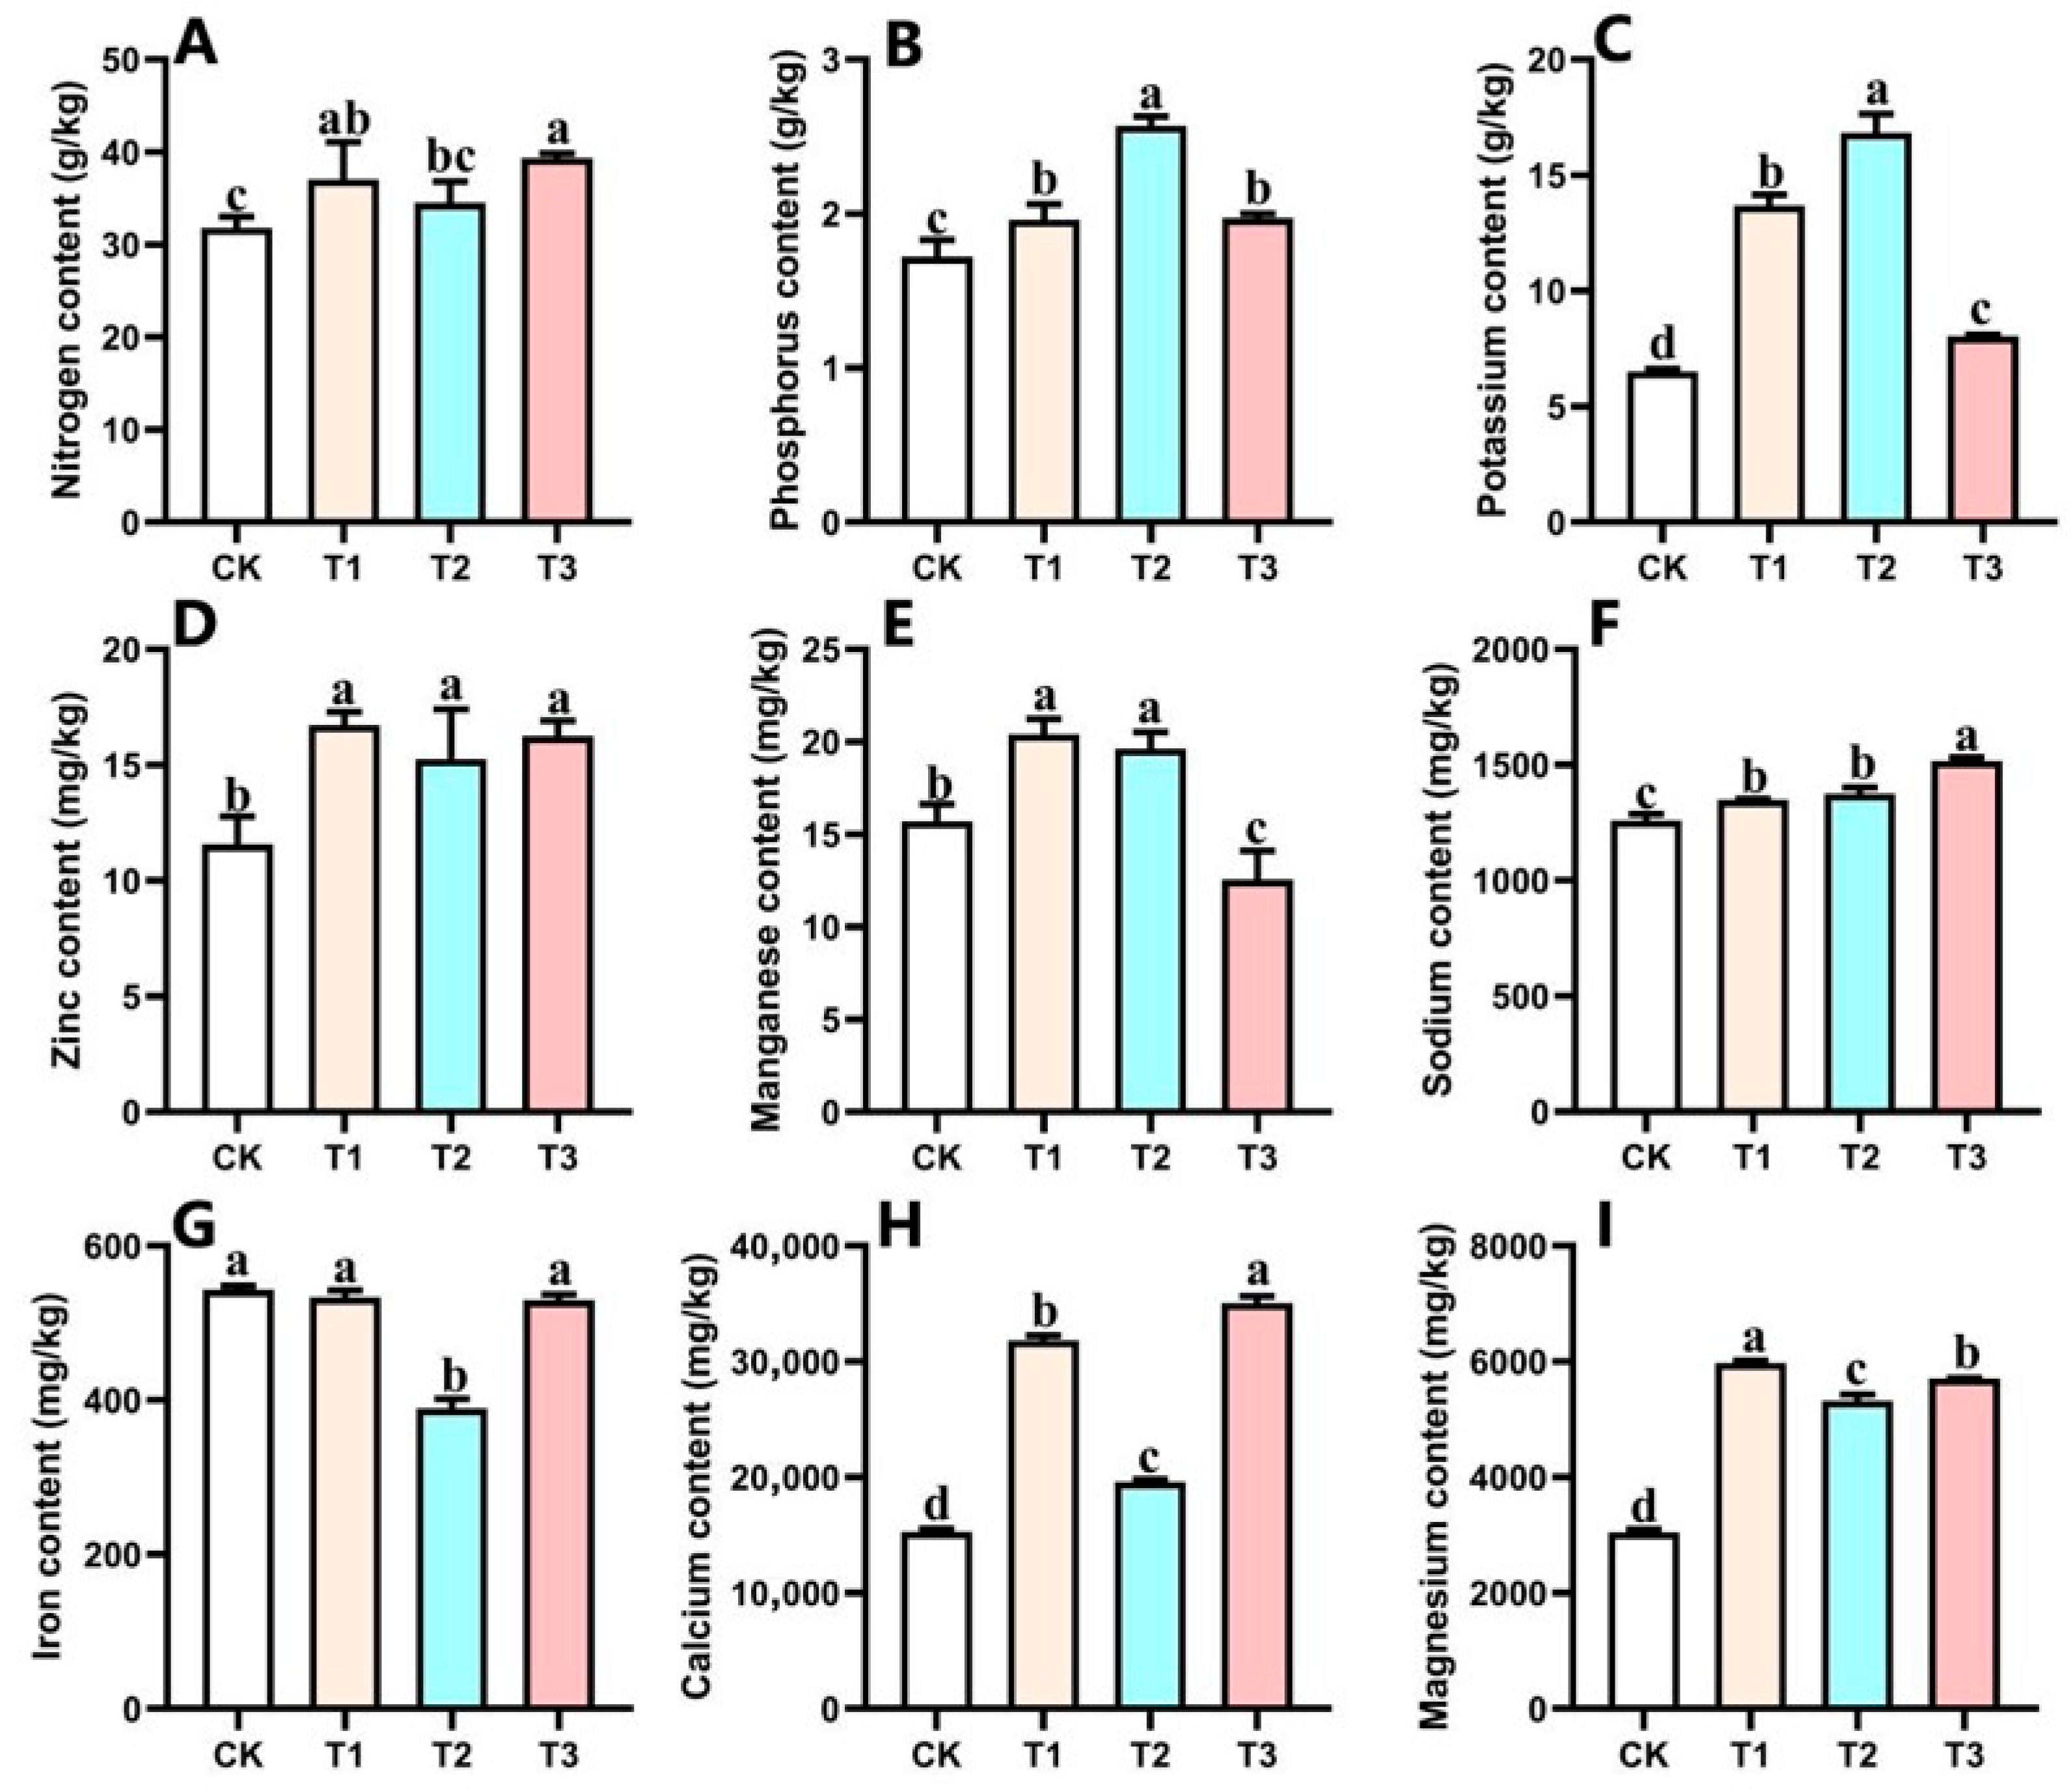
As shown in Figure 4, the P, K, Zn, Na, Ca, and Mg contents were significantly higher than CK under all treatments, with T2 showing the highest P and K levels. N content in all treatments was higher than CK, with T1 and T3 significantly higher by 16.5% and 23.7%. Mn content was significantly higher in T1 and T2, while T3 showed significantly lower Mn than CK (Figure 4E). Fe content in all treatments was lower than CK, with T2 being significantly lower than CK by 28.33% (Figure 4G).

3.4. Effects on Mineral Elements in Jujube Bearing Shoots

As shown in Figure 5, the K, Zn, Na, Fe, Ca, and Mg contents were higher than CK under all treatments, with K, Fe, and Mg showing significant increases. N content under all treatments was lower than CK, with T2 showing the lowest value, 42.22% lower than CK (Figure 5A). P content in T1 was significantly higher than CK by 30.22%, while T2 and T3 were significantly lower, being 0.89 and 0.92 times that of CK (Figure 5G). Mn content in T3 was significantly higher than CK, T1, and T2 (Figure 5E).

3.5. Effects on Mineral Elements in Fruits

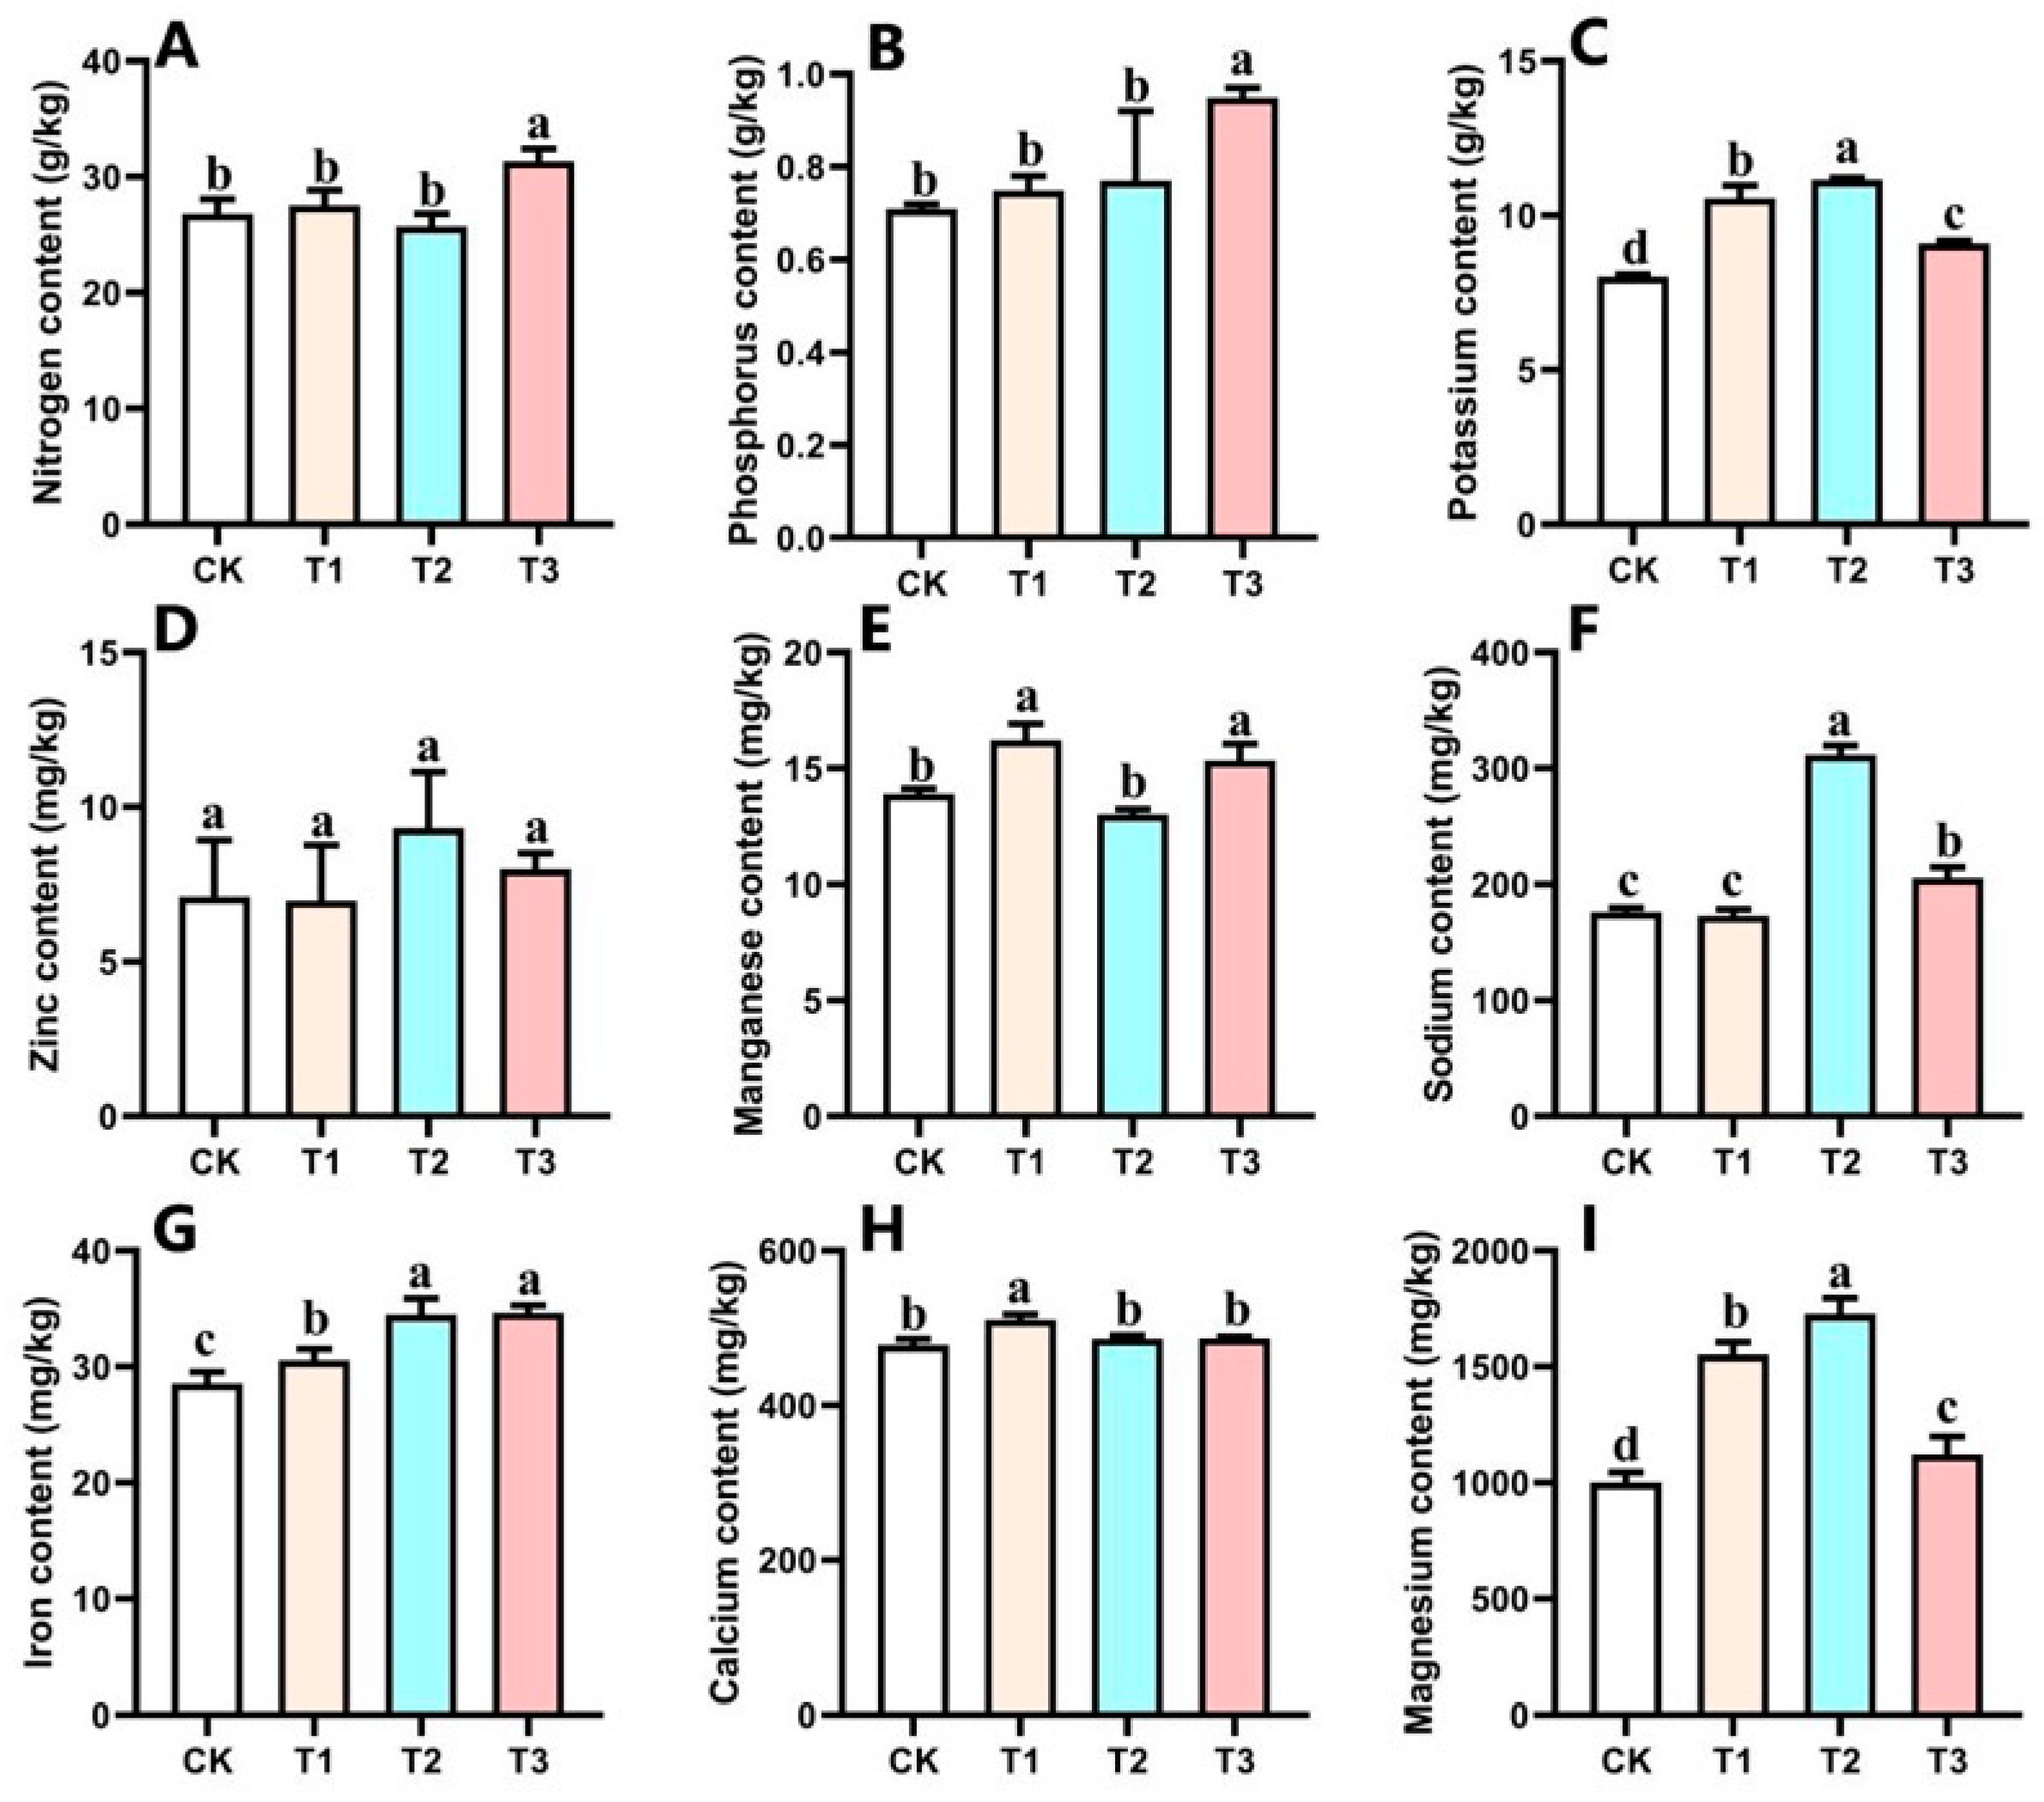
As shown in Figure 6, the K, Fe, and Mg contents were significantly higher than CK under all treatments. T2 showed the highest K and Mg contents, 39.03% and 72.78% higher than CK, respectively, while T3 had the highest Fe content, 21.33% higher than CK. N content in T3 was significantly higher than CK, T1, and T2 (Figure 6A). P and Ca contents were higher than CK across treatments, with T3 showing significantly higher P and T1 significantly higher Ca (Figure 6B,H). Zn content did not differ significantly among treatments and CK (Figure 6D). Mn in T1 and T3 was significantly higher than CK (Figure 6E), while Na in T2 and T3 was significantly higher than CK (Figure 6F).

3.6. Effects on Fruit Quality

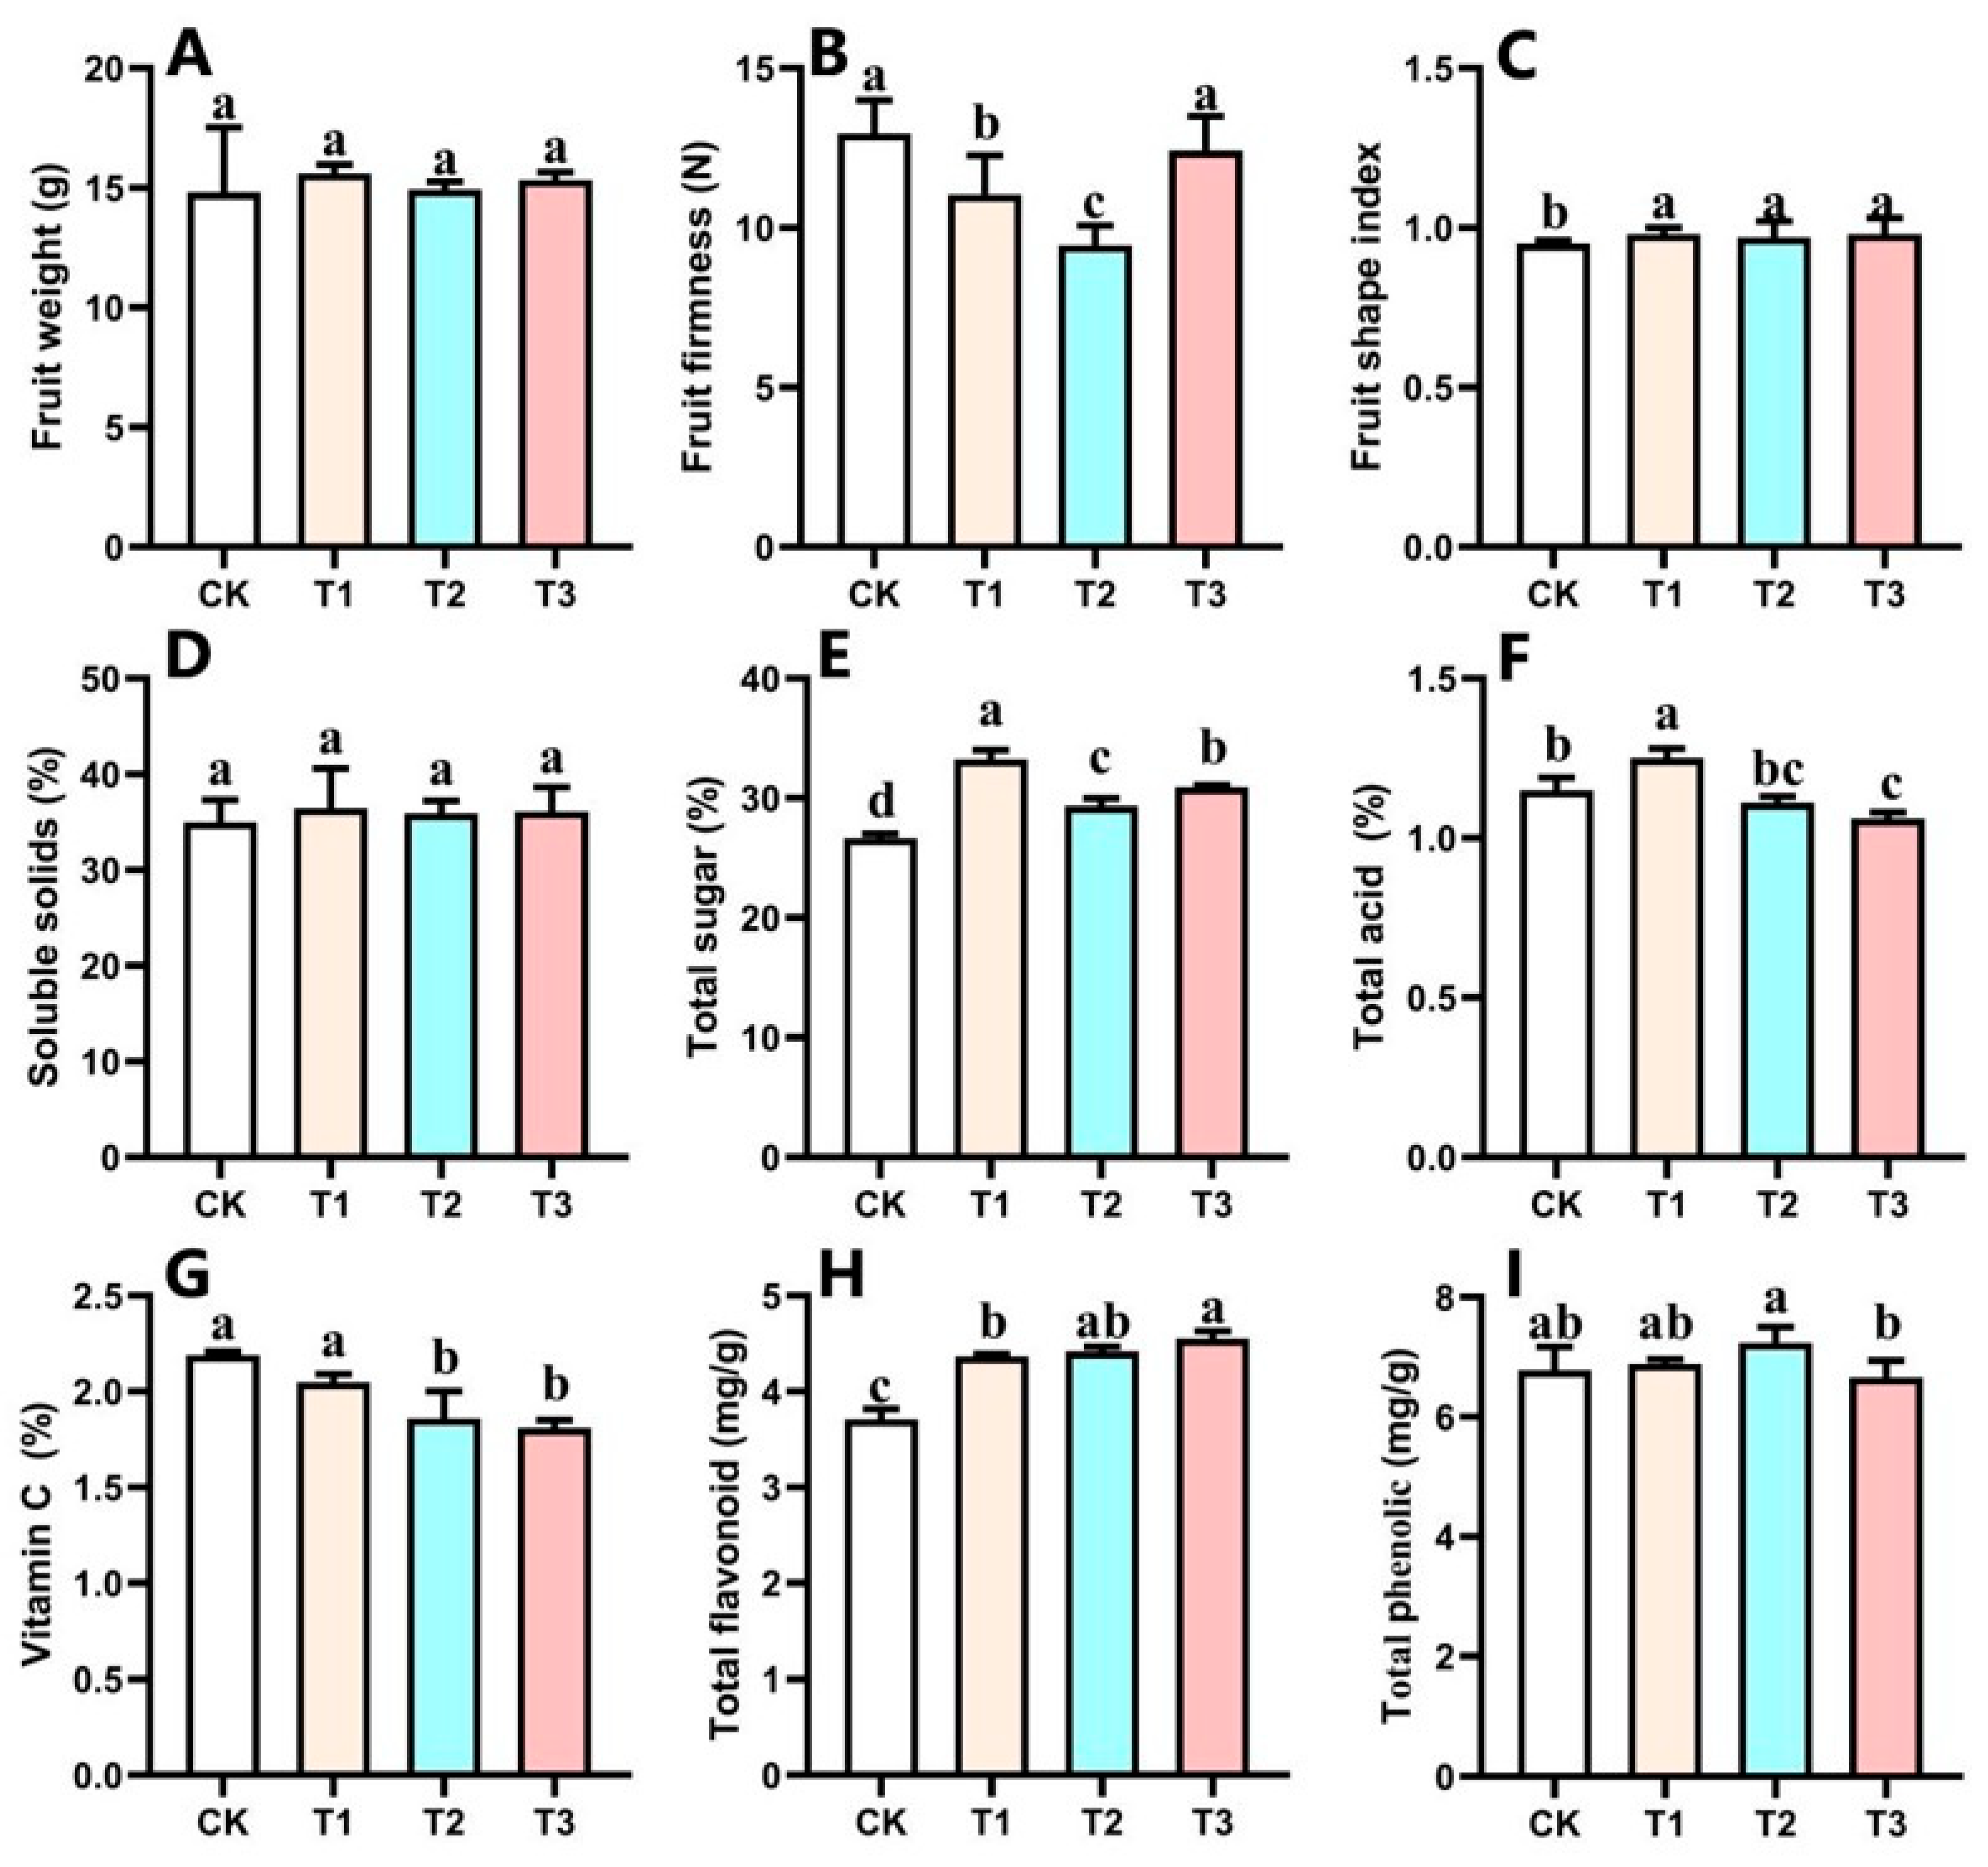
As shown in Figure 7, single fruit weight showed no significant differences (14–16 g; Figure 7A). Fruit firmness was lower in all treatments compared with CK, with T1 and T2 significantly lower (Figure 7B). Fruit shape index and total flavonoids were significantly higher under all treatments (Figure 7C,H). Soluble solids ranged from 34% to 36%, with no significant differences among treatments and CK (Figure 7D,I). Total sugar content was significantly higher under all treatments, with T1 being the highest, 24.8% higher than CK (Figure 7E). Total acid content was significantly higher in T1 but significantly lower in T3 (Figure 7F). Vitamin C content was lower in all treatments, with T2 and T3 significantly lower by 15.1% and 17.4%, respectively (Figure 7G).
Notably, all treatments exhibited a concurrent increase in total sugars and flavonoids alongside a decrease in vitamin C (Figure 7E,G,H), reflecting a coordinated shift in carbon allocation among competing biosynthetic routes. Correlation analysis confirmed this relationship: vitamin C content was significantly negatively correlated with total flavonoids and negatively correlated with total sugars (Table 2). This trade-off aligns with known plant metabolic network behavior, where limited primary carbon resources are partitioned among multiple pathways including ascorbate biosynthesis and polyphenolic production. Combined with the mineral element analysis results (Figure 6), the increased accumulation of Fe, Mn, and Zn in fruits under the treatments may induce reactive oxygen species (ROS) production, which could accelerate vitamin C oxidation while promoting flavonoid biosynthesis—an ROS-scavenging compensatory mechanism—suggesting a metabolic flux redistribution between these nutrients [33].

3.7. Principal Component Analysis

Principal component analysis (PCA) of growth traits, mineral elements, and fruit quality indices yielded eigenvalues, variance contribution rates, and cumulative contribution rates (Table 3). Three principal components were selected based on a cumulative variance contribution rate > 85% [34]. The weighting method for comprehensive evaluation was determined by the variance contribution rate of each principal component: the weights of F1, F2, and F3 was 46.65%, 29.97%, and 23.38% respectively, corresponding to their respective variance contribution rates. The comprehensive score was calculated as (F1 × 46.65% + F2 × 29.97% + F3 × 23.38%). Weighted comprehensive evaluation ranked the treatments as: T1 > T3 > T2 > CK, with T1 and T3 exhibiting similar and significantly higher scores than T2 and CK (Table 4).

4. Effects on Fruit Metabolites

4.1. Metabolomic Profiling

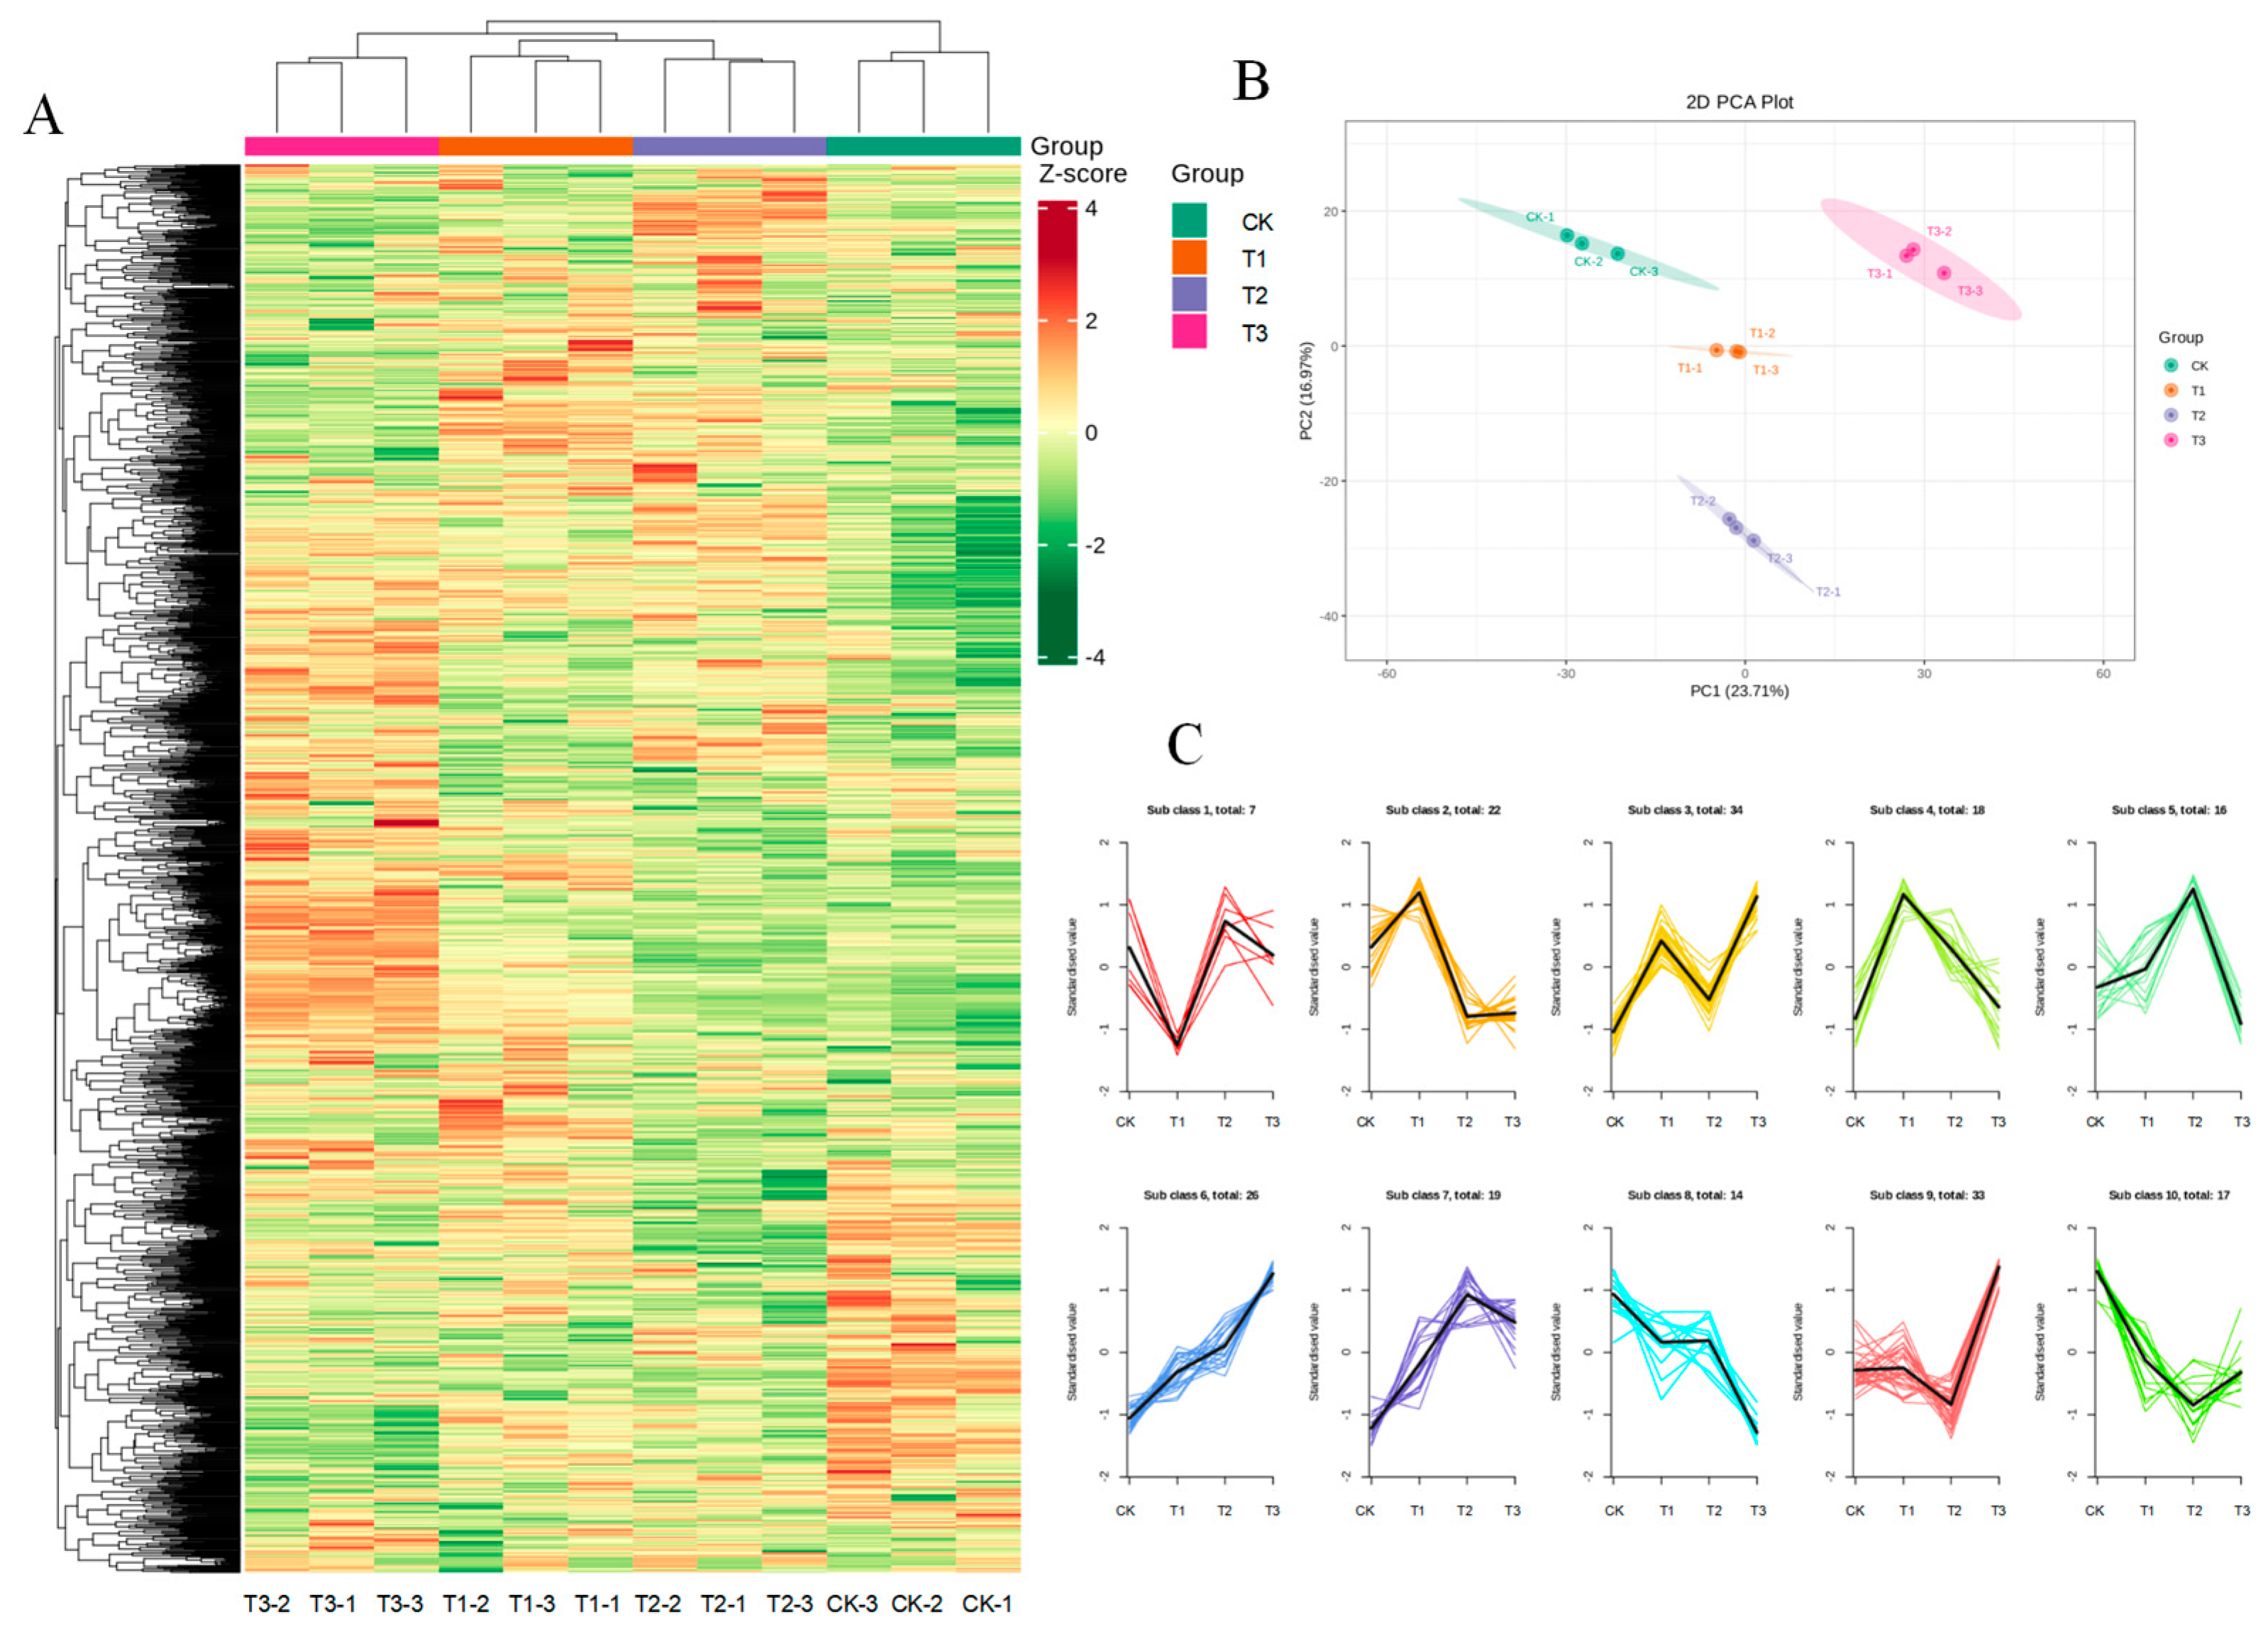
Metabolomic analysis of full-red fruits across treatments detected 1825 metabolites including 157 amino acids and derivatives (8.6%), 243 phenolic acids (13.3%), 63 nucleotides and derivatives (3.4%), 267 flavonoids (14.6%), 17 quinones (0.9%), lignans and coumarins (4.6%), 232 others (12.7%), 19 tannins (1.0%), alkaloids (11.7%), 265 terpenoids (14.5%), 100 organic acids (5.4%), four steroids (0.2%), and 159 lipids (8.7%) (Figure 8A). The PCA (Figure 8B) revealed clear separation among treatments, with PC1 and PC2 explaining 23.71% and 16.97% of the total variance, respectively. QC samples clustered tightly, indicating reliable data.
To explore the dynamic changes of different metabolites across groups, line charts were plotted to illustrate the normalized values of each metabolite as a function of group variation. As shown in Figure 8C, metabolites exhibited distinct response patterns to intergroup changes, reflecting the complexity and specificity of metabolic regulation under different treatment conditions. Analysis of the number of metabolites in each trend category revealed that Subclass 1 contained seven metabolites, while Subclass 3, characterized by an “N”-shaped variation trend, included the largest number of metabolites (34 in total).

4.2. Identification of Differential Metabolites

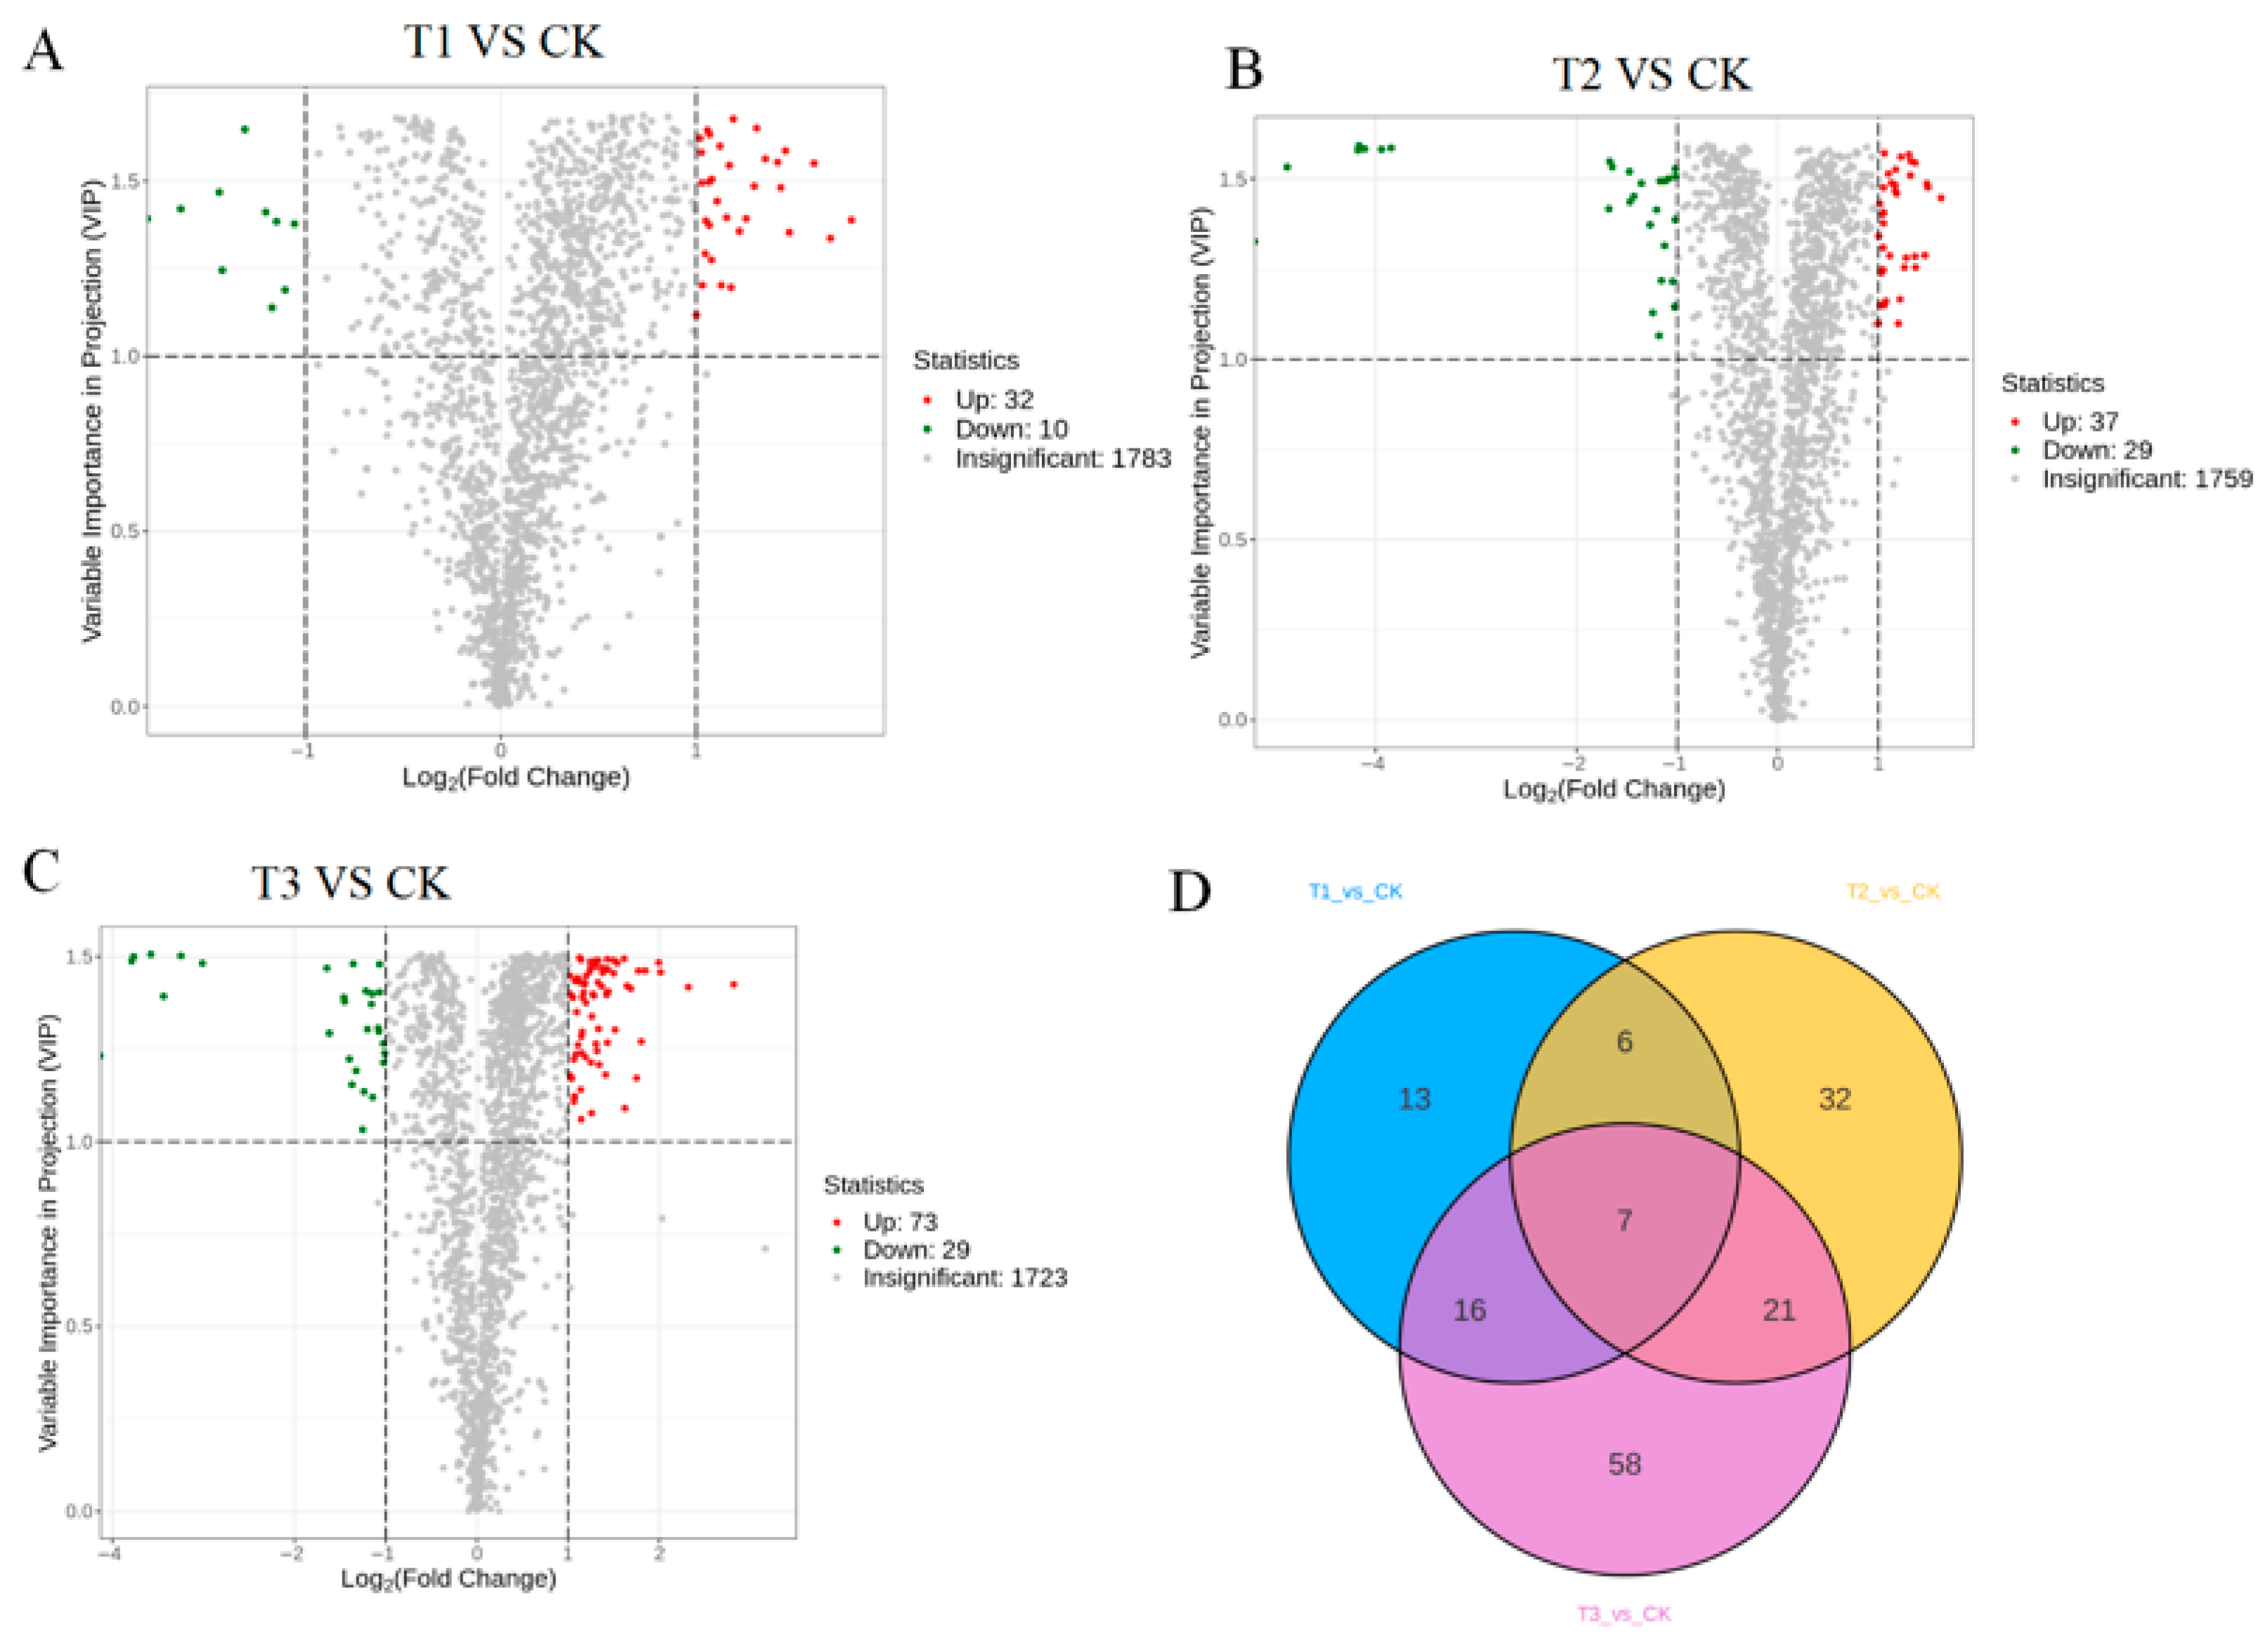
Differential metabolites were screened using |Log2FoldChange| ≥ 2 and VIP ≥ 1. T3 vs. CK showed the highest number of differential metabolites (102; Figure 9C). Venn analysis revealed seven shared key differential metabolites across T1 vs. CK, T2 vs. CK, and T3 vs. CK including campneoside II, cinnamoyltartaric acid, hypolaetin, isosyringinoside, L-valyl-L-phenylalanine, N-acetylneuraminic acid, and O-caffeoyl maltotriose. Phenolic acids accounted for 42.9% (Figure 9D).

4.3. KEGG Pathway Enrichment Analysis of Differential Metabolites

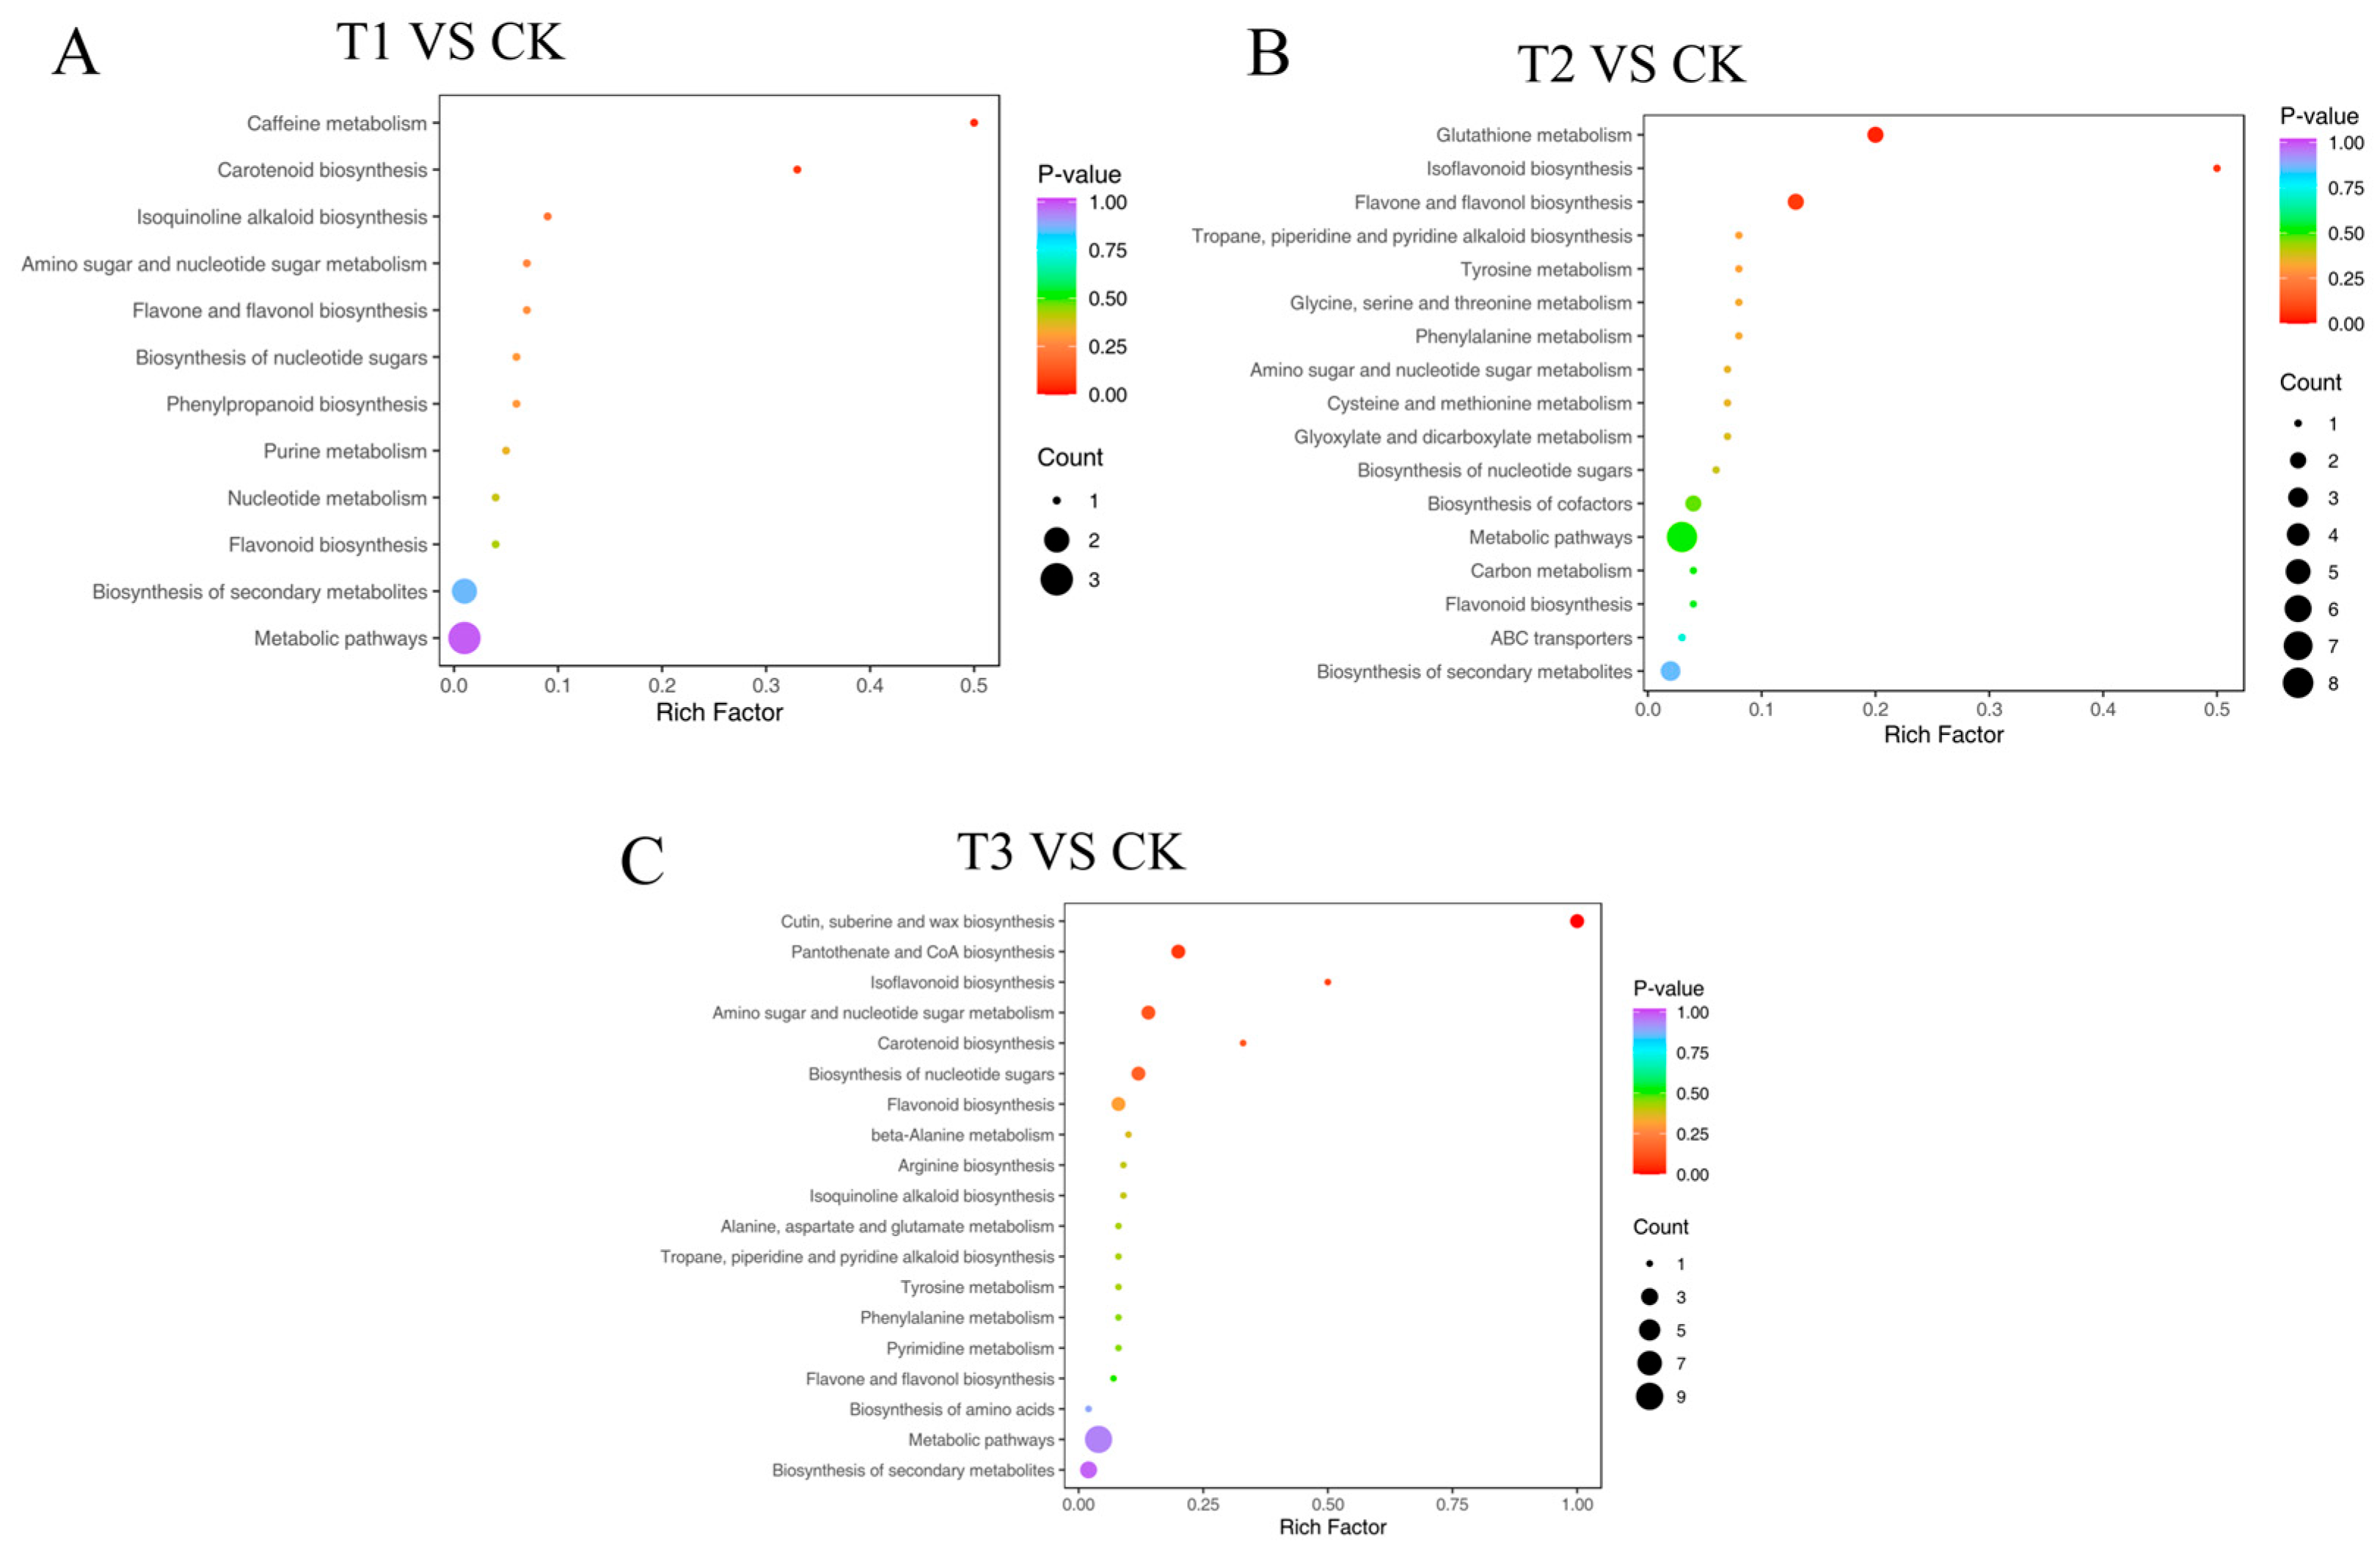
To further clarify the metabolic pathways affected by different fertilization treatments, the screened differential metabolites were annotated using the KEGG database, and KEGG pathway enrichment analysis was performed. The results are presented as bubble plots (Figure 10), with the bubble size representing the number of differential metabolites enriched in the pathway and bubble color indicating the enrichment significance.
T1 vs. CK (Figure 10A) mapped 12 differential metabolic pathways (5 metabolic, 7 biosynthesis), with the most differential metabolites in “Biosynthesis of secondary metabolites” and “Metabolic Pathways”, and the most significant enrichment in “Caffeine metabolism”, “Carotenoid biosynthesis”, and “Flavone and flavonol biosynthesis”. T2 vs. CK (Figure 10B) identified 17 pathways (9 metabolic, 7 biosynthesis, 1 transformation; 8 amino acid-related, 3 flavonoid-related), with the highest metabolite enrichment in “Metabolic Pathways” and “Biosynthesis of secondary metabolites”, and significant enrichment in “Glutathione metabolism”, “Isoflavonoid biosynthesis”, and “Flavone and flavonol biosynthesis”. T3 vs. CK (Figure 10C) mapped 17 pathways (6 metabolic, 11 biosynthesis), with the most metabolites in “Biosynthesis of amino acids” and “Metabolic Pathways”, and significant enrichment in “Cutin, suberine and wax biosynthesis”, “Pantothenate and CoA biosynthesis”, and “Isoflavonoid biosynthesis”.

4.4. Correlation Between Key Metabolites and Physiological Indices

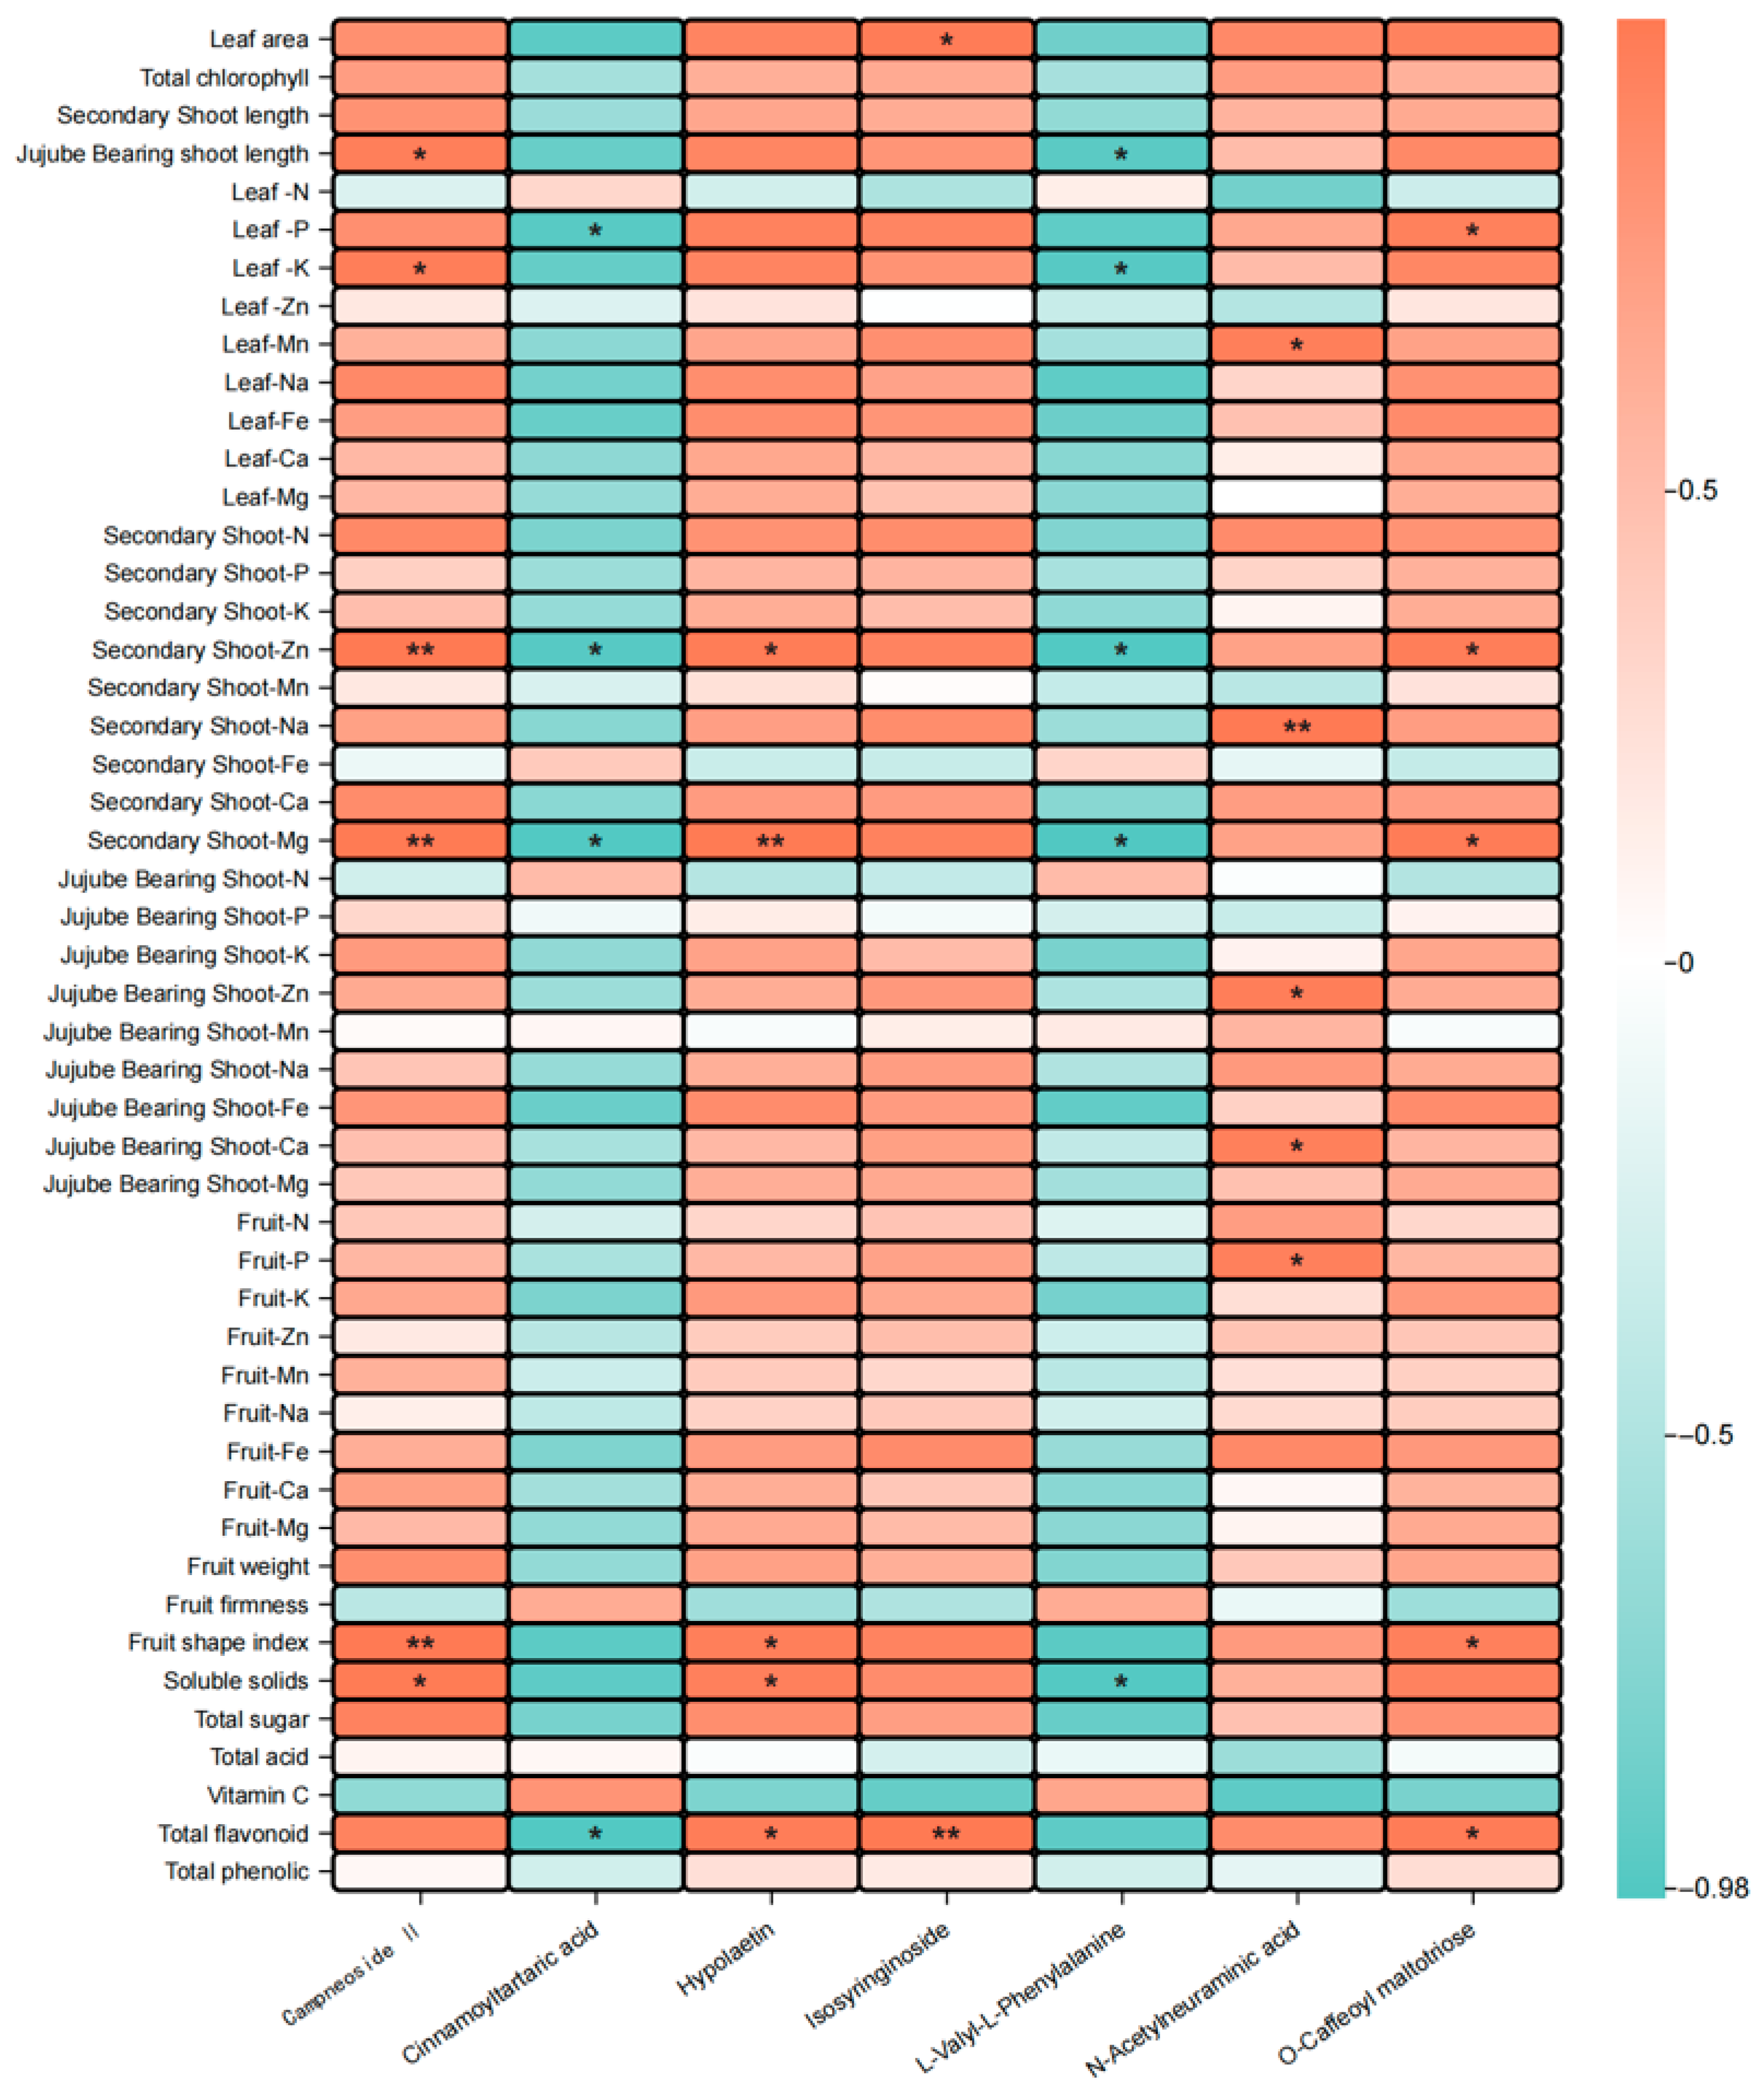
Correlation analysis revealed that cinnamoyltartaric acid and L-valyl-L-phenylalanine were generally negatively correlated with growth, mineral, and quality indices. Cinnamoyltartaric acid was significantly negatively correlated with total flavonoids, leaf phosphorus, secondary shoot zinc and magnesium; L-valyl-L-phenylalanine was negatively correlated with soluble solids, jujube bearing shoot length, leaf potassium, secondary shoot zinc and magnesium. Campneoside II and hypolaetin derivatives were positively correlated with secondary shoot zinc, magnesium, and fruit shape index. Isosyringinoside was positively correlated with total flavonoids and leaf area, while O-caffeoyl maltotriose was positively correlated with fruit shape index, total flavonoids, leaf potassium, and secondary shoot zinc and magnesium (Figure 11).

5. Discussion

Fertilization can regulate the availability, activation efficiency, and balanced supply of soil mineral elements, thereby influencing the absorption, translocation, and distribution of key mineral elements in plants. This provides a material basis for tree growth and development as well as fruit quality formation [9,10]. In the present study, all three treatments generally increased the contents of key mineral elements in various organs of winter jujube. Specifically, biofertilizer application exhibited the most significant promoting effect on the accumulation of P, Fe, Ca, and Mg in leaves, while the combination of basal fertilizer with graphene + biofertilizer significantly enhanced the contents of N, P, Mn, and Fe in fruits. These results are consistent with previous findings that nanomaterials can improve the nutrient absorption capacity of crops [35] and that biofertilizers can enhance soil aeration to facilitate root nutrient acquisition [36]. Notably, existing research on graphene’s application in agriculture is predominantly focused on crops such as tomato, radish, and rice [16,24], with relatively limited systematic studies on fruit crops—especially perennial fruit trees like winter jujube. The few available fruit crop studies reported consistent nutrient-promoting effects: graphene oxide application increased N, P, and K accumulation in apple seedlings [36], while Bacillus-based biofertilizers enhanced Ca and Mg uptake in citrus fruits [15]. This suggests that the positive regulation of mineral element absorption by graphene and microbial inoculants may be a conserved mechanism across fruit crops, but more targeted research is needed to confirm this due to the current scarcity of data in tree fruits. Considering the characteristic of graphene’s nano-scale structure to increase the contact area with soil particles and improve mineral element desorption efficiency [37], as well as the mechanism by which biofertilizers can activate soil trace elements through the secretion of organic acids [38], it is plausible that the two components may exert complementary effects on enhancing the absorption and utilization efficiency of mineral elements in winter jujube.
Reasonable fertilization can significantly improve the external sensory quality and internal nutritional and flavor quality of fruits by optimizing physiological processes such as sugar-acid metabolism, color formation, and flavor substance synthesis in fruits. In this study, all efficiency-enhanced fertilizer treatments significantly improved the quality of winter jujube fruits: specifically, the combination of basal fertilizer with graphene fertilizer significantly increased the total sugar and total acid contents of the fruits, while the combined application of basal fertilizer with graphene + biofertilizer notably elevated the total flavonoid content. These results are consistent with previous findings that biofertilizers can increase the soluble solid content and total sugar content of fruits [39], and that nanocarbon can promote the accumulation of carbohydrates in crops [40]. The combined application of graphene and biofertilizers may regulate fruit quality formation through two complementary pathways: on the one hand, graphene can carry nutrients such as nitrogen (N), phosphorus (P), and potassium (K) into plants, providing a material basis for metabolic synthesis [41]; on the other hand, biofertilizers can enhance the activity of the flavonoid biosynthesis pathway, thereby increasing the content of antioxidant substances in fruits [42].
All treatments reduced vitamin C content but significantly increased the total flavonoids, suggesting a possible metabolic trade-off. Given that ascorbate biosynthesis via the Smirnoff–Wheeler pathway relies on carbohydrate-derived precursors (e.g., GDP-D-mannose, GDP-L-galactose), enhanced allocation of carbon toward sugar accumulation and phenylpropanoid-derived flavonoids may indirectly constrain vitamin C synthesis. In addition, fertilizer-induced increased mineral element (Fe, Mn, Zn) accumulation may elevate oxidative pressure, potentially increasing ascorbate turnover. However, these interpretations remain hypothetical, as reactive oxygen species (ROS) levels and ascorbate redox states were not directly measured in this study [33]. Although all treatments led to a decrease in vitamin C content, the significant increase in functional components such as total flavonoids still reflects the optimization value of efficiency-enhanced fertilizers for fruit nutritional quality. It is speculated that this trade-off effect may be related to the redistribution of metabolic flux, which requires further research to verify.
Comprehensive evaluation via principal component analysis (PCA) of growth parameters, mineral elements, and quality traits revealed that the T1 and T3 treatments achieved the highest comprehensive scores, indicating the superior regulatory effects of basal fertilizer combined with graphene fertilizer, or basal fertilizer integrated with graphene fertilizer + biofertilizer. This result validates the application potential of the novel efficiency-enhanced fertilizer combinations, whose advantages may stem from the complementary effects between graphene and biofertilizers: graphene improves nutrient absorption efficiency, while biofertilizers optimize the soil microecological environment [14,43].
To further elucidate the metabolic changes associated with the effects of efficiency-enhanced fertilizers on winter jujube fruit quality, a preliminary analysis was conducted using widely targeted metabolomics technology. A total of 1825 metabolites were identified in this study, among which the combination of basal fertilizer with graphene + biofertilizer yielded the highest number of differential metabolites (102) compared with the control. Furthermore, seven key differential metabolites shared across all treatments were screened out via Venn diagram analysis, with phenolic acid metabolites accounting for 42.9%. Metabolomic analysis revealed that phenolic acids and flavonoids were the dominant differential metabolites, which are derived from the phenylpropanoid pathway—a key secondary metabolism route connected with stress response and fruit quality traits. The accumulation of these metabolites implicates the modulation of pathways that govern both carbon flux and antioxidant metabolism. These biosynthetic pathways often intersect with sugar and organic acid metabolism, which are also linked to ascorbate pathways via shared primary precursors (e.g., GDP-D-mannose). KEGG-based pathway annotation suggested that “Flavone and flavonol biosynthesis” and “Isoflavonoid biosynthesis” were significantly enriched in multiple treatments, indicating that flavonoid metabolism is a core target of efficiency-enhanced fertilizer regulation in winter jujube. This aligns with the known metabolic framework where secondary metabolite biosynthesis competes with vitamin C synthesis for common carbon resources [33].
Correlation analysis revealed that isosyringinoside was extremely significantly positively correlated with total flavonoid content, while O-caffeoyl maltotriose exhibited a significant positive correlation with fruit shape index and leaf potassium (K) content. In contrast, cinnamoyltartaric acid was negatively correlated with multiple quality traits. These results not only expand the research scope regarding the associations between winter jujube metabolites and fruit quality [31], but also clarify that phenolic acid metabolites are the core mediators of efficiency-enhanced fertilizer-regulated winter jujube quality. Additionally, the diverse response trends of metabolites to different fertilization treatments underscore the complexity and specificity of metabolic regulation under differential nutrient inputs, providing crucial phenotypic evidence for dissecting metabolic regulatory networks. This is consistent with our metabolomic analysis showing that phenolic acids accounted for 42.9% of the shared key differential metabolites across all treatments, further confirming their critical role in quality regulation. From the perspective of metabolic pathways, this study confirms the regulatory logic of the “basal fertilizer + efficiency-enhanced fertilizer” model, specifically by linking mineral element uptake optimization, metabolic pathway reprogramming, and fruit quality improvement, and identifying phenolic acid metabolites as key mediators of these processes.
Notably, the environmental effects of graphene (including its oxide and reduced forms) in soil ecosystems remain inconsistent across studies, which should be considered when recommending its agricultural application. Some studies have shown that graphene can alter soil enzyme activities (e.g., invertase, protease) and increase microbial community richness and diversity [44], while others have reported that graphene application reduces soil microbial biomass, inhibits nitrogen cycling-related bacteria and enzyme activities, with effects exacerbated by increasing doses [45]. Additionally, graphene can serve as a carrier for microbial inoculants to enhance their stability and functional efficiency in soil remediation [46,47], suggesting potential dual roles in regulating soil microecology. Given these inconsistencies, the environmental risks of graphene, such as substrate persistence and potential accumulation in restricted-root cultivation systems, cannot be ignored. Although the graphene dosage used in this study (0.38 g/plant per application) references safe concentration ranges reported in previous reviews [16,24], long-term field monitoring of its residual dynamics and ecological impacts is still necessary to ensure sustainable application.
A limitation of this study is its single-factor design, which precludes a formal statistical analysis of the interaction between graphene and microbial inoculants. Although the combined treatment (T3) often showed superior performance, the specific synergistic or antagonistic effects between the two additives cannot be quantitatively delineated from the present experimental setup. Future studies employing a full factorial design would be required to rigorously verify and quantify their interaction.

6. Conclusions

Graphene (T1) and graphene combined with biofertilizer (T3) significantly improved winter jujube growth (leaf area, chlorophyll content, jujube bearing shoot length), enhanced P, K, Ca, Mg accumulation in multiple organs, and increased the fruit total sugars and flavonoids, showing the best overall performance. Metabolomic analysis revealed strong correlations between phenolic acid metabolites and fruit quality traits, suggesting that enhanced fertilizers promote mineral uptake and influence metabolite accumulation to jointly improve plant growth and fruit quality. These findings provide theoretical support for optimized fertilization strategies in restricted-root cultivated winter jujube under similar soil conditions, and offer new insights into the application of nanomaterials and microbial inoculants in jujube cultivation. It should be noted that this study has certain limitations: the experiment was conducted at a single location with restricted-root cultivation using a mixed soil substrate, lacking multi-location and real-soil (field) validation; the sample size was limited to three biological replicates per treatment; and the research was a one-year trial without long-term multi-year verification. Therefore, the generalizability of the results may be restricted, and future studies should expand to multi-location field trials, increase sample sizes, and conduct long-term monitoring to further validate the stability and applicability of the proposed fertilization strategies.

Author Contributions

B.C.: Sample collection and Writing original draft. D.L.: Data measurement. H.Y., X.Z., and Y.W.: Reviewing and editing. C.W.: Supervision and conceptualization. All authors have read and agreed to the published version of the manuscript.

Funding

This study was supported by the earmarked fund of Xinjiang Jujube Industrial technology System (XJLGCYJSTX02), the Tarim University Chancellor’s Fund Project (TDZKBS202403), and the “Tianchi Talent” Introduction Program for Young Doctoral Scholars (524312003). The funding bodies played no role in the design of the study; collection, analysis, and interpretation of the data, and in writing the manuscript.

Data Availability Statement

The original contributions presented in this study are included in the article. Further inquiries can be directed to the corresponding authors.

Conflicts of Interest

The authors declare no conflicts of interest.

References

  1. Gao, Q.H.; Wu, C.S.; Wang, M. The jujube (Ziziphus jujuba Mill.) fruit: A review of current knowledge of fruit composition and health benefits. J. Agric. Food Chem. 2013, 61, 3351–3363. [Google Scholar] [CrossRef] [PubMed]
  2. Kou, X.H.; He, Y.L.; Li, Y.F. Effect of abscisic acid (ABA) and chitosan/nano-silica/sodium alginate composite film on the color development and quality of postharvest Chinese winter jujube (Ziziphus jujuba Mill. cv. Dongzao). Food Chem. 2019, 270, 385–394. [Google Scholar] [CrossRef]
  3. Shao, Q.; Xia, X.J.; Li, G.H. Effects of flue gas desulfurization gypsum and clover planting on qualities of soil and winter jujube in coastal saline-alkali orchard of north China. Sustainability 2024, 6, 230185. [Google Scholar] [CrossRef]
  4. Zhang, Y.P.; Yu, H.; Yao, H.Y. Yield and Quality of Winter Jujube under Different Fertilizer Applications: A Field Investigation in the Yellow River Delta. Horticulturae 2023, 9, 152. [Google Scholar] [CrossRef]
  5. Chen, H.; Liu, W.; Gao, L.P. An adaptive spacing of root-zone hole fertilization to improve production and fertilizer utilization of rapeseed. J. Sci. Food Agric. 2024, 104, 6276–6288. [Google Scholar] [CrossRef]
  6. Ruan, R.J.; Zhang, Z.B.; Lan, T. The role of soil pore structure on nitrate release from soil organic matter and applied fertilizer under three fertilization regimes. Soil Tillage Res. 2025, 248, 106396. [Google Scholar] [CrossRef]
  7. Li, Q.J.; Zheng, X.N.; Liu, M.J. Influence of Grass Mulching and Organic Fertilizer Addition on Soil Microbial Community Composition and Function in a ‘Dongzao’ Jujube (Ziziphus jujuba Mill. ‘Dongzao’) Orchard. Eurasian Soil Sci. 2024, 57, 460–470. [Google Scholar] [CrossRef]
  8. Liu, F.S.; Xing, S.J.; Ma, H.L. Effects of Biological-organic Fertilizer on Biological Characteristics, Yield and Quality of Zizyphus jujube Mill. Dongzao Trees. J. Soil Water Conserv. 2010, 24, 222–226. [Google Scholar] [CrossRef]
  9. Tong, P.P.; Liao, G.L.; Liang, F.Z. Identification of Key Soil Mineral Elements Affecting Sugars and Organic Acids of Jujube Fruit. Horticulturae 2024, 10, 652. [Google Scholar] [CrossRef]
  10. Yamaji, N.; Ma, J.F. Node-controlled allocation of mineral elements in Poaceae. Curr. Opin. Plant Biol. 2017, 39, 18–24. [Google Scholar] [CrossRef]
  11. Sun, H.L.; Huang, X.; Chen, T. Fruit quality prediction based on soil mineral element content in peach orchard. Food Sci. Nutr. 2022, 10, 1756–1767. [Google Scholar] [CrossRef]
  12. Garratt, M.P.; Breeze, T.D.; Jenner, N.; Polce, C.; Biesmeijer, J.C.; Potts, S.G. Avoiding a bad apple: Insect pollination enhances fruit quality and economic value. Agric. Ecosyst. Environ. 2014, 184, 34–40. [Google Scholar] [CrossRef]
  13. Sun, G.Z.; Hu, T.T.; Liu, X.G. Optimizing irrigation and fertilization at various growth stages to improve mango yield, fruit quality and water-fertilizer use efficiency in xerothermic regions. Agric. Water Manag. 2022, 260, 107296. [Google Scholar] [CrossRef]
  14. Sun, C.X.; Chen, L.P.; Liu, Y.H. Effects of organic and bacterial fertilizer application on cabbage characteristic and rhizosphere soil microorganisms. Plant Stress 2022, 260, 107296. [Google Scholar] [CrossRef]
  15. Chamurliev, O.G.; Borisenko, I.B.; Zelenev, A.V.; Chamurliev, G.O.; Konstantinova, T.V.; Feofilova, L.A. Improving soil ecology when applying bacterial fertilizers. IOP Conf. Ser. Earth Environ. Sci. 2022, 965, 012002. [Google Scholar] [CrossRef]
  16. Cheng, S.; Lei, Y.H.; Li, H.T. Graphene Materials in Agriculture: A Review. Chin. Agric. Sci. Bull. 2023, 39, 108–113. [Google Scholar]
  17. Kabiri, S.; Degryse, F.; Tran, D.N.; da Silva, R.C.; McLaughlin, M.J.; Losic, D. Graphene Oxide: A New Carrier for Slow Release of Plant Micronutrients. ACS Appl. Mater. Interfaces 2017, 9, 43325–43335. [Google Scholar] [CrossRef]
  18. Hong, J.; Yang, L.T.; Zhang, D.B. Plant metabolomics: An indispensable system biology tool for plant science. Int. J. Mol. Sci. 2016, 17, 767. [Google Scholar] [CrossRef] [PubMed]
  19. Liu, X.; Locasale, J.W. Metabolomics: A Primer. Trends Biochem. Sci. 2017, 42, 274–284. [Google Scholar] [CrossRef]
  20. Mao, Y.M.; Shen, L.Y.; Wei, W. Effects of foliar applications of boron and calcium on the fruit quality of ‘Dongzao’ (Ziziphus jujuba Mill.). Acta Hortic. 2016, 1116, 105–108. [Google Scholar] [CrossRef]
  21. Li, M.; Yu, M.L.; Zhang, Z.Q. Effects of spraying Harpin protein on postharvest fruit quality of Dongzao jujube in growth period. Trans. Chin. Soc. Agric. Eng. 2012, 28, 287–292. [Google Scholar]
  22. Lu, W.J. Key points of fertilization for jujube trees. Rural. Sci. Technol. 2008, 12, 19. [Google Scholar]
  23. Dong, Z.A.; Zheng, X.S.; Chen, C.Y. Field experiment on rational fertilization rate for winter jujube. Chin. Hortic. Abstr. 2012, 28, 22–23. [Google Scholar]
  24. Shi, D.; Wu, G.; Yang, Q.; Cheng, R. Research progress on the application of graphene-based materials in agriculture. Jiangsu Agric. Sci. 2023, 51, 39–48. [Google Scholar] [CrossRef]
  25. Liu, H.; Sun, J.; Wu, C.; Zhang, Y. Effects of combined application of different fertilizers and bio-bacterial fertilizer on growth of Jun jujube and soil nutrients. J. Green Sci. Technol. 2025, 27, 70–75+180. Available online: https://link.cnki.net/doi/10.16663/j.cnki.lskj.2025.07.038 (accessed on 21 January 2026).
  26. Yu, H.L.; Xu, G.Y.; Xu, B.B.; Yuan, B.J.; Shao, W.; Wang, X.W.; Zhu, G.R.; Lu, Z.H.; Si, P. Effects of bio-bacterial fertilizer application on soil nutrients and microbial functional diversity in peach orchards. Agric. Res. Arid. Areas 2020, 38, 91–97. [Google Scholar]
  27. Wellburn, A.R. The spectral determination of chlorophylls a and b, as well as total carotenoids, using various solvents with spectrophotometers of different resolution. J. Plant Physiol. 1994, 144, 307–313. [Google Scholar] [CrossRef]
  28. Jones, D.L.; Case, V.W. A simple method for determination of total carbon and nitrogen in soil. Soil Sci. Soc. Am. J. 1990, 54, 397–400. [Google Scholar]
  29. Mertens, D. Determination of major and minor elements in plant samples by inductively coupled plasma optical emission spectrometry (ICP-OES). J. AOAC Int. 2005, 88, 878–884. [Google Scholar] [CrossRef]
  30. Gao, J.F. Experimental Techniques in Plant Physiology; World Book Publishing Company: Xi’an, China, 2000. [Google Scholar]
  31. Feng, Z.H.; Gao, Z.F.; Jiao, X. Widely targeted metabolomic analysis of active compounds at different maturity stages of ‘Hupingzao’ jujube. J. Food Compos. Anal. 2020, 88, 103417. [Google Scholar] [CrossRef]
  32. Wang, Y.; Feng, Y.F.; Yan, M. Effect of Saline–Alkali Stress on Sugar Metabolism of Jujube Fruit. Horticulturae 2022, 8, 474. [Google Scholar] [CrossRef]
  33. Fenech, M.; Amaya, I.; Valpuesta, V.; Botella, M.A. Vitamin C Content in Fruits: Biosynthesis and Regulation. Front. Plant Sci. 2019, 9, 2006. [Google Scholar] [CrossRef]
  34. Liang, F.Z. Fruit quality analysis and dominant zone division of ‘Huizao’ and ‘Junzao’ around Tarim Basin. Xinjiang Aral Tarim Univ. 2021. Available online: https://link.cnki.net/doi/10.27708/d.cnki.gtlmd.2021.000220 (accessed on 21 January 2026). (In Chinese)
  35. Liu, A.X.; Liao, Z.W. Effects of Nano-materials on Water Clusters. J. Anhui Agric. Sci. 2008, 36, 15780–15781. [Google Scholar] [CrossRef]
  36. Chen, J.M.; Ge, S.F.; Sha, J.C.; Feng, Y.G.; Jiang, Y.M. Microbial fertilizer enhances nitrogen uptake and fruit yield in apple trees affected by mosaic disease. J. Plant Nutr. Fertil. 2017, 23, 1296–1302. [Google Scholar]
  37. Rose, P.; Bhat, M.; Vidhani, K. Intelligent informatics platform for nano-agriculture. In Proceedings of the 2011 11th IEEE International Conference on Nanotechnology, Portland, OR, USA, 15–18 August 2011; IEEE: New York, NY, USA, 2011; pp. 916–919. [Google Scholar] [CrossRef]
  38. Ding, W.C.; He, P.; Zhou, W. Development strategies of the new-type fertilizer industry in China. J. Plant Nutr. Fertil. 2023, 29, 201–221. [Google Scholar] [CrossRef]
  39. Li, Y.H.; Xu, Q.X.; Li, M.Y.; Qin, W.M. Effects of Micro-organic fertilizer on the yield and quality of Kurle fragrant pear. Tianjin Agric. Sci. 2006, 2, 48–50. [Google Scholar]
  40. Tang, H.J. Effects of Different Ways of Applying Nano Carbon Compound Fertilizer on Yield and Quality of Sweet Potato. Chin. Agric. Sci. Bull. 2023, 39, 38–43. [Google Scholar]
  41. Li, J.X.; Wu, X.P.; Li, X.X. Effects of nano-carbon on soil enzyme activity, available nutrients and yield and quality of tomato in facilities. Soil Fertil. Sci. China 2023, 10, 83–90. [Google Scholar]
  42. Su, D.; Peng, G.H.; Han, S.Y.; Geng, G.D. Effects of compound fertilizers on capsaicin and related secondary metabolite accumulation in pepper and their correlation analysis. China Cucurbit Gourd 2016, 29, 19–22. [Google Scholar] [CrossRef]
  43. Qi, C.H.; Zhang, C.Y.; Yang, Z.H. Acid-modified biochar-based bacterial fertilizer and increase soil available phosphorus. J. Soils Sediments 2024, 25, 59–66. [Google Scholar] [CrossRef]
  44. Rong, Y.; Wang, Y.; Guan, Y. Pyrosequencing reveals soil enzyme activities and bacterial communities impacted by graphene and its oxides. J. Agric. Food Chem. 2017, 65, 9191–9199. [Google Scholar] [CrossRef] [PubMed]
  45. Fang, J.; Weng, Y.; Li, B. Graphene oxide decreases the abundance of nitrogen cycling microbes and slows nitrogen transformation in soils. Chemosphere 2022, 309, 136642. [Google Scholar] [CrossRef] [PubMed]
  46. Ren, W.; Liu, H.; Mao, T. Enhanced remediation of PAHs-contaminated site soil by bioaugmentation with graphene oxide immobilized bacterial pellets. J. Hazard. Mater. 2022, 433, 128793. [Google Scholar] [CrossRef] [PubMed]
  47. Li, L.N.; Teng, Y.; Ren, W.J.; Li, Z.G.; Luo, Y.M. Effects of Graphene on Soil Enzyme Activities and Microbial Communities. Soils 2016, 48, 102–108. [Google Scholar] [CrossRef]
Figure 1. Morphological characteristics of winter jujube and experimental planting layout. (A) Unripe winter jujube fruits. (B) Ripe winter jujube fruits. (C) Experimental planting layout of main stem-shaped winter jujube.
Horticulturae 12 00133 g001
Figure 2. Effects of different fertilization regimes on growth parameters of winter jujube. (A) Leaf area (mm2). (B) Total chlorophyll content (mg/g). (C) Secondary shoot length (cm). (D) Jujube bearing shoot length (cm). Treatments: CK = Basal fertilizer only; T1 = Basal fertilizer + graphene; T2 = Basal fertilizer + microbial fertilizer; T3 = Basal fertilizer + graphene combined with microbial fertilizer. Note: Data are presented as mean ± standard deviation (n ≥ 3). Different lowercase letters indicate significant differences at the p < 0.05 level.
Horticulturae 12 00133 g002
Figure 3. Effects of different fertilization regimes on mineral element contents in winter jujube leaves. (A) Nitrogen (N, g/kg); (B) phosphorus (P, g/kg); (C) potassium (K, g/kg); (D) zinc (Zn, mg/kg); (E) manganese (Mn, mg/kg); (F) sodium (Na, mg/kg); (G) iron (Fe, mg/kg); (H) calcium (Ca, mg/kg); (I) magnesium (Mg, mg/kg). Treatments: CK = Basal fertilizer only; T1 = Basal fertilizer + graphene; T2 = Basal fertilizer + microbial fertilizer; T3 = Basal fertilizer + graphene combined with microbial fertilizer. Note: Data are presented as mean ± standard deviation (n ≥ 3). Different lowercase letters indicate significant differences at the p < 0.05 level.
Horticulturae 12 00133 g003
Figure 4. Effects of different fertilization regimes on mineral element content in winter jujube secondary shoots. (A) Nitrogen (N, g/kg); (B) phosphorus (P, g/kg); (C) potassium (K, g/kg); (D) zinc (Zn, mg/kg); (E) manganese (Mn, mg/kg); (F) sodium (Na, mg/kg); (G) iron (Fe, mg/kg); (H) calcium (Ca, mg/kg); (I) magnesium (Mg, mg/kg). Treatments: CK = Basal fertilizer only; T1 = Basal fertilizer + graphene; T2 = Basal fertilizer + microbial fertilizer; T3 = Basal fertilizer + graphene combined with microbial fertilizer. Note: Data are presented as mean ± standard deviation (n ≥ 3). Different lowercase letters indicate significant differences at the p < 0.05 level.
Horticulturae 12 00133 g004
Figure 5. Effects of different fertilization regimes on mineral element content in winter jujube bearing shoots. (A) Nitrogen (N, g/kg); (B) phosphorus (P, g/kg); (C) potassium (K, g/kg); (D) zinc (Zn, mg/kg); (E) manganese (Mn, mg/kg); (F) sodium (Na, mg/kg); (G) iron (Fe, mg/kg); (H) calcium (Ca, mg/kg); (I) magnesium (Mg, mg/kg). Treatments: CK = Basal fertilizer only; T1 = Basal fertilizer + graphene; T2 = Basal fertilizer + microbial fertilizer; T3 = Basal fertilizer + graphene combined with microbial fertilizer. Note: Data are presented as mean ± standard deviation (n ≥ 3). Different lowercase letters indicate significant differences at the p < 0.05 level.
Horticulturae 12 00133 g005
Figure 6. Effects of different fertilization regimes on mineral element content in winter jujube fruits. (A) Nitrogen (N, g/kg); (B) phosphorus (P, g/kg); (C) potassium (K, g/kg); (D) zinc (Zn, mg/kg); (E) manganese (Mn, mg/kg); (F) sodium (Na, mg/kg); (G) iron (Fe, mg/kg); (H) calcium (Ca, mg/kg); (I) magnesium (Mg, mg/kg). Treatments: CK = Basal fertilizer only; T1 = Basal fertilizer + graphene; T2 = Basal fertilizer + microbial fertilizer; T3 = Basal fertilizer + graphene combined with microbial fertilizer. Note: Data are presented as mean ± standard deviation (n ≥ 3). Different lowercase letters indicate significant differences at the p < 0.05 level.
Horticulturae 12 00133 g006
Figure 7. Effects on fruit weight (A), firmness (B), fruit shape index (C), soluble solids (D), total sugar (E), total acid (F), vitamin C (G), total flavonoids (H), and total phenols (I). Treatments: CK = Basal fertilizer only; T1 = Basal fertilizer + graphene; T2 = Basal fertilizer + microbial fertilizer; T3 = Basal fertilizer + graphene combined with microbial fertilizer. Note: Data are presented as mean ± standard deviation (n ≥ 3). Different lowercase letters indicate significant differences at the p < 0.05 level.
Horticulturae 12 00133 g007
Figure 8. Metabolomic analysis of winter jujube fruits under different fertilization regimes. (A) Heatmap of metabolite correlations. (B) Principal component analysis (PCA) plot (PC1: 23.71%, PC2: 16.97%); (C) K-means clustering of differential metabolites. The colored lines represent the standardized expression values of individual differential metabolites in each subclass, and the black lines represent the mean standardized expression values of all metabolites in the corresponding subclass. Treatments: CK = Basal fertilizer only; T1 = Basal fertilizer + graphene; T2 = Basal fertilizer + microbial fertilizer; T3 = Basal fertilizer + graphene combined with microbial fertilizer. Note: Data are presented as mean ± standard deviation (n ≥ 3).
Horticulturae 12 00133 g008
Figure 9. Differential metabolite analysis of winter jujube fruits among different treatment comparisons. (A) Volcano plot of T1 vs. CK. (B) Volcano plot of T2 vs. CK. (C) Volcano plot of T3 vs. CK. (D) Venn diagram of shared differential metabolites. Treatments: CK = Basal fertilizer only; T1 = Basal fertilizer + graphene; T2 = Basal fertilizer + microbial fertilizer; T3 = Basal fertilizer + graphene combined with microbial fertilizer. Note: In volcano plots, green dots indicate downregulated metabolites, red dots indicate upregulated metabolites, and gray dots indicate non-significant metabolites (|Log2FoldChange| ≥ 2, VIP ≥ 1). Data are presented as mean ± standard deviation (n ≥ 3).
Horticulturae 12 00133 g009
Figure 10. KEGG Pathway Enrichment of Differential Metabolites in Winter Jujube under Different Treatments (A) T1 vs. CK; (B) T2 vs. CK; (C) T3 vs. CK. Note: Bubbles represent KEGG metabolic pathways. The horizontal axis position and size of bubbles indicate the impact value—larger bubbles indicate more important pathways. The vertical axis and bubble color represent the p-value of enrichment analysis—darker colors indicate smaller p-values and more significant enrichment.
Horticulturae 12 00133 g010
Figure 11. Correlation heatmap between key differential metabolites and growth parameters, mineral elements, and fruit quality traits of winter jujube. Note: ** indicates significant correlation at p < 0.01, * indicates significant correlation at p < 0.05. Data are presented as mean ± standard deviation (n ≥ 3).
Horticulturae 12 00133 g011
Table 1. Experimental program for synergistic fertilizer application.
TreatmentSingle Application of Fertilizer (g/Plant)
Urea SulfateMonoammonium PhosphatePotassium SulfateBio-Microbial FertilizerGraphene Fertilizer
T152.0022.0054.00/0.38
T252.0022.0054.000.26/
T352.0022.0054.000.260.38
CK52.0022.0054.00//
Table 2. Correlation coefficients between vitamin C, total sugars, and total flavonoids in winter jujube fruits under different treatments.
Quality IndexVitamin CTotal SugarTotal Flavonoid
Vitamin C1.00−0.38−0.89 *
Total sugar−0.381.000.75
Total flavonoid−0.89 *0.751.00
Note: * indicates significant correlation at p < 0.05.
Table 3. Eigenvalues and contribution rates of principal components for quality indices in differently treated fruits.
CompositionEigenvalueVariance Contribution RateCumulative Variance Contribution Rate
122.8646.6546.65
214.6929.9776.62
311.4623.38100.00
Table 4. Comprehensive scores of leaf growth and fruit quality under different treatments.
TreatmentF1F2F3Comprehensive ScoreRanking
CK−8.19−0.990.01−4.114
T12.99−1.005.402.361
T23.58−4.24−3.73−0.473
T31.626.23−1.672.232
Disclaimer/Publisher’s Note: The statements, opinions and data contained in all publications are solely those of the individual author(s) and contributor(s) and not of MDPI and/or the editor(s). MDPI and/or the editor(s) disclaim responsibility for any injury to people or property resulting from any ideas, methods, instructions or products referred to in the content.