Article

Domestication Has Reshaped Gene Families, Gene Expressions and Flavonoid Metabolites in Green Jujube (Ziziphus mauritiana Lam.) Fruit

Institute of Subtropical Agriculture, Fujian Academy of Agricultural Science, Zhangzhou 363005, China
*
Author to whom correspondence should be addressed.
These authors contributed equally to this work.
Horticulturae 2025, 11(8), 974; https://doi.org/10.3390/horticulturae11080974
Submission received: 21 July 2025 / Revised: 10 August 2025 / Accepted: 12 August 2025 / Published: 17 August 2025
(This article belongs to the Special Issue New Insights into Breeding and Genetic Improvement of Fruit Crops)

Abstract

Domestication has been proven to significantly impact the biosynthesis of plant secondary metabolites. Cultivated green jujube (Ziziphus mauritiana Lam.), as an important autotetraploid fruit crop widely planted in tropical regions, exhibits differential physicochemical traits compared with its wild progenitor. To assess the traits lost in cultivated green jujube during domestication, the study performed comprehensive genomic, transcriptomic and metabolomic investigations of flavonoid pathways in wild and cultivated green jujube. Based on the four haplotype genomes of wild and cultivated green jujube, for the first time, the study bulk-identified 16 key gene families associated with flavonoid biosynthesis. Collinearity analysis revealed that tandem duplication was the predominant event in flavonoid-related genes rather than WGD. Through the expression profiles in different tissues, the distinct member of these gene families was classified as “redundant” or “functional”. Transcriptomic analyses illustrated the significant differential expressions (p < 0.05) of 13 flavonoid-related gene families in fruits of six cultivated and three wild green jujube accessions, except for FLS, LAR and PPO. The wild green jujube fruits accumulated more abundance of flavonoid metabolites than in cultivated fruits (p < 0.0001), as evidenced by upregulated chalcones, dihydroflavonol, isoflavones and flavonoid carbonoside. Gene–metabolite co-expression modules further validated the potential transcription regulators, such as BBX21, WRI1 and bZIP44. Together, the study suggested a genomic, transcriptomic and metabolic perspective for domestication regarding fruit flavonoid pathways in green jujube, which provides a valuable genetic resource for fruit quality improvement in cultivated green jujube.

1. Introduction

Flavonoids are one of the most extensive groups of secondary metabolites in plants, exhibiting a wide array of functions, including defending against biotic and abiotic stresses, attracting pollinators and seed dispersers, regulating pollen fertility, participating in seed coat development and nodulation processes, and modulating phytohormone transport [1]. More importantly, plant-derived flavonoids have been shown to promote human health by preventing chronic diseases, certain cancers and cardiovascular conditions due to their wide range of biological activities, such as antioxidant, anticancer, antitumor, antidiabetic, anti-inflammatory, antimicrobial and immunomodulation effects [2].
Green jujube (Ziziphus mauritiana) is aa important member of the genus Ziziphus within the family Rhamnaceae. It is one of the oldest cultivated fruit trees in the world, with a history of utilization and cultivation dating back to the Neolithic Age on the Indian subcontinent, approximately 11,000 years ago. Hence, it is known as “Indian jujube” or “ber” [3]. It is widely distributed in over 100 countries or regions across five continents: Asia, Africa, Oceania, North America and South America [4]. The fruit is rich in a diverse array of distinct flavonoids, which have garnered increasing attention due to their remarkable bioactivities, such as antioxidant, anticancer, antidiabetic, antimicrobial, and anti-inflammatory properties [5,6,7]; in particular, green jujube is widely utilized as both a food source and a traditional medicinal compound across Asia [7]. However, over recent decades, green jujube has undergone significant transformation through genetic improvement and selective breeding efforts by horticultural experts. Originating from its wild progenitor (known in China as the “hairy-leaf jujube” or “Yunnan thorn jujube”), this fruit tree has evolved into a distinct group of cultivated varieties different from those now planted in other world regions, such as India, Pakistan and Africa. Many of its characteristics have changed considerably, with notable variations including a larger leaf size; diminished stipular spines; greater fruit size; accelerated growth rates; and especially, the fruit flavor change from bitter to sweet. However, the mechanisms underlying these changes are unclear; therefore, it is essential to reveal domestication’s effect on the flavonoid accumulation of green jujube fruits.
Numerous studies have extensively investigated the changes in flavonoid profiles that occur during the domestication of crops. In some species, flavonoids are lost during domestication, as seen in rice [1], soybean [8], Chinese plum [9], peach [10], watermelon [11], blueberry [12], apples [13] and citrus species [14]. Conversely, there are also plant species where flavonoids increase; for example, the flavonoid contents significantly increased in Dendrobium flexicaule [15], Cucurbitaceae herbs plants [16] and pomegranate [17] during domestication. Apart from these, domestication did not affect the flavonoid profiles in plant species such as Sideritis raeseri [18] and Ruta chalepensis [19]. Furthermore, the molecular/genetic changes that brought about the shift in flavonoid profiles during domestication were investigated thoroughly. For instance, FLS, ANS, CHS, CHI, F3H and LAR showed dramatic expression changes in Chinese plum during domestication [9]. ANR, CYP98A, CYP73A, UGT88F and FLS were significantly upregulated in wild loquats [20]. OsCHS, OsCHI, OsF3′H, OsF3H, OsDFR and OsANS were downregulated in cultivated rice [21], and two internal stop codon mutations of OsDFR led to its deficiency in some rice varieties [21]. Recent studies reported that the loss of anthocyanin pigmentation in most cultivated rice varieties is attributed to the artificial selection of specific null mutations in OsC1 and OsRb, which are members of the R2R3-MYB and bHLH transcription factors, respectively [21,22]. Two transcription factors (MADS1/2) and a glycosyltransferase (UFGT3) involved in flavonoid biosynthesis were also selected during buckwheat domestication [23].
The present study aimed to provide a comprehensive overview of the genetic and metabolic mechanisms underlying the differences in flavonoid profiles between cultivated and wild green jujube. To achieve this, genomic, transcriptomic, and metabolite comparisons of the flavonoid profiles were conducted for cultivated and wild green jujube, which exhibited significant differences. The study identified flavonoid-related genes, key metabolite differences, and associated transcription factors that potentially drive the variations in flavonoid profiles between wild and cultivated green jujube. Collectively, this study offers a valuable resource and identifies candidate regulators for optimizing fruit quality. These findings can be further explored through exhaustive functional characterization and subsequently applied in fruit crop improvement programs.

2. Materials and Methods

2.1. Genome-Wide Identification of Genes Related to Flavonoid Biosynthetic Pathways in Green Jujube

First, the study retrieved the four haplotype sets of genome data of wild (“XSYS”) and cultivated (“Misi”) green jujube, including the mRNA, CDS, protein and GFF3 files, from the latest sequencing data released by Guo et al. [24] at figshare (https://doi.org/10.6084/m9.figshare.23530068, accessed on 12 November 2024).
The study used the Python package “GFAnno” (https://github.com/qunjie-zhang/gfanno, accessed on 6 January 2025) [25], which is an open-source software package that annotates 18 key genes related to the flavonoid biosynthesis pathways, to search the protein sequences in cultivated and wild green jujube. These genes were 4-coumarate: coenzyme a ligase (4CL), anthocyanidin reductase (ANR), anthocyanidin synthase (ANS), trans-cinnamate 4-monooxygenase (C4H), chalcone isomerase (CHI), chalcone synthase (CHS), dihydroflavonol 4-reductase (DFR), flavanone 3-hydroxylase (F3H), flavonoid 3′-hydroxylase (F3′H), flavonoid 3′5′-hydroxylase (F3′5′H), flavonol synthase (FLS), flavone synthase II (FNSII), leucoanthocyanidin reductase (LAR), leucoanthocyanidin dioxygenase (LDOX), phenylalanine ammonia lyase (PAL), polyphenol oxidase (PPO), serine carboxypeptidase-like (SCPL4 and SCPL5) and UDP-glycosyltransferase (UGT84A).
The protein sequences of these genes were aligned via ClustalW; the multiple sequence alignment results were further modified by TrimAL [26]; and the evolutionary tree was constructed using the neighbor-joining (NJ) method in MGEA 12 software [27], where the bootstrap value was set as 1000. Then, the tvBOT online tool (https://www.chiplot.online/tvbot.html, accessed on 12 March 2025) [28] was used to enhance the evolutionary tree.

2.2. Transcriptomic Profiles in Different Tissues and Fruits

The raw RNA-seq data of different tissues of green jujube accessions were downloaded from the Sequence Read Archive (SRA) database of the National Center for Biotechnology Information (NCBI) using the SRA toolkit. In detail, the stone (a hard woody tissue layer surrounding the seed), fruit, branch and leaf of cultivated green jujube “Misi” are labeled as SRR24951744, SRR24951746, SRR24951742 and SRR24951745, respectively. The root, enlarged fruit, mature fruit, branch and leaf are labeled as SRR24951739, SRR24951738, SRR24951741, SRR24951737 and SRR24951740, respectively, in wild green jujube “XSYS”.
In addition, the transcriptome data of mature fruit in six different cultivated green jujube accessions, namely, M18 (SRR24951646, SRR24951645 and SRR24951644), M25 (SRR24951643, SRR24951642 and SRR24951641), M28 (SRR24951640, SRR24951638 and SRR24951702), M31 (SRR24951639, SRR24951763 and SRR24951762), M46 (SRR24951761, SRR24951760 and SRR24951759) and M47 (SRR24951758, SRR24951757 and SRR24951756), was retrieved from the SRA; the transcriptome data of mature fruit in three different wild green jujube accessions, namely, M58 (SRR24951755, SRR24951753 and SRR24951752), M60 (SRR24951751 and SRR24951750, only two replicates found) and M74 (SRR24951749, SRR24951748 and SRR24951747), was also retrieved from the SRA.
The six cultivated accessions, which were selected from Guangdong and Guangxi (China), represent the elite cultivars in main production areas in Southern China and have undergone decades of farmer selection for fruit size and quality traits. Three wild accessions collected from the undeveloped regions of Xishuangbanna and Nanning (China) are morphologically distinguishable from the cultivated accessions and were sampled > 20km from any commercial orchard to minimize the gene flow. Together, these nine accessions cover the primary domestication spots proposed for green jujube. The detailed information of these nine green jujube accessions is listed in Table S1.
The FastQC tool (http://www.bioinformatics.babraham.ac.uk/projects/fastqc/, accessed on 16 March 2025) was used to check the quality of the raw sequencing data, and fastP (https://github.com/OpenGene/fastp, accessed on 17 March 2025) [29] was used to trim the adapter and low-quality base. Then, the clean reads were aligned to genomes of the wild and cultivated green jujube using Kallisto software (v0.51.1) (https://github.com/pachterlab/kallisto, accessed on 20 March 2025) [30], which is better for obtaining faster and more accurate results, to quantify the transcript abundances.
Transcripts per kilobase million (TPM) were used to quantify the gene expression levels. The TPM value was processed with log2 (TPM + 1) to obtain the expression heatmap using TBtools-II [31]. A log2 (TPM + 1) value < 1 signified a gene not being expressed. The tissue specificity index (TAU) of genes was calculated using the online tool tspex (https://tspex.lge.ibi.unicamp.br/, accessed on 5 April 2025). The TAU index indicates how specifically or broadly expressed a gene or transcript is within tissues. Genes with a TAU index close to 1 are specifically expressed in one tissue, while genes with a TAU index closer to 0 are equally expressed across all tissues [32].

2.3. Weighted Gene Co-Expression Network Analysis (WGCNA) and Gene Evolution Analysis

To further investigate the potential regulatory network, this study first used the cI genome as a reference to obtain the expression profiles from SRA data of wild fruits and then merged the expression profiles of the cultivated and wild fruits into an expression matrix to perform a weighted gene co-expression network analysis (WGCNA). Second, the study identified the homologous genes between the Zmc and Zmw genomes using the OrthoFinder v2.5.5 (https://github.com/davidemms/OrthoFinder, accessed on 14 December 2024) [33] to obtain the corresponding gene. Finally, the homologous genes identified replaced the cI annotation in wild fruits to achieve a real expression profile.
WGCNA was conducted to identify modules of highly correlated genes [34]. Based on the expression profiles from the fruits of different green jujubes mentioned above, we constructed a WGCNA network using the R package “WGCNA-shinyApp” (https://github.com/ShawnWx2019/WGCNA-shinyApp, accessed on 20 April 2025) [35] to pinpoint the modules most relevant to flavonoid-related genes. Initially, a correlation matrix was generated, followed by the selection of an optimal soft threshold to transform the correlation matrix into an adjacency matrix. A topological overlap matrix (TOM) was then derived from the adjacency matrix. Leveraging the TOM-based dissimilarity metric, genes with similar expression patterns were clustered into modules via average linkage hierarchical clustering.
MCScanX [36] software was used to investigate the synteny, collinearity and gene duplication patterns of flavonoid-related genes with default parameters. KaKs_Calculator 3.0 [37] was used to calculate the synonymous (Ks) and nonsynonymous (Ka) mutation rates of the duplicated gene pairs and then measure the selection pressure during evolution [37]. The divergence time was calculated using the formula T = Ks/2r, where T is the divergence time in millions of years (Mya), and r is the substitution rate constant for dicotyledonous plants, which is 1.5 × 10⁻⁸ substitutions per site per year, and Ks is the synonymous substitution rate per site [38].

2.4. Metabolomic Profiles in Different Fruits

The metabolome data of mature fruit in six different cultivated (M18, M25, M28, M31, M46 and M47) and three different wild green jujube accessions (M58, M60 and M74) was retrieved from MetaboLights database with the identifier MTBLS10827 (https://www.ebi.ac.uk/metabolights/editor/study/MTBLS10827, accessed on 16 December 2024) released by Guo et al. [24]. Then, the R package MetMiner (https://github.com/ShawnWx2019/MetMiner, accessed on 20 April 2025) [35] was used to further analyze the metabolic data.
Principal component analysis (PCA), hierarchical cluster analysis and orthogonal partial least squares discriminant analysis (OPLS-DA) were performed on these fruits to demonstrate the differences between the cultivated and wild fruits. Differential metabolites were identified by integrating the p-value, fold change and variable importance in projection (VIP) values derived from the OPLS-DA model. The screening criteria were set as fold change ≥ 2 or ≤0.5, p < 0.05 and VIP > 1. Raincloud plots were drawn using the online tool Raincloud-shiny (https://shiny.hiplot.cn/raincloud-shiny/, accessed on 6 May 2025) [39].

2.5. Statistical Analysis

The R package “rstatix” (https://rpkgs.datanovia.com/rstatix/, accessed on 12 May 2025) was used to conduct the Wilcoxon rank-sum test, Kruskal–Wallis and correlation analyses, and the p-values were adjusted using the Benjamini–Hochberg method to control the false discovery rate.

3. Results

3.1. Flavonoid-Related Gene Families Differed Between Wild and Cultivated Green Jujube Genomes

Based on the four haplotype genomes in both the wild and cultivated green jujube, the study identified the genes 4CL, ANR, ANS, C4H, CHI, CHS, DFR, F3H, F3′H, F3′5′H, FLS, FNSII, LAR, PAL, PPO and UGT84A using the GFAnno package. However, the genes LDOX, SCPL4, and SCPL5 were not found (Figure 1a). In detail, 189 members of the flavonoid-related gene families were identified in the cultivated green jujube and 209 members in the wild green jujube. The related information of these genes is listed in Table S2. Among these genes, 28 4CL, 4 ANR, 10 ANS, 11 C4H, 8 CHI, 20 CHS, 8 DFR, 4 F3H, 2 F3′H, 5 F3′5′H, 6 FLS, 7 FNSII, 45 LAR, 13 PAL, 10 PPO and 8 UGT84A genes were found in the cultivated green jujube (Figure 1a); similarly, 34 4CL, 4 ANR, 11 ANS, 9 C4H, 8 CHI, 19 CHS, 7 DFR, 4 F3H, 2 F3′H, 4 F3′5′H, 6 FLS, 5 FNSII, 56 LAR, 14 PAL, 11 PPO and 12 UGT84A genes were found in the wild green jujube (Figure 1a). It is obvious that the LAR gene family was the largest member in the flavonoid pathway genes in the wild and cultivated green jujube; second was the CHS gene family; and the ANR, F3H, F3′H and F3′5′H gene families were the smallest (Figure 1a).
Generally, the copy numbers of most flavonoid-related genes were significantly reduced during domestication (Figure 1a). For instance, the LAR gene copy number decreased from 56 to 45 during domestication, and the 4CL copy number also decreased from 34 to 28. In contrast, the copy numbers of several genes, such as C4H, CHS, DFR, F3′5′H and FNSII, slightly increased (by 1 or 2) during domestication (Figure 1a). Interestingly, the copy numbers of ANR, CHI, F3H, F3′H and FLS remain unchanged (Figure 1a), indicating their high conservation during domestication.
Moreover, the distribution of these genes between the four haplotype genomes was very uneven. Here, the letters “c” and “w” signify the cultivated and wild green jujube, respectively, and the letters “I”, “II”, “III” and “IV” signify the four haplotype genomes, respectively. As shown in Figure 1b–i, the copy numbers of most gene families were completely irregular between the four haplotype genomes (cI, cII, cIII and cIV) of the cultivated green jujube, except for the ANR, CHI, DFR and F3H gene families, which displayed the same copy numbers in all four haplotype genomes. For example, the copy numbers of the UGT84A gene were 2, 2, 1 and 2 in the cI, cII, cIII and cIV genomes, respectively, and the LAR copy numbers also varied from 10 to 13 in these four haplotype genomes. Unsurprisingly, an unequal distribution of copy numbers in flavonoid-related genes also occurred in the wild green jujube (Figure 1b–i). Likewise, the copy numbers of the LAR gene family in the wild green jujube genome ranged from 12 to 17, except for the ANR, CHI, F3H and UGT84A gene families.
Specifically, the total numbers of 4CL, ANS, CHS, F3′H, FLS and PPO genes were equal respectively in two haplotype genomes cI-cII and cIII-cIV, and the total numbers of FLS and PAL were also respectively equal in two haplotype genomes wI-wII and wIII-wIV. Therefore, based on the distribution characteristics of flavonoid-related genes, it was clear that cI-cII, cIII-cIV, wI-wII and wIII-wIV originated from a chromosome doubling event in its diploid ancestor, which is consistent with the findings provided by the Guo et al. [24]. To summarize, in total, 54 flavonoid-related genes were found in the cI genome, 50 flavonoid-related genes in the cII genome, 41 genes in the cIII genome, 44 in the cIV genome, 57 in the wI genome, 49 in the wII genome, 48 in the wIII genome and 52 in the wIV genome (Figure 1j).

3.2. Evolutionary Analysis Revealed the Complexity of Flavonoid-Related Genes During Domestication

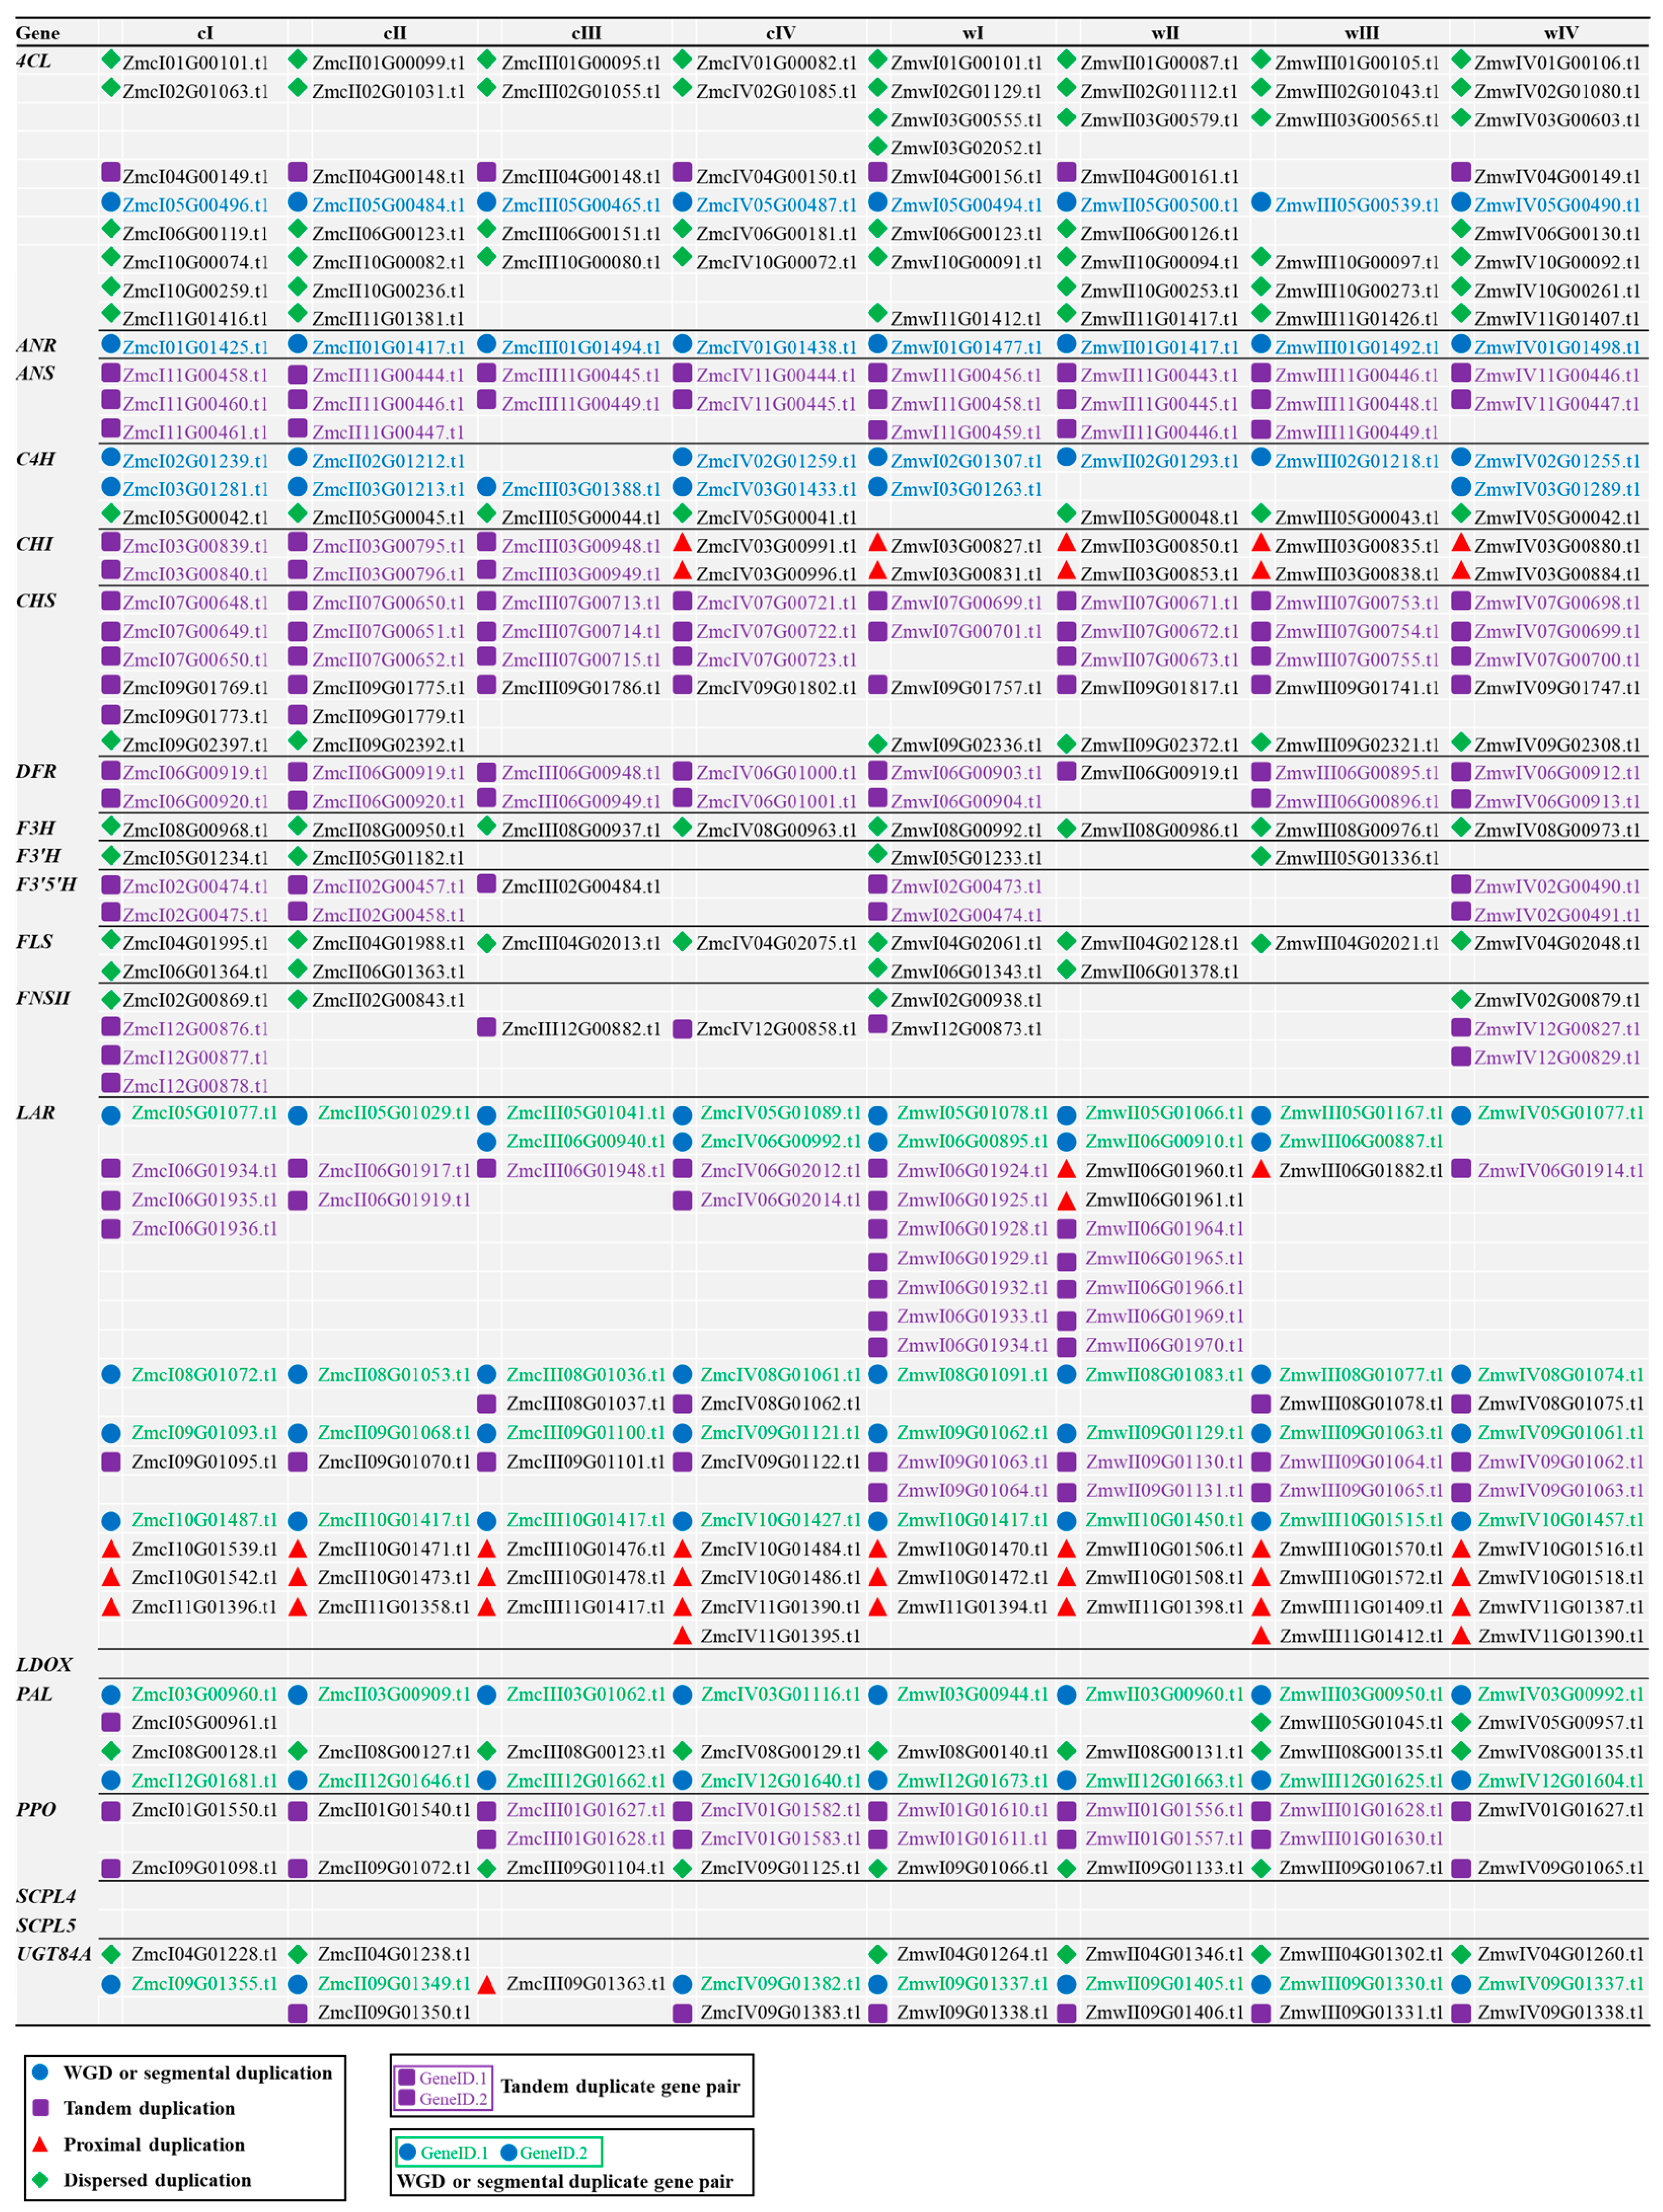
To investigate the evolution model of flavonoid-related genes, we conducted a collinearity analysis between the wild and cultivated green jujube (Figure 2 and Figure S1). In general, tandem duplication was the predominant duplication event among all the flavonoid-related genes in the wild and cultivated green jujube, followed by dispersed duplication and whole-genome duplication (WGD), and proximal duplication was the lowest. Remarkably, the arrangement pattern of the four duplication events was similar between the four haplotype genomes of the wild green jujube (Figure S1). However, there was a little difference in the genomes of the cultivated green jujube; i.e., the number of genes with dispersed duplication was more than the genes with WGD in the cI-cII genomes. In contrast, in the cIII-cIV genomes, the number of genes with dispersed duplication was less than those with WGD. This observation further specifies that a chromosome doubling event occurred and the flavonoid-related genes from the cultivated green jujube suffered domestication pressures.
The detailed inspection of duplication events of flavonoid-related gene families demonstrated their distinct evolution characteristics (Figure 2). Most of the 4CL genes identified was found to be dispersed except for only two sets of homologous genes (for example, ZmcI04G00149.t1 and ZmcI05G00496.t1 in the cI genome). All the ANR genes showed WGD and collinearity between the wild and cultivated green jujube. Furthermore, all the ANS genes showed tandem duplication. Two groups of C4H genes showed WGD through the wild and cultivated green jujube and one set of genes showed dispersed duplication. The duplicated events of CHI genes were completely different between the wild and cultivated green jujube, with tandem duplication observed in cI, cII and cIII, but proximal duplication observed in the cIV, wI, wII, wIII and wIV genomes. Most CHS genes showed tandem duplication and only one set of genes showed dispersed duplication. All the DFR genes showed tandem duplication. Both the F3H and F3′H genes in all the genomes showed dispersed duplication. However, the F3′5′H genes showed tandem duplication and the FLS genes showed dispersed duplication. Most FNSII genes showed tandem duplication but only one set of genes were dispersed. In the LAR gene family, which was the largest, there were three duplication events: whole-genome, tandem and proximal duplications. The same three duplication events were found in the PAL gene family. Lastly, PPO genes exhibited two types of duplication events (tandem and dispersed), and the duplication events of UGT84A were evenly distributed throughout all four events.
To elucidate the phylogenetic relationship between these gene family members in the four haplotype genomes, this study further constructed nine phylogenetic trees (Figure 3 and Figure S2), including 4CL, CHI, CHS, PAL, PPO, UGT84A and three superfamilies. FNSII, F3′5′H, F3′H and C4H are members of the cytochrome P450-dependent monooxygenase (P450) superfamily; F3H, FLS and ANS belong to the 2-oxoglutarate-dependent dioxygenase (2-OGD) superfamily; and DFR, ANR and LAR belong to the short-chain dehydrogenase/reductase (SDR) superfamily. Herein, using CHS and P450 as two cases, the CHS genes were clustered into three groups: I, II and III (Figure 3a). Groups II and III only contained the members in chromosomes 9 and 7, respectively, which were consistent with their tandem and dispersed duplication events. However, group I contained mixed members from chromosomes 9 and 7. In detail, ZmcI07G00649.t1 and ZmcI07G00650.t1 were closely linked in a chromosome but they clustered into groups III and I, respectively, even though the evolutionary analysis showed they were tandem duplicated. The same results were also found in ZmwIII07G00754.t1 and ZmwIII07G00755.t1. On the other hand, the genes in cultivated or wild fruits did not cluster into one group; for example, ZmwIII09G01741.t1 did not cluster with the homologous genes in the wild fruit (ZmwI09G01757.t1, ZmwII09G01817.t1 and ZmwIV09G01747.t1, which were clustered), but clustered closer to homologous genes in the cultivated fruit. Regarding the P450 superfamily (Figure 3b), the different gene families, such as FNSII, F3′5′H, F3′H and C4H, obviously clustered into their distinct groups, and inside their gene families, the results mentioned above were also found. The remaining phylogenetic results of other gene families are included in the Supplementary Materials (Figure S2). These suggest the complicated evolution relationships of flavonoid-related genes in green jujube due to gene duplication events and domestication pressure.

3.3. Gene “Loss and Gain” in Wild and Cultivated Green Jujube Genomes

It was noticed that a lot of flavonoid-related genes in the wild green jujube were “lost” during domestication and only a limited number of gene families “gained” more members during this process. For example, many homologous genes of the LAR family were missing in the cultivated green jujube compared with the wild green jujube. Several tandem-duplicated LAR genes (ZmwI06G01928.t1, ZmwI06G01929.t1, ZmwI06G01932.t1, ZmwI06G01933.t1 and ZmwI06G01934.t1) were missing in the cultivated genomes. In contrast, the 4CL gene family gained one more member in the cultivated than in the wild genomes: ZmcI04G00149.t1 (cI), ZmcII04G00148.t1 (cII), ZmcIII04G00148.t1 (cIII), ZmcIV04G00150.t1 (cIV) in chromosome 4; however, only three homologous members were found in the wild genomes, i.e., ZmwI04G00156.t1 (wI), ZmwII04G00161.t1 (wII) and ZmwIV04G00149.t1 (wIV), which implied one gene without a high-confidence 4CL conserved domain evolved into a 4CL gene under selection, accompanied by a sequence mutation. Furthermore, the types of duplication events of several gene families were also changed throughout the domestication process. For illustration, the CHI genes showed tandem duplication in cI, cII and cIII, but proximal duplication in the cIV, wI, wII, wIII and wIV genomes. One UGT84A gene member, i.e., ZmcIII09G01363.t1, showed proximal duplication in the cIII genome, even though other homologues genes showed WGD. These results indicate domestication has a significant effect on the evolution of flavonoid-related genes in green jujube.
The Ka/Ks ratio (nonsynonymous substitution rate/synonymous substitution rate) is a widely utilized metric for evaluating the selective pressure and evolutionary rate. Specifically, a Ka/Ks ratio of 1 indicates neutral selection, a ratio greater than 1 signifies positive selection accompanied by accelerated evolution, and a ratio less than 1 suggests purifying selection under functional constraints [40]. In this study, almost all homologous flavonoid-related gene pairs between the wild and cultivated green jujube exhibited Ka/Ks ratios below 1 (Table S3), indicating that the flavonoid-related gene families experienced strong purifying selection (or negative selection) during domestication in the green jujube genome. However, there were two gene pairs (ZmcI12G00876.t1/ZmwI12G00873.t1 and ZmcIII08G01036.t1/ZmwIII08G01077.t1, belonging to the FNSII and LAR gene families, respectively) whose Ka/Ks ratio > 1, demonstrating their positive selection. Notably, not all the gene pairs’ Ka/Ks ratios could be calculated because the Ka and Ks values were zero, which indicates that the sequences between gene pairs were too highly conserved (or complete identical) and thus lacked substitutions.
Simultaneously, the divergence times of all the duplicated gene pairs ranged from 0.09 to 113.14 Mya (Table S3). These findings indicate that the “loss and gain” of flavonoid-related gene families resulted from multiple selective forces during the domestication process of green jujube.

3.4. Flavonoid-Related Genes Exhibited Tissue-Specific Expression Profiles

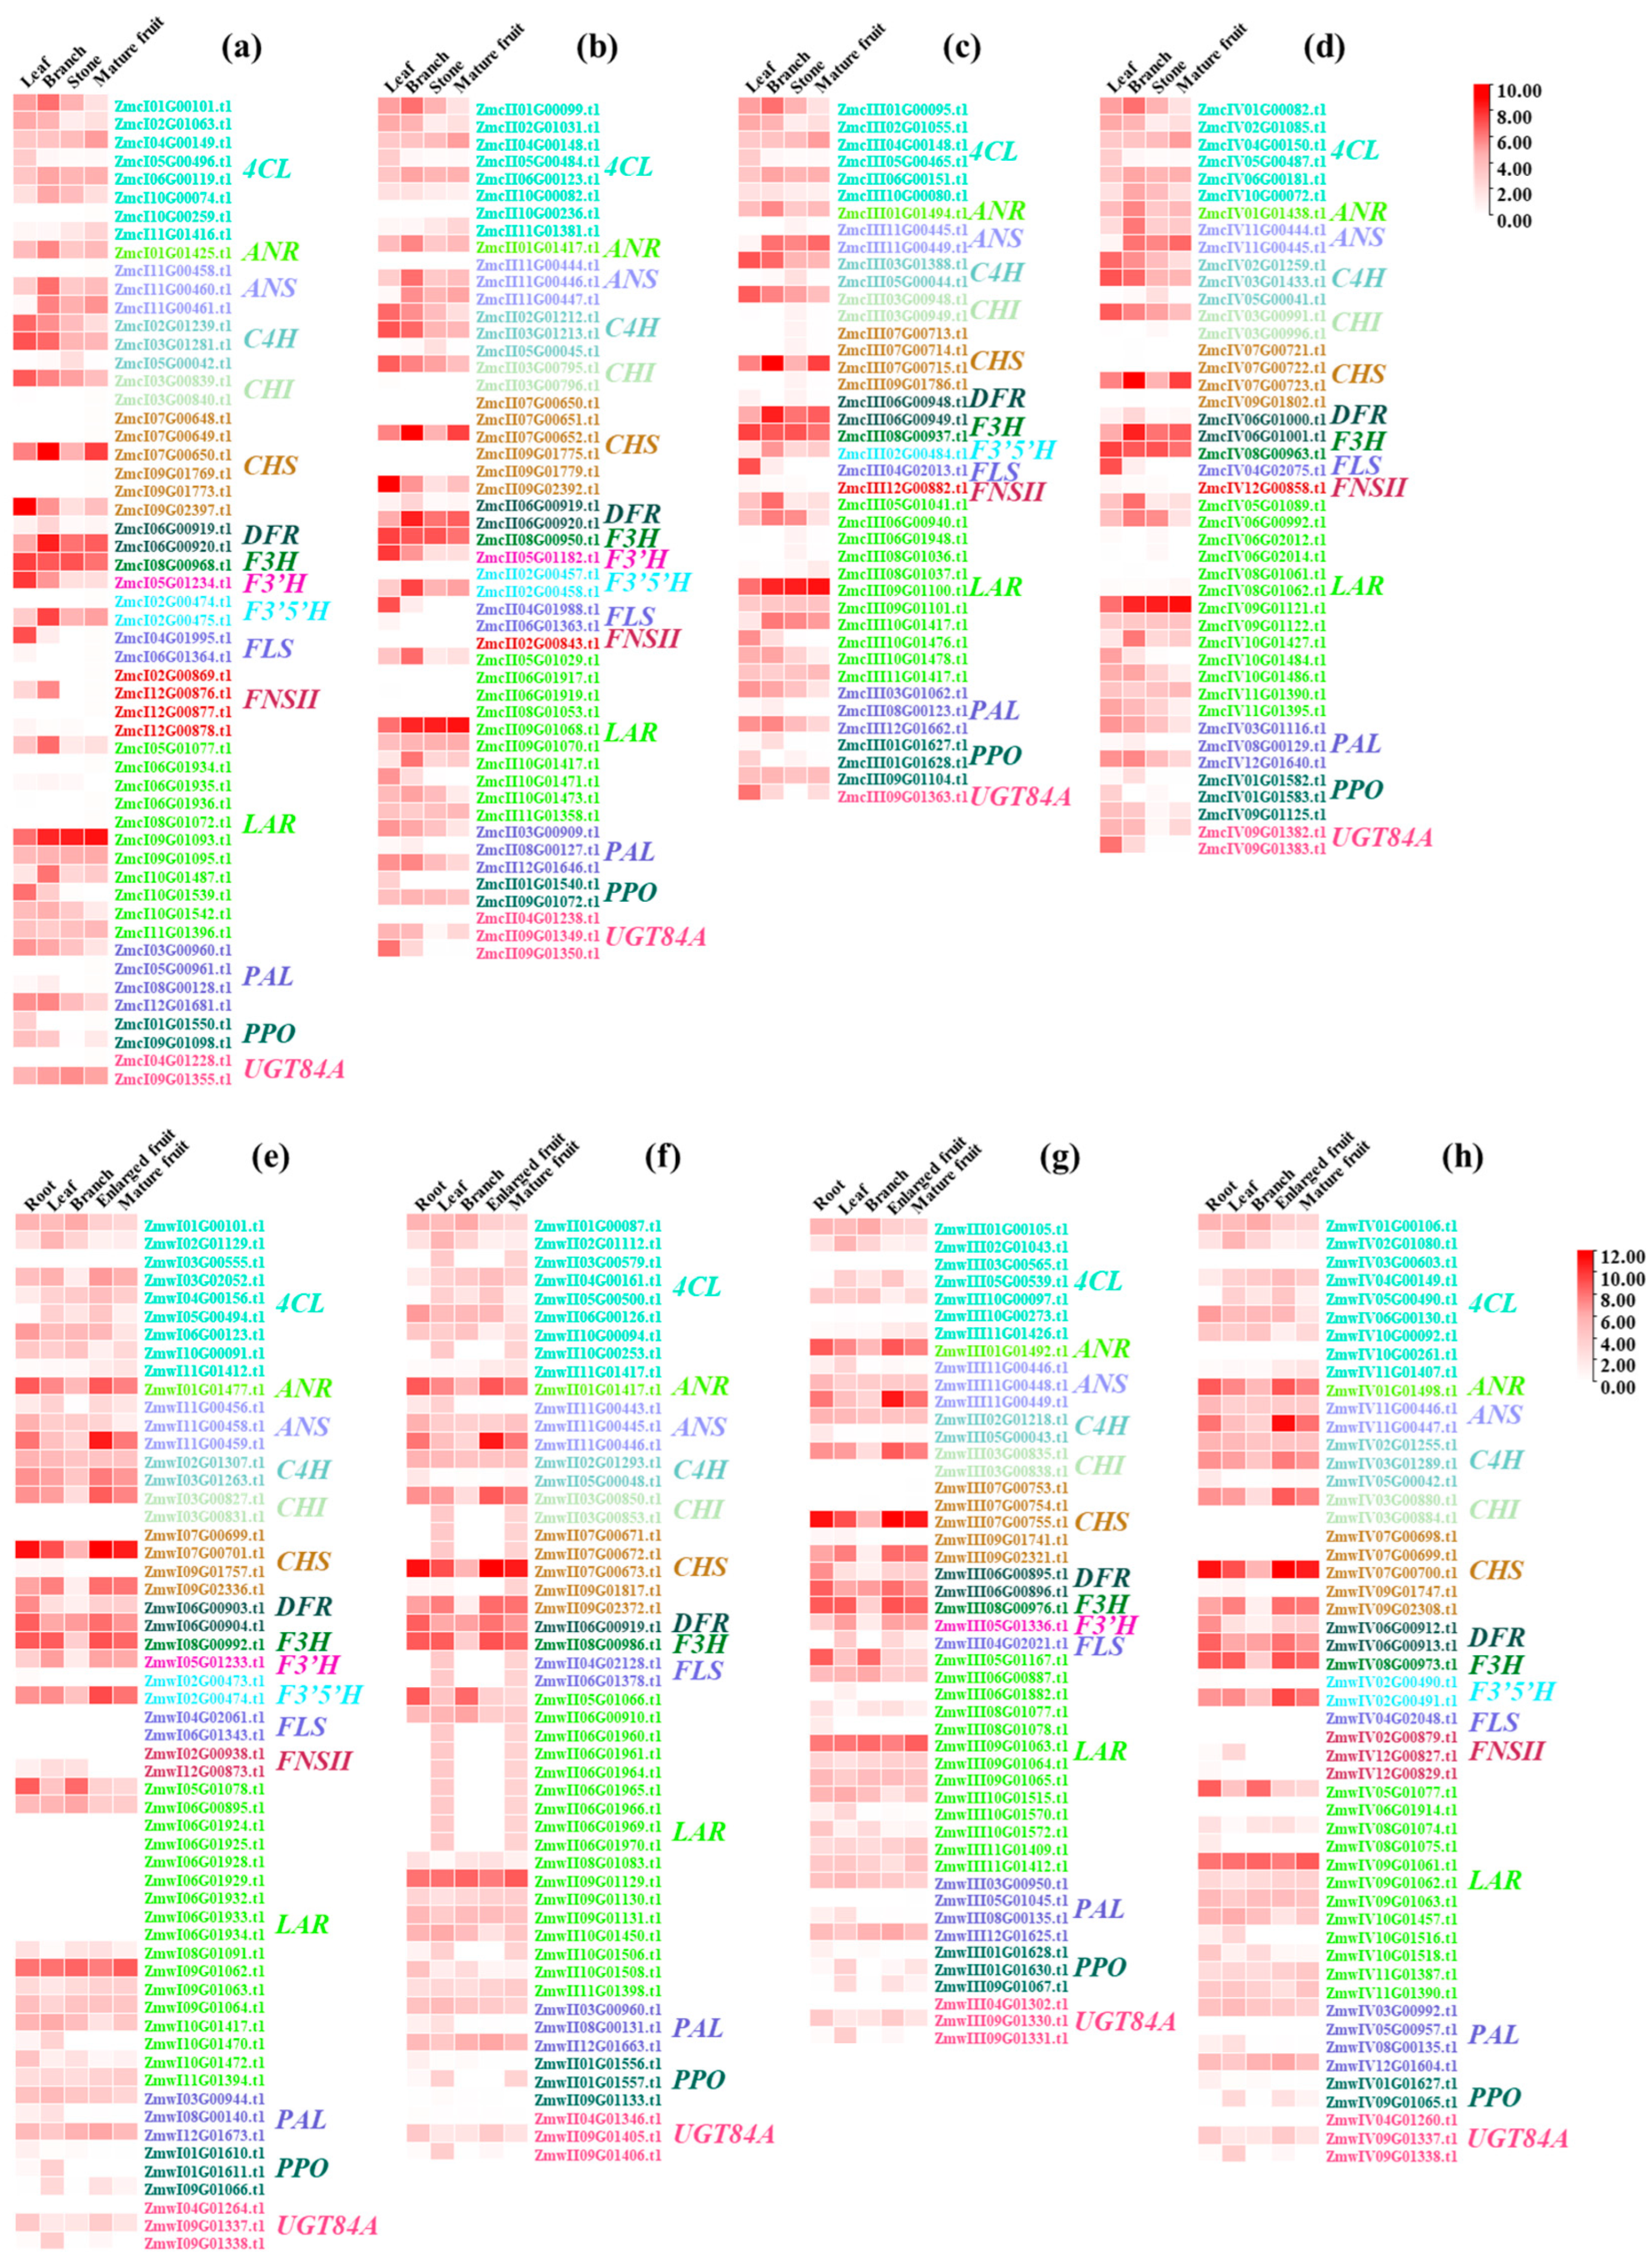
The study examined the expression profiles of identified flavonoid-related genes in different tissues from the wild and cultivated green jujube. The expression patterns of the flavonoid-related genes were tissue-specific (Figure 4 and Table S2). Some genes exhibited expressions in all the tissues, namely, the leaf, branch, stone and mature fruit of the cultivated green jujube and the root, leaf, branch, enlarged fruit and mature fruit of the wild green jujube. For instance, the expression value of ZmcI08G00968.t1 (one member of the Zmc-F3H gene family) was more than 50 in all the tissues (Figure 4 and Table S2), and some genes only expressed in specific tissues, such as ZmcI09G02397.t1 (one member of the Zmc-CHS gene family), which significantly expressed in the leaf and had nearly no expression in the stone (Figure 4 and Table S2). Additionally, a large portion of the genes showed entirely no expression in all the tissues (Figure 4 and Table S2). For example, 8 out of 17 members of the LAR gene family in wI were not expressed in any tissue.

3.5. Functional Flavonoid-Related Genes Were Screened Out in the Wild and Cultivated Green Jujube

Usually, when a specific gene has an expression value < 1 in specific tissue at a specific developmental stage, this means that this gene may not play a role in this specific tissue. Therefore, to facilitate the downstream analyses, we operationally classified flavonoid-related genes into two provisional groups: genes with TPM ≥ 1 in at least one tissue were labelled “functional”, whereas genes with TPM < 1 across all examined tissues were labelled “redundant”. This terminology is purely technical and does not imply biological activity or functional redundancy. Based on the criteria, all the flavonoid-related genes were further filtered through the transcriptomic data. Finally, the study screened out 138 functional genes from the 189 genes identified in the cultivated green jujube and 158 functional genes from the 209 genes identified in the wild green jujube (Figure 1j). The number of members of each gene family decreased by varying degrees (Figure 1b–i), indicating the complexity of functional genes. Obviously, the number of members in the CHS gene family reduced significantly after screening, for instance, from 6 to 2 in the cI genome and 4 to 2 in the wI genome.
Specifically, 18 genes were redundant and 36 genes were functional in the cI genome, while the functional genes totaled 36 in the cII genome, 32 in the cIII genome and 36 in the cIV genome (Figure 1j). The number of functional genes were 41, 36, 40 and 41 in the wI, wII, wIII and wIV genomes, respectively (Figure 1j). Figure 1b–i shows that the distribution of functional flavonoid-related genes in all the haplotype genomes presented analogous patterns. 4CL and LAR were still the largest functional gene families, and the numbers of functional genes in every gene family in each genome were still uneven. After filtering, we renamed the gene ID with a uniform gene symbol based on their gene family and chromosome location (Table S2).
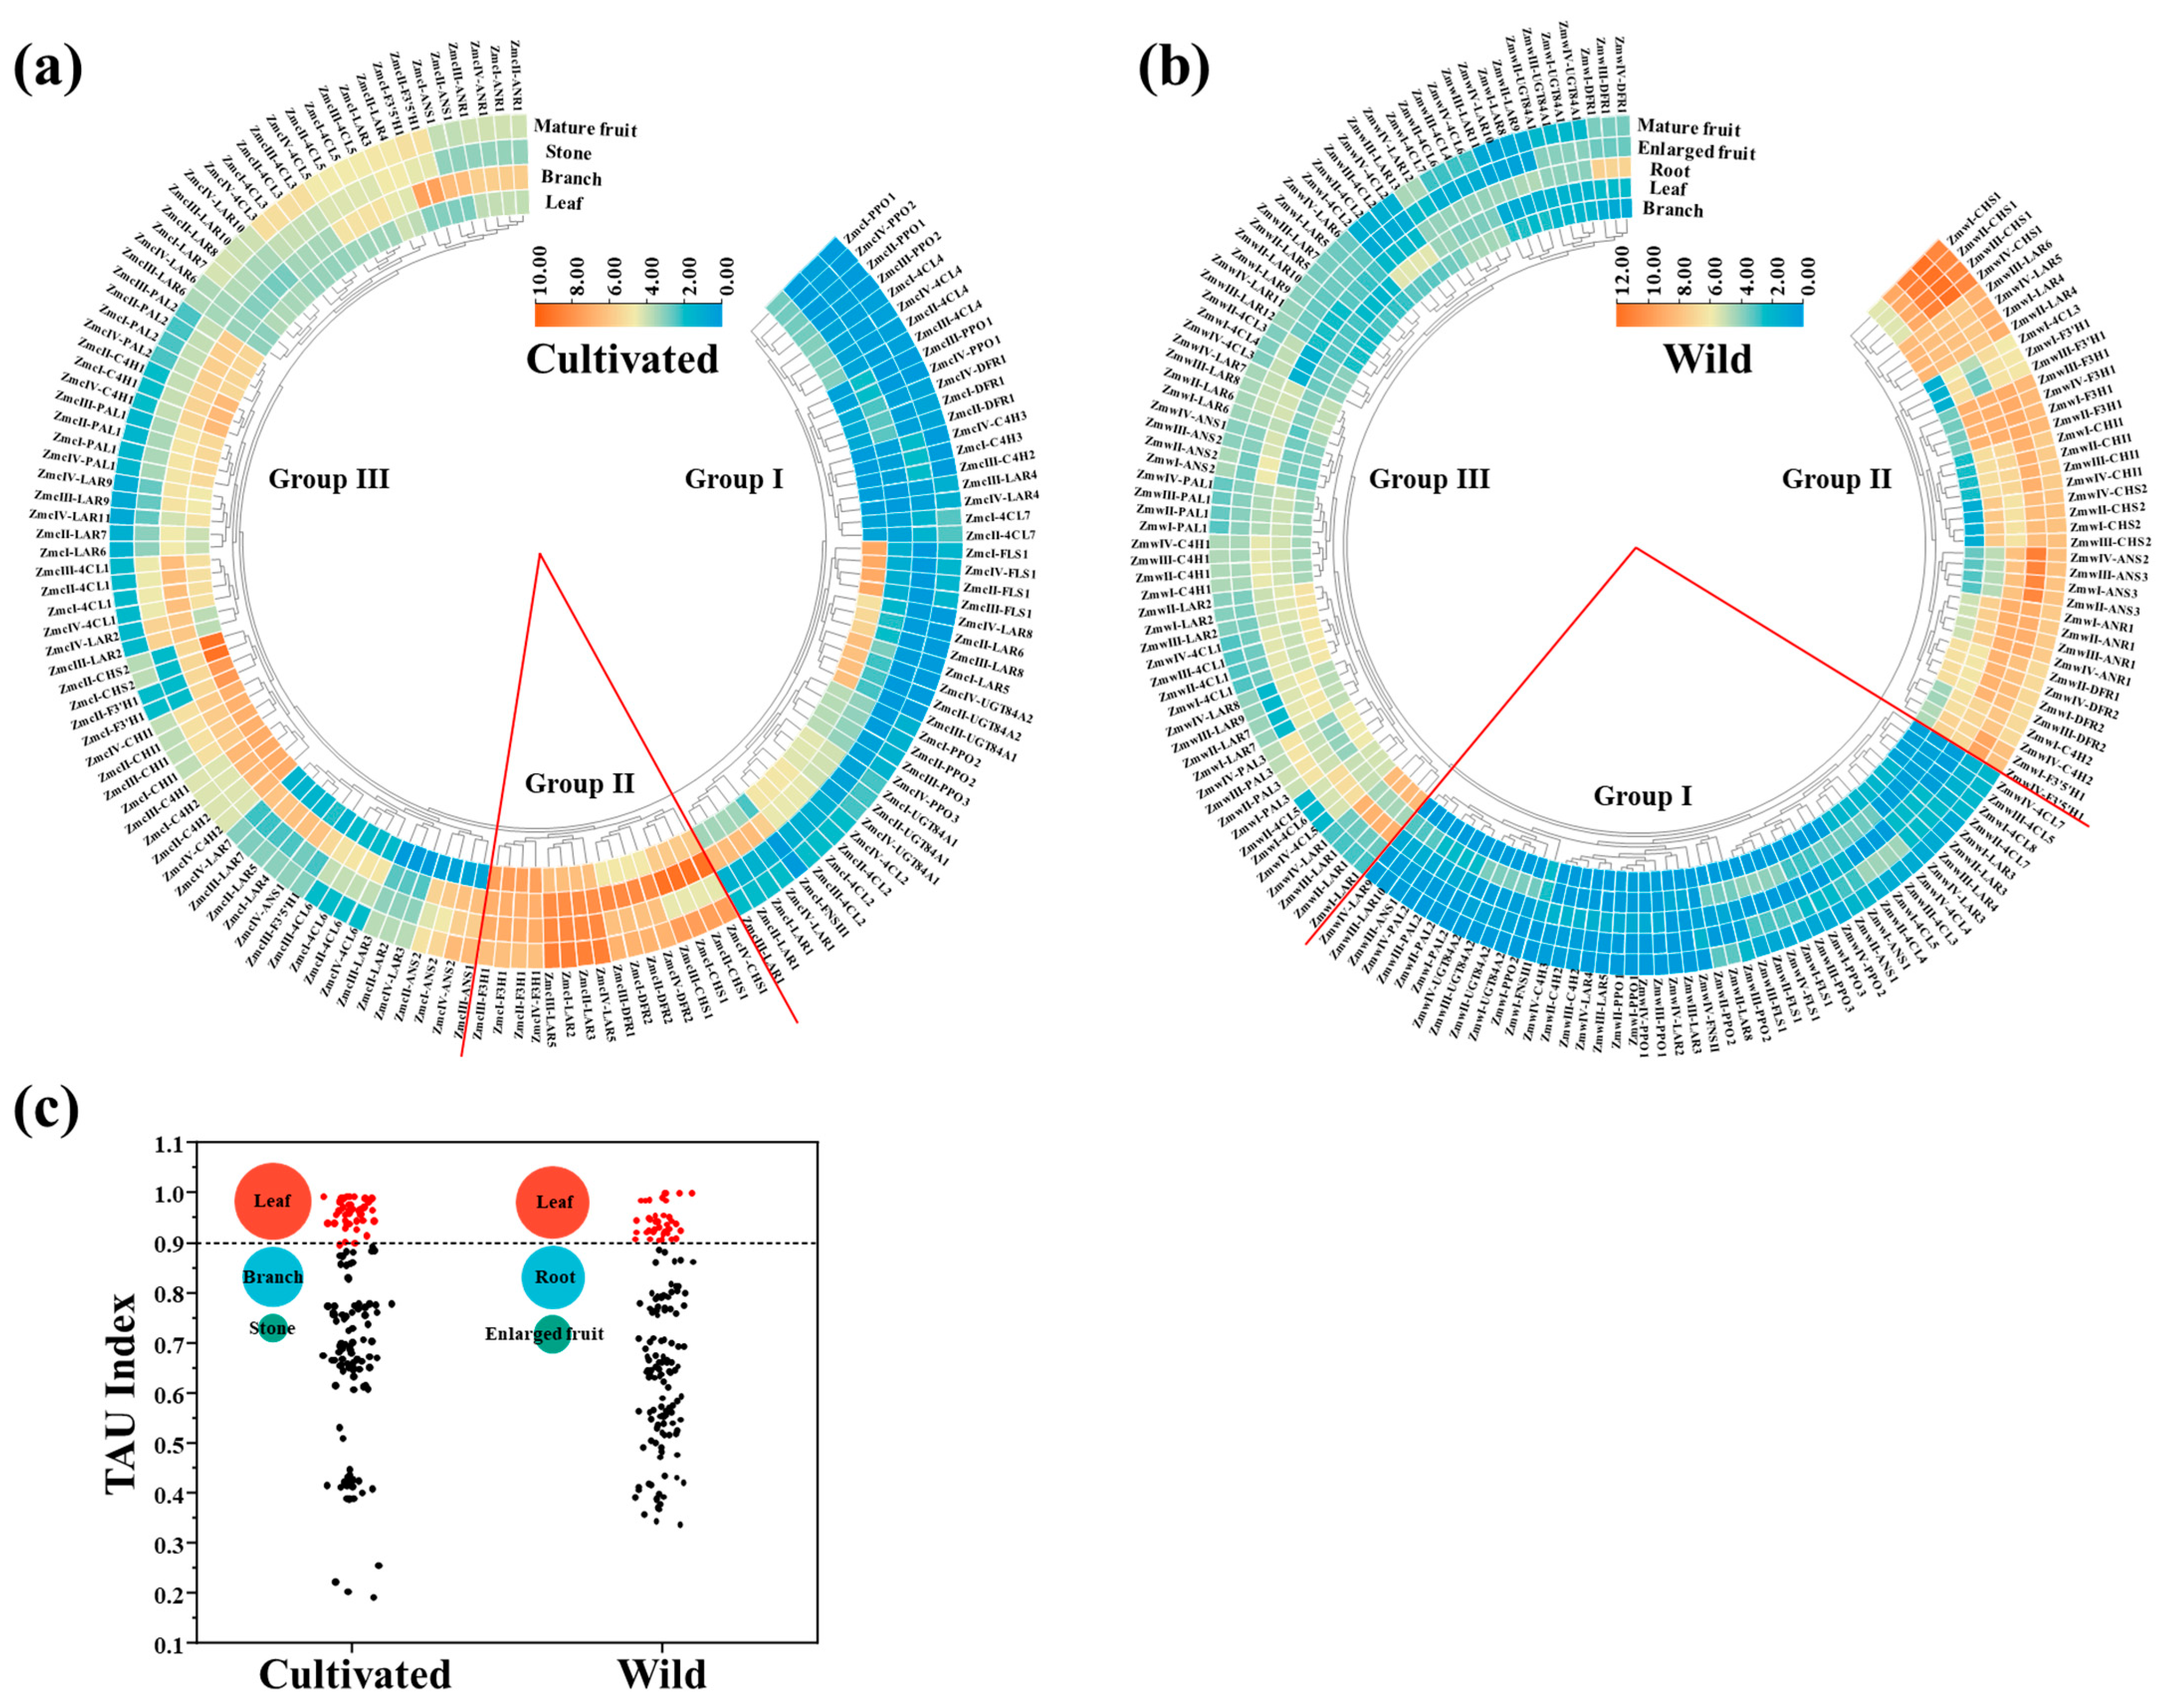
The study again analyzed the expression profiles of the functional flavonoid-related genes in different tissues of cultivated and wild green jujube (Figure 5a,b). Based on the cluster analysis, the expression patterns could be roughly divided into three different groups in the cultivated and wild green jujube (groups I, II and III). In group I, the functional flavonoid-related genes expressed very low levels in all the tissues; in group II, the functional flavonoid-related genes presented high expressions in all the tissues; and in group III, the functional flavonoid-related genes expressed a medium level in most of the tissues (not all the tissues) (Figure 5a,b).
The study further calculated the tissue specificity indices (TAUs) of the functional flavonoid-related genes (Figure 5c). The results demonstrate that 23 out of the 40 genes with TAU > 0.9 were enriched in the leaf tissue of the cultivated green jujube, followed by the branch, and 19 out of the 38 genes with TAU > 0.9 were also enriched in the leaf of the wild green jujube, followed by the root. Therefore, the leaves of green jujube are another rich source of flavonoid compounds, as well as the fruit.

3.6. Functional Flavonoid-Related Genes Were Downregulated in Cultivated Green Jujube

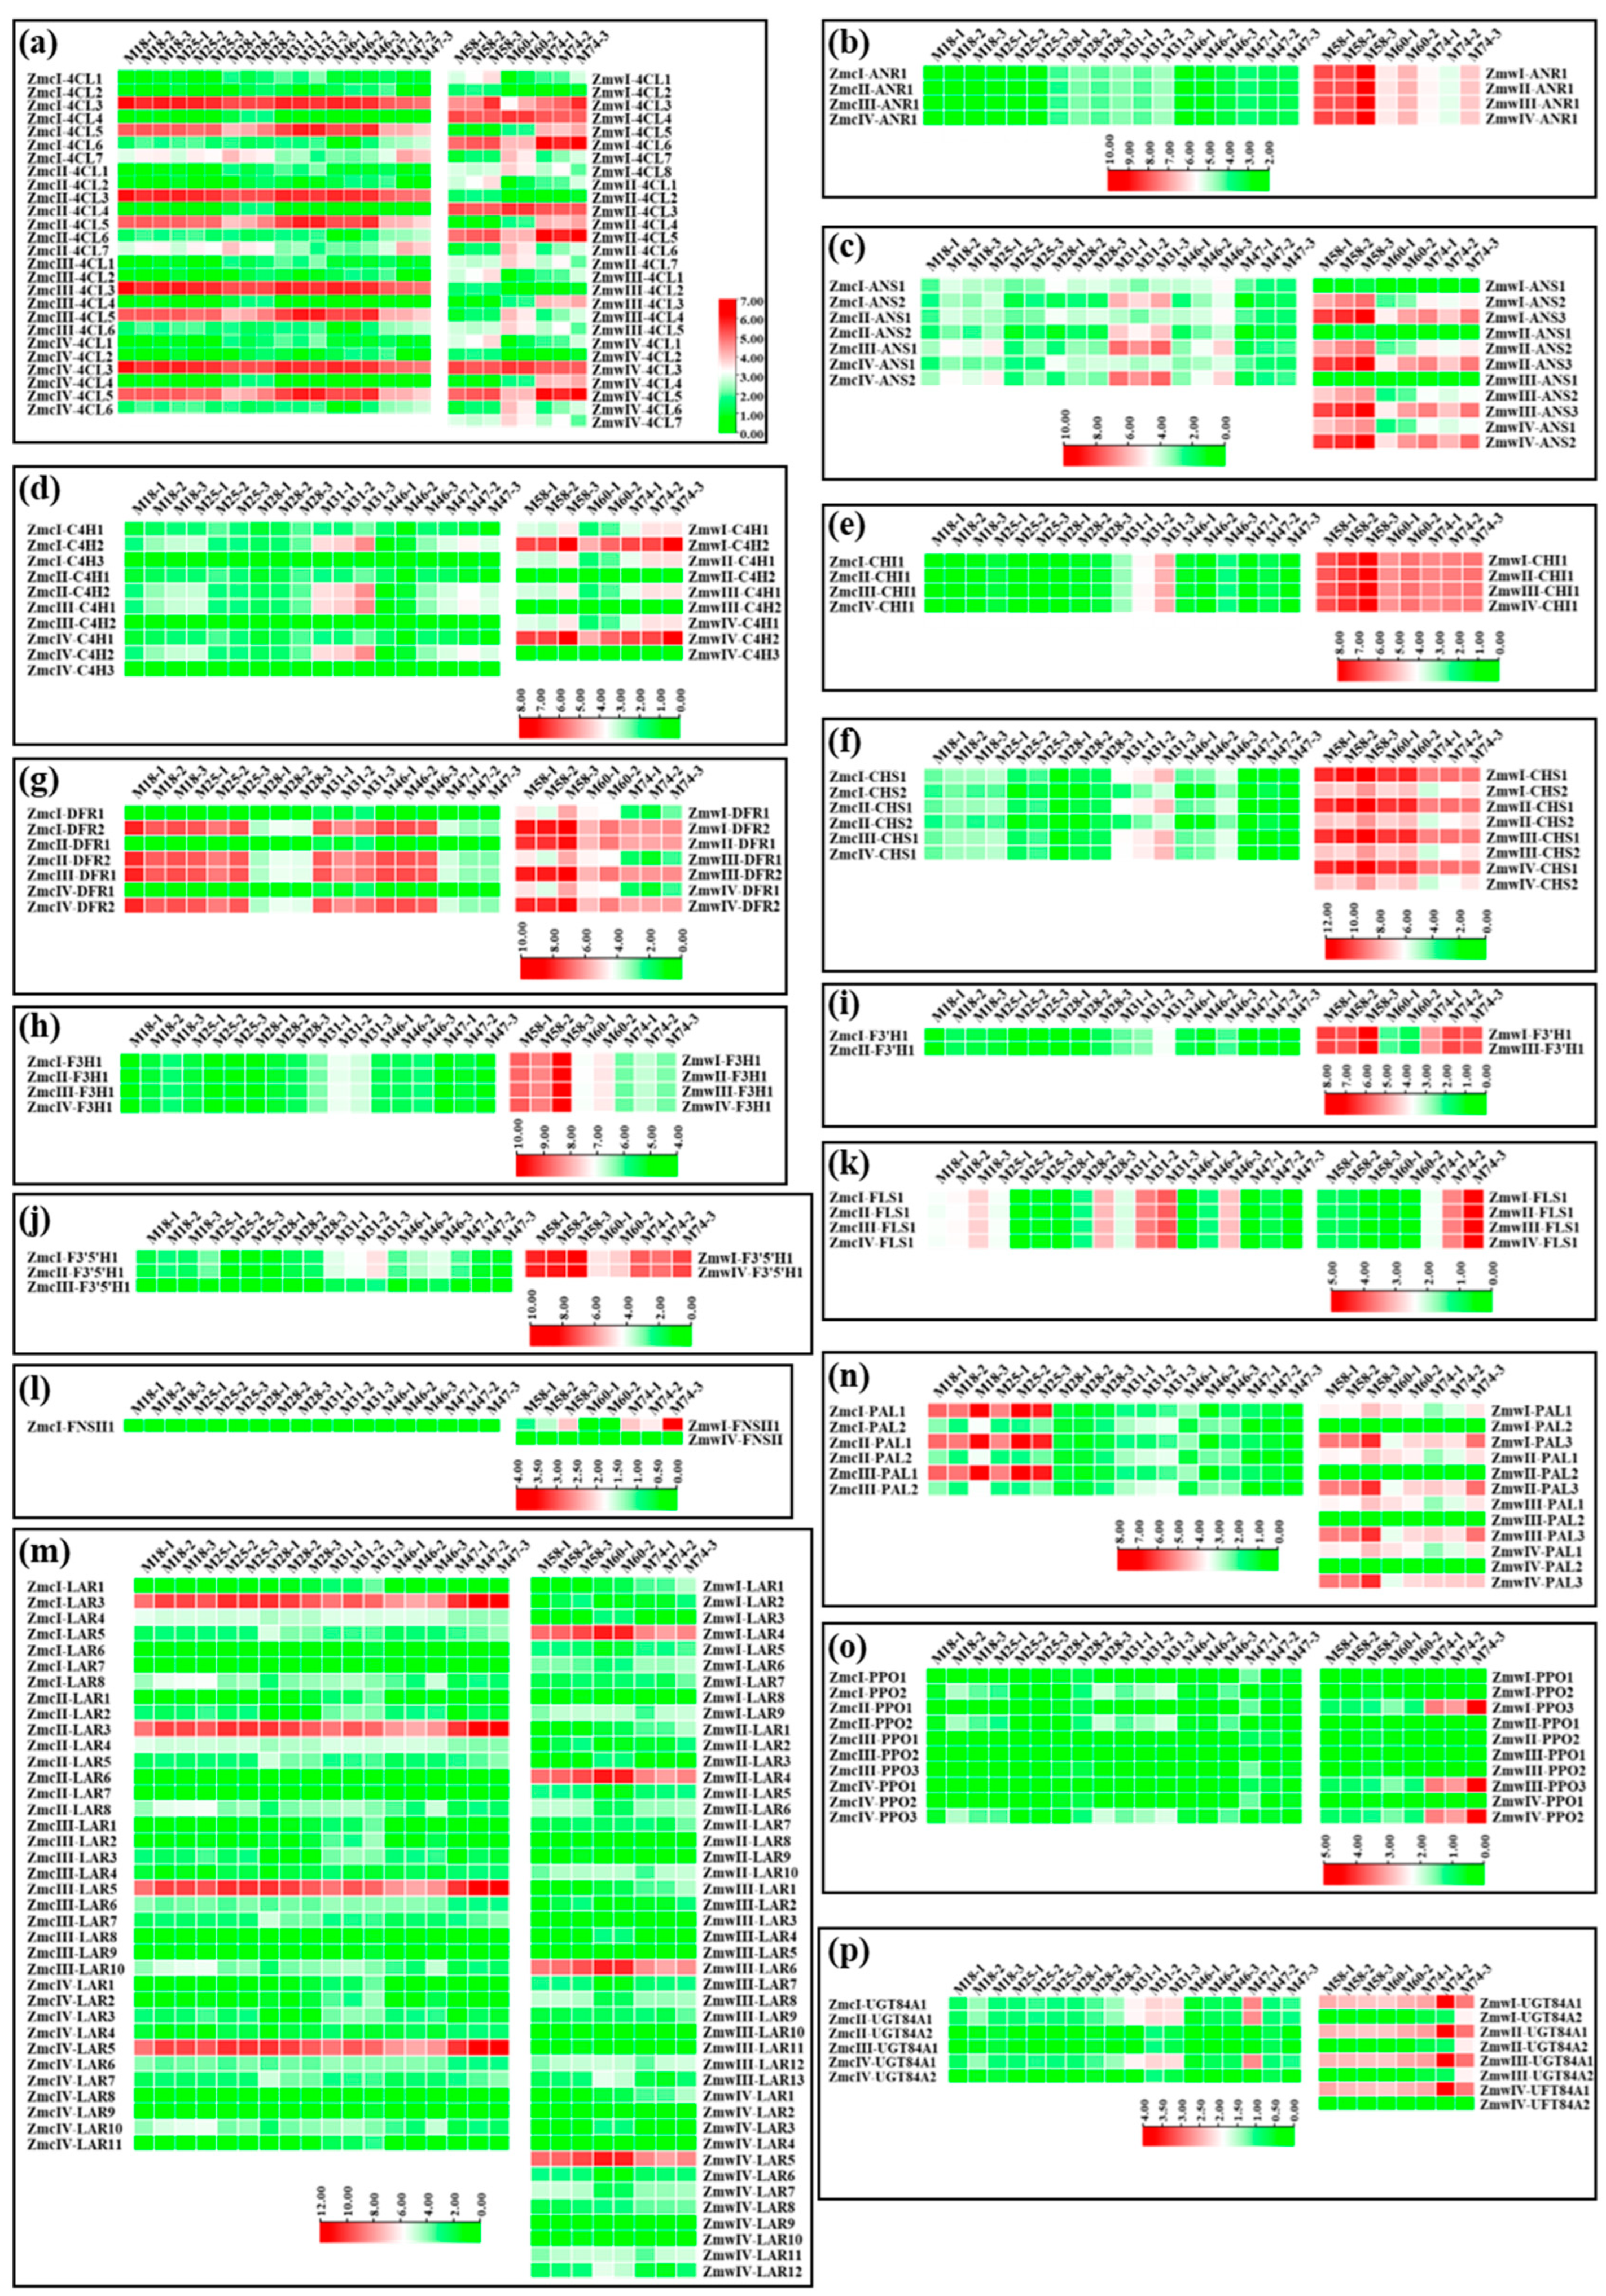
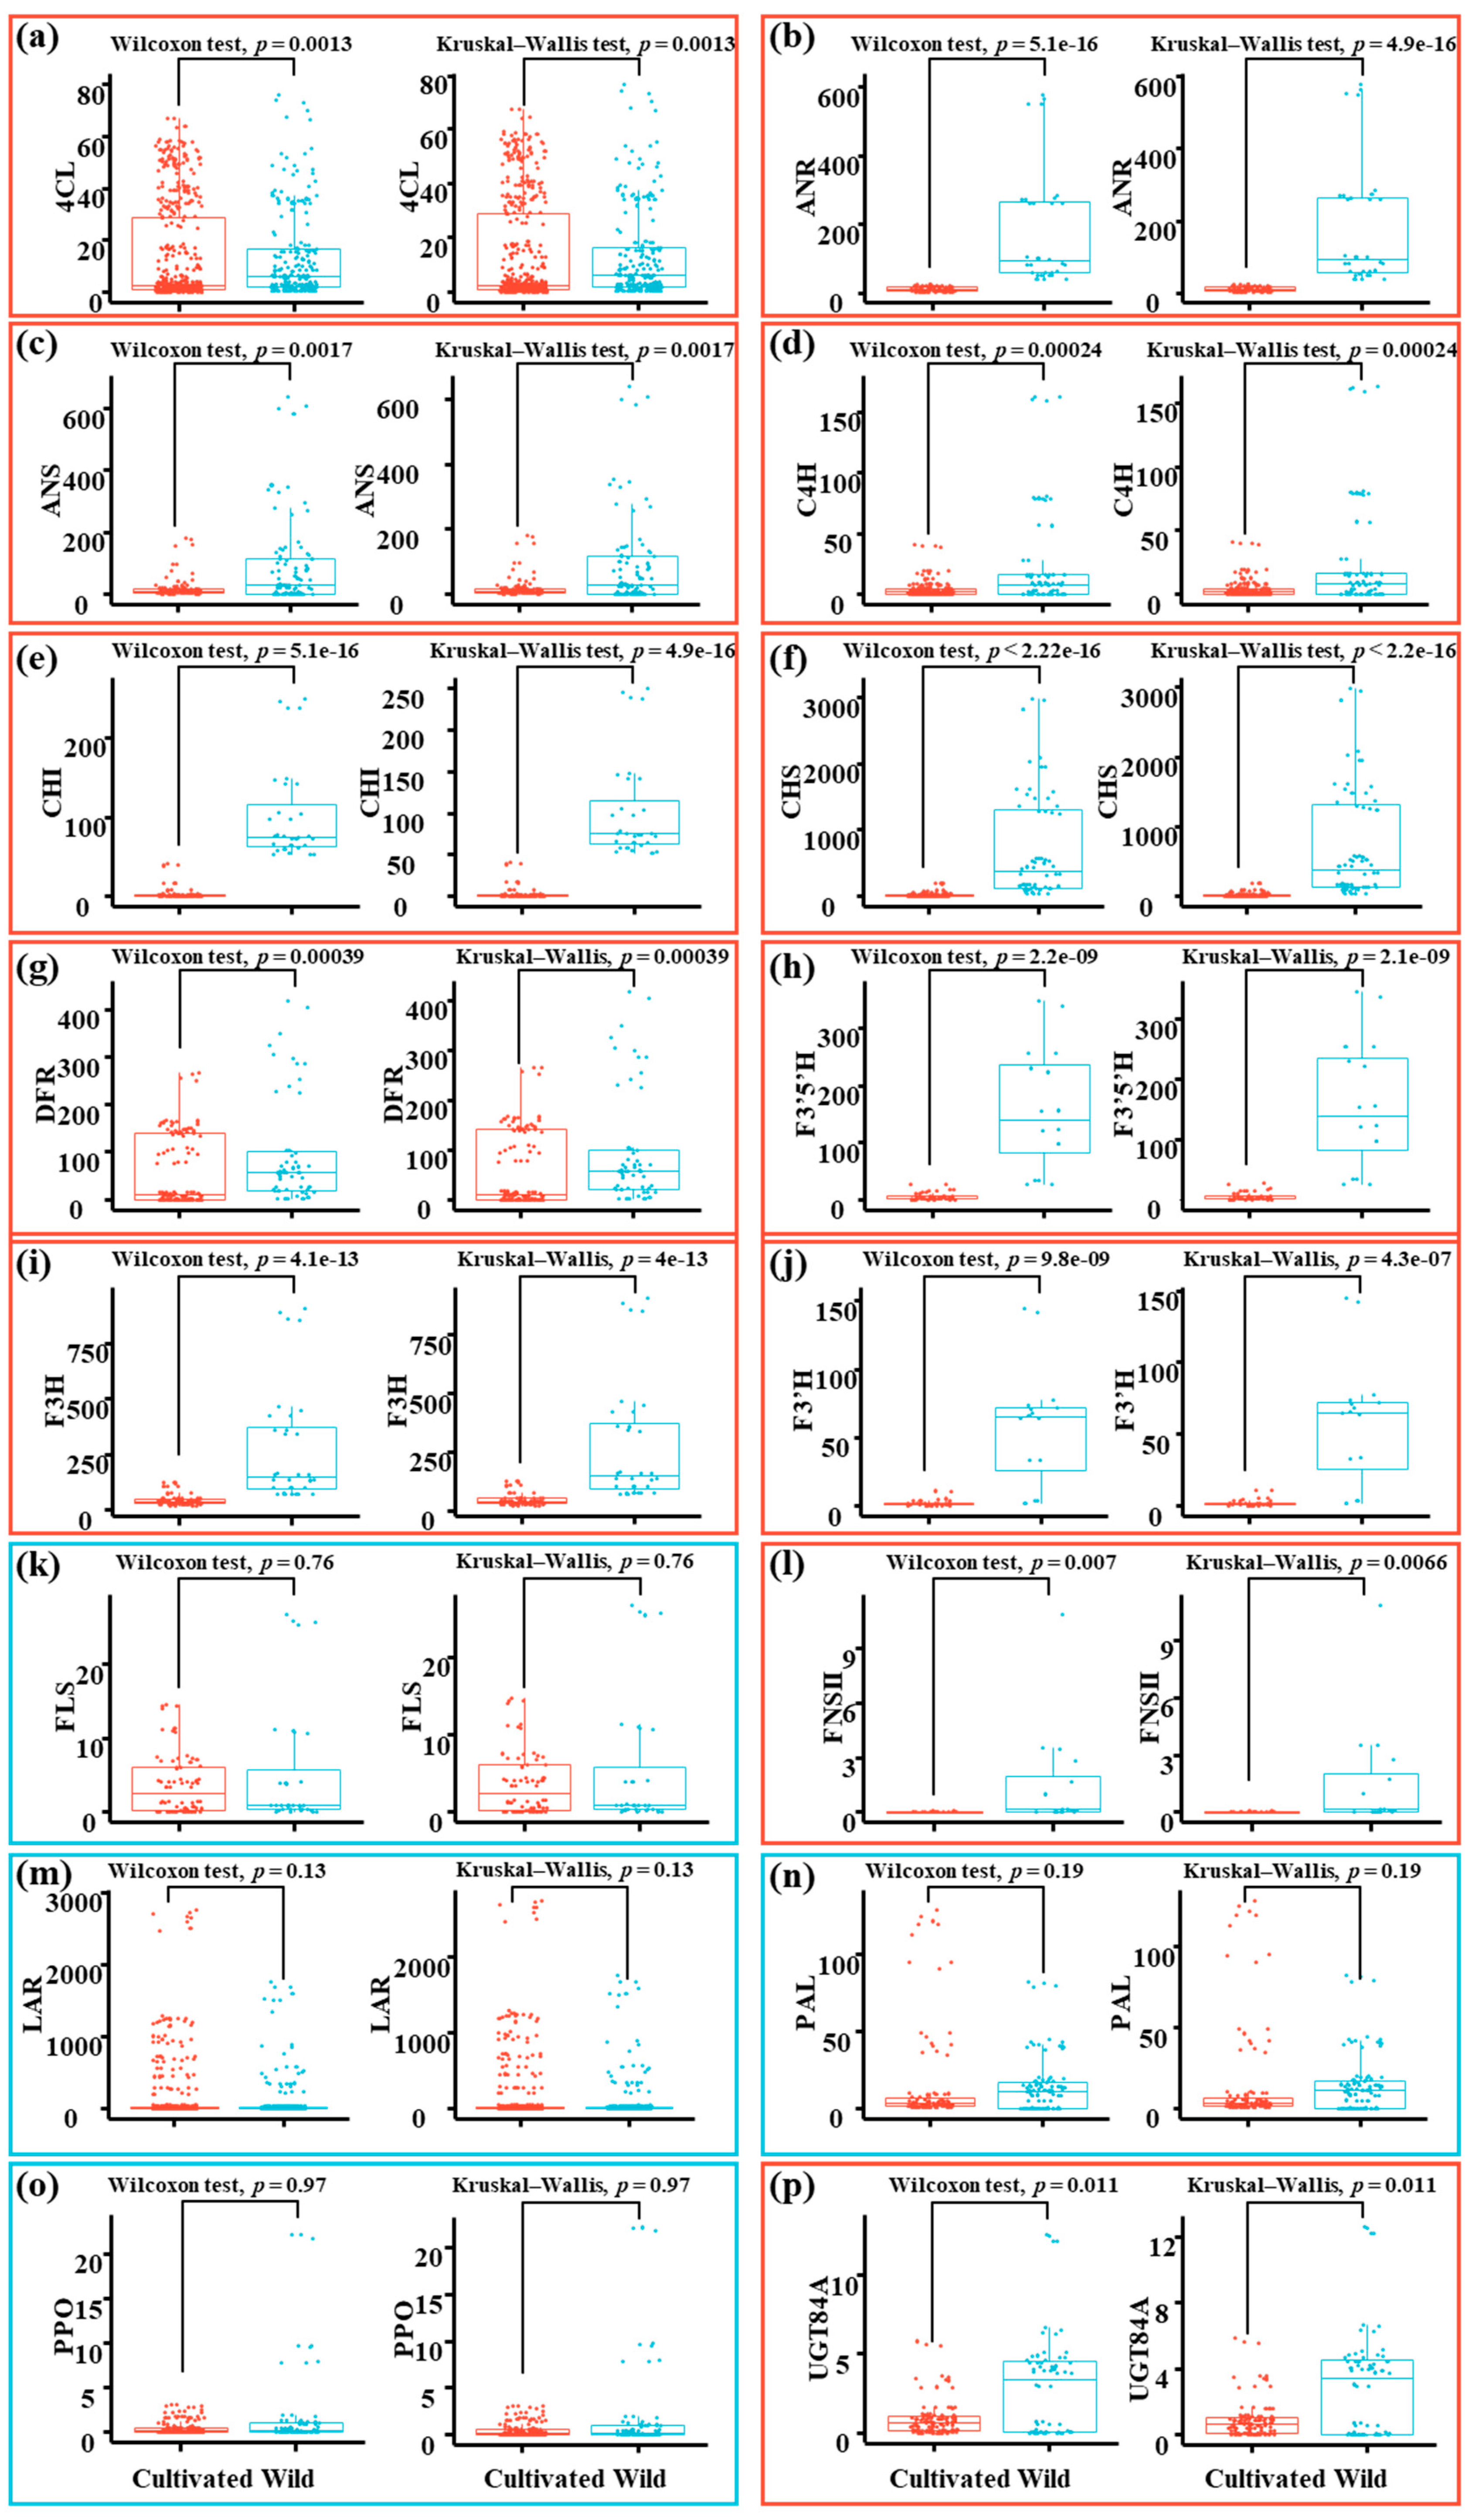
To investigate the difference in flavonoid metabolism between the wild and cultivated green jujube fruits, this study explored the abundance of functional flavonoid-related genes in the different fruits in depth (Figure 6 and Table S4). Figure 6 shows that the expression levels of functional members of the flavonoid-related genes displayed significant differences between the three wild and six cultivated green jujube cultivars. Specifically, the members of the 4CL gene family in the cultivated green jujube, such as ZmcI-4CL3/5, ZmcII-4CL3/5, ZmcIII-4CL3/5 and ZmcIV-4CL3/5, were highly expressed in all six cultivated accessions. Furthermore, ZmcI-4CL7/ZmcII-4CL7 was slightly expressed in several cultivated accessions. The other 16 members of Zmc-4CL showed almost no expression in all six fruits. In contrast, there was no obvious pattern in the Zmw-4CL gene family: ZmwI-4CL3/4/6, ZmwII-4CL3/5 and ZmwIV-4CL3/5 showed high expression levels in all three wild fruits, and some members exhibited slight expressions in one specific wild fruit, such as ZmwI-4CL5 in the M74 fruit and ZmwI-4CL7/8 in the M60 fruit (Figure 6a). All four members of the ANR gene family in the wild fruits showed significantly higher expression levels than those in the cultivated fruits, which showed nearly no expression (Figure 6b). However, the expression profiles of the ANS gene family was complicated: ZmcI-ANS2, ZmcII-ANS2, ZmcIII-ANS1 and ZmcIV-ANS2 were only expressed in the cultivated M31 fruit; ZmwI/II/III-ANS3 and ZmwIV-ANS2 were highly expressed in all three wild fruits and seemed to be higher than their homologous genes in the cultivated fruits; and ZmwI/II/III-ANS2 and ZmwIV-ANS1 were only expressed in the M58 and M74 fruits (Figure 6c). The expression profiles of the C4H gene family were similar to the ANS, i.e., most members of Zmc-C4H expressed extremely low levels, ZmcI/II/IV-C4H2 and ZmcIII-C4H1 were slightly expressed in the cultivated M31 fruit, and ZmwI/IV-C4H2 presented high expression levels in all three wild fruits (Figure 6d). ZmwI/II/III/IV-CHI1 showed significantly higher expressions in all the wild fruits than in the six cultivated fruits (Figure 6e). Similarly, all six members of the CHS gene family in the wild fruits displayed significantly high expression levels and Zmc-CHS expressed very low levels (Figure 6f). However, the expression patterns of the DFR gene family in the wild and cultivated fruits were a little complex: ZmcI/II/IV-DFR1 showed almost no expression, and ZmcI/II/IV-DFR2 and ZmcIII-DFR1 expressed high levels in the M18, M25, M31 and M46 fruits (not all cultivated fruits). In contrast, ZmwI/III/IV-DFR2 and ZmwII-DFR1 expressed high levels in all three wild fruits, and ZmwI/III/IV-DFR1 only expressed slightly high levels in M58 and M60 fruits, but not the M74 fruit (Figure 6g). The F3H, F3′H and F3′5′H gene families exhibited similar tendencies: nearly no expression in the cultivated green jujube fruits but expressed high levels in one or two wild fruits (Figure 6h–j). Both the FLS and FNSII genes were only expressed in specific cultivated and wild fruits (Figure 6k–l). The largest LAR gene family possessed the most distinctive expression patterns: only four members (ZmcI/II-LAR3 and ZmcIII/IV-LAR5 from the cultivated fruits; ZmwI/II-LAR4, ZmwII-LAR6 and ZmwIV-LAR5 from the wild fruits) showed significant high expression levels in all the cultivated and wild green jujube fruits, while all the remaining members exhibited no expression (Figure 6m). On the other hand, the expression trend of the PAL gene family was very divergent, ZmcI/II/III-PAL1 expressed slightly high levels in the M18 and M25 fruits, and the other members in the other fruits showed nearly no expression (Figure 6n). The PPO gene family expressions in all the fruit were very low (Figure 6o), which is consistent with their tissue-specified expression profiles (Figure 5). Evidently, only ZmwI/II/III/IV-UGT84A1 had relatively high levels in the wild fruits, and Zmc-UGT84A exhibited almost no expression in most of the cultivated fruits (Figure 6p).

3.7. The Downregulation of Functional Flavonoid-Related Genes Was Statistically Significant

Since haplotype genomes in the wild and cultivated fruits were used to identify the flavonoid-related genes, which led to various numbers of functional members, the expression levels between the wild and cultivated fruits could not be directly compared. In addition, the expression values (TPM values) of these genes were not approximately normally distributed, and thus, were not suitable for standard parametric tests (such as t-tests and ANOVA) (Figure 6). Hence, the Wilcoxon rank-sum (an alternative to the between-subjects t-test) and Kruskal–Wallis tests (an alternative to the between-subjects one-factor ANOVA), which are both non-parametric tests, were used to validate the differences.
The significance analysis results are illustrated in Figure 7. Finally, only four gene families (FLS, LAR, PAL and PPO) showed no difference (p > 0.05) between the cultivated and wild fruits. The UGT84A gene family expression levels showed significant differences (p < 0.05) between the cultivated and wild fruits. Additionally, the expression levels of three gene families, i.e., 4CL, ANS and FNSII, also exhibited very significant differences between the cultivated and wild fruits at p < 0.01. More importantly, the expression levels in eight gene families, i.e., ANR, C4H, CHI, CHS, DFR, F3′5′H, F3H and F3′H, displayed extremely significant differences between the cultivated and wild fruits at p < 0.001. Among the eight gene families, six genes (ANR, CHI, CHS, F3′5′H, F3H and F3′H) possessed higher differences at p < 0.0001. Overall, the study verified that the vast majority of functional flavonoid-related genes, except for FLS, LAR, PAL and PPO, showed significant expression differences between the cultivated and wild fruits.

3.8. Accumulation of Flavonoid Metabolites Differed Between Wild and Cultivated Green Jujube

To discover the differences in flavonoid metabolites between cultivated and wild fruits, the present study first illustrated the universal profiles of flavonoid metabolites in six cultivated and three wild fruits (Figure 8a), which provided a comprehensive understanding. Notably, the enriched distribution of flavonoid metabolites was at a low abundance, while some flavonoid metabolites accumulated extremely high abundances, especially in the wild M60 fruit.
The PCA results revealed that PC1 and PC2 accounted for 39.5% and 16.2% of the total variability, respectively, with a total contribution of 55.7% (Figure 8b). It is evident that the cultivated fruits were significantly separated from the wild fruits, showing that the flavonoid metabolic profiles of the cultivated fruits differed markedly from the wild fruits. Moreover, the intra-group and inter-group replicates of the six cultivated fruits were tightly clustered, suggesting high data reproducibility and reliable results. Furthermore, three wild fruits exhibited an obvious degree of variation in their flavonoid components. Lastly, in total, 143 flavonoid metabolites were recognized in the green jujube fruits (Figure 8c), including 55 flavonols, 31 flavonoids, 12 flavanols, 9 tannins, 7 chalcones, 6 dihydroflavonols, 6 dihydroflavones, 6 proanthocyanidins, 5 flavonoid carbonosides, 4 anthocyanins and 2 isoflavones.
The current study performed a significance analysis of the flavonoid metabolites between the cultivated and wild fruits to count the differential significance using Wilcoxon and Kruskal–Wallis tests due to the non-normal distributions of the flavonoid metabolites (Figure 8d,e). The results unquestionably established that the difference in flavonoid metabolites between the cultivated and wild fruits was extremely significant at p < 0.0001.

3.9. Wild Green Jujube Fruits Accumulated Significantly More Flavonoids

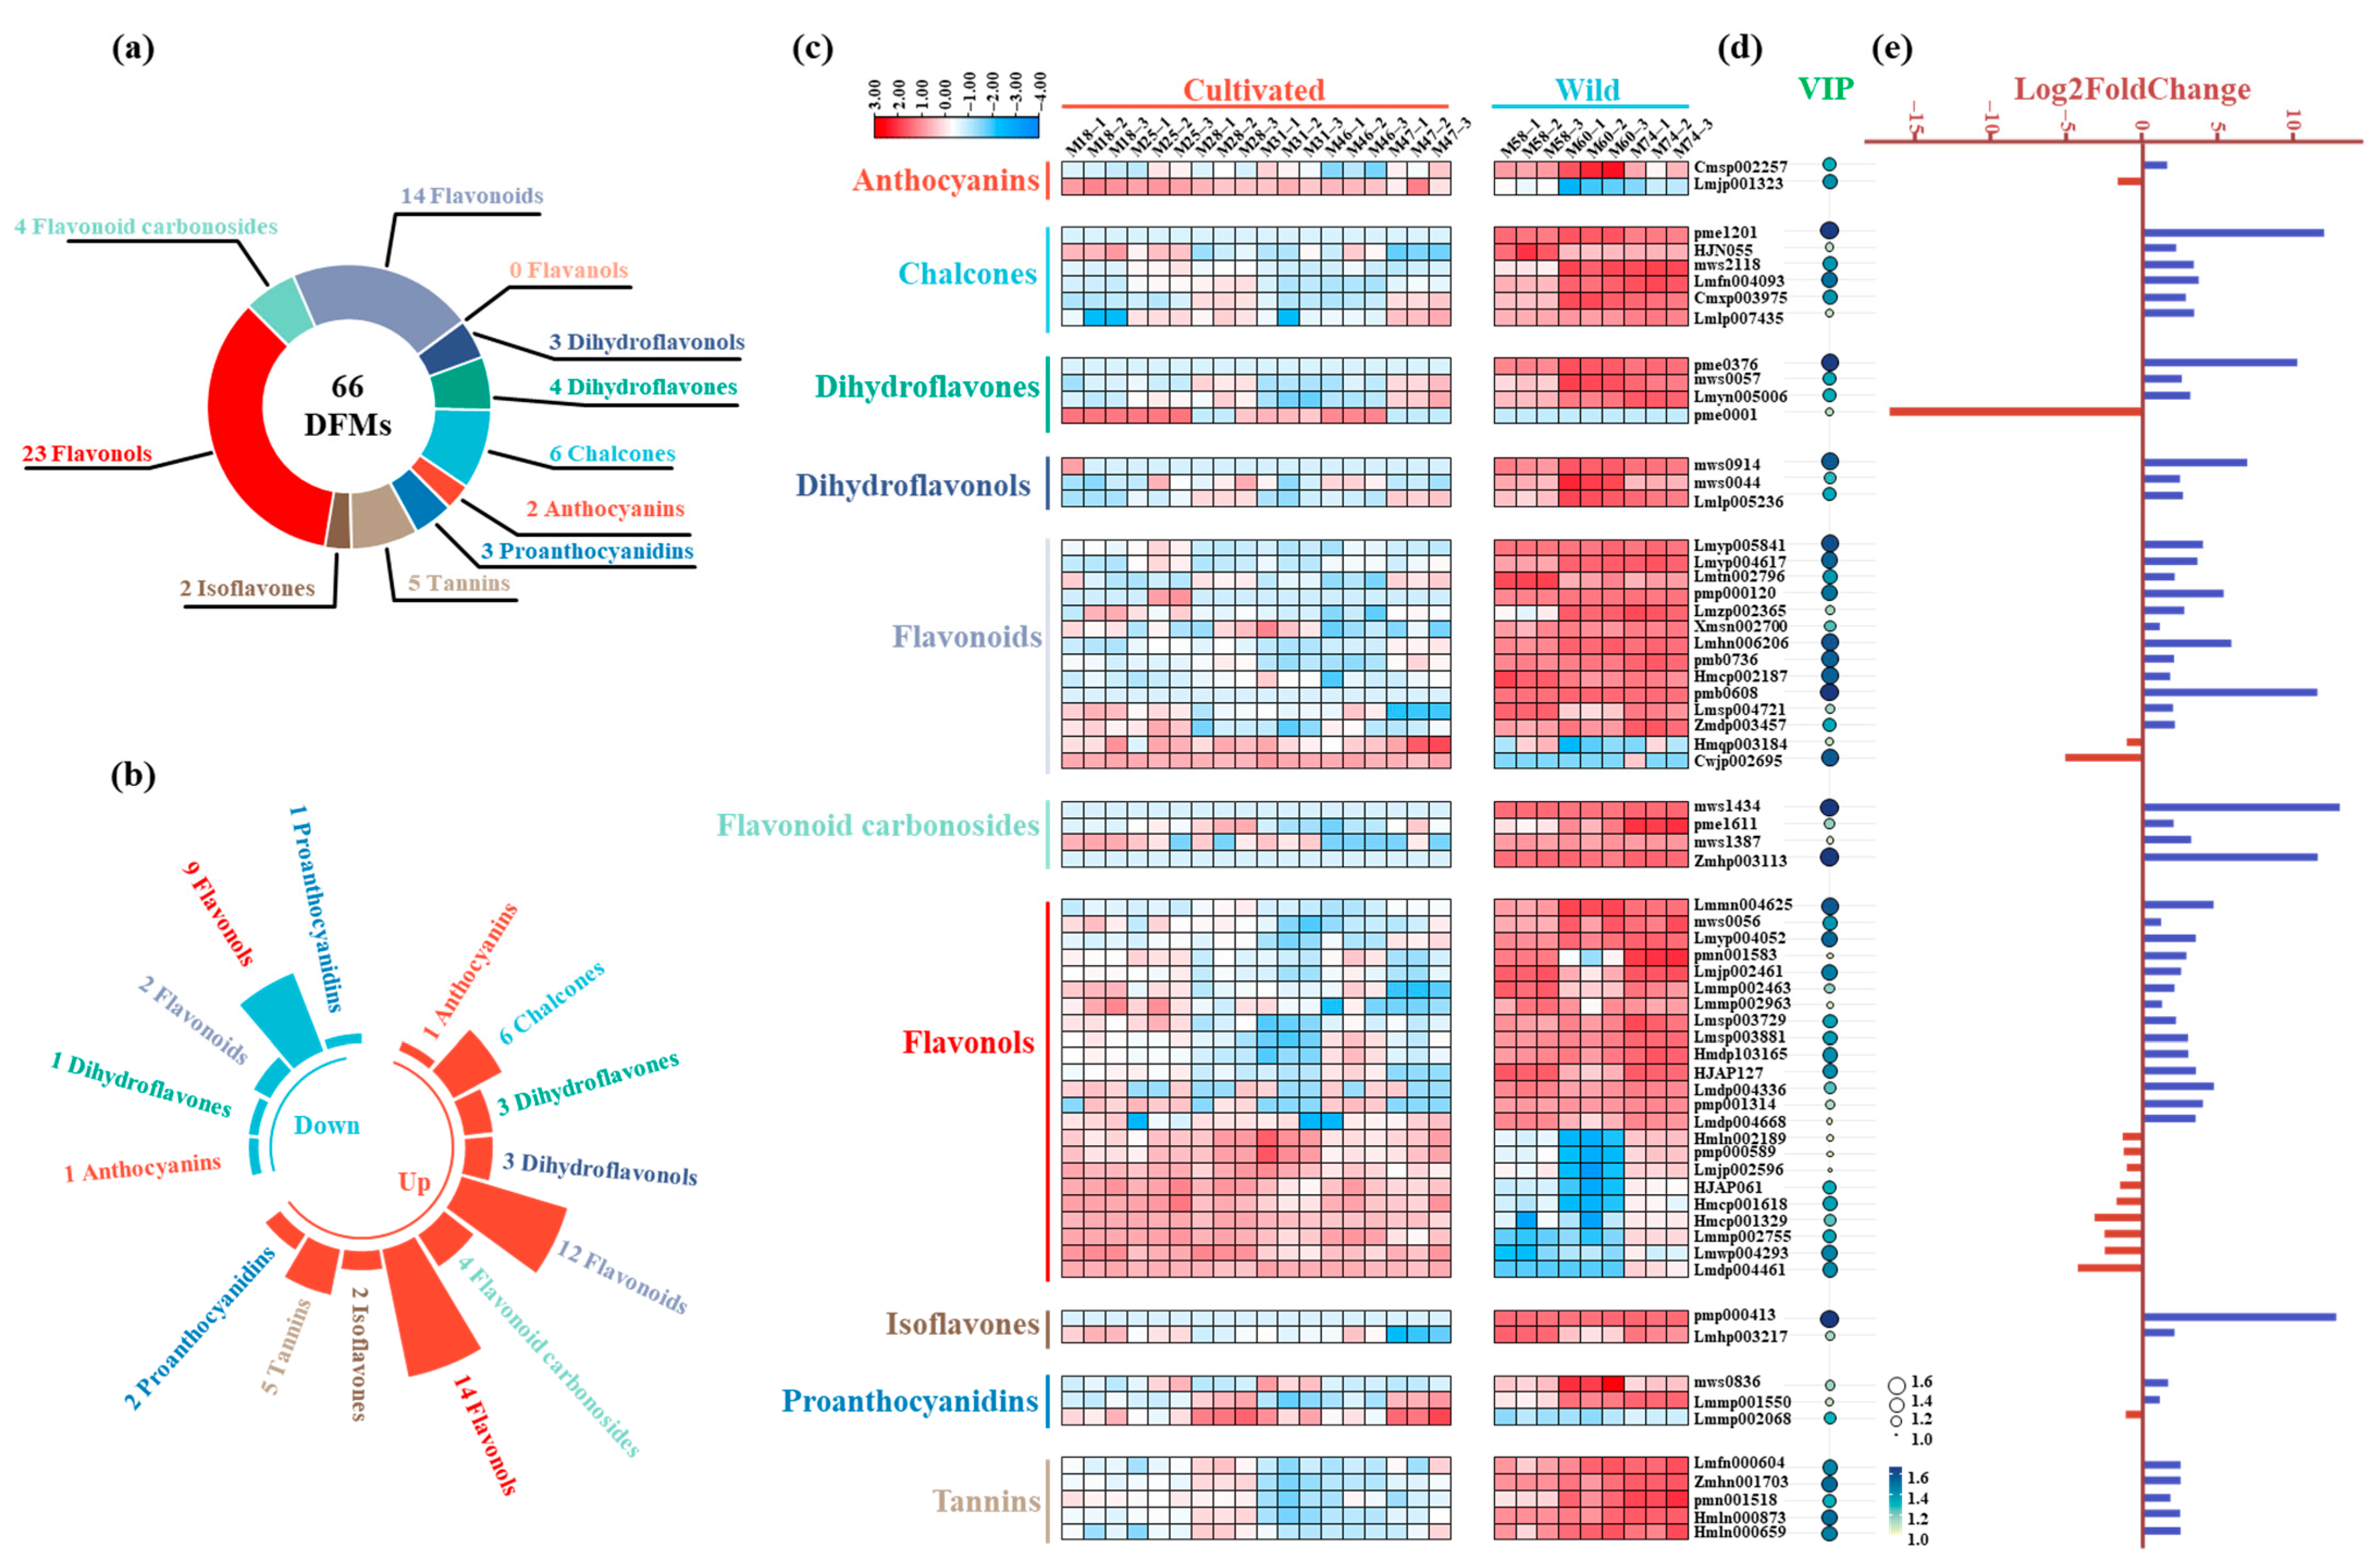
To identify the differential flavonoid metabolites (DFMs) between the cultivated and wild fruits, a combination of fold change and VIP values from the OPLS-DA model was used. Metabolites with a |log2(foldchange)| ≥ 1 and VIP value > 1 were considered significantly different and were selected as differential flavonoid metabolites. The results of the differential flavonoid metabolite screening between the cultivated and wild fruits are illustrated in Figure 9 and Table S5. A total of 66 DFMs were identified in these fruits, including 23 flavonols, 14 flavonoids, 6 chalcones, 5 tannins, 4 flavonoid carbonosides, 4 dihydroflavones, 3 dihydroflavonols, 3 proanthocyanidins, 3 dihydroflavonols, 2 anthocyanins and 2 isoflavones, but no flavanols (Figure 9a). In detail, there were 52 upregulated and 14 downregulated DFMs. The upregulated DFMs comprised 14 flavonols, 12 flavonoids, 6 chalcones, 5 tannins, 4 flavonoid carbonosides, 3 dihydroflavones, 3 dihydroflavonols, 2 isoflavones, 2 proanthocyanidins and 1 anthocyanin. The downregulated DFMs comprised 9 flavonols, 2 flavonoids, 1 anthocyanin, 1 dihydroflavone and 1 proanthocyanidin (Figure 9b).
The differential accumulation levels of all 66 DFMs in the cultivated and wild fruits are shown as a heatmap (Figure 9c), with the VIP and Log2FoldChange values also illustrated (Figure 9d,e). The detailed chemical compound names of the 66 DFMs are listed in Table S5. Among these DFMs, the accumulation levels of phloretin (pme1201), naringenin (pme0376), pinobanksin (mws0914), chrysoeriol (pmb0608), isovitexin (mws1434), vitexin (Zmhp003113) and genistein (pmp00413) in the wild fruits were 5-fold higher than those in the cultivated fruits, and the VIP values in all the DFMs were larger than 1.5. In contrast, the abundance of neohesperidin (pme0001) was 15-foldchanges higher in the cultivated fruits than in the wild fruits, but its VIP was just >1.

3.10. Gene Co-Expression Network Unveiled the Potential Transcription Factors

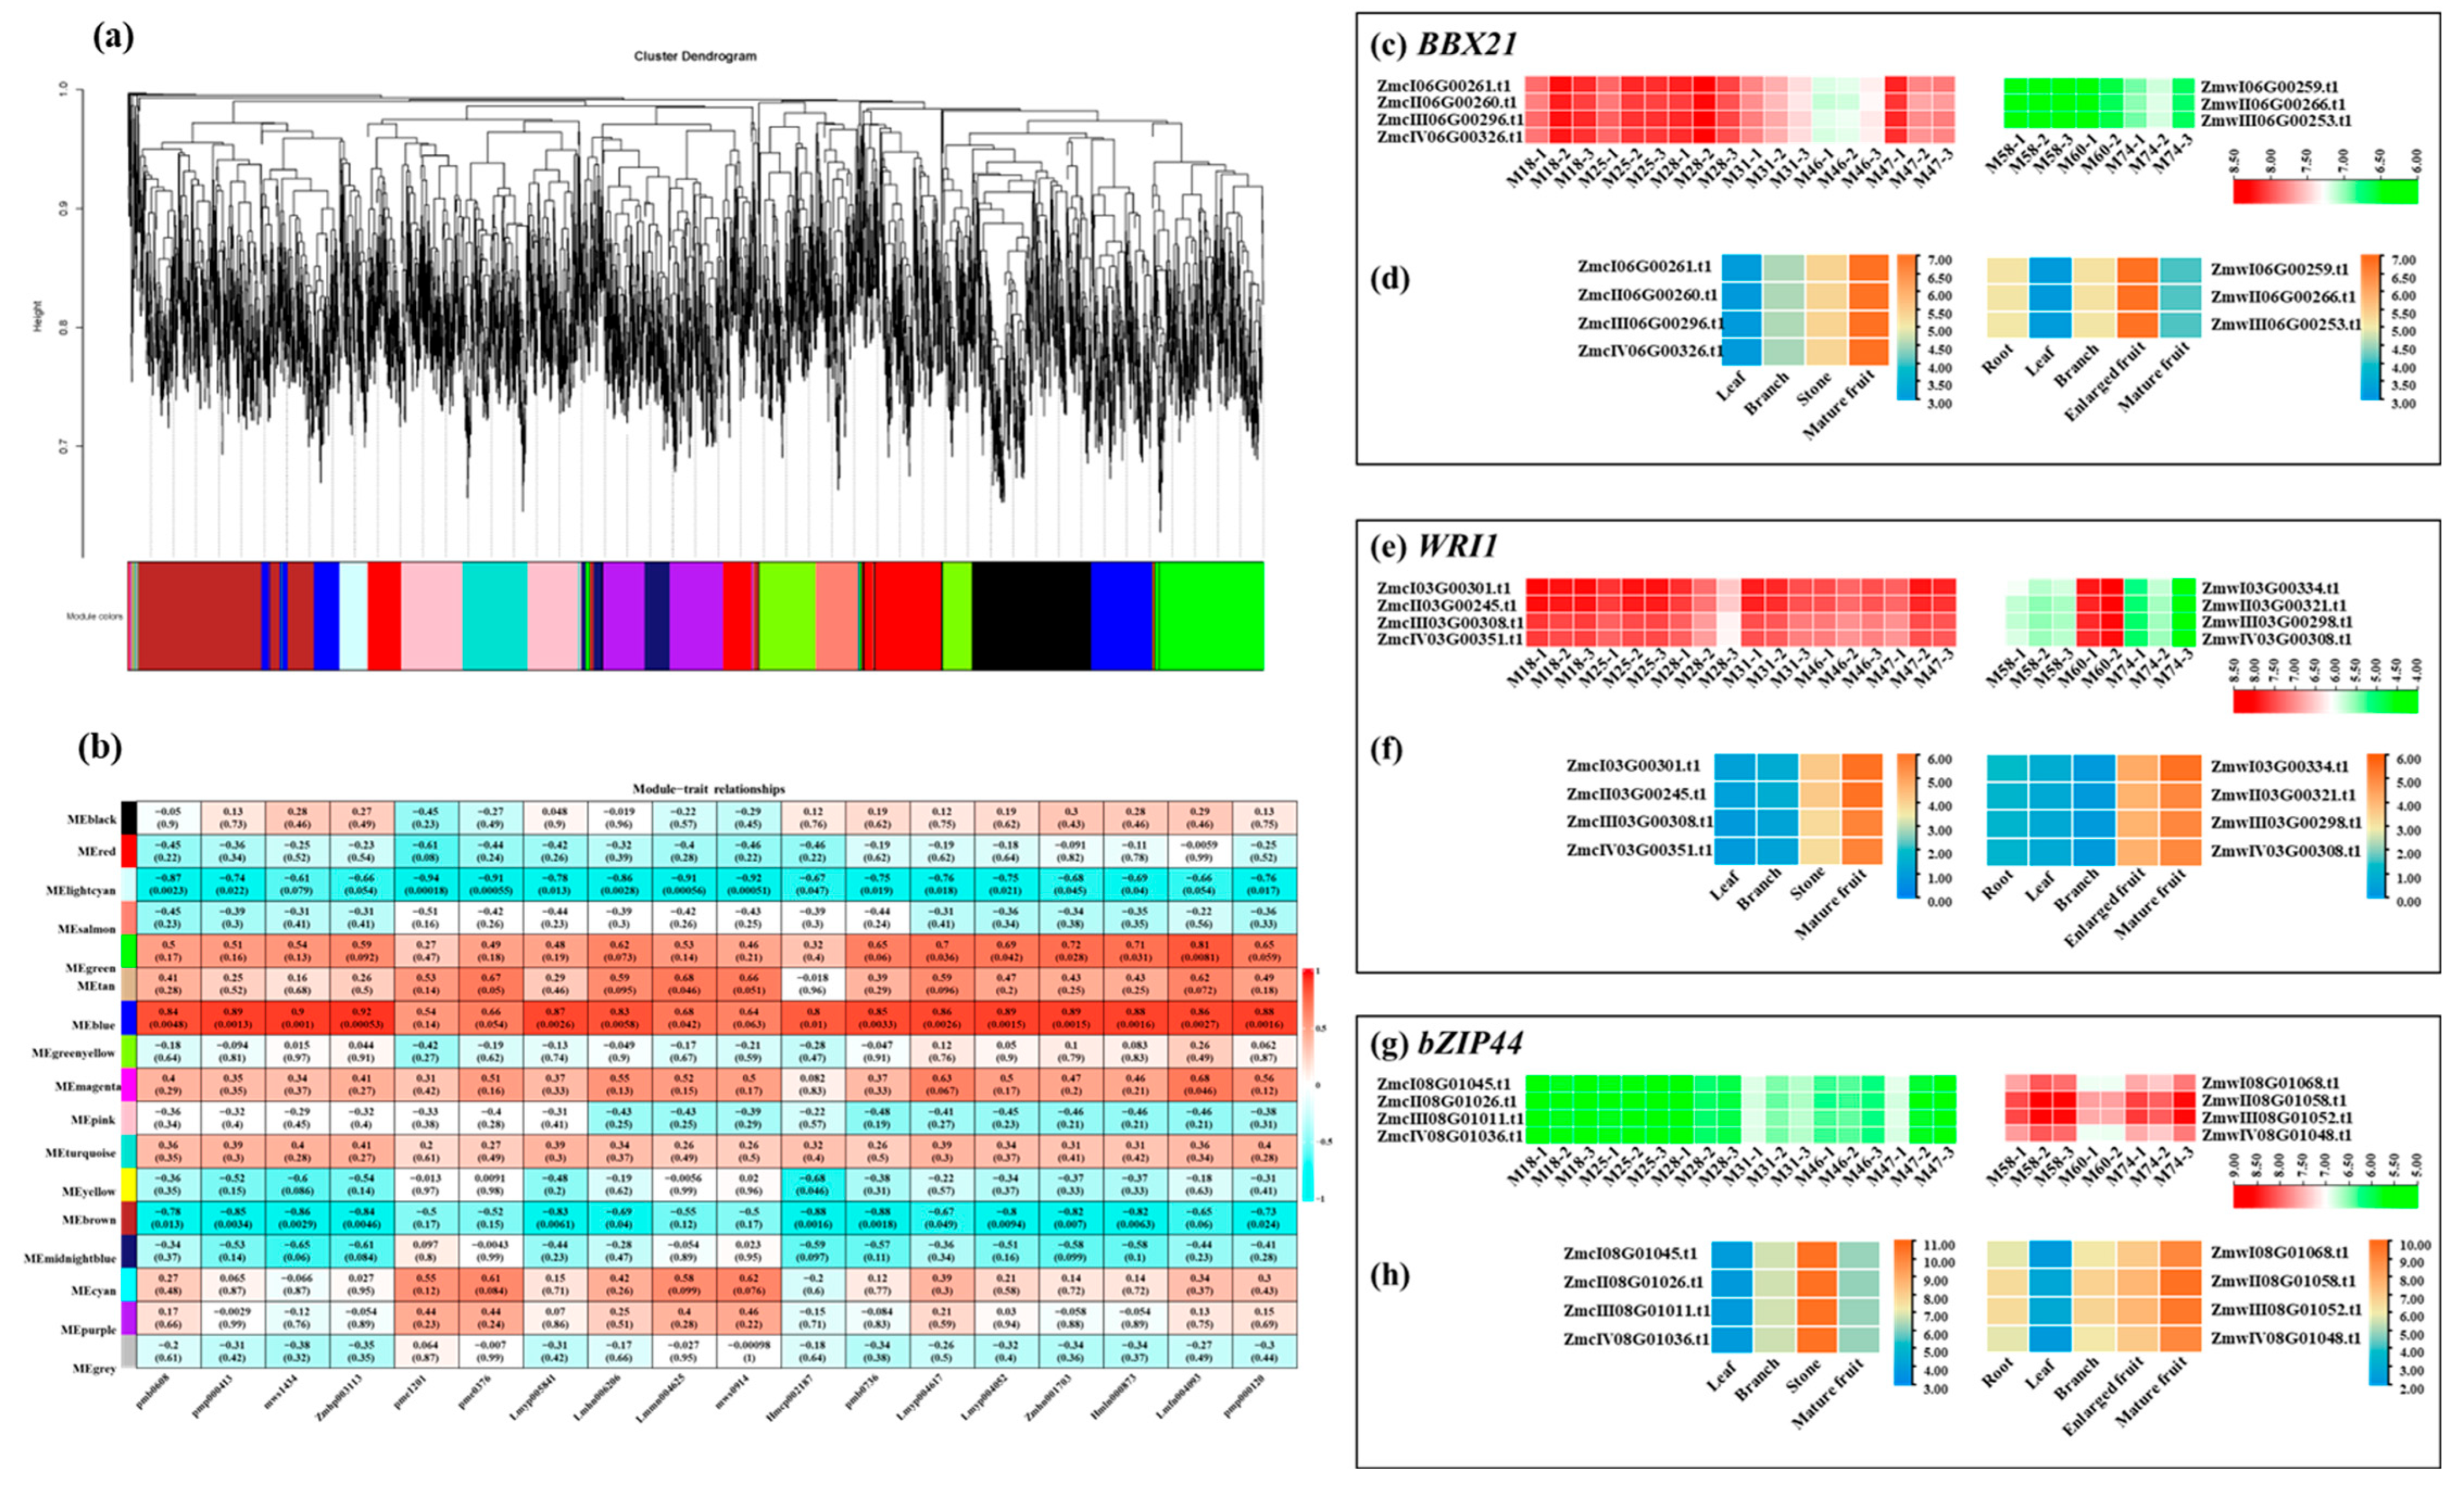
To further explore the potential regulatory factors regulating functional flavonoid-related genes, a WGCNA was executed. The clustering analysis revealed no outliers, which allowed for the inclusion of all the samples in the subsequent analyses. The optimal soft-threshold power for constructing a scale-free network was calibrated to 15, where the scale-free fit index R2 reached 0.82 and the mean connectivity approached zero (Figure S3). Using a module cut-tree height of 0.25 and a minimum of 200 genes per module, 17 modules were selected (Figure 10a). Furthermore, we related the 18 DFMs that had the top VIP values with the 17 co-expressed modules and identified one module (blue) that was significantly associated with 14 out of the 18 DFMs (p < 0.01) (Figure 10b).
Finally, three candidate genes were identified that were screened out from the blue module; these genes demonstrated a regular expression pattern between the cultivated and wild fruits (Figure 10c–h). After searching in the TAIR database for protein sequences, the three genes were annotated as BBX21, WRI1 and bZIP44, where BBX21 belongs to the double B-box subfamily of BBX transcription factors family, WRI1 (WRINKLED1) is defined as a member of the APETALA2 (AP2) transcription factor family and bZIP44 is a member of the basic leucine zipper (bZIP) transcription factors.
Figure 10c–h show that there were four copies of BBX21 (ZmcBBX21: ZmcI06G00261.t1, ZmcII06G00260.t1, ZmcIII06G00296.t1 and ZmcIV06G00326.t1) in the cultivated green jujube, but only three copies (ZmwBBX21: ZmwI06G00259.t1, ZmwII06G00266.t1 and ZmwIII06G00253.t1) were found in the wild green jujube. ZmcBBX21 clearly showed significantly higher expressions in the six cultivated fruits than ZmwBBX21 in the three wild fruits (Figure 10c). Furthermore, ZmcBBX21 expressed high levels in the mature fruit and ZmwBBX21 expressed high levels in the enlarged fruit (Figure 10d). Regarding the WRI1 gene, there were four copies in both the cultivated and wild green jujube. ZmcWRI1 also expressed high levels in all the cultivated fruits, but ZmwWRI1 expressed low levels, except in the M60 fruit (Figure 10e). Expressions of both ZmcWRI1 and ZmwWRI1 were enriched in the mature fruits (Figure 10f). In contrast, the bZIP44 expression was different from those in ZmcBBX21/ZmwBBX21 and ZmcWRI1/ZmwWRI1 and displayed low levels in the cultivated fruits and high levels in the wild fruits (Figure 10g). High expressions of ZmcbZIP44 and ZmwbZIP44 were observed in the stone and mature fruit, respectively, which further verified the distinct expression patterns relative to BBX21 and WRI1 (Figure 10h).

4. Discussion

Recent reports indicate that the global annual production of green jujube exceeds 900,000 tons [41]. Among the major producers, China has a total cultivation area of 21,000 hectares with an annual yield of about 200,000 tons, India has 90,000 hectares with an annual yield of approximately 700,000 tons [3] and Pakistan has 5,425 hectares with an annual yield of about 28,000 tons [42]. Therefore, within the extensive Rhamnaceae plant family, green jujube is a most important tree species, second to the Chinese jujube (Ziziphus jujuba Mill.) regarding their economic, ecological and social values. However, despite its considerable scale of planting and cultivation worldwide, green jujube remains a “neglected and underutilized plant species” [43], still receiving limited attention from policies, research and development institutions, even though green jujube is a major source of food, nutrition and income for local people in underdeveloped rural areas in arid and semi-arid regions [3,43,44]. Nevertheless, a significant breakthrough was achieved in 2024 when Guo et al. [24] successfully assembled two haplotype-resolved, telomere-to-telomere (T2T) genomes of wild and cultivated autotetraploid green jujube. This remarkable advancement has greatly facilitated research endeavors in the field of molecular biology, opening new avenues for the exploration and utilization of this valuable species.
Hence, advances in genomics offer a powerful means to evaluate the impact of domestication at the genomic level through a comparison between wild and cultivated green jujube. Moreover, the integration of transcriptomics with associated metabolome analysis further expands our understanding of domestication by revealing additional dimensions of this process. This work presented a comprehensive investigation of gene identification, gene expression and metabolomic profiles of flavonoid biosynthetic pathways in relation to green jujube domestication. It complemented previous studies of gene identification, gene expression and metabolite profiles of fruits between wild and cultivated green jujube [24,45]. The de novo transcriptome analysis at different fruit developmental stages of green jujube illustrated that the expression levels of the 13 flavonoid-related key genes identified, such as C4H, CHS, CHI, F3H, DFR and ANS, were found to be significantly downregulated in fruit peel [45]. The genetic basis underlying the loss of fruit astringency during green jujube domestication was also inspected. It was found to be closely and positively associated with the concentrations of tannins and chlorogenic acid. The 13 related genes, including PAL5, C4H1, 4CL1, CHS4 and CHI1, were found to be downregulated in cultivated green jujube [24]. Although this study also examined the expression levels of some flavonoid-related genes between cultivated and wild green jujube fruits, it only focused on the limited related genes and metabolites, not all the flavonoid biosynthesis gene families and associated flavonoid metabolites.
The flavonoid biosynthetic pathways are highly complex, encompassing a broad spectrum of enzymes that collectively facilitate the production of a diverse array of metabolites. In this study, the python package “GFAnno” [25] was employed to annotate and classify the 18 key flavonoid-related genes by integrating the sequence similarity and conserved domain analysis. Finally, the study identified 16 gene families, namely, 4CL, ANR, ANS, C4H, CHI, CHS, DFR, F3H, F3′H, F3′5′H, FLS, FNSII, LAR, PAL, PPO and UGT84A, except for LDOX and SCPL (Figure 1 and Figure 2). Several previous studies also identified the flavonoid-related genes in batches using common BLAST and domain searching methods. For instance, 26 flavonoid biosynthesis-related genes were identified in Salvia miltiorrhiza [46], 25 genes identified in Taxus chinensis [47] and 85 genes in rice [48].
However, the study did not find the LDOX and SCPL gene families in either the cultivated or wild green jujube. LDOX plays a crucial role in the biosynthesis of anthocyanins and proanthocyanidins, which has been identified in green jujube using a de novo transcriptome when lacking genomic information [45]. The reason for this result may be due to the high conservation of gene sequences. As is well-known, LDOX belongs to the 2OGD family, which also includes the F3H, ANS and FLS gene families. In this study, 10, 4, and 6 members of the ANS, F3H, and FLS gene families were identified in the cultivated green jujube, respectively, while 11, 4, and 6 members of the ANS, F3H, and FLS gene families, respectively, were identified in wild green jujube. These gene families shared a high sequence similarity, characterizing them as being within the same 2OGD gene family. Furthermore, the intricate genome of green jujube (Ziziphus mauritiana), characterized by its autotetraploid nature, may have significantly influenced the identification and characterization of the LDOX gene family. Furthermore, the SCPL gene family was proved to be involved in the acylation of catechins, signifying the possibility of an accompanying lack of catechin biosynthetic pathway in green jujube given the lineage-specific gene loss. In contrast, we successfully distinguished the members of the P450 gene superfamily, including the those of the F3′H, F3′5′H, FNSII and C4H gene families, which also shared highly similar sequences, using the “GFAnno” package [25], demonstrating the reliability and accuracy of the new technique. Of course, the inherent technical limitations of the annotation tool “GFAnno” that could prevent it from correctly identifying LDOX from the 2OGD superfamily and SCPL genes cannot be ruled out. The study thus screened the genome of jujube (Ziziphus jujuba Mill. cv. ‘Dongzao’) using “GFAnno” and also found no LDOX, SCPL4 and SCPL5which further confirmed the inherent technical limitations. Nevertheless, a definitive conclusion will require cross-plant species explorations.
More importantly, a significant portion of “redundant” members of a gene family were not expressed in any one selected tissue of the green jujube, and the “functional” genes expressed >1 in all of the selected tissues. Notably, not all the “functional” members of a gene family were expressed in the fruit, and therefore, only some play a role in the fruit flavonoid pathway (Figure 1, Figure 4, Figure 5 and Figure 6). Similarly, a recent study also found that C4H1 and UGT were significantly differentially expressed and downregulated in the fruit peel of green jujube [45]. Additionally, these flavonoid-related genes showed spatial and temporal regulation in a tissue-specific manner in Salvia miltiorrhiza [46], Taxus chinensis [47] and rice [48]. Overall, the first large-scale identification of flavonoid-related genes using an extremely fast and highly accurate programed package on the four haplotype genomes of cultivated and wild green jujube was conducted in the present study, which represents a preliminary and foundational in silico analysis; however, a substantial amount of in-depth experimental and functional validation is necessary to further precisely confirm the identities and functions of these flavonoid-related genes in green jujube.
In the present study, the domestication effect could be revealed by the copy number of the gene families, which were not balanced within the different haplotype genomes of the wild and cultivated green jujube. The copy numbers of the LAR gene family varied for different genomes, with 12, 10, 11 and 13 copies in the four haplotype genomes of the cultivated green jujube and 14, 14, 13 and 12 in the wild. Through the expression profiles of all the identified flavonoid-related genes in the cultivated and wild green jujube, it was evident that both the number of total copies and functional members of flavonoid-related genes significantly decreased during the domestication of green jujube, even though some gene families (like C4H family) increased a little (Figure 1, Figure 4 and Figure 6). The “loss and gain”, or “expansion and contraction”, of the gene family members of the flavonoid pathway unveiled the apparent effect of the green jujube domestication process. The domesticated genes of tea plants (Camellia sinensis var. Assamica) were also mainly involved in flavonoid biosynthesis [49]. Therefore, domestication has significantly influenced the flavonoid biosynthetic pathways at the genomic level in green jujube.
Further collinearity analysis displayed that there were various duplication events, such as whole-genome, dispersed, tandem and proximal duplications (Figure 2); tandem duplication was the predominant event, while WGD only ranked third (Figure S1). The segmental and tandem duplication events also significantly contributed to the expansion of key genes involved in flavonoid biosynthesis in rice [48]. Duplication events were found to be greatly different between the gene families. For instance, all the members of the ANS and DFR gene families showed tandem duplication, ANR showed WGD, and F3H showed dispersed duplication. However, the larger gene families were found to display a variety of duplication events. In detail, whole-genome, tandem and proximal duplication events were found in the LAR gene family, and three events (whole-genome, dispersed, and tandem duplications) were also found in the PAL gene family. Notably, some homologous genes displayed different events between the wild and cultivated green jujube. Several typical examples were the CHI gene family and some members of LAR (Figure 2). Tandem duplication was the sole event in the CHI gene family among the cI, cII and cIII genomes, but proximal duplication was found in the cIV and wild genomes. Similar results also were found in the LAR members. The constructed phylogenetic trees (Figure 2 and Figure S2) further validated the complexity of their evolutionary events of flavonoid-related genes shaped by both polyploidy and subsequent domestication.
The above consequences clearly demonstrate that domestication has a pronounced impact on the genomic characteristics of flavonoid-related genes in green jujube. Similar conclusions were drawn for rice, where the numbers and types of duplication events varied significantly between the six gene families that exhibited duplications; hence, the expansion mechanisms of the 13 flavonoid pathway gene families are highly diverse [48].
Another study estimated the differentiation time between chromosomes I and III to be approximately 1.96 Mya, and the most recent WGD event occurred approximately 0.12 Mya in green jujube [24]. In this study, the divergence times of the homologous gene pairs between the wild and cultivated green jujube were assessed, revealing that most of these duplication events occurred between approximately 0.12 and 1.96 Mya (Table S3). Based on these results, the study concluded that gene duplications in flavonoid-related genes of green jujube primarily occurred following the divergence of the Z. mauritiana genome, rather than being driven by WGD events, which were consistent with the collinearity results (Figure 2 and Figure S1). Nevertheless, research on rice has shown that duplication events within current flavonoid gene families occurred approximately between 0.55 and 27.65 Mya, with at least four distinct expansion events identified during their evolutionary history [48]. Moreover, the ratio of Ka to Ks substitutions is commonly used to assess the selective pressures acting on genes following duplication events. The Ka/Ks ratios of duplicated gene pairs involved in the flavonoid pathway show that most genes predominantly underwent negative (or purifying) selection during the domestication history since the Ka/Ks ratios were less than 1.0. However, only two gene pairs exhibited Ka/Ks ratios greater than 1.0, suggesting that these specific genes may have experienced positive selection or relaxed selective constraints (Table S3). Together, these results suggest that most observed changes reflected the domestication effects, although the genomic rearrangements following the chromosome duplication event remain a possible confounder.
Comparative analyses between wild progenitors and their cultivated counterparts provide an invaluable approach to uncovering the genetic networks underlying the significant changes that have occurred over a relatively short evolutionary timescale. There is substantial evidence indicating that the spatiotemporal regulation of gene expression has been a crucial factor in domestication, resulting in numerous changes in metabolites [49,50,51,52]. Most flavonoid biosynthesis-related genes are significantly upregulated in wild loquat (Eriobotrya japonica); consequently, several related flavonoids significantly accumulate in wild loquats [20].
Similarly, the flavonoid metabolic profiles were also significantly altered, and the total amount of flavonoid metabolites in both fruits of six cultivated green jujube accessions significantly reduced in the fruits of three wild green jujube accessions (Figure 8 and Figure 9). Pathway analyses that combined the transcriptome and metabolome profiles (Figure 11) illustrated that most flavonoid-related genes significantly decreased their expressions in cultivated green jujube, particularly the CHS and CHI gene families. Considering the altered degree of expression levels, the CHS and CHI gene families may be considerably contribute to the altered flavonoid metabolic profiles between cultivated and wild green jujube. Although the untargeted metabolomic results are robust, absolute quantification of key flavonoids (e.g., phloretin, naringenin) using targeted LC–MS/MS should be performed in follow-up work.
In-depth studies on other species have shed light on the underlying genetic mechanisms. The specific single-nucleotide polymorphisms (SNPs) in the promoter region of CHS revealed the presence of species-specific alleles in wild and cultivated Citrus, which could be associated with expression-level differences at this locus, and was further confirmed through genomic sequencing, aligning with the haplotypes reported in the assembled lemon genome [52]. In addition, years of domestication have led to natural variation in the promoter region and alternative splicing of the DFR genes, both of which contribute to the altered accumulation of anthocyanins during the domestication of spiny Solanum [53]. FLS1 has been under selection during cassava (Manihot esculenta) domestication, resulting in decreased quercetin 3-O-glucoside content and consequently increased cassava storage root weight per plant [51]. Hence, future research should focus on conducting a thorough investigation of the genomic variations regulating these differentially expressed flavonoid-related genes in green jujube, such as SNP and alternative splicing.
Furthermore, the current study also screened out the potential transcription factors, namely, BBX21, WRI1 and bZIP44, regulating the expression profiles of flavonoid-related genes through the WGCNA analysis (Figure 10). The expression patterns of these three transcription factors were highly correlated with flavonoid-related genes, indicating the probable positive or negative regulation modules involved in the differential flavonoid synthetic pathways between the wild and cultivated green jujube. The transcription factors regulating the flavonoid pathway during domestication, such as MYB, bHLH, WRKY and MADS, were also found in rice [21,22], buckwheat [23], pea, tomato and other plant species, where the mutations in the MYB transcription factors are represented as causes of changes in flavonoid pigmentation during domestication [1]. Furthermore, sequence analysis of four genes, RLL1 (bHLH transcription factor), RLL2 (R2R3-MYB), RLL3 (R2-MYB) and RLL4 (WD-40) between wild and cultivated lettuce displayed that their function-changing mutations (such as a 5 bp deletion) occurred during domestication [54].
A comprehensive analysis of BBX21, WRI1 and bZIP44 should be performed using various molecular biology techniques to elucidate the regulatory mechanism. Several studies have also elucidated the roles of these three genes in flavonoid accumulation. Overexpression of the Arabidopsis BBX21 gene in potato plants resulted in increased production of anthocyanins and phenolic compounds, as well as elevated expression of genes involved in the phenylpropanoid biosynthesis pathway [55]. WRI1 exhibited a negative correlation with flavonoid accumulation in seeds of camelina (Camelina sativa) [56]. bZIP44 was predicted to be involved in grape (Vitis vinifera) [57], rapeseed (Brassica napus) [58] and Crataegus maximowiczii [59] flavonoid biosynthesis through the gene co-expression network. Furthermore, several studies have reported that the roles of BBX21, WRI1 and bZIP4 have been established in regulating flavonoid metabolism, and showed interactions with the MYB/bHLH/WD40 (MBW) complex. For instance, BBX23 overexpression in poplar activated expression of MYB and flavonoid-related genes, thereby promoting the accumulation of proanthocyanidins and anthocyanins [60]. Interactions of FaBBX24 with FaMYB5 have also been reported in strawberry [61]. BBX21 can activate the flavonoid-related gene, but the effects can be largely overwritten by the local MBW complex [62]. Primary studies of WRI1 and bZIP44 interacting with MYB and bHLH [63,64,65,66] have been performed; however, further verification experiments using molecular techniques, such as CRISPR/Cas9 knockouts and transient overexpression assays, are necessary to fully elucidate the regulatory network underlying the flavonoid biosynthetic pathway in green jujube.

5. Conclusions

The current study offers a comprehensive dissection of the genetic and biochemical mechanisms underlying differential flavonoid biosynthesis during green jujube domestication (Figure 12). By integrating comparative genomics, transcriptomics and metabolomics, the study identified 138 (out of 189) “functional” genes in cultivated green jujube, and 158 (out of 209) “functional” genes in wild green jujube across four haplotype genomes. This analysis revealed the dynamic “loss and gain” of gene family members and conserved evolutionary duplication events among homologous genes. The global view of flavonoid-related gene expressions and the flavonoid metabolites profile in the wild and cultivated green jujube shed light on the specific contributions of individual metabolites and their corresponding gene expressions during domestication. Gene co-expression network analysis identified the potential transcription factors (such as BBX21, WRI1 and bZIP44) and key flavonoid-related genes (such as CHS and CHI) that contribute to the differential flavonoid profiles in green jujube. Overall, this study provides a foundation for the following functional characterization of the identified regulators, providing mechanistic insights into flavonoid profile regulation in green jujube. This knowledge could be instrumental for optimizing secondary metabolism to enhance the fruit quality.

Supplementary Materials

The following supporting information can be downloaded from https://www.mdpi.com/article/10.3390/horticulturae11080974/s1—Figure S1: The number of different types of duplication events that occurred in the different haplotype genomes between the cultivated and wild fruits. Figure S2: The phylogenetic relationships of the (a) SDR, (b) CHI, (c) 2OGD, (d) PAL, (e) 4CL, (f) PPO and (g) UGT84A gene families. Table S1: Summary of the six cultivated and three wild green jujube accessions used in this study. Figure S3: Determination of soft-threshold power in the WGCNA. (a) the scale-independent mean connectivity, (b) the soft-threshold-powered scale-free topology. Table S2: Characteristics of the flavonoid-related genes in the haplotype genome of wild and cultivated green jujube and their expression profiles in different tissues. Table S3: The Ka/Ks ratios and divergence times of the duplicated paralog flavonoid-related genes. Table S4: Expression profiles of the flavonoid-related genes in the fruits of different accessions of the wild and cultivated green jujube. Table S5: Profiles of flavonoid metabolites in different fruits of the cultivated and wild green jujube.

Author Contributions

Conceptualization, X.Z. and F.J.; methodology, H.W.; software, H.W.; validation, H.W. and H.L.; formal analysis, X.Z., P.C. and M.W.; investigation, X.Z.; resources, H.L.; data curation, P.C. and H.L.; writing—original draft preparation, X.Z.; writing—review and editing, F.J.; visualization, X.Z. and M.W.; supervision, F.J.; project administration, F.J.; funding acquisition, F.J. All authors have read and agreed to the published version of the manuscript.

Funding

This research was funded by Basic Scientific Research Project of Fujian Public Welfare Scientific Research Institute (F.J.), Natural Science Foundation Project of Zhangzhou City (X.Z.), and National Germplasm Repository for Fujian-Taiwan Characteristic Crops (Zhangzhou) (F.J.).

Data Availability Statement

The original contributions presented in this study are included in the article. Further inquiries can be directed to the corresponding author.

Acknowledgments

The authors sincerely thank Mingxin Guo from Luoyang Normal University for his generous support in providing the data, which were the basis of this study.

Conflicts of Interest

The authors declare no conflicts of interest.

Abbreviations

The following abbreviations are used in this manuscript:
4CL4-coumarate: coenzyme a ligase
ANRanthocyanidin reductase
ANSanthocyanidin synthase
C4Htrans-cinnamate 4-monooxygenase
CHIchalcone isomerase
CHSchalcone synthase
DFRdihydroflavonol 4-reductase
F3Hflavanone 3-hydroxylase
F3′Hflavonoid 3′-hydroxylase
F3′5′Hflavonoid 3′5′-hydroxylase
FLSflavonol synthase
FNSIIflavone synthase II
LARleucoanthocyanidin reductase
LDOXleucoanthocyanidin dioxygenase
PALphenylalanine ammonia lyase
PPOpolyphenol oxidase
SCPLserine carboxypeptidase-like
UGT84AUDP-glycosyltransferase
P450cytochrome P450-dependent monooxygenase
2-OGD2-oxoglutarate dependent dioxygenase
SDRshort-chain dehydrogenase/reductase
BBXB-box
WRI1WRINKLED1
bZIPbasic leucine zipper

References

  1. Paauw, M.; Koes, R.; Quattrocchio, F.M. Alteration of flavonoid pigmentation patterns during domestication of food crops. J. Exp. Bot. 2019, 70, 3719–3735. [Google Scholar] [CrossRef]
  2. Rathore, R.S.; Jiang, W.; Sedeek, K.; Mahfouz, M. Harnessing neo-domestication of wild pigmented rice for enhanced nutrition and sustainable agriculture. Theor. Appl. Genet. 2025, 138, 108. [Google Scholar] [CrossRef]
  3. Kumar, S.N.; Das, U.; Immanuel, S.C. Indian jujube a potential fruit tree to improve the livelihood. Saudi J. Biol. Sci. 2023, 30, 103769. [Google Scholar] [CrossRef] [PubMed]
  4. O’Brien, C.J.; Campbell, S.; Young, A.; Vogler, W.; Galea, V.J. Chinee apple (Ziziphus mauritiana): A comprehensive review of its weediness, ecological impacts and management approaches. Plants 2023, 12, 3213. [Google Scholar] [CrossRef]
  5. Memon, A.A.; Memon, N.; Bhanger, M.I.; Luthria, D.L. Assay of phenolic compounds from four species of ber (Ziziphus mauritiana L.) fruits: Comparison of three base hydrolysis procedure for quantification of total phenolic acids. Food Chem. 2013, 139, 496–502. [Google Scholar] [CrossRef] [PubMed]
  6. Zozio, S.; Servent, A.; Cazal, G.; Mbéguié-A-Mbéguié, D.; Ravion, S.; Pallet, D.; Abel, H. Changes in antioxidant activity during the ripening of jujube (Ziziphus mauritiana Lamk). Food Chem. 2014, 150, 448–456. [Google Scholar] [CrossRef]
  7. Wang, Z.T.; Liu, Y.P.; Ma, Y.L.; Pan, S.Y.; Li, J.K.; Shi, S.J.; Wu, Z.F.; Li, Z.; Shang, Y.F.; Wei, Z.J. Insight into the phenolics and antioxidant activity of Indian jujube (Ziziphus mauritiana Lamk) peel and pulp subjected to the simulated digestion. Heliyon 2023, 9, e16226. [Google Scholar] [CrossRef] [PubMed]
  8. Ren, Z.; Yin, X.; Liu, L.; Zhang, L.; Shen, W.; Fang, Z.; Yu, Q.; Qin, L.; Chen, L.; Jia, R.; et al. Flavonoid localization in soybean seeds: Comparative analysis of wild (Glycine soja) and cultivated (Glycine max) varieties. Food Chem. 2024, 456, 139883. [Google Scholar] [CrossRef]
  9. Huang, Z.; Shen, F.; Chen, Y.; Cao, K.; Wang, L. Chromosome-scale genome assembly and population genomics provide insights into the adaptation, domestication, and flavonoid metabolism of Chinese plum. Plant J. 2021, 108, 1174–1192. [Google Scholar] [CrossRef]
  10. Cao, K.; Wang, B.; Fang, W.; Zhu, G.; Chen, C.; Wang, X.; Li, Y.; Wu, J.; Tang, T.; Fei, Z.; et al. Combined nature and human selections reshaped peach fruit metabolome. Genome Biol. 2022, 23, 146. [Google Scholar] [CrossRef]
  11. Yuan, P.; Xu, C.; He, N.; Lu, X.; Zhang, X.; Shang, J.; Zhu, H.; Gong, C.; Kuang, H.; Tang, T.; et al. Watermelon domestication was shaped by stepwise selection and regulation of the metabolome. Sci. China Life Sci. 2023, 66, 579–594. [Google Scholar] [CrossRef]
  12. Xie, X.; Tian, J.; Wang, Y.; Shu, C.; Gui, H.; Cheng, Z.; Wang, Z.; Song, Z.; Tian, Q.; Wen, B.; et al. Comparison of the content of taste and nutrition-related non-volatile compounds in cultivated and wild blueberry varieties in Northeast China. Food Chem. X 2025, 25, 102235. [Google Scholar] [CrossRef] [PubMed]
  13. Lin, Q.; Chen, J.; Liu, X.; Wang, B.; Zhao, Y.; Liao, L.; Allan, A.C.; Sun, C.; Duan, Y.; Li, X.; et al. A metabolic perspective of selection for fruit quality related to apple domestication and improvement. Genome Biol. 2023, 24, 95. [Google Scholar] [CrossRef] [PubMed]
  14. Rao, M.J.; Wu, S.; Duan, M.; Wang, L. Antioxidant metabolites in primitive, wild, and cultivated citrus and their role in stress tolerance. Molecules 2021, 26, 5801. [Google Scholar] [CrossRef]
  15. Li, Z.; Li, J.; Shu, Z.; Xu, M.; Zhang, Y.; Gu, J.; Chen, J.; Li, X.; Wang, M. Comparative metabolomic analysis provides insights into the metabolite profiles of wild and cultivated Dendrobium flexicaule. BMC Plant Biol. 2025, 25, 217. [Google Scholar] [CrossRef] [PubMed]
  16. Olennikov, D.N.; Kashchenko, N.I. Flavonoids in Cucurbitaceae herbs: Targeted HPLC-PDA-mS profiling of wild and cultivated Cucumis, Echinocystis, and Melothria species and their pancreatic lipase inhibitory potential. Nat. Prod. Res. 2025; ahead of print. [Google Scholar] [CrossRef]
  17. Milošević, M.; Vulić, J.; Kukrić, Z.; Lazić, B.; Četojević-Simin, D.; Čanadanović-Brunet, J. Polyphenolic composition, antioxidant and antiproliferative activity of edible and inedible parts of cultivated and wild pomegranate (Punica granatum L.). Food Technol. Biotechnol. 2023, 61, 485–493. [Google Scholar] [CrossRef]
  18. Tomou, E.M.; Goula, K.; Skaltsa, H.; Urmann, C. Comparative phytochemical analysis of cultivated and wild Sideritis raeseri Boiss. & Heldr. subsp. raeseri infusions. Nat. Prod. Res. 2025, 39, 2608–2613. [Google Scholar] [CrossRef]
  19. Ouerghemmi, I.; Rebey, I.B.; Rahali, F.Z.; Bourgou, S.; Pistelli, L.; Ksouri, R.; Marzouk, B.; Tounsi, M.S. Antioxidant and antimicrobial phenolic compounds from extracts of cultivated and wild-grown Tunisian Ruta chalepensis. J. Food Drug Anal. 2017, 25, 350–359. [Google Scholar] [CrossRef]
  20. Jing, D.; Liu, X.; He, Q.; Dang, J.; Hu, R.; Xia, Y.; Wu, D.; Wang, S.; Zhang, Y.; Xia, Q.; et al. Genome assembly of wild loquat (Eriobotrya japonica) and resequencing provide new insights into the genomic evolution and fruit domestication in loquat. Hortic. Res. 2022, 10, uhac265. [Google Scholar] [CrossRef]
  21. Zheng, J.; Wu, H.; Zhu, H.; Huang, C.; Liu, C.; Chang, Y.; Kong, Z.; Zhou, Z.; Wang, G.; Lin, Y.; et al. Determining factors, regulation system, and domestication of anthocyanin biosynthesis in rice leaves. New Phytol. 2019, 223, 705–721. [Google Scholar] [CrossRef]
  22. Qiao, W.; Wang, Y.; Xu, R.; Yang, Z.; Sun, Y.; Su, L.; Zhang, L.; Wang, J.; Huang, J.; Zheng, X.; et al. A functional chromogen gene C from wild rice is involved in a different anthocyanin biosynthesis pathway in indica and japonica. Theor. Appl. Genet. 2021, 134, 1531–1543. [Google Scholar] [CrossRef]
  23. Huang, X.; He, Y.; Zhang, K.; Shi, Y.; Zhao, H.; Lai, D.; Lin, H.; Wang, X.; Yang, Z.; Xiao, Y.; et al. Evolution and domestication of a novel biosynthetic gene cluster contributing to the flavonoid metabolism and high-altitude adaptability of plants in the Fagopyrum genus. Adv. Sci. 2024, 11, e2403603. [Google Scholar] [CrossRef]
  24. Guo, M.; Bi, G.; Wang, H.; Ren, H.; Chen, J.; Lian, Q.; Wang, X.; Fang, W.; Zhang, J.; Dong, Z.; et al. Genomes of autotetraploid wild and cultivated Ziziphus mauritiana reveal polyploid evolution and crop domestication. Plant Physiol. 2024, 196, 2701–2720. [Google Scholar] [CrossRef] [PubMed]
  25. Du, L.; Lu, C.; Wang, Z.; Zou, L.; Xiong, Y.; Zhang, Q. GFAnno: Integrated method for plant flavonoid biosynthesis pathway gene annotation. Beverage Plant Res. 2024, 4, e008. [Google Scholar] [CrossRef]
  26. Capella-Gutiérrez, S.; Silla-Martínez, J.M.; Gabaldón, T. trimAl: A tool for automated alignment trimming in large-scale phylogenetic analyses. Bioinformatics 2009, 25, 1972–1973. [Google Scholar] [CrossRef]
  27. Tamura, K.; Stecher, G.; Kumar, S. MEGA11: Molecular evolutionary genetics analysis version 11. Mol. Biol. Evol. 2021, 38, 3022–3027. [Google Scholar] [CrossRef]
  28. Xie, J.; Chen, Y.; Cai, G.; Cai, R.; Hu, Z.; Wang, H. Tree Visualization By One Table (tvBOT): A web application for visualizing, modifying and annotating phylogenetic trees. Nucleic Acids Res. 2023, 51, W587–W592. [Google Scholar] [CrossRef] [PubMed]
  29. Chen, S.; Zhou, Y.; Chen, Y.; Gu, J. fastp: An ultra-fast all-in-one FASTQ preprocessor. Bioinformatics 2018, 34, i884–i890. [Google Scholar] [CrossRef]
  30. Bray, N.L.; Pimentel, H.; Melsted, P.; Pachter, L. Near-optimal probabilistic RNA-seq quantification. Nat. Biotechnol. 2016, 34, 525–527. [Google Scholar] [CrossRef]
  31. Chen, C.; Wu, Y.; Li, J.; Wang, X.; Zeng, Z.; Xu, J.; Liu, Y.; Feng, J.; Chen, H.; He, Y.; et al. TBtools-II: A “one for all, all for one” bioinformatics platform for biological big-data mining. Mol. Plant 2023, 16, 1733–1742. [Google Scholar] [CrossRef]
  32. Mantica, F.; Iñiguez, L.P.; Marquez, Y.; Permanyer, J.; Torres-Mendez, A.; Cruz, J.; Franch-Marro, X.; Tulenko, F.; Burguera, D.; Bertrand, S.; et al. Evolution of tissue-specific expression of ancestral genes across vertebrates and insects. Nat. Ecol. Evol. 2024, 8, 1140–1153. [Google Scholar] [CrossRef]
  33. Emms, D.M.; Kelly, S. OrthoFinder: Phylogenetic orthology inference for comparative genomics. Genome Biol. 2019, 20, 238. [Google Scholar] [CrossRef]
  34. Langfelder, P.; Horvath, S. Fast R functions for robust correlations and hierarchical clustering. J. Stat. Softw. 2012, 46, i11. [Google Scholar] [CrossRef] [PubMed]
  35. Wang, X.; Liang, S.; Yang, W.; Yu, K.; Liang, F.; Zhao, B.; Zhu, X.; Zhou, C.; Mur, L.A.J.; Roberts, J.A.; et al. MetMiner: A user-friendly pipeline for large-scale plant metabolomics data analysis. J. Integr. Plant Biol. 2024, 66, 2329–2345. [Google Scholar] [CrossRef]
  36. Wang, Y.; Tang, H.; Debarry, J.D.; Tan, X.; Li, J.; Wang, X.; Lee, T.H.; Jin, H.; Marler, B.; Guo, H.; et al. MCScanX: A toolkit for detection and evolutionary analysis of gene synteny and collinearity. Nucleic Acids Res. 2012, 40, e49. [Google Scholar] [CrossRef]
  37. Zhang, Z. KaKs_Calculator 3.0: Calculating selective pressure on coding and non-coding sequences. Genom. Proteom. Bioinform. 2022, 20, 536–540. [Google Scholar] [CrossRef]
  38. Huang, Z.; Duan, W.; Song, X.; Tang, J.; Wu, P.; Zhang, B.; Hou, X. Retention, molecular evolution, and expression divergence of the auxin/indole acetic acid and auxin response factor gene families in Brassica rapa shed light on their evolution patterns in plants. Genome Biol. Evol. 2015, 8, 302–316. [Google Scholar] [CrossRef]
  39. Allen, M.; Poggiali, D.; Whitaker, K.; Marshall, T.R.; van Langen, J.; Kievit, R.A. Raincloud plots: A multi-platform tool for robust data visualization. Wellcome Open Res. 2021, 4, 63. [Google Scholar] [CrossRef] [PubMed]
  40. Zhu, X.; Wang, M.; Li, X.; Jiu, S.; Wang, C.; Fang, J. Genome-wide analysis of the sucrose synthase gene family in grape (Vitis vinifera): Structure, evolution, and expression profiles. Genes 2017, 8, 111. [Google Scholar] [CrossRef]
  41. Anjum, A.; Haram, A.; Ahmad, R.; Bashir, A. Physico-chemical attributes of fresh and dried Indian jujube (Zizyphus mauritiana) fruits. Pak. J. Agri. Sci. 2020, 57, 165–176. [Google Scholar] [CrossRef]
  42. Ishtiaq, A.; Muhammad, N.; Irfan, A.; Maryam, M.; Al-Khayri, M.; Yousaf, M.; Rahmatullah, Q. Fruit morphological attributes to assess genetic diversity in jujube (Ziziphus mauritiana L.) germplasm of Bahawalpur. Pure Appl. Biol. 2016, 5, 921–926. [Google Scholar] [CrossRef]
  43. Ngigi, P.B.; Termote, C.; Pallet, D.; Amiot, M.J. Mainstreaming traditional fruits, vegetables and pulses for nutrition, income, and sustainability in sub-Saharan Africa: The case for Kenya and Ethiopia. Front. Nutr. 2023, 10, 1197703. [Google Scholar] [CrossRef]
  44. Nyanga, L.K.; Gadaga, T.H.; Nout, M.J.; Smid, E.J.; Boekhout, T.; Zwietering, M.H. Nutritive value of masau (Ziziphus mauritiana) fruits from Zambezi Valley in Zimbabwe. Food Chem. 2013, 138, 168–172. [Google Scholar] [CrossRef]
  45. Muhammad, N.; Luo, Z.; Meng, X.; Zhao, X.; Wang, J.; Yang, M.; Liu, Z.; Liu, M. Comparative transcriptome profiling unveils the potential key genes involved in peel coloration between Ziziphus mauritiana Lam. and Z. jujuba Mill. Sci. Hortic. 2023, 319, 112175. [Google Scholar] [CrossRef]
  46. Deng, Y.; Li, C.; Li, H.; Lu, S. Identification and characterization of flavonoid biosynthetic enzyme genes in Salvia miltiorrhiza (Lamiaceae). Molecules 2018, 23, 1467. [Google Scholar] [CrossRef]
  47. Zhang, L.; Sun, X.; Wilson, I.W.; Shao, F.; Qiu, D. Identification of the genes involved in anthocyanin biosynthesis and accumulation in Taxus chinensis. Genes 2019, 10, 982. [Google Scholar] [CrossRef]
  48. Wang, J.; Zhang, C.; Li, Y. Genome-wide identification and expression profiles of 13 key structural gene families involved in the biosynthesis of rice flavonoid scaffolds. Genes 2022, 13, 410. [Google Scholar] [CrossRef]
  49. Tong, W.; Wang, Y.; Li, F.; Zhai, F.; Su, J.; Wu, D.; Yi, L.; Gao, Q.; Wu, Q.; Xia, E. Genomic variation of 363 diverse tea accessions unveils the genetic diversity, domestication, and structural variations associated with tea adaptation. J. Integr. Plant Biol. 2024, 66, 2175–2190. [Google Scholar] [CrossRef]
  50. Klčová, B.; Balarynová, J.; Trněný, O.; Krejčí, P.; Cechová, M.Z.; Leonova, T.; Gorbach, D.; Frolova, N.; Kysil, E.; Orlova, A.; et al. Domestication has altered gene expression and secondary metabolites in pea seed coat. Plant J. 2024, 118, 2269–2295. [Google Scholar] [CrossRef] [PubMed]
  51. Ding, Z.; Fu, L.; Wang, B.; Ye, J.; Ou, W.; Yan, Y.; Li, M.; Zeng, L.; Dong, X.; Tie, W.; et al. Metabolic GWAS-based dissection of genetic basis underlying nutrient quality variation and domestication of cassava storage root. Genome Biol. 2023, 24, 289. [Google Scholar] [CrossRef] [PubMed]
  52. Borredá, C.; Perez-Roman, E.; Talon, M.; Terol, J. Comparative transcriptomics of wild and commercial Citrus during early ripening reveals how domestication shaped fruit gene expression. BMC Plant Biol. 2022, 22, 123. [Google Scholar] [CrossRef]
  53. Wang, X.; Chen, X.; Luo, S.; Ma, W.; Li, N.; Zhang, W.; Tikunov, Y.; Xuan, S.; Zhao, J.; Wang, Y.; et al. Discovery of a DFR gene that controls anthocyanin accumulation in the spiny Solanum group: Roles of a natural promoter variant and alternative splicing. Plant J. 2022, 111, 1096–1109. [Google Scholar] [CrossRef]
  54. Su, W.; Tao, R.; Liu, W.; Yu, C.; Yue, Z.; He, S.; Lavelle, D.; Zhang, W.; Zhang, L.; An, G.; et al. Characterization of four polymorphic genes controlling red leaf colour in lettuce that have undergone disruptive selection since domestication. Plant Biotechnol. J. 2020, 18, 479–490. [Google Scholar] [CrossRef]
  55. Crocco, C.D.; Ocampo, G.G.; Ploschuk, E.L.; Mantese, A.; Botto, J.F. Heterologous expression of AtBBX21 enhances the rate of photosynthesis and alleviates photoinhibition in Solanum tuberosum. Plant Physiol. 2018, 177, 369–380. [Google Scholar] [CrossRef]
  56. Cai, Y.; Liang, Y.; Shi, H.; Cui, J.; Prakash, S.; Zhang, J.; Anaokar, S.; Chai, J.; Schwender, J.; Lu, C.; et al. Creating yellow seed Camelina sativa with enhanced oil accumulation by CRISPR-mediated disruption of Transparent Testa 8. Plant Biotechnol. J. 2024, 22, 2773–2784. [Google Scholar] [CrossRef]
  57. Dou, F.; Phillip, F.O.; Liu, H. Combined metabolome and transcriptome analysis revealed the accumulation of anthocyanins in grape berry (Vitis vinifera L.) under high-temperature stress. Plants 2024, 13, 2394. [Google Scholar] [CrossRef] [PubMed]
  58. Guan, M.; Shi, X.; Chen, S.; Wan, Y.; Tang, Y.; Zhao, T.; Gao, L.; Sun, F.; Yin, N.; Zhao, H.; et al. Comparative transcriptome analysis identifies candidate genes related to seed coat color in rapeseed. Front. Plant Sci. 2023, 14, 1154208. [Google Scholar] [CrossRef]
  59. Zhang, X.; Wang, J.; Li, P.; Sun, C.; Dong, W. Integrative metabolome and transcriptome analyses reveals the black fruit coloring mechanism of Crataegus maximowiczii C. K. Schneid. Plant Physiol. Biochem. 2023, 194, 111–121. [Google Scholar] [CrossRef]
  60. Li, C.; Pei, J.; Yan, X.; Cui, X.; Tsuruta, M.; Liu, Y.; Lian, C. A poplar B-box protein PtrBBX23 modulates the accumulation of anthocyanins and proanthocyanidins in response to high light. Plant Cell Environ. 2021, 44, 3015–3033. [Google Scholar] [CrossRef] [PubMed]
  61. Zhang, L.; Wang, Y.; Yue, M.; Jiang, L.; Zhang, N.; Luo, Y.; Chen, Q.; Zhang, Y.; Wang, Y.; Li, M.; et al. FaMYB5 interacts with FaBBX24 to regulate anthocyanin and proanthocyanidin biosynthesis in Strawberry (Fragaria × ananassa). Int. J. Mol. Sci. 2023, 24, 12185. [Google Scholar] [CrossRef] [PubMed]
  62. Li, N.; Xu, Y.; Lu, Y. A regulatory mechanism on pathways: Modulating roles of MYC2 and BBX21 in the flavonoid network. Plants 2024, 13, 1156. [Google Scholar] [CrossRef] [PubMed]
  63. Gong, W.; Song, Q.; Ji, K.; Gong, S.; Wang, L.; Chen, L.; Zhang, J.; Yuan, D. Full-length transcriptome from Camellia oleifera seed provides insight into the transcript variants involved in oil biosynthesis. J. Agric. Food Chem. 2020, 68, 14670–14683. [Google Scholar] [CrossRef] [PubMed]
  64. Shi, P.; Hua, W.; Htwe, Y.M.; Zhang, D.; Li, J.; Wang, Y. Abscisic acid improves linoleic acid accumulation possibly by promoting expression of EgFAD2 and other fatty acid biosynthesis genes in oil palm mesocarp. Front. Plant Sci. 2021, 12, 748130. [Google Scholar] [CrossRef]
  65. Ying, J.; Wen, S.; Cai, Y.; Ye, Y.; Li, L.; Qian, R. Decoding anthocyanin biosynthesis regulation in Asparagus officinalis peel coloration: Insights from integrated metabolomic and transcriptomic analyses. Plant Physiol. Biochem. 2024, 215, 108980. [Google Scholar] [CrossRef]
  66. Zhou, Y.; Xu, Y.; Zhu, G.F.; Tan, J.; Lin, J.; Huang, L.; Ye, Y.; Liu, J. Pigment diversity in leaves of Caladium × hortulanum Birdsey and transcriptomic and metabolic comparisons between red and white leaves. Int. J. Mol. Sci. 2024, 25, 605. [Google Scholar] [CrossRef] [PubMed]
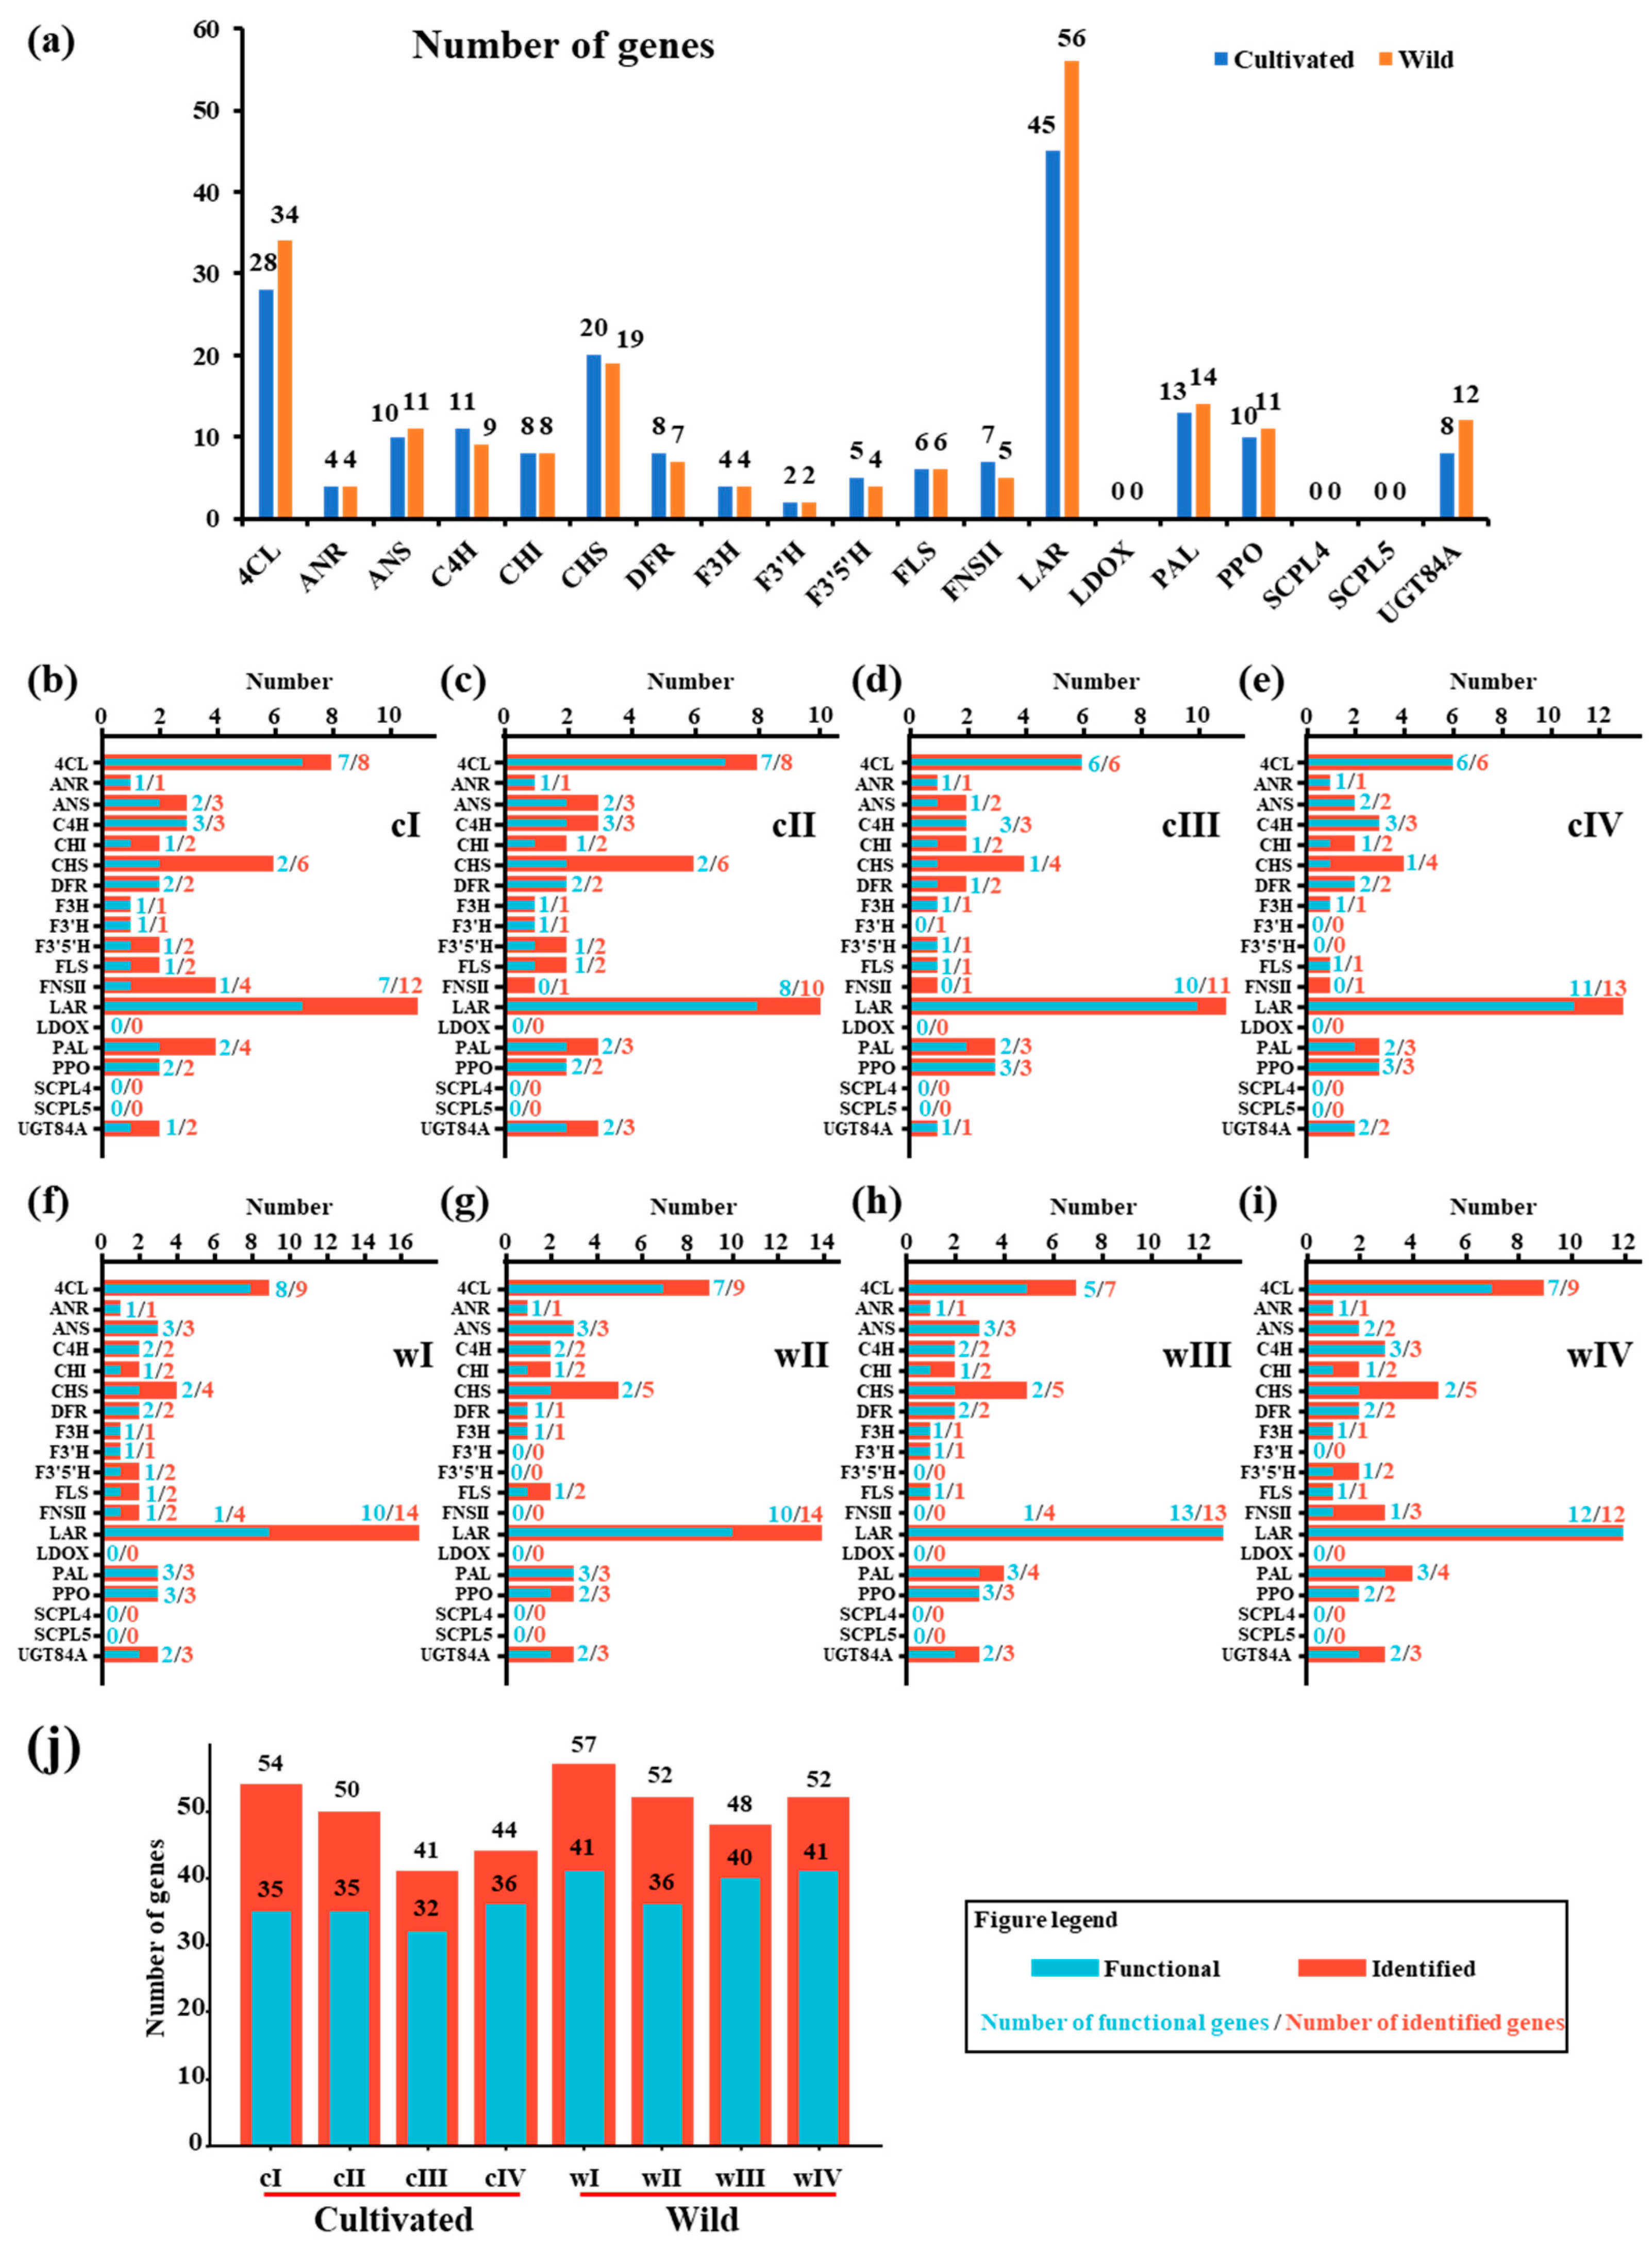
Figure 1. Identification of flavonoid-related genes in the haplotype genomes of the cultivated and wild green jujube. (a) Total number of flavonoid-related genes in the genomes of cultivated and wild green jujube. Number of identified and functional flavonoid-related genes in the (b) cI, (c) cII, (d) cIII, (e) cIV, (f) wI, (g) wII, (h) wIII and (i) wIV chromosomes. (j) The total number of identified and functional flavonoid-related genes in different genomes. The letters “c” and “w” signify the cultivated and wild Z. mauritiana, respectively, and the letters “I”, “II”, “III” and “IV” signify the four haplotype genomes, respectively. The number on the top of the bar indicates the number of members of the gene family, the blue number represents the number of “functional” genes, and the red number represents the number of identified genes.
Horticulturae 11 00974 g001
Figure 2. Evolution patterns of identified flavonoid-related genes in the haplotype genomes of cultivated and wild green jujube. The letters “c” and “w” signify the cultivated and wild Z. mauritiana, respectively, and the letters “I”, “II”, “III” and “IV” signify the four haplotype genomes, respectively. The blue circles indicate that the gene showed WGD, a purple square indicates tandem duplication, a red triangle means proximal duplication and a green lozenge means dispersed duplication. Genes belonging to the same gene family and labeled with purple in the same haplotype genome indicate these genes were paired with tandem duplication. Genes belonging to the same gene family in different haplotype genomes (labeled with green) indicate these genes were paired with WGD.
Horticulturae 11 00974 g002
Figure 3. The phylogenetic relationships of the (a) CHS and (b) P450 gene families.
Horticulturae 11 00974 g003
Figure 4. Expression profiles of flavonoid-related genes in different tissues of the wild and cultivated green jujube. Flavonoid-related genes from the (a) cI, (b) cII, (c) cIII, (d) cIV, (e) wI, (f) wII, (g) wIII and (h) wIV genomes are illustrated. The heatmap was constructed using relative log2 (TPM+1) values derived from the transcriptomic data. The color gradient from white to red indicates a gradual increase in the gene expression levels.
Horticulturae 11 00974 g004
Figure 5. Expression profiles of functional flavonoid-related genes in different tissues of the wild and cultivated green jujube and their tissue specificity indices (TAUs). The functional flavonoid-related genes in the different tissues of the (a) cultivated and (b) wild green jujube. (c) TAU indices of functional flavonoid-related genes in the cultivated and wild genomes. A red dot in (c) indicates a gene with TAU > 0.9, and the circle size indicates the number of genes with TAU > 0.9 in the specified tissue. The heatmap was constructed using relative log2 (TPM+1) values derived from the transcriptomic data. The color gradient from cyan to orange indicates a gradual increase in the gene expression levels.
Horticulturae 11 00974 g005
Figure 6. Expression profiles of the functional flavonoid-related genes in different fruits of the wild and cultivated green jujube. (a) 4CL gene family. (b) ANR. (c) ANS. (d) C4H. (e) CHI. (f) CHS. (g) DFR. (h) F3H. (i) F3′H. (j) F3′5′H. (k) FLS. (l) FNSII. (m) LAR. (n) PAL. (o) PPO. (p) UGT84A. The heatmap was constructed using relative log2 (TPM+1) values derived from the transcriptomic data. The color gradient from green to red indicates a gradual increase in the gene expression levels.
Horticulturae 11 00974 g006
Figure 7. Difference significance analysis of functional flavonoid-related genes between cultivated and wild green jujube. (a) 4CL gene family. (b) ANR. (c) ANS. (d) C4H. (e) CHI. (f) CHS. (g) DFR. (h) F3′5′H. (i) F3H. (j) F3′H. (k) FLS. (l) FNSII. (m) LAR. (n) PAL. (o) PPO. (p) UGT84A. The Wilcoxon rank-sum test and Kruskal–Wallis tests were used to calculate the significance. A blue box enclosing a gene family indicates the genes had no significant difference (p > 0.05) and a red box indicates the genes showed a significant difference (p < 0.05).
Horticulturae 11 00974 g007
Figure 8. Metabolic profiles of flavonoid metabolites in the cultivated and wild green jujube fruits. (a) Raincloud plot of flavonoid profiles. A raincloud plot combines three plots: a violin plot (a density plot representing data distribution), box plot (showing median, quartiles and outliers) and swarm plot (showing raw data points to observe data granularity and potential outliers). (b) PCA results. (c) Number of different types of flavonoid metabolites. (d) Wilcoxon rank-sum and (e) Kruskal–Wallis tests of flavonoid profiles.
Horticulturae 11 00974 g008
Figure 9. Differential flavonoid metabolites (DFMs) in the cultivated and wild fruits. (a) Composition of the 66 DFMs. (b) Composition of the 52 upregulated and 14 downregulated DFMs. (c) Accumulation levels of the 66 DFMs. (d) VIP values of the 66 DFMs. (e) Log2FoldChange values of the 66 DFMs.
Horticulturae 11 00974 g009
Figure 10. WGCNA analysis and expression profiles of BBX21, WRI1 and bZIP44 in the different fruits and tissues of the cultivated and wild green jujube. (a) The cluster dendrogram illustrates the gene expression patterns in the wild and cultivated green jujube fruits. Each branch corresponds to a single gene, while the colors beneath the dendrogram indicate distinct co-expression modules. (b) Heatmap of the correlation between the module eigengenes (MEs) and the top 18 upregulated DFMs in the wild green jujube. The top and bottom (in parentheses) numbers in each box represent the correlated index and p-value, respectively. The expressions of BBX21 in the different fruits (c) and tissues (d). The expressions of WRI1 in the different fruits (e) and tissues (f). The expressions of bZIP44 in the different fruits (g) and tissues (h). The heatmap was constructed using relative log2 (TPM+1) values derived from the transcriptomic data. The color gradients from green to red or cyan to orange indicate a gradual increase in the gene expression levels.
Horticulturae 11 00974 g010
Figure 11. Differences in the metabolic and transcriptional regulation of flavonoid biosynthesis in the cultivated and wild green jujube fruits. The numbers in the boxes indicate the numbers of highly expressed genes and all the functional genes in the cultivated and wild fruits. Different colored boxes indicate the significance levels of gene expression between the cultivated and wild fruits. Based on the Wilcoxon and Kruskal–Wallis tests, the significance levels were divided into five groups, i.e., not significant, p < 0.05, p < 0.01, p < 0.001 and p < 0.0001, which are labeled in grey, green, orange, pink and red, respectively. A solid box indicates the gene was upregulated in wild fruits and a dashed box indicated the gene was downregulated in wild fruits based on the significance analysis. A red circle indicates an upregulated DFM in wild fruits and a blue circle means a downregulated DFM in wild fruits. The size of the circles indicates the VIP value.
Horticulturae 11 00974 g011
Figure 12. Model of the effects of domestication on the flavonoid pathways in green jujube.
Horticulturae 11 00974 g012
Disclaimer/Publisher’s Note: The statements, opinions and data contained in all publications are solely those of the individual author(s) and contributor(s) and not of MDPI and/or the editor(s). MDPI and/or the editor(s) disclaim responsibility for any injury to people or property resulting from any ideas, methods, instructions or products referred to in the content.