Article

Comparative Analysis of Phenolic Acid Metabolites and Differential Genes Between Browning-Resistant and Browning-Sensitive luffa During the Commercial Fruit Stage

1
Department of Agronomy and Horticulture, Jiangsu Vocational College of Agriculture and Forestry, Jurong 212400, China
2
Engineering and Technical Center for Modern Horticulture, Jiangsu Vocational College of Agriculture and Forestry, Jurong 212400, China
3
Jiangsu Academy of Agricultural Sciences, Nanjing 210014, China
4
Taizhou Institute of Agricultural Sciences, Jiangsu Academy of Agricultural Sciences, Taizhou 225300, China
5
Nanjing Agricultural University (Changshu) New Rural Development Research Institute Co., Ltd., Suzhou 215500, China
6
College of Horticulture, Nanjing Agricultural University, Nanjing 210014, China
*
Authors to whom correspondence should be addressed.
Horticulturae 2025, 11(8), 903; https://doi.org/10.3390/horticulturae11080903 (registering DOI)
Submission received: 3 June 2025 / Revised: 24 July 2025 / Accepted: 26 July 2025 / Published: 4 August 2025

Abstract

Browning significantly impacts the commercial value of luffa (luffa cylindrica) and is primarily driven by the metabolic processes of phenolic acids. Investigating changes in phenolic acids during browning aids in understanding the physiological mechanisms underlying this process and provides a basis for improving storage, processing, variety breeding, and utilization of germplasm resources. This study compared browning-resistant (‘30’) and browning-sensitive (‘256’) luffa varieties using high-throughput sequencing and metabolomics techniques. The results revealed 55 genes involved in the phenylpropanoid biosynthesis pathway, including 8 phenylalanine ammonia-lyase (PAL) genes, 20 peroxidase (POD) genes, 2 polyphenol oxidase (PPO) genes associated with tyrosine metabolism, and 37 peroxisome-related genes. Real-time quantitative (qPCR) was employed to validate 15 browning-related genes, revealing that the expression levels of LcPOD21 and LcPOD6 were 12.5-fold and 25-fold higher in ‘30’ compared to ‘256’, while LcPAL5 and LcPAL4 were upregulated in ‘30’. Enzyme analysis showed that catalase (CAT) and phenylalanine ammonia-lyase (PAL) activities were higher in ‘30’ than in ‘256’. Conversely, superoxide dismutase (SOD) and polyphenol oxidase (PPO) activities were reduced in ‘30’, whereas CAT activity was upregulated. The concentrations of cinnamic acid, p-coumaric acid, trans-5-O-(4-coumaroyl)mangiferic acid, and caffealdehyde were lower in browning-resistant luffa ‘30’ than in browning-sensitive luffa ‘256’, suggesting that their levels influence browning in luffa. These findings elucidate the mechanisms underlying browning and inform strategies for the storage, processing, and genetic improvement of luffa.

1. Introduction

Common luffa (luffa cylindrica) belongs to the Cucurbitaceae family and the genus luffa [1]. It is an important vegetable and medicinal plant in the tropics and subtropics worldwide [2]. It is rich in cellulose, minerals, and saponins and is recognized for its medicinal value [3]. However, common luffa is susceptible to browning during high-temperature cooking, resulting in soups turning black, which adversely affects its flavor, nutritional value, and commercial value [4]. Clarifying the molecular mechanisms of luffa browning and breeding browning-resistant luffa varieties have become important goals in luffa breeding.
With the rising popularity and advancement of bioinformatics, we can now more efficiently and accurately uncover the genes that influence fruit and vegetable browning. Transcriptome analysis revealed the molecular basis for differences between two luffa varieties with different degrees of resistance to browning (the resistant variety YLB05 and the susceptible variety XTR05). The results showed that key regulatory genes in the phenolic oxidation, carbohydrate metabolism, and hormone response pathways were differentially expressed. In the browning-resistant luffa variety ‘YLB05’, two PPO genes, three POD genes, and four PAL genes were significantly downregulated compared to those in ‘XTR05’ [5]. Similarly, during the enzymatic browning process of fresh-cut luffa, Zhu et al. identified 11 genes that may play a role in the enzymatic browning process, and they belong to five gene families, namely, PPO, PAL, POD, CAT, and SOD [6]. Based on comparative transcriptome analysis of browning and non-browning fresh-cut walnut cultivars, Zhang et al. screened eight genes involved in enzymatic browning. These genes were classified according to their functions, as follows: two PAL genes, one CHS gene, and two 4CL genes related to the phenylpropane pathway; two PPO genes that directly catalyze the oxidation of phenolics; and one SOD gene involved in scavenging reactive oxygen species [7]. It was shown that 62 genes from 6 gene families (PPO, PAL, POD, CAT, APX, GST), associated with phenolic metabolism and scavenging of reactive oxygen species, were differentially regulated at the transcriptional level in fresh-cut eggplant fruits [8]. In the browning-sensitive cultivar YS505, the observed high accumulation of PPO and POD mRNA and their enzymatic activity show that fresh-cut potato tuber browning stems directly from PPO’s action on polyphenols [9]. Furthermore, transcriptome analysis revealed the association of differentially expressed genes with metabolite accumulation [10].
It has been confirmed that the enzymatic browning of fresh-cut lettuce is closely related to the presence of the metabolites chlorogenic acid, coumaroyl tartaric acid, and dicaffeoylquinic acid, which can promote the browning reaction [11]. Previous findings suggest that increasing the content of phenolic acids, especially chlorogenic acid, in eggplant pulp increases the pulp’s susceptibility to browning [12]. The content of phenolics and flavonoids in plant tissues is related to the enzymes involved in their synthesis, including PAL, cinnamate-4-hydroxylase (C4H), and 4-coumarate-CoA ligase (4CL). Key enzymes catalyze the core reactions of the phenylpropane pathway, including PAL, C4H, and 4CL. As the initial enzyme of phenylpropane metabolism, PAL regulates the synthesis of phenols and flavonoids by catalyzing the production of cinnamic acid and ammonia from L-phenylalanine [13,14].
However, combining the luffa transcriptome and metabolome phenolic synthesis has not been comprehensively reported. Despite the large amount of sequencing and plant molecular information revealed through histology, reports on luffa are relatively lacking. The aim of this study was to systematically analyze the changing patterns of phenolic acid metabolites and their key regulatory pathways during luffa browning by comparing the metabolomic and transcriptomic characteristics of browning-resistant ‘30’ and browning-sensitive ‘256’. The key phenolic substances and their metabolic pathways leading to the differences in browning phenotypes were highlighted, and the structural genes involved in phenolic synthesis were elucidated. The results of this study are expected to provide potential insights into the molecular regulatory mechanisms of luffa browning and lay the foundation for breeding high-quality luffa germplasm resources with high resistance to browning.

2. Materials and Methods

2.1. Materials and Treatment

The experiment was conducted in 2021 at the luffa experimental field of Jiangsu Vocational College of Agriculture and Forestry. The field soil was clay loam with a pH of 5.8 in the subsoil layer (20–50 cm), an organic matter content of 17.48 g/kg, an available phosphorus content of 124.12 mg/kg, and an available potassium content of 356.23 mg/kg. The browning-resistant material ‘30’ was supplied by the Taizhou Academy of Agricultural Sciences, while the browning-sensitive material ‘256’ was provided by the Vegetable Research Institute of Jiangsu Academy of Agricultural Sciences. The plant spacing was 70 cm by 100 cm, with hanging vine cultivation, uniform growth, and conventional management. Samples of browning-resistant and browning-sensitive luffa were collected on the 10th day after artificial pollination, following flowering. Three plants of each variety were randomly selected, and three luffa fruits were picked from each plant. Three biological replicates were performed. The rind was peeled off with a peeler, and then the pulp was chopped about 1 cm from the center of the fruit. After collection, samples were quickly frozen in liquid nitrogen and stored at −80 °C for subsequent use.

2.2. Determination of Antioxidant Enzyme (SOD, CAT), PPO, and PAL Activities

The SOD activity of the sample extracts was determined according to the SOD kit (nitrotetrazolium blue chloride (NBT) method) (Comin, Suzhou, China). We weighed 0.1 g of tissue, added 1 mL of reagent extract, and then performed ice bath homogenization. We centrifuged it at 8000× g for 10 min at 4 °C, took the supernatant, and placed it on ice for measurement. After adding the corresponding reagents according to the operational guidelines, the mixture was shaken well and allowed to stand at room temperature for 30 min. The absorbance was then measured at a wavelength of 560 nm using a microplate reader (Yisheng Yishi (Shanghai) Biotechnology Co., Ltd., MagicBox, Shanghai, China). Three biological replicates were performed for each sample.
The CAT activity of the sample extracts was determined according to the CAT kit (ammonium molybdate colorimetric method) (Comin, Suzhou, China). Tissue sample processing involved weighing approximately 0.1 g of the sample and homogenizing it in 1 mL of extraction solution on ice. The sample was then centrifuged at 8000× g for 10 min at 4 °C, and the supernatant was collected and stored on ice for testing. Preparation of the assay tube was as follows: 50 µL of sample extract and 30 µL of reagent 1 were added, mixed well, and reacted at 25 °C for 10 min; next, 100 µL of reagent 2 and 265 µL of reagent 3 were added and mixed well. Preparation of the control tube was as follows: 30 µL of reagent 1, 100 µL of reagent 2, and 265 µL of reagent 3 were mixed, and then 50 µL of sample extract was added. Next, 200 µL of the assay tube and 200 µL of the control tube were added to a 96-well plate and measured at a wavelength of 405 nm using a microplate reader (Yisheng Yishi (Shanghai) Biotechnology Co., Ltd., MagicBox, China). Three biological replicates were performed for each sample. The formula is as follows:
CAT (μmol/min/g FW) = [(Aassay − Acontrol) − 0.0013] ÷ 0.1 × VRV ÷ (W × Vsample
÷ VEL) ÷ T = 8.9 × [(Adetermination − Acontrol) − 0.0013] ÷ W
where VRV is the reaction volume, Vsample is the added sample volume, VEL is the added volume of the extraction liquid, T is the reaction time, and W is the sample weight.
The PPO activity of the sample extracts was determined according to the PPO kit (Comin, Suzhou, China). A total of 0.1 g of tissue was weighed, and 1 mL of reagent extract was added; ice bath homogenization was then performed. The mixture was centrifuged at 8000× g for 10 min at 4 °C, the supernatant was collected, and it was placed on ice for measurement. Preparation of the assay tubes was as follows: 50 µL of sample extract was added, followed by 200 µL of reagent 1 and 50 µL of reagent 2. Preparation of the control tubes was as follows: 50 µL of boiled sample extract was added, followed by 200 µL of reagent 1 and 50 µL of distilled water. Next, 200 µL of the assay tube and 200 µL of the control tube were added to a 96-well plate separately and measured at 525 nm. Three biological replicates were performed for each sample. The formula is as follows:
PPO (U/g FW) = (Aassay − Acontrol) × VTR ÷ (W × Vsample ÷ total Vsample) ÷ 0.01 ÷ T = 60 × (Aassay − Acontrol) ÷ W
where VTR is the total reaction volume, W is the sample weight, and T is the reaction time.

2.3. Determination of (1,1-Diphenyl-2-Picrylhydrazyl Radical 2,2-Diphenyl-1-(2,4,6-Trinitrophenyl)Hydrazyl)DPPH and (2,2′-Azino-Bis (3-Ethylbenzothiazoline-6-Sulfonic Acid))ABTS Scavenging Activity

The antioxidant capacity was assessed based on the DPPH and ABTS free radical scavenging abilities [10]. The scavenging activity of DPPH radicals was measured with a total antioxidant capacity (DPPH method) kit (Comin, Suzhou, China) according to the manufacturer’s instructions. A total of 0.1 g of tissue was weighed, 1 mL of reagent extract was added, and ice bath homogenization was performed. This was centrifuged at 10,000× g for 10 min at 4 °C, the supernatant was collected, and it was placed on ice for measurement. Preparation of the blank tube: 20 µL of reagent extract was added, followed by 380 µL of reagent 1, which was mixed well and kept away from light for 20 min at room temperature. Preparation of the assay tube: 20 µL of sample extract was added, followed by 380 µL of reagent 1. The mixture was mixed well and kept away from light for 20 min at room temperature. The absorbance values were determined at 515 nm by pipetting 200 µL of blank and control tubes into a 96-well plate. According to the total antioxidant capacity (ABTS method) kit instructions (Comin, Suzhou, China), the sample extracts were prepared in the same way as those used for the scavenging activity of DPPH radicals. Blank tube preparation was as follows: 10 µL of reagent extraction solution was added, followed by 190 µL of working solution; the mixture was mixed well in a 96-well plate. Preparation of the assay tubes was as follows: 10 µL of sample extract and 190 µL of working solution were added and mixed well in a 96-well plate. The absorbance was measured at 734 nm within 10 min. Three biological replicates were performed for each sample. The DPPH radical scavenging rate formula was the same as that for ABTS. DPPH radical scavenging capacity = (Ablank ‒ Aassay) ÷ Ablank × 100%.

2.4. Determination of Malondialdehyde (MDA), H2O2, and Total Phenolic Content

The malondialdehyde content was determined by referring to methods described by previous researchers for fresh-cut luffa [15]. A 2 g sample was ground in 8 mL of 5 mM phosphate buffer and then centrifuged at 12,000 rpm at 4 °C for four minutes. The supernatant was collected, and 1 mL was added to 3 mL of 5 g/L thiobarbituric acid in 100 g/L trichloroacetic acid. The mixture was heated in boiling water for 15 min, quickly cooled, and then centrifuged at 12,000 rpm for 10 min at 4 °C. The unit of MDA content was nmol/g FW. For hydrogen peroxide determination, 3 g of the sample was weighed and ground in 5 mL of cooled 100% acetone. The mixture was centrifuged at 10,000 rpm for 20 min at 4 °C, and the supernatant was immediately used to measure the H2O2 content, with the result expressed as μmol/g of fresh weight (FW). The total phenolic content was determined using the Folin–Ciocalteu colorimetric method, and the absorbance was measured at 765 nm. Three biological replicates were performed for each sample. Gallic acid was employed as the calibration standard, and the results were expressed as gallic acid equivalents per gram of fresh weight (GAE mg/g FW) [14,16,17].

2.5. Real-Time Quantitative PCR Analysis

RNA was extracted from browning and browning-resistant luffa flesh using the Takara Plant RNA Extraction Kit (Takara Biotechnology Co., Ltd., Dalian, China). The concentration and quality of RNA were assessed using a micro-nucleic acid–protein analyzer and 1% agarose gel electrophoresis. The luffa flesh RNA was reverse-transcribed into cDNA using the Takara reverse transcription kit (refer to the Takara reverse transcription kit instructions for detailed steps).
Based on sequencing results, genes with significant expression differences related to browning were selected for validation using the qPCR primers provided in Supplementary Data S1. Three biological replicates were performed for each sample. The relative quantification method (2−∆∆CT) was used to calculate the relative expression of differentially expressed genes, and the relative expression of candidate genes was determined using Excel software for real-time fluorescence quantification.

2.6. Transcriptome Sequencing

The total RNA was extracted from samples using the Takara Plant RNA Extraction Kit (Takara Biotechnology Co., Ltd., Dalian, China). Magnetic beads coated with Oligo(dT) were used to bind to the poly(A) tails characteristic of mRNA ends, thereby isolating the mRNA. After obtaining the mRNA, fragmentation reagents were added to break up the entire mRNA structure into smaller fragments. The fragmented mRNA was unstable and required primers and reverse transcriptase to synthesize stable cDNA structures. However, the synthesized cDNA had sticky ends that needed to be repaired using an end-repair mixture. Subsequently, purification, fractionation, and PCR amplification were performed to complete library construction, followed by sequencing. Data processing and analysis were then performed.

2.7. Gene Function Annotation, Differential Gene Expression, and Enrichment Analysis

After removing adapters and low-quality reads, as well as checking sequencing error rates and GC content distribution, clean reads were obtained from the original data. The RNA-Seq data were aligned using Tophat2 (http://tophat.cbcb.umd.edu, accessed on 30 October 2021), Hisat2 (http://ccb.jhu.edu/software/hisat2, accessed on 30 October 2021), and STAR (https://github.com/alexdobin/STAR, accessed on 30 October 2021), with the luffa whole genome sequencing used as the reference genome [18,19,20,21]. StringTie was utilized for assembling and quantifying transcripts and genes, and gene expression levels were measured using FPKM (fragments per kilobase of transcript sequence per million mapped reads). Differentially expressed genes (DEGs) were screened utilizing thresholds of padj < 0.05 and |log2Fold Change| > 2 [22,23]. KEGG pathway enrichment analysis was performed using KOBAS (http://bioinfo.org/kobas, accessed on 30 October 2021) and calculated using Fisher’s exact test. To control for the calculation of the false positive rate, multiple testing was performed using the Benjamini–Hochberg (BH) method, and a p-value threshold of 0.05 was used. KEGG pathways meeting this condition were defined as being significantly enriched in differentially expressed genes [24].

2.8. Metabolite Determination

The samples were freeze-dried using a vacuum freeze dryer (Scientz-100F) (Scientz Co., Ltd., Ningbo, China) and then ground into a powder using a grinder (MM400, Retsch) (Retsch Co., Ltd., Haan, Germany). A 100 mg sample of the powder was dissolved in 1.2 mL of 70% methanol extraction solution. The mixture was vortexed for 30 s every 10 min, totaling six vortexing rounds. The samples were stored in a 4 °C refrigerator overnight and then centrifuged at 12,000 rpm. The supernatant was collected and filtered through a microporous membrane (0.22 μm pore size) and stored in sample vials. Chromatographic analysis was performed using tandem mass spectrometry (MS/MS, Applied Biosystems 4500 QTRAP, Waltham, MA, USA, http://www.appliedbiosystems.com.cn/, accessed on 30 October 2021) and ultra-performance liquid chromatography (UPLC, Shimadzu Nexera X2, Kyoto, Japan, http://www.shimadzu.com.cn/, accessed on 30 October 2021). MultiQuant was used to integrate the peak areas of all mass spectrometry peaks and to perform peak integration correction for the same metabolite across different samples [25].
Metabolomic data analysis was performed through the built-in statistical prcomp function in R software 4.3.1 (www.r-project.org/, accessed on 30 October 2021) to normalize the data (unit variance scaling, UV). All detected metabolites were quantified using the multiple reaction monitoring (MRM) method. Principal component analysis (PCA) and cluster analysis were performed on all samples, and PCA and orthogonal partial least squares/discriminant analysis (OPLS-DA) were conducted on grouped samples [26,27]. A fold change ≥ 2, a fold change ≤ 0.5, and a VIP ≥ 1 were used as thresholds for considering significant differential metabolites. Differential metabolites were mapped to the Kyoto Encyclopedia of Genes and Genomes (KEGG) database to identify significantly enriched pathways [28].

2.9. Data Processing

Data were organized using GraphPad Prism 8.0.2, and statistical and Pearson correlation analyses were conducted using SPSS 18.0. A Student’s t-test was employed to analyze the significant differences between each treatment.
Differential analysis was conducted on the gene expression data, followed by functional enrichment analysis of DEGs. The differential gene expression in the pathway is displayed as a heat map generated using https://www.bioinformatics.com.cn (last accessed on 10 December 2024), an online platform for data analysis and visualization. Using FPKM values to make heat maps with complete clustering methods [22], the pathway map was created in conjunction with Microsoft Office PowerPoint.

3. Results

3.1. Analysis of Antioxidant Enzyme (SOD, CAT, PPO, and PAL) Activities

The browning-resistant variety ‘30’ and the browning-sensitive variety ‘256’ are shown in Figure 1a. The CAT enzyme activity in the browning-resistant luffa ‘30’ was higher than that in the browning-sensitive luffa ‘256’. However, the SOD enzyme activity in the browning-resistant luffa ‘30’ was lower than that in the browning-sensitive luffa ‘256’ (Figure 1b,c). The PPO enzyme activity in the browning-resistant luffa ‘30’ was significantly lower than that in the browning-sensitive luffa ‘256’, indicating that the browning-resistant luffa ‘30’ had higher resistance to browning than the browning-sensitive variety ‘256’ and possessed better anti-browning characteristics (Figure 1d). The PAL enzyme activity in the browning-resistant luffa ‘30’ was higher than that in the browning-sensitive luffa ‘256’, and PAL activity was related to the accumulation of total phenols in the substrate, with the total phenolic content of the browning-resistant luffa ‘30’ being significantly lower than that of the browning-sensitive luffa ‘256’ (Figure 1e).

3.2. Analysis of Scavenging Activity of ABTS and DPPH Radicals

ABTS and DPPH measurements were used to evaluate the antioxidant capacity of the luffa. The higher the DPPH and ABTS values, the stronger the ability of the luffa to scavenge free radicals, indicating that this variety has greater antioxidant capacity [15]. As shown in Figure 2, the ABTS radical scavenging activity of browning-resistant luffa ‘30’ was significantly higher than that of browning-sensitive luffa ‘256’, while the DPPH scavenging activity of radicals showed no notable difference between the two. The above results indicate that a possible link exists between luffa browning and the antioxidant substance, with higher ABTS scavenging activity of radicals indicating stronger scavenging activity of radicals and reduced susceptibility to browning (Figure 2a).

3.3. Analysis of H2O2, Total Phenols, and Malondialdehyde (MDA)

Figure 2 shows that the fresh-cut browning-resistant luffa ‘30’ fruit flesh had lower H2O2 and MDA content than the browning-sensitive luffa ‘256’ (Figure 2b,c). At the same time, the total phenolic content of the browning-resistant luffa ‘30’ was significantly lower than that of the browning-sensitive luffa ‘256’ (Figure 2d).

3.4. Verification of Expression Levels of luffa Browning-Related Genes

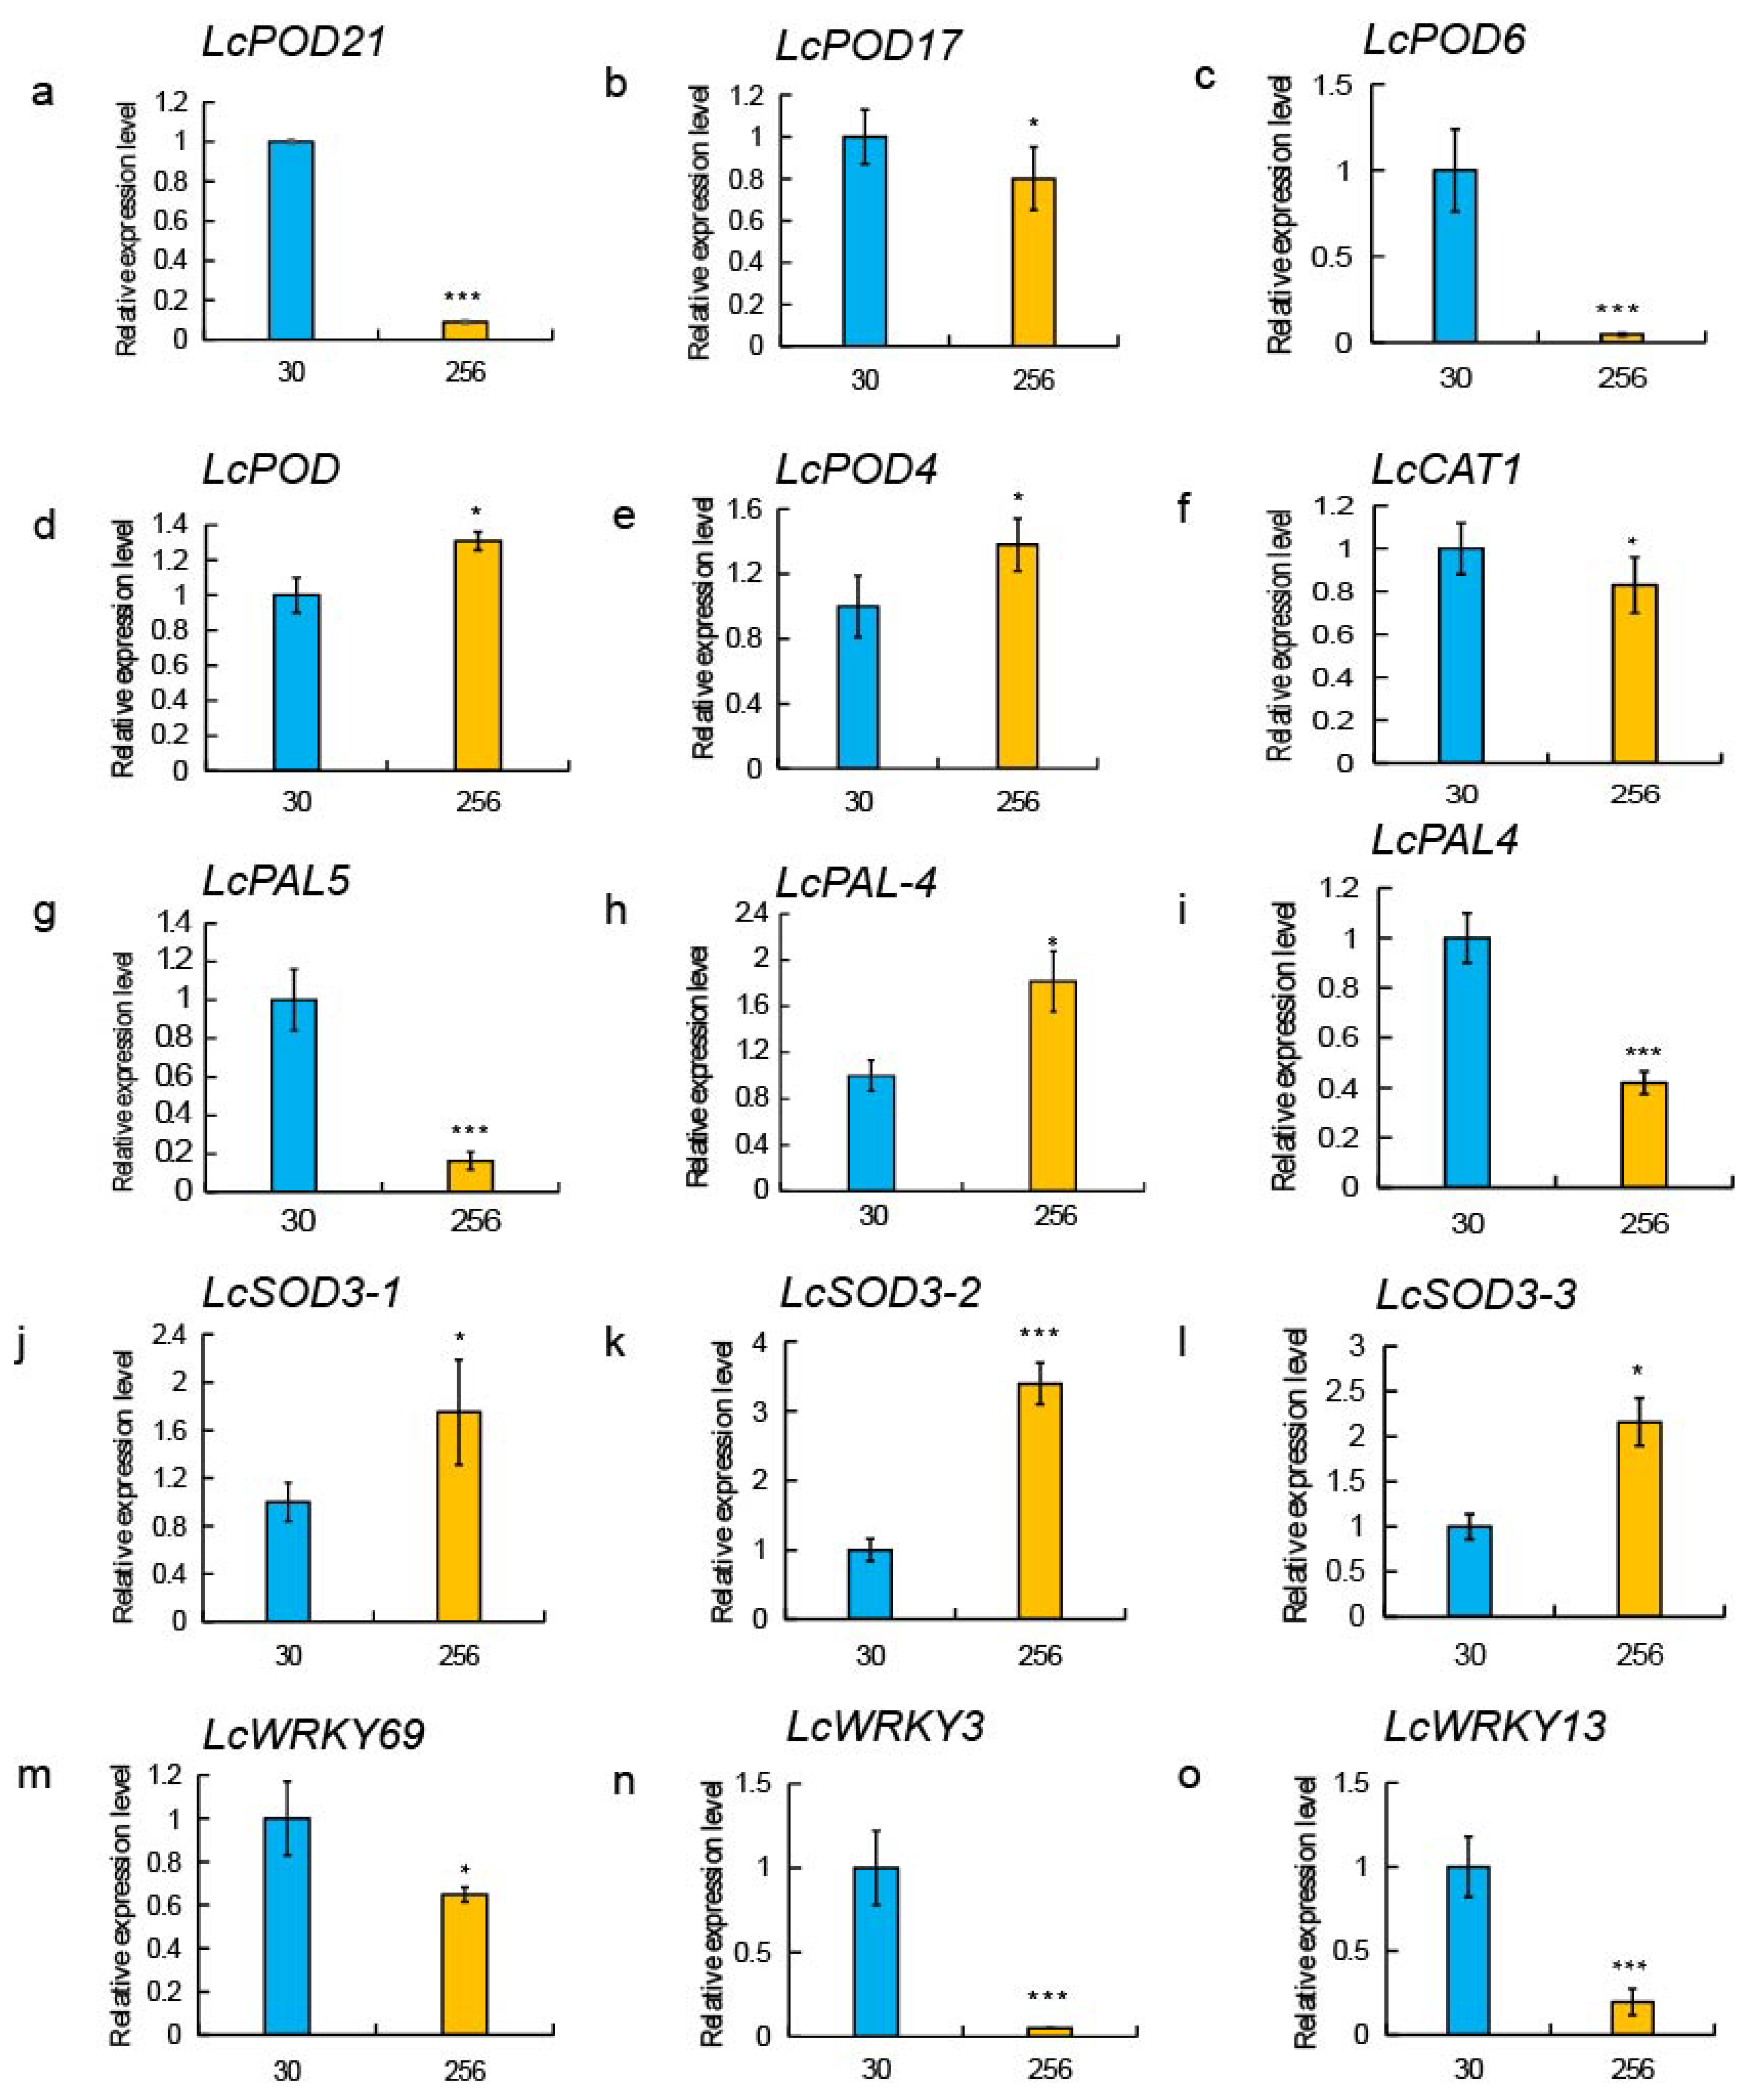
To verify the accuracy of differential genes from transcriptome sequencing, 15 genes were selected for qPCR detection, as follows: 5 LcPOD genes, 1 LcCAT gene, 3 LcSOD genes, 3 LcPAL genes, and 3 LcWRKY genes. The sequences are provided in Supplementary Data S1. The expression values of the LcPOD21 and LcPOD6 genes in ‘30’ were 12.5 and 25 times higher than those in ‘256’, respectively (Figure 3a,c). LcPOD and LcPOD4 genes showed significant downregulation in ‘30’ (Figure 3d,e), while the LcPOD17 gene displayed upregulation in ‘30’ (Figure 3b). The LcCAT1 gene was dramatically upregulated in ‘30’ (Figure 3f), and LcPAL5 and LcPAL4 genes were extremely upregulated in ‘30’ (Figure 3g,i). However, LcPAL-4, LcSOD3-1, LcSOD3-2, and LcSOD3-3 genes were significantly downregulated in ‘30’ (Figure 3h, Figure 3j–l). LcWRKY69, LcWRKY3, and LcWRKY13 genes exhibited pronounced upregulation in ‘30’ (Figure 3m–o). Among the 15 selected verification genes, the expression levels of 13 genes were generally consistent with the results from qPCR and sequencing (Supplementary Figure S2). Correlation analysis was performed using the fpkm values of these genes and the relative gene expression, R = 0.747.

3.5. Transcriptome Analysis in Varieties ‘30’ vs. ‘256’

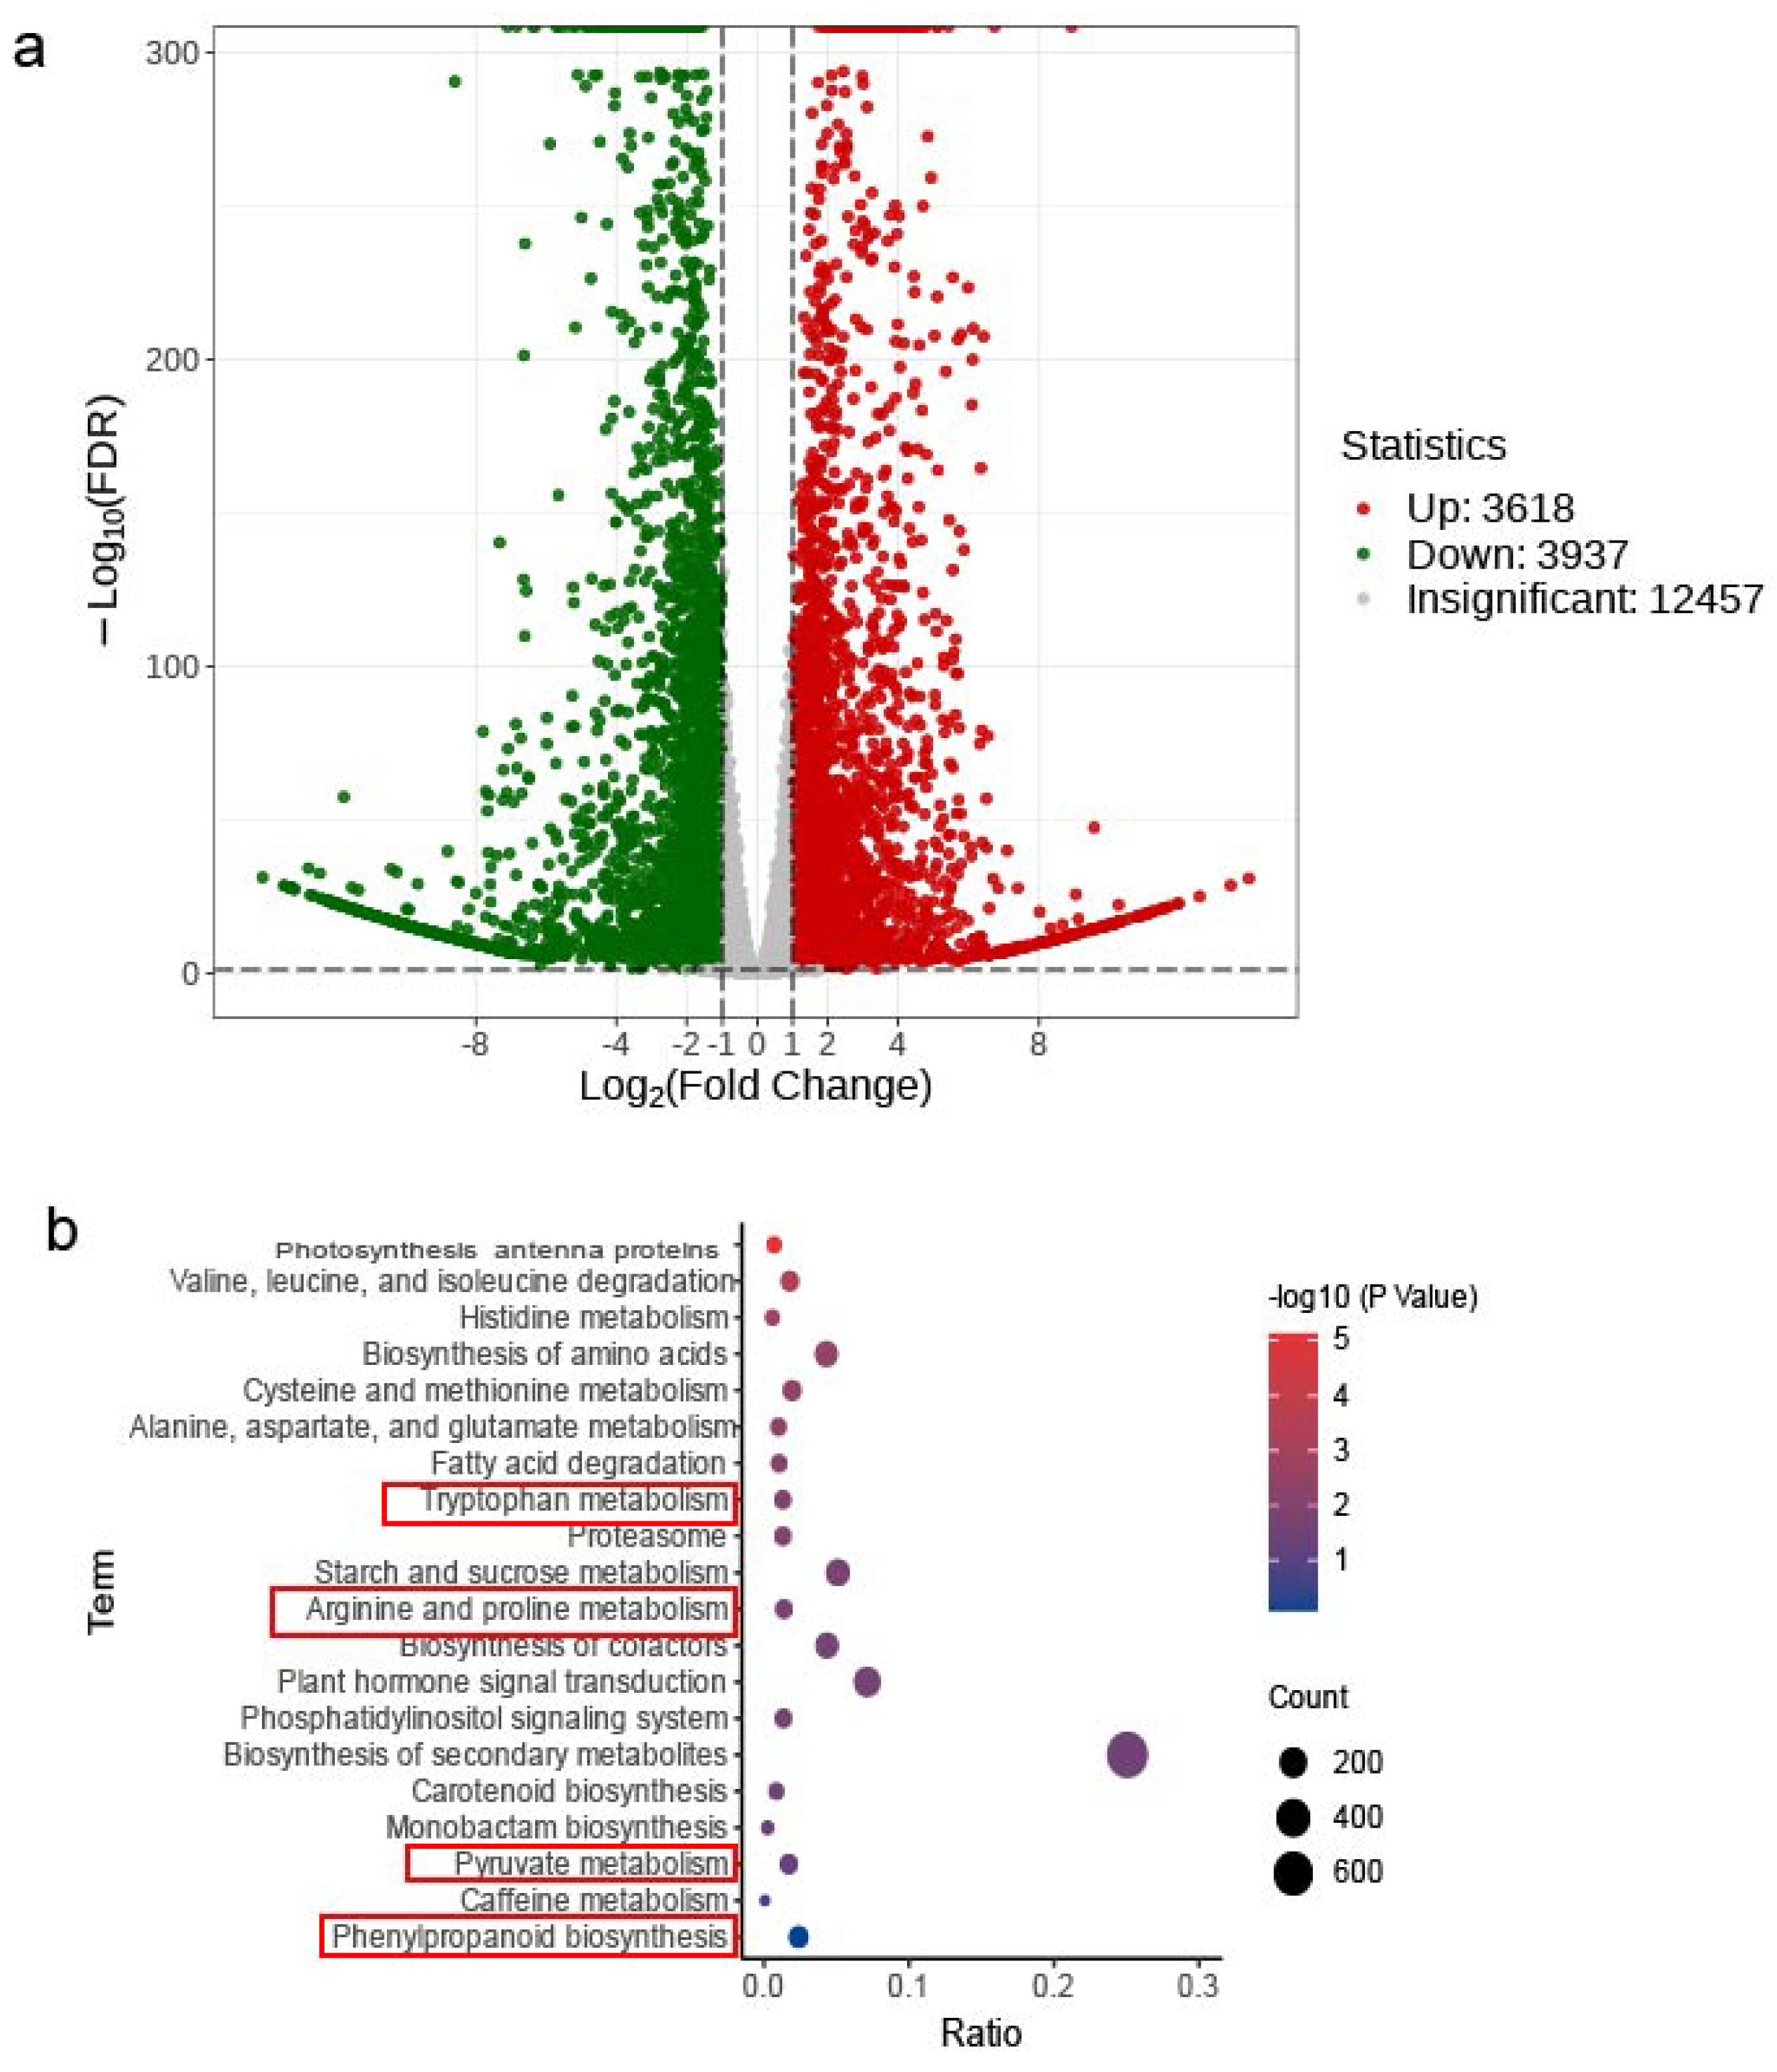
By comparing the log10 (FDR) expression levels in ‘30’ vs. ‘256’, a total of 7555 DEGs were identified. In ‘30’, 3937 DEGs were upregulated and 3618 DEGs were downregulated (Figure 4a). In addition, KEGG enrichment analysis showed that a large number of differentially expressed genes were enriched in tryptophan metabolism, arginine and proline metabolism, pyruvate metabolism, and phenylpropanoid biosynthesis pathways, which are closely related to browning (Figure 4b).

3.6. Identification of Potential Genes Related to Enzymatic Browning

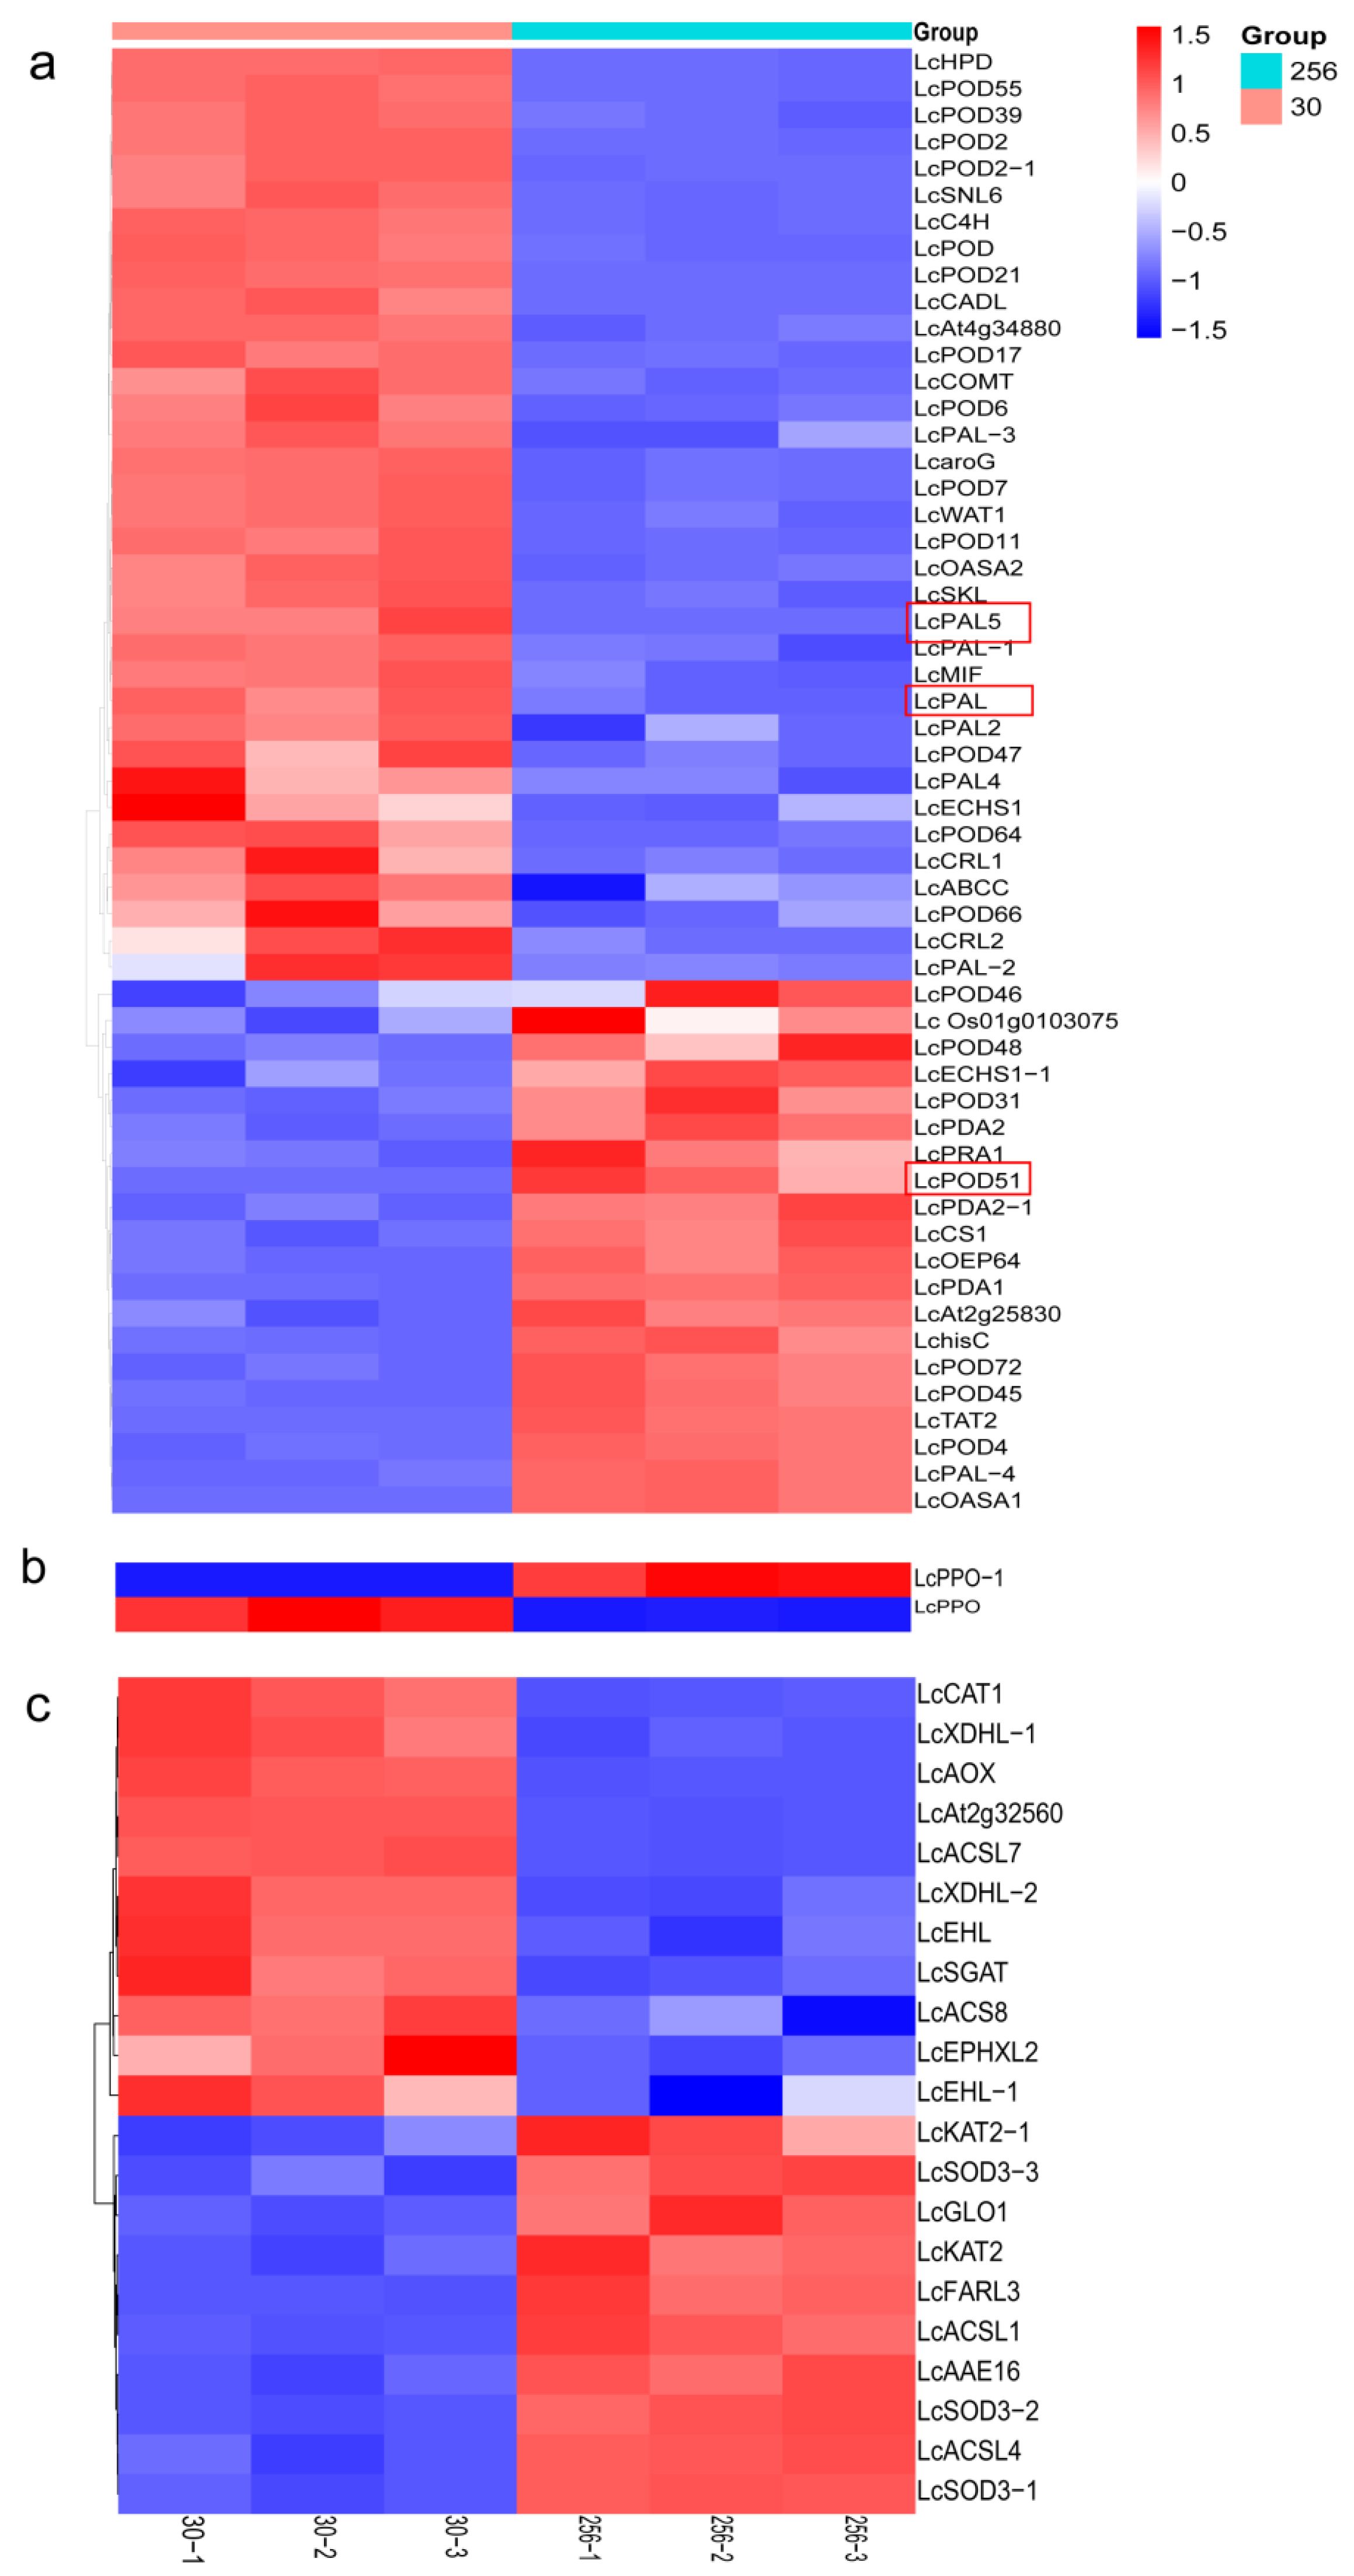
To further investigate the molecular mechanisms of luffa browning, we compared the expression levels of browning-related genes in two varieties with differing degrees of browning. The relevant gene IDs, gene names, and annotations are detailed in Supplementary Data S2. A total of 55 genes were enriched in the phenylpropanoid biosynthesis metabolic pathway, including 8 genes encoding PAL enzymes and 20 genes encoding POD enzymes. Figure 5a shows that the LcPAL gene family was involved in the phenylpropanoid biosynthesis metabolism pathway, and, with the exception of the LcPAL-4 gene, all had higher expression levels than those in ‘256’. Among the 20 differential genes related to LcPODs, 13 genes exhibited higher expression in ‘30’ than in ‘256’, while 7 genes displayed lower expression in ‘30’ than in ‘256’. Notably, the expression level of LcPOD51 in ‘30’ was 9.57-fold lower than that of ‘256’ (Figure 5a).
Two PPO-encoding genes were identified in tyrosine metabolism. The LcPPO-1 gene was expressed at significantly lower levels in ’30’ than in ‘256’, whereas the expression of the LcPPO gene showed the opposite, suggesting that the LcPPO-1 gene may play a key role in luffa browning.
Peroxisomes are highly dynamic and metabolically active organelles ubiquitous in eukaryotes, primarily involved in metabolic processes such as fatty acid β-oxidation, the glyoxylate cycle, hormone synthesis, and hydrogen peroxide (H2O2) production [29]. As a reactive oxygen species (ROS), H2O2 can damage plant cells when excessively accumulated, ultimately leading to plant cell death [30]. In total, 21 genes were found to be enriched in the peroxisome (ko04146) pathway. Among them, 10 genes showed lower expression in ‘30’ compared to ‘256’, while the majority of genes displayed higher expression in ‘30’ compared to ‘256’ (Figure 5c). There were three SOD-encoding genes and one CAT-encoding gene connected to browning; this pathway can participate in the generation and degradation of reactive oxygen species, enhancing plant stress resistance.

3.7. Metabolomic Analysis of Varieties ‘30’ and ‘256’

To explore the differences in the composition of metabolites between ’30’ and ’256’, a non-targeted metabolomic analysis was performed. A total of 206 differential metabolites (DEMs) were identified through total ion current (TIC) and multiple reaction monitoring (MRM) spectra detections, as follows: 18 flavonoids, 14 terpenoids, 20 lipids, 8 lignins and coumarins, 53 phenolic acids, 25 nucleic acids and their derivatives, 21 organic acids, 20 amino acids and their derivatives, 17 alkaloids, and 10 other substances across the two luffa varieties (Supplementary Figure S1a). The PCA of the detected metabolites indicated that the first two principal components explained 69.69% (PCA1) and 9.56% (PCA2) of the sample variance, respectively (Supplementary Figure S1b). Additionally, the heat map analysis clearly analyzed the metabolites of the two varieties (Supplementary Figure S1c). Therefore, based on OPLS-DA, the six samples were divided into two groups. The R2X, R2Y, and Q2 values were 0.705, 0.999, and 0.986, respectively. The R2 and Q2 values were close to 1, indicating that the results were reliable (Supplementary Figure S1d).
Based on VIP ≥ 1 and |log2FoldChange| ≥ 1, differentially accumulated metabolites (DAMs) between the two luffa varieties were determined. A total of 206 metabolites showed significant differences, with 126 upregulated and 80 downregulated (Supplementary Data Table S1).
Additionally, these metabolites were enriched in phenylpropanoid biosynthesis, pyrimidine metabolism, and flavonoid and flavonol biosynthesis. As shown in Figure 6a, significantly enriched KEGG pathways of differential metabolites included proline metabolism, phenylpropanoid biosynthesis (ko00940), flavonoid and flavonol biosynthesis (ko00944), ubiquinone and other terpenoid-quinone biosynthesis (ko00130), and isoquinoline alkaloid biosynthesis (ko00950).
According to qualitative and quantitative mass spectrometry analyses of luffa fruit metabolites, a total of 53 metabolites were identified as phenolic acids. The relative content of the top 10 phenolic acids, calculated with the browning-sensitive luffa as the control, is shown in Figure 6b. Compared to the control, among the top 10 phenolic acid compounds, only 6-O-feruloyl-D-glucose content was seven times higher than ’256’, while the other nine phenolic acids were all lower than ‘256’. Notably, the caffeic acid content in the browning-sensitive variety was six times lower than ’256’ (Figure 6b).

3.8. DEGs and DEMs Involved in the Varieties ‘30’ and ‘256’

A previous study found that spraying rutin on dates significantly inhibited 4-coumarate-coenzyme A ligase (4CL), phenylalanine ammonia lyase (PAL), and cinnamic acid 4-hydroxylase (C4H), and also reduced postharvest browning of dates [31]. Based on this, we analyzed the co-expression of DEGs and DEMs involved in the phenylpropanoid metabolic pathway to further investigate the accumulation of phenylpropanoids in the transcriptome phenylpropanoid biosynthesis pathway and the enrichment of DEGs. As illustrated in Figure 7, after fresh cutting, luffa contained substantial phenolic acids, which were converted into cinnamic acid by PAL, and then into p-coumaric acid by trans-cinnamate 4-monooxygenase (CYP73A). p-Coumaric acid was transformed into p-coumaroyl-CoA by 4-coumarate-CoA ligase (4CL) and subsequently into trans-5-O-(p-coumaroyl)shikimate by shikimate O-hydroxycinnamoyltransferase (HCT). Catalyzed by cinnamoyl-CoA reductase, trans-O-(p-coumaroyl)shikimate was converted into caffeic aldehyde, which was then transformed into coniferyl aldehyde under the influence of caffeic acid 3-O-methyltransferase (COMT). Sinapaldehyde was converted by cinnamyl alcohol dehydrogenase (CAD) to sinapyl alcohol, which then formed syringin under the action of coniferyl alcohol glucosyltransferase (UGT72E). In the browning-resistant luffa ‘30’, cinnamic acid, p-coumaric acid, trans-5-O-(p-coumaroyl)shikimate, and caffeic aldehyde were downregulated, while sinapaldehyde, sinapyl alcohol, and syringin tended to be upregulated.

4. Discussion

During processing, packaging, and transportation, fresh-cut fruits and vegetables undergo enzymatic browning, which leads to changes in flavor and results in significant losses for the agricultural economy [28,32]. Previous research on luffa browning has primarily focused on physiological studies and traditional variety breeding through hybridization stemming from inbred lines enabled by self-crossing. However, the genetic mechanisms and internal changes in substances related to luffa browning have received little attention, and the lack of in-depth understanding has severely constrained the progress of luffa variety breeding.
Enzymatic browning in fruits and vegetables is closely related to the stability of cell membranes. PPO is typically located on the membranes of organelles, while phenolic compounds are found in vacuoles. When cutting or friction causes cell rupture and the destruction of cellular compartments, phenolic compounds are released. PPO or POD in the organelles then interacts with these phenolic compounds to form brown polymers, which result in browning. In this study, PPO activity was inhibited in the browning-resistant ‘30’ (Figure 1d), possibly due to the combined effect of the downregulation of the LcPPO gene and upregulation of the LcPPO-1 gene. Furthermore, suppression of PPO-encoding genes in potato by artificial microRNAs has been shown to result in low PPO protein levels and low browning in potato tubers [33]. Moreover, higher phenolic content results in stronger PPO enzyme activity, increasing the likelihood of browning [34]. The accumulation of phenolic substrates is influenced by enzyme activity. The carbon flow provided by high PAL activity may be directed primarily to phenolic compounds that are less susceptible to oxidation by PPO (e.g., certain flavonoids, anthocyanins, lignans) rather than to the main substrates of PPO (e.g., o-diphenols) [35], which is why the phenolic content in the browning-resistant ‘30’ was significantly lower than that in the browning-sensitive ‘256’. Total phenolic content in ‘30’ was notably lower than that in ‘256’ (Figure 2d). The LcPAL4 and LcPAL5 genes negatively regulated PAL enzyme activity, while the LcPAL-4 gene positively regulated it (Figure 3g–i). This is similar to the findings of the research conducted by Li and Liu Xiaohui on fresh-cut eggplant [36,37]. When cell membranes are damaged, it results in the accumulation of H2O2 and MDA, thereby reducing antioxidant capacity. The stronger the ABTS and DPPH scavenging activity of radicals is, the stronger the antioxidant capacity of antioxidant substances will be [38]. However, our research indicates that only the ABTS scavenging activity of radicals is enhanced, while the DPPH scavenging activity of radicals is not significant (Figure 2a). The content of H2O2 and MDA in browning-resistant ‘30’ was significantly lower than that in browning-sensitive ‘256’ (Figure 2b–c), which can increase cell permeability. The CAT enzyme activity in the browning-resistant ‘30’ was substantially higher than that in the browning-sensitive ‘256’ (Figure 1b), thus possibly facilitating the conversion of H2O2 to H2O and O2. However, the SOD enzyme activity in the browning-resistant ‘30’ was significantly lower than that in the browning-sensitive ‘256’ (Figure 1c), with LcSOD3-1, LcSOD3-2, and LcSOD3-3 genes being expressed at significantly lower levels in ‘30’ compared to ‘256’ (Figure 3j–i), which is inconsistent with previous research [36,39]. The POD genes play a role in preventing browning in fruits and vegetables, as their encoded enzymes help suppress this process [40]. Melatonin treatment inhibits the expression of LcPOD genes and prolongs the browning of lychee pericarp [34]. The application of selenium-enriched organic fertilizer during apple fruit expansion can inhibit apple fresh-cut browning and the expression of the POD gene [9]. Our study showed that LcPOD21, LcPOD17, and LcPOD6 were upregulated and LcPOD4 and LcPOD were downregulated in browning-resistant luffa ‘30’ (Figure 3a–e). This was similar to the expression of PODs in fresh-cut eggplant [41].
KEGG enrichment analysis showed that a large number of differentially expressed genes were enriched in tryptophan metabolism, arginine and proline metabolism, pyruvate metabolism, and phenylpropanoid biosynthesis pathways, which were likely closely related to browning [8,42].
Enzymatic browning is one of the most destructive reactions that affect fruit flavor and reduce its nutritional value. It is also considered the second leading cause of vegetable quality loss [5,43]. In this study, 206 differential metabolites were obtained, with 126 upregulated and 80 downregulated (Supplementary Data Table S1). Additionally, they were enriched in phenylpropanoid biosynthesis, pyrimidine metabolism, amino acid biosynthesis, and flavonoid and flavonol biosynthesis (Figure 6a). This is similar to the metabolic pathways involved in the browning of different apple varieties [39]. Enzymatic browning is caused by the disruption of the regional separation between phenolic oxidases and phenolic substrates, as well as the catalytic action of enzymes on these substrates [44]. The primary phenolic compounds responsible for browning vary across species. In this study, the PCA of the metabolic quantification of six fruit samples explained the independence of the sample variance, which is similar to previous studies and indicates the high reliability of our data (Supplementary Figure S1b). There were 53 phenolic acids identified, of which 10 compounds had the highest content, including 6-O-caffeoyl-D-glucose, 6-O-feruloyl-D-glucose, and 2-hydroxycinnamic acid. The content of these phenolic acids varied among the two luffa varieties, suggesting that these 10 phenolic acids play a significant role in browning in luffa ‘256’ (Figure 7). In the phenylpropanoid metabolism pathway, coniferaldehyde is a precursor of lignin synthesis and an important substrate for peroxidase (POD). Research on jicama has shown that the browning of cut jicama is related to the lignification process [45]. When H2O2 is present in plants, phenolic compounds are readily oxidized and browned under the catalysis of the POD enzyme [46]. Ferulic acid, protocatechuic aldehyde, caffeic acid, and chlorogenic acid are the primary substrates for luffa browning. We found that when luffa experienced mechanical damage, it could induce the activity of the phenylpropanoid metabolism enzyme system, with PAL being the first key enzyme. Mechanical damage significantly activated PAL gene expression, increased its activity [47,48], and induced the accumulation of phenolic compounds, including caffeic acid, ferulic acid, and protocatechuic aldehyde. Simultaneously, the PPO gene was significantly expressed, activating PPO enzyme activity, which oxidized phenolic compounds and led to browning [8]. The content of cinnamic acid, p-coumaric acid, trans-5-O-(4-coumaroyl)mangiferic acid, and caffealdehyde was lower in browning-resistant luffa ‘30’ than in browning-sensitive luffa ‘256’, suggesting that the levels of these phenolic acids affect luffa browning.

5. Conclusions

In conclusion, a total of 55 genes were identified in the phenylpropanoid biosynthesis pathway, including 8 PAL genes, 20 POD genes, 2 PPO genes related to lysine metabolism, and 37 peroxisome-related genes. The metabolomic analysis linked phenolic compounds such as p-coumaric acid, sinapaldehyde, and syringin to browning, with coumaric acid being the most abundant in the ‘256’ variety. Among them, the genes related to browning enzymes included three SOD-encoding genes and one CAT-encoding gene. qPCR confirmed the expression of 15 browning-related genes, which was generally consistent with the sequencing results. It was revealed that the levels of PPO, PAL, and SOD enzymes in ‘30’ were lower than those in ‘256 ’. This indicates that once the browning-sensitive material is damaged, its antioxidant system becomes easily compromised. luffa is prone to browning mainly because it contains more phenolic substances. During metabolism, the cinnamic acid and p-coumaric acid contents were significantly lower in ‘30’ than in ‘256’. Although comparisons of the transcriptome and metabolome were made between browning-resistant and browning-sensitive luffa to identify the changing patterns of phenolics associated with browning, further functional studies of genes regulating browning are needed. This will provide a solid theoretical foundation for the molecular breeding of luffa.

Supplementary Materials

The following supporting information can be downloaded at https://www.mdpi.com/article/10.3390/horticulturae11080903/s1. Supplementary Data S1: The qPCR primers used in this study. Supplementary Data S2: The relevant gene IDs, gene names, and annotations. Supplementary Data Table S1: Differential metabolites. Supplementary Figure S1: Metabolome sequencing quality analysis: (a) differential metabolite classification; (b) differential metabolite principal components; (c) differential metabolite clustering; (d) 30 vs. 256 OPLS permutations. Supplementary Figure S2: Correlation between RNA-seq and qPCR.

Author Contributions

Conceptualization, Y.F. (Yingna Feng), S.G., and Y.W.; methodology, Y.F. (Yingna Feng), R.W., and W.N.; validation, Y.L., Z.Y., M.Y., and S.Z.; data curation, Y.F. (Yingna Feng), Y.L., M.Y., C.F., and W.N.; writing—original draft preparation, Y.F. (Yingna Feng), Y.F. (Yichen Fang), and S.Z.; writing—review and editing, Y.W., and L.L. All authors have read and agreed to the published version of the manuscript.

Funding

This research was funded by the Science Fund of the Jiangsu Vocational College of Agriculture and Forestry, grant number 2023kj21; Jiangsu Province Seed Industry Revitalization ‘Unveiling the List and Appointing the Leader’ Project JBGS [2021]018; and Changshu Science and Technology Development Plan Project CN202403.

Data Availability Statement

The raw data supporting the conclusions of this article will be made available by the authors upon request.

Conflicts of Interest

Author Weichen Ni was employed by the company Nanjing Agricultural University (Changshu) New Rural Development Research Institute Co., Ltd. The remaining authors declare that the research was conducted in the absence of any commercial or financial relationships that could be construed as a potential conflict of interest.

References

  1. Maamoun, A.A.; El-Akkad, R.H.; Farag, M.A. Mapping metabolome changes in luffa aegyptiaca Mill fruits at different maturation stages via MS-based metabolomics and chemometrics. J. Adv. Res. 2019, 29, 179–189. [Google Scholar] [CrossRef] [PubMed]
  2. Wu, H.; Zhao, G.; Gong, H.; Li, J.; Luo, C.; He, X.; Luo, S.; Zheng, X.; Liu, X.; Guo, J.; et al. A high-quality sponge gourd (luffa cylindrica) genome. Hortic. Res. 2020, 7, 128. [Google Scholar] [CrossRef]
  3. Zhao, G.; Wang, M.; Luo, C.; Li, J.; Gong, H.; Zheng, X.; Liu, X.; Luo, J.; Wu, H. Metabolome and Transcriptome Analyses of Cucurbitacin Biosynthesis in luffa (luffa acutangula). Front. Plant Sci. 2022, 13, 886870. [Google Scholar] [CrossRef]
  4. Xu, Y.; Liu, Z.; Lou, L.; Su, X. Identification of browning-related microRNAs and their targets reveals complex miRNA-mediated browning regulatory networks in luffa cylindrica. Sci. Rep. 2018, 8, 16242. [Google Scholar] [CrossRef]
  5. Chen, X.; Tan, T.; Xu, C.; Huang, S.; Tan, J.; Zhang, M.; Wang, C.; Xie, C. Genome-wide transcriptome profiling reveals novel insights into luffa cylindrica browning. Biochem. Biophys. Res. Commun. 2015, 463, 1243–1249. [Google Scholar] [CrossRef]
  6. Zhu, H.; Liu, J.; Wen, Q.; Chen, M.; Wang, B.; Zhang, Q.; Xue, Z. De novo sequencing and analysis of the transcriptome during the browning of fresh-cut luffa cylindrica ‘Fusi-3’ fruits. PLoS ONE 2017, 12, e0187117. [Google Scholar] [CrossRef]
  7. Zhang, S.; Tian, L.; Zhang, Y.; Zhao, H.; Zhu, G. De novo transcriptome assembly of the fresh-cut white husk of juglans cathayensis dode: Insights for enzymatic browning mechanism of fresh-cut husk of walnut. Sci. Hortic. 2019, 257, 108654. [Google Scholar] [CrossRef]
  8. Liu, X.; Xiao, K.; Zhang, A.; Zhu, W.; Zhang, H.; Tan, F.; Huang, Q.; Wu, X.; Zha, D. Metabolomic Analysis, Combined with Enzymatic and Transcriptome Assays, to Reveal the Browning Resistance Mechanism of Fresh-Cut Eggplant. Foods 2022, 11, 1174. [Google Scholar] [CrossRef]
  9. Qiao, L.; Gao, M.; Wang, Y.; Tian, X.; Lu, L.; Liu, X. Integrated transcriptomic and metabolomic analysis of cultivar differences provides insights into the browning mechanism of fresh-cut potato tubers. Postharvest. Biol. Technol. 2022, 188, 111905. [Google Scholar] [CrossRef]
  10. Hu, Z.; Fang, Y.; Yi, Z.; Tian, X.; Li, J.; Jin, Y.; He, K.; Liu, P.; Du, A.; Huang, Y.; et al. Determining the nutritional value and antioxidant capacity of duckweed (Wolffia arrhiza) under artificial conditions. LWT 2022, 153, 112477. [Google Scholar] [CrossRef]
  11. Kitima, S.; Souksanh, N.; Yupaporn, S. Paper-based DPPH Assay for Antioxidant Activity Analysis. Anal. Sci. 2018, 34, 795–800. [Google Scholar] [CrossRef]
  12. Lee, H.S.; Wicker, L. Anthocyanin Pigments in the Skin of Lychee Fruit. J. Food Sci. 2010, 56, 466–468. [Google Scholar] [CrossRef]
  13. Wang, Y.; Luo, Z.; Du, R. Nitric oxide delays chlorophyll degradation and enhances antioxidant activity in banana fruits after cold storage. Acta Physiol. Plant. 2015, 37, 74. [Google Scholar] [CrossRef]
  14. Zhu, L.; Zhou, J.; Zhu, S.; Guo, L. Inhibition of browning on the surface of peach slices by short-term exposure to nitric oxide and ascorbic acid. Food Chem. 2009, 114, 174–179. [Google Scholar] [CrossRef]
  15. Feng, Y.; Feng, C.; Wang, Y.; Gao, S.; Sun, P.; Yan, Z.; Su, X.; Sun, Y.; Zhu, Q. Effect of CaCl2 Treatment on Enzymatic Browning of Fresh-Cut luffa (luffa cylindrica). Horticulturae 2022, 8, 473. [Google Scholar] [CrossRef]
  16. Ainsworth, E.; Gillespie, K. Estimation of total phenolic content and other oxidation substrates in plant tissues using Folin-Ciocalteu reagent. Nat. Protoc. 2007, 2, 875–877. [Google Scholar] [CrossRef]
  17. Ceccanti, C.; Landi, M.; Incrocci, L.; Pardossi, A.; Guidi, L. Suitability of hydroponically-grown Rumex acetosa L. as fresh-cut produce. Horticulturae 2020, 6, 4. [Google Scholar] [CrossRef]
  18. Trapnell, C.; Pachter, L.; Salzberg, S. TopHat: Discovering splice junctions with RNA-Seq. Bioinformatics 2009, 25, 1105–1111. [Google Scholar] [CrossRef]
  19. Kim, D.; Langmead, B.; Salzberg, S. HISAT: A fast spliced aligner with low memory requirements. Nat. Methods 2015, 12, 357–360. [Google Scholar] [CrossRef]
  20. Dobin, A.; Davis, C.; Schlesinger, F.; Drenkow, J.; Gingeras, T. Star: Ultrafast universal rna-seq aligner. Bioinformatics 2012, 29, 15–21. [Google Scholar] [CrossRef]
  21. Zhang, T.; Ren, X.; Zhang, Z.; Ming, Y.; Yang, Z.; Hu, J.; Li, S.; Wang, Y.; Sun, S.; Sun, K.; et al. Long-read sequencing and de novo assembly of the luffa cylindrica (L.) Roem. genome. Mol. Ecol. Resour. 2020, 20, 511–519. [Google Scholar] [CrossRef]
  22. Jo, Y.; Choi, H.; Lee, B.; Hong, J.; Kim, S.; Cho, W. Exploring tomato fruit viromes through transcriptome data analysis. Viruses 2023, 15, 2139. [Google Scholar] [CrossRef] [PubMed]
  23. Wu, Z.; Ji, R.; Huang, Z.; Ye, X.; Huang, L.; Deng, H.; Lu, G.; Wei, S.; Liu, C.; Li, Z.; et al. Transcriptomic and Metabolomic Characterization of Volatile Flavor Compound Dynamics in Dragon Fruit (Selenicereus spp.) Development. Horticulturae 2025, 11, 599. [Google Scholar] [CrossRef]
  24. Bu, D.; Luo, H.; Huo, P.; Wang, Z.; Zhang, S.; He, Z.; Wu, Y.; Zhao, L.; Liu, J.; Guo, J.; et al. KOBAS-i: Intelligent prioritization and exploratory visualization of biological functions for gene enrichment analysis. Nucleic Acids Res. 2021, 49, W317–W325. [Google Scholar] [CrossRef] [PubMed]
  25. Fraga, C.G.; Clowers, B.; Moore, R.; Zink, E. Signature-discovery approach for sample matching of a nerve-agent precursor using liquid chromatography-mass spectrometry, XCMS, and chemometrics. Anal Chem. 2010, 82, 4165–4173. [Google Scholar] [CrossRef] [PubMed]
  26. Mie, A.; Laursen, K.; Åberg, K.; Forshed, J.; Lindahl, A.; Thorup-Kristensen, K.; Olsson, M.; Knuthsen, P.; Larsen, E.; Husted, S. Discrimination of conventional and organic white cabbage from a long-term field tr ial study using untargeted LC-MS-based metabolomics. Anal Bioanal Chem. 2014, 406, 2885–2897. [Google Scholar] [CrossRef]
  27. Leng, T.; Hu, X.; Chen, Y.; Gan, B.; Xie, J.; Yu, Q. Rapid identification and quantitation of pork and duck meat of binary and ternary adulteration in minced beef by 1H NMR combined with multivariate data fusion. Food Control 2023, 154, 110018. [Google Scholar] [CrossRef]
  28. Sui, X.; Meng, Z.; Dong, T.; Fan, X.; Wang, Q. Enzymatic browning and polyphenol oxidase control strategies. Curr. Opin. Biotechnol. 2023, 81, 102921. [Google Scholar] [CrossRef]
  29. Corpas, F.J.; Barroso, J.B.; del Río, A.L. Peroxisomes as a source of reactive oxygen species and nitric oxide signal molecules in plant cells. Trends Plant Sci. 2001, 6, 145–150. [Google Scholar] [CrossRef]
  30. Averill-Bates, D. Reactive oxygen species and cell signaling. Review. Biochim. Biophys. Acta Mol. Cell Res. 2024, 1871, 119573. [Google Scholar] [CrossRef]
  31. Chen, J.; Li, Y.; Li, F.; Yuan, D. Physiological, metabolome, and transcriptome analysis revealed the effect of ethyl 3-amino-3-thioxopropanoate on the browning of fresh-cut banana during storage. Postharvest Biol. Technol. 2024, 218, 113176. [Google Scholar] [CrossRef]
  32. Saghaie, L.; Pourfarzam, M.; Fassihi, A.; Sartippour, B. Synthesis and tyrosinase inhibitory properties of some novel derivatives of kojic acid. Res. Pharm. Sci. 2013, 8, 233–242. [Google Scholar] [PubMed]
  33. Dong, T.; Shi, J.; Jiang, C.Z.; Feng, Y.; Wang, Q. A short-term carbon dioxide treatment inhibits the browning of fresh-cut burdock. Postharvest Biol. Technol. 2015, 110, 96–102. [Google Scholar] [CrossRef]
  34. Marak, K.A.; Mir, H.; Siddiqui, M.W.; Singh, P.; Homa, F.; Alamri, S. Exogenous melatonin delays oxidative browning in litchi during cold storage by regulating biochemical attributes and gene expression. Front. Plant Sci. 2024, 15, 1402607. [Google Scholar] [CrossRef]
  35. Vogt, T. Phenylpropanoid biosynthesis. Mol. Plant. 2010, 3, 2–20. [Google Scholar] [CrossRef] [PubMed]
  36. Li, X.; Zhang, C.; Wang, X.; Liu, X.; Zhu, X.; Zhang, J. Integration of Metabolome and Transcriptome Profiling Reveals the Effect of Modified Atmosphere Packaging (MAP) on the Browning of Fresh-Cut Lanzhou Lily (Lilium davidii var. unicolor) Bulbs during Storage. Foods 2023, 12, 1335. [Google Scholar] [CrossRef]
  37. Supapvanich, S.; Pimsaga, J.; Srisujan, P. Physicochemical changes in fresh-cut wax apple (Syzygium samarangenese [Blume] Merrill & L.M. Perry) during storage. Food Chem. 2011, 127, 912–917. [Google Scholar]
  38. Huang, Q.; Liu, J.; Peng, C.; Han, X.; Tan, Z. Hesperidin ameliorates H2O2-induced bovine mammary epithelial cell oxidative stress via the Nrf2 signaling pathway. Anim. Sci. Biotechnol. 2024, 15, 57. [Google Scholar] [CrossRef]
  39. Wang, W.; Bi, J.; Hu, J.; Li, X. Metabolomics comparison of four varieties apple with different browning characters in response to pretreatment during pulp processing. Food Res. Int. 2024, 190, 114600. [Google Scholar] [CrossRef]
  40. Wang, Y.; Liu, X.; Zhang, R.; Yan, Z.; Xiong, A.; Su, X. Sequencing, assembly, annotation, and gene expression: Novel insights into browning-resistant luffa cylindrica. PeerJ 2020, 8, e9661. [Google Scholar] [CrossRef]
  41. Liu, X.; Zhang, A.; Zhao, J.; Shang, J.; Zhu, Z.; Wu, X.; Zha, D. Transcriptome profiling reveals potential genes involved in browning of fresh-cut eggplant (Solanum melongena L.). Sci. Rep. 2021, 11, 16081. [Google Scholar] [CrossRef]
  42. Wang, Y.; Wang, M.; Chen, Y.; Hu, W.; Zhao, S. Integrated metabolomic and transcriptomic analysis provides insights into the browning of walnut endocarps. Front, Plant Sci. 2025, 16, 1582209. [Google Scholar] [CrossRef] [PubMed]
  43. Pang, X.; Lin, Z.; Wang, M.; Liang, H.; Zhao, Y.; Li, Y.; Yan, B.; He, Y.; Wu, X.; Wang, Q.; et al. Mechanisms underlying the effect of high-temperature curing treatments on the browning response of fresh-cut yams. Food Chem. 2025, 476. [Google Scholar] [CrossRef] [PubMed]
  44. Ali, H.; El-Gizawy, A.; El-Bassiouny, R.; Saleh, M. Browning inhibition mechanisms by cysteine, ascorbic acid and citric acid, and identifying PPO-catechol-cysteine reaction products. Food Sci. Technol. 2015, 52, 3651–3659. [Google Scholar] [CrossRef] [PubMed]
  45. Aquino-Bolaños, E.; Mercado-Silva, E. Effects of polyphenol oxidase and peroxidase activity, phenolics and lignin content on the browning of cut jicama. Postharvest Biol. Technol. 2004, 33, 275–283. [Google Scholar] [CrossRef]
  46. Dharmawardhana, D.; Ellis, B.; Carlson, J. A beta-glucosidase from lodgepole pine xylem specific for the lignin precursor coniferin. Plant Physiol. 1995, 107, 331–339. [Google Scholar] [CrossRef]
  47. Min, T.; Bao, Y.; Zhou, B.; Yi, Y.; Wang, L.; Hou, W.; Ai, Y.; Wang, H. Transcription profiles reveal the regulatory synthesis of phenols during the development of lotus rhizome (Nelumbo nucifera gaertn). Int. J. Mol. Sci. 2019, 20, 2735. [Google Scholar] [CrossRef]
  48. Prasad, K.; Sharma, R.; Srivastav, M. Postharvest treatment of antioxidant reduces lenticel browning and improves cosmetic appeal of mango (Mangifera indica L.) fruits without impairing quality. Food Sci. Technol. 2016, 53, 2995–3001. [Google Scholar] [CrossRef]
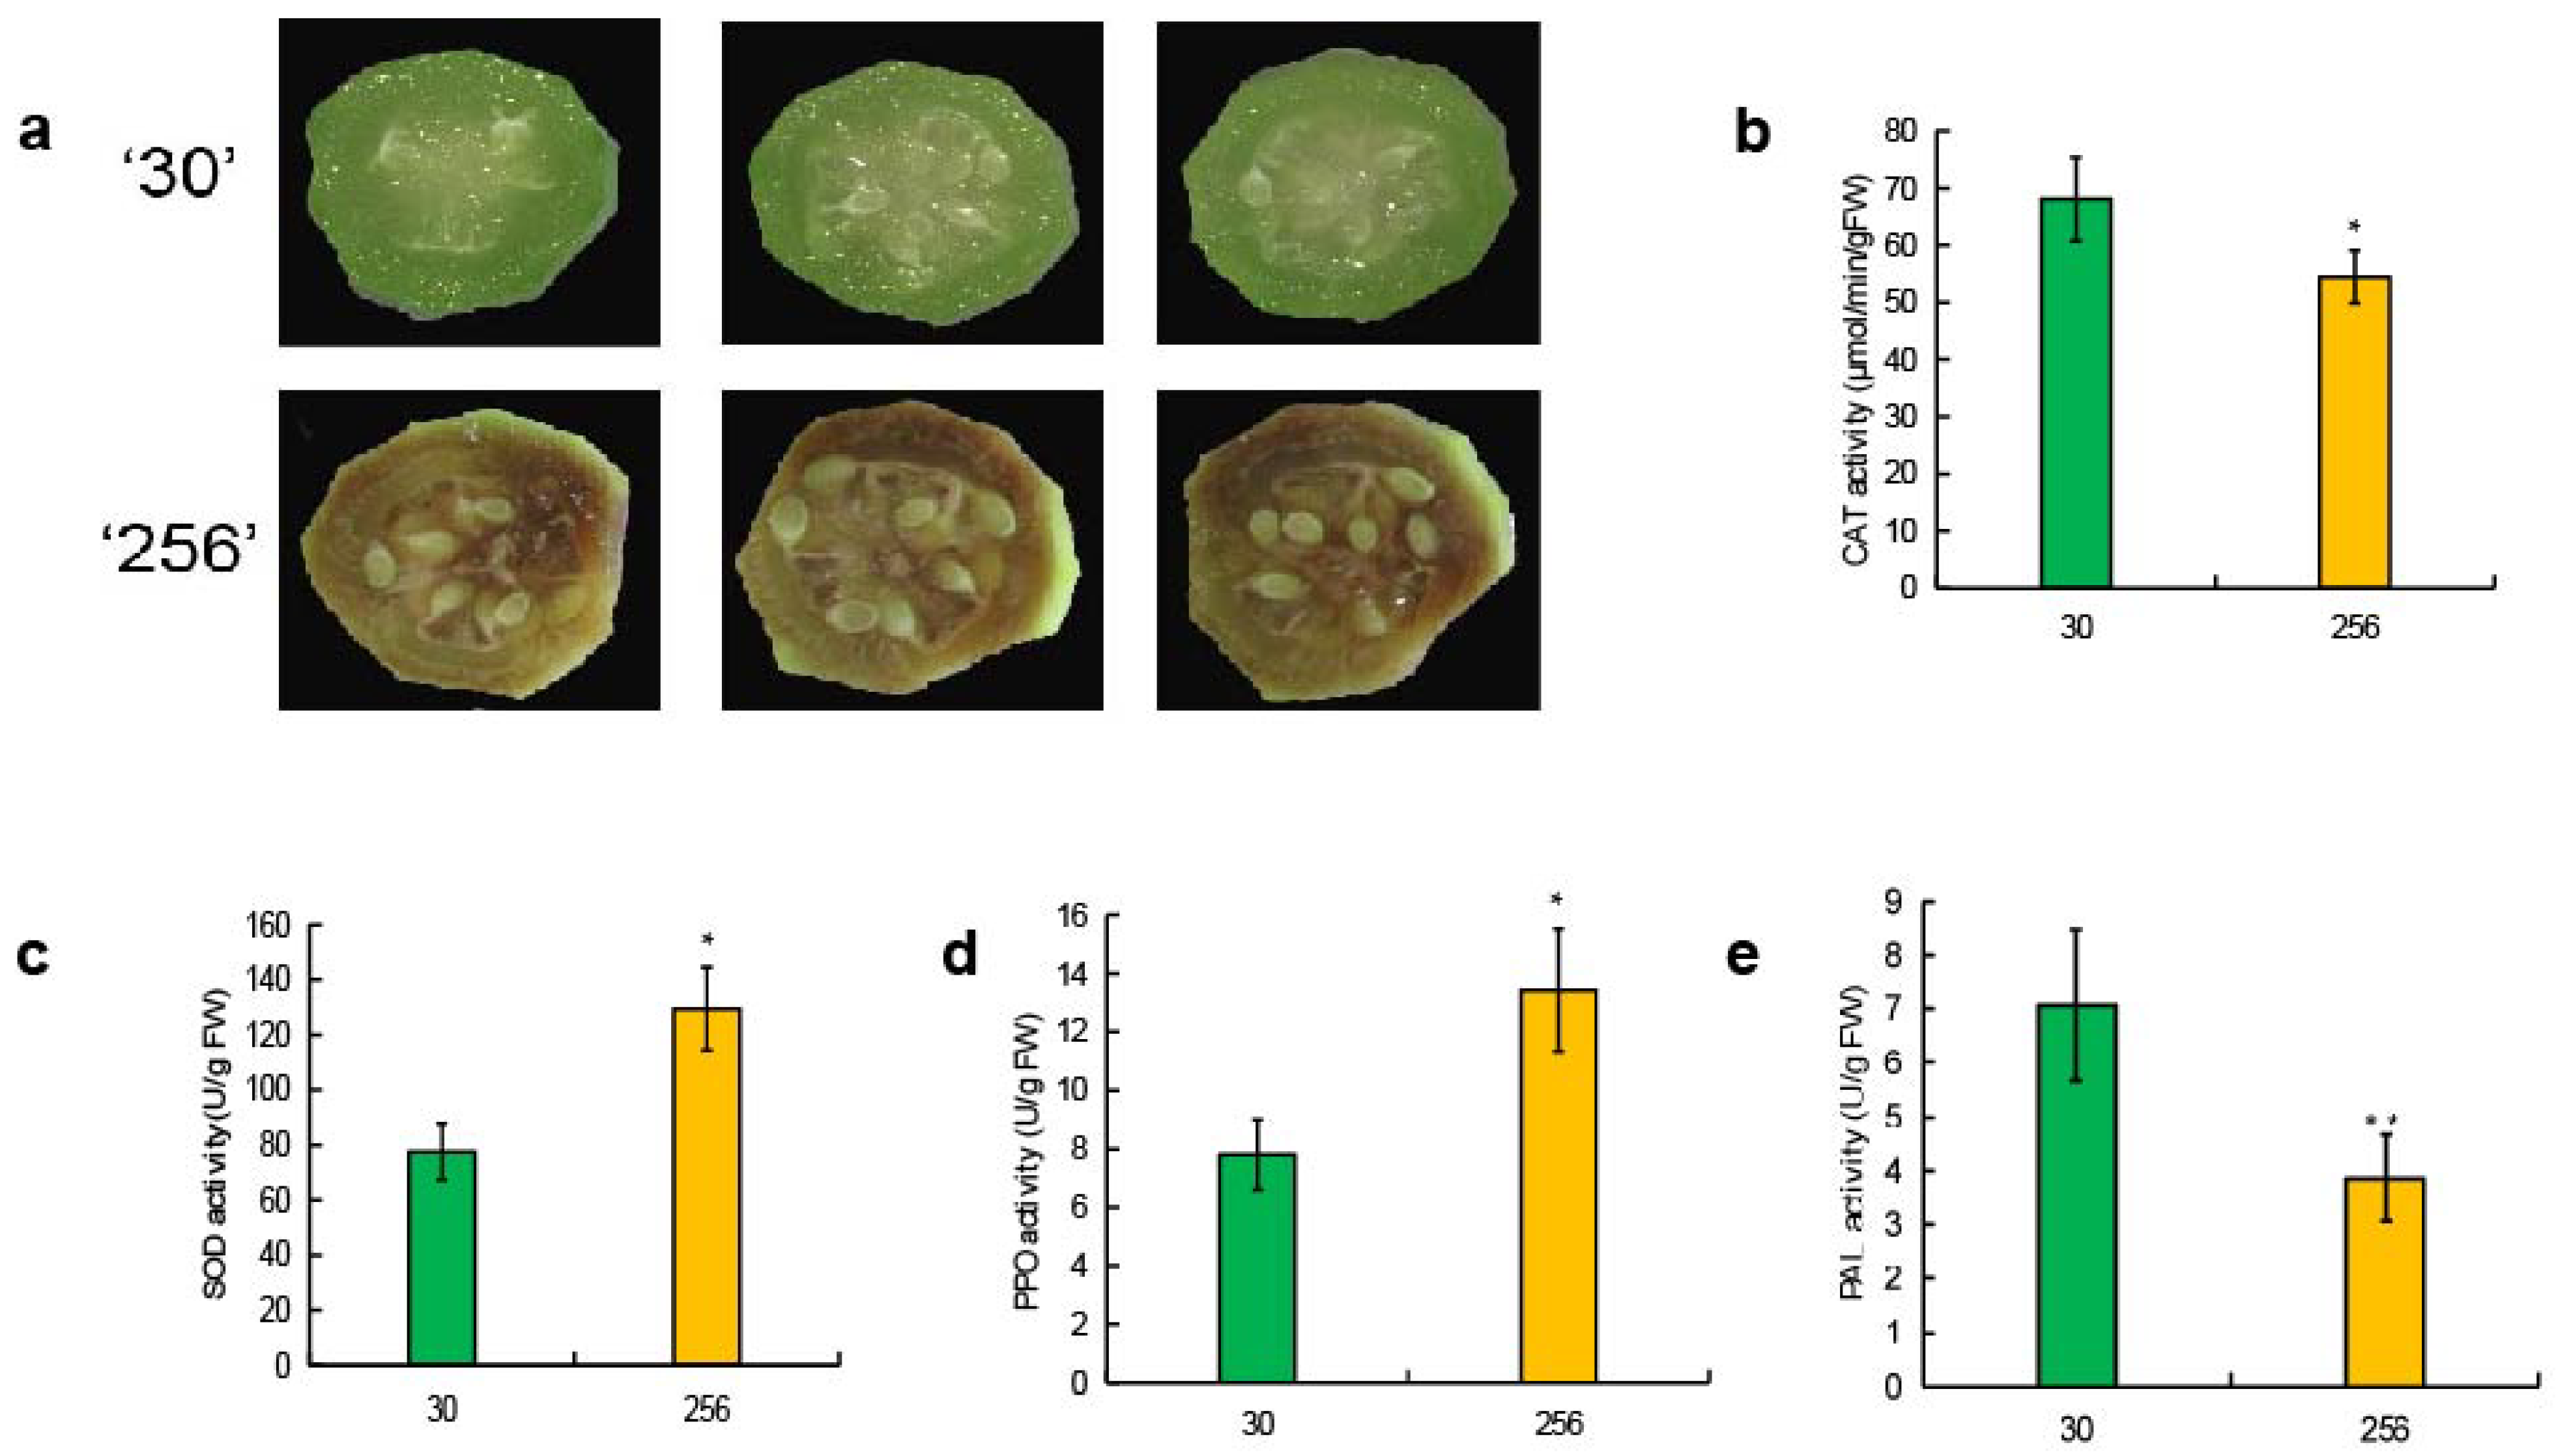
Figure 1. Antioxidant enzyme and related enzyme-induced browning enzyme activity in luffa: (a) browning-resistant variety ‘30’ vs. browning-sensitive ‘256’; (b) CAT activity in varieties ‘30’ vs. ‘256’; (c) SOD activity in varieties ‘30’ vs. ‘256’; (d) PPO activity in varieties ‘30’ vs. ‘256’; (e) PAL activity in varieties ‘30’ vs. ‘256’. CAT, catalase; SOD, superoxide dismutase; PPO, polyphenol oxidase; PAL, phenylalanine ammonia lyase. Each value is presented as mean ± SE (n = 3); * indicates significant difference between treatment and control at p < 0.05. (Student’s t-test, * p < 0.05, ** p < 0.01.).
Horticulturae 11 00903 g001
Figure 2. Antioxidants, H2O2, MDA, and total phenolic content in luffa: (a) ABTS and DPPH scavenging capacity in varieties ‘30’ vs. ‘256’; (b) content of H2O2 in varieties ‘30’ vs. ‘256’; (c) content of MDA in varieties ‘30’ vs. ‘256’; (d) content of TP in varieties ‘30’ vs. ‘256’. ABTS, 2,2′-azino-bis-3-ethylbenzthiazoline-6-sulphonic acid; DPPH, 2,2-diphenyl-1-picrylhydrazyl; H2O2, hydrogen peroxide; MDA, malondialdehyde; TP, total phenols. Each value is presented as mean ± SE (n = 3). * indicates significant difference between treatment and control at p < 0.05. (Student’s t-test, * p < 0.05, ** p < 0.01.). ns indicates no significant difference.
Horticulturae 11 00903 g002
Figure 3. Expression levels of browning-related genes: (ae) were identified as LcPODs encoding peroxidase; the unigene (f) was identified as LcCAT1 encoding catalase; (gi) were identified as LcPALs encoding phenylalanine ammonia lyase; (jl) were identified as LcSODs encoding Superoxide dismutase; (mo) were identified as LcWRKYs. Each value is presented as mean ± SE (n = 3); * indicates significant difference between treatment and control at p < 0.05. (Student’s t-test, * p < 0.05, *** p < 0.01.).
Horticulturae 11 00903 g003
Figure 4. Differentially expressed genes between ‘30’ vs. ’256’: (a) volcano plot of differential gene expressions in varieties ‘30’ vs. ‘256’; (b) statistics of KEGG enrichment of the DEGs identified in the unigene libraries between two luffa cultivars. The red box represents pathways enriched with genes associated with browning differences.
Horticulturae 11 00903 g004
Figure 5. Heat map of the expression levels of browning-related genes identified in the DEGs: (a) related DEGs in phenylpropanoid biosynthesis metabolic pathway; (b) related DEGs in tyrosine metabolism; (c) related DEGs in peroxisomes. Heat maps were created with the FPKM of the DEGs. Blue and red represent low and high expression levels, respectively. The red box represents significant changes in genes involved in the phenylalanine metabolism pathway.
Horticulturae 11 00903 g005
Figure 6. Analyses of differentially accumulated metabolites (DAMs) between ‘30’ and ‘256’: (a) statistics of KEGG enrichment in ‘30’ and ‘256’; (b) relative content represented by each chromatographic peak area (area/106). The red box indicates the metabolic pathway that mainly enriches the browning differential metabolites.
Horticulturae 11 00903 g006
Figure 7. Changes in differential genes and differential metabolites involved in the luffa phenylpropanoid metabolism pathway. Rectangles represent changes in DEGs, and circles symbolize changes in differential metabolites. Rectangles represent changes in the expression of differentially expressed genes, and circles represent changes in the content of differentially expressed metabolites. Blue and red represent low and high expression levels, respectively. Red circles represent high metabolite content, and green circles represent low metabolite content.
Horticulturae 11 00903 g007
Disclaimer/Publisher’s Note: The statements, opinions and data contained in all publications are solely those of the individual author(s) and contributor(s) and not of MDPI and/or the editor(s). MDPI and/or the editor(s) disclaim responsibility for any injury to people or property resulting from any ideas, methods, instructions or products referred to in the content.