

Unraveling the Biochemical Diversity in Short-Day Onion Genotypes

Abstract
1. Introduction
2. Materials and Methods
2.1. Plant Material
2.2. Field Evaluation
2.3. Data Recording
2.4. Total Soluble Solids Content
2.5. Thiosulfinate Content
2.6. Total Phenolic Content
2.7. Total Flavonoid Content
2.8. Antioxidant Content ABTS
2.9. Total Antioxidant Capacity
2.10. Total Sugar Content
2.11. Reducing Sugar Content
2.12. Statistical Analysis
3. Results
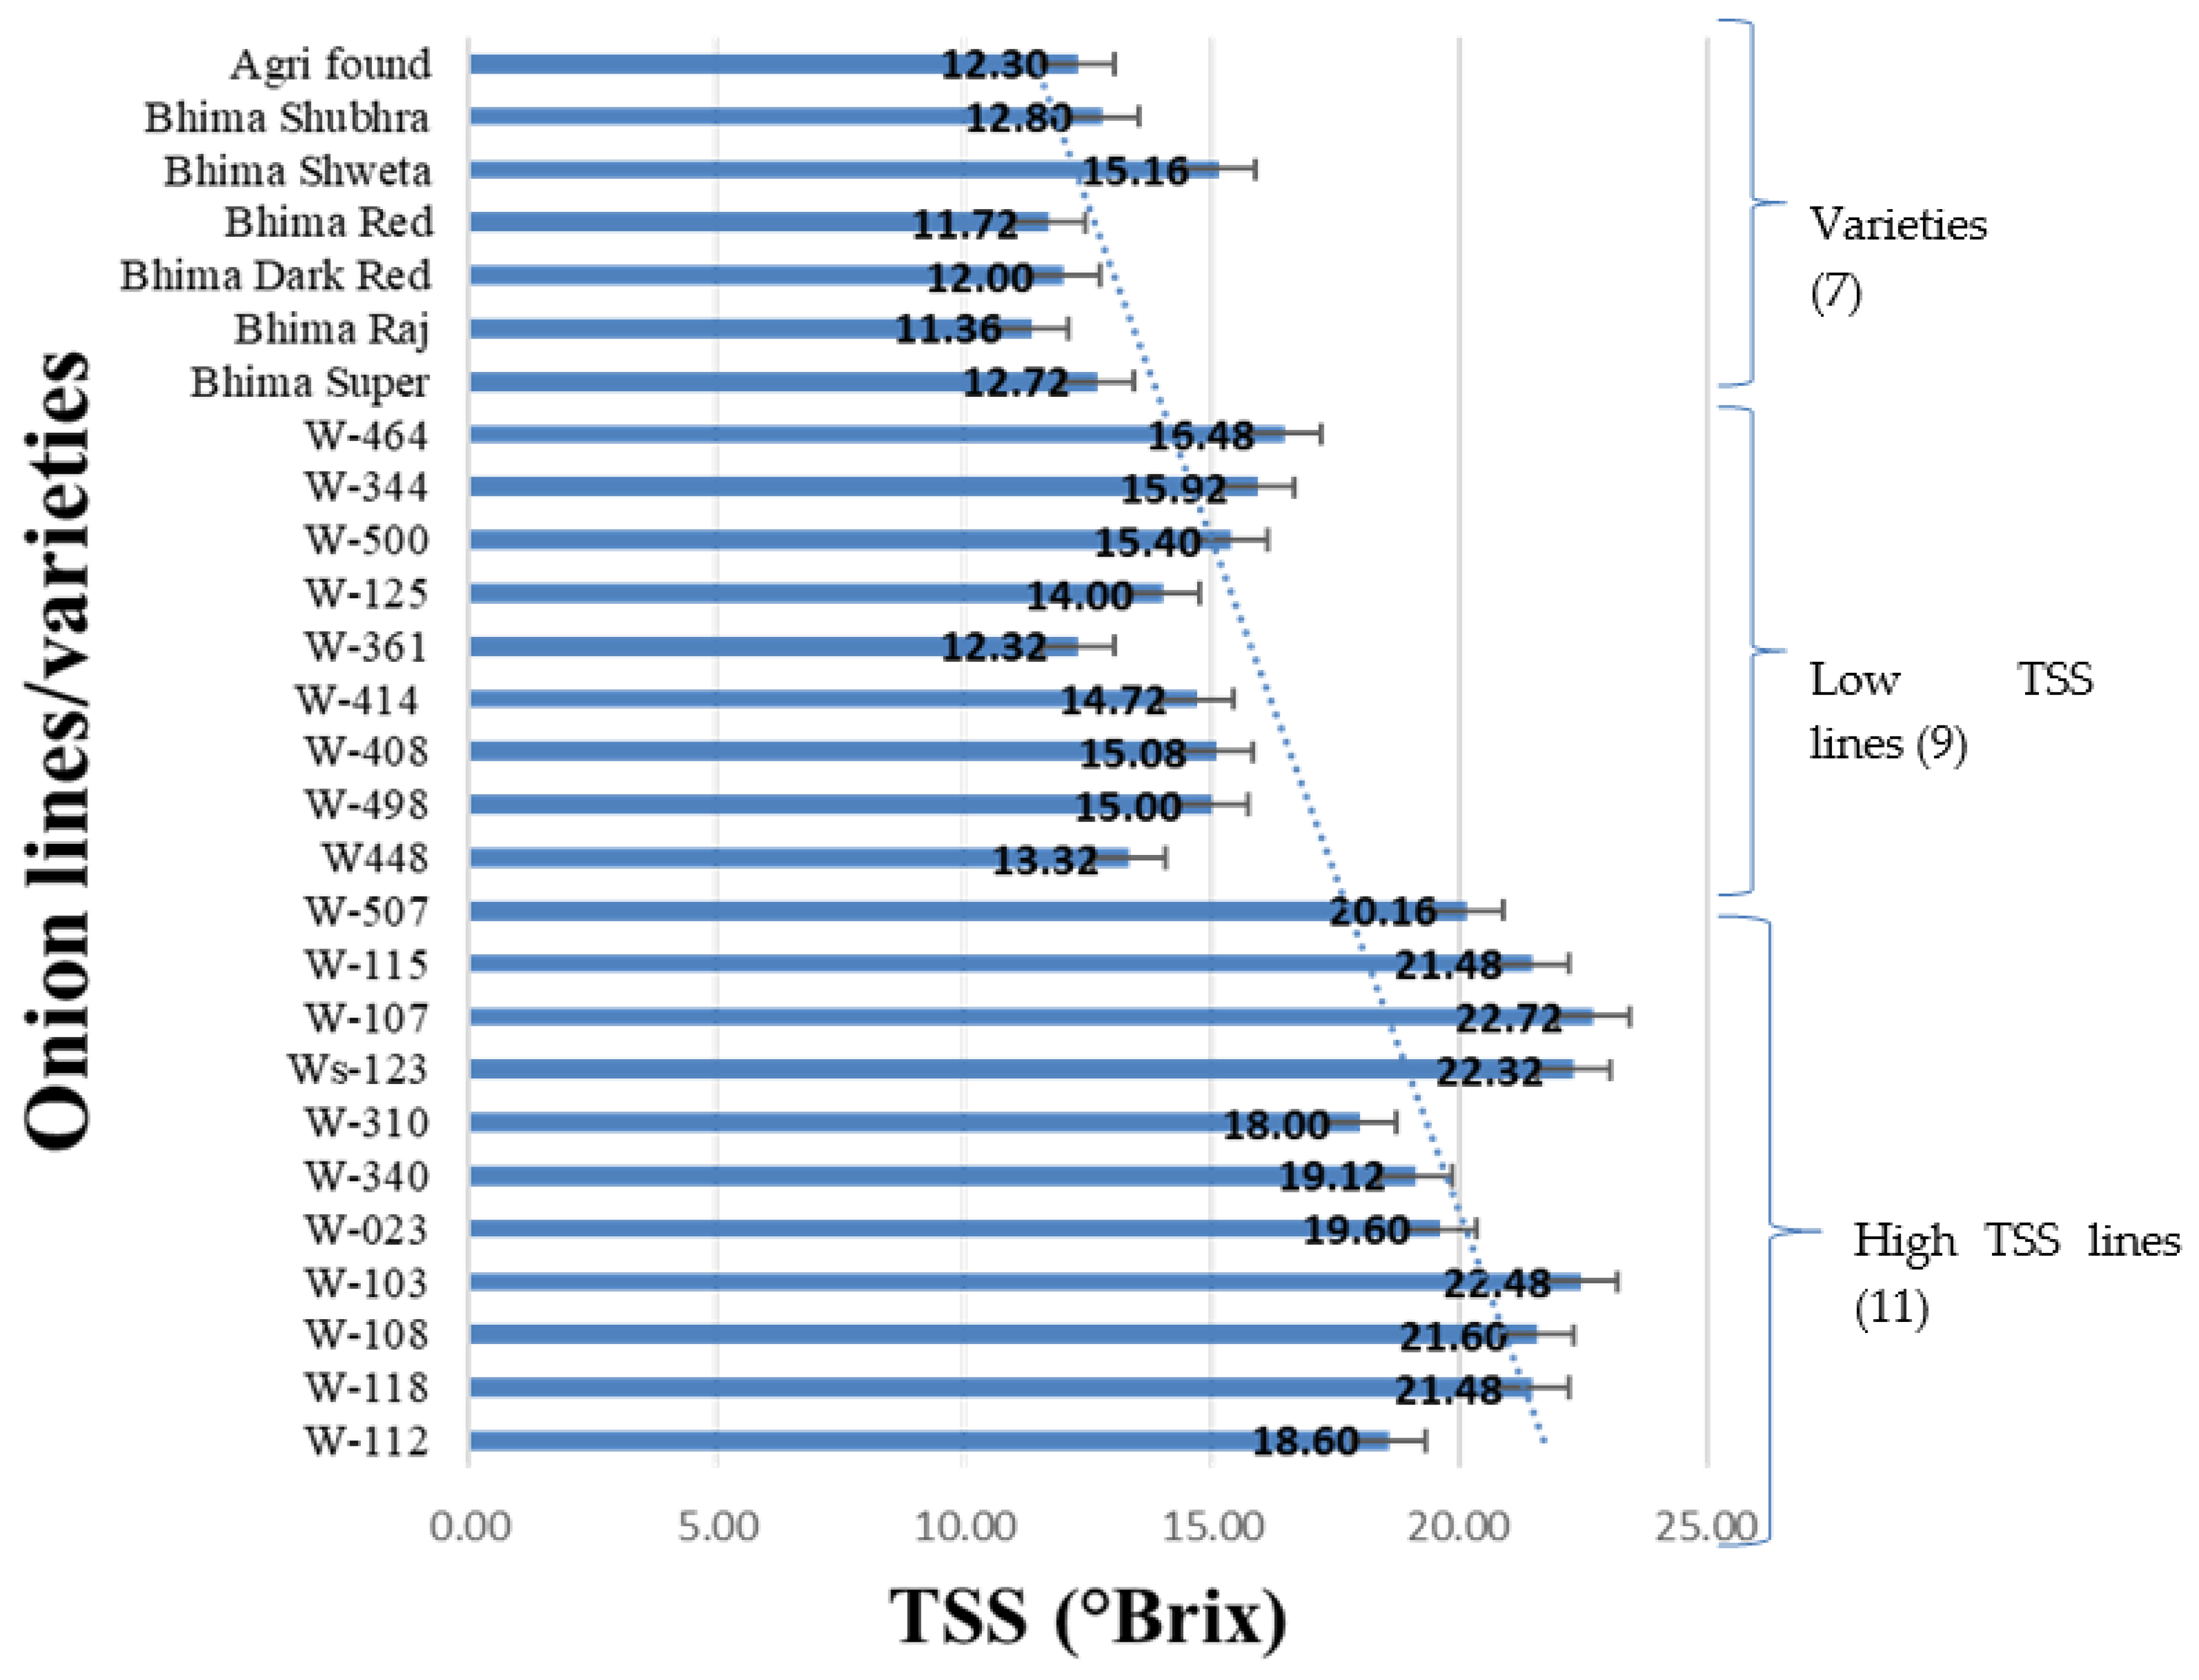
3.1. Total Soluble Solids Content
3.2. Thiosulfinate Content
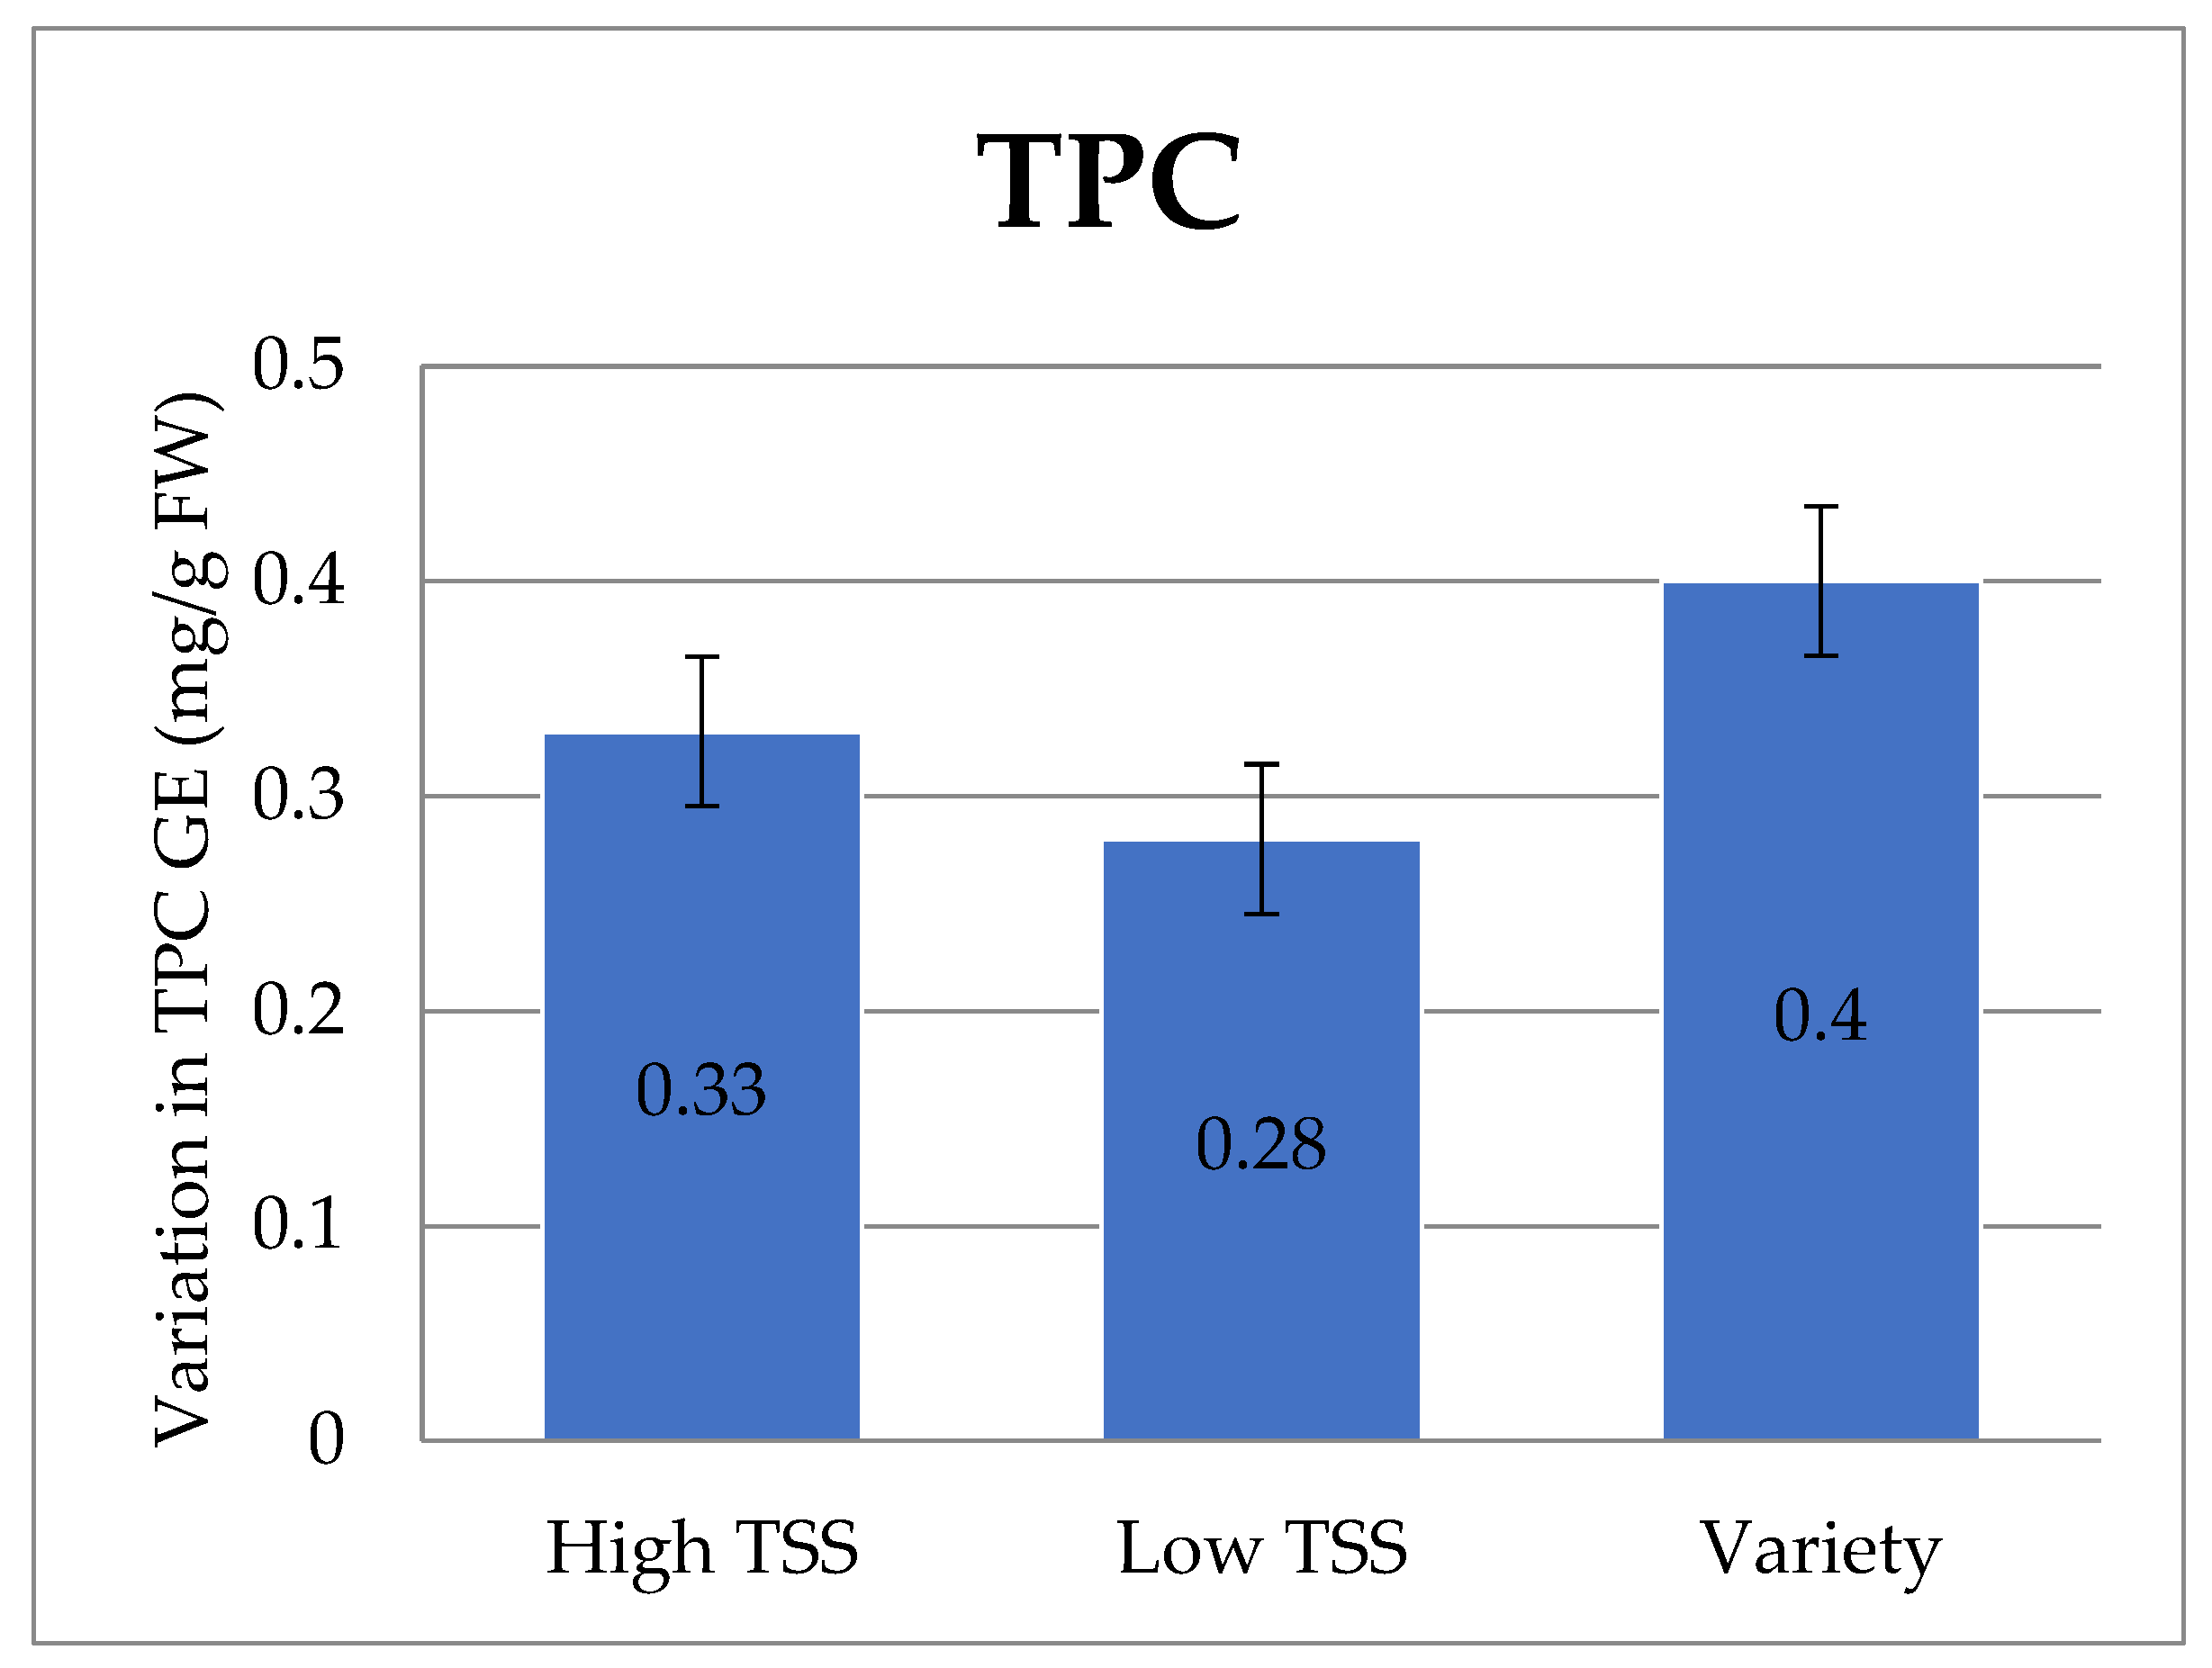
3.3. Total Phenolic Content
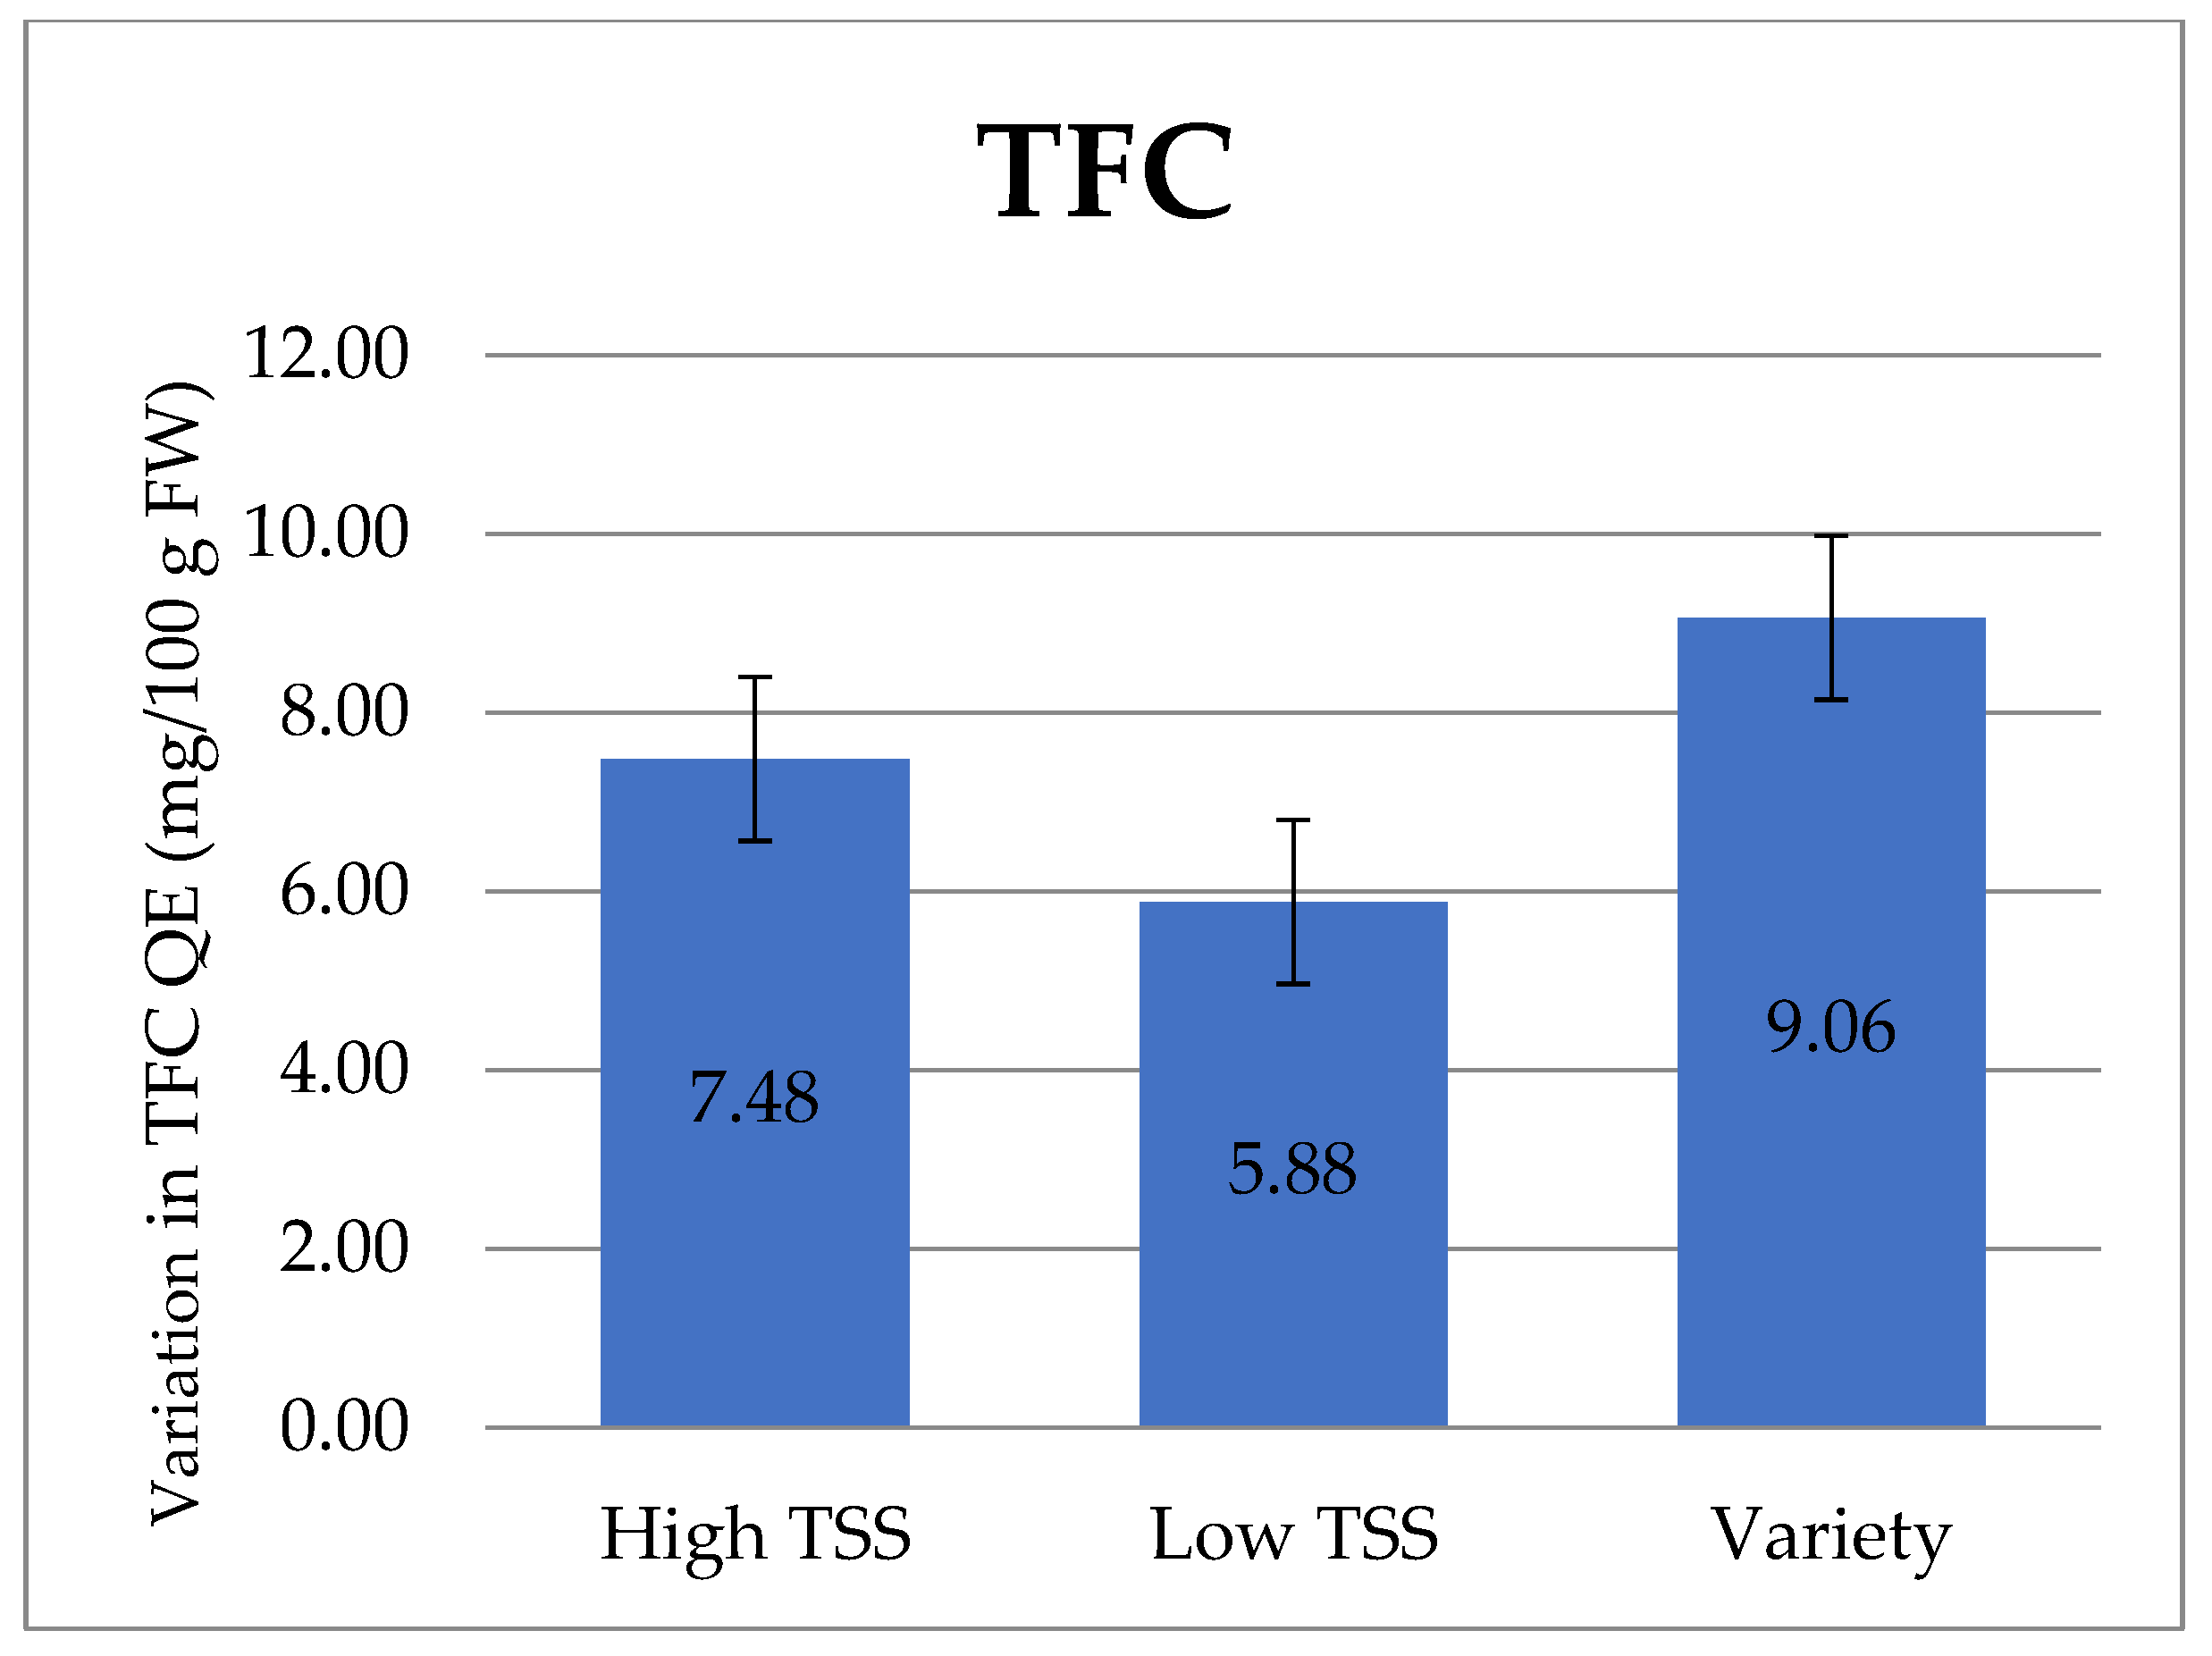
3.4. Total Flavonoid Content
3.5. Total Sugar Content
3.6. Correlation Studies
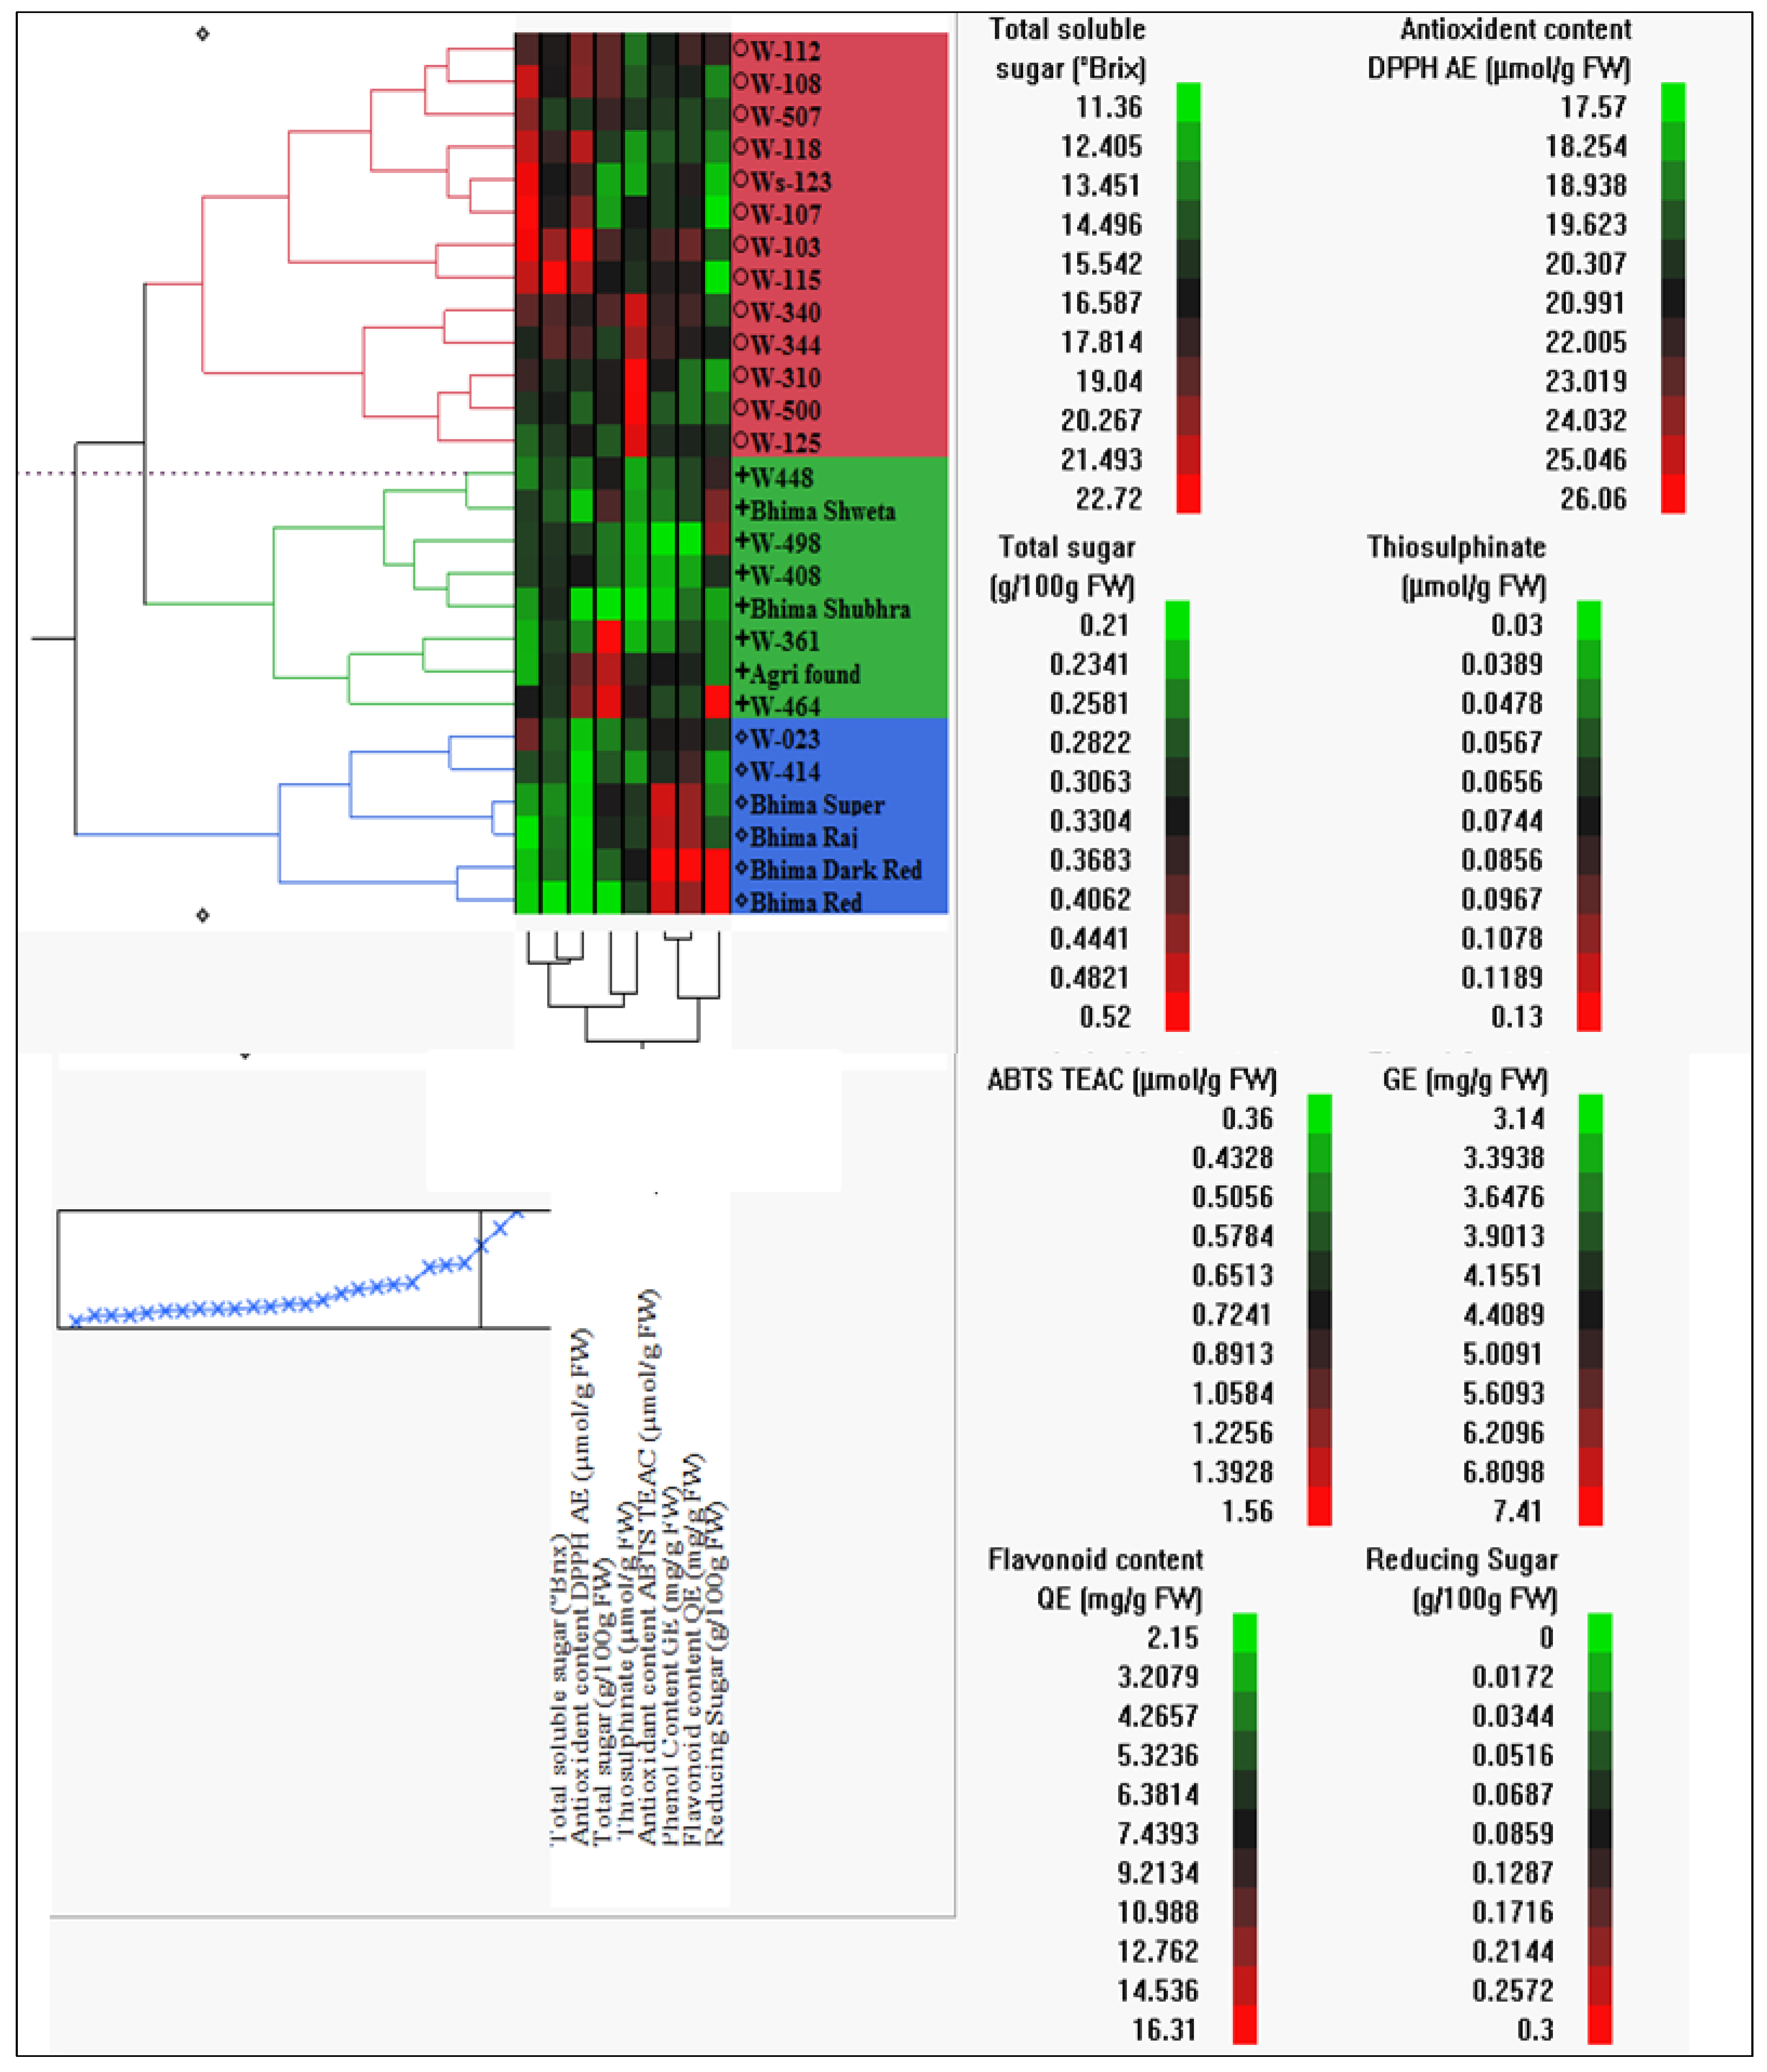
3.7. Clustering of Genotypes Based on Biochemical Traits
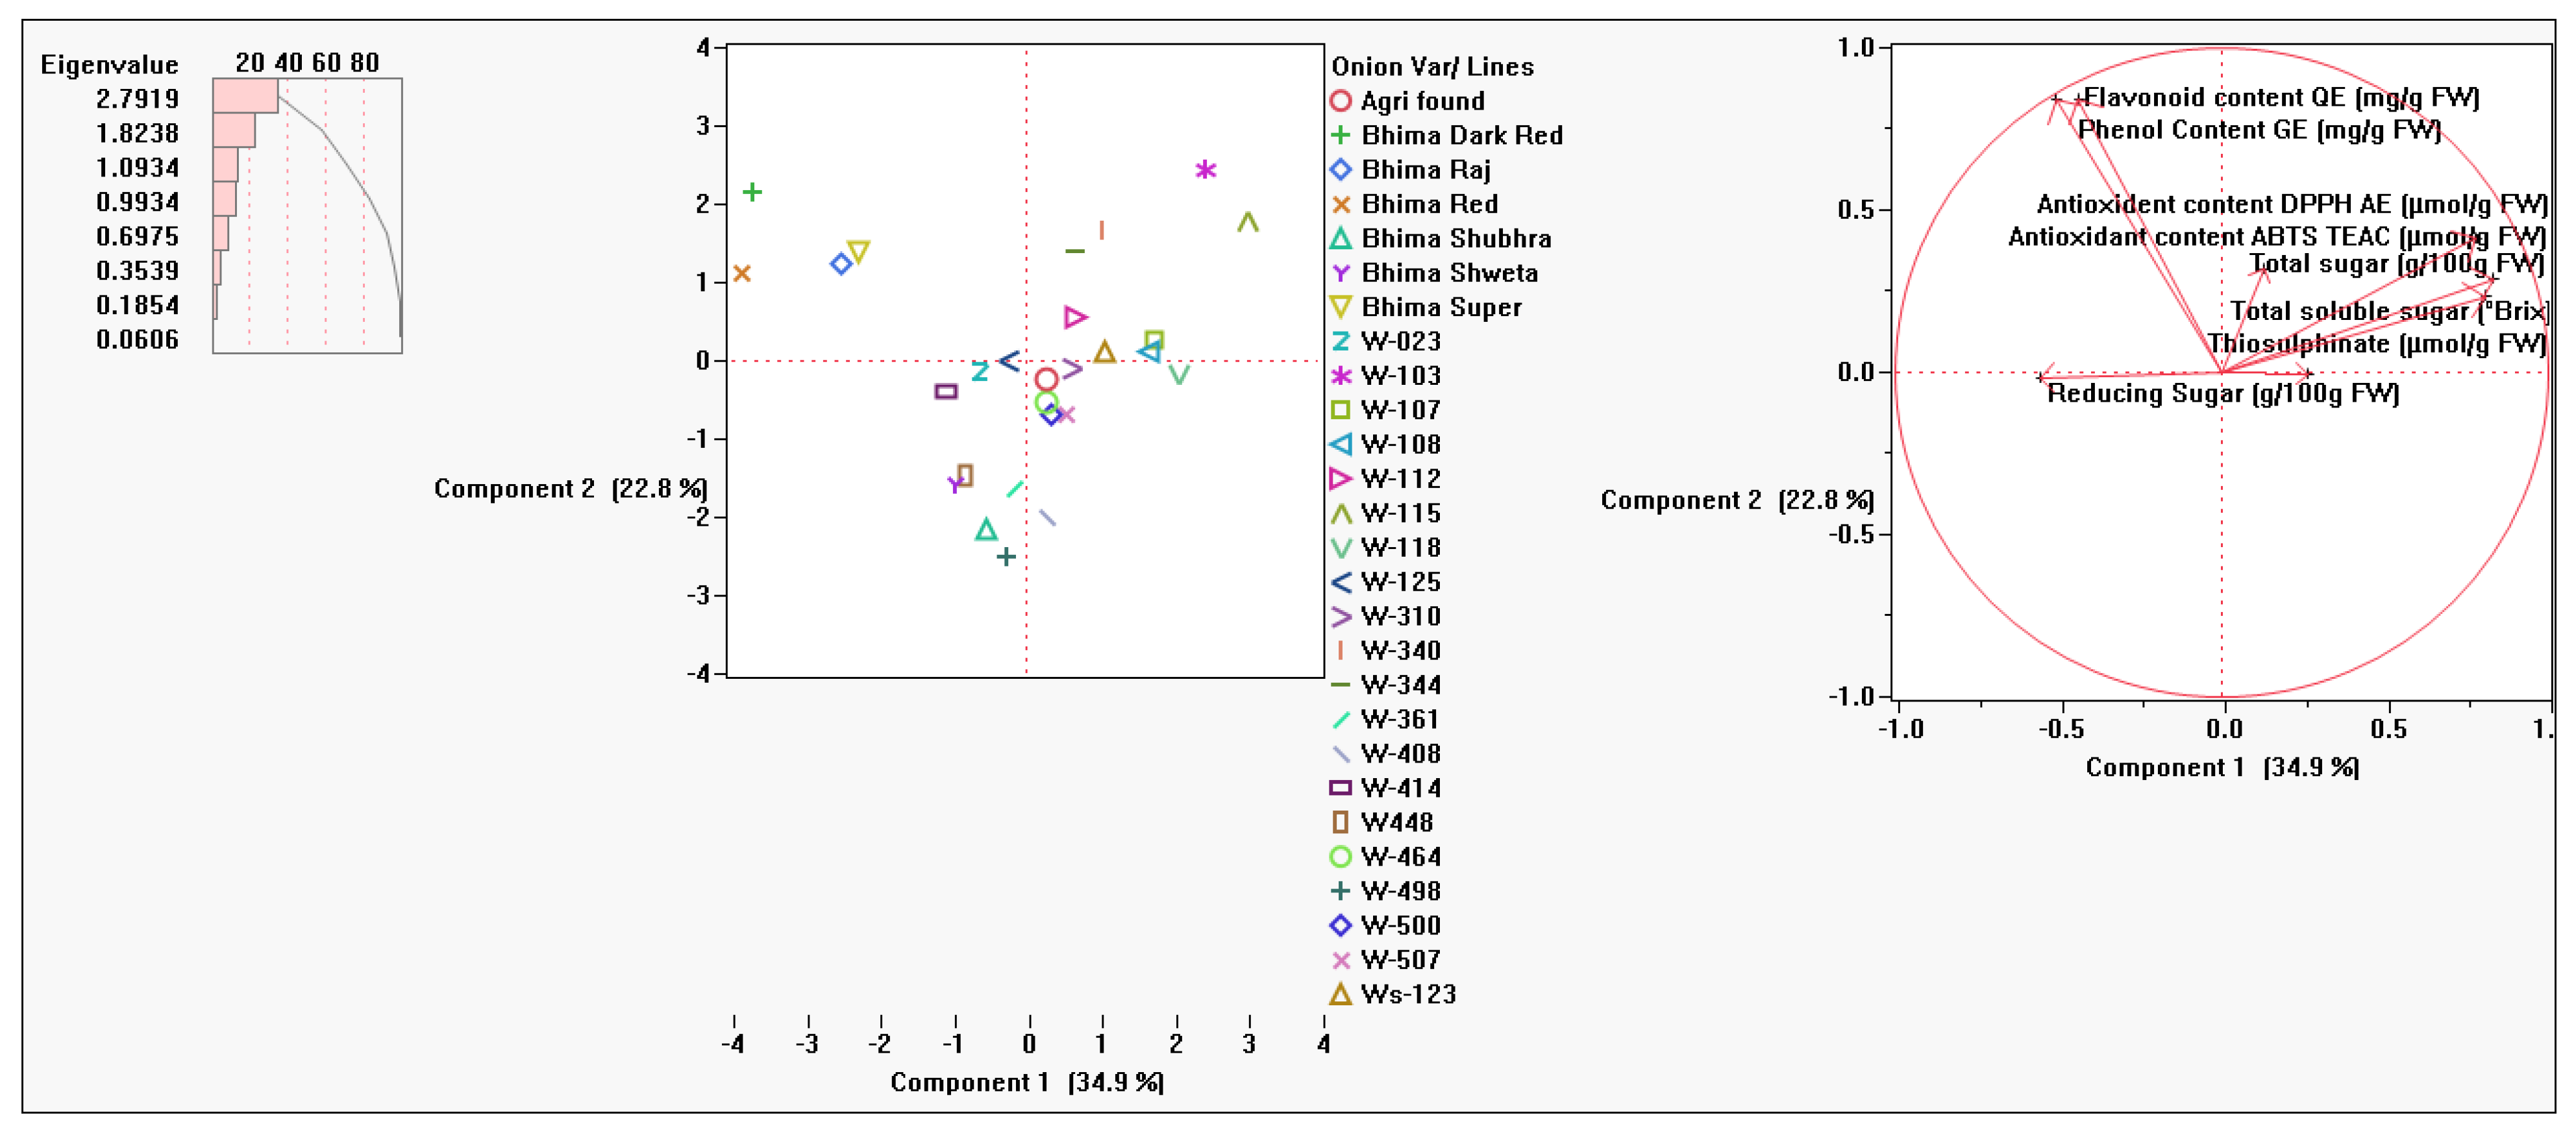
3.8. Principal Component Analysis
4. Discussion
5. Conclusions
6. Recommendation
Author Contributions
Funding
Data Availability Statement
Acknowledgments
Conflicts of Interest
References
- FAO; STAT. Food and Agriculture Organization of the United Nations-FAO Statistics Division. 2019. Available online: http://www.fao.org (accessed on 1 June 2024).
- Havey, M.J. Onion breeding. Plant Breed. Rev. 2018, 42, 39–85. [Google Scholar]
- Singh, A.K.; Janakiram, T.; Singh, M.; Mahajan, V. Onion cultivation in India- a way forward. Indian Hortic. 2017, 62, 3–8. [Google Scholar]
- Benkeblia, N.; Varoquaux, P. Effects of gamma-irradiation, temperature and storage time on the status of the glucose, fructose and sucrose in onion bulbs (Allium cepa L.). Int. Agrophys. 2003, 17, 1–5. [Google Scholar]
- Wang, C.K. Health benefits of onion bioactives on hypercholesterolemia, cardiovascular diseases, and bone mineral density. Food Front. 2020, 1, 107–108. [Google Scholar] [CrossRef]
- Zhao, X.X.; Linc, F.J.; Li, H.; Li, H.B.; Wu, D.T.; Geng, F.; Ma, W.; Wang, Y.; Miao, B.H.; Gan, R.Y. Recent advances in bioactive compounds, health functions, and safety concerns of onion (Allium cepa L.). Front. Nutr. 2021, 8, 669805. [Google Scholar] [CrossRef]
- Sato, A.T.; Zhang, L.; Yonekura, H.; Tamura, A. Antiallergic activities of eleven onions (Allium cepa) were attributed to quercetin 4’-glucoside using QuEChERS method and Pearson’s correlation coefficient. J. Funct. Foods 2015, 14, 581–589. [Google Scholar] [CrossRef]
- Dhumal, K.; Datir, S.; Pandey, R. Assessment of bulb pungency level in different Indian cultivars of onion (Allium cepa L.). Food Chem. 2007, 100, 1328–1330. [Google Scholar] [CrossRef]
- Zhang, S.L.; Peng, D.E.N.G.; Xu, Y.C.; Lü, S.W.; Wang, J.J. Quantification and analysis of anthocyanin and flavonoids compositions, and antioxidant activities in onions with three different colors. J. Integr. Agric. 2016, 15, 2175–2181. [Google Scholar] [CrossRef]
- Lee, E.J.; Patil, B.S.; Yoo, K.S. Antioxidants of 15 onions with white, yellow, and red colors and their relationship with pungency, anthocyanin, and quercetin. LWT—Food Sci. Technol. 2015, 63, 108–114. [Google Scholar] [CrossRef]
- Dangi, R.; Khar, A.; Islam, S.; Kumar, A. Characterization and association of phenotypic and biochemical traits in onion under short day tropical conditions. Indian J. Hortic. 2018, 75, 226–236. [Google Scholar] [CrossRef]
- Gupta, A.J.; Benke, A.P.; Gorrepati, K.; Mahajan, V.; Singh, M. Trait association and variability study for biochemical and yield related traits in onion (Allium cepa L.). Veg. Sci. 2024, 51, 49–55. [Google Scholar] [CrossRef]
- Lyngkhoi, F.; Saini, N.; Gaikwad, A.B.; Thirunavukkarasu, N.; Verma, P.; Silvar, C.; Yadav, S.; Khar, A. Genetic diversity and population structure in onion (Allium cepa L.) accessions based on morphological and molecular approaches. Physiol. Mol. Biol. Plants 2021, 27, 2517–2525. [Google Scholar] [CrossRef]
- Raj, A.C.; Sharangi, A.B.; Das, A.; Pramanik, K.; Upadhyay, T.K.; Almutairi, M.; Khan, M.I.; Ahmad, I.; Kausar, M.A.; Saeed, M. Assessing the genetic divergence of onion (Allium cepa L.) through morpho-physiological and molecular markers. Sustainability 2022, 14, 1131. [Google Scholar] [CrossRef]
- Priyadarshini, G.; Amarananjundeswara, H.; Doddabasappa, B.; Vasudeva, K.R.; Anjanappa, M.; Prasad, P.S. Studies on identification of suitable onion genotypes for processing. J. Pharmacol. Phytochem. 2020, 9, 3091–3094. [Google Scholar]
- Singh, S.R.; Ahamed, N.; Srivastava, K.K.; Kumar, D.; Yousuf, S. Assessment of genetic divergence in long day onion (Allium cepa L.) through principal component and single linkage cluster analysis. J. Hortic. Sci. 2020, 15, 17–26. [Google Scholar]
- Abbasi, Z.; Darabi, A.; Shahmansouri, E. Evaluation of short day onion (Allium cepa L.) genotypes for quantity and quality traits. J. Hortic. Postharvest Res. 2022, 5, 379–390. [Google Scholar]
- Cantwell, M.I.; Kang, J.; Hong, G. Heat treatments control sprouting and rooting of garlic cloves. Posth. Bio. Tech. 2003, 30, 57–65. [Google Scholar] [CrossRef]
- Singleton, V.L.; Orthofer, R.; Lamuela-Raventos, R.M. Analysis of total phenols and other oxidation substrates and antioxidants by means of Folin-Ciocalteu reagent. Methods Enzymol. 1999, 299, 152–178. [Google Scholar]
- Sembiring, E.N.; Elya, B.; Sauriasari, R. Phytochemical screening, total flavonoid and total phenolic content and antioxidant activity of different parts of Caesalpinia bonduc (L.) Roxb. Pharmacogn. J. 2018, 10, 123–127. [Google Scholar] [CrossRef]
- Kumaran, A.; Karunakaran, R.J. In vitro antioxidant activities of methanol extracts of five phyllanthus species from India. LWT-Food Sci. Technol. 2007, 40, 344–352. [Google Scholar] [CrossRef]
- Lee, J.Y.; Hwang, W.I.; Lim, S.T. Antioxidant and anticancer activities of organic extracts from Platycodon grandiflorum A. De Candolle roots. J. Ethnopharma 2004, 93, 409–415. [Google Scholar] [CrossRef] [PubMed]
- Nuutila, A.M.; Puupponen-Pimiä, R.; Aarni, M.; Oksman-Caldentey, K.M. Comparison of antioxidant activities of onion and garlic extracts by inhibition of lipid peroxidation and radical scavenging activity. Food Chem. 2003, 81, 485–493. [Google Scholar] [CrossRef]
- Mathew, S.; Abraham, T.E. Studies on the antioxidant activities of cinnamon (Cinnamom umverum) bark extracts, through various in vitro models. Food Chem. 2006, 94, 520–528. [Google Scholar] [CrossRef]
- Ward, J.H., Jr.; Hook, M.E. Application of an hierarchical grouping procedure to a problem of grouping profiles. Educ. Psychol. Meas. 1963, 23, 69–81. [Google Scholar] [CrossRef]
- Benkeblia, N. Free-radical scavenging capacity and antioxidant properties of some selected onions (Allium cepa L.) and garlic (Allium sativum L.) extracts. Braz. Arch. Biol. Technol. 2005, 48, 753–759. [Google Scholar] [CrossRef]
- Kahane, R.; Vaillle-Guerin, E.; Boukema, I.; Tzanoudakis, D.; Bellamy, C.; Chamaux, C.; Kik, C. Changes in non- structural carbohydrate composition during bulbing in sweet and high-solid onions in field experiments. Environ. Exp. Bot. 2001, 45, 72–83. [Google Scholar] [CrossRef]
- Benke, A.P.; Krishna, R.; Mahajan, V.; Ansari, W.A.; Gupta, A.J.; Khar, A.; Shelke, P.; Thangasamy, A.; Shabeer, T.A.; Singh, M.; et al. Genetic diversity of Indian garlic core germplasm using agro-biochemical traits and SRAP markers. Saudi J. Biol.Sci. 2021, 28, 4833–4844. [Google Scholar] [CrossRef]
- Sahoo, B.B.; Panda, D.; Panda, A.; Gupta, A.J.; Tripathy, P.; Senapati, N.; Bhupenchandra, I.; Singh, S.; Mohanty, S.; Dasgupta, M.; et al. Exploring the morphological and biochemical characteristics of Kharif onion (Allium cepa L.): Principal component and path coefficient analysis. Vegetos 2024, 37, 2041–2050. [Google Scholar] [CrossRef]
- Velioglu, Y.S.; Mazza, G.; Gao, L.; Oomah, B.D. Antioxidant activity and total phenolics in selected fruits, vegetables, and grain products. J. Agric. Food Chem. 1998, 46, 4113. [Google Scholar] [CrossRef]
- Benke, A.P.; Dukare, S.; Mahajan, V.; Singh, M. Genetic divergence studies for bulbing and related traits in garlic germplasm during kharif season. Int. J. Curr. Microbiol. Appl. Sci. 2018, 7, 2920–2927. [Google Scholar] [CrossRef]
- Islam, S.; Khar, A.; Singh, S.; Tomar, B.S. Variability, heritability and trait association studies for bulb and antioxidant traits in onion (Allium cepa L.) varieties. Ind. J. Agric. Sci. 2019, 89, 450–457. [Google Scholar] [CrossRef]
- Kaur, C.; Joshi, S.; Kapoor, H.C. Antioxidants in onion (Allium cepa L.) cultivars grown in India. J. Food Biochem. 2009, 33, 184–200. [Google Scholar] [CrossRef]
- Clark, C.J.; Shaw, M.L.; Wright, K.M.; McCallum, J.A. Quantification of free sugars, fructan, pungency and sweetness indices in onion populations by FT-MIR spectroscopy. J. Sci. Food. Agric. 2018, 98, 5525–5533. [Google Scholar] [CrossRef] [PubMed]


| Sr No. | Name | Type | Bulb Skin Color | Storage |
|---|---|---|---|---|
| 1. | W-112 | Breeding line | White | Medium |
| 2. | W-118 | Breeding line | White | Medium |
| 3. | W-108 | Breeding line | White | Medium |
| 4. | W-103 | Breeding line | White | Medium |
| 5. | W-023 | Breeding line | White | Medium |
| 6. | W-340 | Breeding line | White | Medium |
| 7. | W-310 | Breeding line | White | Medium |
| 8. | Ws-123 | Breeding line | White | Medium |
| 9. | W-107 | Breeding line | White | Medium |
| 10. | W-115 | Breeding line | White | Medium |
| 11. | W-507 | Breeding line | White | Medium |
| 12. | W448 | Breeding line | White | Medium |
| 13. | W-498 | Breeding line | White | Medium |
| 14. | W-408 | Breeding line | White | Medium |
| 15. | W-414 | Breeding line | White | Medium |
| 16. | W-361 | Breeding line | White | Medium |
| 17. | W-125 | Breeding line | White | Medium |
| 18. | W-500 | Breeding line | White | Medium |
| 19. | W-344 | Breeding line | White | Medium |
| 20. | W-464 | Breeding line | White | Medium |
| 21. | Bhima Super | Open-pollinated | Red | Poor |
| 22. | Bhima Raj | Open-pollinated | Red | poor |
| 23. | Bhima Dark Red | Open-pollinated | Dark Red | Poor |
| 24. | Bhima Red | Open-pollinated | Red | Good |
| 25. | Bhima Shweta | Open-pollinated | White | Medium |
| 26. | Bhima Shubhra | Open-pollinated | White | Medium |
| 27. | Agri Found Red | Open-pollinated | Red | Medium |
| Biochemical Parameters | High TSS Lines | Low TSS Lines | Varieties |
|---|---|---|---|
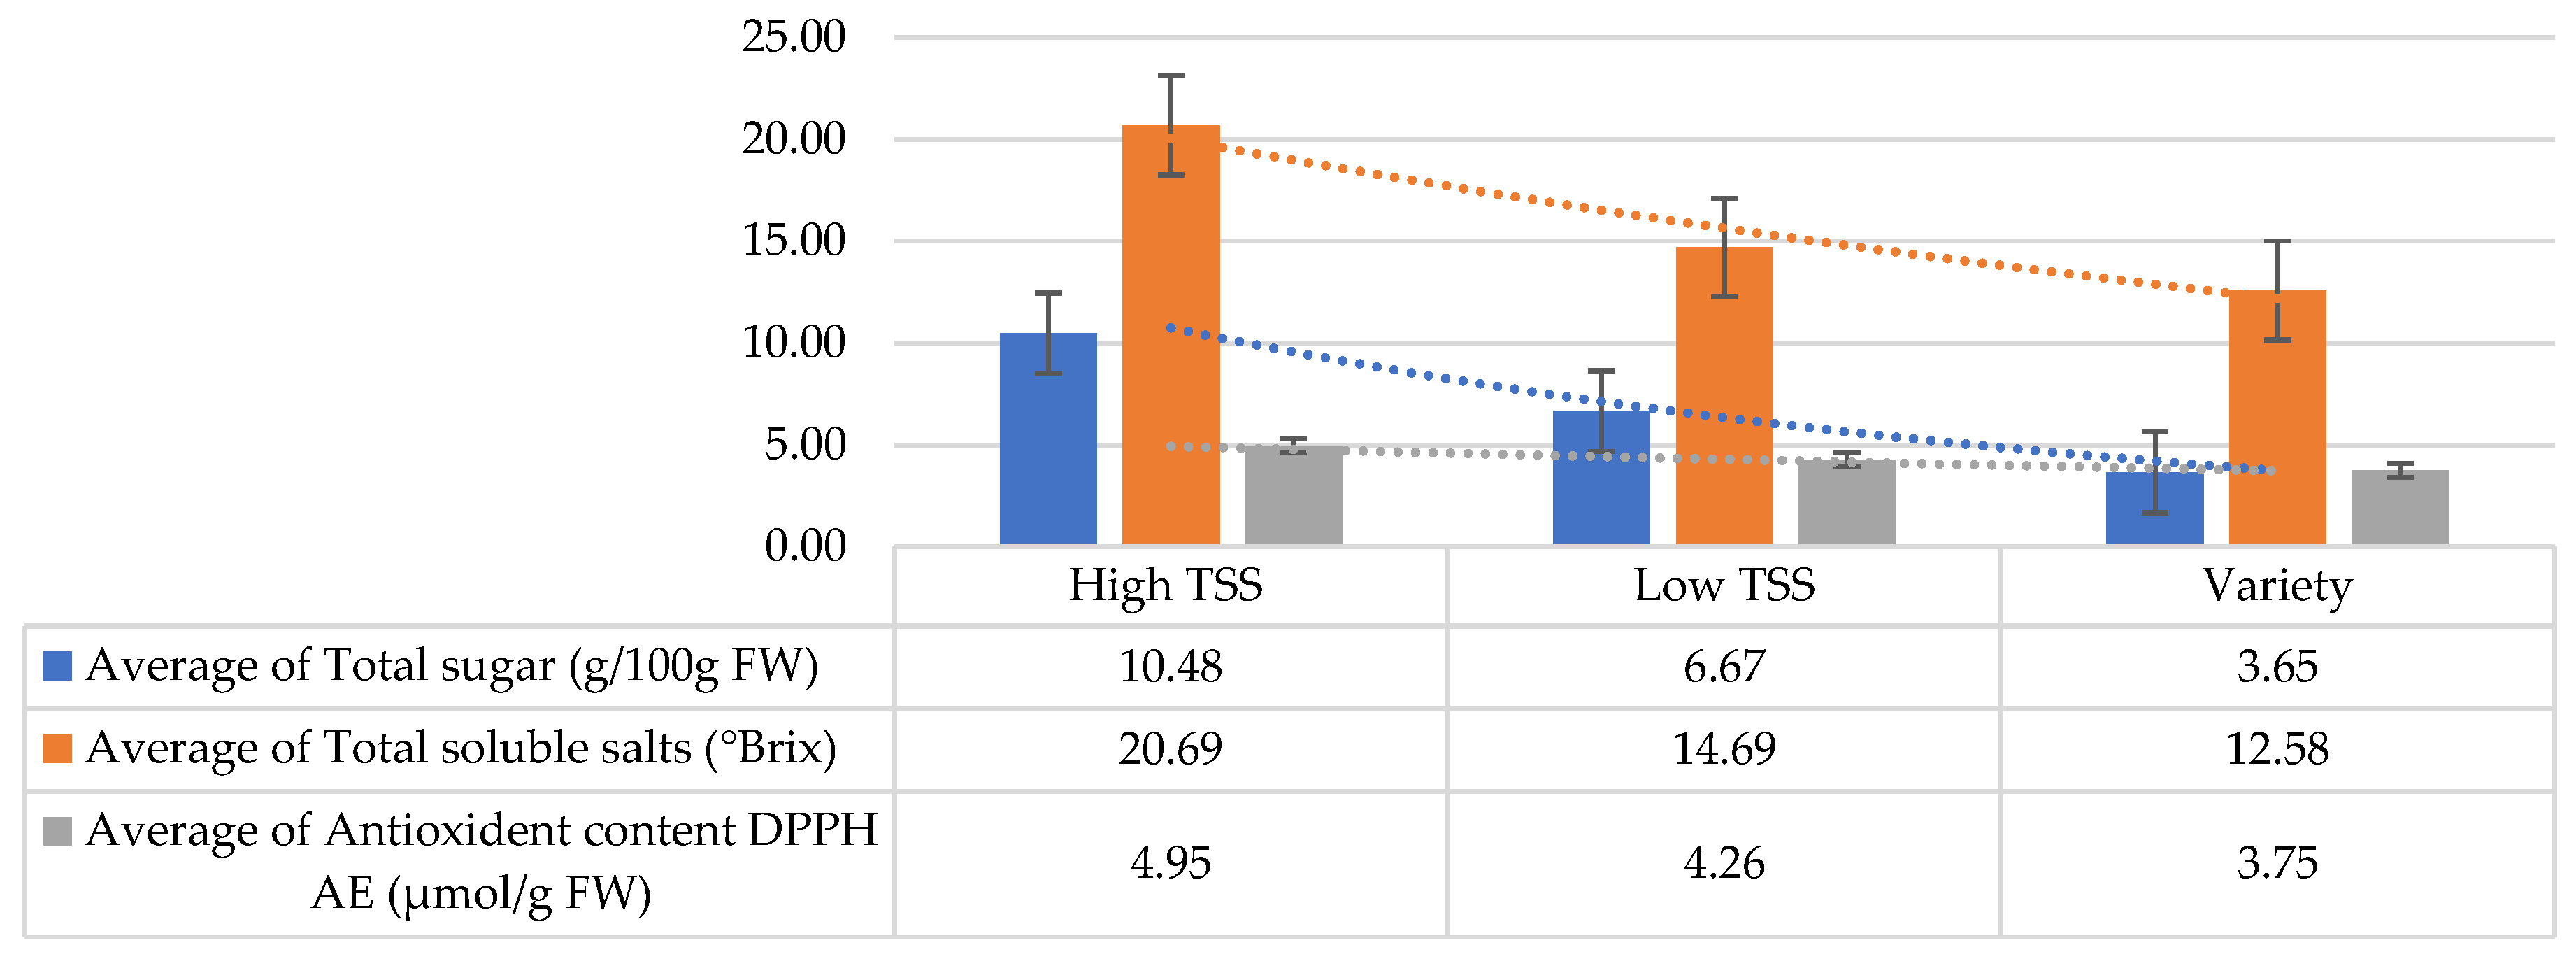
| Total soluble solids °Brix | 20.69 ± 0.20 a | 14.69 ± 0.13 b | 12.42 ± 0.15 ab |
| Thiosulfinate content µmol/g FW | 21.06 ± 0.18 ab | 21.27 ± 0.43 ab | 20.53 ± 0.23 ab |
| Total phenolic content mg GAE/g FW | 0.33 ± 0.02 bc | 0.28 ± 0.015 ab | 0.40 ± 0.02 abc |
| Total flavonoid content QE mg/100 g FW | 7.48 ± 0.012 bc | 5.88 ± 0.028 abc | 9.06 ± 0.015 bcd |
| Antioxidant capacity ABTS TEAC µmol/g FW | 0.74 ± 0.031 bcd | 0.80 ± 0.022 bcd | 0.58 ± 0.061 bc |
| Antioxidant capacity DPPH AE µmol/g FW | 4.95 ± 0.120 bcd | 4.26 ± 0.125 bcd | 3.75 ± 0.160 ab |
| Total sugar content g/100 g FW | 12.85 ± 0.12 ab | 6.11 ± 0.31 cd | 6.15 ± 0.11 cd |
| Reducing sugar content g/100 g FW | 0.90 ± 0.11 bc | 0.90 ± 0.12 bc | 1.20 ± 0.14 ad |
| Traits | Total Soluble Solids (°Brix) | Thiosulfinate Content (µmol/g FW) | Total Phenolic Content GE (mg/g FW) | Total Flavonoid Content QE (mg/g FW) | Antioxidant Capacity ABTS TEAC (µmol/g FW) | Antioxidant Capacity DPPH AE (µmol/g FW) | Total Sugar Content (g/100 g FW) | Reducing Sugar (g/100 g FW) |
|---|---|---|---|---|---|---|---|---|
| Total soluble solids (°Brix) | 1 | |||||||
| Thiosulfinate (µmol/g FW) | 0.0033 | 1 | ||||||
| Total phenolic Content GE (mg/g FW) | −0.2139 | −0.1130 | 1 | |||||
| Total flavonoid content QE (mg/g FW) | −0.1218 | −0.0958 | 0.9097 | 1 | ||||
| Antioxidant capacity ABTS TEAC (µmol/g FW) | 0.0362 | 0.0833 | 0.1903 | −0.0059 | 1 | |||
| Antioxidant capacity DPPH AE (µmol/g FW) | 0.6117 | 0.1301 | −0.0705 | −0.0089 | 0.1757 | 1 | ||
| Total sugar content (g/100 g FW) | 0.7063 | 0.3127 | −0.1801 | −0.1237 | 0.0923 | 0.7122 | 1 | |
| Reducing sugar (g/100 g FW) | −0.3890 | 0.0029 | 0.2232 | 0.1719 | −0.1113 | −0.3723 | −0.2295 | 1 |
| Cluster (No. of Lines/Varieties) | Parameters | Total Soluble Solids (°Brix) | Thiosulfinate Content (µmol/g FW) | Total Phenolic Content GE (mg/g FW) | Total Flavonoid Content QE (mg/g FW) | Antioxidant Content ABTS TEAC (µmol/g FW) | Antioxidant Content DPPH AE (µmol/g FW) | Total Sugar (g/100 g FW) | Reducing Sugar (g/100 g FW) |
|---|---|---|---|---|---|---|---|---|---|
| I (13) | Means | 19.48 | 21.05 | 0.32 | 0.07 | 0.92 | 4.97 | 10.45 | 0.04 |
| Max | 22.72 | 23.07 | 0.39 | 0.1 | 1.56 | 7.41 | 16.31 | 0.13 | |
| Min | 14 | 18.33 | 0.28 | 0.05 | 0.44 | 4.03 | 4.94 | 0 | |
| Std Dev | 2.81 | 1.6 | 0.04 | 0.02 | 0.44 | 0.96 | 3.36 | 0.03 | |
| Variance | 7.92 | 2.57 | 0 | 0 | 0.19 | 0.93 | 11.26 | 0 | |
| II(8) | Means | 14.06 | 22 | 0.26 | 0.05 | 0.49 | 4.08 | 6.39 | 0.13 |
| Max | 16.48 | 26.06 | 0.33 | 0.07 | 0.79 | 4.22 | 12.78 | 0.3 | |
| Min | 12.3 | 17.57 | 0.21 | 0.03 | 0.36 | 3.83 | 2.32 | 0.02 | |
| Std Dev | 1.47 | 3.07 | 0.04 | 0.01 | 0.14 | 0.12 | 3.72 | 0.1 | |
| Variance | 2.16 | 9.4 | 0 | 0 | 0.02 | 0.01 | 13.82 | 0.01 | |
| III (6) | Means | 13.69 | 19.51 | 0.44 | 0.1 | 0.61 | 3.64 | 2.32 | 0.13 |
| Max | 19.6 | 21.2 | 0.52 | 0.13 | 0.72 | 3.92 | 2.75 | 0.3 | |
| Min | 11.36 | 17.6 | 0.31 | 0.08 | 0.46 | 3.14 | 2.15 | 0.02 | |
| Std Dev | 2.86 | 1.16 | 0.08 | 0.02 | 0.08 | 0.25 | 0.22 | 0.12 | |
| Variance | 8.18 | 1.34 | 0.01 | 0 | 0.01 | 0.06 | 0.05 | 0.02 |
| Traits | PC1 | PC2 | PC3 | PC4 | PC 5 |
|---|---|---|---|---|---|
| Total soluble solids | 0.48301 | 0.17229 | −0.25215 | 0.14162 | 0.17744 |
| Thiosulfinate content | 0.15782 | 0.00426 | 0.82728 | 0.19161 | −0.43348 |
| Total phenolic content | −0.30324 | 0.62220 | 0.08454 | 0.00623 | 0.07136 |
| Total flavonoid content | −0.26411 | 0.62260 | −0.07996 | 0.18900 | −0.19480 |
| Antioxidant capacity ABTS TEAC | 0.07765 | 0.23732 | 0.32982 | −0.83188 | 0.31145 |
| Antioxidant capacity DPPH | 0.46424 | 0.30680 | 0.04090 | 0.03708 | 0.08169 |
| Total sugar content | 0.49779 | 0.21196 | 0.15292 | 0.25262 | 0.20752 |
| Reducing sugar content | −0.33277 | 0.01261 | 0.33433 | 0.38761 | 0.76866 |
| Number | Eigen Value | Percent | Cum Percent |
|---|---|---|---|
| 1 | 2.7919 | 34.899 | 34.89 |
| 2 | 1.8238 | 22.797 | 57.69 |
| 3 | 1.0934 | 13.668 | 71.36 |
| 4 | 0.9934 | 12.418 | 83.78 |
| 5 | 0.6975 | 8.719 | 92.50 |
| 6 | 0.3539 | 4.423 | 96.92 |
| 7 | 0.1854 | 2.317 | 99.24 |
| 8 | 0.0606 | 0.758 | 100.00 |
Disclaimer/Publisher’s Note: The statements, opinions and data contained in all publications are solely those of the individual author(s) and contributor(s) and not of MDPI and/or the editor(s). MDPI and/or the editor(s) disclaim responsibility for any injury to people or property resulting from any ideas, methods, instructions or products referred to in the content. |
© 2025 by the authors. Licensee MDPI, Basel, Switzerland. This article is an open access article distributed under the terms and conditions of the Creative Commons Attribution (CC BY) license (https://creativecommons.org/licenses/by/4.0/).
Share and Cite
Benke, A.P.; Mahajan, V.; Mokat, D.N. Unraveling the Biochemical Diversity in Short-Day Onion Genotypes. Horticulturae 2025, 11, 484. https://doi.org/10.3390/horticulturae11050484
Benke AP, Mahajan V, Mokat DN. Unraveling the Biochemical Diversity in Short-Day Onion Genotypes. Horticulturae. 2025; 11(5):484. https://doi.org/10.3390/horticulturae11050484
Chicago/Turabian StyleBenke, Ashwini Prashant, Vijay Mahajan, and Digambar N. Mokat. 2025. "Unraveling the Biochemical Diversity in Short-Day Onion Genotypes" Horticulturae 11, no. 5: 484. https://doi.org/10.3390/horticulturae11050484
APA StyleBenke, A. P., Mahajan, V., & Mokat, D. N. (2025). Unraveling the Biochemical Diversity in Short-Day Onion Genotypes. Horticulturae, 11(5), 484. https://doi.org/10.3390/horticulturae11050484