Article

Response of Shoot Growth to Ecological Factors Highlights a Synergistic Relationship Between Yield and Catechin Accumulation in Tea Plant (Camellia sinensis L.)

1
College of Life and Environmental Science, Hunan University of Arts and Science, Changde 415000, China
2
Agricultural Products Processing and Food Safety Key Laboratory of Hunan Higher Education, Changde 415000, China
3
College of Synthetic Biology Industry, Hunan University of Arts and Science, Changde 415000, China
4
College of Horticulture, Fujian Agriculture and Forestry University, Fuzhou 350002, China
*
Author to whom correspondence should be addressed.
Horticulturae 2025, 11(6), 624; https://doi.org/10.3390/horticulturae11060624
Submission received: 26 April 2025 / Revised: 25 May 2025 / Accepted: 28 May 2025 / Published: 2 June 2025
(This article belongs to the Special Issue Biotic and Abiotic Stress Responses of Horticultural Plants)

Abstract

Ecological factors directly influence the growth and metabolism of tea plants (Camellia sinensis L.), and unfavorable environmental conditions cause abiotic stress to them. Abiotic stress causes damage to reliable, high-quality, and safe tea production, yet the optimal ecological conditions for enhancing both yield and quality remain unclear. To investigate the response patterns of shoot growth to ecological factors and its relationship with catechin accumulation, this study conducted the cultivation of tea plants with a precise modulation of both individual and combined ecological parameters. Under 30 °C and 90% air humidity, specific combinations of light intensity and substrate relative humidity (“250 µmol·m−2·s−1 + 65%” or “350 µmol·m−2·s−1 + 70%”) significantly enhanced growth and yield. A significant correlation between shoot growth and catechin accumulation was observed, and mathematical models further revealed a synergistic response between shoot growth capacity and total catechin content to ecological factors. Furthermore, co-expression analysis indicated that catechin biosynthesis-related genes exhibited coordinated expression with key growth-related genes, including CsTCP, CsErf, and CsXth. In conclusion, these findings identify optimal ecological conditions to mitigate abiotic stress and reveal a synergistic relationship between catechin biosynthesis and shoot growth, providing an ecological basis for balancing yield and quality in tea production.

1. Introduction

Tea is a popular non-alcoholic beverage worldwide, valued for its various health benefits [1]. Global tea leaf production reportedly exceeded 30 million metric tons in 2023 [2], with an import value reaching USD 6.57 billion. However, rising temperatures and inconsistent rainfall reduce tea yields in major producing countries, such as Sri Lanka [3,4], Kenya [5,6], India [7,8], and China [9,10]. Drought has reduced tea production by 30% in Kenya [11] and by 26% in Sri Lanka [4]. As global warming intensifies, future climate change is expected to cause further losses in tea production [11]. Projections indicate a potential 5% decline in Kenya’s tea yield between 2040 and 2070 due to heat and water stress [6]. Moreover, Sri Lanka’s total tea production is estimated to decrease by 7.7%, 10.7%, and 22% over the next 10, 20, and 70 years, respectively [3].
Climate change negatively impacts both the yield and quality of tea, primarily through variations in temperature, light intensity, and humidity [12]. Previous studies show a direct negative correlation between minimum daily temperature and tea yield, as indicated by predictive models [13,14]. A decline in solar radiation during the growing season reduces yield, as both leaf number and weight increase with higher solar radiation [9,15]. An analysis of five studies concluded that excessive, insufficient, or unevenly distributed rainfall reduces tea yield [11]. Additionally, predictive models suggest that drought increases the risk of tea growth and yield reduction by over 40% [16]. The uncontrollable nature of the outdoor environment often necessitates pesticide and herbicide use, posing risks to the quality and safety of tea [17]. Therefore, ensuring a stable and optimized growing environment represents a significant challenge for sustainable tea cultivation and quality assurance.
Plant factories, which allow the precise monitoring and control of environmental factors such as temperature, humidity, light, and nutrients [18,19], offer a potential solution for stable and controlled cultivation. Plant factories can effectively mitigate natural disasters, reduce pesticide use, enhance crop yield and quality, and promote sustainable agriculture [20,21]. For instance, lettuce grown in plant factories can exhibit a shorter growth cycle with higher dry weight compared with greenhouses [22]. Moreover, optimizing cultivation conditions has significantly increased steviol glycoside content in stevia [23]. Research on artificial tea cultivation is emerging, led by groups like Fujian Sanan Sino-Science Photobiotech Co., Ltd. (SANANBIO, Quanzhou, China) in China and research teams in Japan. SANANBIO established a suitable method for indoor tea cultivation and subsequently applied for a related technical patent. Shunsuke Miyauchi et al. investigated artificial tea cultivation, focusing on light conditions to enhance green tea quality [24,25]. Furthermore, specific light conditions conductive to promoting tea plant growth in plant factories have been identified [17]. In summary, tea yield and quality face significant challenges from adverse ecological conditions, both currently and projected into the future. However, previous research has predominantly focused on the effects of light intensity or a specific light spectrum in isolation. A critical knowledge gap exists regarding the complex interplay between multiple key ecological factors and their combined influence on the growth, yield, and biochemical profile of tea plants grown indoors. Addressing this gap is crucial for developing optimized ecological conditions for high-quality indoor tea production.
Building on the team’s previous findings in both field and controlled environments, we hypothesized that manipulating ecological factors could optimize tea shoot growth, likely showing diminishing returns or stress effects beyond certain thresholds. We further hypothesized that the response of catechin accumulation, a key quality indicator, to these environmental factors might have the same pattern as shoot growth, potentially creating opportunities to achieve a co-increase in yield and quality. To validate this hypothesis, experiments were conducted in artificial climate chambers with variations in light intensity (L150, L250, L350, L450, and L550 μmol·m−2·s−1), relative air humidity (AH40%, AH50%, AH70%, and AH90%), and substrate relative humidity (RH65%, RH70%, RH75%, RH80%, and RH85%), and the interactive effects of ecological factors across seventeen treatment combinations were assessed (T1–T17). This study provides novel insights into balancing yield and quality in tea production.

2. Materials and Methods

2.1. Plant Material

This study utilized the “Huangdan” tea cultivar (Camellia sinensis var. sinensis cv. Huangdan). One-year-old cuttings were purchased from the Qianhe Tea Cooperative (Anxi County, China). The cultivation protocol followed the optimized methods developed by Fujian Zhongke Biology Co., Ltd. (Quanzhou, China). Specifically, tea cuttings were pruned to 18–20 cm in height, with excess shoots removed to retain only 2–4 mature leaves on the stem, and fibrous roots were excised. The pruned cuttings were disinfected with a 1% potassium permanganate solution for 1 min before being planted in pots (16 cm in diameter, 18 cm in height). After the tea plants had successfully rooted and developed 2–3 new shoots, they were subjected to different ecological factor treatments. Each treatment consisted of 30 tea plants, which were randomly divided into three biological replicates. During the experiment, samples consisting of one bud and one leaf were collected. Half of the samples were dried and stored at −20 °C (drying conditions: 120 °C for 10 min, followed by 90 °C for 30 min) for HPLC analysis. The other half were frozen in liquid nitrogen and stored at −80 °C for qPCR analysis.

2.2. Environmental Conditions and Manipulation Methods

The artificial climate chamber, LED lamps, and nutrient solution were provided by Zhongke Biological Co., Ltd., Quanzhou, China. CO2 concentration was maintained at 750 ± 50 µmol·mol−1, automatically adjusted by the artificial climate chamber. The environmental parameters and manipulation methods are shown in Supplementary Table S1. In growth chambers, the ecological conditions experienced by individual plants fluctuate within a range rather than remain constant. However, the ranges of ecological factors were controlled to undergo minimal changes, and the ecological factors across different treatments fluctuated synchronously. The ecological conditions and duration for each treatment are provided in Supplementary Table S2.

2.3. Determination of Catechin Content

The method for catechin detection was consistent with that published by the research team in [26]. Tea samples (0.2 g, accurate to 0.0001 g) were weighed into a 10 mL centrifuge tube, and 5 mL of a pre-heated 70% methanol solution was added. After shaking on a mixer, the mixture was immediately transferred to a 70 °C water bath. It was incubated for 10 min, and shaken once at the 5 min mark. After 10 min, the centrifuge tube was centrifuged at 3500 r/min for 10 min, and the supernatant was transferred into a 10 mL brown volumetric flask. The residue was re-extracted with 5 mL of 70% methanol solution, and the procedure was repeated as above. The combined extract was adjusted to a volume of 10 mL and shaken well. Then, 1 mL of the solution was transferred into a 10 mL volumetric flask and diluted to 10 mL with the mobile phase. The mixture was then filtered through a 0.45 μM membrane before HPLC analysis.
The HPLC instrument was equipped with a Waters Acquity UPLC HSS T3 column (2.1 × 100 mm, RP18 1.7 μm) at a column temperature of 35 °C. Mobile phase A consisted of 97.98% pure water + 0.02% EDTA − 2Na + 2% glacial acetic acid, and mobile phase B comprised 98% acetonitrile + 2% glacial acetic acid. The photodiode array (PDA) detection conditions were as follows: a scanning range of 200–400 nm, a characteristic detection wavelength of 278 nm, a scanning time of 10 min, and an injection volume of 2 μL.

2.4. Measurement of Growth Indexes

Six tea plants were randomly selected from each treatment for measurements. The number of leaves, shoots, and buds per plant was counted. Leaf length, leaf width, shoot length, and internode length were measured using a ruler, while leaf thickness and shoot diameter were measured using a vernier caliper. Leaf area was estimated using the following formula: LA = Leaf Length × Leaf Width × 0.7. A “shoot strength index” was determined by dividing the length measured from the first true leaf to the uppermost mature leaf by the number of internodes. The “shoot ratio” was calculated as the number of shoots divided by the total number of buds.

2.5. RNA Extraction and qRT-PCR

The methods for detecting and calculating gene expression levels were the same as those described in published paper [27]. Total RNA was extracted using the RNAprep Pure Plant Kit (Tiangen, Beijing, China), according to the manufacturer’s instructions. First-strand cDNA was synthesized using the Script RT Kit (Tiangen, Beijing, China), and qRT-PCR was performed on an ABI 7500 Real-Time PCR System using the SuperReal PreMix Plus (SYBR Green) Kit (Tiangen, Beijing, China), following the manufacturer’s protocol. The 20 µL reaction mixture included 0.6 µL of forward and reverse primers, 1 µL of cDNA, 10 µL of SuperReal PreMix Plus, and 7.8 µL of ddH2O. The PCR program consisted of an initial denaturation at 95 °C for 15 min, followed by 40 cycles at 95 °C for 10 s and 61 °C for 32 s, and a melting curve analysis (95 °C for 15 s, 60 °C for 1 min, 95 °C for 30 s, and 60 °C for 15 s). GAPDH was used as the reference gene, and the relative expression levels of genes were calculated using the 2−ΔΔCt method. The primer sequences are listed in Supplementary Table S3.

2.6. Data Analysis

Significance analysis, correlation analysis, partial least squares analysis (PLS), logistic regression, receiver operating characteristic (ROC) curve analysis, and multiple regression analysis were conducted using SPSS 21.0. Surface fitting was performed using Origin 2021. The co-expression was analyzed by https://www.bioinformatics.com.cn (accessed on 1 February 2025), and visualization was performed using Adobe Illustrator 2024.

3. Results

3.1. Growth Patterns of Tea Shoots in Response to Individual Changes in Ecological Factors

The changes in each ecological factor, including light intensity, relative air humidity, and relative substrate humidity, significantly influenced tea plant shoot growth. Extremely low light (L150) inhibited shoot elongation and germination, while moderately high light (L250–L550) promoted increases in shoot length, diameter, and internode length (Figure 1). Low relative air humidity (AH40%) caused comprehensive reductions in five shoot-growth-related indices, resulting in shorter plants. Compared to AH40%, the AH90% treatment increased shoot length and leaf number by 58.33% and 35.79%, respectively (Supplementary Figure S1A, Supplementary Table S4). Substrate drought (RH65%) significantly suppressed shoot elongation but enhanced bud density and leaf thickness. In contrast, high substrate humidity (RH85%) increased shoot ratio, internode length, and other indices by 32.74–247.69% (Supplementary Figure S1B, Supplementary Table S4). Collectively, moderate light enhancement, higher air humidity, and adequate substrate moisture promoted vigorous shoot growth, while drought stress inhibited bud development into shoots and leaf expansion.
To comprehensively elucidate the response patterns of shoot growth to individual variations in ecological factors, we employed principal component analysis (PCA) on ten indicators. The principal component analysis explained 74.87%, 72.37%, and 85.61% of the original data with regard to individual variations in light intensity, relative air humidity, and relative substrate humidity, respectively. The model score (F), an indicator of shoot growth capacity, was significantly higher under moderate-light-intensity (L250–L450), AH70%, and RH80–85% treatments (Supplementary Figure S2).

3.2. Response of Tea Shoot Growth to the Interactive Changes in Ecological Factors

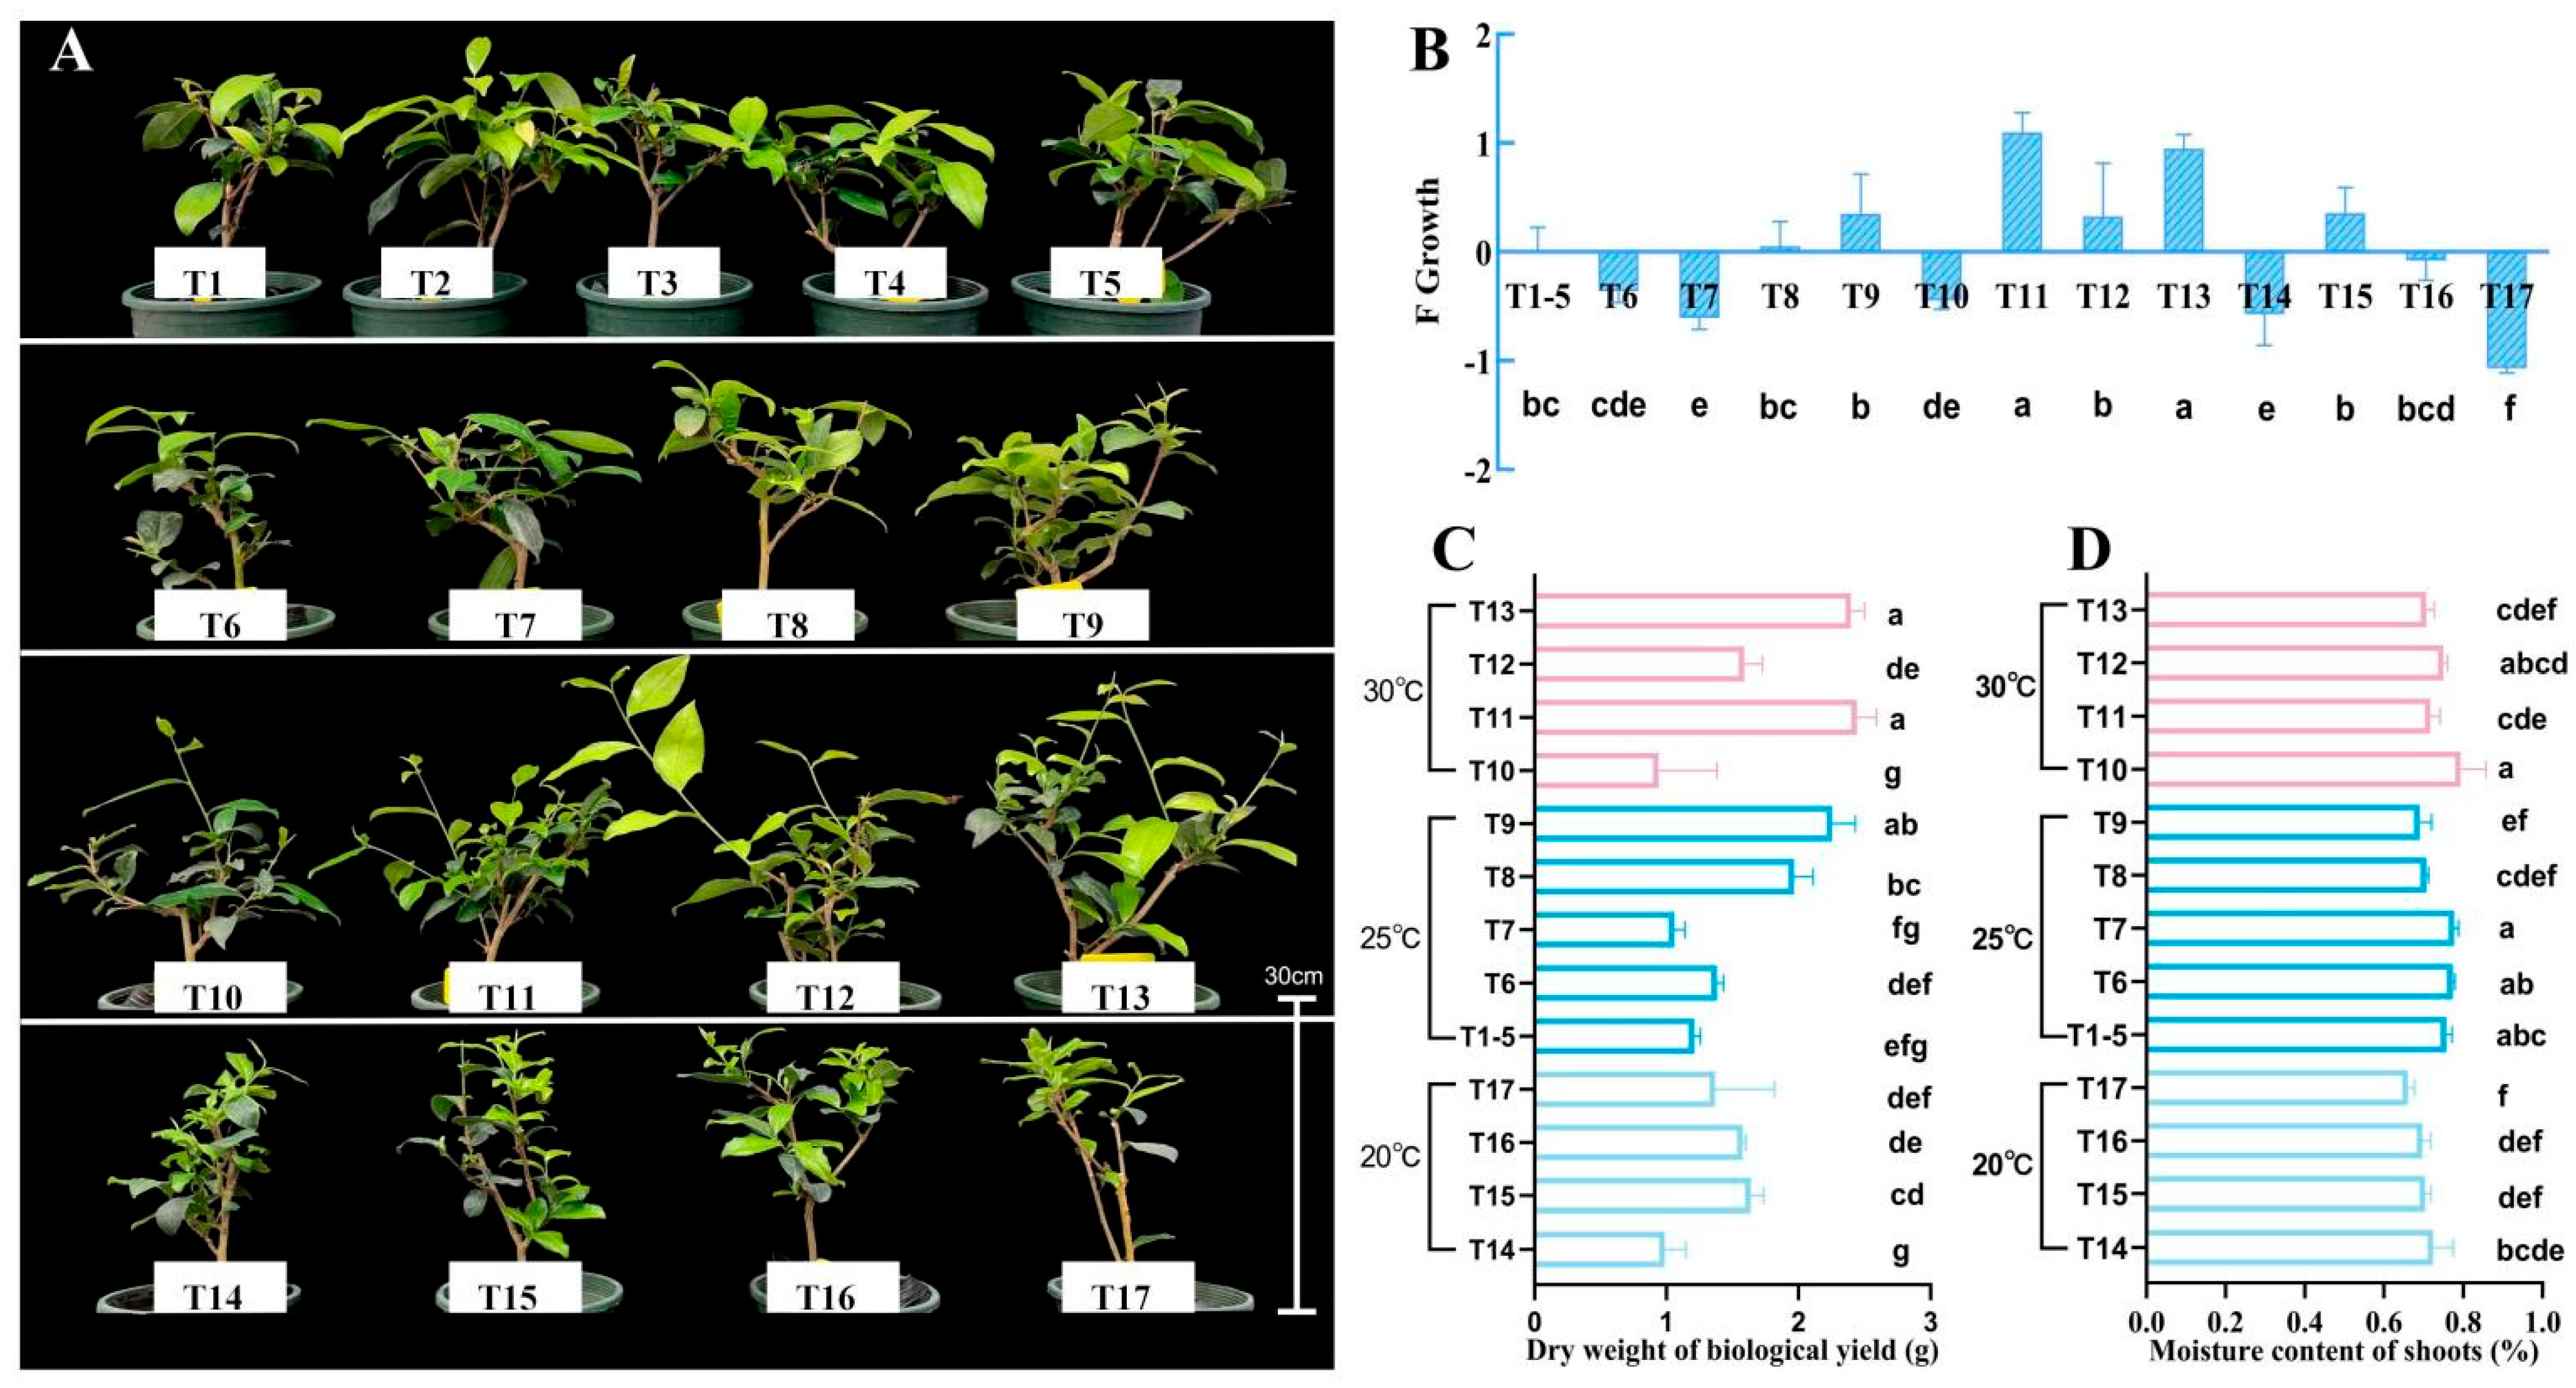
To elucidate the response patterns of tea shoot growth to the interactive variations in ecological factors, we employed the response surface methodology to design 17 treatments (T1–T17, Figure 2A). In treatments where both temperature and light intensity were increased (T11, T13, T12, T8, T9, and T15), there was an increase in shoot strength, shoot length, and internode length (Supplementary Table S5). This finding suggests that moderately elevated temperature and light intensity facilitate the elongation of tea shoots. Leaf area increased notably under treatments at 30 °C (T10–T13), was significantly lower at 25 °C (T1–T9), and reached its minimum at 20 °C (T14–T17). These results indicate that, within interacting ecological factors, tea leaves enlarge with rising temperature. In the principal component model, four principal components accounted for 88.50% of the original information, and the total score F represents the growth potential of tea shoots. Under moderately increased temperature, light intensity had a positive impact on growth capacity (T8 and T9 > T6 and T7; T11, T12 and T13 > T10). Conversely, under low-temperature conditions, both extremely high and low light intensities inhibited shoot growth (T15 and T16 > T14 and T17, Figure 2B).
The interactive changes in ecological factors significantly affected the biomass yield and water content of tea shoots (Figure 2C,D). The biomass yield was significantly higher under treatments with high light intensity (T13, T11, T9, and T8). Moreover, at 25 °C, the dry weight under treatments T8 and T9 (350 μmol·m−2·s−1) was significantly higher than that under treatments T6 and T7 (150 μmol·m−2·s−1). At 20 °C, treatment T14 (150 μmol·m−2·s−1) led to a decrease in dry weight but an increase in water content, and this response pattern was similar to that under 30 °C. Therefore, when the temperature is constant, higher light intensity promotes the biomass yield of tea shoots. Intriguingly, the response pattern of shoot water content was opposite to that of biomass yield, implying that increased light intensity promotes the lignification of tea shoots. In summary, both growth capacity and biomass yield were significantly enhanced under the ecological conditions of “90% AH + 30 °C + L250 + 65% RH” or “90% AH + 30 °C + L350 + 70% RH”. This indicates that, under conditions of higher temperature and air humidity, both high light intensity and moderate substrate water deficit can independently promote shoot growth.

3.3. Gene Responses in Shoot Growth to Ecological Factor Changes

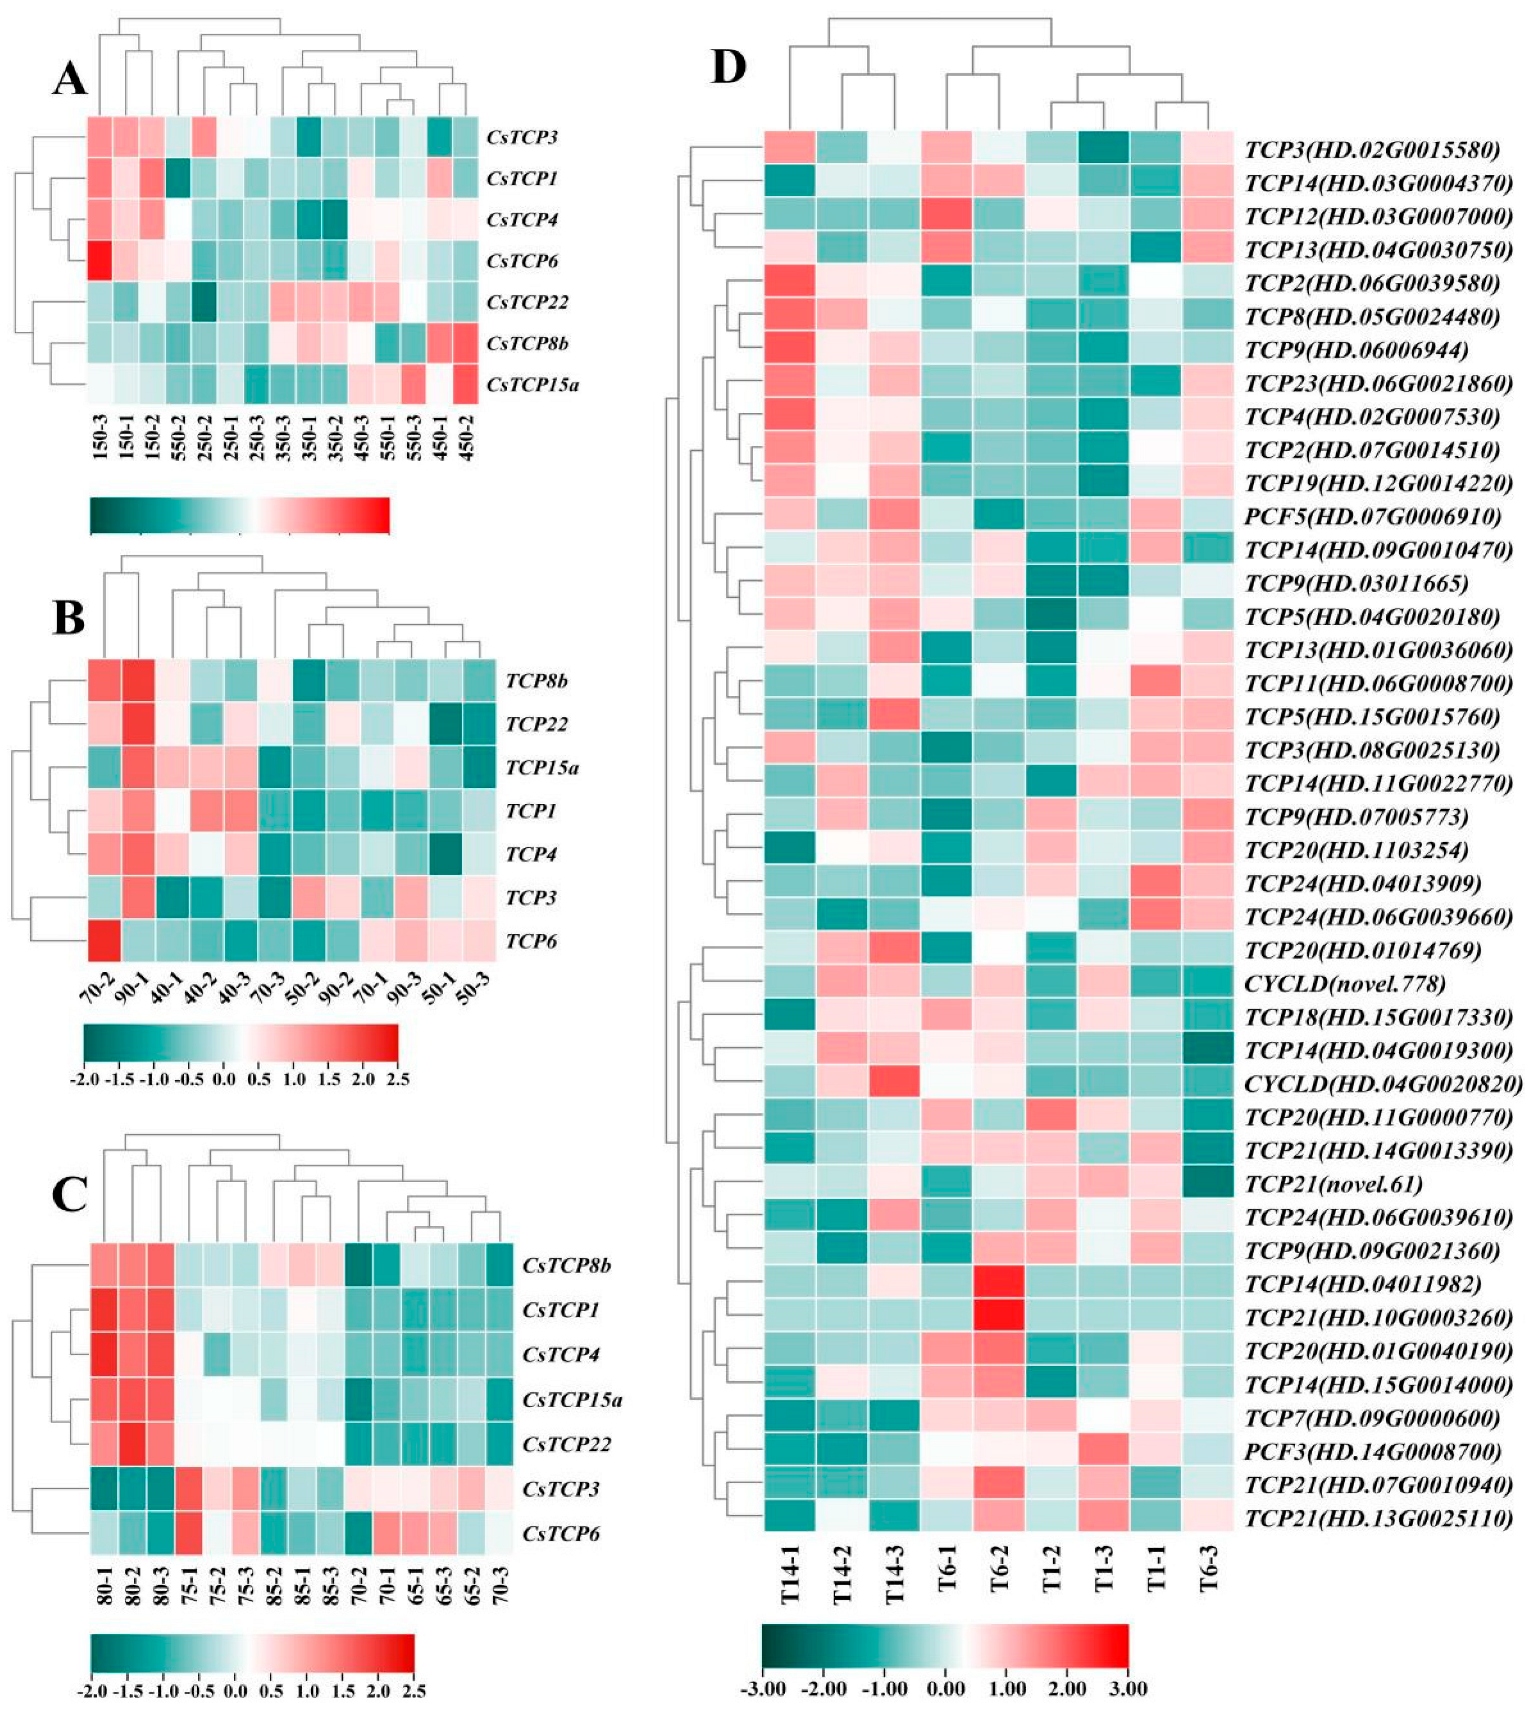
The CsTCP gene family plays a crucial role in shoot growth and exhibits a remarkable response to individual variations in ecological factors (Figure 3). When the light intensity was altered, treatment L150 maximized the expression of CsTCP3, CsTCP4, and CsTCP6, and treatment L450 up-regulated the expression of CsTCP8b (Figure 3A). Regarding changes in relative air humidity, the AH90% treatment enhanced the expression of CsTCP3 and CsTCP22 (Figure 3B). Similarly, regarding variations in relative substrate humidity, the expression levels of CsTCP1, CsTCP4, CsTCP15, and CsTCP22 under RH80% treatment were more than double those under RH65% treatment (Figure 3C). Evidently, the expression of CsTCP22 is promoted by higher air and substrate humidity. When ecological factors changed interactively, the transcriptional level of CsTCP12, CsTCP14, and CsTCP20 changed by less than 1.5-fold. The expression level of CsPCF3 reached its peak under treatment T1 and its lowest point under treatment T14. Notably, the response pattern of the expression level of CsTCP9 to the interactive changes in ecological factors was completely opposite to that of CsPCF3 (Figure 3D). In conclusion, the CsTCP gene family exhibits significant responses to individual and interactive changes in ecological factors such as light, air humidity, and substrate humidity. Different CsTCP genes display diverse expression patterns. For example, the expression of CsTCP22 is promoted by high humidity, and the response patterns of CsPCF3 and CsTCP9 are opposite.

3.4. Relationship Between Shoot Growth and Catechin Content in Response to Environmental Conditions

3.4.1. Correlation Analysis and Partial Least Squares Analysis

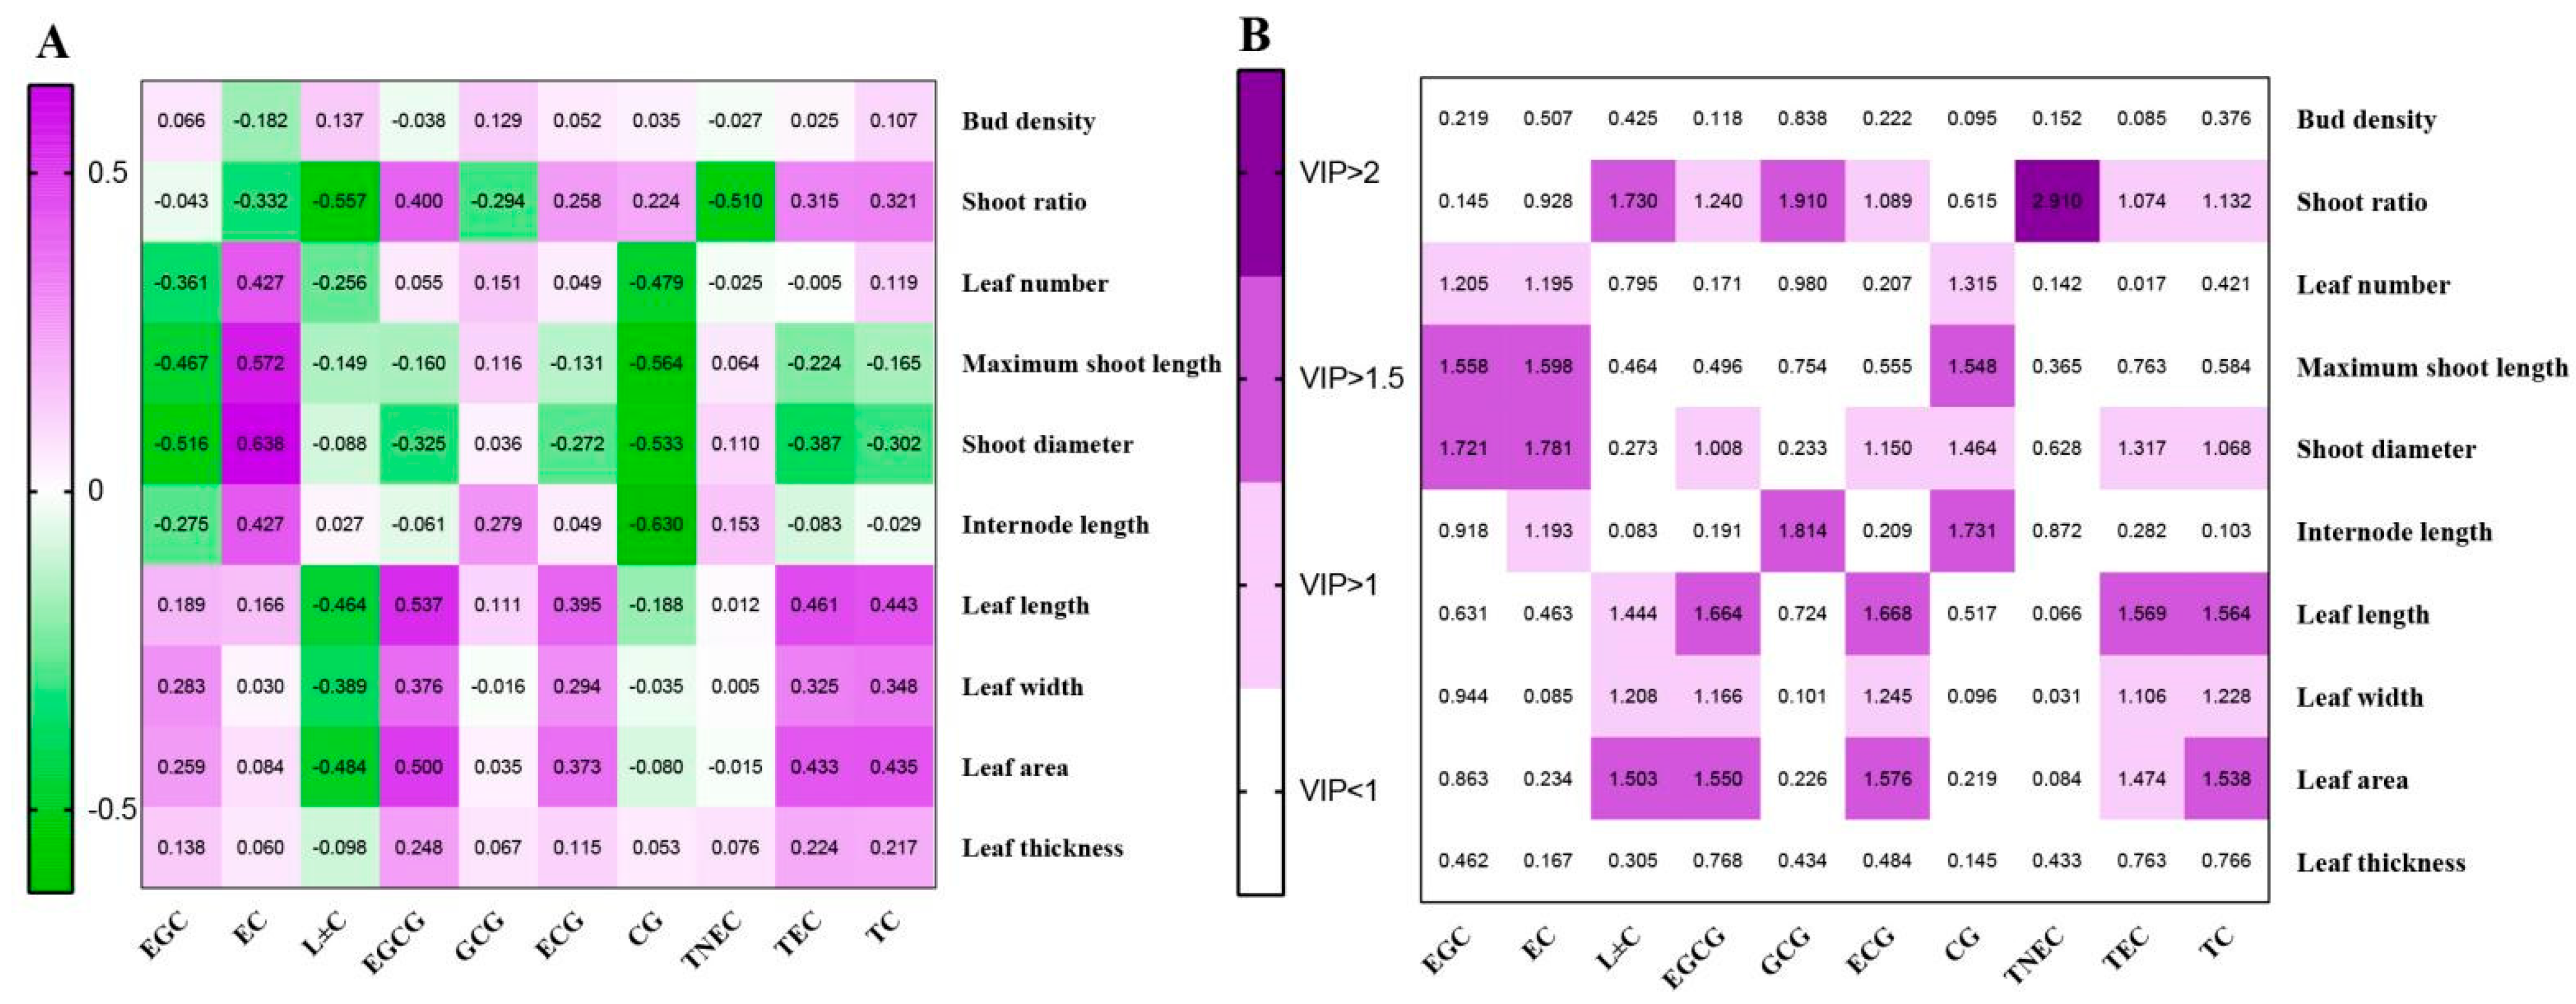
Shoot ratio, leaf length, leaf width, and leaf area were positively correlated with the content of ECG, EGCG, TEC, and TC, implying a synergistic response between shoot number, leaf size, and ester catechins (Figure 4A). Leaf number, maximum shoot length, shoot diameter, and internode length were negatively correlated with EGC and CG but positively correlated with EC. Interestingly, the diameter and maximum length of shoots showed a negative correlation with five catechin indicators. In contrast, there was a relatively weak correlation between leaf thickness, bud density, and catechin content, indicating that bud sprouting and leaf thickening in tea plants have no significant relationship with catechin accumulation. These results indicate that the relationship between the morphology and biochemical components of tea plants depends on their growth phases.
Variable importance in projection (VIP) from the partial least squares (PLS) model revealed that bud density and leaf thickness showed values below 1 across all catechin indicators (Figure 4B). In contrast, leaf number and maximum shoot length had VIP values surpassing 1 for EGC, EC, and CG. Leaf size (leaf length, width, and area) VIP values were above 1 for C, EGCG, ECG, TEC, and TC. Remarkably, shoot ratio and shoot diameter exhibited VIP values greater than 1 for seven catechin indicators, with the shoot ratio being particularly prominent, as its VIP value for TNEC exceeded 2. To explore the relationship between shoot growth parameters and overall catechin accumulation in tea plants, the contents of seven catechin monomers were used as Y variables in the PLS analysis. The results showed that leaf number, maximum shoot length, shoot diameter, and internode length had a significant relationship with catechin accumulation (Supplementary Figure S3). In summary, leaf number, shoot length, shoot ratio, and shoot diameter synergistically respond to changes in ecological factors alongside catechin accumulation. Specifically, shoot ratio and leaf size have a synergistic relationship with total non-esterified catechin (TNEC) and total esterified catechin (TEC) content, respectively.

3.4.2. Regression Analysis and Surface Fitting

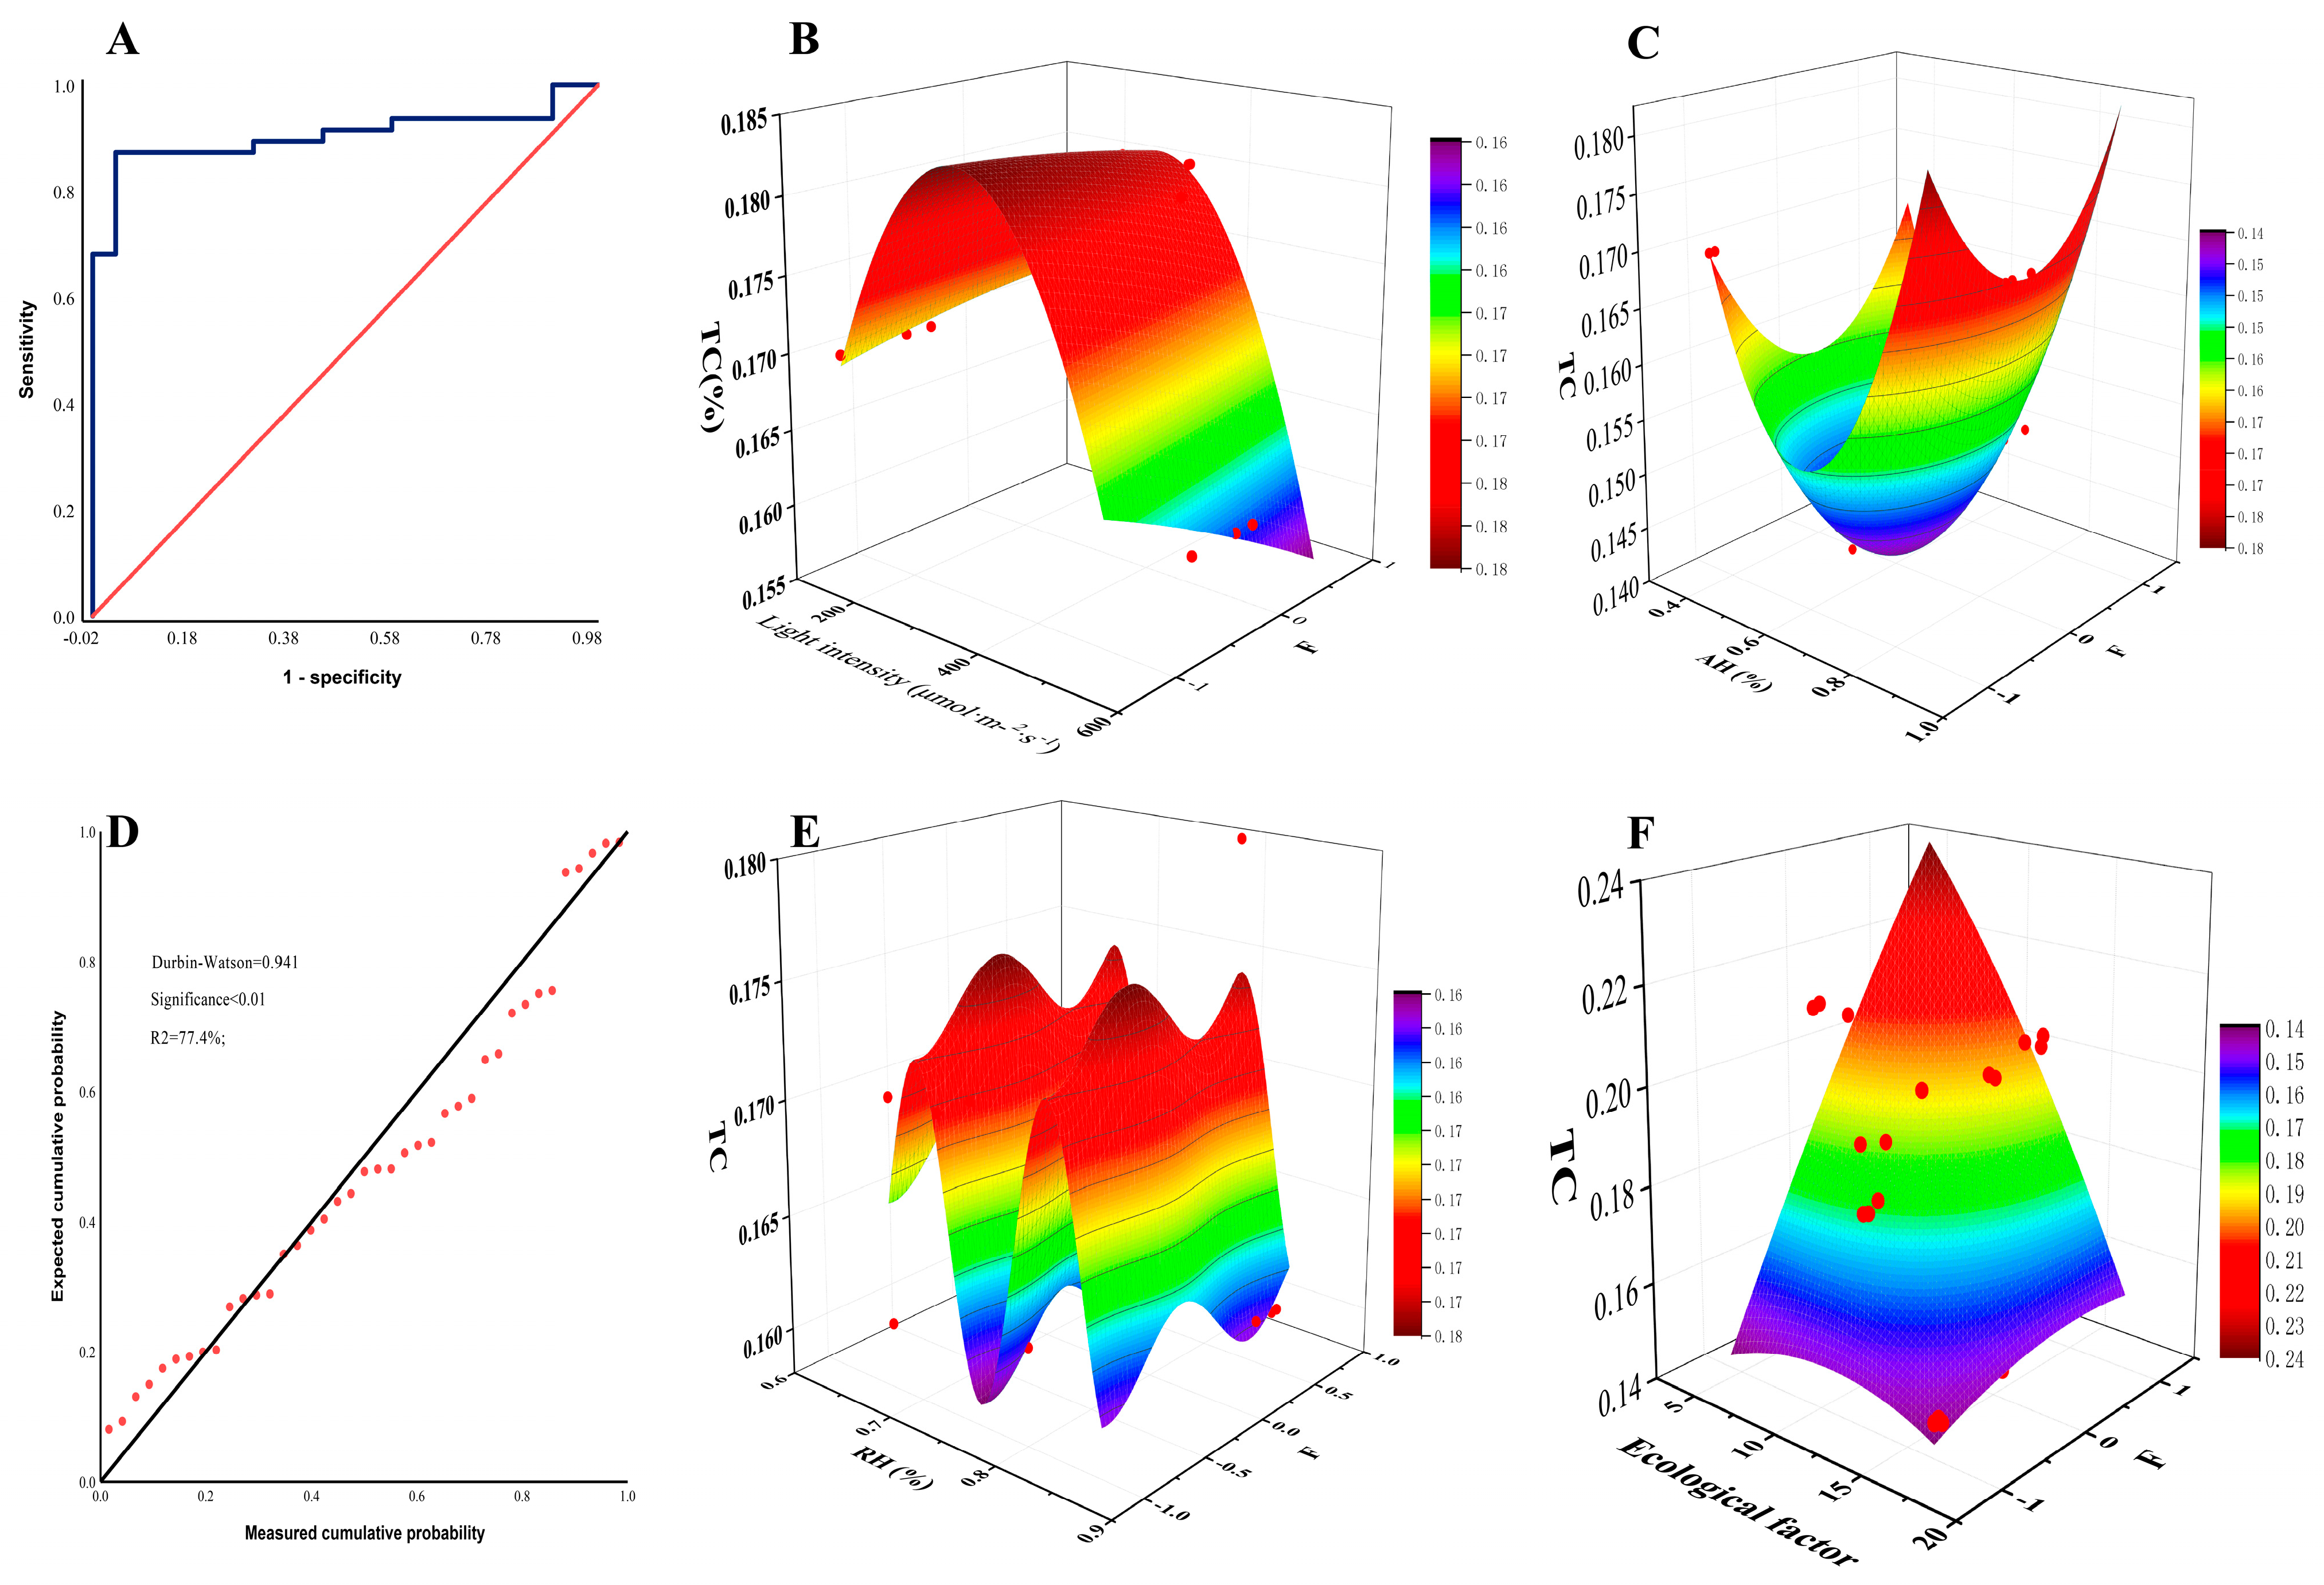
The L150, AH40%, RH65%, and T14 treatments were used as controls to determine whether the change trends of the F value and TC content were consistent. A consistent trend was coded as 1 and an inconsistent one as 0, on which logistic regression analysis and ROC curve analysis were conducted (Supplementary Table S6). The results showed that the logistic model was highly significant (p < 0.01) and the ROC area was 90.4% (Figure 5A). Consequently, variations in shoot growth were closely linked to changes in TC content across the ecological factors, suggesting these two aspects respond synergistically to environmental shifts. We removed the independent variables exhibiting multicollinearity and performed a multiple regression analysis using seven growth indicators and TC content. The results showed that Durbin–Watson values were <2, overall model significance was <0.01, and R2 was >70% (Figure 5D). The standardized residuals followed a normal distribution (Supplementary Figure S4). Using the resulting multiple regression equation, the predicted TC content fitted well with the actual measured values, suggesting a synergistic relationship between shoot growth and total catechin content. The results of the surface fitting between the F values (score of the PCA model) and the TC content conform to the Poly2D, Poly2D, and Fourier2D models, respectively, under different light intensity, AH, and RH treatments, with R2 > 75% (Figure 5B,C,E). The relationship between F values and TC content followed the polynomial surface model when environmental factors were varied interactively (Figure 5F, R2 = 63%). These results suggest that tea shoot growth ability exhibits a synergistic relationship with catechin accumulation in response to variations in ecological factors.

3.5. Molecular Mechanisms of Shoot Growth Mediating Catechin Accumulation in Tea Plants

3.5.1. Co-Expression of Growth Transcription Factors and Catechin-Related Genes Under Individual Changes in Ecological Factors

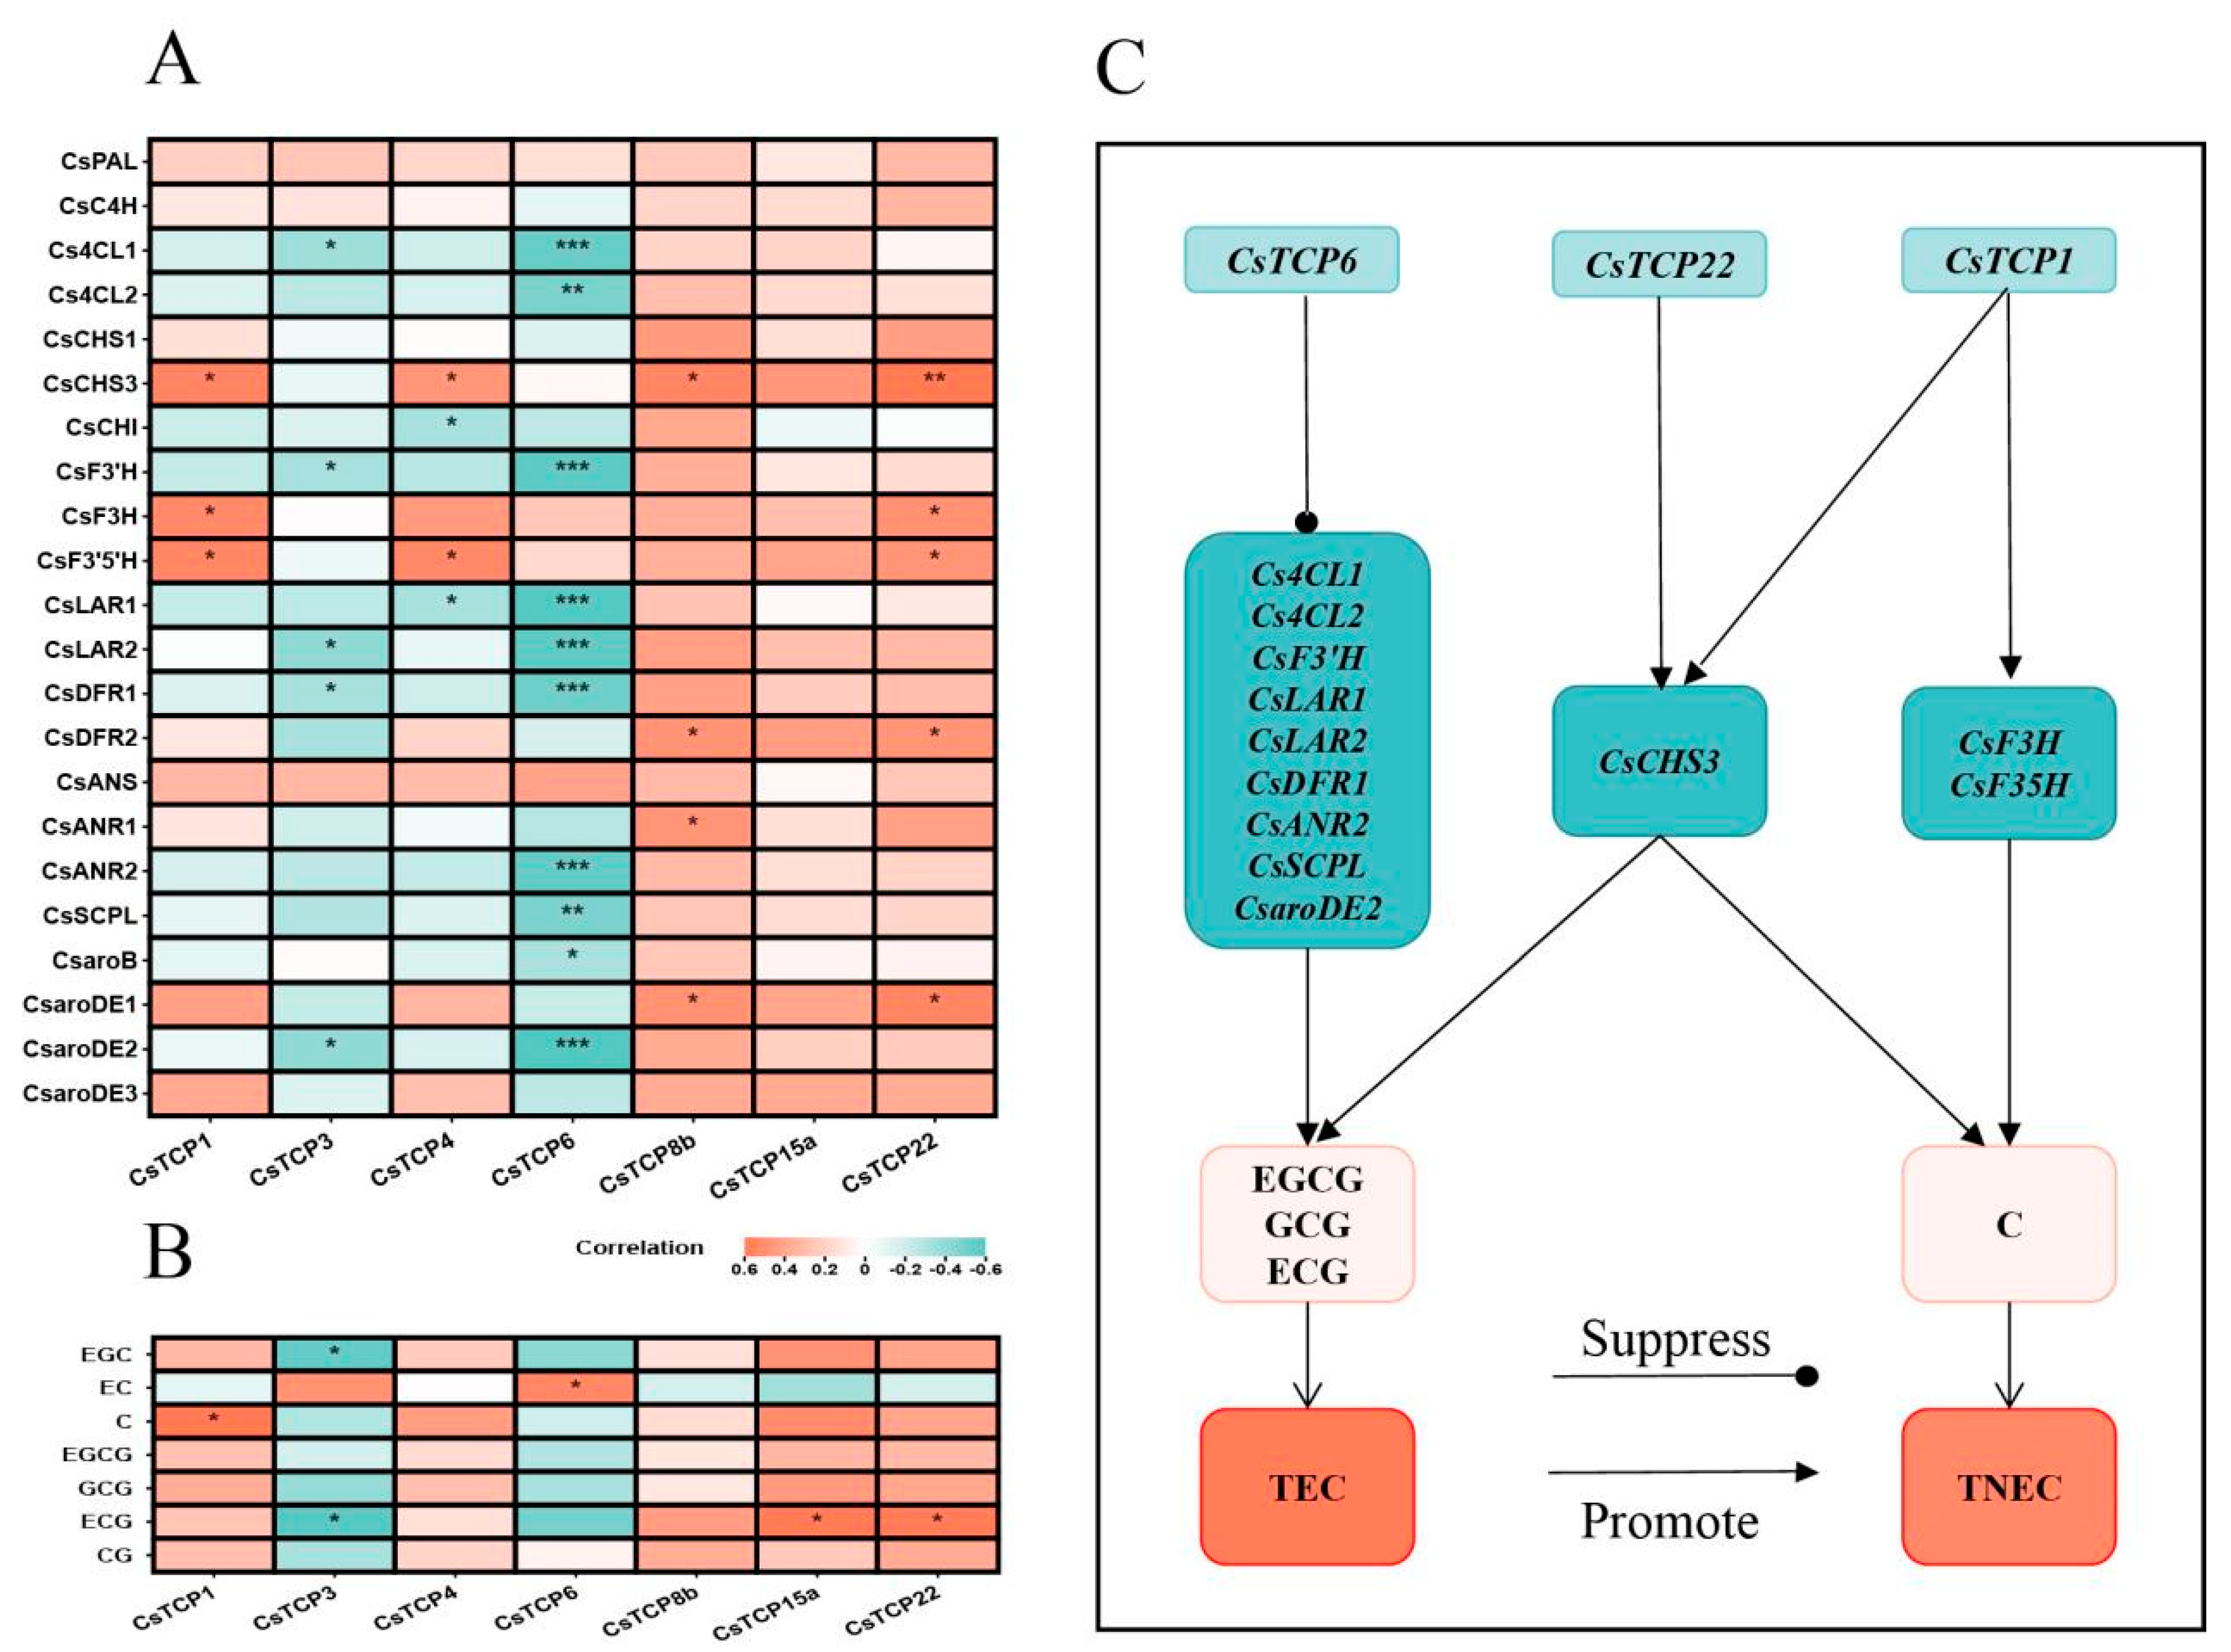
When ecological factors changed individually, a significant correlation was observed between the expression levels of CsTCP and the genes associated with catechin biosynthesis (Figure 6A). Specifically, CsTCP6 expression was significantly negatively correlated with the expression of ten catechin-related genes (e.g., Cs4CL1), while CsTCP8b and CsTCP22 were positively correlated with them. Moreover, the expression of CsCHS3 showed a significant positive correlation with four CsTCPs, indicating that CsCHS3 cooperates with CsTCP in responding to individual changes in ecological factors. Similarly, there was a notable correlation between the expression levels of CsTCP and catechin accumulation (Figure 6B). The expression levels of two CsTCP transcription factors, CsTCP15a and CsTCP22, were significantly positively correlated with ECG content. However, CsTCP3 expression was significantly negatively correlated with ECG and EGC content. Using a correlation coefficient greater than 0.6 or less than −0.6 as the standard, this study delineated the potential pathways through which shoot growth influences catechin accumulation (Figure 6C). CsTCP6 inhibited the expression of genes such as Cs4CL1, leading to a reduction in the accumulation of esterified catechin monomers (EGCG, GCG, ECG) and TEC. Meanwhile, CsTCP22 and CsTCP1 promoted the expression of CsCHS3, thereby facilitating catechin accumulation. Additionally, CsTCP1 might also enhance the accumulation of C and TNEC via the up-regulation of CsF3H, CsF3′5′H, and CsCHS3.

3.5.2. Co-Expression of Growth Transcription Factors and Catechin-Related Genes Under Interactive Changes in Ecological Factors

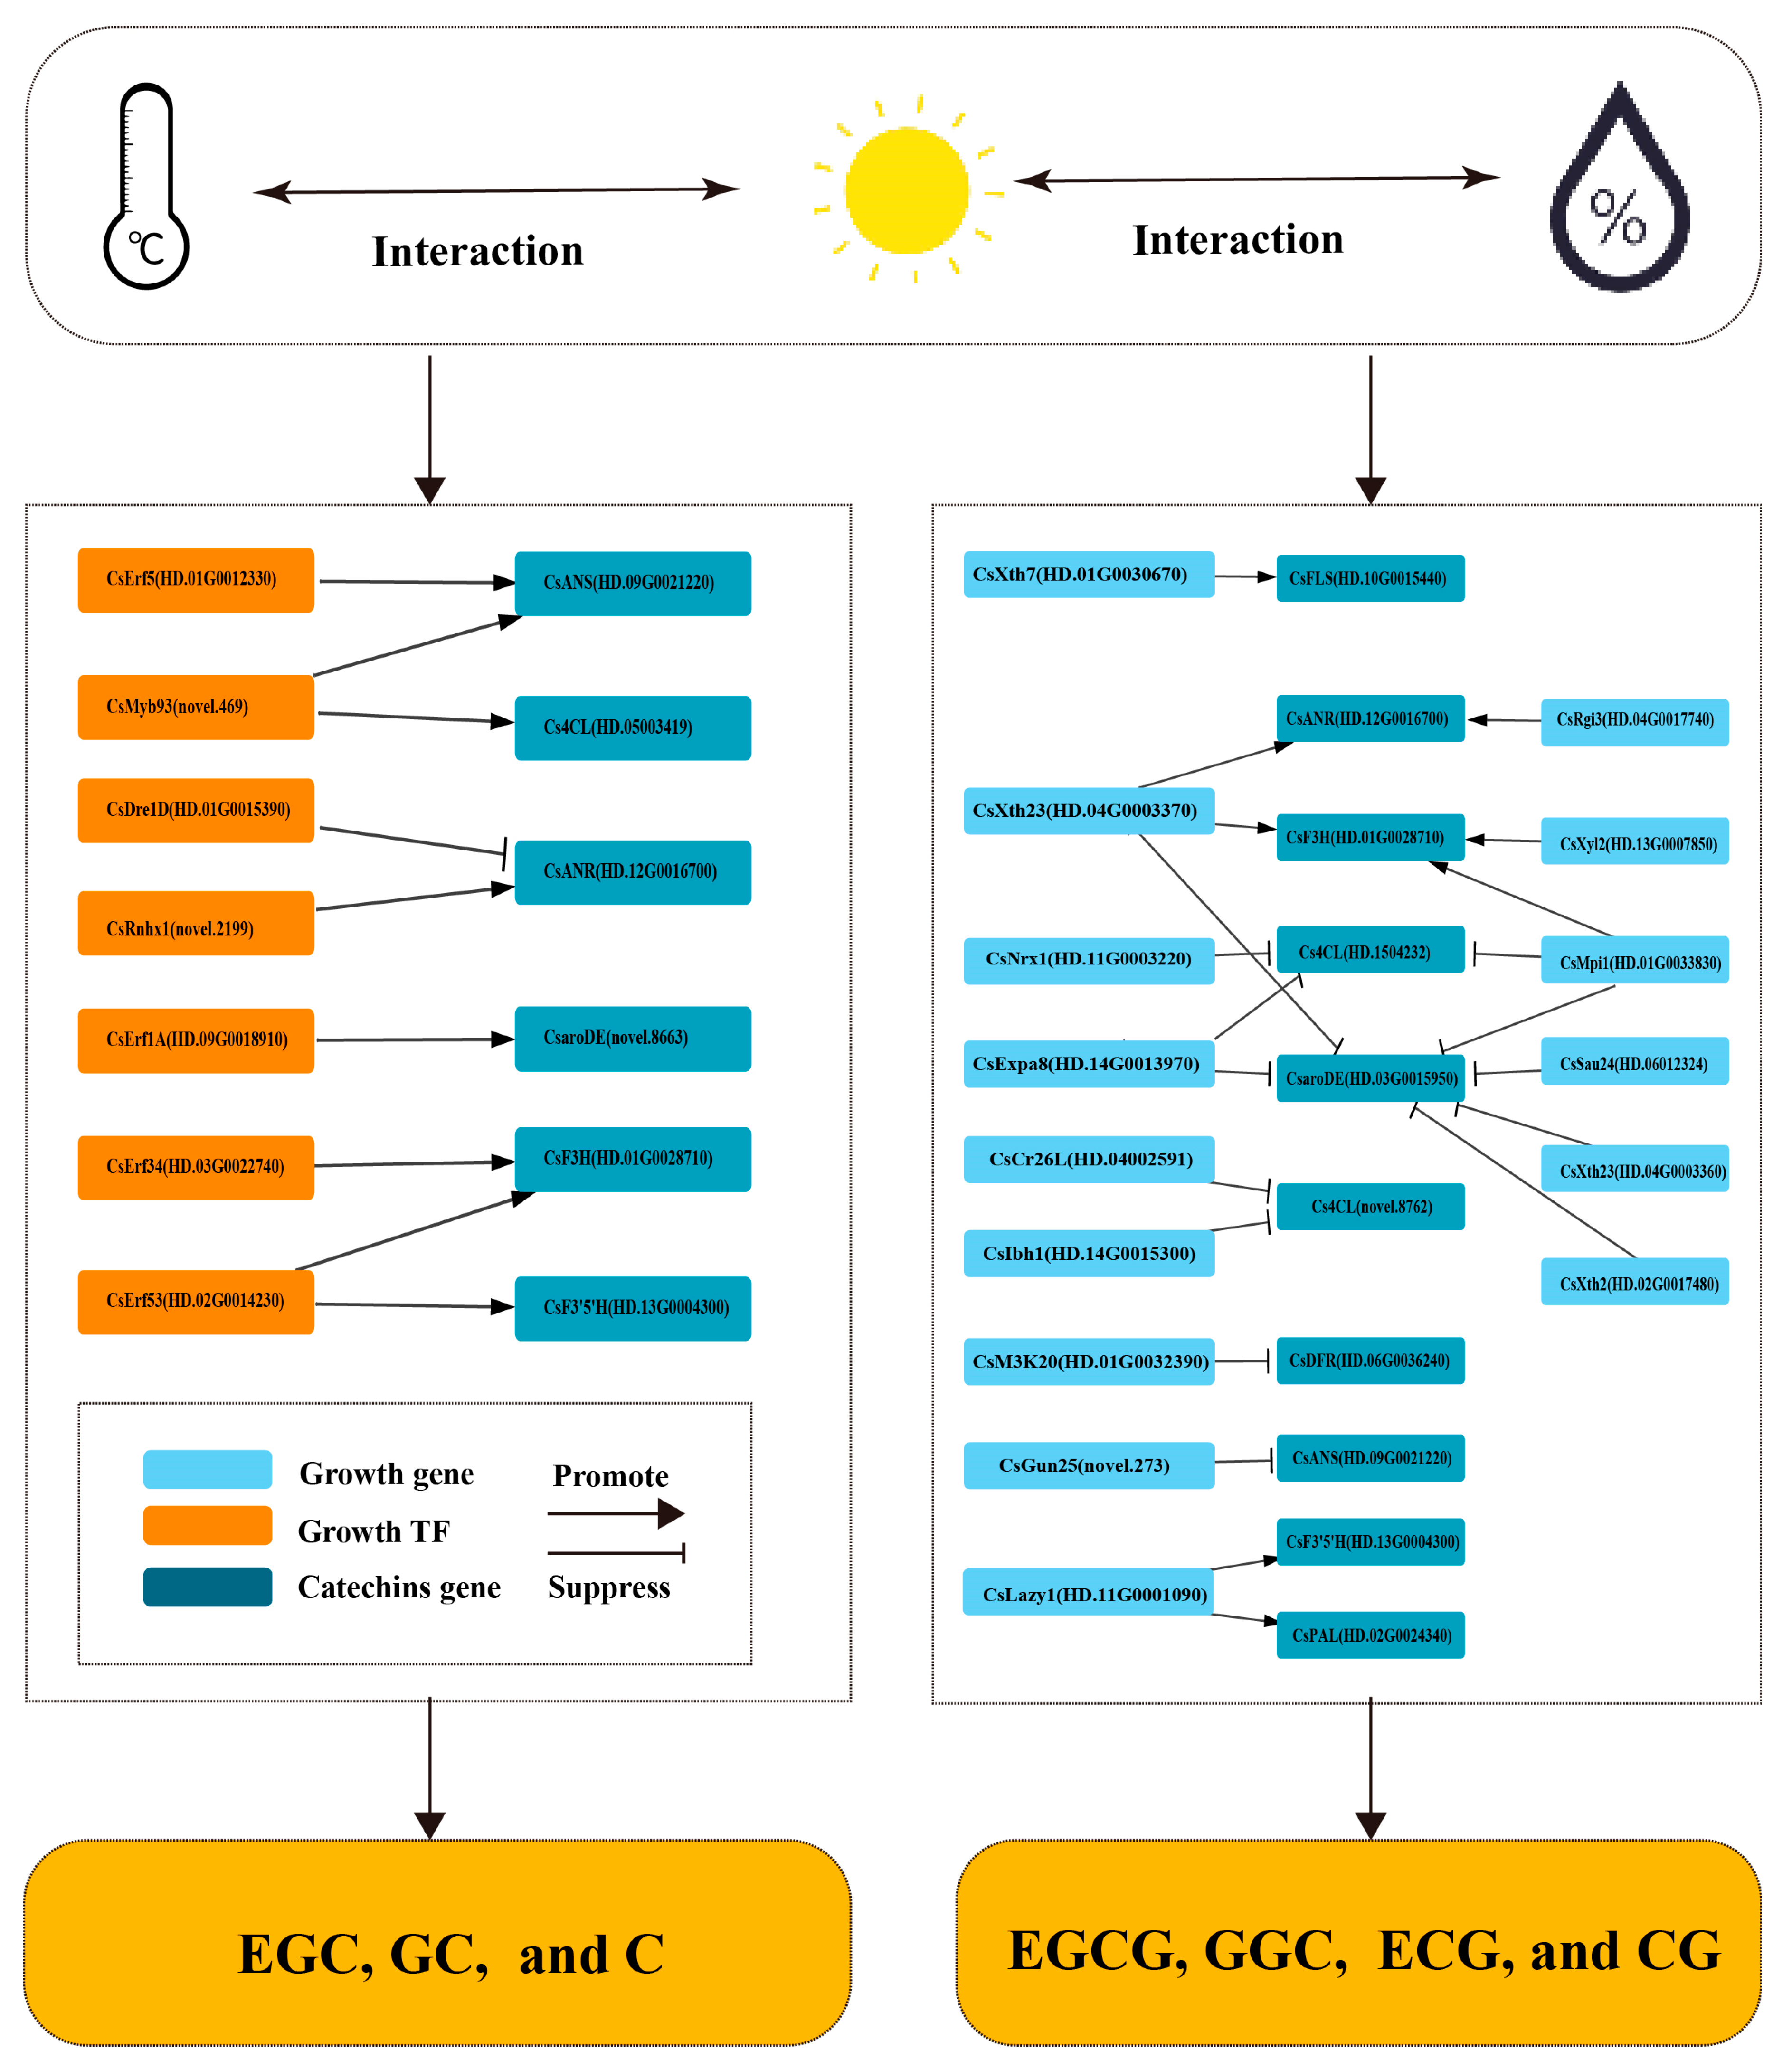
Using a correlation coefficient threshold of >0.9 or <−0.9 as the screening criterion, we elucidated the potential pathways related to the coordinated response of tea shoot growth and catechin biosynthesis (Figure 7). Four CsErf transcription factors and CsMYB93 cooperated with five catechin-related genes (CsANS, Cs4CL, CsF3H, CsF3′5′H, CsaroDE) to respond to interactive changes in ecological factors, thereby influencing catechin accumulation. Genes related to shoot growth also influenced catechin biosynthesis. CsXth positively affected the expression of CsFLS, CsANR, and CsF3H. Specifically, the expression of CsF3′5′H and CsPAL was enhanced by CsLazy1, which then exerted an impact on catechin accumulation. Furthermore, CsDFR and CsANS were, respectively, inhibited by CsM3K20 and CsGun25. Notably, four CsErf genes and five CsXth genes significantly modulated the expression of genes associated with catechin biosynthesis. This finding strongly implies a pivotal role of CsErf and CsXth in regulating both tea shoot growth and catechin biosynthesis processes.

4. Discussion

4.1. Ecological Conditions for Enhancing Tea Growth and Yield

Under high temperature (30 °C) and air humidity (90%), the “L250 + 65% RH” and “L350 + 70% RH” treatments enhanced growth and yield. The current results differ from the optimal artificial settings established for dormancy release [28], likely due to differing ecological requirements for bud break and shoot elongation [29]. Field studies highlight strong temperature and water influences on tea growth [30,31]. Due to the variability in the ecological environment, field studies struggle to identify the specific effects of ecological factors on tea plant growth and development. However, plant factories can vary ecological factors independently and in combination to identify optimal tea growth conditions. Our findings indicate that under high temperature and air humidity, both high light intensity and moderate drought stress can independently promote biomass accumulation. When other ecological factors remained unchanged, the increased light intensity promoted vigorous growth and shoot elongation in tea plants. This finding is consistent with previous studies: under higher light intensity conditions, the thickness of tea leaves and dry matter accumulation significantly increase [32,33]. Fang et al. also reported that tea plants under non-shaded treatment exhibited the highest biomass [34], and the mechanism may be related to leaf isotope enrichment and enhanced starch synthesis driven by high light intensity [35,36].
Meanwhile, moderate deficit irrigation has been reported to maintain a similar tea yield to full irrigation [37]. Interestingly, experimental results show that drought stress increases bud density, aligning with previous studies indicating that drought stress raises the number of non-productive buds [38,39]. However, previous studies have reported that drought is unfavorable for tea plant growth and yield [40,41]. We speculate that this discrepancy arises from the combined influence of air relative humidity and substrate moisture on tea plant physiology. Even under moist soil conditions, vapor pressure deficit (VPD) can significantly affect tea yield [31]. In this study, higher air humidity reduced root water demand due to weakened transpiration, while moderate drought stress prevented root exposure to excessive moisture, thereby promoting tea plant growth. In addition, diurnal temperature variations are considered critical for shoot growth, and future research should investigate the optimal parameters for this variation.

4.2. Synchronous Relationship Between Catechin Biosynthesis and Shoot Growth

Metabolite accumulation in tea leaves depends on growth processes [42,43,44]. Previous studies have demonstrated that catechin content changes in alignment with shoot growth patterns. For example, shading reduces leaf number and simultaneously decreases EC and EGC content [32], and inter-cropping with soybeans increases non-esterified catechins and shoot growth [45]. A synchronous increase in catechin content and shoot biomass has been observed in response to elevated CO2 [46], moderate–high temperatures [47], and increased Al concentrations [48]. Explorations have exhibited a significant synchronous pattern between catechin accumulation and shoot growth, likely due to the association between esterified catechin biosynthesis and vacuolization in stem meristematic tissue [49]. Interestingly, other studies found weak relationships between catechin content, the number of germinated buds, and leaf thickness, potentially attributed to metabolite differences across growth stages [50,51]. During the young phase, tea plants prioritize primary metabolic pathways to support growth, whereas maturation induces the biosynthesis of secondary metabolites, such as catechins, to enhance stress resistance [52]. To provide insights for high-quality tea cultivation and timely harvesting, future research could investigate the relationship between growth capacity and catechin accumulation at different growth stages.
Furthermore, linking this physiological response to potential regulatory mechanisms, a significant relationship was found between catechin accumulation and the expression of CsTCP and CsErf. Similarly, the transcription levels of cin-type TCPs have been significantly associated with catechin production [53], and ERF014 may promote the decline in EGC during development [54]. Delving deeper into the regulatory basis for this observed coordination between growth and development with catechin content, the findings reveal that key shoot-development-related genes, namely CsTCP, CsErf, and CsXth, exhibited co-expression patterns with genes involved in catechin biosynthesis. This provides evidence supporting the role of these gene families and builds upon previous work showing the co-expression of CsTCP1 and CsTCP6 with Cs4CL1 and CsCHI [55]. In other studies, the expression of TCP3 activates genes involved in flavonoid biosynthesis [56], and TCP15 induces the expression of catechin biosynthesis-related genes in Arabidopsis [57]. It has been found that TCP targets and regulates specific genes in catechin biosynthesis, such as F3H and F3′5′H [58]. CsTCP3 regulates the activity of the CsANS1 and CsANR1 [53], and TCP13 directly targets the CHS and DFR promoters [59]. Additionally, AP2/ERF exhibits strong co-regulatory effects on C4H [60]. Previous research has also demonstrated that miR319 targets growth-related transcription factors [42,53,61], and flavonoid accumulation is associated with the miR167d_1-ARF-GH3 and miR319c_3-PIF-ARF modules [62]. The synchronous response between catechin biosynthesis and shoot growth may also be regulated by miRNAs, though the precise mechanisms warrant further investigation.
This research comprehensively and precisely explored the response patterns of tea shoot growth to ecological factor variations and discovered a synergistic relationship between catechin accumulation and shoot growth. The optimal ecological conditions for tea cultivation offer practical guidance for tea production, providing a new ecological approach to balance tea yield and quality.

5. Conclusions

Under conditions of high temperature and air humidity (30 °C, 90%), moderately high light intensity or moderate substrate water deficit can promote tea plant growth. Specifically, the combinations of “250 µmol·m−2·s−1 + 65%” and “350 µmol·m−2·s−1 + 70%” were observed. This finding elucidated the precise response patterns of shoot growth to ecological factors and identified the optimal ecological conditions for promoting growth. Meanwhile, shoot growth ability and total catechin content exhibited high-fidelity modeling fits, suggesting a synergistic response between shoot growth and total catechin accumulation. Additionally, key growth-related genes (CsTCP1, CsTCP6, CsTCP22, CsErf, and CsXth) were co-expressed with catechin biosynthesis-related genes. Our results reveal the synergistic relationship between catechin accumulation and yield, providing an ecological perspective for improving both tea yield and quality.

Supplementary Materials

The following supporting information can be downloaded at: https://www.mdpi.com/article/10.3390/horticulturae11060624/s1, Figure S1: Growth state of tea plants under different humidity treatment; Figure S2: Response of tea shoot growth capacity (F) to individual changes in ecological factors; Figure S3: Variable Importance in Projection (VIP) of shoot growth influencing catechin accumulation in PLS analysis. The contents of seven catechin monomers as dependent variables, and the growth indicators of tea plants as the independent variables; Figure S4: Normal distribution of standardized residuals of the multiple regression; Table S1: Environmental indexs and manipulation methods; Table S2: Cultivation environment of tea plants; Table S3: The qPCR primers; Table S4: The response of shoot growth to air relative humidity and substrate relative humidity in tea plants; Table S5: Effects of ecological factors interaction on shoot growth and leaf size of tea plants; Table S6: Code about the trend between growth ability and total catechins content.

Author Contributions

P.X.: Investigation, Formal analysis, Writing—Original draft. Q.Z.: Investigation, Data curation. M.T. (Marat Tukhvatshin): Writing—review and editing. B.C., M.T. (Meng Tan): Investigation. J.L. (Jianghong Liu), J.H.: Methodology, Investigation. Y.H.: Investigation, Supervision. Y.S.: Visualization. L.W.: Conceptualization, Visualization. J.L. (Jinke Lin): Conceptualization, Writing—review and editing, Supervision, Project administration. All authors have read and agreed to the published version of the manuscript.

Funding

This work was supported by the Natural Science Foundation of Hunan Province (grant numbers 2023JJ50326); the National Natural Science Foundation of China (grant numbers 31870683); the Scientific Research Project of Hunan University of Arts and Sciences (grant numbers 22BSQD16); the Scientific research project of Hunan Provincial Department of Education (grant numbers 22A0487); and the Natural Science Foundation of Hunan Province (grant numbers 2023JJ30436).

Data Availability Statement

Requests to access the datasets should be sent via email to ljk213@163.com.

Acknowledgments

We express our gratitude to the Fujian Sanan Sino-Science Photobiotech Co., Ltd. for the site and nutrient solution for the study. This research was funded by the Provincial Applied Characteristic Discipline of Biology of Hunan University of Arts and Science.

Conflicts of Interest

The authors declare no conflicts of interest.

Abbreviations

The following abbreviations are used in this manuscript:
EGCGEpigallocatechin gallate
CGCatechin gallate
GCGGallocatechin gallate
ECGEpicatechin gallate
TCTotal catechins
TNECTotal non-esterified catechins
TECTotal esterified catechins
PCAPrincipal component analysis
PLSPartial Least Squares
ARFAuxin response factor
ERFEthylene response factor
RHRelative humidity of substrate
AHRelative humidity of air

References

  1. Liao, Q.; Liang, P.-X.; Xing, Y.; Yao, Z.-F.; Chen, J.-P.; Pan, L.-P.; Deng, Y.-Q.; Liu, Y.-X.; Huang, D.-L. Optimizing Selenium Application for Enhanced Quality and Nutritional Value of Spring Tea (Camellia sinensis). Horticulturae 2025, 11, 423. [Google Scholar] [CrossRef]
  2. FAOSTAT. Food and Agricultural Organization of the United Nations. Available online: http://www.fao.org/faostat (accessed on 23 March 2025).
  3. Gunathilaka, R.P.D.; Smart, J.C.R.; Fleming, C.M. The impact of changing climate on perennial crops: The case of tea production in Sri Lanka. Clim. Chang. 2017, 140, 577–592. [Google Scholar] [CrossRef]
  4. Wijeratne, M.A.; Anandacoomaraswamy, A.; Amarathunga, M.K.S.L.D.; Ratnasiri, J.; Kalra, N. Assessment of impact of climate change on productivity of tea (Camellia sinensis L.) plantations in Sri Lanka. J. Natl. Sci. Found. Sri Lanka 2007, 35, 119–126. [Google Scholar] [CrossRef]
  5. Tim, B.; Michal, K.; Christoph, M.; Sibyll, S.; Yvonne, J. First process-based simulations of climate change impacts on global tea production indicate large effects in the World’s major producer countries. Environ. Res. Lett. 2020, 15, e034023. [Google Scholar] [CrossRef]
  6. Rigden, A.J.; Ongoma, V.; Huybers, P. Kenyan tea is made with heat and water: How will climate change influence its yield? Environ. Res. Lett. 2020, 15, e044003. [Google Scholar] [CrossRef]
  7. Raj, E.E.; Ramesh, K.V.; Rajkumar, R. Modelling the impact of agrometeorological variables on regional tea yield variability in South Indian tea-growing regions: 1981–2015. Cogent Food Agric. 2019, 5, e1581457. [Google Scholar] [CrossRef]
  8. Duncan, J.M.A.; Saikia, S.D.; Gupta, N.; Biggs, E.M. Observing climate impacts on tea yield in Assam, India. Appl. Geogr. 2016, 77, 64–71. [Google Scholar] [CrossRef]
  9. Chen, H.; Liu, C.J.; Liu, C.F.; Hu, C.Y.; Hsiao, M.C.; Chiou, M.T.; Su, Y.S.; Tsai, H.T. A Growth Model to Estimate Shoot Weights and Leaf Numbers in Tea. Agron. J. 2019, 111, 2255–2262. [Google Scholar] [CrossRef]
  10. Lou, W.; Sun, K.; Zhao, Y.; Deng, S.; Zhou, Z. Impact of climate change on inter-annual variation in tea plant output in Zhejiang, China. Int. J. Climatol. 2020, 41, 479–490. [Google Scholar] [CrossRef]
  11. Jayasinghe, S.L.; Kumar, L. Potential Impact of the Current and Future Climate on the Yield, Quality, and Climate Suitability for Tea Camellia sinensis (L.) O. Kuntze: A Systematic Review. Agronomy 2021, 11, 619. [Google Scholar] [CrossRef]
  12. Sun, L.; Li, X.; Shen, J.; Wang, S.; Xu, X.; Fan, K.; Wang, Y.; Bi, C.; Ding, Z. Optimizing tea plantation through rapeseed intercropping: Ecological and pest-resistant benefits. Ind. Crop. Prod. 2025, 227, e120821. [Google Scholar] [CrossRef]
  13. Wang, C.; Zhao, B. Application of Apriori Algorithm in Meteorological Disaster Information Mining. In Cooperative Design, Visualization, and Engineering, Proceedings of the 15th International Conference, CDVE 2018, Hangzhou, China, 21–24 October 2018; Springer International Publishing: Cham, Switzerland, 2018; pp. 258–261. [Google Scholar] [CrossRef]
  14. Edirisinghe, J.C.; Ranjan, H.; Herath, H.M.L.K.; Jayasinghe-Mudalige, U.K.; Wijeratne, M.; Kuruppu, V.; Jayathilake, C.; Wijesuriya, W.; Somarathna, K.; Karunaratne, S. Impact of climate on tea yield: An empirical investigation from Sri Lanka. J. Natl. Sci. Found. Sri Lanka 2024, 52, 183–190. [Google Scholar] [CrossRef]
  15. Rebecca, B.; Sean, C.; Bruce, A.; Selena, A.; Timothy, G.; Albert, R.; John, S.; Wenyan, H.; Matt, H.; Colin, O. Association between Empirically Estimated Monsoon Dynamics and Other Weather Factors and Historical Tea Yields in China: Results from a Yield Response Model. Climate 2016, 4, 20. [Google Scholar] [CrossRef]
  16. Wang, Y.-C.; Chen, C.-T.; Li, R.-Y.; Lu, Y.-H.; Chiang, L.-C. Climate risk analysis of low-altitude tea gardens in central Taiwan using a Bayesian network. Environ. Monit. Assess. 2024, 196, e809. [Google Scholar] [CrossRef]
  17. Chang, C.-L.; Huang, C.-C.; Chen, H.-W. Design and Implementation of Artificial Intelligence of Things for Tea (Camellia sinensis L.) Grown in a Plant Factory. Agronomy 2022, 12, 2384. [Google Scholar] [CrossRef]
  18. Zhiwei, T.; Wei, M.; Qichang, Y.; Famin, D. Application status and challenges of machine vision in plant factory—A review. Inf. Process. Agric. 2021, 9, 195–211. [Google Scholar] [CrossRef]
  19. Kaya, C. Intelligent Environmental Control in Plant Factories: Integrating Sensors, Automation, and AI for Optimal Crop Production. Food Energy Secur. 2025, 14, e70026. [Google Scholar] [CrossRef]
  20. Cai, W.; Bu, K.; Zha, L.; Zhang, J.; Lai, D.; Bao, H. Energy consumption of plant factory with artificial light: Challenges and opportunities. Renew. Sustain. Energy Rev. 2024, 210, e115235. [Google Scholar] [CrossRef]
  21. Azad, M.O.K.; Gruda, N.S.; Naznin, M.T. Energy Efficiency of Glasshouses and Plant Factories for Sustainable Urban Farming in the Desert Southwest of the United States of America. Horticulturae 2024, 10, 1055. [Google Scholar] [CrossRef]
  22. Graamans, L.; Baeza, E.; Andy, V.D.D.; Tsafaras, I.; Stanghellini, C. Plant factories versus greenhouses: Comparison of resource use efficiency. Agric. Syst. 2018, 160, 31–43. [Google Scholar] [CrossRef]
  23. Yoneda, Y. Optimization Process of Plant Growth Environment for Improving Content Compounds Using Physiological and Genetic Information in a Closed-type Plant Factory. Jpn. Agric. Res. Q. 2021, 55, 201–208. [Google Scholar] [CrossRef]
  24. Miyauchi, S.; Yuki, T.; Fuji, H.; Kojima, K.; Yonetani, T.; Tomio, A.; Bamba, T.; Fukusaki, E. High-quality green tea leaf production by artificial cultivation under growth chamber conditions considering amino acids profile. J. Biosci. Bioeng. 2014, 118, 710–715. [Google Scholar] [CrossRef] [PubMed]
  25. Miyauchi, S.; Yonetani, T.; Yuki, T.; Tomio, A.; Bamba, T.; Fukusaki, E. Quality evaluation of green tea leaf cultured under artificial light condition using gas chromatography/mass spectrometry. J. Biosci. Bioeng. 2016, 123, 197–202. [Google Scholar] [CrossRef] [PubMed]
  26. Tukhvatshin, M.; Peng, Q.; Zhao, X.; Liu, J.; Xiang, P.; Lin, J. Identifying meteorological factors influencing catechin biosynthesis and optimizing cultivation conditions of tea plant (Camellia sinensis). Front. Plant Sci. 2025, 16, e1532880. [Google Scholar] [CrossRef]
  27. Xiang, P.; Zhu, Q.; Zhang, L.; Xu, P.; Liu, L.; Li, Y.; Cheng, B.; Wang, X.; Liu, J.; Shi, Y.; et al. Integrative analyses of transcriptome and metabolome reveal comprehensive mechanisms of Epigallocatechin-3-gallate (EGCG) biosynthesis in response to ecological factors in tea plant (Camellia sinensis). Food Res. Int. 2023, 166, e112591. [Google Scholar] [CrossRef]
  28. Omae, H.; Takeda, Y. Modeling Winter Dormancy of Tea Buds and Simulation in Southern Japan. Jpn. Agric. Res. Q. 2003, 37, 189–194. [Google Scholar] [CrossRef]
  29. Carr, M.K.V. The role of water in the growth of the tea (Camellia sinensis) crop: A synthesis of research in eastern africa. 1. water relations. Exp. Agric. 2010, 46, 327–349. [Google Scholar] [CrossRef]
  30. Benti, T.; Debela, A.; Bekele, Y.; Suleman, S. Effect of seasonal variation on yield and leaf quality of tea clone (Camellia sinensis (L.) O. Kuntze) in South West Ethiopia. Heliyon 2023, 9, e14051. [Google Scholar] [CrossRef]
  31. De Costa, W.A.J.M.; Mohotti, A.J.; Wijeratne, M.A. Ecophysiology of tea. Braz. J. Plant Physiol. 2007, 19, 299–332. [Google Scholar] [CrossRef]
  32. Sano, T.; Horie, H.; Matsunaga, A.; Hirono, Y. Effect of shading intensity on morphological and color traits and on chemical components of new tea (Camellia sinensis L.) shoots under direct covering cultivation. J. Sci. Food Agric. 2018, 98, 5666–5676. [Google Scholar] [CrossRef]
  33. Bahrami-Rad, S. Effect of light intensity on photosynthesis and antioxidant defense in boron deficient tea plants. Acta Biol. Szeged. 2011, 55, 265–272. [Google Scholar]
  34. Fang, Z.-T.; Jin, J.; Ye, Y.; He, W.-Z.; Shu, Z.-F.; Shao, J.-N.; Fu, Z.-S.; Lu, J.-L.; Ye, J.-H. Effects of Different Shading Treatments on the Biomass and Transcriptome Profiles of Tea Leaves (Camellia sinensis L.) and the Regulatory Effect on Phytohormone Biosynthesis. Front. Plant Sci. 2022, 13, 909765. [Google Scholar] [CrossRef] [PubMed]
  35. Xia, W.; Li, C.; Nie, J.; Shao, S.; Rogers, K.M.; Zhang, Y.; Li, Z.; Yuan, Y. Stable isotope and photosynthetic response of tea grown under different temperature and light conditions. Food Chem. 2022, 368, 130771. [Google Scholar] [CrossRef] [PubMed]
  36. Zhang, X.; Liu, K.; Tang, Q.; Zeng, L.; Wu, Z. Light Intensity Regulates Low-Temperature Adaptability of Tea Plant through ROS Stress and Developmental Programs. Int. J. Mol. Sci. 2023, 24, 9852. [Google Scholar] [CrossRef]
  37. Lin, S.K.; Lin, J.; Liu, Q.L.; Ai, Y.F.; Ke, Y.Q.; Chen, C.; Zhang, Z.Y.; He, H. Time-course of photosynthesis and non-structural carbon compounds in the leaves of tea plants (Camellia sinensis L.) in response to deficit irrigation. Agric. Water Manag. 2014, 144, 98–106. [Google Scholar] [CrossRef]
  38. Cheruiyot, E.K.; Mumera, L.M.; Ng'Etich, W.K.; Hassanali, A.; Wachira, F. Polyphenols as Potential Indicators for Drought Tolerance in Tea (Camellia sinensis L.). J. Agric. Chem. Soc. Jpn. 2007, 71, 2190–2197. [Google Scholar] [CrossRef]
  39. Ng’etich, W.K.; Stephens, W. Responses of tea to environment in kenya. 1. genotype × environment interactions for total dry matter production and yield. Exp. Agric. 2001, 37, 333–342. [Google Scholar] [CrossRef]
  40. Zhang, Y.; Xiao, Y.; Zhang, Y.; Dong, Y.; Liu, Y.; Liu, L.; Wan, S.; He, J.; Yu, Y. Accumulation of Galactinol and ABA Is Involved in Exogenous EBR-Induced Drought Tolerance in Tea Plants. J. Agric. Food Chem. 2022, 70, 13391–13403. [Google Scholar] [CrossRef]
  41. Dai, F.; Rong, Z.; Wu, Q.; Fathi Abd_Allah, E.; Liu, C.; Liu, S. Mycorrhiza improves plant growth and photosynthetic characteristics of tea plants in response to drought stress. Biocell 2022, 46, 1339–1346. [Google Scholar] [CrossRef]
  42. Wu, Z.-J.; Wang, W.-L.; Zhuang, J. TCP family genes control leaf development and its responses to hormonal stimuli in tea plant Camellia sinensis (L.) O. Kuntze. Plant Growth Regul. 2017, 83, 43–53. [Google Scholar] [CrossRef]
  43. Ashihara, H.; Deng, W.-W.; Mullen, W.; Crozier, A. Distribution and biosynthesis of flavan-3-ols in Camellia sinensis seedlings and expression of genes encoding biosynthetic enzymes. Phytochemistry 2010, 71, 559–566. [Google Scholar] [CrossRef] [PubMed]
  44. Jiang, X.; Liu, Y.; Li, W.; Zhao, L.; Meng, F.; Wang, Y.; Tan, H.; Yang, H.; Wei, C.; Wan, X.; et al. Tissue-Specific, Development-Dependent Phenolic Compounds Accumulation Profile and Gene Expression Pattern in Tea Plant Camellia sinensis. PLoS ONE 2013, 8, e62315. [Google Scholar] [CrossRef] [PubMed]
  45. Sun, L.; Dong, X.; Wang, Y.; Maker, G.; Agarwal, M.; Ding, Z. Tea-Soybean Intercropping Improves Tea Quality and Nutrition Uptake by Inducing Changes of Rhizosphere Bacterial Communities. Microorganisms 2022, 10, 2149. [Google Scholar] [CrossRef] [PubMed]
  46. Ahammed, G.J.; Li, X.; Liu, A.; Chen, S. Physiological and Defense Responses of Tea Plants to Elevated CO2: A Review. Front. Plant Sci. 2020, 11, e305. [Google Scholar] [CrossRef]
  47. Li, X.; Li, M.-H.; Deng, W.-W.; Ahammed, G.J.; Wei, J.-P.; Yan, P.; Zhang, L.-P.; Fu, J.-Y.; Han, W.-Y. Exogenous melatonin improves tea quality under moderate high temperatures by increasing epigallocatechin-3-gallate and theanine biosynthesis in Camellia sinensis L. J. Plant Physiol. 2020, 253, e153273. [Google Scholar] [CrossRef]
  48. Chen, Y.M.; Tsao, T.M.; Liu, C.C.; Lin, K.C.; Wang, M.K. Aluminium and nutrients induce changes in the profiles of phenolic substances in tea plants (Camellia sinensis). J. Sci. Food Agric. 2011, 91, 1111–1117. [Google Scholar] [CrossRef]
  49. Cheruiyot, E.K.; Mumera, L.M.; Ngetich, W.K.; Hassanali, A.; Wachira, F.; Wanyoko, J.K. Shoot epicatechin and epigallocatechin contents respond to water stress in tea Camellia sinensis (L.) O. Kuntze. Biosci. Biotechnol. Biochem. 2008, 72, 1219–1226. [Google Scholar] [CrossRef]
  50. Ryu, H.W.; Yuk, H.J.; An, J.H.; Kim, D.-Y.; Song, H.-H.; Oh, S.-R. Comparison of secondary metabolite changes in Camellia sinensis leaves depending on the growth stage. Food Control 2017, 73, 916–921. [Google Scholar] [CrossRef]
  51. Jeon, D.B.; Hong, Y.S.; Lee, G.H.; Park, Y.M.; Lee, C.M.; Nho, E.Y.; Choi, J.Y.; Jamila, N.; Khan, N.; Kim, K.S. Determination of volatile organic compounds, catechins, caffeine and theanine in Jukro tea at three growth stages by chromatographic and spectrometric methods. Food Chem. 2017, 219, 443–452. [Google Scholar] [CrossRef]
  52. Zeng, L.; Zhou, X.; Liao, Y.; Yang, Z. Roles of specialized metabolites in biological function and environmental adaptability of tea plant (Camellia sinensis) as a metabolite studying model. J. Adv. Res. 2021, 34, 159–171. [Google Scholar] [CrossRef]
  53. Yu, S.; Li, P.; Zhao, X.; Tan, M.; Ahmad, M.Z.; Xu, Y.; Tadege, M.; Zhao, J. CsTCPs regulate shoot tip development and catechin biosynthesis in tea plant (Camellia sinensis). Hortic. Res. 2021, 8, e104. [Google Scholar] [CrossRef] [PubMed]
  54. Chen, L.; Yan, J.; Miu, Y.; Huang, R.; Wei, H.; Wang, L.; Zhang, C.; Yuan, L.; Tong, H. The spatiotemporal variations of L-glutamic acid and catechins during the development of etiolated tea leaves in ‘Huangjinye’. Sci. Hortic. 2024, 328, e112888. [Google Scholar] [CrossRef]
  55. Xiang, P.; Wilson, I.W.; Huang, J.; Zhu, Q.; Tan, M.; Lu, J.; Liu, J.; Gao, S.; Zheng, S.; Lin, D.; et al. Co-regulation of catechins biosynthesis responses to temperature changes by shoot growth and catechin related gene expression in tea plants (Camellia sinensis L.). J. Hortic. Sci. Biotechnol. 2021, 96, 228–238. [Google Scholar] [CrossRef]
  56. Li, S.; Zachgo, S. TCP3 interacts with R2R3-MYB proteins, promotes flavonoid biosynthesis and negatively regulates the auxin response in Arabidopsis thaliana. Plant J. 2013, 76, 901–913. [Google Scholar] [CrossRef]
  57. Viola, I.L.; Camoirano, A.; Gonzalez, D.H. Redox-Dependent Modulation of Anthocyanin Biosynthesis by the TCP Transcription Factor TCP15 during Exposure to High Light Intensity Conditions in Arabidopsis. Plant Physiol. 2016, 170, 74–85. [Google Scholar] [CrossRef]
  58. Mei, X.; Wan, S.; Lin, C.; Zhou, C.; Hu, L.; Deng, C.; Zhang, L. Integration of Metabolome and Transcriptome Reveals the Relationship of Benzenoid-Phenylpropanoid Pigment and Aroma in Purple Tea Flowers. Front. Plant Sci. 2021, 12, e762330. [Google Scholar] [CrossRef]
  59. Hur, Y.-S.; Oh, J.; Kim, N.; Kim, S.; Son, O.; Kim, J.; Um, J.-H.; Ji, Z.; Kim, M.-h.; Ko, J.-H.; et al. Arabidopsis transcription factor TCP13 promotes shade avoidance syndrome-like responses by directly targeting a subset of shade-responsive gene promoters. J. Exp. Bot. 2024, 75, 241–257. [Google Scholar] [CrossRef]
  60. Li, N.-N.; Lu, J.-L.; Li, Q.-S.; Zheng, X.-Q.; Wang, X.-C.; Wang, L.; Wang, Y.-C.; Ding, C.-Q.; Liang, Y.-R.; Yang, Y.-J. Dissection of Chemical Composition and Associated Gene Expression in the Pigment-Deficient Tea Cultivar ‘Xiaoxueya’ Reveals an Albino Phenotype and Metabolite Formation. Front. Plant Sci. 2019, 10, e1543. [Google Scholar] [CrossRef]
  61. Li, D.; Tang, X.; Dong, Y.; Wang, Y.; Shi, S.; Li, S.; Liu, Y.; Ge, H.; Chen, H. Comparative genomic investigation of TCP gene family in eggplant (Solanum melongena L.) and expression analysis under divergent treatments. Plant Cell Rep. 2022, 41, 2213–2228. [Google Scholar] [CrossRef]
  62. Zhu, C.; Zhang, S.; Zhou, C.; Chen, L.; Zaripov, T.; Zhan, D.; Weng, J.; Lin, Y.; Lai, Z.; Guo, Y. Integrated Transcriptome, microRNA, and Phytochemical Analyses Reveal Roles of Phytohormone Signal Transduction and ABC Transporters in Flavor Formation of Oolong Tea (Camellia sinensis) during Solar Withering. J.-Agric. Food Chem. 2020, 68, 12749–12767. [Google Scholar] [CrossRef]
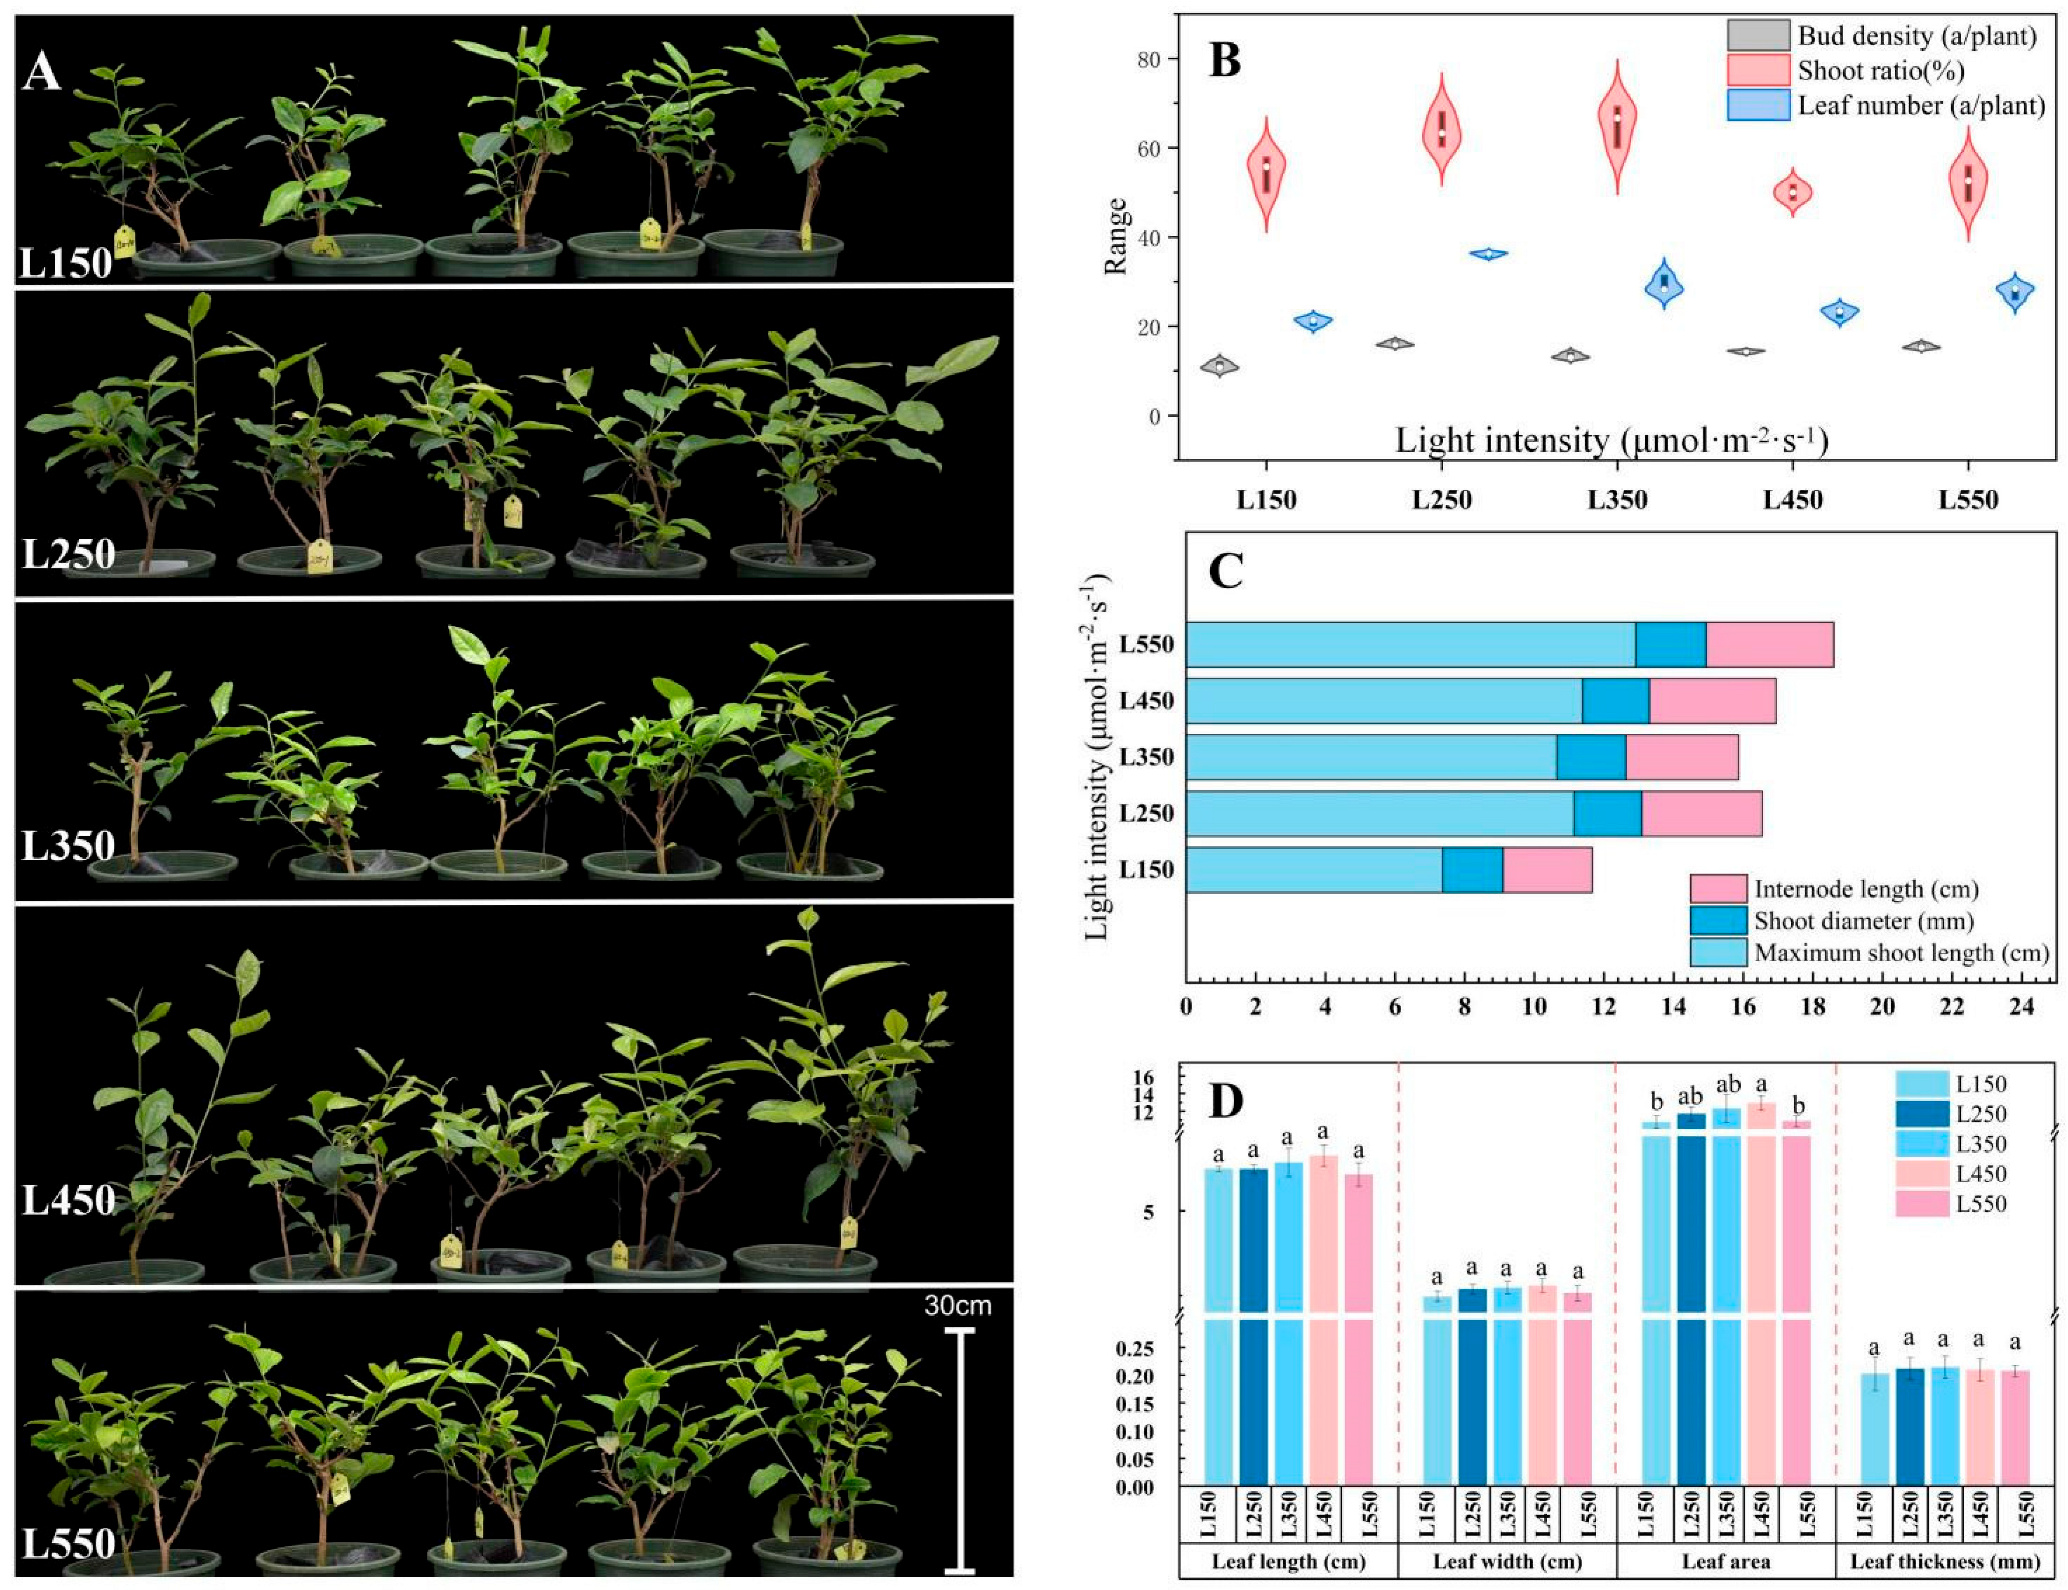
Figure 1. Effects of light intensity treatment on the growth of tea plant shoots. (A) Growth status of tea plants. (B) Buds number, shoot rate (number of shoots/number of buds), and leaf number. (C) Internode length, shoot diameter, and maximum length of shoot. (D) Leaf length, leaf width, leaf area, and leaf thickness. Different lowercase letters indicate significant differences at the 0.05 level.
Horticulturae 11 00624 g001
Figure 2. Effects of ecological factor interactions on the growth and yield of tea plant shoots. Different lowercase letters indicate significant differences at the 0.05 level. (A) Growth status of tea plants. (B) Total score (F) of the PCA model for growth indicators. F represents the shoot growth capacity. (C) Dry weight of biomass yield. (D) Water content of shoots.
Horticulturae 11 00624 g002
Figure 3. Response patterns of transcription factors related to growth with changes in ecological factors. (A) Response patterns to different light intensity treatments. (B) Response patterns to air humidity treatments. (C) Response patterns to substrate relative humidity treatments. (D) Response patterns to interactions of ecological factors.
Horticulturae 11 00624 g003
Figure 4. Relationship between growth indicators and catechin content in response to changes in ecological factors. (A) Pearson correlation coefficients between shoot growth indicators and catechin content. (B) Variable importance in projection of shoot growth indicators for catechin content in the partial least squares model.
Horticulturae 11 00624 g004
Figure 5. Surface fitting and regression analysis of growth indicators and catechin content in response to changes in ecological factors. (A) ROC curve analysis. F is the total score of the PCA model for growth indicators and represents the shoot growth capacity. (B,C,E,F) represent the surface fitting of TC content and F values under different light intensities, air humidities, substrate relative humidities, and interactions of ecological factor treatments, respectively. (D) Multiple regression analysis of seven growth indicators and TC content. The seven indicators are bud density, shoot percentage, leaf number, average shoot length, leaf area, leaf thickness, and shoot diameter.
Horticulturae 11 00624 g005
Figure 6. Synchronized responses of growth transcription factor and catechin biosynthesis genes to individual changes in ecological factors. (A) Pearson correlation between CsTCP expression levels and expression levels of catechin biosynthesis-related genes. (B) Pearson correlation between CsTCP expression and catechin content. (C) Potential pathways through which tea shoot growth affects catechin biosynthesis under individual changes in ecological factors. *, **, and *** represent significance levels of <0.05, <0.01, and <0.001, respectively.
Horticulturae 11 00624 g006
Figure 7. Potential working model of the coordinated response of tea shoot growth and catechin biosynthesis to interactions of ecological factors.
Horticulturae 11 00624 g007
Disclaimer/Publisher’s Note: The statements, opinions and data contained in all publications are solely those of the individual author(s) and contributor(s) and not of MDPI and/or the editor(s). MDPI and/or the editor(s) disclaim responsibility for any injury to people or property resulting from any ideas, methods, instructions or products referred to in the content.