Article

Tomato Lines Tolerant to Sodium Chloride at Early Growth Stages

by
Alma Aurora Deanda-Tovar
1,
Juan Enrique Rodríguez-Pérez
1,*,
Jaime Sahagún-Castellanos
1,
María Teresa Beryl Colinas-y-León
1,
Paulino Pérez-Rodríguez
2 and
Ana Elizabeth Paredes-Cervantes
1
1
Departamento de Fitotecnia, Instituto de Horticultura, Universidad Autónoma Chapingo, Km 38.5 Carretera México-Texcoco, Chapingo 56230, Estado de México, Mexico
2
Colegio de Postgraduados, Km 36.5 Carretera México-Texcoco, Montecillo 56230, Estado de México, Mexico
*
Author to whom correspondence should be addressed.
Horticulturae 2025, 11(5), 532; https://doi.org/10.3390/horticulturae11050532
Submission received: 7 April 2025 / Revised: 8 May 2025 / Accepted: 12 May 2025 / Published: 14 May 2025
(This article belongs to the Special Issue Biotic and Abiotic Stress Responses of Horticultural Plants)

Abstract

:
High concentrations of sodium chloride (NaCl) in soil and water are increasingly common conditions in tomato (Solanum lycopersicum L.) production that impair the development and yield of this crop, generating the need for tolerant varieties. This research aimed to identify tomato lines tolerant to salinity during germination and early seedling development. A standard germination test was carried out in which 93 lines were evaluated under conditions of 0 and 80 mM NaCl for 12 days in a germination chamber with a temperature of 28 ± 1 °C and relative humidity of 80 ± 5%. At the seedling stage, 88 lines were evaluated under conditions of 0 and 150 mM NaCl in a floating raft system. During germination, saline conditions decreased germination percentage (37%), plumule (43%) and radicle (47%) length, dry matter (44%) and germination rate index (70%). At the seedling stage, NaCl decreased (p ≤ 0.05) plant height (44%) and leaf area (50%), without modifying root, aerial and total dry matter or root length. Twenty-eight tolerant lines were identified at germination and twenty-three at the seedling stage, seven of which were tolerant at both stages. This implies that salinity tolerance mechanisms differ in the developmental stages studied and makes it possible to combine these mechanisms to prolong tolerance during plant development.

1. Introduction

Salinity is one of the major abiotic factors affecting agriculture worldwide and threatening food security [1], as it is estimated that 20% of cultivated land and 33% of irrigated agricultural area are affected by this condition [2,3]; this causes reductions in agricultural crop yields between 50 and 80% [4,5], with losses of up to USD 27.3 billion annually [6]. In addition, it is estimated that by 2050, half of all crops will be affected by salinity [2,7]. Mexico also faces this problem due to the fact that of the country’s 9.8 million hectares of irrigated agricultural land, 34.9% are slightly affected by excess sodium and 25.1% by salinity [8]; this percentage is constantly increasing due to inadequate agricultural practices and use of poor-quality water.
Tomato (Solanum lycopersicum L.) is one of the most consumed vegetables worldwide, with a harvested area of 4,917,735 hectares in 2022 [9]. Mexico is the world’s eighth largest producer and leading exporter of this vegetable [10]. The widespread cultivation of this crop implies that its establishment can occur under salinity stress conditions. Although the crop is considered moderately tolerant to salts, up to 6 dS·m−1 [11], it shows disorders when grown in highly saline soils, with greater damage during germination and, to a lesser extent, during the seedling stage [12]. Saline conditions delay and reduce the germination of tomato seeds by altering their physiological and biochemical activity and by decreasing the water potential gradient and its surrounding environment [13,14]; saline conditions also reduce the germination rate due to the deterioration of enzymatic activity caused by osmotic stress or ionic toxicity caused by NaCl [15,16].
At the seedling stage, salinity reduces the height, growth and development of the stem, root and leaf area and, consequently, biomass accumulation [17,18]. High Na+ and Cl concentrations in the soil solution generate osmotic stress, ionic imbalance, water deficit and oxidative stress in the plant [19]. Thus, as the concentration of salts and the stress period increase, the accumulation of Na+ and Cl ions increases, which generates toxicity and inhibits the primary metabolism by damaging the photosynthetic machinery and accumulating excess reactive oxygen species (ROS) [20]. The high accumulation of ROS increases the permeability of the cell membrane due to the degradation of its functional and structural proteins [21]. In the root zone, osmotic stress reduces the ability to absorb water and nutrients, which decreases leaf and shoot growth [22].
Plants also have the ability to activate gene families involved in different metabolic, physiological and biochemical processes to tolerate salinity stress [23]. Among them, there are those that regulate stomatal closure, which prevents water loss and increase and maintains ionic homeostasis [24]; those that prevent Na+ accumulation in roots [25]; and those that increase antioxidant activity, biomass accumulation and secondary metabolite accumulation [26]. These metabolites have the functions of preserving enzymatic activity, stabilizing structural proteins and scavenging reactive oxygen species to mitigate oxidative damage and enhance the tolerance response [22,27].
All of them together maintain root development in the face of salinity stress for the supply of nutrients. Since there is a genetic control of these processes involved in salt tolerance, some tomato breeding programs focus on the selection of these genes to obtain new tolerant varieties [28], particularly during the initial growth stages (germination, emergence and seedling), since the greatest vulnerability of tomato plants to saline conditions occurs during these stages in which the ability to adapt to salt stress is crucial to maintain crop productivity [29].
This research aimed to identify and select experimental tomato lines that are salinity tolerant at the germination and seedling stages and to design a strategy to evaluate a large number of genotypes using short-term tests and identify their degree of tolerance to salt stress in the early stages of development.

2. Materials and Methods

The genotypes evaluated were 93 homozygous lines (F17–F19) at germination and 88 lines at the seedling stage. The difference in the number of genotypes evaluated in the tests was due to seed availability. The lines were generated by the greenhouse tomato breeding program of the Universidad Autónoma Chapingo (UACh) and were obtained from balanced composites of segregating populations derived from crosses between commercial hybrids. Some characteristics of these lines are presented in Table S1 (fruit type, color and growth habit).
Two salt tolerance tests were carried out, one during germination (in 2022) and one at the seedling stage (in 2020). The NaCl concentrations studied were chosen based on Seth et al. [30] for germination, 80 mM NaCl, and Ahmed et al. [23] for seedling, 150 mM NaCl. These concentrations allowed to differentiate between tolerant and susceptible lines, without being lethal doses.

2.1. NaCl Tolerance at Germination Stage

The experiment was carried out in June and July 2022 in the seed laboratory of the Plant Science Department of the Universidad Autónoma Chapingo (UACh). Two standard germination tests were performed using saline treatment (80 mM NaCl) and a control. The saline solution was prepared with distilled and deionized water and 99.3% pure NaCl (High Purity®, Mexico city, Mexico).
The experimental unit (EU) was a 56 mm diameter Petri dish with 25 seeds. Filter paper was used as a substrate saturated with 2 mL of solution, either with distilled and deionized water or 80 mM NaCl, according to the corresponding treatment. The experimental design randomized complete blocks with two replicates in the case of the control and four replicates in the case of 80 mM NaCl. Under laboratory or greenhouse conditions, environmental variation tends to be considerably smaller, allowing for a more precise estimation of experimental error with a smaller number of replicates. In contrast, under stress conditions, this variation increases. Thus, the smaller number of replicates in the control setting does not compromise the statistical validity of the results.
The tests were carried out for twelve days in a germination chamber (Lab-Tech Inc.®, model D-7140, Hopkinton, MA, USA) with three days of darkness and nine days of artificial light. The temperature was maintained at 28 ± 1 °C and relative humidity at 80 ± 5%. Three 1 mL irrigations were made with the corresponding solutions, according to the water needs of the seedlings.
Germinated seeds were counted daily. A seed was considered germinated when the radicle protruded. At the end of the test, the following were evaluated:
Germination percentage (GP, in %) with respect to the total number of seeds sown.
Germination rate index (GRI) with the formula proposed by Maguire [31]:
G R I = i = 1 n x i d i ,
where n is the number of counts made during the trial, x is the number of seeds germinated in count i minus the number of seeds germinated in count i 1 , and d is the number of days after sowing until count i .
Five seedlings were randomly selected from the EU, and the average plumule length (PL, in cm) and average radicle length (RL, in cm) were determined.
Seedlings from all the EU were dried to constant weight at 45 °C in an oven (Riossa®, model H-48, series 301007, Mexico city, Mexico). Subsequently, total dry matter (TDM, in mg) was determined on an analytical balance (Sartorius, practiucum224-1S, 0029604782, Goettingen, Germany).

2.2. NaCl Tolerance at the Seedling Stage

The evaluation was carried out from July to September 2020 under greenhouse conditions at the Colegio de Postgraduados, Montecillo campus (19°27′53″ N, 98°54′19″ W); temperatures inside the greenhouse ranged between 13.5 and 35 °C.
Eighty-eight experimental lines exposed during the seedling stage to 0 and 150 mM NaCl concentrations were evaluated. The lines were sown in 200-cavity polystyrene trays with peat foam (Oasis®, Columbus, OH, USA) as substrate. Transplanting was carried out 23 days after sowing in a floating raft system (Figure 1) under greenhouse conditions. Wooden containers measuring 2.4 × 1.2 × 0.2 m and covered with geomembrane and with a capacity of 500 L of nutrient solution were used. The nutrient solution used was that of Cadahia [32] at 50%. The experimental unit consisted of 5 seedlings, with a planting density of 166.6 plants·m2. One container constituted a replicate. Four days after transplanting (DAT), 150 mM NaCl was added to the nutrient solution of three containers. Two other containers corresponded to the control without NaCl. A randomized complete block experimental design was used with three replicates at 150 mM concentration and two replicates at the control.
Seedling height (SH, in cm) was measured on three EU seedlings.
The test ended at 14 DAT. The average root length (RL, in cm) was then evaluated in three EU seedlings, and from the five EU seedlings, aerial dry matter (ADM, in g) and root dry matter (RDM, in g) were determined, both dried for 96 h at 46 °C. Leaf area (LA, in cm2), for which digital photographs were captured, was subsequently determined using ImageJ software (v1.4.3.67; National Institutes of Health, Bethesda, MD, USA).

2.3. Statistical Analysis

The statistical analysis was similar in both tests. Initially, indices were obtained by the quotient of the response obtained in the saline condition divided by the average of the response obtained in the control. With the generated indices, a cluster analysis was carried out with Gower’s [33] distance and Ward’s [34] minimum variance algorithm. The cut-off height was determined by Hotelling’s [35] T2 statistics and the pseudo-F statistic [36].
To corroborate the sets obtained by the cluster analysis, a discriminant analysis was performed, and resubstitution and cross-validation tests were applied [36]. Finally, with the original data, analysis of variance and comparison of means were performed with Tukey’s test, considering the generated groups as a source of variation and the genotypes nested in this factor.
The analysis was performed with SAS statistical package (version 9.4., Cary, NC, USA) with the procedures UNIVARIATE, MEANS, DISTANCE, CLUSTER, DISCRIM and GLM.

3. Results and Discussion

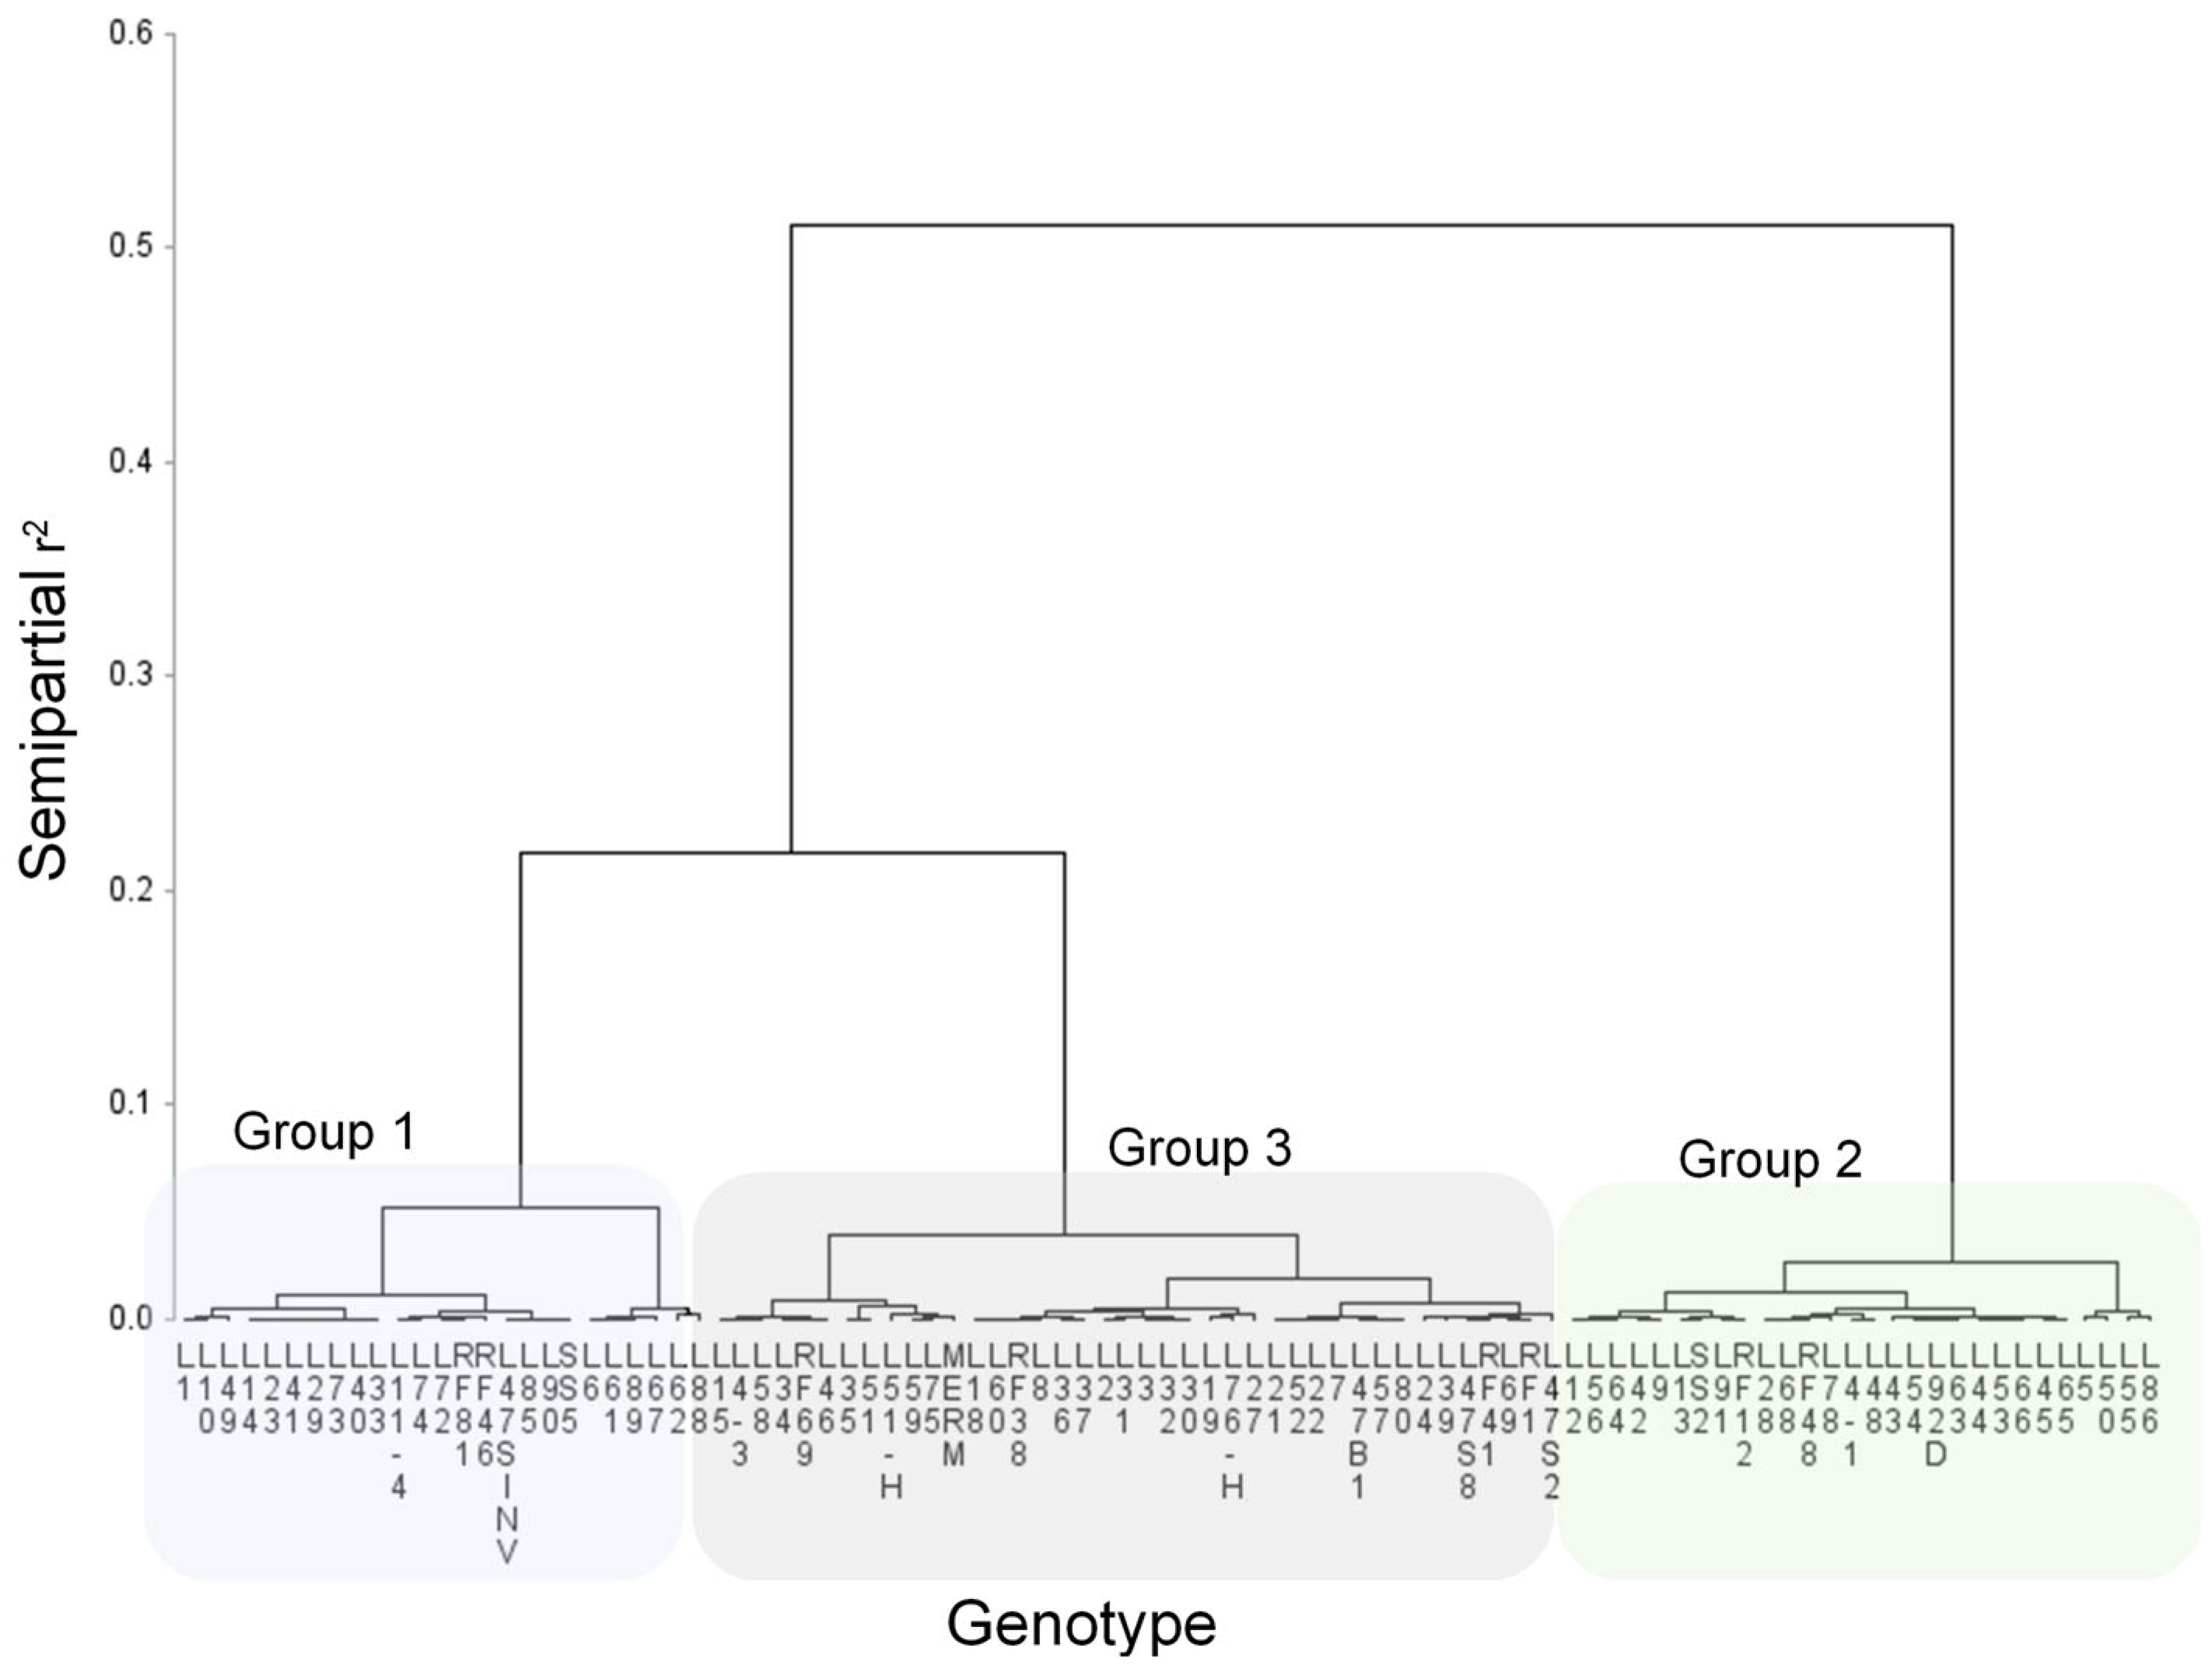
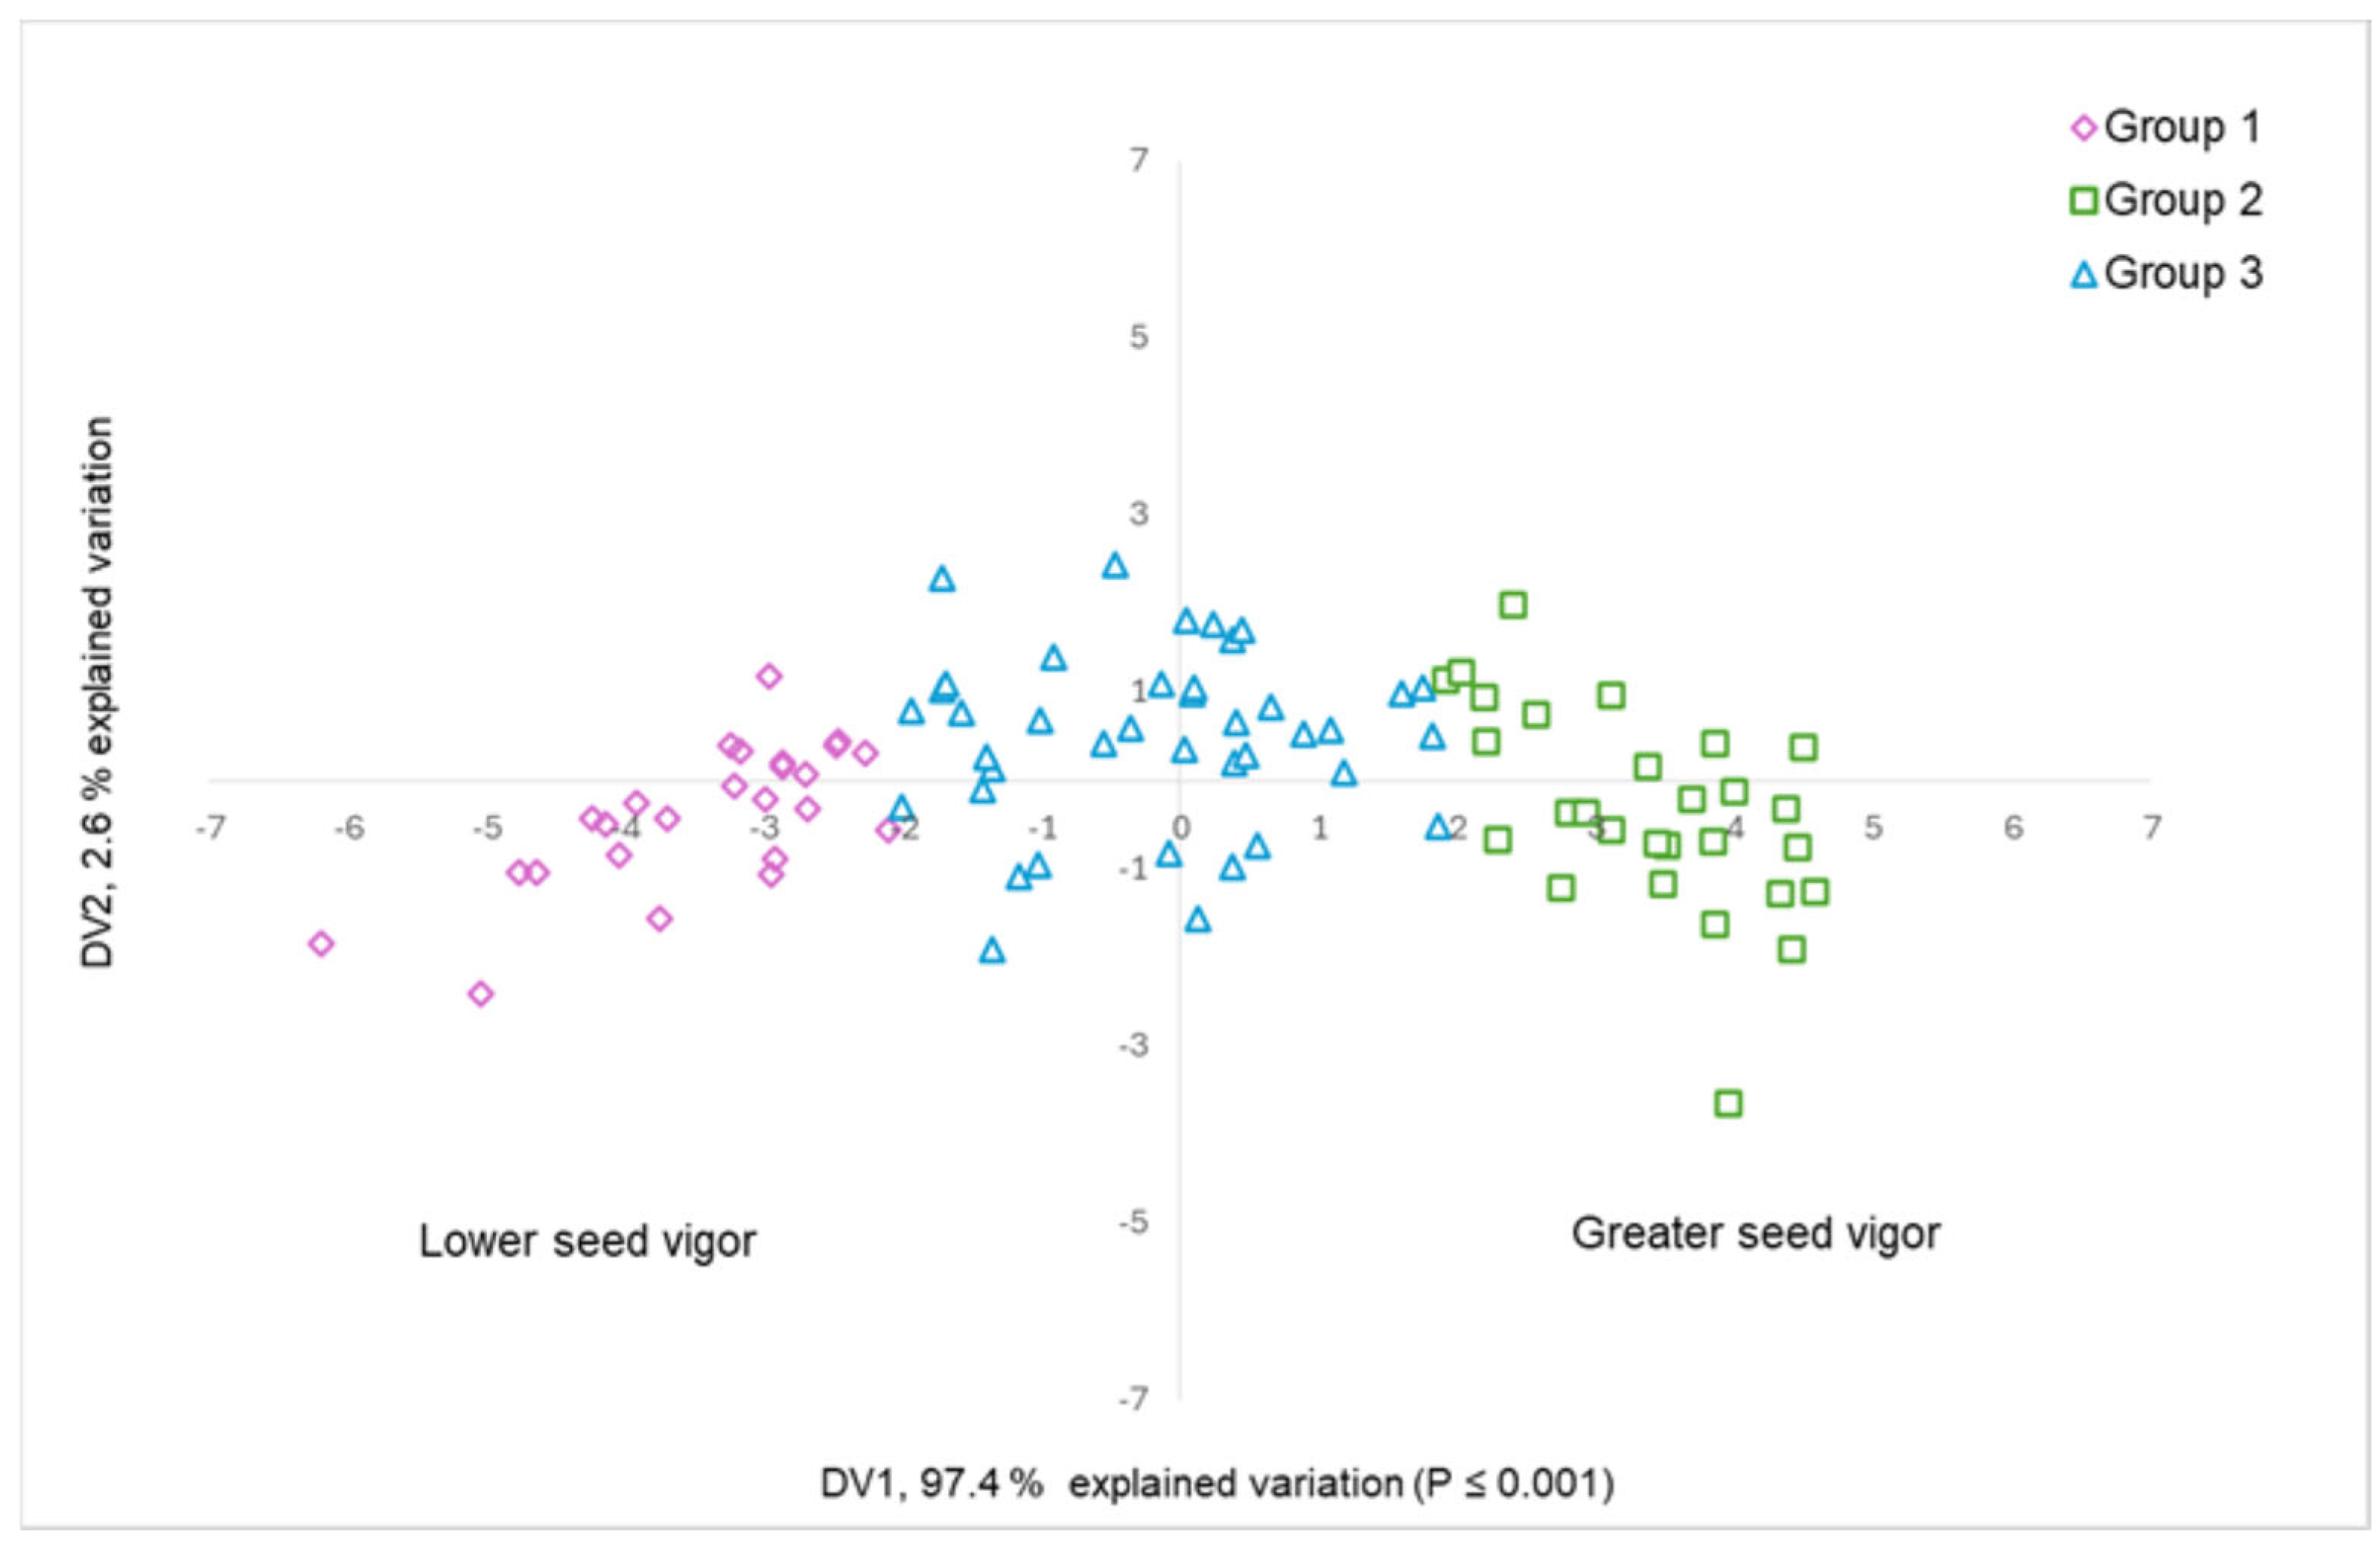
3.1. Salinity Tolerance at Germination Stage

The dendrogram generated by the cluster analysis obtained from Gower’s distance and Ward’s minimum variance algorithm is presented in Figure 2. Hotelling’s T2 statistic and the pseudo-F statistic indicated the formation of three groups with a cut-off height of 0.05 of semipartial r2. The groups were made up of 25, 28 and 40 genotypes.
The appropriateness of the achieved grouping was corroborated with a linear discriminant analysis, which indicated that the first discriminant variable (DV1), with an eigenvalue of 6.8, explained 97.4% of the variation in the data (p ≤ 0.0001). The DV1 eigenvector indicated a greater relationship with germination percentage, germination rate index and total dry matter (Table 1); that is, lines with a high DV1 value identify lines with greater vigor during germination and vice versa. The second discriminant variable (DV2) described only 2.6% of the variation, which was not significant. Resubstitution and cross-validation tests showed adequate assignments in 90 of the 93 genotypes evaluated.
The graphical representation of the genotypes based on the two discriminant variables is presented in Figure 3. Group 2 had the highest tolerance to salt stress, showing the greatest seed vigor with the highest DV1 values, associated with the greatest development of GP, TDM, PL, RL and GRI. In contrast, Group 1 was the most susceptible to NaCl, with the lowest seed vigor, while Group 3 showed intermediate tolerance.
Analyses of variance were performed for original traits where NaCl concentrations, the generated groups and the genotypes nested within groups were considered, along with the corresponding interactions. These analyses showed significance for all sources of variation in the evaluated traits, except for GP and TDM in the concentration × genotype (group) interaction. Coefficients of variation ranged between 20 and 25%, except for radicle length, which was 40% (Table S2).
The evaluated traits were diminished by more than 37% by salinity stress (Table 2). Similar results were reported by Fadhil et al. [37] in commercial cultivars under salinity conditions between 70 and 170 mM NaCl, where a negative association was detected between the increase in saline condition with the germination percentage and biomass accumulation. At 100 mM, the reductions in these two traits corresponded to 95 and 100%, whereas, in the present study, at 80 mM NaCl, they were 37 and 44%, respectively.
The evaluated lines showed reductions of less than 47% in seedling development (RL, PL and TDM) (Table 2); this contrasts with the reductions observed by Shanika and Seran [38] in the same variables and at the same NaCl concentration, which were greater than 50%. GRI was the most affected trait, being reduced by 70% over a 12-day period at 80 mM NaCl. This percentage was lower than that obtained in tomatoes native to Mexico (88%) germinated in 150 mM NaCl, although over a 20-day period [39]. At concentrations of 80 mM NaCl, the GRI reduction percentages are consistent with those observed in commercial varieties, in which they have been higher than 80% starting at 75 mM [40].
Comparisons of means of the group × NaCl concentration interaction (Table 3) indicated that in all groups the traits decreased (p ≤ 0.05) under salt stress. However, Group 2 had greater tolerance, since it decreased the evaluated traits to a lesser extent, with appreciably smaller reductions than the other two groups; in the case of GP, PL, RL and TDM, they were less than 40%. Group 1, with the greatest susceptibility, had reduction percentages in the evaluated traits of between 57 and 84%. This is consistent with Figure 3, derived from the discriminant analysis previously performed.
The tolerant lines belonging to Group 2 (L4-1, L5, L9, L45 and L92D) showed no differences in GP, RL, PL and TDM (p ≤ 0.05) between the saline condition (80 mM NaCl) and the control (Table 4). Previous research indicates that in various crops, including tomato, genotypes with salinity tolerance show minor reductions in these same traits [29,38,41,42].
At a concentration of 70 mM, two commercial varieties showed germination percentages of 65% [43], while the tolerant lines in the present study (80 mM NaCl) had germination percentages above 78%.
According to previous information, it was possible to identify 28 genotypes with better performance under salt stress (Table S3) than those reported in other studies [37,38,41,44,45]. In contrast, susceptible genotypes were found with diminished development under this condition (Figure 4) and were clearly outperformed by both the tolerant genotypes in this work and those from other studies [14,15,39,40,43]. This shows the usefulness of the methodology employed for the selection of NaCl tolerance during germination with a high number of genotypes.
The tolerance expressed by the genotypes during a 12-day period to the salt stress that occurred in this research must be associated with both osmotic stress tolerance and ionic tolerance. The former occurs in the initial periods of exposure to NaCl, which causes a decrease in the osmotic potential that prevents water uptake during seed germination [5,15,46,47]. In contrast, ionic stress occurs during prolonged periods of NaCl exposure, caused by the toxicity of Na+ and Cl upon entering embryonic tissues, resulting in the alteration of cellular metabolism, protein synthesis and ATP synthesis [23,48,49,50], reasons why the germination process is considered to be the most sensitive in plant development [29,44,51].
Under this reasoning, the genotypes of Group 2, with greater tolerance during germination, must possess mechanisms of tolerance to both types of stress due to the prolonged period of the test. Group 3, with partial tolerance to NaCl, could possess one of these two mechanisms, suggesting that the tolerance gene complexes are different.

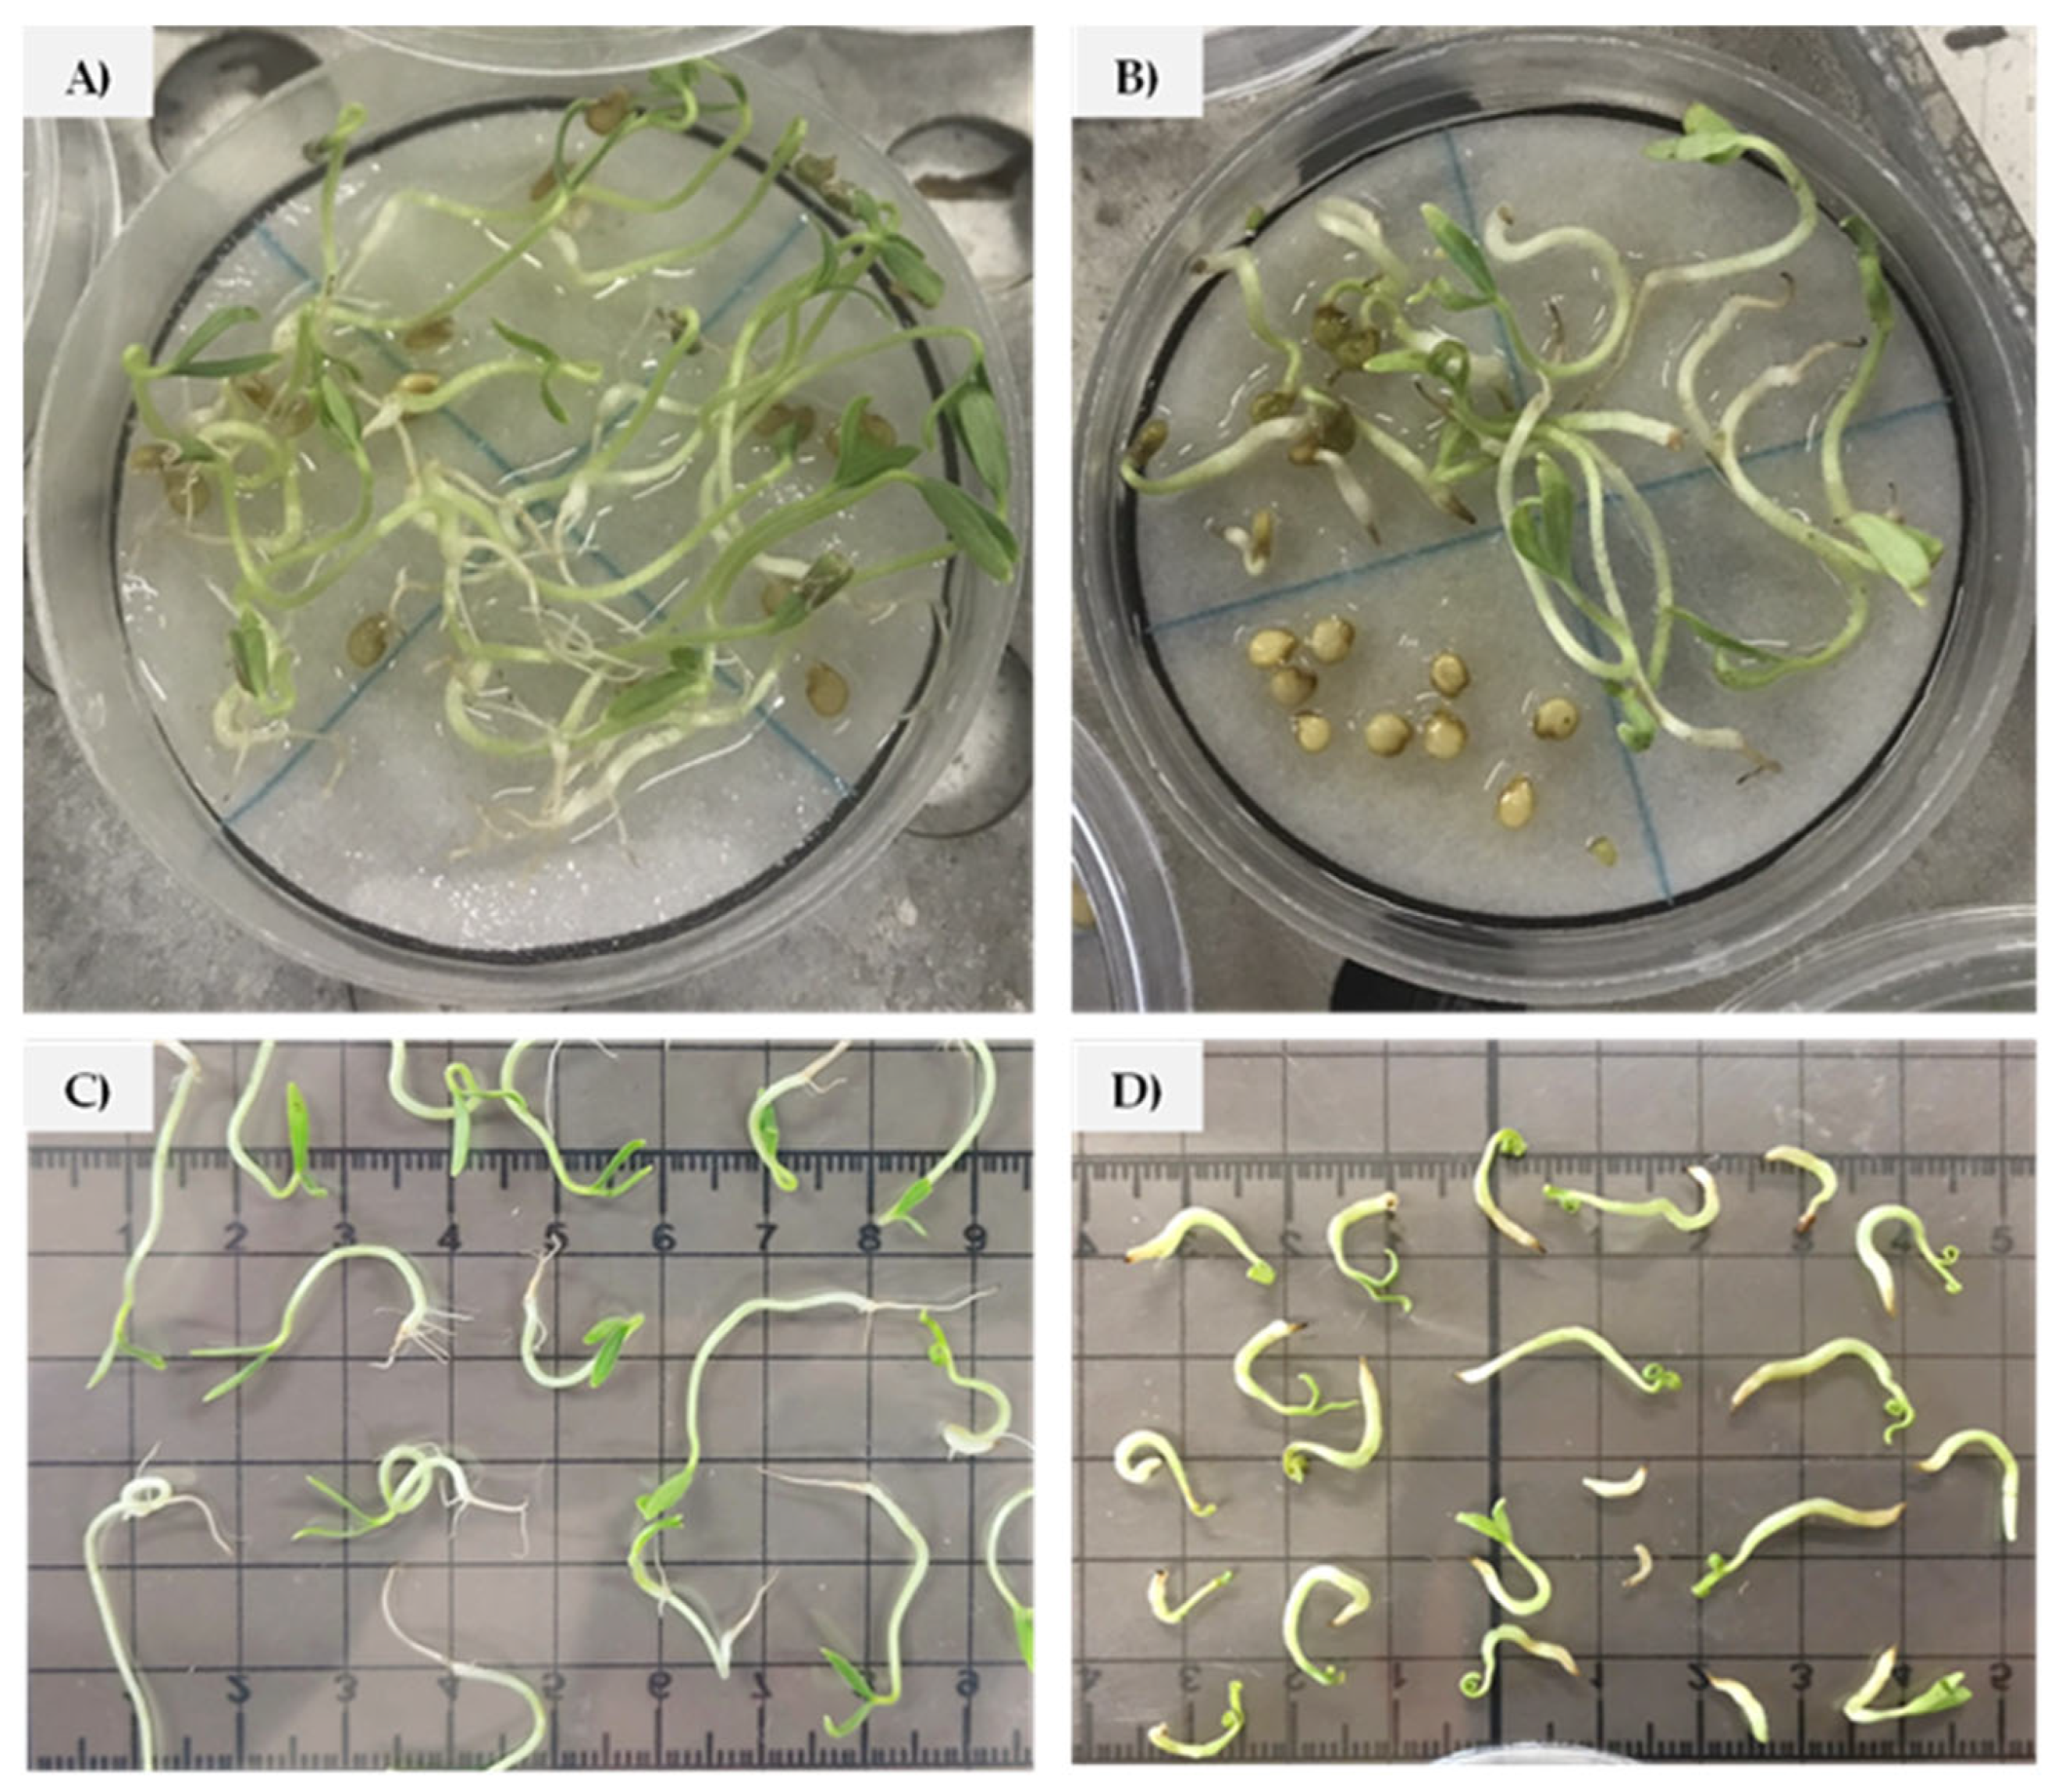
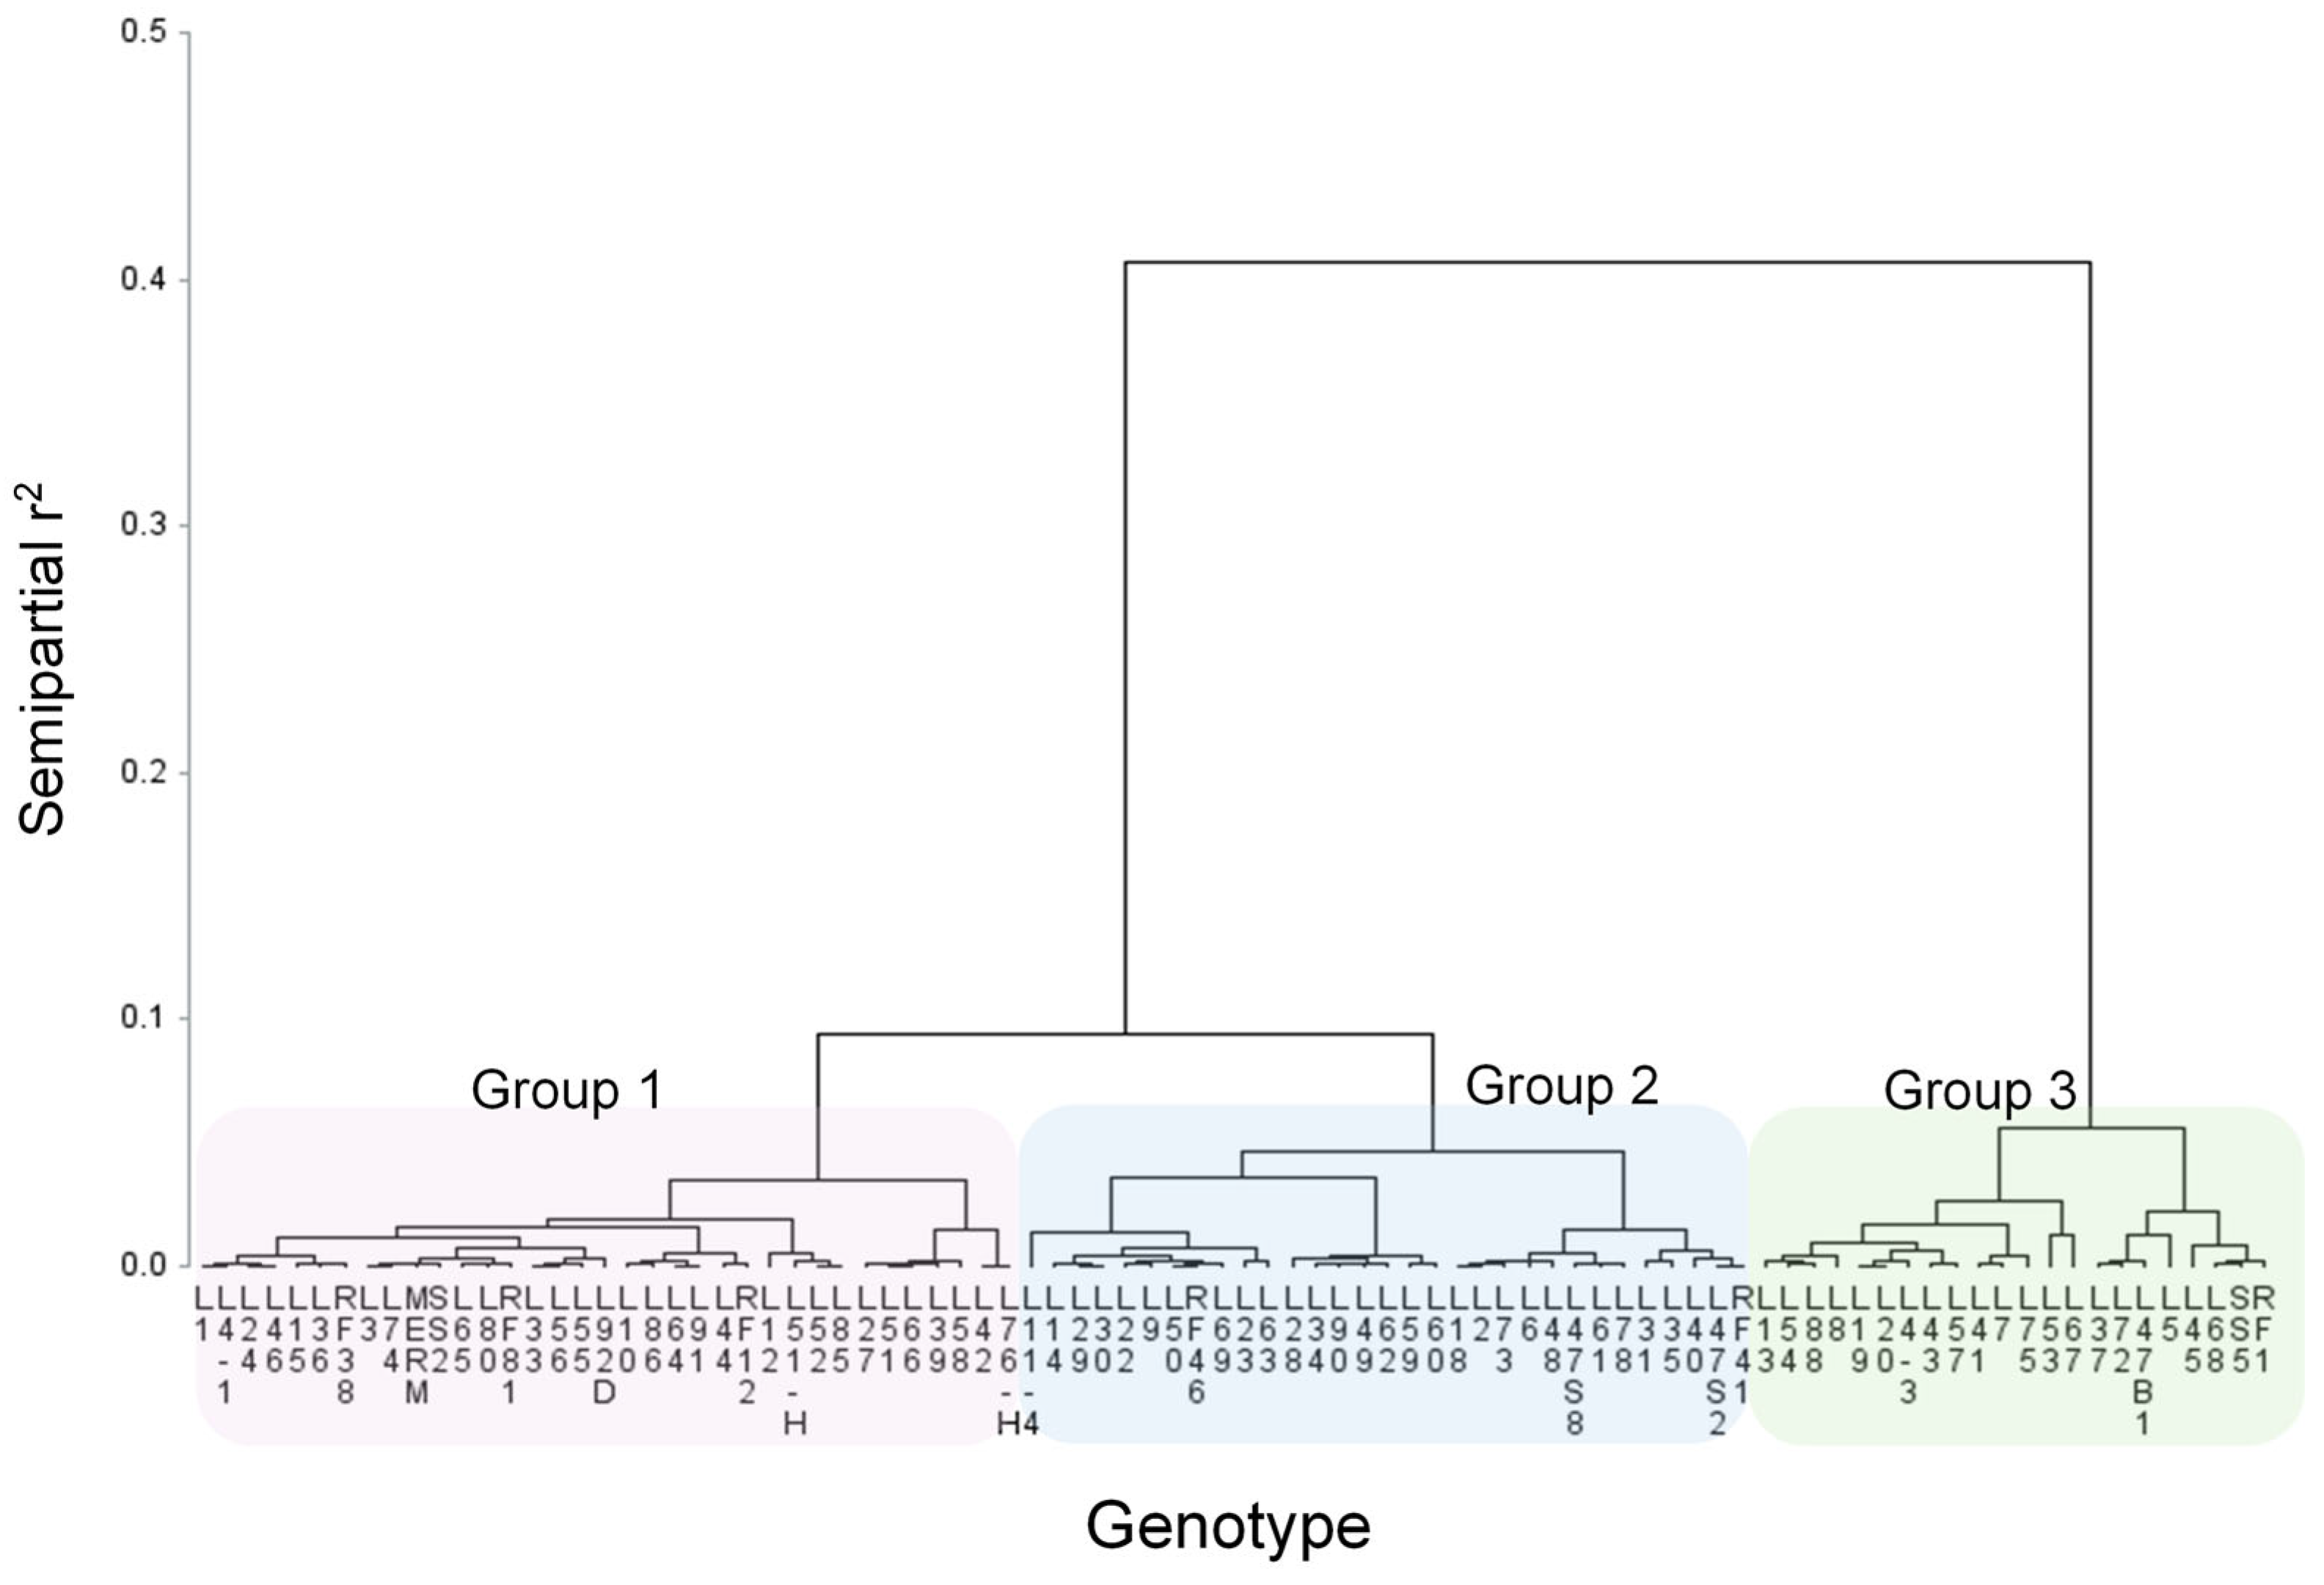
3.2. Salinity Tolerance at Seedling Stage

An index was calculated for each trait, which consisted of dividing the result of the saline condition by the average of the result in the absence of salt, with which multivariate analyses were performed. The dendrogram, generated with Gower’s distance and Ward’s minimum variance algorithm, is presented in Figure 5. Hotelling’s T2 statistic and the pseudo-F statistic indicated the formation of three groups with a cut-off height of 0.05 of semipartial r2.
A linear discriminant analysis was performed to corroborate the appropriateness of the grouping, which indicated that one discriminant variable (DV1), with an eigenvalue of 5.3, explained 97% of the variation in the data (p ≤ 0.0001). The DV1 eigenvector showed a greater positive association with aerial dry matter accumulation, total dry matter and leaf area (Table 5); that is, lines with a high DV1 value indicate greater stem and leaf development. The cross-validation test showed adequate assignments in 80 of the 88 genotypes evaluated. Once the eight genotypes were reassigned, the three groups were made up of 36, 29 and 23 lines.
The graphical representation of the genotype distribution based on discriminant variables DV1 and DV2 is presented in Figure 6. The Group 3 genotypes were the most tolerant to salt stress, showing higher DV1 values; that is, they had greater development of the aerial part and leaf area. In contrast, the Group 1 genotypes were susceptible, since they showed less development of the traits mentioned.
The analyses of variance considered the sources of variation: NaCl concentration, groups, genotypes nested within groups and the corresponding interactions. In the sources of variation groups and concentration, significance was detected in the evaluated traits, except for RL in groups and TDM for concentrations. The genotypes within groups had differences (p ≤ 0.01) in all evaluated traits. Regarding the concentrations × genotype interaction, statistical differences were only detected in SH and LA. Coefficients of variation were acceptable, between 12 and 21% in SH, RL and LA. For RDM, ADM and TDM, the coefficients of variation ranged between 34 and 37.5% (Table S4).
According to the comparisons of means for NaCl concentration, the saline condition drastically decreased SH and LA, without modifying RL, RDM, ADM or TDM (Table 6). In a previous study, tomato seedlings exposed to 105 mM NaCl had plant height reductions of 70% [43]. In commercial varieties, decreases of 30% in plant height were observed at a 100 mM NaCl concentration [41], which was 10% lower than the percentage obtained in the present study. In addition, the lines showed reductions of 50% in leaf area, results like those obtained in tomato lines native to Mexico at 205 mM NaCl, where the genotypes decreased their leaf area by 38% [52]. Similarly, at the same concentration, three commercial varieties decreased their leaf area by 50% [45].
The comparisons of means for the concentration × group interaction (Table 7) identify the genotypes of Group 3 as tolerant to NaCl, since they had fewer effects on SH, LA and RL; the percentages of reduction in the saline condition corresponded to 42, 14 and 43%, respectively, and RDM, ADM and TDM showed increases greater than 40% with respect to the control. In contrast, Group 1 genotypes were the most susceptible, showing reductions of more than 15% in the evaluated traits.
Under salinity conditions, the RDM of the tolerant genotypes of Group 3 increased by more than 100% (p ≤ 0.05) with respect to the control (Table 7). Similar results were observed in tomato seedlings exposed to 150 mM NaCl, which increased root dry matter by 72% [53].
Table 8 shows the 10 best-performing genotypes from Group 3, which expressed the highest tolerance (Table 7); these, except in the case of SH, did not show statistical differences in the evaluated traits (p ≤ 0.05) when going from the stress-free condition to the saline condition (150 mM NaCl). A tendency is observed in most of them to increase, although not significantly, RL, RDM and TDM; in addition, all, except one, did not reduce LA. Similar results were observed by López-Méndez et al. [39], where tolerant lines of wild tomatoes showed no statistical difference in biomass accumulation under 0 and 175 mM NaCl conditions. Previous research has indicated that as the NaCl concentration in the medium increases, stem and root length decreases, as well as dry matter accumulation [41,44,45,52]; however, in our research, aerial and root dry matter was not affected (p≤ 0.05) by the saline condition, and even tendencies to be increased in tolerant genotypes are observed (Figure 7). In contrast, the susceptible genotypes of Group 1 tended to increase only the RDM.
Of the 88 lines evaluated in the seedling test, 23 were identified as tolerant (Table S5), showing better performance under saline conditions than other genotypes from previous research [39,44,45,52]. This resulted from increased development of SH, RL and LA, as well as the greater accumulation of dry matter by structures. This increase in dry matter as a mechanism of salt stress tolerance has also been reported in corn [54], sweet potato [55], barley [42] and tomato [41]; these responses are associated with increases in the synthesis of organic solutes such as reducing sugars, total sugars, proline and amino acids, which help counteract osmotic effects and maintain plant water status [56,57,58]. In contrast, 36 susceptible genotypes were identified with impaired development in saline conditions, outperformed by the tolerant genotypes in this research, as well as those in other studies [16,40,51].
Under this reasoning, tolerant lines (Group 3) must have mechanisms that allow maintaining an adequate root system for the supply and distribution of water and nutrients to ensure the development and growth of seedlings, which must include tolerance to both osmotic stress and ionic toxicity by having the ability to accumulate Na+ in the vacuole and restrict the entry and translocation of Na+ [21,51,59]. Additionally, they participate in hormonal regulation that affects source–demand relationships and regulates the production and use of photoassimilates [60] that prevent ionic toxicity in photosynthetic tissues, which translates into greater biomass accumulation [61,62].
Upon consideration of the results of both tests, seven lines (L5, L13, L28, L43, L53, L54 and L68) were identified as salinity tolerant at the germination and seedling stages (Table 9). This set was characterized by having the lowest decreases in GP, PL and TDM during germination and RL, RDM, ADM and TDM in the seedling test when going from a normal condition to saline stress.
Growth assessment using rapid tests during germination and seedling development exposed to NaCl is an effective strategy for the preliminary identification of tolerant genotypes [37,44]. Several studies have shown that root growth and seedling length are correlated with salinity tolerance; therefore, these variables have been used as selection criteria for tolerant genotypes [38,39,41]. These conditions are observed in our results.
Leaf area, dry matter, seedling length and root length are required variables for the identification of genotypes tolerant to salt stress [43,45,52,53]. In this context, the floating raft system allows the evaluation of root development and growth through direct and non-destructive monitoring, which represents a great advantage over the use of solid substrates, in which the quantification of these characteristics is less precise [63].
The presence of tolerant lines in a single test implies that the tolerance mechanisms activated at each stage are different. For example, line L92D was tolerant in the germination test, while in the seedling test, it showed high susceptibility. Two lines derived from native populations were included in the study; SS2 exhibited the same behavior as L92D, while SS5 was tolerant in seedlings and susceptible during germination. Thus, salinity tolerance is a complex trait regulated by the expression of various metabolic and structural genes influenced by the presence of salt [64,65,66,67], such as those involved in the exclusion and compartmentalization of toxic ions and transcription factors that participate in signaling pathways in the presence of stress [68,69] and by the adaptive responsiveness of the genotype to salt stress [51,70]. Although genotypes with different levels of tolerance were found, no associations between this behavior and their phenotypic characteristics (fruit color and shape, growth habit) were identified (Table S1).
Similar to the present results, previous research has detected as tolerant genotypes those with smaller reductions in seedling and root length, as well as in biomass accumulation. In addition, these studies have been able to associate this response with the accumulation of secondary metabolites such as carotenoids, flavonoids, amino acids and anthocyanins, which are indicators to salinity stress adaptation [15,45,53]. Therefore, it is highly likely that the tolerant lines identified in this research possess these mechanisms that allow them to counteract the negative effects of salt stress.
Having rapid initial tests that are easy to replicate in a large number of genotypes in order to identify those that are tolerant to salt stress in periods of less than 20 days, enough time to show tolerance to both osmotic stress and ionic stress during the germination and seedling stages, facilitates the breeding of this crop. However, a detailed study of selected materials in longer periods of exposure to stress is necessary in order to quantify the concentration of secondary metabolites and nutrients, which would allow confirming tolerance to salt stress, even at advanced phenological stages. Quantification of these metabolites can provide further evidence of NaCl tolerance, complementing information from growth assessments. Under prolonged salt stress, secondary metabolites play a crucial role in maintaining enzyme function, stabilizing membrane proteins and scavenging reactive oxygen species [58,71].

4. Conclusions

Salinity caused by NaCl produces negative effects on the early developmental stages, germination and seedling of tomato lines. Furthermore, the results of this research suggest that the response to salinity stress depends on the adaptability of the genotype and the developmental stage. This is attributed to the fact that the twenty-eight tolerant genotypes in germination were different from the twenty-three tolerant ones in the seedling stage, with only seven tolerant genotypes coinciding in both phenological stages, which implies that salt stress tolerance is regulated by the expression of different genetic complexes.
The differential behavior of the lines allowed us to identify genotypes that are tolerant and susceptible to salt stress by evaluating growth and development at the germination and seedling stages using the methodologies employed in this research.
The variation in salt stress tolerance observed in a large number of tomato lines during the germination and seedling stages allowed the initial selection of genotypes for use in breeding. Thus, the tolerant lines at both stages evaluated (L5, L13, L28, L43, L53, L54 and L68) can be considered as parents for obtaining future tolerant varieties, because these genotypes showed the best response in terms of salt tolerance at germination and seedling stages.
In the germination test, salt stress-tolerant genotypes did not decrease dry matter accumulation, germination percentage or plumule and radicle length with respect to the control; in contrast, during the seedling stage, the tolerant genotypes increased root length and dry matter as an adaptive response to salt stress. This suggests the usefulness of these traits for the early selection of salt-tolerant genotypes.

Supplementary Materials

The following supporting information can be downloaded at https://www.mdpi.com/article/10.3390/horticulturae11050532/s1: Table S1. Phenotypic characteristics of the greenhouse tomato breeding program lines of the Universidad Autónoma Chapingo; Table S2. Analysis of variance for the traits evaluated in 93 tomato lines (Solanum lycopersicum L.) germinated under salinity conditions; Table S3. Comparisons of means of the concentration-by-genotype interaction in 93 experimental tomato (Solanum lycopersicum L.) lines, germinated under salinity conditions. Comparisons are made within each genotype between control (0 mM NaCl) versus saline condition (80 mM NaCl) (Tukey, p ≤ 0.05); Table S4. Analysis of variance for the traits evaluated in 88 seedlings tomato lines (Solanum lycopersicum L.) under salinity conditions; Table S5. Comparisons of means of the concentration-by-genotype interaction in 88 seedlings of experimental tomato (Solanum lycopersicum L.) lines under salinity conditions. Comparisons are made within each genotype between control (0 mM NaCl) versus saline condition (150 mM NaCl) (Tukey, p ≤ 0.05).

Author Contributions

Conceptualization, A.A.D.-T., J.E.R.-P., J.S.-C. and M.T.B.C.-y.-L.; methodology, A.A.D.-T., J.E.R.-P., J.S.-C., M.T.B.C.-y.-L. and A.E.P.-C.; validation, A.A.D.-T., J.E.R.-P., P.P.-R. and A.E.P.-C.; formal analysis, A.A.D.-T., J.E.R.-P., P.P.-R. and A.E.P.-C.; investigation, A.A.D.-T., J.E.R.-P. and A.E.P.-C.; resources, J.E.R.-P. and J.S.-C.; writing—original draft preparation, A.A.D.-T. and J.E.R.-P.; writing—review and editing, J.S.-C. and M.T.B.C.-y.-L.; visualization, A.A.D.-T. and J.E.R.-P.; supervision, J.E.R.-P., M.T.B.C.-y.-L., J.S.-C. and P.P.-R.; project administration, J.E.R.-P. and J.S.-C.; funding acquisition, J.E.R.-P. and J.S.-C. All authors have read and agreed to the published version of the manuscript.

Funding

This research received funding from Universidad Autónoma Chapingo through project D.G.I.P. 24002-EI2.

Data Availability Statement

Data are contained within the article. Additional information is available on request from the corresponding author.

Acknowledgments

For their assistance in the conduction of the experiments, thanks to Jorge Luis Sánchez Galicia and Ricardo Gaspar Hernández.

Conflicts of Interest

The authors declare no conflicts of interest.

References

  1. Mukhopadhyay, R.; Sarkar, B.; Jat, H.S.; Sharma, P.C.; Bolan, N.S. Soil salinity under climate change: Challenges for sustainable agriculture and food security. J. Environ. Manag. 2021, 280, 111736. [Google Scholar] [CrossRef]
  2. Shrivastava, P.; Kumar, R. Soil salinity: A serious environmental issue and plant growth promoting bacteria as one of the tools for its alleviation. Saudi J. Biol. Sci. 2015, 22, 123–131. [Google Scholar] [CrossRef] [PubMed]
  3. Hopmans, J.W.; Qureshi, A.S.; Kisekka, I.; Munns, R.; Grattan, S.R.; Rengasamy, P.; Ben-Gal, A.; Assouline, S.; Javaux, M.; Minhas, P.S.; et al. Chapter One—Critical knowledge gaps and research priorities in global soil salinity. Adv. Agron. 2021, 169, 1–191. [Google Scholar] [CrossRef]
  4. Vargas, R.; Pankova, E.I.; Balyuk, S.A.; Krasilnikov, P.V.; Khasankhanova, G.M. Handbook for Saline Soil Management; Food and Agriculture Organization of the United Nations: Rome, Italy; Lomonosov Moscow State University: Moscow, Russia, 2018. [Google Scholar]
  5. Uçarlı, C. Effects of Salinity on Seed Germination and Early Seedling Stage. In Abiotic Stress in Plants; Fahad, S., Saud, S., Chen, Y., Wu, C., Wang, D., Eds.; IntechOpen: London, UK, 2021. [Google Scholar] [CrossRef]
  6. Qadir, M.; Quillérou, E.; Nangia, V.; Murtaza, G.; Singh, M.; Thomas, R.J.; Drechsel, P.; Noble, A.D. Economics of salt-induced land degradation and restoration. Nat. Resour. Forum. 2014, 38, 282–295. [Google Scholar] [CrossRef]
  7. Zhao, S.; Zhang, Q.; Liu, M.; Zhou, H.; Ma, C.; Wang, P. Regulation of Plant Responses to Salt Stress. Int. J. Mol. Sci. 2021, 22, 4609. [Google Scholar] [CrossRef] [PubMed]
  8. Secretaría de Agricultura y Desarrollo Rural. Mapa Agrícola de Afectación por Salinidad en México. 2021. Available online: https://www.gob.mx/agricultura/acciones-y-programas/mapa-agricola-de-afectacion-por-salinidad-en-mexico (accessed on 20 July 2024).
  9. Food and Agriculture Organization of the United (FAOSTAT). Data About Food and Agriculture. 2024. Available online: https://www.fao.org/faostat/en/#data (accessed on 5 July 2024).
  10. Servicio de Información Agroalimentaria y Pesquera (SIAP). Panorama Agroalimentario 2024. Available online: https://www.gob.mx/agricultura/dgsiap/acciones-y-programas/panorama-agroalimentario-258035 (accessed on 6 April 2024).
  11. Singh, A. Soil salinity: A global threat to sustainable development. Soil Use and Manag. 2022, 38, 39–67. [Google Scholar] [CrossRef]
  12. Shams, M.; Khadivi, A. Mechanisms of salinity tolerance and their possible application in the breeding of vegetables. BMC Plant Biol. 2023, 23, 139. [Google Scholar] [CrossRef]
  13. Zhao, C.; Zhang, H.; Song, C.; Zhu, J.-K.; Shabala, S. Mechanisms of Plant Responses and Adaptation to Soil Salinity. Innovation 2020, 1, 100017. [Google Scholar] [CrossRef]
  14. Adilu, G.S.; Gebre, Y.G. Effect of salinity on seed germination of some tomato (Lycopersicon esculentum Mill.) varieties. J. Aridland Agri. 2021, 7, 76–82. [Google Scholar] [CrossRef]
  15. Abdel-Farid, I.B.; Marghany, M.R.; Rowezek, M.M.; Sheded, M.G. Effect of Salinity Stress on Growth and Metabolomic Profiling of Cucumis sativus and Solanum lycopersicum. Plants 2020, 9, 1626. [Google Scholar] [CrossRef]
  16. González-Grande, P.; Suárez, N.; Marín, O. Effect of salinity and seed salt priming on the physiology of adult plants of Solanum lycopersicum cv. ‘Río Grande’. Braz. J. Bot. 2020, 43, 775–787. [Google Scholar] [CrossRef]
  17. Osakabe, Y.; Osakabe, K.; Shinozaki, K.; Tran, L.-S.P. Response of plants to water stress. Front. Plant Sci. 2014, 5, 86. [Google Scholar] [CrossRef]
  18. Zörb, C.; Geilfus, C.M.; Dietz, K.J. Salinity and crop yield. Plant Biol. 2019, 21, 31–38. [Google Scholar] [CrossRef]
  19. Yang, Y.; Guo, Y. Elucidating the molecular mechanisms mediating plant salt-stress responses. New Phytol. 2018, 217, 523–539. [Google Scholar] [CrossRef]
  20. Machado, R.; Serralheiro, R. Soil Salinity: Effect on Vegetable Crop Growth. Management Practices to Prevent and Mitigate Soil Salinization. Horticulturae 2017, 3, 30. [Google Scholar] [CrossRef]
  21. Isayenkov, S.V.; Maathuis, F.J.M. Plant Salinity Stress: Many Unanswered Questions Remain. Front. Plant Sci. 2019, 10, 80. [Google Scholar] [CrossRef] [PubMed]
  22. Jameel, J.; Anwar, T.; Majeed, S.; Qureshi, H.; Siddiqi, E.H.; Sana, S.; Zaman, W.; Ali, H.M. Effect of salinity on growth and biochemical responses of brinjal varieties: Implications for salt tolerance and antioxidant mechanisms. BMC Plant Biol. 2024, 24, 128. [Google Scholar] [CrossRef]
  23. Ahmed, A.M.; Wais, A.H.; Ditta, A.; Islam, M.R.; Chowdhury, M.K.; Pramanik, M.H.; Ismaan, H.N.; Soufan, W.; El Sabah, A.; Islam, M.S. Seed Germination and Early Seedling Growth of Sorghum (Sorghum bicolor L. Moench) Genotypes Under Salinity Stress. Pol. Environ. Stud. 2024, 33, 3019–3032. [Google Scholar] [CrossRef]
  24. Ludwiczak, A.; Osiak, M.; Cárdenas-Pérez, S.; Lubińska-Mielińska, S.; Piernik, A. Osmotic Stress or Ionic Composition: Which Affects the Early Growth of Crop Species More? Agronomy 2021, 11, 435. [Google Scholar] [CrossRef]
  25. Abbas, A.; Mansha, S.; Waheed, H.; Siddiq, Z.; Hayyat, M.U.; Zhang, Y.-J.; Alwutayd, K. NaCl stress, tissue specific Na+ and K+ up-take and their effect on growth and physiology of Helianthus annuus L. and Solanum lycopersicum L. Sci. Hortic. 2024, 326, 112454. [Google Scholar] [CrossRef]
  26. Meza, S.L.R.; Egea, I.; Massaretto, I.L.; Morales, B.; Purgatto, E.; Egea-Fernández, J.M.; Bolarin, M.C.; Flores, F.B. Traditional Tomato Varieties Improve Fruit Quality Without Affecting Fruit Yield Under Moderate Salt Stress. Front. Plant Sci. 2020, 11, 587754. [Google Scholar] [CrossRef] [PubMed]
  27. Li, K.; Zhao, M.; Zhou, S.; Niu, L.; Zhao, L.; Xu, D. Effects of antibiotics on secundary metabolism and oxidative stress in oilseed rape seeds. Env. Sci. Poll. Res. 2024, 31, 27689–27698. [Google Scholar] [CrossRef] [PubMed]
  28. Sytar, O.; Mbarki, S.; Zivcak, M.; Brestic, M. The Involvement of Different Secondary Metabolites in Salinity Tolerance of Crops. In Salinity Responses and Tolerance in Plants; Kumar, V., Wani, S., Suprasanna, P., Tra, L.S., Eds.; Springer: Cham, Switzerland, 2018; Volume 2, pp. 21–48. [Google Scholar] [CrossRef]
  29. Ellouzi, H.; Ben Slimene Debez, I.; Amraoui, S.; Rabhi, M.; Hanana, M.; Alyami, N.M.; Debez, A.; Abdelly, C.; Zorrig, W. Effect of seed priming with auxin on ROS detoxification and carbohydrate metabolism and their relationship with germination and early seedling establishment in salt stressed maize. BMC Plant Biol. 2024, 24, 704. [Google Scholar] [CrossRef]
  30. Seth, R.; Kendurkar, S. In vitro screening: An effective method for evaluation of commercial cultivars of tomato towards salinity stress. Inter. J. Curr. Microbiol. Appl. Sci. 2015, 4, 725–730. [Google Scholar]
  31. Maguire, J.D. Speed of germination-aid in selection and evaluation for seedling emergence and vigor. Crop Sci. 1962, 2, 176–177. [Google Scholar] [CrossRef]
  32. Cadahia López, C. Fertirrigación: Cultivos Hortícolas y Ornamentales, 2nd ed.; Mundiprensa: Barcelona, Spain, 2000. [Google Scholar]
  33. Gower, J.C. A Comparison of Some Methods of Cluster Analysis. Biometrics. 1967, 23, 623. [Google Scholar] [CrossRef]
  34. Ward, J.H. Hierarchical Grouping to Optimize an Objective Function. J. Am. Stat. Assoc. 1963, 58, 236–244. [Google Scholar] [CrossRef]
  35. Hotelling, H. A Generalized T Test and Measure of Multivariate Dispersion. In Proceedings of the Second Berkeley Symposium on Mathematical Statistics and Probability; Neyman, J., Ed.; University of California Press: Berkeley, CA, USA, 1951; pp. 23–42. [Google Scholar] [CrossRef]
  36. Johnson, D.E. Applied Multivariate Methods for Data Analysts; Brooks Cole Publishing Company: Pacific Grove, MA, USA, 1998. [Google Scholar]
  37. Fadhil, A.A.; Swaid, S.Y.; Mohammed, S.J.; Al-Abboodi, A. Impact of Salinity on Tomato Seedling Development: A Comparative Study of Germination and Growth Dynamics in Different Cultivars. J. Chem. Health Risks 2024, 14, 183–190. [Google Scholar] [CrossRef]
  38. Shanika, M.M.A.N.; Seran, T.H. Impact of salinity on seed germination and seedling performance of tomato (Solanum lycopersicum L.) cv KC-1. J. Sci. 2020, 11, 1–11. [Google Scholar] [CrossRef]
  39. López-Méndez, A.G.; Rodríguez-Pérez, J.E.; Mascorro-Gallardo, J.O.; Sahagún-Castellanos, J.; Lobato-Ortiz, R. Sodium Chloride Tolerance during Germination and Seedling Stages of Tomato (Solanum lycopersicum L.) Lines Native to Mexico. Horticulturae 2024, 10, 466. [Google Scholar] [CrossRef]
  40. de Oliveira, L.B.; de Oliveira, L.B. Effects of water salinization on tomato seedlings (Solanum lycopersicum). Int. J. Adv. Eng. Res. Sci. 2023, 10, 015–021. [Google Scholar] [CrossRef]
  41. Ruiz Espinoza, H.F.; Villalpando Gutiérrez, R.L.; Murillo Amador, B.; Beltrán Morales, F.A.; Hernández Montiel, L.G. Respuesta diferencial a la salinidad de genotipos de tomate (Lycopersicon esculentum Mill.) en primeras etapas fenológicas. Terra Latinoam. 2014, 32, 311–323. [Google Scholar]
  42. Mwando, E.; Angessa, T.T.; Han, Y.; Zhou, G.; Li, C. Quantitative Trait Loci Mapping for Vigour and Survival Traits of Barley Seedlings after Germinating under Salinity Stress. Agronomy 2021, 11, 103. [Google Scholar] [CrossRef]
  43. Sané, A.K.; Diallo, B.; Kane, A.; Sagna, M.; Sané, D.; Sy, M.O. In Vitro Germination and Early Vegetative Growth of Five Tomato (Solanum lycopersicum L.) Varieties under Salt Stress Conditions. Am. J. Plant Sci. 2021, 12, 796–817. [Google Scholar] [CrossRef]
  44. Chakma, P.; Hossain, M.M.; Rabbani, M.G. Effects of salinity stress on seed germination and seedling growth of tomato. J. Bangladesh Agri. Univ. 2019, 17, 490–499. [Google Scholar] [CrossRef]
  45. Mustafa, A.A.; Abass, M.H.; Awad, K.M. Responses of three tomato (Lycopersicon esculentum L.) varieties to different salinity levels. Plant Cell Biotechnol. Mol. Biol. 2021, 22, 277–291. [Google Scholar]
  46. Rajendran, K.; Tester, M.; Roy, S.J. Quantifying the three main components of salinity tolerance in cereals. Plant Cell Environ. 2009, 32, 237–249. [Google Scholar] [CrossRef]
  47. Long, Y.; Chen, J.; Zeng, F.; Wu, S. An activatable NIR-II fluorescent probe for tracking heavy-metal ion and high-level salt-induced oxidative stress in plant sprouts. Aggregate 2023, 4, e288. [Google Scholar] [CrossRef]
  48. Kaneko, M.; Itoh, H.; Ueguchi-Tanaka, M.; Ashikari, M.; Matsuoka, M. The α-Amylase Induction in Endosperm during Rice Seed Germination Is Caused by Gibberellin Synthesized in Epithelium. Plant Physiol. 2002, 128, 1264–1270. [Google Scholar] [CrossRef]
  49. Zhang, P.; Senge, M.; Dai, Y. Effects of salinity stress on growth, yield, fruit quality and water use efficiency of tomato under hydroponics system. Rev. Agric. Sci. 2016, 4, 46–55. [Google Scholar] [CrossRef]
  50. Li, J.; Wu, Y.; Feng, X.; Hussain, T.; Guo, K.; Liu, X. Nonuniform salinity regulates leaf characteristics and improve photosynthesis of cherry tomatoes under high salinity. Environ. Exp. Bot. 2024, 217, 105565. [Google Scholar] [CrossRef]
  51. Nawaz, A.; Amjad, M.; Afzal, I.; Aslam Pervez, M. Effect of halopriming on germination and seedling vigor of tomato. Afr. J. Agric. Res. 2011, 6, 3551–3559. [Google Scholar]
  52. Sanjuan-Lara, F.; Ramírez-Vallejo, P.; Sánchez-García, P.; Sandoval-Villa, M.; Livera-Muñoz, M.; Carrillo-Rodríguez, J.C.; Perales-Segovia, C. Tolerancia de líneas nativas de tomate (Solanum lycopersicum L.) a la salinidad con NaCl. Interciencia 2015, 40, 704–709. [Google Scholar]
  53. Bogoutdinova, L.R.; Khaliluev, M.R.; Chaban, I.A.; Gulevich, A.A.; Shelepova, O.V.; Baranova, E.N. Salt Tolerance Assessment of Different Tomato Varieties at the Seedling Stage. Horticulturae 2024, 10, 598. [Google Scholar] [CrossRef]
  54. Akram, M.; Yasin Ashraf, M.; Ahmad, R.; Waraich, E.A.; Iqbal, J.; Mohsan, M. Screening for salt tolerance in maize (Zea mays L.) hybrids at an early seedling stage. Pak. J. Bot. 2010, 42, 141–154. [Google Scholar]
  55. Rodríguez-Delfín, A.; Posadas, A.; Quiroz, R. Rendimiento y absorción de algunos nutrimentos en plantas de camote cultivadas con estrés hídrico y salino. Rev. Chapingo Ser. Hortic. 2014, 20, 19–28. [Google Scholar] [CrossRef]
  56. Babu, M.A.; Singh, D.; Gothandam, K.M. The effect of salinity on growth, hormones and mineral elements in leaf and fruit of tomato cultivar PKM1. J. Anim. Plant Sci. 2012, 22, 159–164. [Google Scholar]
  57. Saha, J.; Brauer, E.K.; Sengupta, A.; Popescu, S.C.; Gupta, K.; Gupta, B. Polyamines as redox homeostasis regulators during salt stress in plants. Front. Environ. Sci. 2015, 3, 21. [Google Scholar] [CrossRef]
  58. Sabzmeydani, E.; Sedaghathoor, S.; Hashemabadi, D. Salinity response of Kentucky bluegrass (Poa pratensis L.) as influenced by salicylic acid and progesterone. Rev. Chapingo Ser. Hortic. 2019, 26, 49–63. [Google Scholar] [CrossRef]
  59. Parra-Terraza, S.; Angulo-Castro, A.; Sánchez-Peña, P.; Valdéz-Torres, J.B.; Rubio-Carrasco, W. Effect of Cl- and Na+ ratios in nutrient solutions on tomato (Solanum lycopersicum L.) yield in a hydroponic system. Rev. Chapingo Ser. Hortic. 2022, 28, 67–78. [Google Scholar] [CrossRef]
  60. Pérez-Alfocea, F.; Albacete, A.; Ghanem, M.E.; Dodd, I.C. Hormonal regulation of source—Sink relations to maintain crop productivity under salinity: A case study of root-to-shoot signalling in tomato. Funct. Plant Biol. 2010, 37, 592. [Google Scholar] [CrossRef]
  61. Roy, S.J.; Negrão, S.; Tester, M. Salt resistant crop plants. Curr. Opin. Biotechnol. 2014, 26, 115–124. [Google Scholar] [CrossRef] [PubMed]
  62. Pailles, Y.; Awlia, M.; Julkowska, M.; Passone, L.; Zemmouri, K.; Negrão, S.; Schmöckel, S.M.; Tester, M. Diverse Traits Contribute to Salinity Tolerance of Wild Tomato Seedlings from the Galapagos Islands. Plant Physiol. 2020, 182, 534–546. [Google Scholar] [CrossRef] [PubMed]
  63. Solanki, P.; Narayan, M.; Meena, S.S.; Srivastava, R.K. Floating raft wastewater treatment system: A review. J. Pure App. Microbiol. 2017, 11, 1113–1116. [Google Scholar] [CrossRef]
  64. Yokoi, S.; Quintero, F.J.; Cubero, B.; Ruiz, M.T.; Bressan, R.A.; Hasegawa, P.M.; Pardo, J.M. Differential expression and function of Arabidopsis thaliana NHX Na+/H+ antiporters in the salt stress response. Plant J. 2002, 30, 529–539. [Google Scholar] [CrossRef]
  65. Wu, X.; Shu, S.; Wang, Y.; Yuan, R.; Guo, S. Exogenous putrescine alleviates photoinhibition caused by salt stress through cooperation with cyclic electron flow in cucumber. Photosynth. Res. 2019, 141, 303–314. [Google Scholar] [CrossRef]
  66. Yang, X.; Li, Y.; Chen, H.; Huang, J.; Zhang, Y.; Qi, M.; Liu, Y.; Li, T. Photosynthetic Response Mechanism of Soil Salinity-Induced Cross-Tolerance to Subsequent Drought Stress in Tomato Plants. Plants 2020, 9, 363. [Google Scholar] [CrossRef]
  67. Akram, S.; Ghaffar, M.; Wadood, A.; Shokat, S.; Hameed, A.; Waheed, M.Q.; Arif, M.A.R. A GBS-based genome-wide association study reveals the genetic basis of salinity tolerance at the seedling stage in bread wheat (Triticum aestivum L.). Front. Genet. 2022, 13, 997901. [Google Scholar] [CrossRef]
  68. Hichri, I.; Muhovski, Y.; Clippe, A.; Žižková, E.; Dobrev, P.I.; Motyka, V.; Lutts, S. SlDREB2, a tomato dehydration-responsive element-binding 2 transcription factor, mediates salt stress tolerance in tomato and Arabidopsis. Plant Cell Ennviron. 2015, 39, 62–79. [Google Scholar] [CrossRef]
  69. Zhang, P.; Wang, R.; Yang, X.; Ju, Q.; Li, W.; Lü, S.; Tran, L.S.P.; Xu, J. The R2R3-MYB transcription factor AtMYB49 modulates salt tolerance in Arabidopsis by modulating the cuticle formation and antioxidant defence. Plant Cell Ennviron. 2020, 43, 1925–1943. [Google Scholar] [CrossRef]
  70. Dogan, M.; Tipirdamaz, R.; Demir, Y. Salt resistance of tomato species grown in sand culture. Plant Soil Environ. 2010, 56, 499–507. [Google Scholar] [CrossRef]
  71. Khalid, M.F.; Huda, S.; Yong, M.; Li, L.H.; Chen, Z.H.; Ahmed, T. Alleviation of drought and salt stress in vegetables: Crop responses and mitigation strategies. Plant Growth Regul. 2023, 99, 177–194. [Google Scholar] [CrossRef]
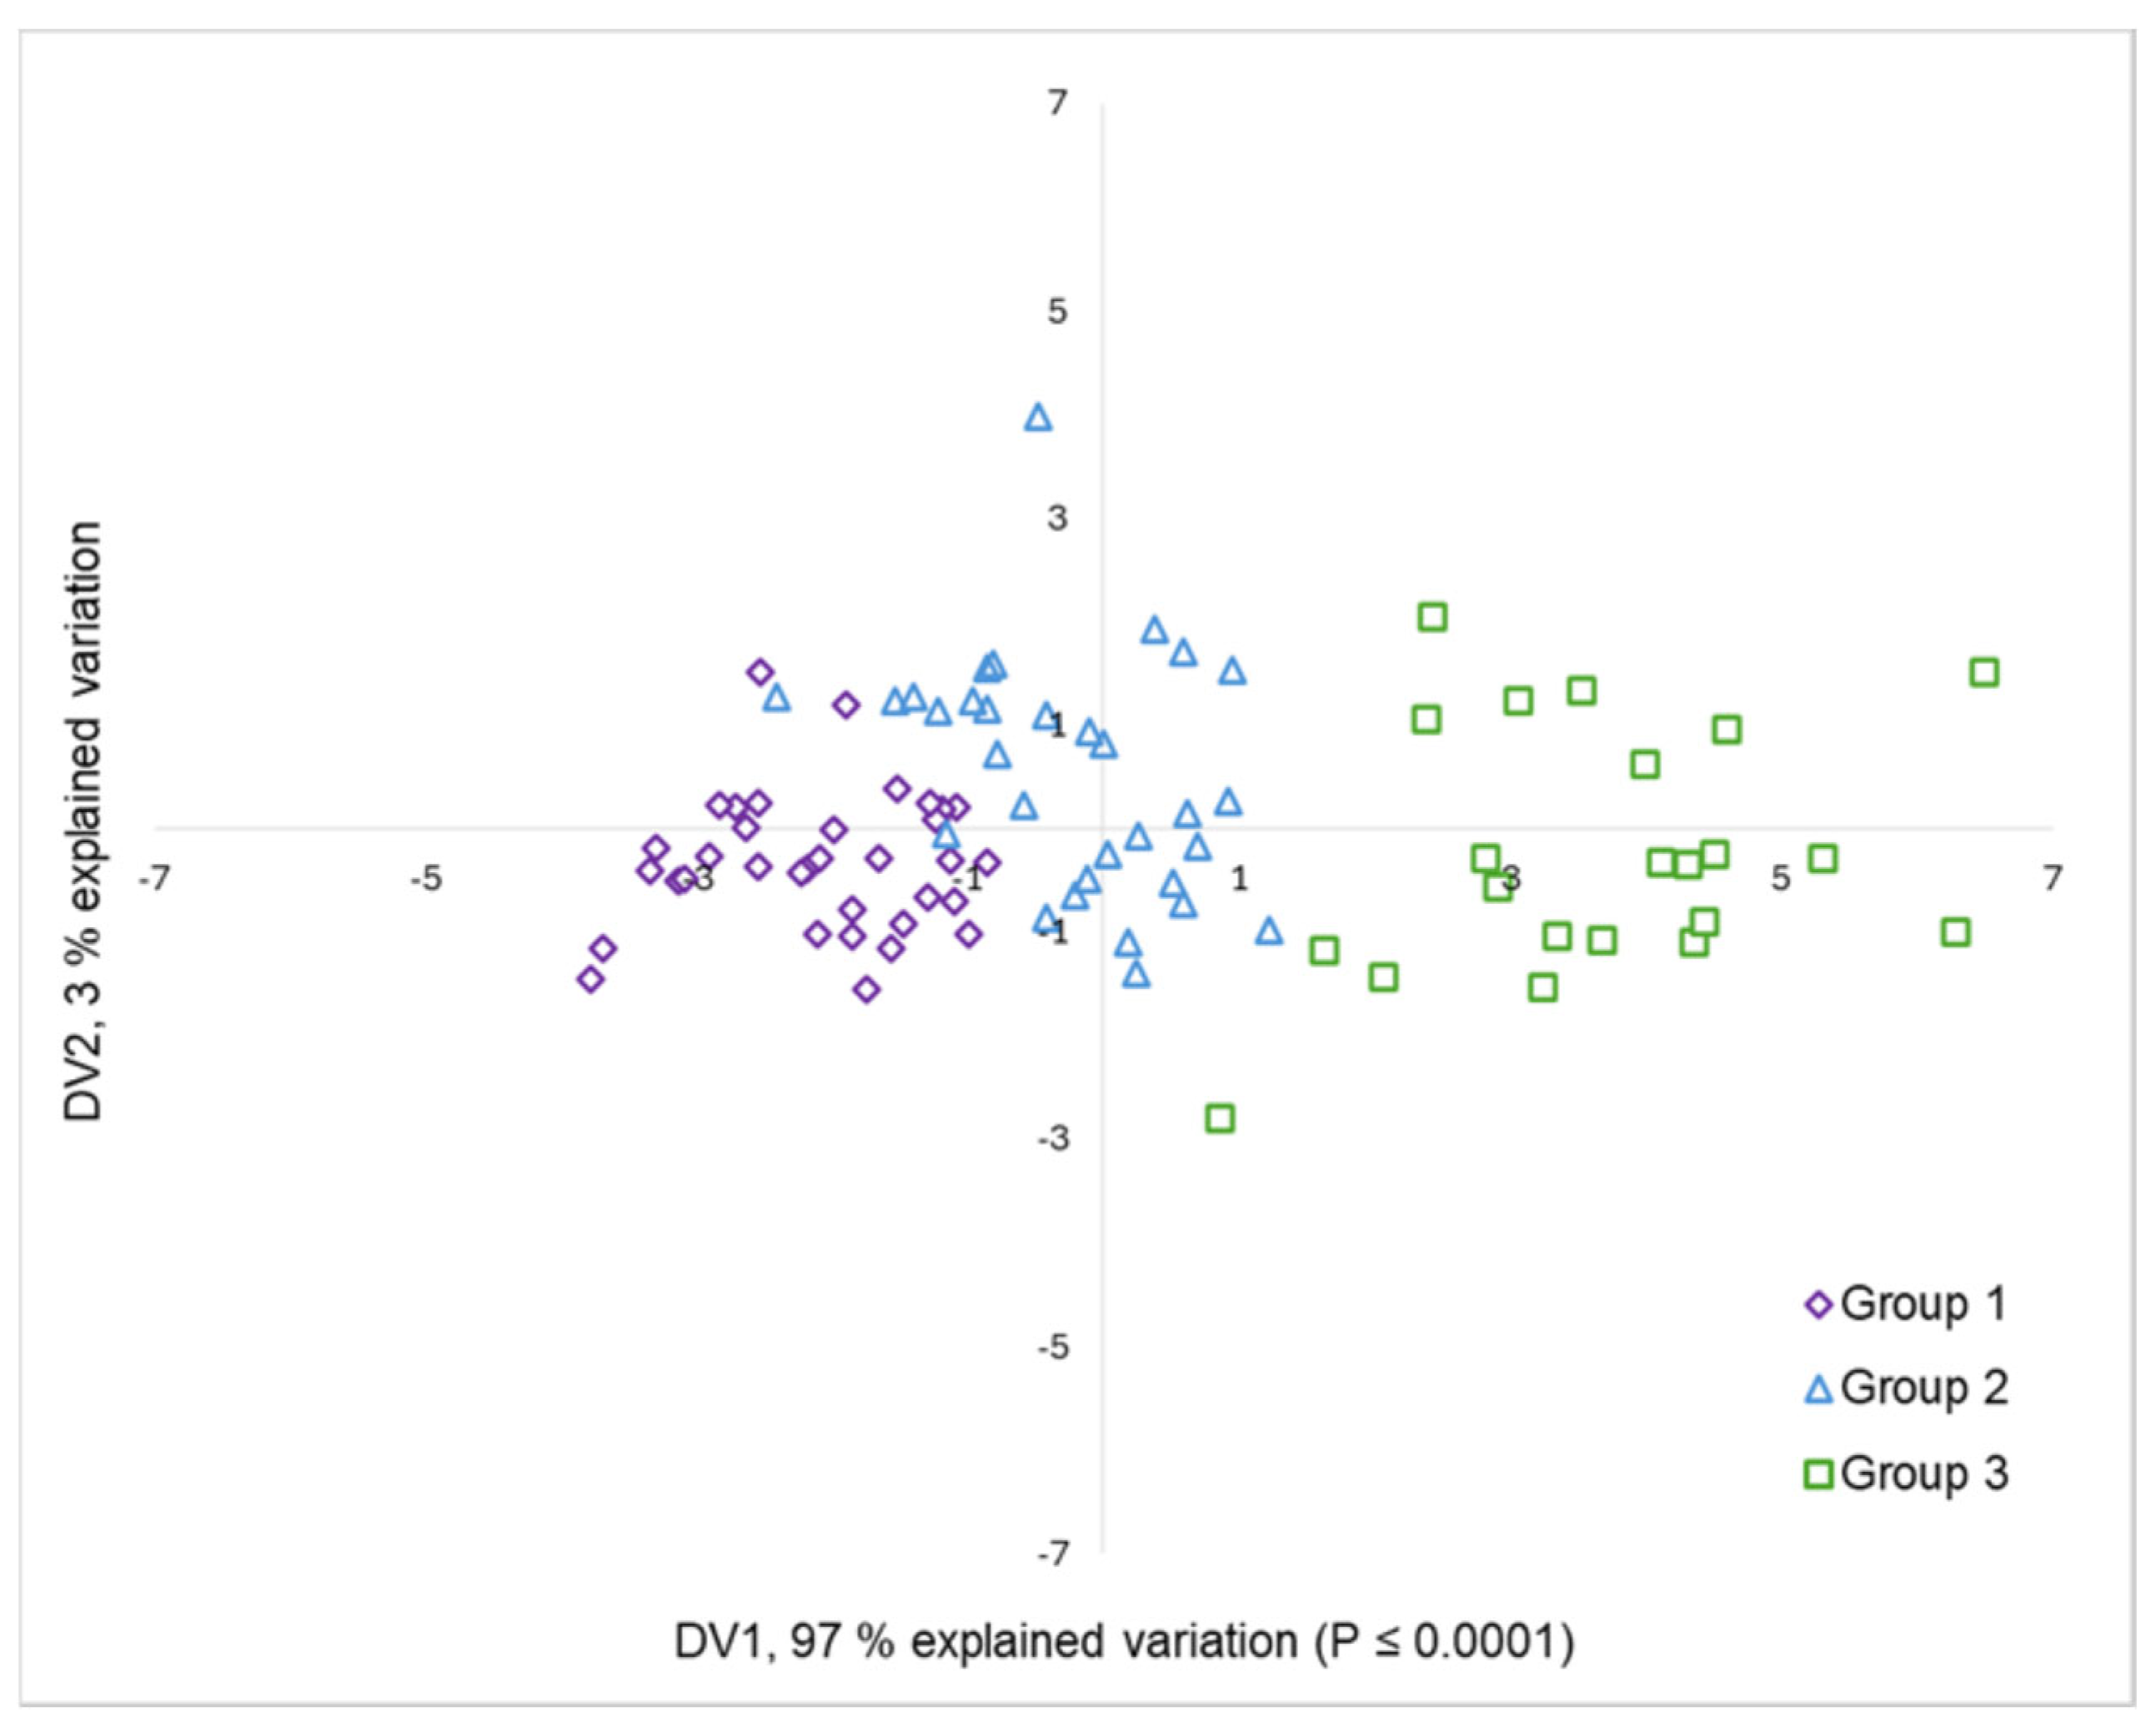
Figure 1. Tomato lines evaluated in a floating raft system.
Horticulturae 11 00532 g001
Figure 2. Hierarchical dendrogram generated from Gower’s distance and Ward’s minimum variance algorithm of NaCl tolerance indices of 93 experimental tomato lines evaluated under salt stress during germination.
Horticulturae 11 00532 g002
Figure 3. Graphical representation of discriminant variables of 93 tomato lines germinated under salinity conditions. DV1: discriminant variable 1; positive values are associated with a higher germination percentage, germination rate index and dry matter content and vice versa. DV2: discriminant variable 2 (not significant).
Horticulturae 11 00532 g003
Figure 4. Tomato seeds at the end of germination test. (A) Control without NaCl; (B) 80 mM NaCl; (C) control treatment; (D) 80 mM NaCl. Saline conditions induce seed death and root necrosis in tomato seedlings and reduce seedling length.
Horticulturae 11 00532 g004
Figure 5. Hierarchical dendrogram generated from Gower’s distance and Ward’s minimum variance algorithm of NaCl tolerance indices of 88 experimental tomato lines evaluated under salt stress during initial seedling development.
Horticulturae 11 00532 g005
Figure 6. Graphical representation of discriminant variables of 88 tomato (Solanum lycopersicum L.) seedlings under saline conditions. DV1: discriminant variable 1; positive values are associated with higher aerial and total dry matter content, as well as greater leaf area and vice versa. DV2: discriminant variable 2; positive values are associated with greater root length and seedling height and vice versa.
Horticulturae 11 00532 g006
Figure 7. Root length and leaf area of seedlings tomato. (A) Control without NaCl; (B) susceptible line to 150 mM NaCl; (C) tolerant line to 150 mM NaCl. Saline conditions significantly reduce leaf area and root length in susceptible lines, whereas in tolerant lines, leaf area is affected, but root volume tends to increase.
Horticulturae 11 00532 g007
Table 1. Eigenvectors of the discriminant variables DV1 and DV2 generated from indices of 93 experimental tomato (Solanum lycopersicum L.) lines during the germination stage.
VariableEigenvectorsDiscriminant Functions
DV1DV2DV1DV2
Total dry matter (TDM)0.98−0.121.56−2.39
Germination percentage (GP)0.960.250.372.24
Plumule length (PL)0.770.21−0.080.93
Radicle length (RL)0.49−0.22−0.20−0.24
Germination rate index (GRI)0.960.051.09−0.42
Table 2. Comparisons of NaCl concentration means for the traits evaluated in 93 tomato (Solanum lycopersicum L.) lines germinated under salinity and control conditions.
NaCl
(mM)
GP
(%)
GRI PL
(cm)
RL
(cm)
TDM
(mg)
080.62a6.84a3.40a1.08a0.028a
8050.87b2.04b1.94b0.58b0.015b
% Reduction37 70 43 47 44
HSD6.24 0.59 0.46 0.17 0.0029
GP: germination percentage, GRI: germination rate index, PL: plumule length, RL: radicle length, TDM: total dry matter, % Reduction: percentage reduction from 0 to 80 mM NaCl concentration. HSD: honestly significant difference. Means with the same letter within columns do not differ statistically (Tukey, p ≤ 0.05).
Table 3. Comparisons of means of the group × NaCl concentration interaction of 93 experimental tomato (Solanum lycopersicum L.) lines germinated under saline conditions. Comparisons are made within each group between control (0 mM NaCl) versus saline condition (80 mM NaCl).
NaCl
(mM)
GROGP
(%)
GRI PL
(cm)
RL
(cm)
TDM (mg)
0180.37b 6.44b3.32a1.00a0.03a
80130.26d1.06e1.33d0.44d0.01d
% Reduction 62 84 60 57 69
0286.37a7.85a3.40a1.06a0.03a
80275.07b3.38c2.52b0.73b0.02b
% Reduction 13 57 26 31 14
0376.82b6.41b3.46a1.14a0.03a
80348.38c1.78d1.96c0.57c0.01c
% Reduction 37 72 44 50 48
HSD 3.05 0.17 0.13 0.07 0.0012
GRO: group, % reduction: percentage reduction at 80 mM NaCl with respect to the control, GP: germination percentage, GRI: germination rate index, PL: plumule length, RL: radicle length, TDM: total dry matter, HSD: honestly significant difference. Means with the same letter within columns and group do not differ statistically (Tukey, p ≤ 0.05).
Table 4. Comparisons of means of the concentration-by-genotype interaction nested in a group of experimental tomato (Solanum lycopersicum L.) lines selected from a set of 93 lines, germinated under salinity conditions. Comparisons are made within each genotype between control (0 mM NaCl) versus saline condition (80 mM NaCl).
NaCl
(mM)
GENGROGP
(%)
GRI RL
(cm)
PL
(cm)
TDM
(mg)
0L4-1296a10.2a1.34a3.71a0.0258a
80L4-1284a5.1b1.11a3.10a0.0252a
% Reduction 13 50 17 17 2
0L45294a8.0a0.90a3.37a0.0306a
80L45280a3.5b0.66a2.63a0.0312a
% Reduction 15 56 27 22 102
0L52100a9.7a0.84a2.70a0.0299a
80L5294a4.6b0.68a2.19a0.0300a
% Reduction 6 53 19 19 103
0L9292a7.6a1.20a3.50a0.0328a
80L9278a3.3b0.77a2.57a0.0240a
% Reduction 15 57 36 27 27
0L92D298a9.9a0.94a3.15a0.0214a
80L92D291a4.1b0.54a2.16a0.0193a
% Reduction 7 59 43 32 10
0L29194a8.7a1.41a3.35a0.0403a
80L29136b1.3b0.43b1.59b0.0126b
% Reduction 62 84 70 53 69
0L33188a6.5a1.16a3.24a0.0402a
80L33138b1.4b0.42a1.56b0.0131b
% Reduction 57 79 64 52 67
0L40180a7.0a0.94a4.13a0.0256a
80L40127b1.0b0.33a1.64b0.0086b
% Reduction 66 86 65 60 66
0L41198a7.1a1.22a3.44a0.0354a
80L41138b1.2b0.55a1.28b0.0102b
% Reduction 61 83 55 63 71
0L73194a8.4a1.52a3.81a0.0416a
80L73136b1.1b0.45b1.755b0.0124b
% Reduction 62 87 70 54 70
HSD 34 1.8 0.78 1.47 0.0133
GEN: genotype, GRO: group, % reduction: percentage reduction when going from 0 to 80 mM NaCl concentration, GP: germination percentage, GRI: germination rate index, PL: plumule length, RL: radicle length, TDM: total dry matter, HSD: honestly significant difference. Means with the same letter within columns and genotype do not differ statistically (Tukey, p ≤ 0.05).
Table 5. Eigenvector of the variables generated from indices of 88 experimental tomato (Solanum lycopersicum L.) lines at seedling stage.
VariableEigenvectorsDiscriminant Functions
VD1VD2VD1VD2
Seedling height (SH)0.280.620.360.74
Root length (RL)0.070.23−0.290.09
Root dry matter (RDM)0.250.62−0.070.93
Aerial dry matter (ADM)0.97−0.11−1.761.83
Total dry matter (TDM)0.98−0.084.18−2.30
Leaf area (LA)0.620.310.020.05
Table 6. Comparisons of concentration means for the traits evaluated in 88 seedlings of experimental tomato (Solanum lycopersicum L.) lines under salinity conditions.
NaCl
(mM)
SH
(cm)
RL
(cm)
RDM
(g)
ADM
(g)
TDM
(g)
LA
(cm2)
018.3a44.0a0.2a2.1a2.3a702.2a
15010.2b38.0a0.5a1.8a2.3a348.5b
% Reduction44 14 −187 13 0 50
HSD7.5 6.7 0.4 1.2 1.6 248.9
CV12.3 12.5 34.1 37.5 35.3 21.0
% reduction: percentage reduction when going from 0 to 150 mM NaCl concentration (negative values indicate evaluated trait’s increases in the saline condition), SH: seedling height, RL: root length, RDM: root dry matter, ADM: aerial dry matter, TDM: total dry matter, LA: leaf area, HSD: honestly significant difference. Means with the same letter within columns did not differ statistically (Tukey, p ≤ 0.05).
Table 7. Comparisons of group-by-concentration interaction means of 88 seedlings of tomato (Solanum lycopersicum L.) lines under salinity conditions. Comparisons are made within each group between control (0 mM NaCl) versus saline condition (150 mM NaCl).
NaCl
(mM)
GROSH
(cm)
RL
(cm)
RDM
(g)
ADM
(g)
TDM
(g)
LA
(cm2)
0119.5a44.9a0.19c2.65a2.85a771.5a
150110.3d38.1b0.51a1.84bc2.35b351.7de
% reduction 47 15 −163 31 17 54
0218.4b43.7a0.16c2.07b2.24b718.8b
150210.5d38.3b0.50a1.89bc2.39b366.3d
% reduction 43 13 −201 9 −7 49
0316.0c42.9a0.13c1.15d1.29c559.1c
15039.4e37.1b0.42b1.64c2.07b317.0e
% reduction 42 14 −219 −42 −61 43
HSD 6.42 1.97 0.062 0.28 0.31 40.16
GRO: group, % reduction: percentage reduction when going from 0 to 150 mM NaCl concentration (negative values indicate evaluated trait’s increases in the saline condition), SH: seedling height, RL: root length, RDM: root dry matter, ADM: aerial dry matter, TDM: total dry matter, LA: leaf area, HSD: honestly significant difference. Means with the same letter within columns and group do not differ statistically (Tukey, p ≤ 0.05).
Table 8. Comparisons of means of tomato genotypes of Group 3 under two NaCl concentrations at seedling stage. Comparisons are made within each genotype between control (0 mM NaCl) versus saline condition (150 mM NaCl).
NaClGENSH
(cm)
RL
(cm)
RDM
(g)
ADM
(g)
TDM
(g)
LA
(cm2)
0L1318.3a50.5a0.109a0.99a1.10a518.7a
150L139.4b41.0a0.449a1.42a1.87a316.2a
% reduction 49 19 −313 −44 −70 39
0L2014.7a36.8a0.129a1.01a1.14a683.0a
150L208.8a36.2a0.357a1.41a1.77a340.3a
% reduction 40 2 −176 −39 −55 50
0L4314.5a40.8a0.090a0.68a0.77a455.7a
150L438.9a34.3a0.269a1.18a1.45a244.2a
% reduction 39 16 −198 −72 −87 46
0L510.2a46.3a0.111a0.76a0.87a344.4a
150L58.4a33.7a0.204a1.06a1.27a205.0a
% reduction 18 27 −84 −40 −45 40
0L7515.1a37.8a0.085a0.84a0.93a409.1a
150L7510.1b34.8a0.369a1.46a1.83a277.8a
% reduction 33 8 −334 −74 −97 32
0L4115.2a37.8a0.091a0.95a1.04a420.6a
150L418.8b39.5a0.369a1.43a1.80a279.0a
% reduction 42 −5 −305 −51 −73 34
0L814.1a46.5a0.1a0.8a0.9a387.6a
150L87.6b44.0a0.4a1.2a1.5a280.1a
% Reduction 46 5 −186 −49 −68 28
0L678.0a26.3a0.0a0.2a0.3a130.5a
150L674.4b27.8a0.1a0.4a0.5a114.6a
% Reduction 44 −6 −150 −79 −89 12
0L4-318.6a33.0a0.1a1.0a1.1a487.4a
150L4-38.6b32.3a0.3a1.4a1.8a252.9b
% reduction 53 2 −196 −40 −55 48
0L5313.7a44.3a0.2a0.9a1.0a343.1a
150L538.3b31.2a0.3a1.8a2.2a230.3a
% reduction 39 30 −103 −107 −107 33
GEN: genotype, GRO: group, % reduction: percentage reduction when going from 0 to 150 mM NaCl concentration (negative values indicate evaluated trait’s increases in the saline condition), SH: seedling height, RL: root length, RDM: root dry matter, ADM: aerial dry matter, TDM: total dry matter, LA: leaf area. Means with the same letter within columns and genotype do not differ statistically (Tukey, p ≤ 0.05).
Table 9. Clustering groups for tomato (Solanum lycopersicum L.) lines in salinity tolerance tests at germination and seedling stages.
Germination Tolerant
Group 2
Intermediate Tolerance Group 3Susceptible
Group 1
Seedling
Tolerant
Group 3
L5, L13, L28, L43, L53, L54, L68L4-3, L8, L19, L35, L37, L47B1, L57, L75, RF1L7, L41, L67, L72, L88, SS5
Intermediate tolerance
Group 2
L9, L45, L48, L63, L78L2, L18, L22, L30, L31, L34, L47S2, L58, L59, L60, L69L10, 11-4, L14, L23, L29, L40, L47S8, L49, L61, L62, L73, L90, RF46
Susceptible
Group 1
L4-1, L12, L42, L44, L50, L55, L56, L64, L65, L66, L86, L91, L92D, RF12, SS2L3, L15, L24, L27, L36, L39, L46, L51, L51H, L52, L76H, L80, MERM, RF38, RF41L1, L6, L33, L74, L85, RF81
Disclaimer/Publisher’s Note: The statements, opinions and data contained in all publications are solely those of the individual author(s) and contributor(s) and not of MDPI and/or the editor(s). MDPI and/or the editor(s) disclaim responsibility for any injury to people or property resulting from any ideas, methods, instructions or products referred to in the content.

