Article

The Effect of the Ripening Period on the Quality Attributes of Pear Fruit

by
Smaranda-Oana Boghean
1,
Mădălina Militaru
2,*,
Eugenia Gherghina (Mareși)
2,3,
Radu E. Sestras
4,
Orsolya Borsai
4,
Andreea F. Andrecan
4,
Catalina Dan
4,
Adriana F. Sestras
5,* and
Anca Livia Butiuc-Keul
1
1
Department of Molecular Biology and Biotechnology, Faculty of Biology and Geology, Babeș-Bolyai University, 1 M. Kogalniceanu Street, 400084 Cluj-Napoca, Romania
2
Research Institute for Fruit Growing Pitesti, 402 Mărului Street, 117450 Mărăcineni, Romania
3
Doctoral School of Engineering and Management of Plant and Animal Resources, Horticulture, University of Agronomic Sciences and Veterinary Medicine of Bucharest, 59 Marasti Blv, District 1, 011464 Bucharest, Romania
4
Department of Horticulture and Landscape, University of Agricultural Sciences and Veterinary Medicine Cluj-Napoca, 3–5 Manastur Street, 400372 Cluj-Napoca, Romania
5
Department of Forestry, University of Agricultural Sciences and Veterinary Medicine Cluj-Napoca, 3–5 Manastur Street, 400372 Cluj-Napoca, Romania
*
Authors to whom correspondence should be addressed.
Horticulturae 2025, 11(5), 468; https://doi.org/10.3390/horticulturae11050468
Submission received: 5 April 2025 / Revised: 23 April 2025 / Accepted: 25 April 2025 / Published: 27 April 2025
(This article belongs to the Special Issue Rosaceae Crops: Cultivation, Breeding and Postharvest Physiology)

Abstract

:
Pear fruit quality is a key determinant of consumer preference, yet it remains insufficiently characterized in many newly developed cultivars. This study aimed to evaluate 25 pear genotypes (Pyrus communis L.), internationally renowned cultivars and new cultivars developed through Romanian breeding programs, with distinct ripening periods, using an integrative approach based on morphological, biochemical, and sensory traits. Standardized methods were applied to assess attributes including fruit size, firmness, soluble solids, organic acid composition, skin color, and hedonic sensory responses for taste, aroma, texture, and visual appeal. Results revealed significant variability across ripening groups, with several cultivars, such as ‘Paradox’, ‘Pandora’, ‘Isadora’, and ‘Daciana’, displaying favorable combinations of appearance, internal quality, and consumer-rated acceptability. ‘Paradox’ and ‘Pandora’ achieved the highest sensory scores, comparable to or surpassing those of commercial standards like ‘Packham’s Triumph’. Multivariate analyses confirmed trait correlations and distinct phenotypic profiles among cultivars. These findings underscore the utility of multidimensional quality assessment for selecting cultivars suited to modern market demands, both for fresh consumption and processing. Moreover, several genotypes demonstrated potential as parental sources in pear breeding programs targeting improved organoleptic and physicochemical traits. The study suggests that a differentiated sensory scoring approach, rather than a uniform 1–9 hedonic scale, may more effectively identify high-quality pear cultivars for breeding programs.

1. Introduction

Pears (Pyrus communis L.), one of the most ancient and widely consumed fruits, hold a unique position in global horticulture due to their nutritional value, sensory appeal, and cultural importance. Traditionally cultivated across Europe, Asia, and the Americas, pears have evolved into a broad spectrum of cultivars characterized by diversity in flavor, texture, appearance, and post-harvest behavior. Although pear consumption is universally promoted as part of a healthy diet [1], the global intake remains modest compared to other fruits [2]. This underlines the need for deeper attention to factors influencing consumer preference and satisfaction, some of them playing a central role such as fruit quality and particularly consumption quality.
The concept of fruit quality in pears extends beyond mere external appearance, encompassing a complex interplay between chemical, physical, and sensory attributes. Internal characteristics such as sweetness, acidity, texture, juiciness, and aroma are essential in defining the organoleptic profile of the fruit, whereas size, shape, color, and skin defects contribute to its commercial and visual appeal [3,4]. While breeders and producers have long focused on yield, resistance, and shelf life, consumer-centered research has revealed that consistent eating quality is a more decisive factor in purchasing behavior [5,6]. Indeed, sensory studies have shown that the ideal pear is juicy, has a melting and buttery texture, a balanced sweet–acidic taste, and a distinctive pear aroma while being free from defects like mealiness or grittiness [4,7].
The nutritional properties of pears further reinforce their role in a balanced diet [8,9,10]. They are low in calories and rich in dietary fiber, especially insoluble fiber, as well as vitamin C, potassium, and various polyphenolic compounds [11,12,13]. Numerous studies have highlighted their antioxidant, anti-inflammatory, and even anti-ulcerative potential [2,14,15,16,17]. The skin of the pear is particularly rich in phenolics, and while peeling can reduce antioxidant content, the whole fruit remains a beneficial food for gut health and metabolic regulation [18,19]. Moreover, epidemiological data suggest correlations between increased fruit intake, including pears, and lower incidences of cardiovascular and metabolic diseases [20,21,22].
However, ensuring these benefits reach consumers requires not just nutritional value but also better palatability and a positive sensory experience. Herein lies the importance of selecting cultivars not only for agronomic performance but also for superior sensory characteristics [23,24,25]. Over time, traditional cultivars such as ‘Williams Bon Chrétien’, ‘Abbé Fetel’ and ‘Beurré Bosc’ have retained their relevance, however, recent international breeding programs have introduced promising new cultivars [11,26,27], including in Romania [28,29], that more closely meet the expectations of modern consumers. New cultivars often combine attractive appearance with improved textural and flavor qualities, alongside more reliable post-harvest performance [7,30].
Organoleptic and sensory evaluation techniques are critical tools in assessing these qualities. Relying on human perception, sensory tests explore how fruits are experienced through taste, smell, sight, and touch [31]. When standardized and conducted under controlled conditions, they provide reproducible data that can link consumer preferences to specific chemical and physical traits [32,33]. Sensory attributes such as firmness, sweetness, acidity, juiciness, and aroma are closely correlated with instrumentally measured traits like soluble solids content, titratable acidity, firmness via penetrometer, and volatile profiles. For instance, a minimum of 11% soluble solids is generally required to meet the threshold of consumer acceptability in terms of flavor [3,32].
Evaluating these sensory and physicochemical parameters is particularly important when dealing with different harvest periods. Pears can be early-maturing, mid-season, or late-maturing, and their storage behavior varies accordingly [34]. For example, late cultivars like ‘Forelle’ require cold storage of at least 12 weeks to prevent mealiness and allow for full ripening potential [32]. On the other hand, early cultivars must maintain quality despite a shorter post-harvest period. This diversity complicates quality control and highlights the necessity of a cultivar-specific approach to harvesting, storage, and ripening management [35,36].
Consumer studies conducted in various markets emphasize that preferences vary but are generally guided by consistent parameters [6,37]. Most consumers favor pears with a recognizable pyriform shape, a bright but natural color (especially light green or with a soft blush), and internal qualities like a melting texture, sweet taste, and characteristic aroma. A segment of consumers, however, shows a preference for firmer and crispier textures, suggesting a potential market for both traditional European and Asian pear types [2,4]. Such insights further support the application of sensory testing as a decisive tool in cultivar selection and commercialization strategies [38,39].
This study aims to assess the fruit quality of 25 pear cultivars with different ripening periods (early, autumn, and late), including both newly developed Romanian cultivars and internationally recognized ones. The main objective is to analyze how morphological, biochemical, and sensory traits vary among cultivars and ripening stages. Through standardized methods of evaluation, the study seeks to identify cultivars that combine attractive appearance with internal qualities valued by consumers, such as taste, aroma, and texture. The findings are intended to support the selection of high-performing cultivars for fresh consumption and provide practical insights for pear breeding programs and market-oriented strategies.

2. Materials and Methods

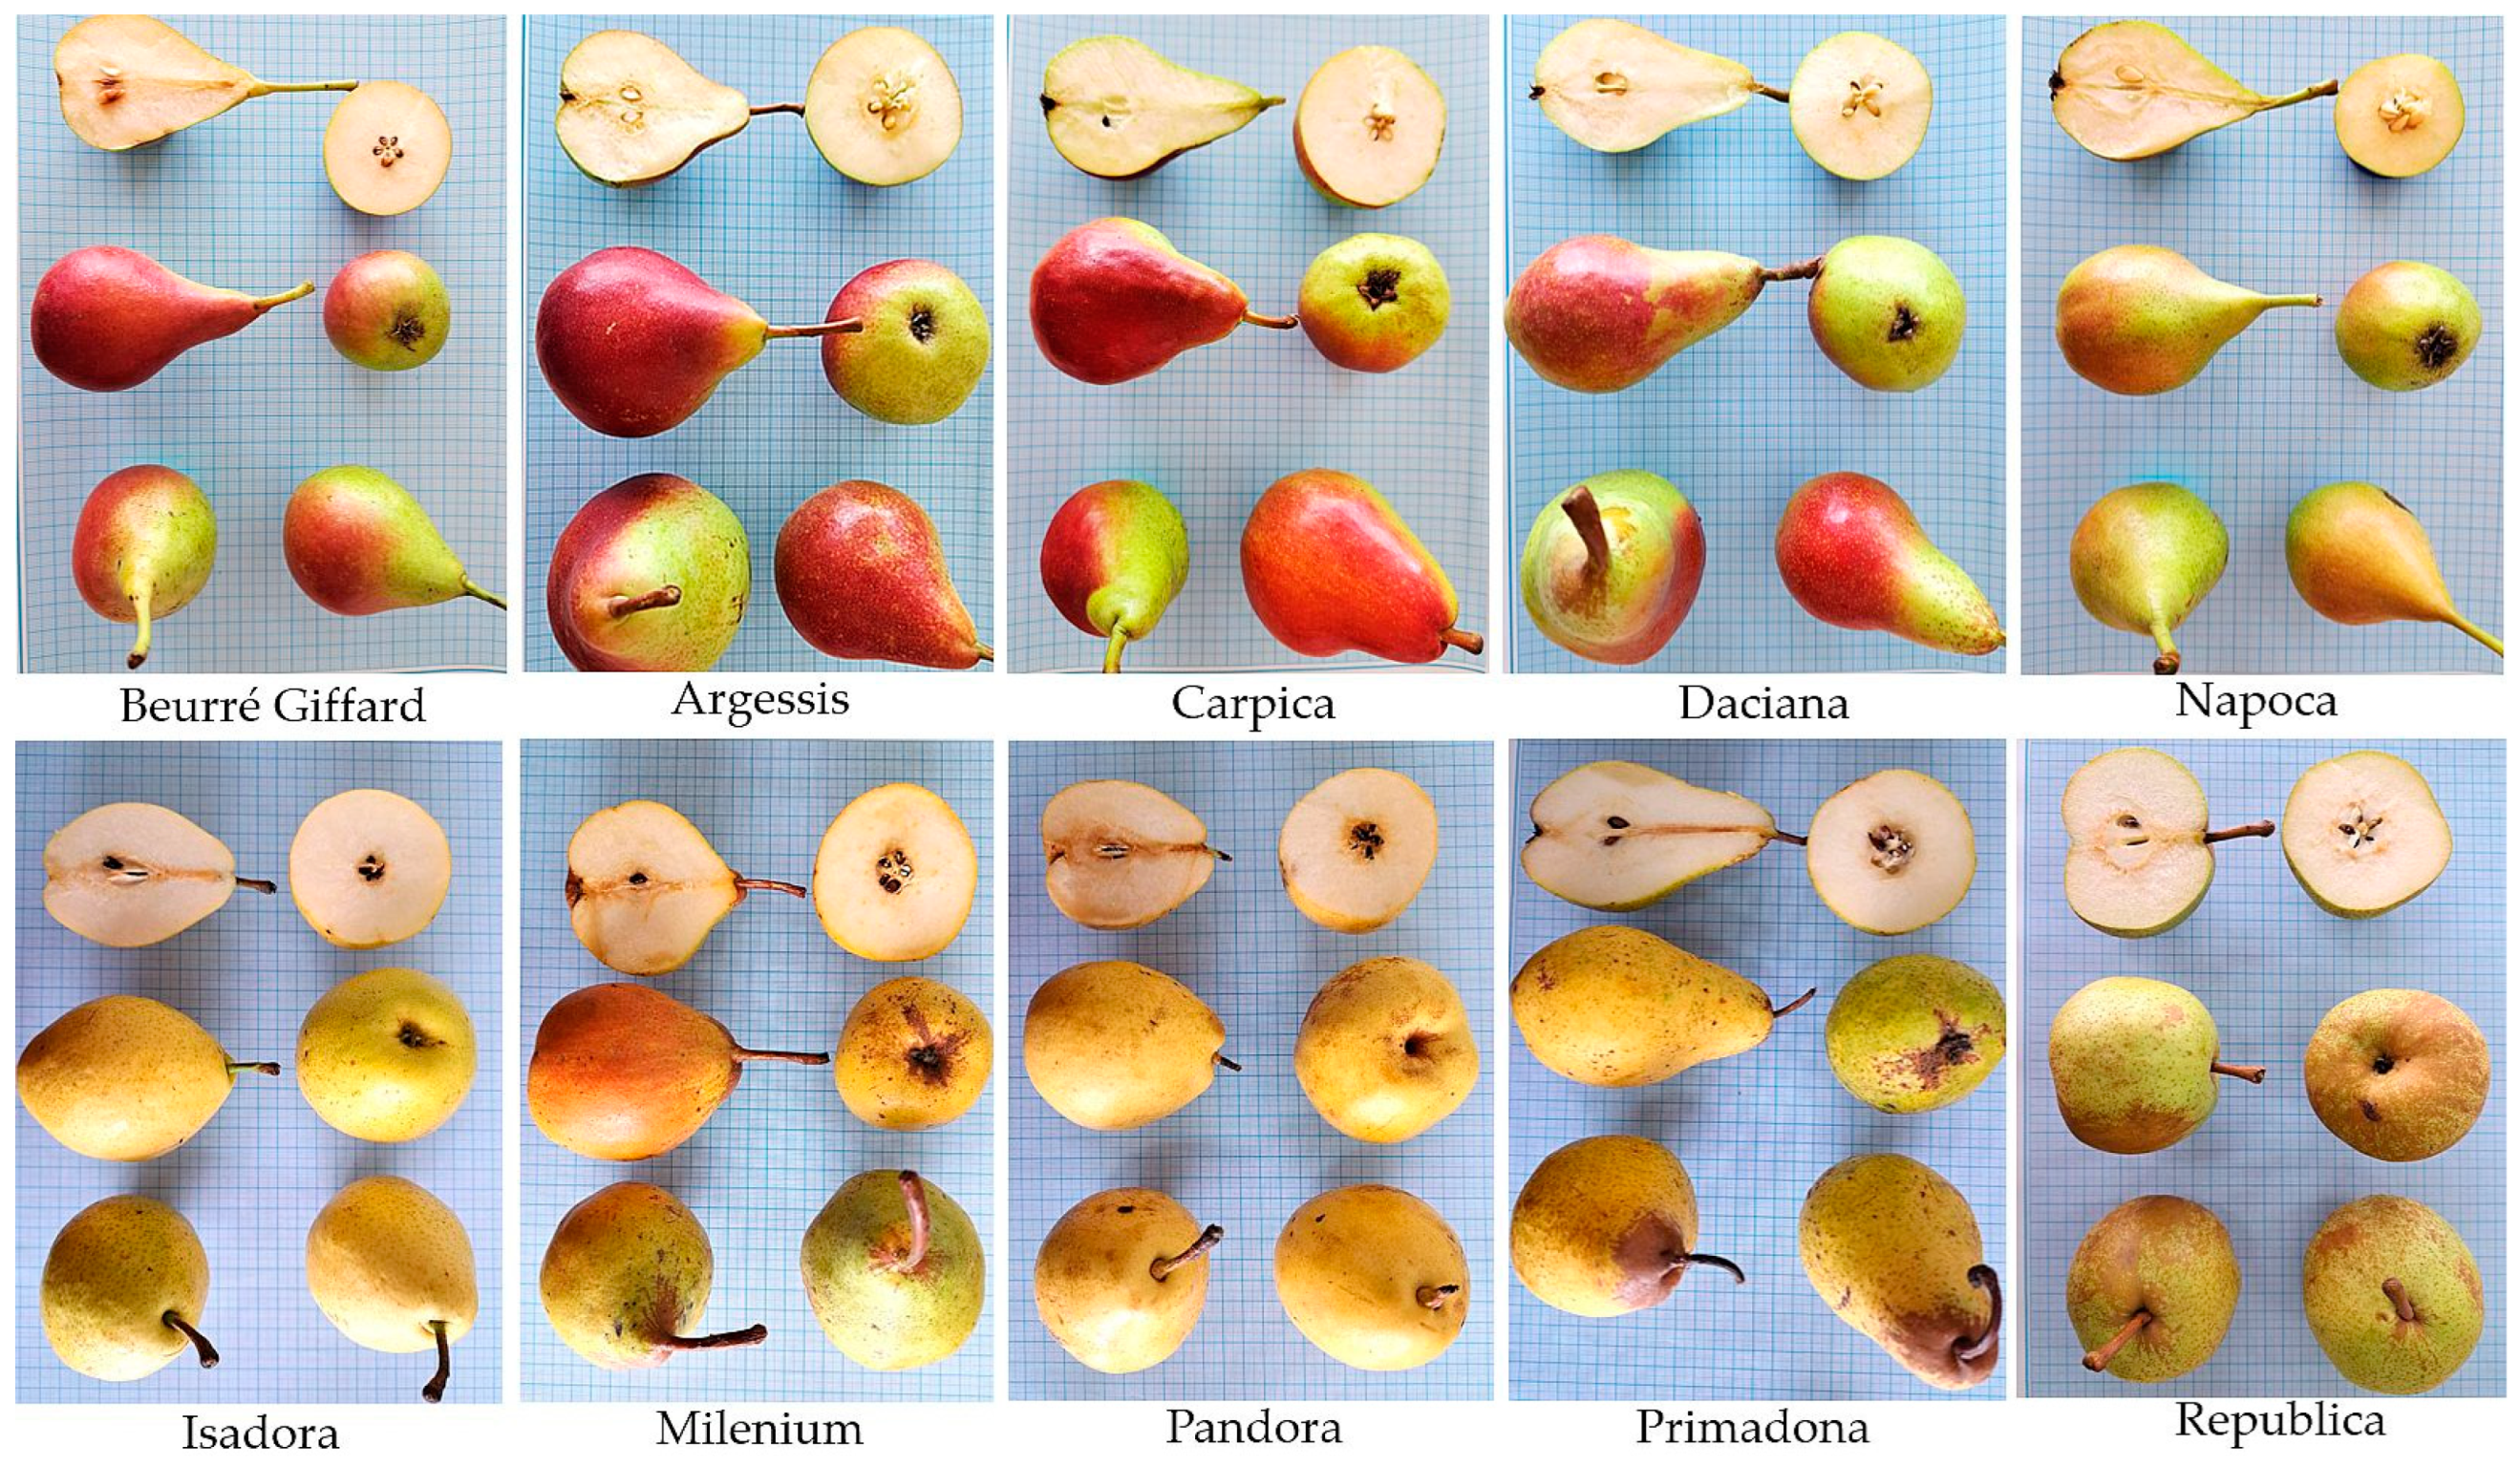
2.1. Biological Material

The biological material used in this study consisted of pear fruits collected from cultivars maintained in the germplasm collection of the Research Institute for Fruit Growing (RIFG) Pitești-Mărăcineni, Romania (44.8992° N latitude and 24.8596° E longitude). The fruits were harvested at optimal ripeness (i.e., eating-ripe stage for early and autumn cultivars) and immediately refrigerated at 4.0 ± 1.0 °C to preserve quality (or to reach optimal consumption maturity for late-ripening cultivars) until analysis. The samples were maintained under these controlled conditions until comprehensive morphological, biochemical, and organoleptic evaluations were performed. The cultivars were classified according to their fruit ripening period and analyzed based on three distinct groups: early-ripening cultivars (July–mid-August), mid-season, autumn cultivars (ripening between late August and October), and late-ripening winter cultivars (maturing from October onward). In the early-ripening group, six cultivars were analyzed, including five Romanian-bred cultivars and one international cultivar, ‘Beurré Giffard’, included as a reference (Figure 1). The autumn group comprised ten cultivars, of which eight were of Romanian origin and two were internationally well known and widely cultivated around the world: ‘Packham’s Triumph’ and ‘Williams Bon Chrétien’ (hereafter called ‘Williams’). For the late-ripening group, nine Romanian cultivars were included in the analysis. Most of the Romanian cultivars evaluated in this study were developed at the RIFG, at the Horticulture Research Station (HRS) Cluj, and at the Research Station for Fruit Growing (RSFG) Voinești, Dâmbovița, reflecting decades of dedicated national breeding efforts.

2.2. Assessment of Morphological and Biochemical Attributes of Fruits

In order to assess fruit quality, standardized measurements were performed to evaluate the external and internal attributes of the pear cultivars. The assessment of external quality included parameters related to fruit dimension (height and average diameter), weight, and skin color, on the sunny (SU) and shaded (SH) parts of fruits. Individual fruit weight was recorded using a precision electronic balance, and the number of seeds per fruit was also analyzed. Skin color was determined instrumentally on two opposite sides of each fruit using a Konica Minolta CR-400 chroma meter. Measurements were based on the CIE Lab* color space [40], where L* represents brightness (ranging from black to white), a* denotes the green-red axis, and b* corresponds to the blue-yellow axis. The a* and b* values were used to describe the chromatic aspects of pear skin color, reflecting changes along the green-red (a*) and blue-yellow (b*) axes. These values provide a useful basis for assessing ripening-related color variation and consumer visual appeal. The evaluation of internal fruit quality included measurements of firmness, total soluble solids (TSS), pH, and titratable acidity. Fruit firmness, a key trait for both texture and storability, was determined using a digital penetrometer (Bareiss Qualitest HPE-II-FFF, Oberdischingen, Germany). Measurements were taken at two equidistant points on opposite sides of the fruit, after the removal of a thin layer of skin, using a 5 mm plunger tip. Total soluble solids content, expressed in °Brix, was measured with a portable digital refractometer (Hanna HI 96801, Hanna Instruments Ltd., Leighton Buzzard, United Kingdom) using freshly extracted juice from each sample. This parameter provides an indirect estimation of sugar content and is closely linked to perceived sweetness [41]. In parallel, titratable acidity and juice pH were assessed using the Hanna HI 84532 (Hanna Instruments Ltd., Leighton Buzzard, United Kingdom)) automatic mini-titrator, which allows the accurate quantification of organic acid content as titratable acidity (separately as a percentage of malic, citric and tartaric acids) and acid–base balance, both critical to the flavor profile and postharvest stability [42].

2.3. Assessment of Organoleptic Attributes of Fruits

The organoleptic evaluation of the pear fruits was carried out through structured tasting sessions designed to assess both external and internal sensory attributes. The trials were conducted using standardized tasting forms entitled “Bulletin for Assessing the Organoleptic Quality of Fruits”, which included hedonic scales ranging from 1 (extremely disliked) to 9 (extremely liked) [43]. The tasting forms included assessment fields for both extrinsic and intrinsic fruit characteristics. External traits—specifically size, shape, and skin color—were considered primary components of visual appeal and commercial value. Intrinsic features were evaluated through attributes such as pulp color, texture consistency, juiciness, taste, and aroma. All traits were rated individually on a 9-point scale. Lower scores were assigned to samples exhibiting negative attributes such as poor taste or mealy texture, whereas higher scores were attributed to fruits with desirable sensory qualities, including intense aroma, balanced sweetness, and firm and juicy flesh.
The evaluation was carried out by a panel of 20 participants, specialists in fruit trees or related disciplines, equally divided by gender. The scoring system and protocol were designed to quantify subjective sensory evaluations reproducibly, based on the conclusion of Hampson et al. [44], who demonstrated that a minimum panel of eleven expert judges provides statistically discriminative power (p < 0.05) for 1-point differences on a 0–9 scale. Tastings were conducted during the optimal consumption period for each cultivar to ensure that fruit maturity enabled the full expression of commercial and organoleptic potential. For each varietal group, two evaluation sessions were held with a 24 h interval. Evaluators received bowls containing 5–6 fruits per sample to facilitate visual assessments (e.g., size, shape, and color). From these, a minimum of two fruits per sample were sectioned with a knife for tasting. All samples were anonymized to prevent cultivar recognition bias. Prior to evaluation, panelists received standardized instructions on assessment criteria to ensure scoring consistency. To mitigate sensory fatigue and maintain accuracy, participants were asked to refrain from eating for at least two hours before the tasting and were provided with water and unsalted bread for palate cleansing between samples.

2.4. Statistical Analysis

To characterize the primary traits of the pear fruits, statistical evaluations were performed using average values derived from morphological, biochemical, and sensory measurements. Therefore, the synthetic data of the analyzed traits are presented as mean ± SEM (standard error of the mean). Prior to analysis, the distribution of data was assessed for normality to ensure the validity of parametric tests. A one-way analysis of variance was applied to examine the statistical significance of differences among measured variables. In the case of significant differences, Duncan’s post hoc test was used to identify specific pairwise contrasts among the group means, with attention given to the delineation of variability in fruit quality traits. The level of statistical significance was defined as p < 0.05. Comparative assessments among cultivars, categorized by their ripening season, were further explored through boxplot visualization. These graphical representations provided detailed insights into data dispersion and central tendency, illustrating minimum and maximum values, interquartile ranges, medians, and mean, thereby supporting a clearer interpretation of trait variation across groups. The overall pear quality score by cultivar groups depending on ripening time was analyzed with Kruskal–Wallis test and Dunn’s post hoc test.
For a broader understanding of the relationships among variables and cultivars, multivariate statistical techniques were employed. Prior to these analyses, all data were normalized to eliminate scale differences and ensure the comparability of variables across different units. PAST software (Past4.09) [45] was used to perform Pearson correlations and principal component analysis (PCA), providing a dimensionality reduction and pattern recognition between features. Additionally, hierarchical clustering was carried out using the single linkage method and Gower’s similarity coefficient to examine grouping patterns and proximities between cultivars based on their overall fruit characteristics.

3. Results

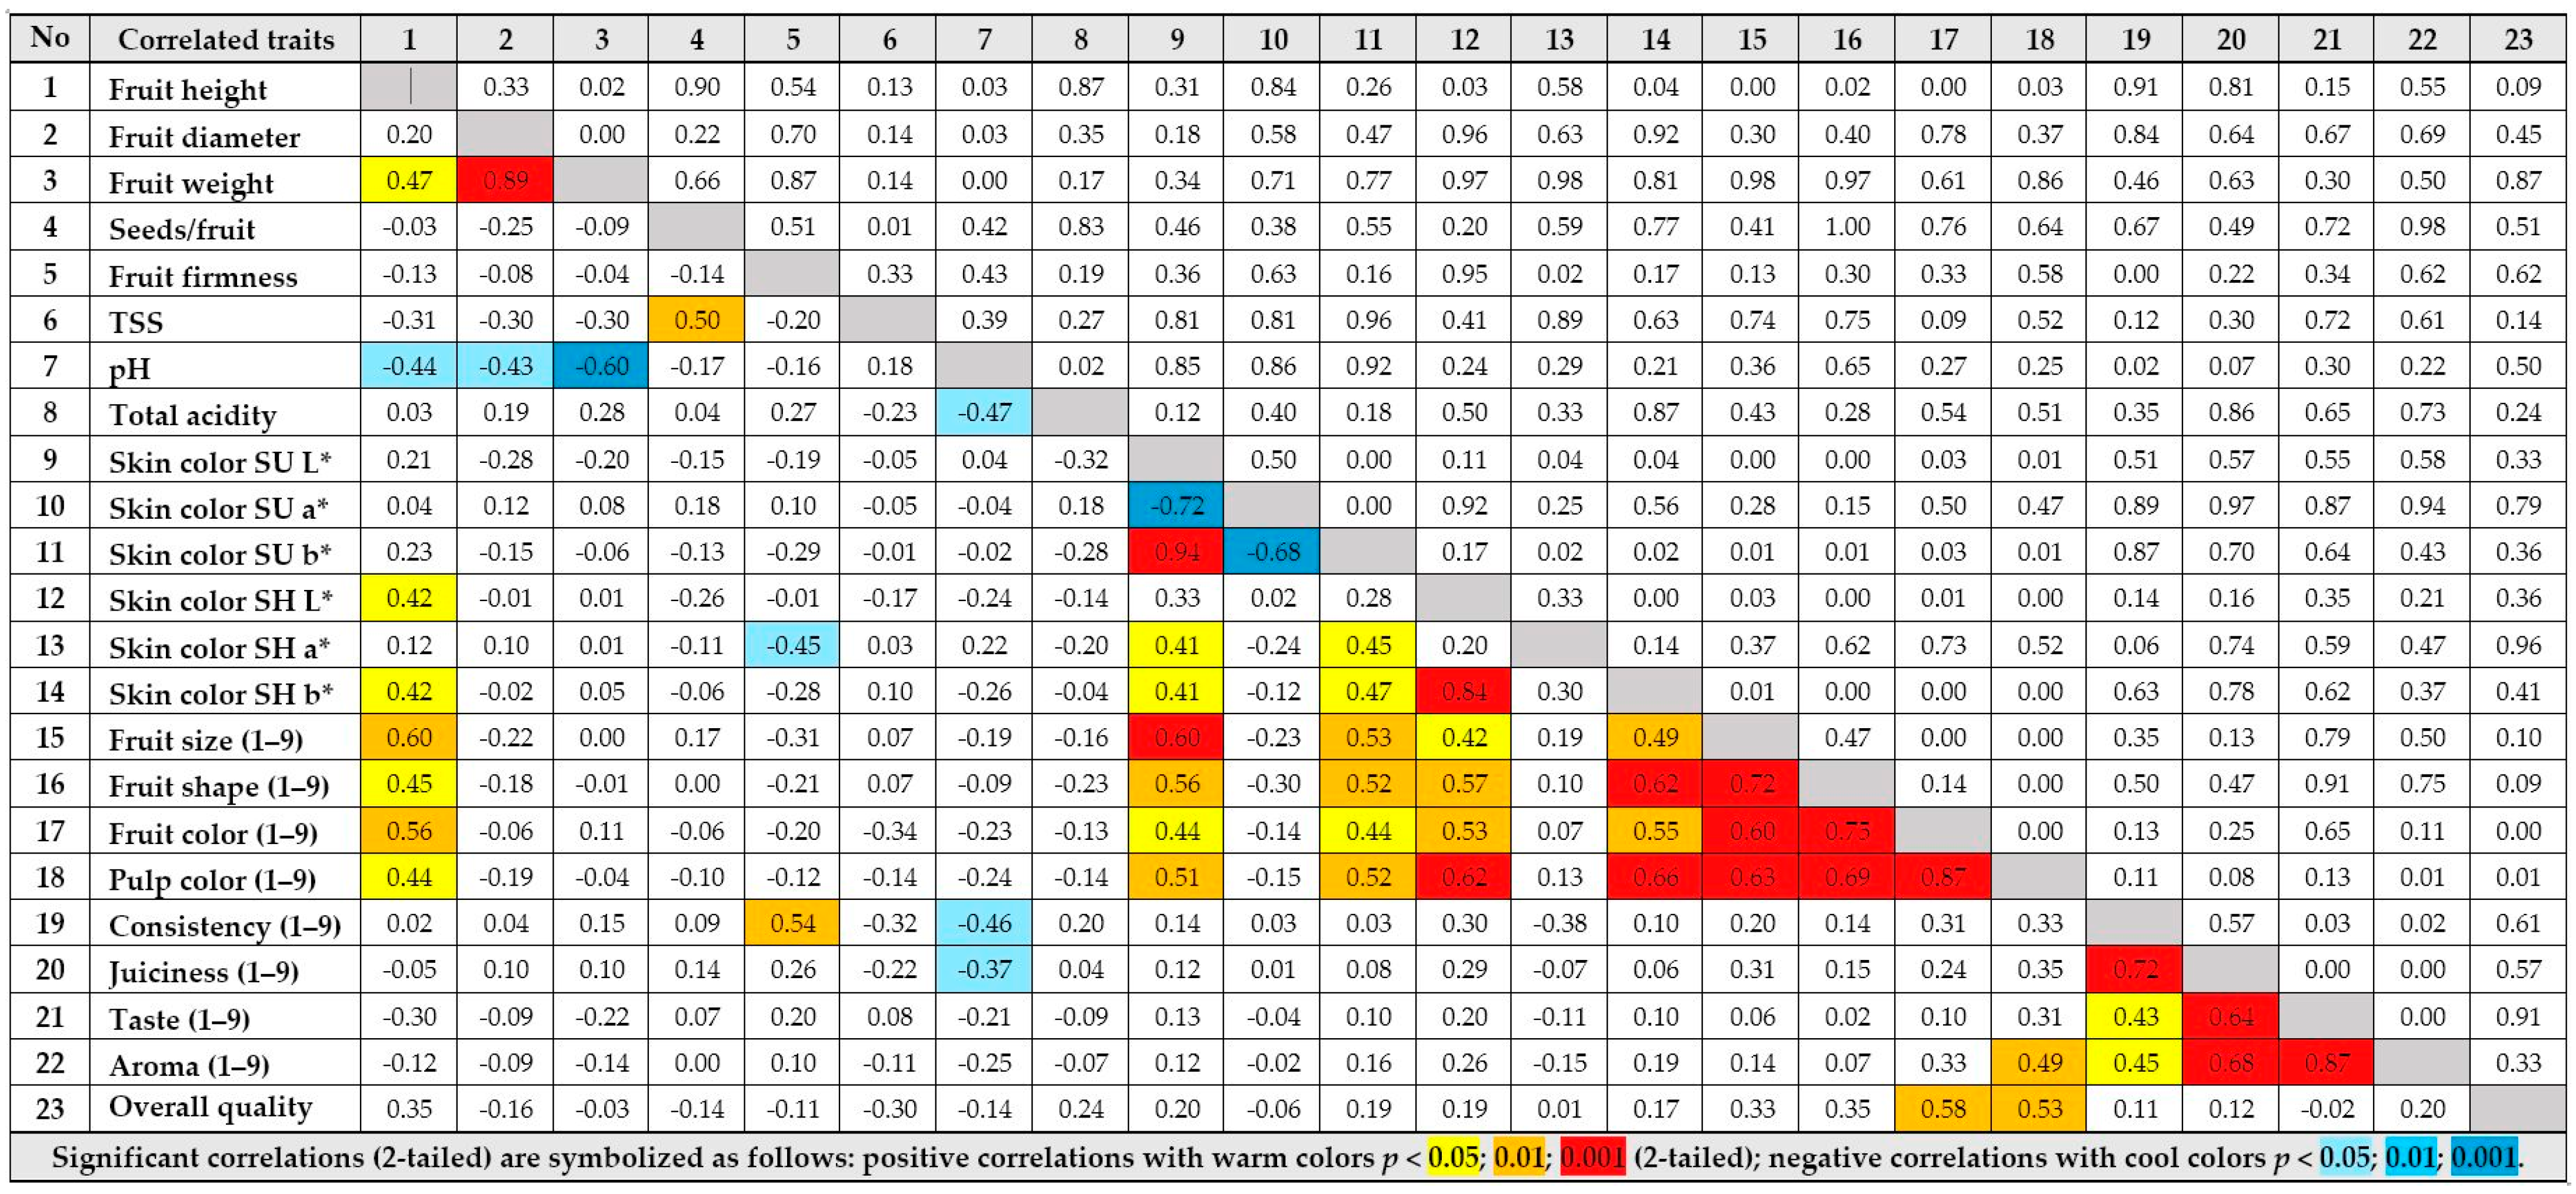
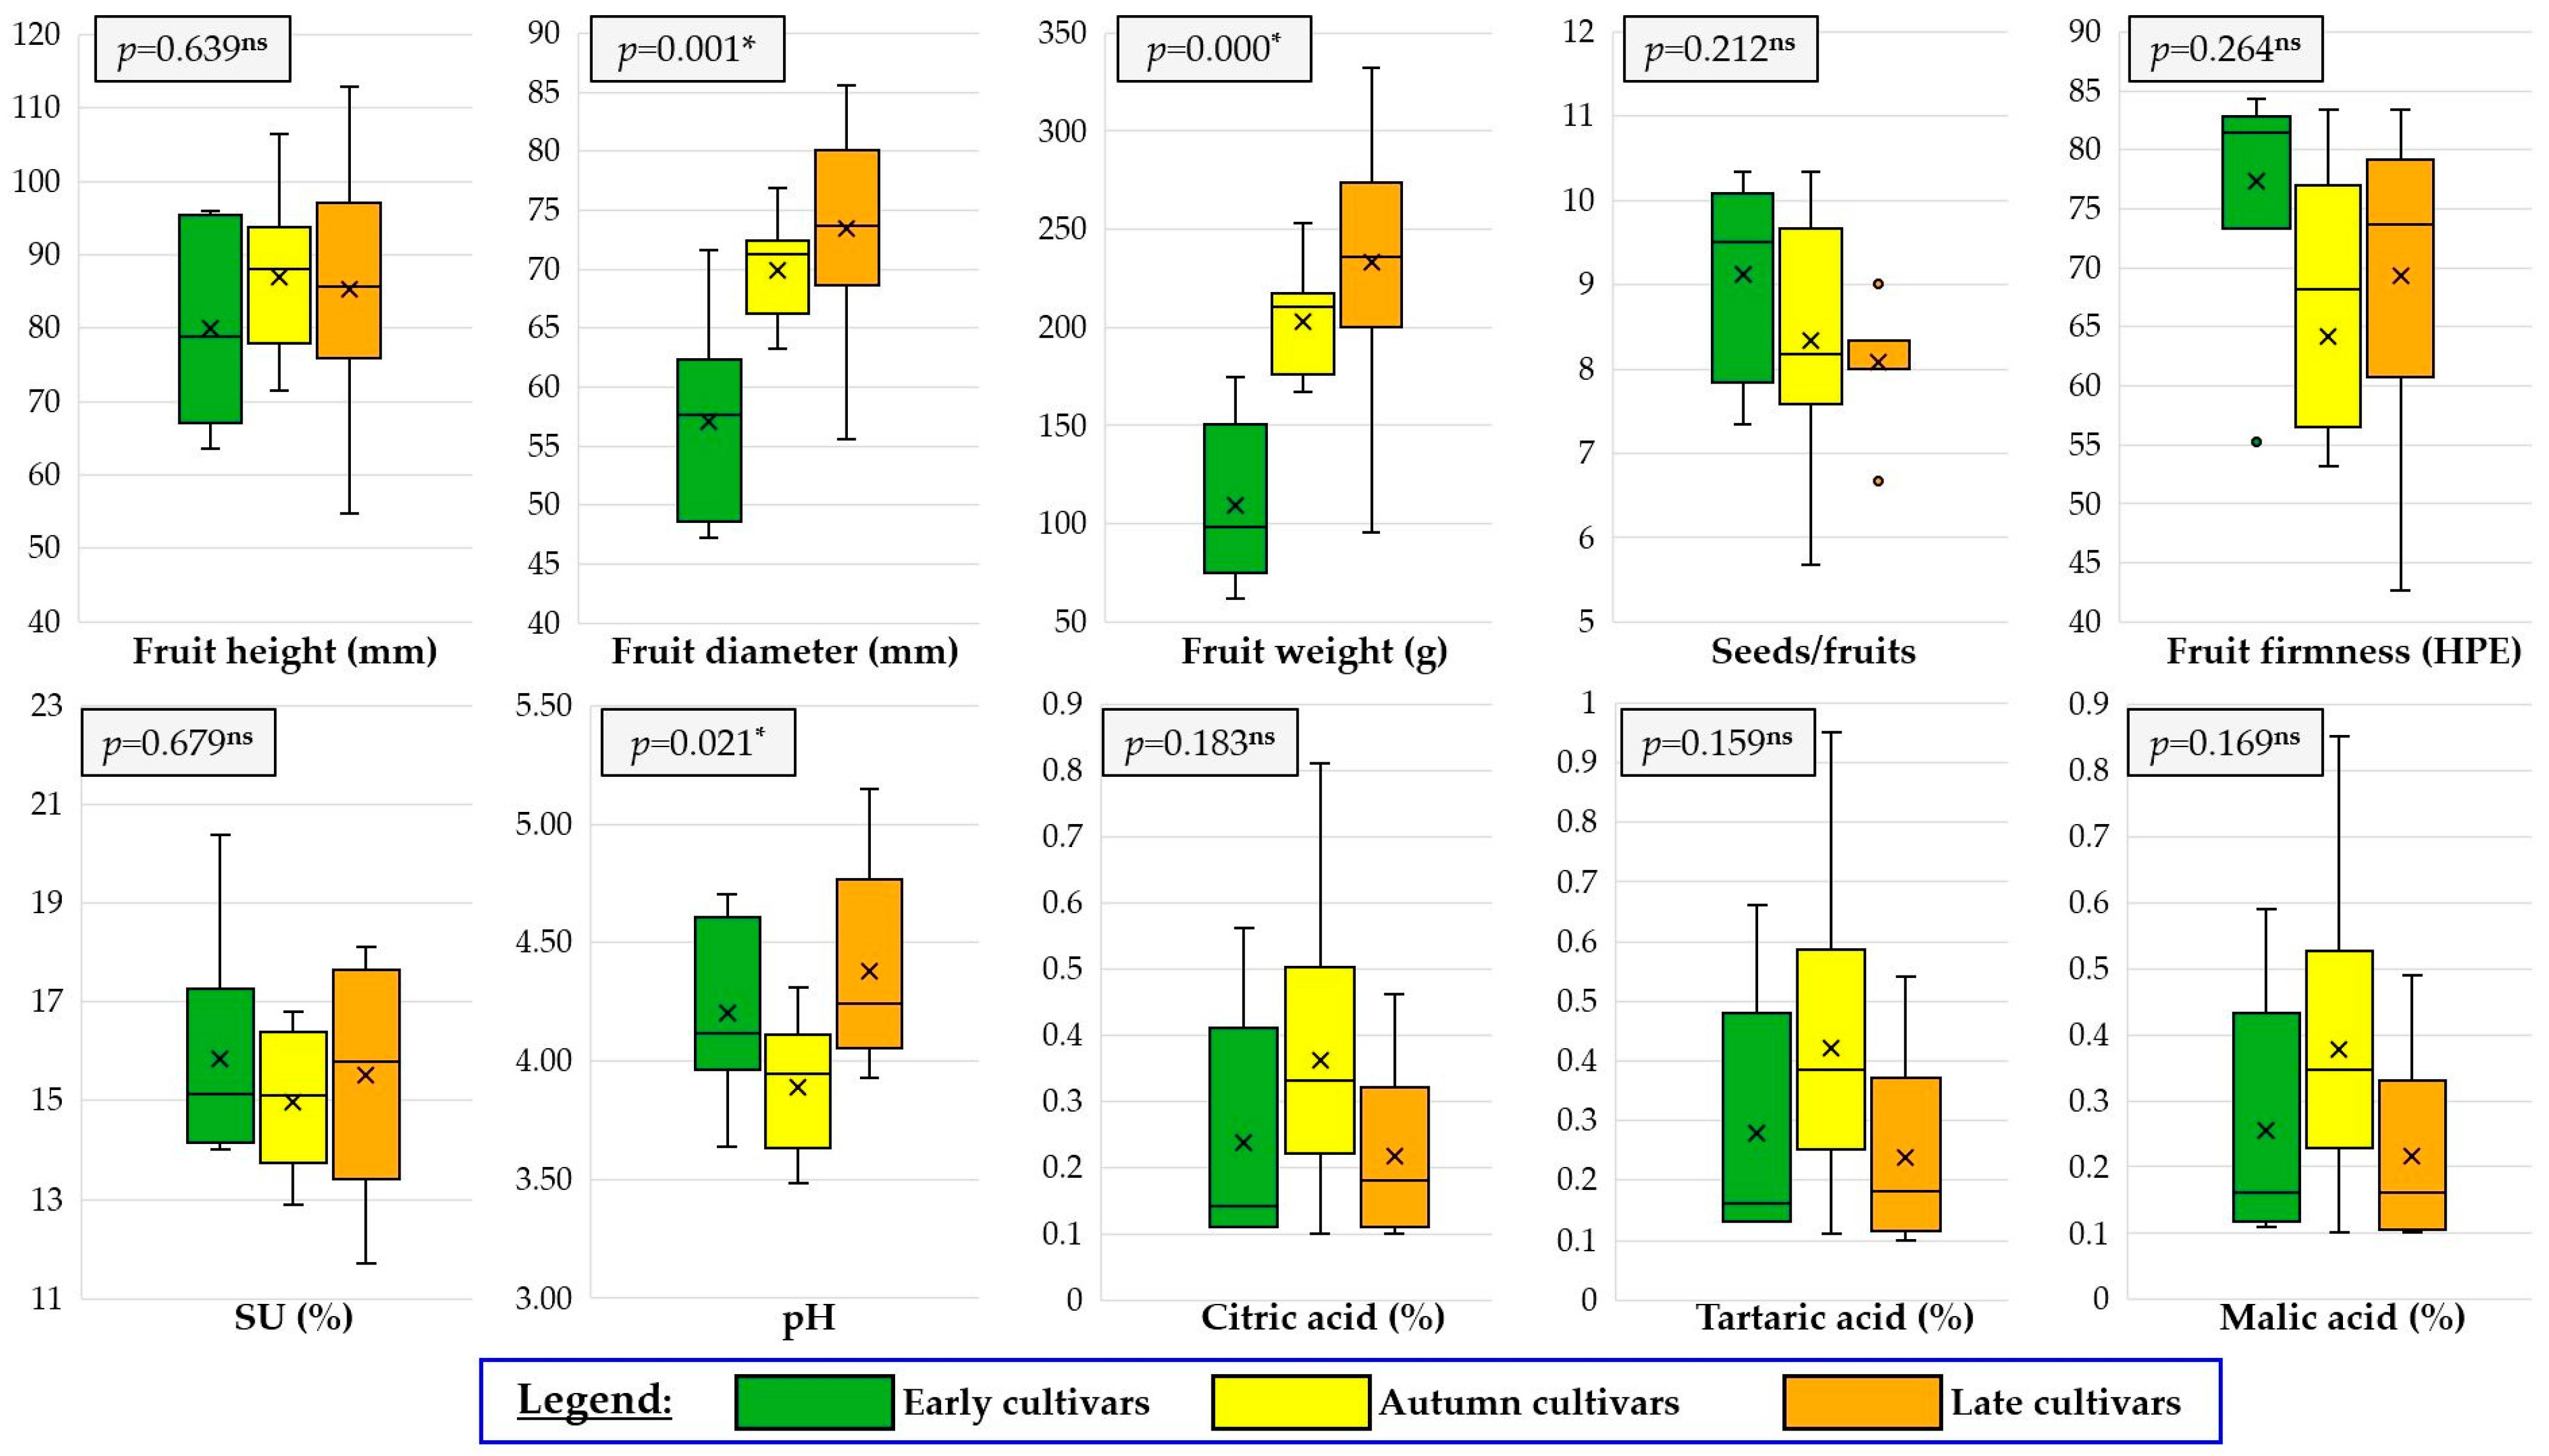
3.1. Morphological, Biochemical, and Colorimetric Attributes of Fruits

The main morphological attributes of the fruits summarized in Table 1 showed that the height of the pears varied significantly in the six early-ripening cultivars, ranging from 63.4 mm in ‘Beurré Giffard’ to 95.8 mm in ‘Argessis’. The largest fruits, in terms of both size and weight, were observed in ‘Argessis’ (174.2 g), while ‘Beurré Giffard’ produced the smallest (61.4 g). The number of seeds per fruit was highest in ‘Beurré Giffard’ (10.33) and lowest in ‘Triumf’ (7.33). Physicochemical measurements highlighted that fruit firmness was lowest in ‘Triumf’ (55.2 HPE) and highest in ‘Beurré Giffard’ (84.3 HPE). Among the ten autumn-ripening cultivars, ‘Romcor’ produced the largest fruits, with an average weight of 253.1 g and a diameter of 76.8 mm. In contrast, smaller fruits were observed in ‘Ervina’, ‘Arvena’, and ‘Cristal’. The number of seeds per fruit ranged from 5.76 (‘Cristal’) to 10.33 (‘Arvena’). Data regarding fruit firmness indicated that the firmest fruit texture was observed in ‘Paradox’ (83.3 HPE), while ‘Arvena’ exhibited the lowest firmness (21.4 HPE). Among the nine late-ripening cultivars, ‘Primadona’ and ‘Virgiliu Hibernal’ recorded the largest fruits, exceeding 107 mm, while ‘Euras’ had the smallest overall dimensions. ‘Paramis’ and ‘Republica’ stood out with the highest fruit weight (332.0 g and 284.9 g, respectively) and the greatest overall size. Firmness values ranged from 42.6 HPE (‘Virgiliu Hibernal’) to 83.3 HPE (‘Paradise’).
Variations were observed in the chemical contents of the tested fruits, both within the fruit ripening category and among the three groups exhibiting differing ripening periods (Table 2). In the early-ripening cultivar group, total soluble solids (TSSs) ranged between 14.0% and 20.4%, with ‘Beurré Giffard’ showing the highest sugar content. The pH ranged from 3.63 (‘Daciana’) to 4.70 (‘Beurré Giffard’), while ‘Daciana’ also exhibited the highest levels of malic, citric, and tartaric acid. In autumn cultivars, total soluble solids ranged from 12.9% (‘Paradox’) to 16.8% (‘Orizont’). The lowest pH was observed in ‘Orizont’ (3.48), corresponding to the highest citric and malic acid levels. For late-maturing cultivars, ‘Milenium’ and ‘Euras’ had the highest soluble solids levels (18.0–18.1%), while ‘Paramis’ and ‘Republica’ had the lowest (11.7–13.3%). The acid content varied considerably, with ‘Paradise’ and ‘Republica’ registering the highest levels of titratable acidity (malic, citric, and tartaric acids).
The skin color indices are presented in Table 3, based on the CIE Lab* system. In early-ripening cultivars, ‘Napoca’ had the highest lightness value (L*) for skin on the sunny side (53.6), while ‘Carpica’ and ‘Argessis’ had the lowest. On the shading side, the skin color lightness was highest in ‘Triumf’ (70.9), accompanied by high yellowness (b* = 33.4). Also, the hue variations were reflected in a* values, with most samples presenting negative values along the green–red axis. Among the autumn-ripening cultivars, the highest fruit skin lightness (L*) on the sunny side was observed in ‘Adria’ (66.9), while ‘Orizont’ and ‘Romcor’ were darker. On the shading side, the lightness (L*) was also highest in ‘Adria’ and ‘Latina’ (>66), with variation in hue and saturation expressed. Color indices for both skin side for the late-ripening cultivars indicated that ‘Isadora’ and ‘Pandora’ had the highest lightness values (L* > 68), while ‘Republica’ had the lowest. Color variation among cultivars was evident from the differences in a* and b* values, indicating variability in red–green and yellow–blue components of the skin color.
The comparative analysis of morphological and biochemical fruit traits performed on the 25 pear cultivars, grouped by ripening period (six early, ten autumn, and nine late), is presented in Figure 2.
Among morphological traits, significant differences were observed in fruit diameter (p = 0.001) and especially fruit weight (p < 0.001), with late cultivars showing the highest values, while fruit height did not differ significantly between groups. Seed number and fruit firmness also showed variation, though it was not statistically significant (p > 0.05). Extreme values recorded for ‘Republica’ and ‘Virgiliu Hibernal’ in average seed number per fruit appeared as outliers, mainly due to the trait’s homogeneity among the other late cultivars. An outlier in fruit firmness was observed in the early-ripening cultivar ‘Triumf’. Regarding biochemical attributes, soluble solids content (SU%) was relatively uniform across groups, whereas pH differed significantly (p = 0.021), with late cultivars tending to have higher values. In contrast, the content of citric, tartaric, and malic acids showed no significant differences among ripening groups, although a decreasing trend in malic acid content was noted from the early to late cultivars. Overall, the ripening period appears to influence the fruit size and acidity more than sugar accumulation or firmness.

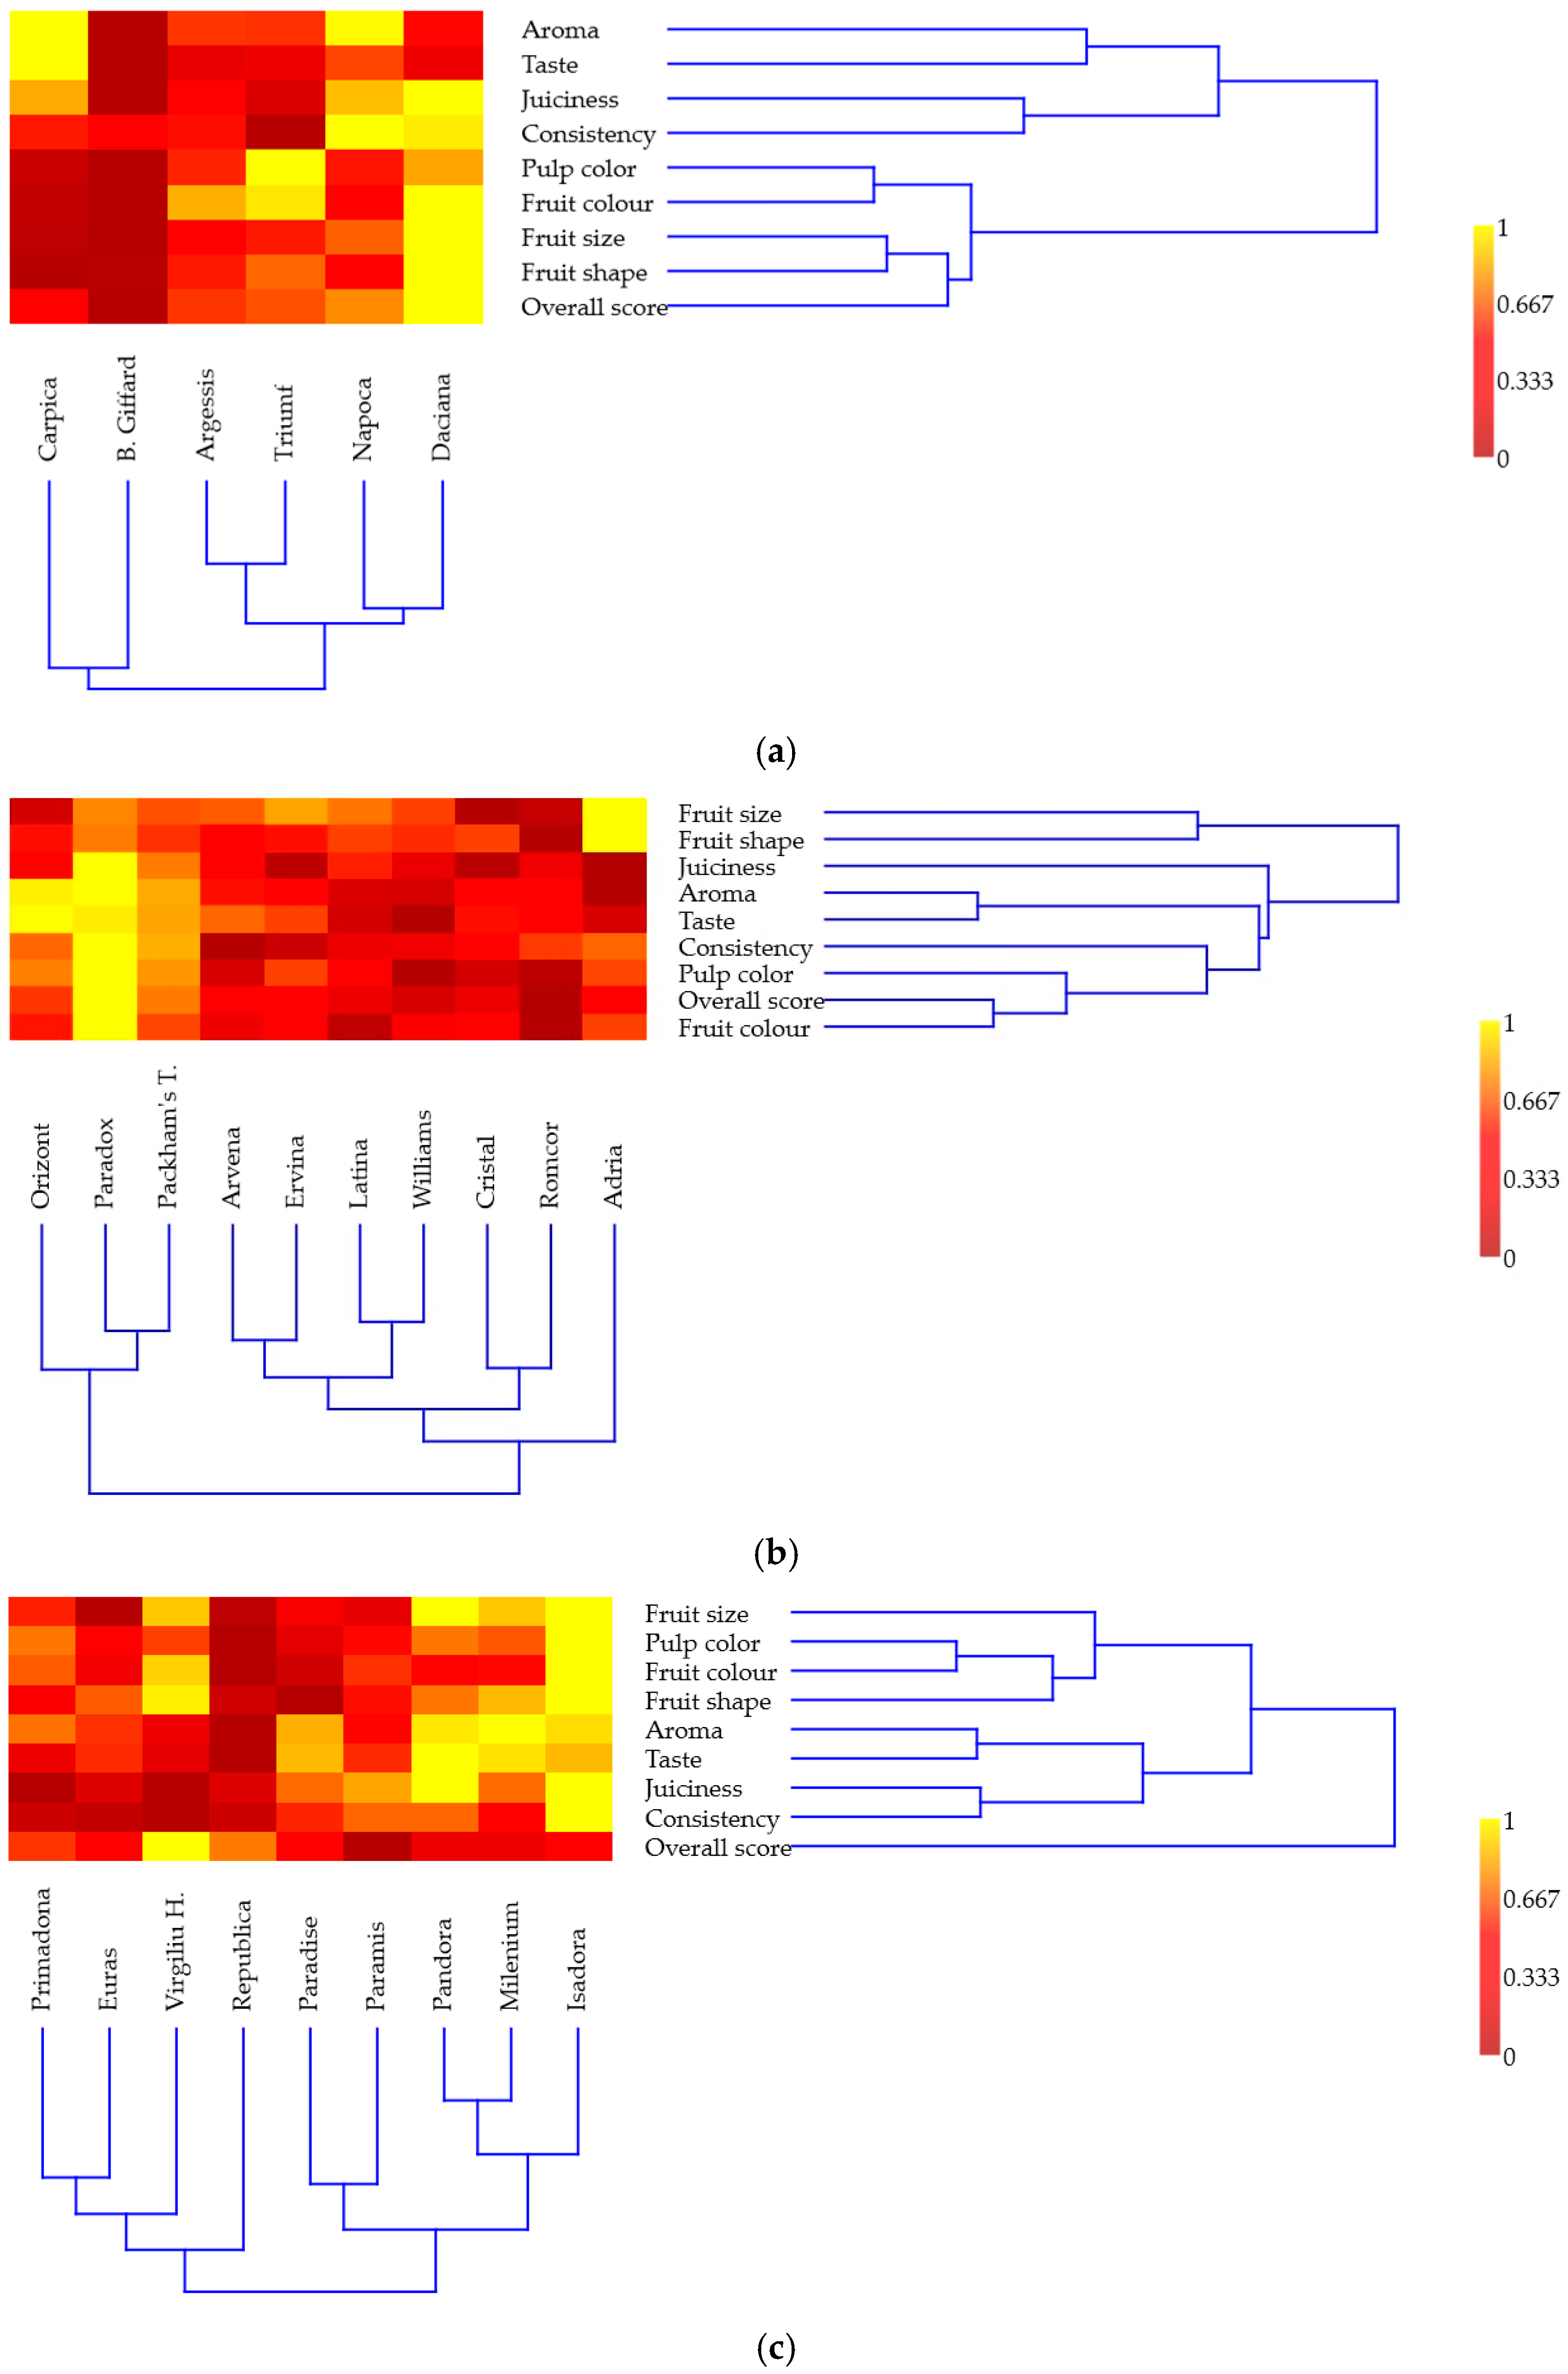
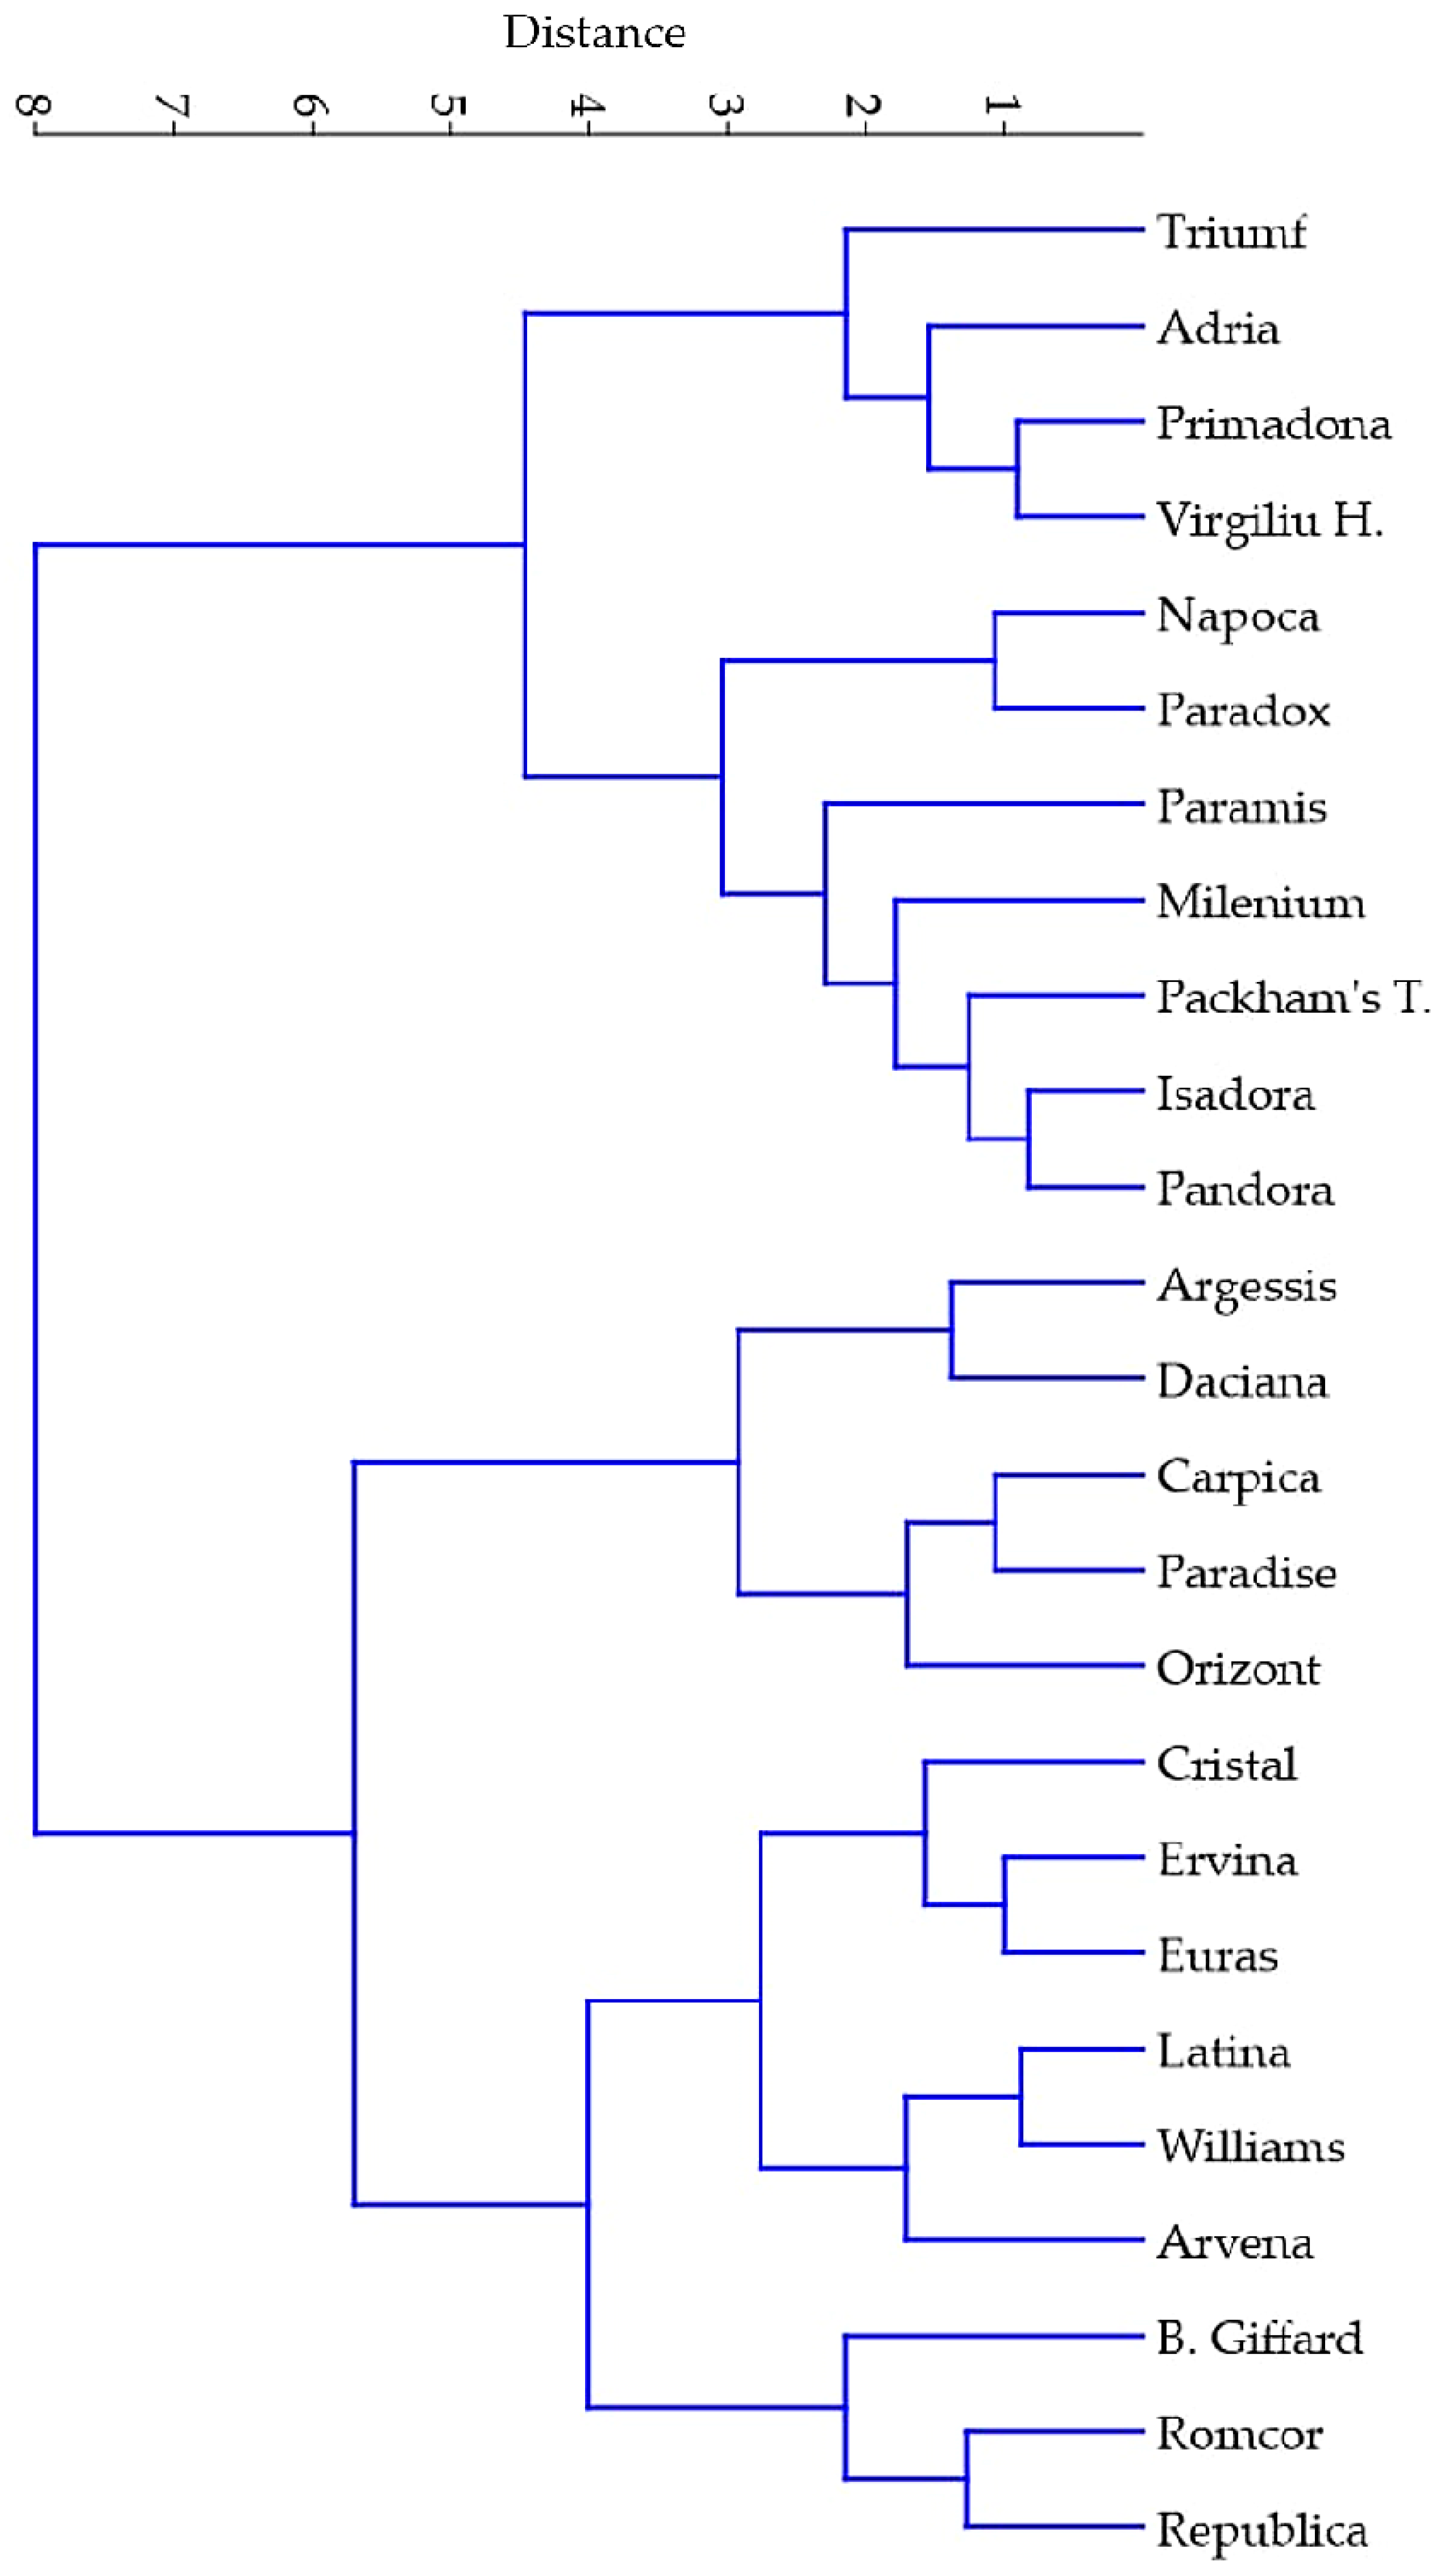
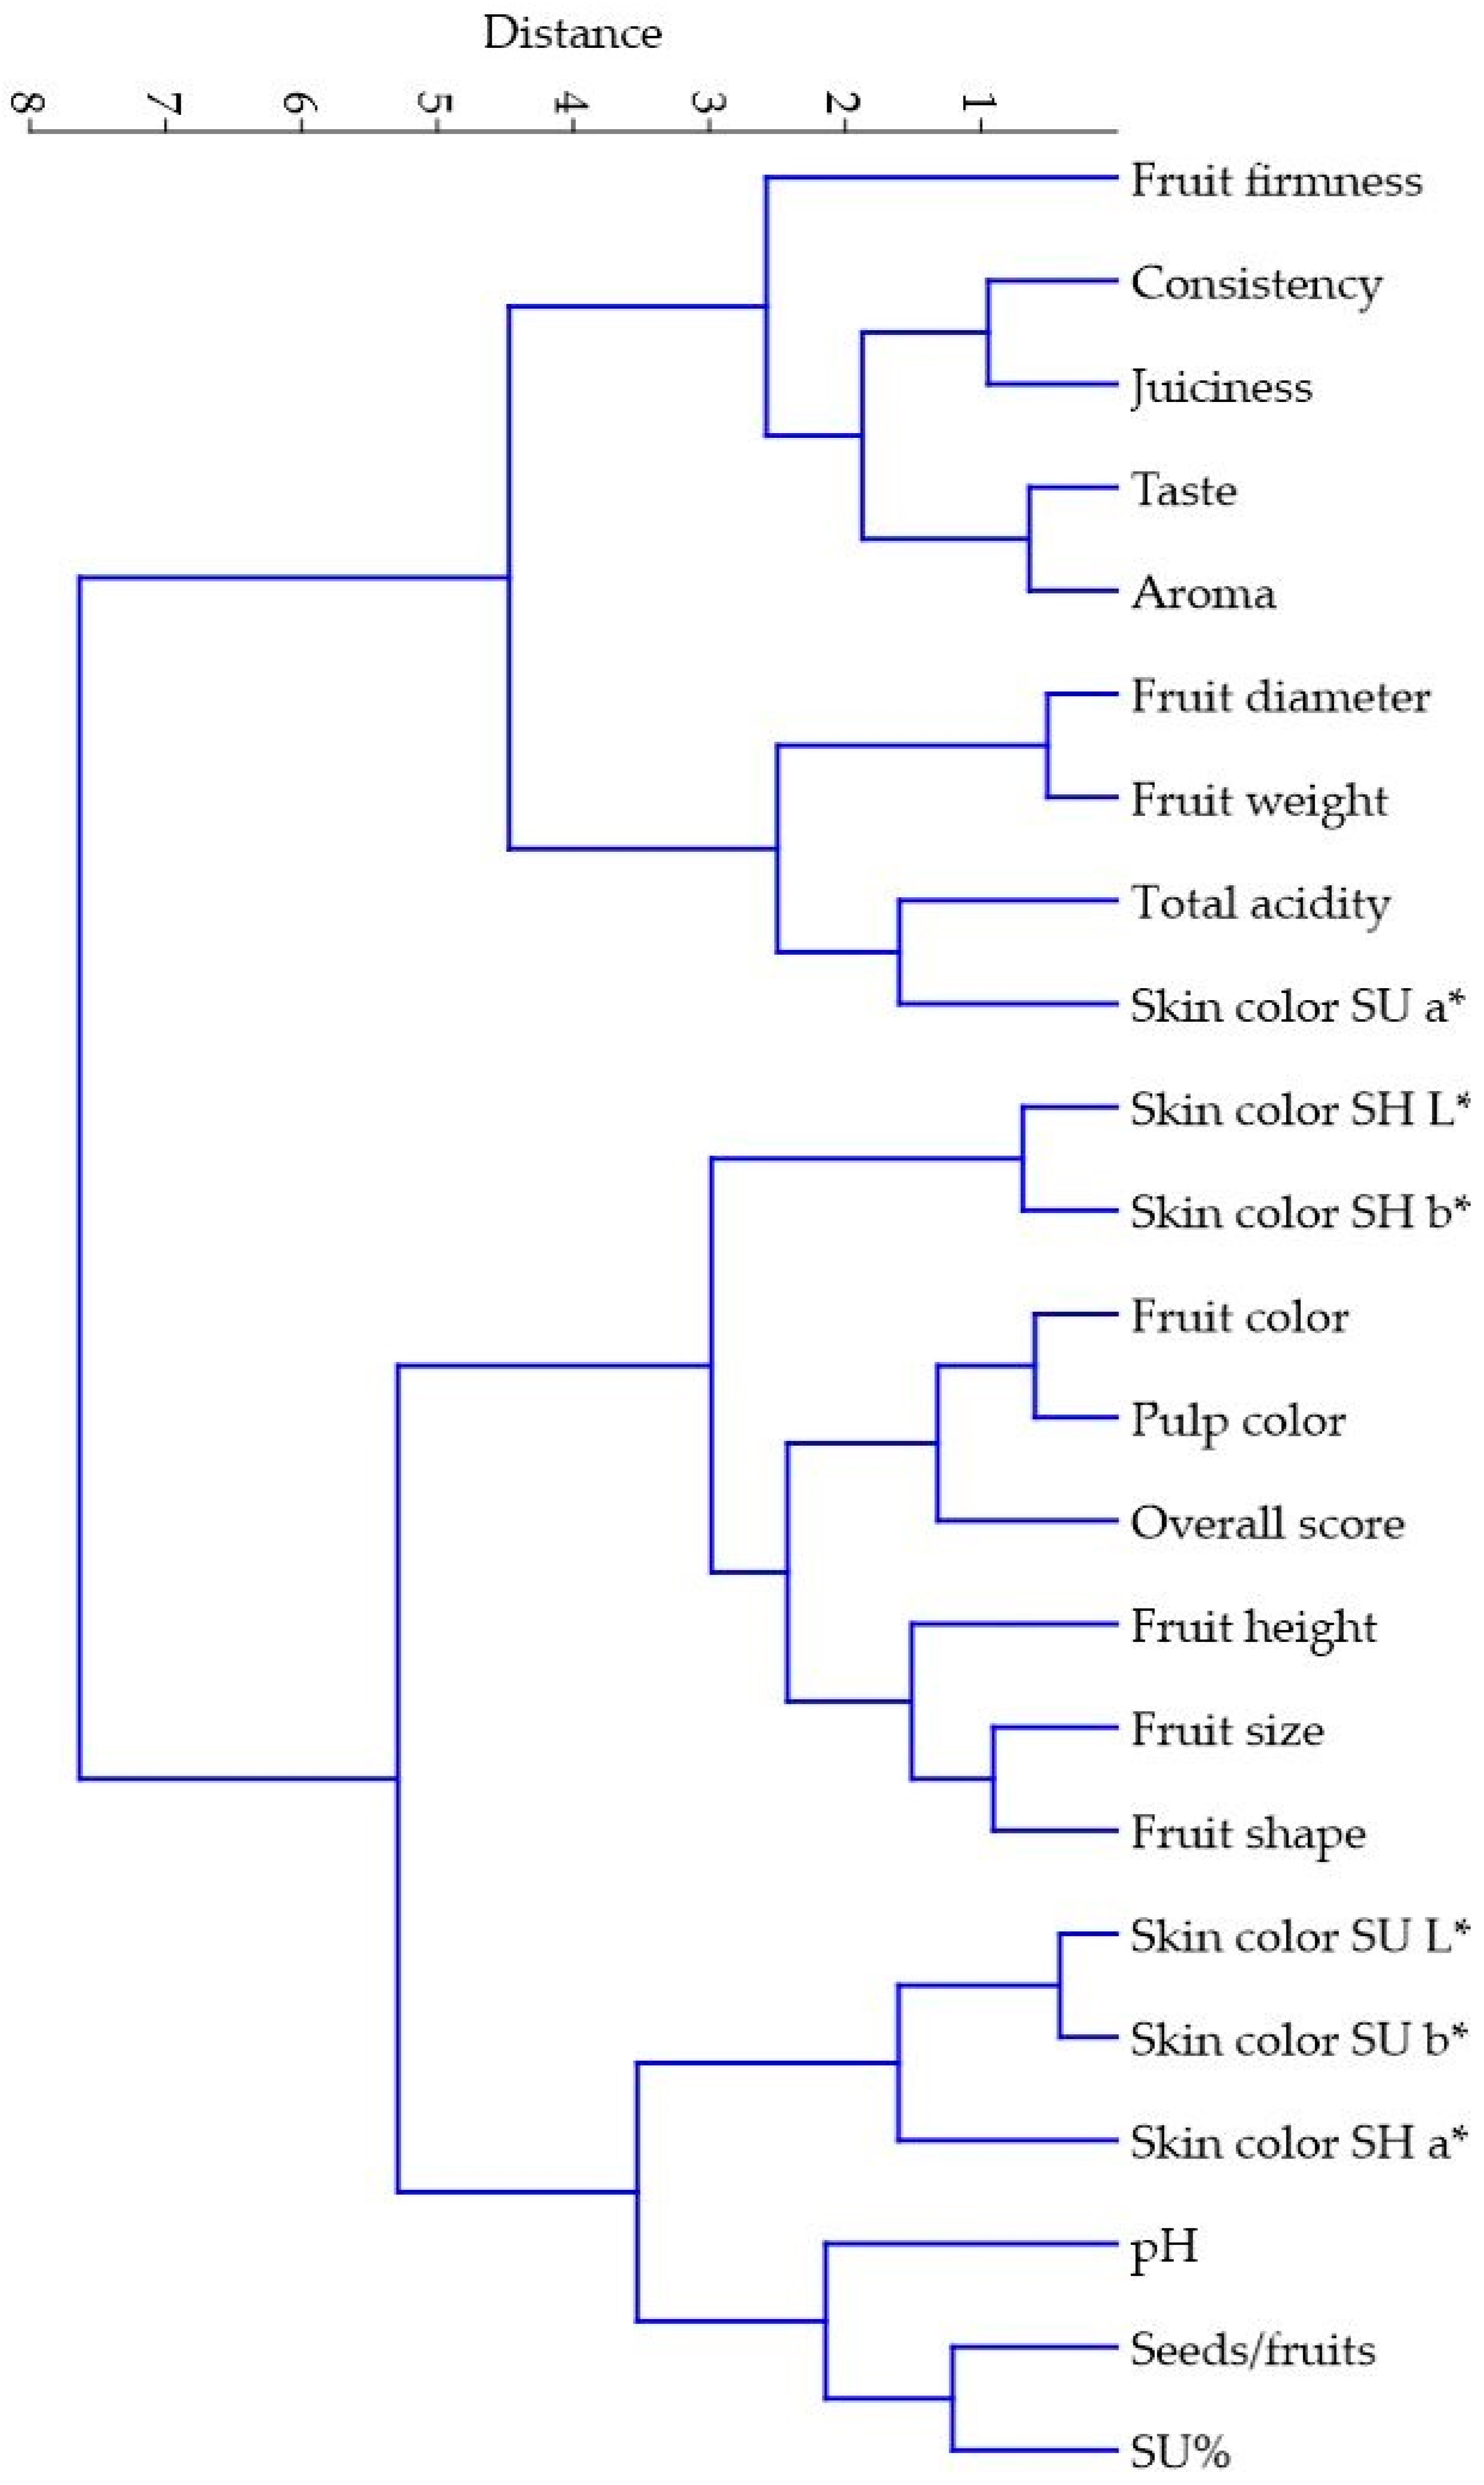
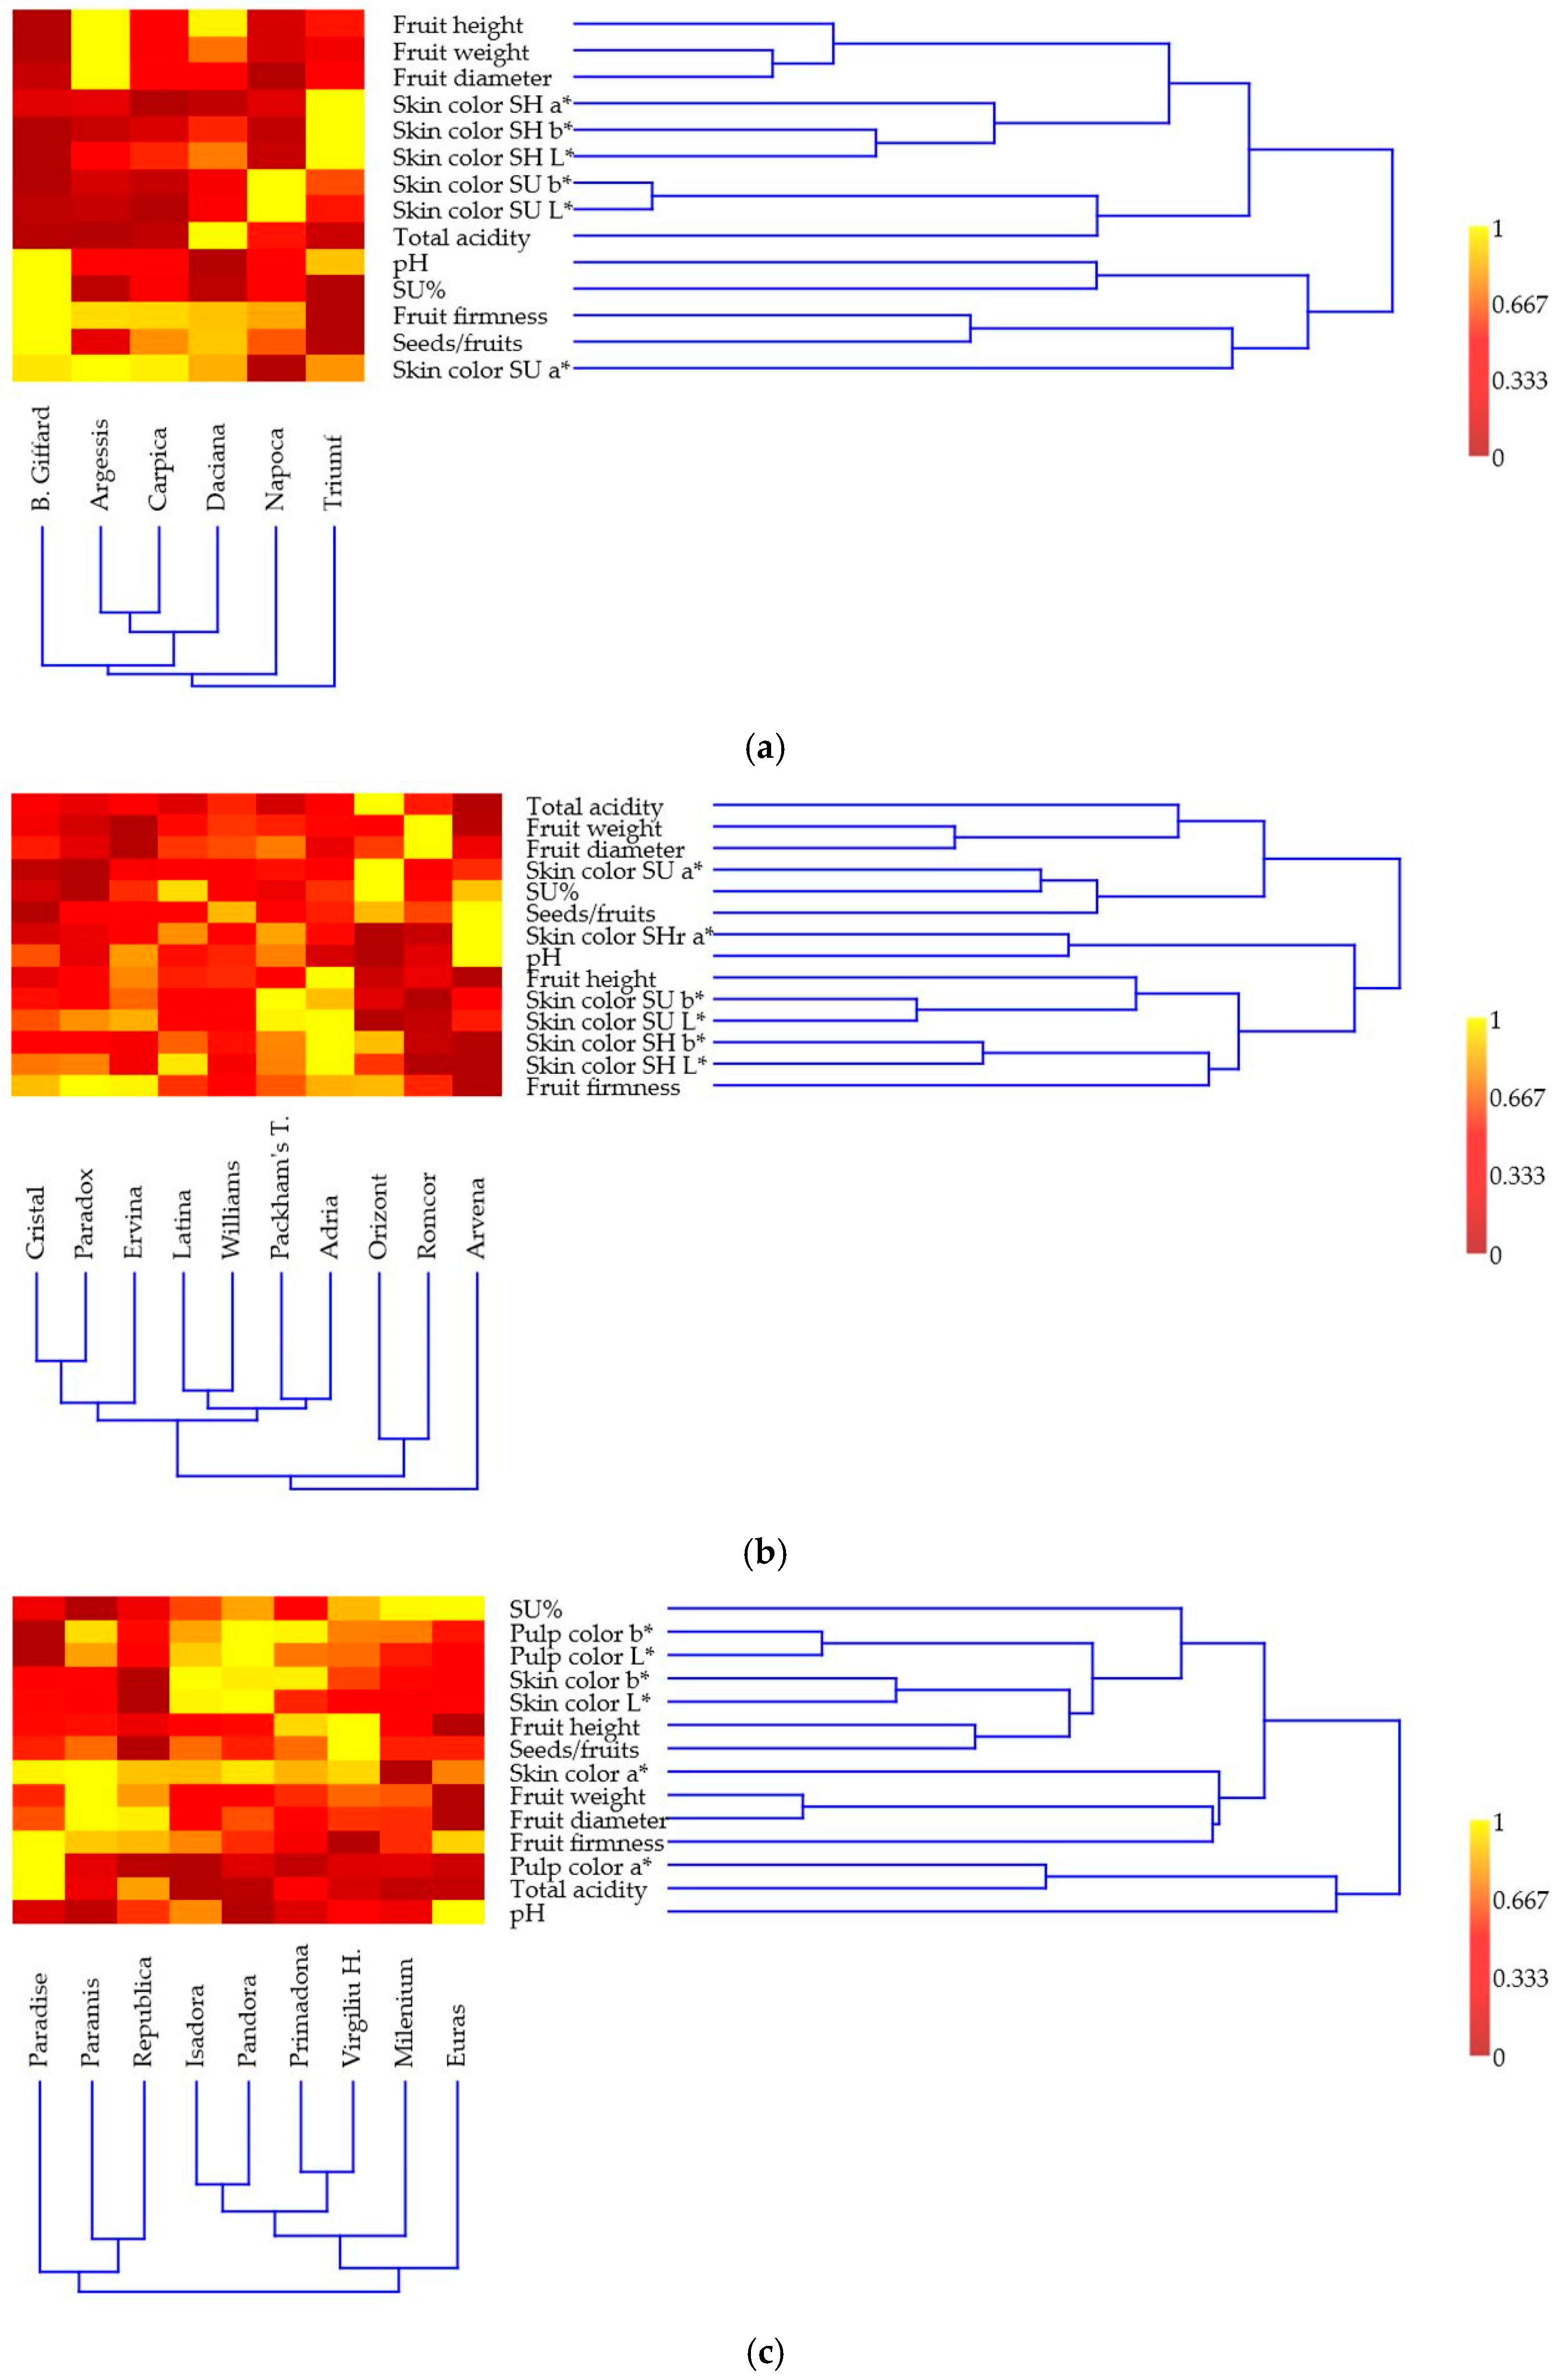
3.2. Multivariate Analysis for Morphological, Biochemical, and Colorimetric Attributes of Fruits

Figure 3 presents a hierarchical clustering analysis (UPGMA, Euclidean similarity) of pear cultivars based on morphological, biochemical, and colorimetric traits. The vertical dendrogram separates the six early cultivars into three main groups (Figure 3a): ‘Triumf’ stands apart due to its distinct profile, and ‘Argessis’, ‘Carpica’, and ‘Daciana’ cluster together, while ‘Beurré Giffard’ and ‘Napoca’ form a separate group, likely reflecting smaller fruit size and lower color intensity.
The horizontal dendrogram shows that traits group according to their nature: fruit size parameters (weight, diameter, and height) cluster tightly, and colorimetric attributes are quite homogeneous, especially skin color L* and b* on the shading side, which form a very close pair, while other traits are more loosely associated. The heat map highlights variation intensity, with yellow tones indicating higher values and red tones lower ones, visually reinforcing the similarities and differences across both cultivars and traits.
The clustering of the ten autumn pear cultivars reveals three distinct cultivar groups (Figure 3b). The first cluster includes ‘Cristal’, ‘Paradox’, and ‘Ervina’, which show similar trait profiles, likely associated with higher firmness and acidity. The second cluster is composed of ‘Williams’, ‘Latina’, ‘Packham’s Triumph’, and ‘Adria’, cultivars that share intermediate characteristics in terms of size, color, and sugar content. The third cluster comprises ‘Orizont’, ‘Romcor’, and ‘Arvena’, characterized by distinct values in size-related and biochemical traits. The horizontal dendrogram groups fruit size parameters (weight and diameter), together with total acidity, while the colorimetric traits are quite close, except for skin color a* on the shading side associated with soluble solids content (SU%). The heat map highlights the variation in trait intensity across cultivars, with the yellow color indicating higher values (i.e., ‘Adria’ shows elevated values for some traits).
UPGMA clustering of the nine late pear cultivars presented in Figure 3c reveals three main groups: ‘Paramis’, ‘Republica’ and ‘Paradise’, form the first group, while ‘Isadora’ with ‘Pandora’, ‘Primadona’ with ‘Virgiliu Hibernal’ and ‘Milenium’ are grouped in the second, and ‘Euras’ in the third. The horizontal dendrogram of traits shows that fruit size parameters (weight and diameter) cluster closely, while colorimetric traits such as skin color (L*, b*) form distinct pairs. Biochemical parameters like pH and total acidity are positioned separately, reflecting their independent variation. The heat map visualizes the intensity of traits within cultivars, with ‘Pandora’ showing strong expression in skin color and soluble solids, aligning with its cluster position.

3.3. Organoleptic Analysis

Table 4 presents the average sensory scores (mean ± SEM) for key fruit quality attributes in 25 pear cultivars, grouped by ripening period, using a 1–9 hedonic scale. Duncan’s test indicated significant differences (α < 0.05) among cultivars for most traits within each ripening group. Among early cultivars, ‘Triumf’ had the highest scores for pulp color (8.2) and taste (6.7), while ‘Beurré Giffard’ showed lower values across most traits, including aroma (5.9) and juiciness (6.2). In the autumn group, ‘Paradox’ and ‘Orizont’ scored highest for pulp color (8.4 and 8.2, respectively), whereas ‘Latina’ and ‘Williams’ had lower ratings for aroma (6.4 and 6.3) and taste (6.4 and 6.2). Among late cultivars, ‘Pandora’ and ‘Primadona’ received the high average scores, particularly for pulp color, aroma, and taste, while ‘Republica’ had the lowest values in aroma (3.8) and taste (4.3).
Table 5 displays the ranking of overall fruit quality (based on mean sensory scores ± SEM) for 25 pear cultivars, categorized by ripening period. Among early cultivars, ‘Daciana’ achieved the highest score (7.6 ± 0.4), significantly outperforming ‘Carpica’ (6.7 ± 0.2) and ‘Beurré Giffard’ (6.2 ± 0.3), which had the lowest rating within the group. In the autumn group, ‘Paradox’ stood out with the highest overall score (8.2 ± 0.2), followed by ‘Packham’s Triumph’ (7.9 ± 0.3), both significantly superior to cultivars like ‘Romcor’ (7.0 ± 0.3) and ‘Williams’ (7.2 ± 0.4), which received lower but statistically distinct scores. Among late-ripening cultivars, ‘Isadora’ ranked first (8.0 ± 0.7), with ‘Pandora’ (7.7 ± 0.4) and ‘Milenium’ (7.5 ± 0.4) also showing favorable evaluations. In contrast, ‘Republica’ had the lowest overall sensory quality in this group (5.7 ± 0.4), significantly different from the top performers, as confirmed by Duncan’s multiple range test (α < 0.05).
Figure 4 presents a comparative analysis of sensory attributes of fruits for 25 pear cultivars grouped by ripening period, evaluated on a 1–9 hedonic scale. Among the organoleptic traits presented, statistically significant differences (p < 0.05) were observed for fruit size (p = 0.011), juiciness (p = 0.026), taste (p = 0.049), and overall average score (p = 0.050), which includes both external (size, shape, and color) and internal attributes of fruits presented in the graph. Late-ripening cultivars received the highest average ratings for taste and juiciness, while early cultivars generally showed lower scores for these attributes. Although consistency (p = 0.096) and aroma (p = 0.082) did not show statistically significant differences, autumn cultivars tended to perform slightly better in these categories. For instance, autumn cultivars had the highest average consistency score, while late cultivars displayed a wider distribution, indicating greater variability in fruit texture. Overall, the data suggest a tendency for late-ripening cultivars to be more favorably rated in terms of sensory quality, particularly for juiciness and taste, with ‘Pandora’ and ‘Primadona’ being among the top scorers.
The sensory evaluation of the 25 pear cultivars, classified into three ripening periods, revealed distinct organoleptic profiles depending on the fruit maturity periods (Figure 5a–c). However, the contribution of each trait (from a total of eight traits, of which three external and five internal fruit traits) to the overall fruit quality was relatively balanced across the three groups. In early-ripening cultivars, fruit color (13.3%), shape (13.2%), and pulp color (13.1%) contributed the most to perceived quality, emphasizing external appeal. Autumn cultivars showed a balanced influence of fruit size (13.2%), shape (12.8%), and juiciness (12.5%), suggesting a harmony between visual and textural traits. In late cultivars, the highest contributors were pulp color (13.5%), fruit color (13.4%), and shape (13.3%), highlighting visual and internal pulp characteristics. Overall fruit quality scores differed significantly among groups, as shown in Figure 5d. The Kruskal-Wallis test (p = 0.00763), followed by Dunn’s post hoc analysis, confirmed that autumn-ripening cultivars were significantly superior in overall sensory quality compared to both early and late groups.

4. Discussion

The current study provides a comprehensive assessment of 25 pear cultivars across different ripening periods, integrating morphological, biochemical, and organoleptic evaluations to define fruit quality. Grouping cultivars into early, autumn, and late-ripening categories revealed both commonalities and distinctive patterns, which are essential for cultivar selection, market orientation, and breeding strategies.
Morphological traits such as fruit weight and diameter exhibited the highest variation among groups, with late cultivars generally displaying superior values. For instance, ‘Paramis’ and ‘Republica’ recorded the largest fruit weights (332.0 g and 284.9 g, respectively), highlighting their suitability for fresh market demands. These findings align with prior reports indicating that fruit size is a key consumer preference and selection trait. In contrast, early cultivars like ‘Beurré Giffard’ had significantly smaller fruit sizes, suggesting their relevance for early-season markets or niche processing purposes [3,4].
Usually, biochemical analyses reveal significant variations in the main chemical compounds in different pear cultivars [46,47,48,49]; in the current study, these variations also included the pH and titratable acidity values. ‘Orizont’, an autumn cultivar, presented the lowest pH (3.48) and highest total acidity, correlating with elevated citric and malic acid content. Conversely, late cultivars such as ‘Euras’ and ‘Isadora’ had higher pH values and lower acid content, contributing to milder taste profiles. These results reinforce the idea that acidity levels are pivotal for flavor perception and storage potential [7,50,51]. Soluble solids content (SU%) varied less significantly across ripening groups, although cultivars such as ‘Beurré Giffard’ and ‘Milenium’ recorded high values (>18%), suggesting enhanced sweetness and consumer acceptability. Colorimetric traits measured through the CIE Lab* system offered valuable insights into the visual quality of fruits. Lightness values (L*) were particularly high in ‘Isadora’ and ‘Pandora’, which may contribute to improved visual appeal. Consumer preference for the attractive color of pears and the growing interest in the nutritional, dietary, and health value of pears are significantly influencing breeding programs and production strategies in the fruit industry [4,7,37,39,52].
The multivariate analyses, which are recognized for providing reliable information on the variability of Pyrus species and pear quality [53,54,55,56,57,58], effectively grouped cultivars based on integrated trait profiles. For early cultivars, hierarchical clustering analyses and a heat map revealed that ‘Argessis’ was highlighted for fruit size, while ‘Triumf’ was distinguished by its high acidity and vivid coloration. In contrast, ‘Napoca’ and ‘Carpica’ showed weaker performance across most traits. In autumn and late cultivars, ‘Paradox’, ‘Packham’s Triumph’, and ‘Adria’ were identified as superior autumn cultivars in terms of color and acidity, and ‘Pandora’ and ‘Isadora’ as top-performing late cultivars. For autumn cultivars, the cluster containing ‘Cristal’, ‘Paradox’, and ‘Ervina’ reflected firmness and brightness. The late cultivars were grouped into three main categories, with ‘Isadora’ and ‘Pandora’ clustering due to high color, firmness, and flavor attributes, whereas ‘Republica’ and ‘Paradise’ were grouped together based on inferior organoleptic traits. As a robust tool for dimensionality reduction in complex datasets, multivariate analysis is routinely applied to identify key breeding targets for fruit quality and post-harvest management parameters [55,59,60,61].
The results of sensory analyses of fruit quality are influenced by a range of factors, including the genotype (cultivar), environmental and agronomic conditions during fruit development, the stage of fruit ripeness, the timing of the evaluation, etc. [61,62,63,64]. Divergent consumer preferences for pears—with Western markets favoring buttery cultivars (e.g., Pyrus communis) versus Asian consumers preferring crisp Nashi pears (Pyrus pyrifolia)—demonstrate how qualitative traits and geographical influences shape long-term taste formation [65]. Additionally, the assessment protocols and other subjective elements, such as the panelists’ level of expertise and their momentary psychological state, can also impact outcomes [44]. While the ‘Williams’ cultivar underperformed in this study (likely due to aforementioned factors), it remains a quality benchmark. Pears require precise ripening timing to reach optimal sensory quality, at which point they offer exceptional gastronomic value. In alignment with Collona et al. [39], we firmly concur that enhanced knowledge regarding pear ripening and storage is essential for enabling consumers to relish pears at their optimal ripeness. However, despite the sources of variability presented previously, sensory evaluation remains the most widely used method for determining the commercial value and taste quality of fruit cultivars [38].
In our study, organoleptic assessments highlighted significant differences among cultivars and ripening groups. Traits like taste, juiciness, and pulp color strongly influenced the overall sensory score. The highest sensory scores were recorded in ‘Paradox’ (8.2), ‘Packham’s Triumph’ (7.9), and ‘Isadora’ (8.0), while ‘Republica’ (5.7) and ‘Beurré Giffard’ (6.2) ranked lowest. Late cultivars, as a group, tended to outperform others in taste and juiciness, suggesting a superior eating quality. These results echo previous findings emphasizing the importance of flavor, texture, and visual appeal in shaping consumer preference [2,32]. The UPGMA hierarchical analysis illustrates distinct clustering patterns of organoleptic traits across ripening groups. In summer-ripening cultivars, the overall sensory quality is grouped in the same subcluster as fruit size, shape, and skin color, indicating a strong association with external appearance (Figure A1a). Taste is closely paired with aroma, while consistency clusters with juiciness, forming two separate subclusters related to internal fruit quality. In autumn-ripening cultivars, overall quality is most closely associated with skin color, while taste and aroma again form a tightly linked subcluster (Figure A1b). In contrast, the late-ripening cultivars display a different pattern, where overall quality is distinctly separated from both external and internal sensory attributes (Figure A1c). The remaining traits fall into two primary clusters: one composed of pulp color and fruit color in proximity to shape and size and another comprising two internal quality pairs—taste with aroma, and consistency with juiciness. In the hierarchical analysis of the 25 pear cultivars evaluated based on all morphological, biochemical, and sensory characteristics of the fruits (Figure A2), two main clusters are distinguished, within which some pairs of cultivars with close genetic origin (e.g., ‘Argessis’ and ‘Daciana’, both obtained from the hybridization of ‘Napoca’ × ‘Butirra Precoce Morettini’ [29]) or extremely different (e.g., ‘Packham’s Triumph’ versus ‘Isadora’ and ‘Pandora’), and fruit ripening period (‘Carpica’ and ‘Paradise’) are formed. The dendrogram of all fruit characteristics places overall pear quality in a sub-cluster with elements of fruit size and shape, or flesh color, while essential intrinsic fruit quality characteristics form close pairs in another subcluster (Figure A3). Here, taste is closely linked to aroma and consistency to juiciness, all forming a common sub-cluster with fruit texture. A Pearson phenotypic correlation analysis (Figure A4) revealed significant relationships between the overall fruit quality score and both fruit and pulp color. Fruit taste was positively correlated with firmness, juiciness, and aroma. Other notable associations were observed, including some between less intuitively linked traits: pH exhibited negative correlations with fruit size (height, diameter, and weight), total acidity, and organoleptically assessed firmness and juiciness. Additionally, the seed number per fruit correlated positively with the dry matter content.
Despite the practicality of the 1–9 hedonic scale in quantifying sensory perceptions, its uniform application across all fruit quality traits may obscure the relative importance of specific characteristics. In the present study, the contribution of each evaluated trait—external (size, shape, and color) and internal (pulp color, consistency, juiciness, taste, and aroma)—to the overall fruit quality score was nearly equal, regardless of its actual sensory or commercial impact. This uniform weighting tends to flatten perceptual differences, causing minor visual traits such as shape to influence the final score as much as critical internal attributes like taste or aroma. While useful for general comparisons, this approach is suboptimal in breeding programs, where fruit quality must be dissected to identify elite genotypes with superior internal qualities. In this context, a differentiated scoring model may offer more accurate insights. As proposed in our previous studies on apples [66,67], such a model assigns trait-specific weights according to their sensory relevance—for example, a scoring range of 1–3 for size, shape, and pulp color, 1–5 for skin color, juiciness, and aroma, and 1–15 for taste. Applying this refined methodology to pear evaluation could better capture consumer-preferred attributes, improve selection efficiency, and support the development of high-quality cultivars with genuine market potential.
The integration of morpho-biochemical and sensory data allows a deeper understanding of cultivar potential [25,68]. For breeding programs, this multidimensional evaluation is critical in identifying genotypes like ‘Paradox’, ‘Pandora’, and ‘Daciana’, which combine attractive appearance, favorable flavor, and good textural properties. Such cultivars can serve as parental lines in artificial hybridization strategies aimed at enhancing consumer-preferred traits. Additionally, the identification of cultivars with balanced biochemical profiles supports their suitability for fresh consumption or processing, responding to the needs of both direct markets and the food industry. Moreover, these analyses are highly relevant to market orientation. As consumer expectations evolve, especially toward fruits with cleaner flavor profiles, a uniform texture, and enhanced visual appeal, the results of this study can inform marketing strategies and post-harvest handling protocols. Organoleptic bulletins and hedonic sensory assessments offer actionable data for growers and distributors aiming to optimize cultivar selection based on target segments [38,68,69,70]. Despite its breadth, the study has limitations related to environmental and temporal factors, as evaluations were conducted in a single season and location. Future research should address trait stability through multi-year, multi-site trials and integrated genomic tools and post-harvest behavior to refine cultivar recommendations. Additionally, further exploration of consumer preference profiles, market segmentation, and value-chain integration would enhance the practical applicability of quality-based selection in pear breeding and commercialization.

5. Conclusions

This study has provided a comprehensive evaluation of 25 pear cultivars, classified into early, autumn, and late-ripening groups, by integrating morphological, biochemical, and sensory parameters. The results demonstrated significant differences in fruit size, soluble solids content, acidity, and sensory qualities across cultivars and ripening stages. Several cultivars, such as ‘Paradox’, ‘Isadora’, and ‘Pandora’, showed balanced profiles that combined attractive visual traits with favorable internal quality, including taste and aroma, as confirmed via sensory panels. The multivariate and statistical analyses supported a trait-based differentiation among cultivars, which is useful for identifying promising genotypes for fresh consumption. By applying a multidimensional assessment, this study contributes to a better understanding of cultivar performance in relation to the ripening period, offering valuable insights for breeding programs and market-driven selection strategies in pear production.

Author Contributions

Conceptualization, M.M., A.F.S. and R.E.S.; methodology, R.E.S., C.D. and A.F.S.; software, S.-O.B., E.G. and A.F.S.; validation, M.M., R.E.S. and A.L.B.-K.; formal analysis, S.-O.B., E.G., A.F.A. and O.B.; investigation, S.-O.B., E.G., A.F.A., O.B. and C.D.; resources, M.M., A.F.A., O.B. and A.L.B.-K.; data curation, S.-O.B., M.M. and E.G.; writing—original draft preparation, S.-O.B. and A.F.S.; writing—review and editing, M.M., R.E.S. and A.L.B.-K.; visualization, A.F.A. and O.B.; supervision, M.M., R.E.S. and A.F.S.; project administration, S.-O.B., M.M., C.D. and A.L.B.-K.; funding acquisition, S.-O.B., M.M., C.D. and A.L.B.-K. All authors have read and agreed to the published version of the manuscript.

Funding

This research was supported partly by the Babeș-Bolyai University Cluj-Napoca through the doctoral grant of S.-O.B. and by the Ministry of Agriculture and Rural Development through the project ADER 2026, 6.1.4/18/07/2023.

Data Availability Statement

The original contributions presented in the study are included in the article; further inquiries can be directed to the corresponding authors.

Conflicts of Interest

The authors declare no conflicts of interest. The funders played no role in the design of the study, in the collection, analyses, or interpretation of data, in the writing of the manuscript, or in the decision to publish the results.

Appendix A

Figure A1. Hierarchical clustering analyses (UPGMA pairwise clustering) using the Euclidean similarity index for pear cultivars based on organoleptic assessments using 1–9 hedonic scale ratings: (a) six early-ripening; (b) ten autumn-ripening; (c) nine late-ripening.
Horticulturae 11 00468 g0a1
Figure A2. Hierarchical analysis of 25 pear cultivars based on all morphological, biochemical, and sensory characteristics of the fruits (Ward’s algorithm).
Horticulturae 11 00468 g0a2
Figure A3. Hierarchical analysis of the main morphological, biochemical, and sensory characteristics of fruits, developed based on 25 pear cultivars (Ward’s algorithm).
Horticulturae 11 00468 g0a3
Figure A4. Pearson phenotypic correlations (‘r’) between trait pairs (below the diagonal) and their corresponding p-values (above the diagonal).
Horticulturae 11 00468 g0a4

References

  1. Hong, S.-Y.; Lansky, E.; Kang, S.-S.; Yang, M. A review of pears (Pyrus spp.), ancient functional food for modern times. BMC Complement. Med. Ther. 2021, 21, 219. [Google Scholar] [CrossRef]
  2. Reiland, H.; Slavin, J. Systematic review of pears and health. Nutr. Today 2015, 50, 301–305. [Google Scholar] [CrossRef] [PubMed]
  3. Vangdal, E. Quality factors of pears, plums and sweet cherries for fresh consumption. Acta Agric. Scand. 1982, 32, 129–133. [Google Scholar] [CrossRef]
  4. Blanckenberg, A. Preference of Western Cape Province Consumers for the Eating Quality and Appearance of Pears. Master’s Thesis, Stellenbosch University, Stellenbosch, South Africa, 2015. [Google Scholar]
  5. Kappel, F.; Fisher-Fleming, R.; Hogue, E.J. Ideal pear sensory attributes and fruit characteristics. HortScience 1995, 30, 988–993. [Google Scholar] [CrossRef]
  6. Manning, N. Physical, Sensory and Consumer Analysis of Pear Genotypes Among South African Consumers and Preference of Appearance Among European Consumers. Master’s Thesis, Stellenbosch University, Stellenbosch, South Africa, 2009. [Google Scholar]
  7. Turpin, S.R.; Stefanelli, D.; Jones, L.; Norton, J.; Probst, R.; Konings, J.; Langford, G. Perfect pears for the next generation of consumers. Acta Hortic. 2016, 1120, 507–514. [Google Scholar] [CrossRef]
  8. Bvenura, C.; Hermaan, N.N.P.; Chen, L.; Sivakumar, D. Nutritional and health benefits of temperate fruits. In Postharvest Biology and Technology of Temperate Fruits; Mir, S.A., Shah, M.A., Mir, M.M., Eds.; Springer International Publishing: Cham, Switzerland, 2018; pp. 51–75. [Google Scholar]
  9. Dreher, M.L. Whole fruits and fruit fiber emerging health effects. Nutrients 2018, 10, 1833. [Google Scholar] [CrossRef] [PubMed]
  10. Gorinstein, S.; Martin-Belloso, O.; Lojek, A.; Číž, M.; Soliva-Fortuny, R.; Park, Y.-S.; Caspi, A.; Libman, I.; Trakhtenberg, S. Comparative content of some phytochemicals in Spanish apples, peaches and pears. J. Sci. Food Agric. 2002, 82, 1166–1170. [Google Scholar] [CrossRef]
  11. Colavita, G.M.; Curetti, M.; Sosa, M.C.; Vita, L.I. Pear. In Temperate Fruits; Apple Academic Press: New York, NY, USA, 2021; pp. 107–182. [Google Scholar]
  12. Brunetto, G.; Melo, G.W.B.d.; Toselli, M.; Quartieri, M.; Tagliavini, M. The role of mineral nutrition on yields and fruit quality in grapevine, pear and apple. Rev. Bras. Frutic. 2015, 37, 1089–1104. [Google Scholar] [CrossRef]
  13. Kolniak-Ostek, J. Chemical composition and antioxidant capacity of different anatomical parts of pear (Pyrus communis L.). Food Chem. 2016, 203, 491–497. [Google Scholar] [CrossRef]
  14. Hammam, W.E.; Gad, A.M.; Gad, M.K.; Kirollos, F.N.; Yassin, N.A.; Tantawi, M.E.E.; El Hawary, S.S.E. Pyrus communis L. (pear) and Malus domestica Borkh. (apple) leaves lipoidal extracts as sources for beta-sitosterol rich formulae and their wound healing evaluation. Nat. Prod. Res. 2023, 37, 2613–2617. [Google Scholar] [CrossRef]
  15. Li, X.; Wang, T.; Zhou, B.; Gao, W.; Cao, J.; Huang, L. Chemical composition and antioxidant and anti-inflammatory potential of peels and flesh from 10 different pear varieties (Pyrus spp.). Food Chem. 2014, 152, 531–538. [Google Scholar] [CrossRef]
  16. Kolniak-Ostek, J.; Kłopotowska, D.; Rutkowski, K.P.; Skorupińska, A.; Kruczyńska, D.E. Bioactive compounds and health-promoting properties of pear (Pyrus communis L.) fruits. Molecules 2020, 25, 4444. [Google Scholar] [CrossRef]
  17. Singh, S.; Verma, R.; Sharma, H. Exploring the therapeutic potential and bioactive compounds in Pyrus species. Pharmacol. Res. Mod. Chin. Med. 2024, 10, 100342. [Google Scholar] [CrossRef]
  18. Nazir, N.; Nisar, S.; Mubarak, S.; Khalil, A.; Javeed, K.; Banerjee, S.; Kour, J.; Nayik, G.A. Pear. In Antioxidants in Fruits: Properties and Health Benefits; Nayik, G.A., Gull, A., Eds.; Springer: Singapore, 2020; pp. 435–447. [Google Scholar]
  19. Kathuria, D.; Ramachandran, P.; Gautam, S.; Thakur, A.; Thakur, N. Fruits as a Functional Food for Health. In Functional Foods; CRC Press: Boca Raton, FL, USA, 2023; pp. 49–101. [Google Scholar]
  20. Navaei, N.; Pourafshar, S.; Akhavan, N.S.; Litwin, N.S.; Foley, E.M.; George, K.S.; Hartley, S.C.; Elam, M.L.; Rao, S.; Arjmandi, B.H.; et al. Influence of daily fresh pear consumption on biomarkers of cardiometabolic health in middle-aged/older adults with metabolic syndrome: A randomized controlled trial. Food Funct. 2019, 10, 1062–1072. [Google Scholar] [CrossRef]
  21. Gayer, B.A.; Avendano, E.E.; Edelson, E.; Nirmala, N.; Johnson, E.J.; Raman, G. Effects of intake of apples, pears, or their products on cardiometabolic risk factors and clinical outcomes: A systematic review and meta-analysis. Curr. Dev. Nutr. 2019, 3, nzz109. [Google Scholar] [CrossRef] [PubMed]
  22. James-Martin, G.; Williams, G.; Stonehouse, W.; O’Callaghan, N.; Noakes, M. Health and Nutritional Properties of Pears (Pyrus): A Literature Review. For Hort Innovation and Apple and Pear Australia Ltd. (APAL). Final Report, 15 October 2015. Available online: https://www.australianpears.com.au/wp-content/uploads/2019/10/Pears-Health-Study-AP15010-Final-Report-Complete.pdf (accessed on 12 February 2025).
  23. Ogah, O.; Ene, C.; Afiukwa, F.; Nwankwo, V. Flavor quality in Rosaceae fruit and nut crops: “Insights into volatile organic compounds and recent breeding strategies”. Niger. J. Biotechn. 2024, 41, 191–211. [Google Scholar] [CrossRef]
  24. Brewer, L.R.; Palmer, J.W. Global pear breeding programmes: Goals, trends and progress for new cultivars and new rootstocks. Acta Hortic. 2011, 909, 105–119. [Google Scholar] [CrossRef]
  25. Konopacka, D.; Rutkowski, K.P.; Kruczynska, D.; Skorupinska, A.; Plocharski, W. Quality potential of some new pear cultivars–how to obtain fruit of the best sensory characteristics? J. Hort. Res. 2014, 22, 71–84. [Google Scholar] [CrossRef]
  26. Dondini, L.; Sansavini, S. European Pear. In Fruit Breeding; Badenes, M.L., Byrne, D.H., Eds.; Springer: Boston, MA, USA, 2012; pp. 369–413. [Google Scholar]
  27. da Silva, G.J.; Villa, F.; Grimaldi, F.; da Silva, P.S.; Welter, J.F. Pear (Pyrus spp.) Breeding. In Advances in Plant Breeding Strategies: Fruits; Al-Khayri, J.M., Jain, S.M., Johnson, D.V., Eds.; Springer International Publishing: Cham, Switzerland, 2018; Volume 3, pp. 131–163. [Google Scholar]
  28. Militaru, M.; Coman, M.; Butac, M.; Sturzeanu, M.; Tititrică, I.; Călinescu, M.; Stanciu, C.; Botu, M.; Gavăt, C.; Sîrbu, S.; et al. Fondul de Germoplasmă la Speciile Pomicole Cultivate în România; Editura Invel Multimedia: Otopeni, Romania, 2018. [Google Scholar]
  29. Paraschiv, M.; Militaru, M.; Hoza, D. Commercial and biochemical quality of Romanian pear genotypes. Sci. Pap. Ser. B Hortic. 2024, 68, 52–60. [Google Scholar]
  30. Bokszczanin, K.Ł. Future breeding strategies. In The Pear Genome; Korban, S.S., Ed.; Springer International Publishing: Cham, Switzerland, 2019; pp. 301–315. [Google Scholar]
  31. Takácsné Hájos, M.; Nyéki, J.; Szabó, Z. Organoleptic evaluation of pear varieties grown at different sites. Int. J. Hortic. Sci. 2010, 16, 33–37. [Google Scholar] [CrossRef]
  32. Cronje, A. Effect of Canopy Position on Fruit Quality and Consumer Preference for the Appearance and Taste of Pears. Master’s Thesis, Stellenbosch University, Stellenbosch, South Africa, 2014. [Google Scholar]
  33. Bruhn, C.M.; Feldman, N.; Garlitz, C.; Harwood, J.; Ivans, E.; Marshall, M.; Riley, A.; Thurber, D.; Williamson, E. Consumer perceptions of quality: Apricots, cantaloupes, peaches, pears, strawberries, and tomatoes. J. Food Qual. 1991, 14, 187–195. [Google Scholar] [CrossRef]
  34. Pasquariello, M.S.; Rega, P.; Migliozzi, T.; Capuano, L.R.; Scortichini, M.; Petriccione, M. Effect of cold storage and shelf life on physiological and quality traits of early ripening pear cultivars. Sci. Hortic. 2013, 162, 341–350. [Google Scholar] [CrossRef]
  35. Tóth-Markus, M.; Bánáti, D.; Adányi, N.; Boross, F.; Konrád-Németh, C.; Szabó, Z.; Soltész, M.; Nyéki, J. Composition and storage of pear cultivars from Nagykanizsa. Int. J. Hortic. Sci. 2011, 17, 63–68. [Google Scholar] [CrossRef]
  36. Quamme, H.A.; Gray, J.I. Pear fruit quality and factors that condition it. In Evaluation of Quality of Fruits and Vegetables; Pattee, H.E., Ed.; Springer: Dordrecht, The Netherlands, 1985; pp. 47–61. [Google Scholar]
  37. Gamble, J.; Jaeger, S.R.; Harker, F.R. Preferences in pear appearance and response to novelty among Australian and New Zealand consumers. Postharvest Biol. Technol. 2006, 41, 38–47. [Google Scholar] [CrossRef]
  38. Gallardo, R.K.; Ma, X.; Colonna, A.; Montero, M.L.; Ross, C. Consumers’ preferences for novel and traditional pear cultivars: Evidence from sensory evaluation and willingness-to-pay elicitation. HortScience 2023, 58, 1474–1483. [Google Scholar] [CrossRef]
  39. Colonna, A.E.; Gutierrez, J.; Montero, M.L.; Gallardo, R.K.; Ross, C.F. An investigation of consumer pear knowledge, consumer preferences and desirable sensory traits to increase pear consumption. Acta Hortic. 2024, 1403, 53–62. [Google Scholar] [CrossRef]
  40. Giusti, M.M.; Gordillo, B.; González-Miret, M.L. Color Analysis. In Nielsen’s Food Analysis; Ismail, B.P., Nielsen, S.S., Eds.; Springer International Publishing: Cham, Switzerland, 2024; pp. 509–522. [Google Scholar]
  41. Magwaza, L.S.; Opara, U.L. Analytical methods for determination of sugars and sweetness of horticultural products—A review. Sci. Hort. 2015, 184, 179–192. [Google Scholar] [CrossRef]
  42. Wu, J.; Fan, J.; Li, Q.; Jia, L.; Xu, L.; Wu, X.; Wang, Z.; Li, H.; Qi, K.; Qiao, X.; et al. Variation of organic acids in mature fruits of 193 pear (Pyrus spp.) cultivars. J. Food Compos. Anal. 2022, 109, 104483. [Google Scholar] [CrossRef]
  43. Morariu, P.A.; Mureșan, A.E.; Sestras, A.F.; Dan, C.; Andrecan, A.F.; Borsai, O.; Militaru, M.; Mureșan, V.; Sestras, R.E. The impact of cultivar and production conditions on apple quality. Not. Bot. Horti Agrobot. Cluj-Napoca 2025, 53, 14046. [Google Scholar] [CrossRef]
  44. Hampson, C.R.; Quamme, H.A.; Hall, J.W.; MacDonald, R.A.; King, M.C.; Cliff, M.A. Sensory evaluation as a selection tool in apple breeding. Euphytica 2000, 111, 79–90. [Google Scholar] [CrossRef]
  45. Hammer, Ø.; Harper, D.A.T.; Ryan, P.D. PAST: Paleontological statistics software package for education and data analysis. Palaeontol. Electron. 2001, 4, 4–9. [Google Scholar]
  46. Akagić, A.; Oras, A.; Gaši, F.; Meland, M.; Drkenda, P.; Memić, S.; Spaho, N.; Žuljević, S.O.; Jerković, I.; Musić, O.; et al. A comparative study of ten pear (Pyrus communis L.) cultivars in relation to the content of sugars, organic acids, and polyphenol compounds. Foods 2022, 11, 3031. [Google Scholar] [CrossRef]
  47. Yin, C.; Tian, L.; Li, J.; Cao, Y.; Dong, X.; Zhang, Y.; Qi, D. Dynamic analysis of UPLC-MS/MS for sugar and organic acid components of pears with different flesh texture types during development. Agronomy 2024, 14, 2494. [Google Scholar] [CrossRef]
  48. Chen, J.; Wang, Z.; Wu, J.; Wang, Q.; Hu, X. Chemical compositional characterization of eight pear cultivars grown in China. Food Chem. 2007, 104, 268–275. [Google Scholar] [CrossRef]
  49. Kalkisim, O.; Okcu, Z.; Karabulut, B.; Ozdes, D.; Duran, C. Evaluation of pomological and morphological characteristics and chemical compositions of local pear varieties (Pyrus communis L.) grown in Gumushane, Turkey. Erwerbs-Obstbau 2018, 60, 173–181. [Google Scholar] [CrossRef]
  50. Predieri, S.; Gatti, E. Effects of cold storage and shelf-life on sensory quality and consumer acceptance of ‘Abate Fetel’ pears. Postharvest Biol. Technol. 2009, 51, 342–348. [Google Scholar] [CrossRef]
  51. Torregrosa, L.; Echeverria, G.; Illa, J.; Giné-Bordonaba, J. Ripening behaviour and consumer acceptance of ‘Conference’ pears during shelf life after long term DCA-storage. Postharvest Biol. Technol. 2019, 155, 94–101. [Google Scholar] [CrossRef]
  52. Blanckenberg, A.; Muller, M.; Theron, K.; Crouch, E.M.; Steyn, W.J. Preference of consumers from the Western Cape Province of South Africa for pear eating quality and appearance. Acta Hortic. 2024, 1403, 43–52. [Google Scholar] [CrossRef]
  53. Pérez-Sánchez, R.; Morales-Corts, M.R. Agromorphological and chemical characterization of pear cultivars grown in Central–West Iberian peninsula. Agronomy 2023, 13, 2993. [Google Scholar] [CrossRef]
  54. HongMei, M.; Shujun, Z.; Qiang, G.; Aishajiang, M.; Xiaoyun, D.; Yuanjun, L.; Zhijuan, C. Variability of Pyrus communis accessions in China assessed using multivariate analysis. Eur. J. Hortic. Sci. 2022, 87, 1–11. [Google Scholar] [CrossRef]
  55. Zarei, A.; Erfani-Moghadam, J.; Jalilian, H. Assessment of variability within and among four Pyrus species using multivariate analysis. Flora 2019, 250, 27–36. [Google Scholar] [CrossRef]
  56. Zhang, Y.; Cao, Y.-f.; Huo, H.-l.; Xu, J.-y.; Tian, L.-m.; Dong, X.-g.; Qi, D.; Liu, C. An assessment of the genetic diversity of pear (Pyrus L.) germplasm resources based on the fruit phenotypic traits. J. Integr. Agric. 2022, 21, 2275–2290. [Google Scholar] [CrossRef]
  57. Simionca Mărcășan, L.I.; Oltean, I.; Popa, S.; Plazas, M.; Vilanova, S.; Gramazio, P.; Sestras, A.F.; Prohens, J.; Sestras, R.E. Comparative analysis of phenotypic and molecular data on response to main pear diseases and pest attack in a germplasm collection. Int. J. Mol. Sci. 2023, 24, 6239. [Google Scholar] [CrossRef]
  58. Simionca Mărcășan, L.I.; Pop, R.; Somsai, P.A.; Oltean, I.; Popa, S.; Sestras, A.F.; Militaru, M.; Botu, M.; Sestras, R.E. Comparative evaluation of Pyrus species to identify possible resources of interest in pear breeding. Agronomy 2023, 13, 1264. [Google Scholar] [CrossRef]
  59. Sharma, A.; Thakur, D.S.; Dangi, G.; Chauhan, N.; Verma, P. Qualitative and quantitative analysis of pear (Pyrus communis L.) germplasm for morphological and pomological traits using multivariate analysis. Appl. Fruit Sci. 2025, 67, 27. [Google Scholar] [CrossRef]
  60. Shafaei-Cherush, Z.; Arzani, K.; Ahmadi, N.; Mokhtassi-Bidgoli, A.; Ayyari, M.; Abdollahi, H. Improving pear (Pyrus spp.) harvest maturity assessment: Integration of color composite indicators and sophisticated multivariate analysis techniques. J. Agric. Food Res. 2025, 19, 101596. [Google Scholar] [CrossRef]
  61. Zheng, P.; Zhang, M.; Wang, Z.; Wang, T.; Tang, L.; Ma, E.; Liu, J.; Shi, F. Comprehensive evaluation of the fruit quality of the main cultivars of pear (Pyrus spp.) in North China. Erwerbs-Obstbau 2022, 64, 219–227. [Google Scholar] [CrossRef]
  62. Zhang, Y.; Cheng, Y.; Ma, Y.; Guan, J.; Zhang, H. Regulation of pear fruit quality: A review based on Chinese pear varieties. Agronomy 2025, 15, 58. [Google Scholar] [CrossRef]
  63. Paraschiv, M.; Maresi, E.; Militaru, M.; Hoza, D. Influence of genotypes and the storage time on pears quality indicators. Sci. Pap. Ser. B Hortic. 2024, 68, 128–138. [Google Scholar]
  64. Dan, G.; Ruth, B.-A.; Martin, G. Optimizing the harvest date for long-term storage of ‘Spadona’ pears (Pyrus communis L.) by prediction of the pre-climacteric minimum. Sci. Hortic. 2015, 197, 280–286. [Google Scholar] [CrossRef]
  65. Taiti, C.; Marone, E.; Lanza, M.; Azzarello, E.; Masi, E.; Pandolfi, C.; Giordani, E.; Mancuso, S. Nashi or Williams pear fruits? Use of volatile organic compounds, physicochemical parameters, and sensory evaluation to understand the consumer’s preference. Eur. Food Res. Technol. 2017, 243, 1917–1931. [Google Scholar] [CrossRef]
  66. Dan, C.; Șerban, C.; Sestras, A.F.; Militaru, M.; Morariu, P.; Sestras, R.E. Consumer perception concerning apple fruit quality, depending on cultivars and hedonic scale of evaluation—A case study. Not. Sci. Biol. 2015, 7, 140–149. [Google Scholar] [CrossRef]
  67. Morariu, P.A.; Mureșan, A.E.; Sestras, A.F.; Tanislav, A.E.; Dan, C.; Mareși, E.; Militaru, M.; Mureșan, V.; Sestras, R.E. A comprehensive morphological, biochemical, and sensory study of traditional and modern apple cultivars. Horticulturae 2025, 11, 264. [Google Scholar] [CrossRef]
  68. Lozano, L.; Iglesias, I.; Puy, J.; Echeverria, G. Performance of an expert sensory panel and instrumental measures for assessing eating fruit quality attributes in a pear breeding programme. Foods 2023, 12, 1426. [Google Scholar] [CrossRef]
  69. Rivaroli, S.; Calvia, M.; Spadoni, R.; Tartarini, S.; Gregori, R.; Calvo-Porral, C.; Canavari, M. Sensory perception and willingness to pay for a local ancient pear variety: Evidence from in-store experiments in Italy. Foods 2024, 13, 138. [Google Scholar] [CrossRef]
  70. Montero, M.L.; Colonna, A.E.; Gallardo, R.K.; Ross, C.F. Sensory profiling of pears from the Pacific Northwest: Consumers’ perspective and descriptive analysis. J. Food Sci. 2024, 89, 1225–1242. [Google Scholar] [CrossRef]
Figure 1. ‘Beurré Giffard’ and several other representative pear cultivars out of 25 tested for fruit quality.
Horticulturae 11 00468 g001
Figure 2. Comparative boxplot analysis of morphological and biochemical fruit traits in pear cultivars with different ripening periods. The small × symbol inside the boxes represents the mean of the trait. To assess differences among the three ripening groups, a one-way ANOVA was applied, with statistical significance set to p < 0.05; “ns” indicates non-significant differences, and “*” indicates significant differences.
Horticulturae 11 00468 g002
Figure 3. Hierarchical clustering analyses (UPGMA pairwise clustering) using the Euclidean similarity index based on morphological, biochemical and colorimetric parameters (skin color SU—on the sunny side and SH on the shaded side) for pear cultivars: (a) Six early-ripening; (b) Ten autumn-ripening; (c) Nine late-ripening.
Horticulturae 11 00468 g003
Figure 4. Comparative boxplot analysis of sensorial attributes of fruits in 25 pear cultivars with different ripening periods (early, autumn, and late), based on 1–9 hedonic scale ratings. The small × symbol inside the boxes represents the mean of the trait. To assess differences among the three ripening groups, a one-way ANOVA was applied, with statistical significance set to p < 0.05; “ns” indicates non-significant differences, and “*” indicates significant differences.
Horticulturae 11 00468 g004
Figure 5. Contribution (%) of organoleptic features to total fruit quality assessment (100%) based on hedonic sensory evaluation (1–9 scale) across pear groups of cultivars according to their ripening: (a) early; (b) autumn; (c) late, and (d) overall pear quality score by cultivar groups, depending on ripening period (Kruskal–Wallis test and Dunn’s post hoc test; p = 0.02593); different letters indicate significant differences between cultivar groups.
Horticulturae 11 00468 g005
Table 1. The main morphological characteristics of fruits and the firmness of 25 pear cultivars, categorized into three groups according to their ripening periods.
CultivarFruit Height
(mm)
Fruit Diameter
(mm)
Fruit Weight
(g)
Seeds/FruitFruit Firmness (HPE)
Early-ripening
‘Triumf’81.1 ± 5.2 b57.1 ± 2.8 b91.9 ± 4.5 d 7.33 ± 0.3 b55.2 ± 0.6 b
‘B. Giffard’63.4 ± 3.1 c48.9 ± 2.3 c61.4 ± 4.5 f 10.33 ± 0.4 a84.3 ± 0.8 a
‘Argessis’95.8 ± 2.3 a71.6 ± 0.3 a174.2 ± 3.0 a 8.00 ± 0.6 b82.2 ± 1.2 a
‘Carpica’76.2 ± 4.0 b59.3 ± 0.4 b104.0 ± 0.8 c 9.76 ± 0.4 a82.0 ± 2.1 a
‘Napoca’68.1 ± 0.8 c47.2 ± 0.3 c78.6 ± 1.7 e 9.33 ± 0.7 a79.2 ± 0.8 a
‘Daciana’95.1 ± 5.3 a58.0 ± 2.4 a142.5 ± 6.4 b 10.00 ± 0.6 a80.8 ± 0.9 a
Autumn-ripening
‘Adria’106.4 ± 4.1 a66.3 ± 2.9 b211.4 ± 11.7 b8.33 ± 0.9 bc73.2 ± 6.1 b
‘Arvena’71.3 ± 1.5 c66.7 ± 0.7 b168.6 ± 0.2 c10.33 ± 0.3 a21.4 ± 1.2 e
‘Cristal’78.9 ± 2.3 bc70.8 ± 2.1 ab190.9 ± 8.8 bc5.76 ± 0.7 d75.2 ± 0.5 ab
‘Ervina’98.0 ± 3.0 ab63.2 ± 1.0 b166.9 ± 13.1 c8.00 ± 0.6 bc81.8 ± 5.2 ab
‘Latina’91.5 ± 1.2 b71.5 ± 1.5 ab212.3 ± 15.2 b8.00 ± 0.1 bc58.3 ± 3.7 cd
‘Orizont’74.8 ± 0.8 c71.7 ± 0.4 ab208.5 ± 3.5 b9.76 ± 0.7 a 74.5 ± 0.8 ab
‘Paradox’88.4 ± 2.3 b66.0 ± 1.3 b178.0 ± 6.2 c7.73 ± 0.3 c83.3 ± 1.5 a
‘Romcor’79.6 ± 3.2 bc76.8 ± 0.9 a253.1 ± 11.2 a 8.76 ± 0.3 b57.5 ± 3.9 cd
‘Packham’s T.’87.6 ± 2.1 b73.2 ± 0.8 ab215.9 ± 7.8 b7.33 ± 0.4 c63.1 ± 3.6 c
‘Williams’92.1 ± 1.2 b72.0 ± 0.7 ab219.7 ± 9.9 b9.76 ± 0.3 a53.2 ± 4.8 d
Late-ripening
‘Euras’54.7 ± 2.5 d55.5 ± 0.2 c95.4 ± 2.3 e8.00 ± 0.6 a79.4 ± 1.6 b
‘Isadora’82.9 ± 4.1 b66.8 ± 2.1 b192.3 ± 13.8 d8.33 ± 0.3 a73.7 ± 1.7 bc
‘Pandora’85.6 ± 1.8 b75.4 ± 1.5 b207.3 ± 2.5 d8.00 ± 0.6 a66.5 ± 2.8 c
‘Paradise’85.7 ± 1.8 b75.4 ± 1.5 b233.7 ± 7.8 c8.00 ± 0.6 a83.3 ± 0.5 a
‘Milenium’82.8 ± 3.7 b73.2 ± 2.2 b253.7 ± 30.1 bc8.00 ± 0.6 a66.7 ± 3.7 c
‘Primadona’107.9 ± 2.2 a70.2 ± 0.9 b235.3 ± 9.0 c8.33 ± 0.3 a55.0 ± 5.1 d
‘Virgiliu H.’112.7 ± 5.9 a73.6 ± 1.2 b261.7 ± 14.0 bc9.00 ± 0.6 a42.6 ± 3.0 e
‘Paramis’86.0 ± 1.0 b85.6 ± 1.1 a332.0 ± 12.2 a8.33 ± 0.9 a78.8 ± 3.3 b
‘Republica’68.7 ± 2.4 c84.7 ± 1.8 a284.9 ± 12.8 b6.76 ± 0.3 b77.6 ± 0.3 b
Duncan’s test indicates no statistically significant difference between any two means in a column that share the same letter for any attribute within any ripening group (α < 0.05).
Table 2. Chemical attributes of fruits of 25 pear cultivars, categorized into three groups according to their ripening times.
CultivarTSS (%)pHCitric Acid (%)Tartaric Acid (%)Malic Acid (%)
Early-ripening
‘Triumf’14.0 ± 0.2 c4.57 ± 0.1 a0.15 ± 0.02 c0.16 ± 0.02 c0.18 ± 0.02 c
‘B. Giffard’20.4 ± 0.3 a4.70 ± 0.1 a0.11 ± 0.01 e0.13 ± 0.01 e0.12 ± 0.01 e
‘Argessis’14.3 ± 0.3 c4.11 ± 0.0 b0.11 ± 0.01 e0.13 ± 0.01 e0.11 ± 0.01 e
‘Carpica’16.0 ± 0.4 b4.07 ± 0.0 b0.13 ± 0.01 d0.16 ± 0.02 d0.14 ± 0.02 d
‘Napoca’16.2 ± 0.3 b4.13 ± 0.1 b0.36 ± 0.03 b0.42 ± 0.03 b0.38 ± 0.04 b
‘Daciana’14.2 ± 0.5 c3.63 ± 0.1 c0.56 ± 0.04 a0.66 ± 0.07 a0.59 ± 0.07 a
Autumn-ripening
‘Adria’15.2 ± 0.4 b3.60 ± 0.2 b0.34 ± 0.02 c0.40 ± 0.03 c0.36 ± 0.02 c
‘Arvena’16.3 ± 0.5 ab4.31 ± 0.1 a0.10 ± 0.01 g0.11 ± 0.01 g0.10 ± 0.01 g
‘Cristal’13.4 ± 0.1 c4.02 ± 0.1 ab0.32 ± 0.02 c0.37 ± 0.04 c0.33 ± 0.04 c
‘Ervina’15.2 ± 0.2 b4.14 ± 0.1 a0.35 ± 0.03 c0.41 ± 0.05 c0.36 ± 0.02 c
‘Latina’16.5 ± 0.7 a3.92 ± 0.1 ab0.23 ± 0.02 e0.26 ± 0.01 e0.24 ± 0.01 e
‘Orizont’16.8 ± 0.8 a3.48 ± 0.2 b0.81 ± 0.05 a0.95 ± 0.07 a0.85 ± 0.09 a
‘Paradox’12.9 ± 0.2 c3.66 ± 0.1 b0.26 ± 0.02 d0.31 ± 0.02 d0.28 ± 0.05 d
‘Romcor’15.0 ± 0.3 b3.64 ± 0.2 b0.50 ± 0.04 b0.58 ± 0.03 b0.52 ± 0.07 b
‘Packham’s T.’13.8 ± 0.4 bc4.10 ± 0.1 a0.19 ± 0.02 f0.22 ± 0.01 f0.19 ± 0.02 f
‘Williams’14.4 ± 0.3 bc3.96 ± 0.1 ab0.51 ± 0.06 b0.60 ± 0.07 b0.54 ± 0.06 b
Late-ripening
‘Euras’18.1 ± 0.3 a5.15 ± 0.1 a0.18 ± 0.2 e0.10 ± 0.2 i0.10 ± 0.2 g
‘Isadora’15.8 ± 0.1 b4.87 ± 0.1 a0.10 ± 0.1 h0.11 ± 0.1 hi0.10 ± 0.1 g
‘Pandora’17.0 ± 0.2 ab3.93 ± 0.3 b0.10 ± 0.2 h0.12 ± 0.2 gh0.11 ± 0.2 g
‘Paradise’13.4 ± 0.1 c4.13 ± 0.2 b0.46 ± 0.6 a0.54 ± 0.7 a0.49 ± 0.7 a
‘Milenium’18.0 ± 0.1 a4.24 ± 0.1 b0.12 ± 0.2 g0.14 ± 0.2 f0.12 ± 0.2 f
‘Primadona’14.9 ± 0.2 b4.13 ± 0.1 b0.24 ± 0.5 c0.28 ± 0.5 c0.25 ± 0.6 c
‘Virgiliu H.’17.2 ± 0.1 ab4.34 ± 0.1 b0.15 ± 0.2 f0.18 ± 0.2 e0.16 ± 0.2 e
‘Paramis’11.7 ± 0.4 d3.97 ± 0.2 b0.20 ± 0.2 d0.21 ± 0.3 d0.20 ± 0.5 d
‘Republica’13.3 ± 0.2 c4.66 ± 0.1 ab0.40 ± 0.3 b0.46 ± 0.6 b0.41 ± 0.7 b
Duncan’s test indicates no statistically significant difference between any two means in a column that share the same letter for any attribute within any ripening group (α < 0.05).
Table 3. Color indices (CIE L*a*b* standard) for skin color on sunny and shaded parts of fruits in 25 pear cultivars, classified into three groups according to ripening times.
CultivarSkin Color—Sunny SideSkin Color—Shading Side
L*a*b*L*a*b*
Early-ripening
‘Triumf’44.5 ± 5.0 b16.4 ± 7.7 b19.4 ± 3.0 b70.9 ± 0.8 a−8.5 ± 2.6 c33.4 ± 1.2 a
‘B. Giffard’34.0 ± 0.4 d19.0 ± 1.2 a10.7 ± 0.4 e61.0 ± 1.2 b−14.2 ± 0.3 b27.3 ± 0.5 b
‘Argessis’34.8 ± 1.7 d20.0 ± 1.1 a12.6 ± 1.2 d65.1 ± 1.6 a−14.0 ± 0.3 b27.8 ± 0.4 b
‘Carpica’33.4 ± 0.5 d19.4 ± 0.3 a11.6 ± 0.9 de66.7 ± 0.3 a−15.6 ± 0.3 a28.3 ± 0.3 b
‘Napoca’53.6 ± 2.1 a3.0 ± 0.7 c24.1 ± 1.3 a61.7 ± 1.3 ab−14.3 ± 0.4 b27.6 ± 0.3 b
‘Daciana’39.7 ± 5.1 c17.2 ± 3.5 b14.6 ± 2.4 c68.4 ± 1.1 a−15.2 ± 0.7 a30.8 ± 0.4 ab
Autumn-ripening
‘Adria’66.9 ± 4.7 a−2.7 ± 5.0 30.6 ± 2.8 ab68.6 ± 2.3 a−6.7 ± 0.5 31.9 ± 1.6 a
‘Arvena’59.0 ± 2.1 b−0.2 ± 1.6 27.2 ± 1.0 b55.5 ± 1.0 b0.8 ± 0.7 25.2 ± 0.6 b
‘Cristal’60.8 ± 4.5 ab−10.9 ± 0.8 27.7 ± 1.6 b65.1 ± 0.8 a−12.8 ± 0.1 28.6 ± 0.5 ab
‘Ervina’64.1 ± 3.3 ab−5.6 ± 0.3 29.1 ± 1.2 ab59.2 ± 0.7 ab−7.7 ± 1.2 27.1 ± 0.4 ab
‘Latina’56.8 ± 5.0 b−2.9 ± 6.0 26.1 ± 2.4 b68.0 ± 1.8 a−2.7 ± 3.2 29.8 ± 0.9 a
‘Orizont’49.1 ± 0.1 c8.1 ± 0.3 24.6 ± 0.6 bc63.5 ± 1.1 a−15.2 ± 0.4 31.1 ± 0.4 a
‘Paradox’63.0 ± 1.1 ab−11.8 ± 1.1 27.2 ± 0.4 b65.4 ± 1.7 a−11.3 ± 1.9 28.1 ± 0.5
‘Romcor’50.3 ± 2.9 c−3.5 ± 4.9 22.9 ± 1.5 c55.5 ± 2.6 b−13.9 ± 0.3 25.7 ± 1.0 b
‘Packham’s T.’66.5 ± 1.8 a−1.0 ± 1.7 31.8 ± 0.5 a65.4 ± 1.7 a−2.1 ± 0.3 30.3 ± 0.4 a
‘Williams’56.2 ± 4.0 b−4.8 ± 4.0 27.3 ± 2.6 b59.3 ± 2.2 ab−8.5 ± 0.2 28.8 ± 1.1 a
Late-ripening
‘Euras’55.9 ± 2.0 b−3.3 ± 3.4 25.1 ± 1.4 c60.9 ± 2.1 b−13.1 ± 0.5 27.8 ± 0.8 bc
‘Isadora’68.3 ± 1.8 a−7.0 ± 0.5 29.8 ± 4.4 b73.4 ± 1.7 a−6.0 ± 0.6 33.6 ± 0.3 a
‘Pandora’71.4 ± 0.6 a−1.1 ± 1.1 33.0 ± 0.6 a73.8 ± 1.0 a−1.3 ± 0.3 33.2 ± 1.0 a
‘Paradise’41.1 ± 1.1 c25.2 ± 1.6 15.6 ± 0.8 d63.2 ± 3.6 b0.4 ± 0.2 27.5 ± 1.5 bc
‘Milenium’58.2 ± 0.7 b−1.0 ± 2.3 28.4 ± 1.9 b58.6 ± 1.6 b−3.2 ± 1.528.7 ± 2.3 bc
‘Primadona’63.3 ± 0.3 ab−5.2 ± 0.7 32.6 ± 0.4 a64.6 ± 1.4 b−6.9 ± 1.333.3 ± 0.8 a
‘Virgiliu H.’62.8 ± 2.3 ab−1.2 ± 0.2 28.7 ± 1.7 b60.2 ± 2.5 b−3.1 ± 2.829.8 ± 1.0 b
‘Paramis’65.5 ± 2.4 ab−0.2 ± 0.6 31.7 ± 4.1 a61.4 ± 3.2 b1.7 ± 1.326.8 ± 1.1 c
‘Republica’54.6 ± 4.1 b−6.4 ± 2.0 24.7 ± 1.7 c51.9 ± 4.4 c−5.4 ± 1.823.4 ± 1.7 d
Duncan’s test indicates no statistically significant difference between any two means in a column that share the same letter for any attribute within any ripening group (α < 0.05).
Table 4. Average scores (mean ± SEM) for key fruit quality attributes based on organoleptic assessments using 1–9 hedonic scale ratings for 25 pear cultivars (six early, ten autumn, and nine late-ripening).
No.CultivarFruit
Size
Fruit
Shape
Fruit
Color
Pulp
Color
ConsistencyJuicinessTasteAroma
Early cultivars
1‘Triumf’6.8 ± 0.4 b7.8 ± 0.2 ab8.1 ± 0.4 a8.2 ± 0.5 a6.3 ± 0.3 c6.4 ± 0.4 bc6.7 ± 0.4 b6.8 ± 0.4 b
2‘B. Giffard’4.8 ± 0.2 c6.7 ± 0.4 c6.5 ± 0.2 c6.5 ± 0.3 c6.8 ± 0.4 b6.2 ± 0.3 c6.4 ± 0.3 b5.9 ± 0.2 c
3‘Argessis’6.6 ± 0.3 b7.6 ± 0.3 b7.9 ± 0.3 b7.5 ± 0.4 b6.9 ± 0.2 b6.6 ± 0.4 b6.6 ± 0.4 b6.8 ± 0.4 b
4‘Carpica’4.9 ± 0.1 c6.7 ± 0.2 c6.6 ± 0.2 c6.6 ± 0.2 c6.9 ± 0.1 b7.2 ± 0.5 a7.4 ± 0.3 a7.4 ± 0.5 a
5‘Napoca’7.3 ± 0.3 ab7.3 ± 0.3 b7.3 ± 0.4 b7.5 ± 0.3 b 7.4 ± 0.4 a7.2 ± 0.3 a7.1 ± 0.5 a7.3 ± 0.4 a
6‘Daciana’8.4 ± 0.4 a8.2 ± 0.4 a8.2 ± 0.5 a7.9 ± 0.4 a7.3 ± 0.5 a7.3 ± 0.4 a6.7 ± 0.2 b6.7 ± 0.3 b
Autumn cultivars
1‘Adria’8.8 ± 0.6 a9.0 ± 0.3 a8.0 ± 0.6 b8.0 ± 0.4 b7.7 ± 0.7 ab7.0 ± 0.6 c6.4 ± 0.2 c6.0 ± 0.2 c
2‘Arvena’8.2 ± 0.3 b7.4 ± 0.5 c7.3 ± 0.3 d7.5 ± 0.6 c6.9 ± 0.4 c7.6 ± 0.3 b7.4 ± 0.4 ab7.2 ± 0.4 b
3‘Cristal’7.0 ± 0.5 c7.9 ± 0.2 bc7.6 ± 0.5 c7.5 ± 0.3 c7.4 ± 0.3 b7.0 ± 0.4 b7.1 ± 0.3 b7.1 ± 0.5 b
4‘Ervina’8.5 ± 0.4 b7.6 ± 0.4 c7.5 ± 0.2 c8.0 ± 0.6 b7.0 ± 0.5 c7.0 ± 0.5 c7.2 ± 0.4 b7.0 ± 0.6 b
5‘Latina’8.3 ± 0.3 b7.9 ± 0.6 bc7.0 ± 0.4 e7.7 ± 0.5 b7.1 ± 0.4 c7.8 ± 0.6 b6.4 ± 0.5 cd6.4 ± 0.7 c
6‘Orizont’7.2 ± 0.2 c7.6 ± 0.3 c7.8 ± 0.5 b8.2 ± 0.7 b7.7 ± 0.7 b7.7 ± 0.7 b7.9 ± 0.7 a8.0 ± 0.3 a
7‘Paradox’8.4 ± 0.5 b8.2 ± 0.2 b8.6 ± 0.2 a8.4 ± 0.5 a8.0 ± 0.4 a8.4 ± 0.3 a7.8 ± 0.6 a8.1 ± 0.4 a
8‘Romcor’7.1 ± 0.1 c6.1 ± 0.4 d6.9 ± 0.6 e7.4 ± 0.4 e7.6 ± 0.6 b7.3 ± 0.5 c7.0 ± 0.5 a6.8 ± 0.5 bc
9‘Packham’s T.’8.2 ± 0.3 b7.8 ± 0.3 bc8.0 ± 0.5 b8.2 ± 0.3 b7.9 ± 0.5 a8.0 ± 0.6 b7.6 ± 0.4 ab7.8 ± 0.2 a
10‘Williams’8.1 ± 0.6 b7.8 ± 0.5 bc7.4 ± 0.3 d7.3 ± 0.2 d7.2 ± 0.4 c7.3 ± 0.4 c6.2 ± 0.3 d6.3 ± 0.3 c
Late cultivars
1‘Euras’6.7 ± 0.5 b7.6 ± 0.6 b6.7 ± 0.4 c7.3 ± 0.5 bc5.9 ± 0.4 c5.8 ± 0.6 c6.1 ± 0.4 b5.9 ± 0.3 bc
2‘Isadora’8.4 ± 0.4 a8.4 ± 0.7 a8.9 ± 0.5 a8.4 ± 0.4 a8.3 ± 0.6 a7.8 ± 0.3 a7.0 ± 0.6 a7.1 ± 0.4 ab
3‘Pandora’8.4 ± 0.5 a7.8 ± 0.4 b7.4 ± 0.3 b7.9 ± 0.6 b7.6 ± 0.2 b7.8 ± 0.4 a7.4 ± 0.4 a7.2 ± 0.5 ab
4‘Paradise’7.2 ± 0.4 b6.1 ± 0.5 d6.3 ± 0.4 c6.9 ± 0.5 c7.3 ± 0.6 b7.1 ± 0.6 b7.0 ± 0.5 a6.8 ± 0.6 ab
5‘Milenium’8.3 ± 0.2 a8.1 ± 0.4 ab7.5 ± 0.5 b7.8 ± 0.4 b6.8 ± 0.3 b7.1 ± 0.4 b7.3 ± 0.4 a7.4 ± 0.3 a
6‘Primadona’7.7 ± 0.3 ab6.8 ± 0.5 c7.9 ± 0.3 b7.9 ± 0.6 b6.1 ± 0.5 c5.4 ± 0.5 c5.1 ± 0.6 c6.4 ± 0.5 b
7‘Virgiliu H.’8.3 ± 0.4 a8.3 ± 0.3 a8.6 ± 0.2 a7.7 ± 0.3 b5.8 ± 0.3 c5.4 ± 0.6 c4.9 ± 0.3 c4.7 ± 0.4 cd
8‘Paramis’7.1 ± 0.5 b7.3 ± 0.4 bc7.7 ± 0.5 b7.5 ± 0.6 b7.6 ± 0.6 b7.3 ± 0.5 ab6.1 ± 0.5 b5.6 ± 0.3 c
9‘Republica’6.8 ± 0.4 b6.3 ± 0.3 c5.9 ± 0.4 c6.5 ± 0.4 d6.1 ± 0.4 c5.8 ± 0.4 c4.3 ± 0.4 c3.8 ± 0.4 d
Duncan’s test indicates no statistically significant difference between any two means in a column that share the same letter for any attribute within any ripening group (α < 0.05).
Table 5. Hierarchy of overall fruit quality based on organoleptic assessments of 25 pear cultivars grouped by ripening period.
Early CultivarsOverall Score (Mean ± SEM) and SignificanceAutumn
Cultivars
Overall Score (Mean ± SEM) and SignificanceLate CultivarsOverall Score (Mean ± SEM) and Significance
‘Daciana’7.6 ± 0.4 a‘Paradox’8.2 ± 0.2 a‘Isadora’8.0 ± 0.7 a
‘Napoca’7.3 ± 0.5 a‘Packham’s T.’7.9 ± 0.3 b‘Pandora’7.7 ± 0.4 a
‘Argessis’7.1 ± 0.4 ab‘Orizont’7.8 ± 0.4 bc‘Milenium’7.5 ± 0.4 a
‘Triumf’7.1 ± 0.4 ab‘Adria’7.6 ± 0.5 c‘Paramis’7.0 ± 0.5 b
‘Carpica’6.7 ± 0.2 b‘Ervina’7.5 ± 0.5 b‘Paradise’6.8 ± 0.3 b
‘B. Giffard’6.2 ± 0.3 c‘Arvena’7.4 ± 0.6 cd‘Virgiliu H.’6.7 ± 0.4 b
‘Latina’7.3 ± 0.3 d‘Primadona’6.6 ± 0.3 b
‘Cristal’7.3 ± 0.4 d‘Euras’6.5 ± 0.6 b
‘Williams’7.2 ± 0.4 d‘Republica’5.7 ± 0.4 c
‘Romcor’7.0 ± 0.3 cd
Duncan’s test indicates no statistically significant difference between any two means in a column that share the same letter for any attribute within any ripening group (α < 0.05).
Disclaimer/Publisher’s Note: The statements, opinions and data contained in all publications are solely those of the individual author(s) and contributor(s) and not of MDPI and/or the editor(s). MDPI and/or the editor(s) disclaim responsibility for any injury to people or property resulting from any ideas, methods, instructions or products referred to in the content.

