Article

The Interaction Between Soil Microorganisms and Understory Ginseng During Its Growth

College of Traditional Chinese Medicine, Jilin Agricultural University, Changchun 130118, China
*
Authors to whom correspondence should be addressed.
Horticulturae 2025, 11(5), 467; https://doi.org/10.3390/horticulturae11050467
Submission received: 3 April 2025 / Revised: 19 April 2025 / Accepted: 25 April 2025 / Published: 26 April 2025
(This article belongs to the Section Medicinals, Herbs, and Specialty Crops)

Abstract

:
Soil, as the foundation for the survival of understory ginseng, directly impacts its growth and development. However, studies focusing on the role of soil in determining the quality of understory ginseng are limited. This study examines the relationship between quality and yield of 5-, 9-, and 17-year-old understory ginseng and their soil microbiota. The results indicate that with the increase in growth years, the overall biomass of understory ginseng generally shows an upward trend, while its quality slightly decreases at 9 years. Compared to the other two growth years, the soil from 9-year-old ginseng shows lower enzyme activity and pH and a higher abundance of pathogens. The 17 years soil has higher OM and AHN content, along with increased abundance of denitrifying and nitrogen-reducing bacteria. Correlation networks reveal that AK significantly influences ginsenoside content, while AP and AHN are more closely related to soil microorganisms. Compared with other types of ginsenosides, ginsenosides Rh2 and Rd are affected by a greater variety of soil microorganisms and chemical factors. As growth years increase, the changes in ginseng quality, soil nutrients, and soil microbiota do not follow a single linear trend; instead, there appears to be a bottleneck phase at certain intermediate stages.

1. Introduction

Panax ginseng C.A. Mey, belonging to the Araliaceae family and the genus Panax, is a perennial herbaceous plant known for its high medicinal value from its dried roots and is revered as the “King of All Herbs”. Recent studies have indicated that ginsenosides, the active components found in ginseng, can reduce damage to cardiac muscle cells and inhibit cancer occurrence [1,2,3]. Polysaccharides found in ginseng have been shown to possess anti-tumor, blood sugar-lowering, anti-fatigue, antioxidant, and immunomodulatory effects [4,5,6]. Currently, there are three main ginseng cultivation models: under-forest cultivation, farmland cultivation, and deforestation cultivation. Understory ginseng refers to ginseng plants grown from seeds that are manually sown in forests, simulating the growing environment of wild ginseng. This method involves artificial care and cultivation, and the medicinal and economic value of understory ginseng is higher compared to regular ginseng [7,8]. In recent years, with the implementation of policies such as returning farmland to forests and banning logging for ginseng cultivation, the under-forest cultivation model has become an effective way to ease the conflict between forestry and agriculture. It is also an important approach to promote the sustainable development of forestry and the healthy growth of the ginseng industry [9]. In addition, after the fifth year of growth, ginseng cultivated in farmlands or through deforestation experiences a significant increase in the incidence of root rot and red skin disease, leading to a sharp rise in mortality. In contrast, understory ginseng can grow for ten years or even several decades, with a significantly higher medicinal value compared to the former two cultivation methods. [10,11].
Ginseng growth is influenced by various environmental factors, including light, temperature, and soil conditions [12,13,14]. Soil, as the fundamental environment for ginseng’s survival, directly affects its growth and the accumulation of ginsenosides [15]. Soil is a complex microecosystem, with a close relationship between nutrients, enzymes, and microorganisms. Increasing evidence suggests that rhizosphere microorganisms play a crucial role in nutrient cycling, organic matter decomposition, and maintaining soil fertility [16]. Studies have shown that the rhizosphere microbial community of ginseng is affected by multiple complex factors such as cultivation age, developmental stage, and cultivation method. At the same time, soil chemical properties directly affect the growth and development of ginseng, and soil enzyme activity also significantly impacts the growth and quality of ginseng roots by altering the structure of soil microorganisms. [17,18,19].
Based on the understanding above, a question naturally arises: Why does cultivated ginseng in farmland suffer widespread disease and mortality after just five years of growth, while forest-grown ginseng can thrive for decades like wild ginseng? Is it because forest-grown ginseng possesses stronger disease resistance, enabling its “longevity”, or do they also undergo the same growth “bottleneck” period as cultivated ginseng but manage to overcome it? This study, based on 16S rRNA technology and Biolog-ECO plates, compares the soil chemical properties, enzyme activities, and microbial communities among 5-year-old, 9-year-old, and 17-year-old understory ginseng soils. This study aims to explore the relationship between the soil microecosystem, the growth of understory ginseng, and the content of ginsenosides, and attempts to construct a relationship network among ginseng, soil, and microorganisms.

2. Materials and Methods

2.1. Background of the Study Location

The area where samples were gathered is situated at a forest understory ginseng cultivation site in Liuhe County, Tonghua City, Jilin Province, China (125°25′07″ E, 42°03′01″ N). This region experiences a continental monsoon climate pattern, characterized by an average annual temperature of 5 °C. The mean annual precipitation amounts to 750 mm. Additionally, the average annual sunshine duration is 2551 h, and the frost-free period ranges from 126 to 138 days.

2.2. Quadrat Setup and Sample Collection

Understory ginseng seeds were evenly sown in the forest in 2002, 2010, and 2014. In September 2019, ginseng and rhizosphere soil samples were collected from 5-year-old, 9-year-old, and 17-year-old understory ginseng plants in the forest. For each age group (5 years, 9 years, and 17 years), five 2 m × 2 m plots were randomly established in the forest. From each plot, the fallen leaves and other ground litter were first cleaned up. Then, all understory ginseng plants were carefully dug up, and their rhizosphere soil was collected by gently shaking the roots to remove loosely adhering soil and then brushing off the tightly adhering soil. The ginseng samples were brought back to the laboratory, cleaned, measured, and then placed in an oven at 40 °C to dry before being ground and passed through a 0.15 mm sieve. The soil was divided into three portions: Samples were processed in multiple ways to suit different analytical requirements. A portion of the samples was air-dried at room temperature, which was intended for the assessment of various chemical attributes. This included testing for pH levels, electrical conductivity (EC), organic matter (OM) content, as well as the activities of specific enzymes such as S-SC, S-UE, S-CAT, and S-ACP. Another part of the samples was also air-dried at room temperature but was designated for comprehensive physicochemical and enzyme activity analysis. A separate part was kept in a refrigerator at 4 °C for subsequent Biolog-ECO analysis. The remaining part was stored at −80 °C to be used for microbial analysis.

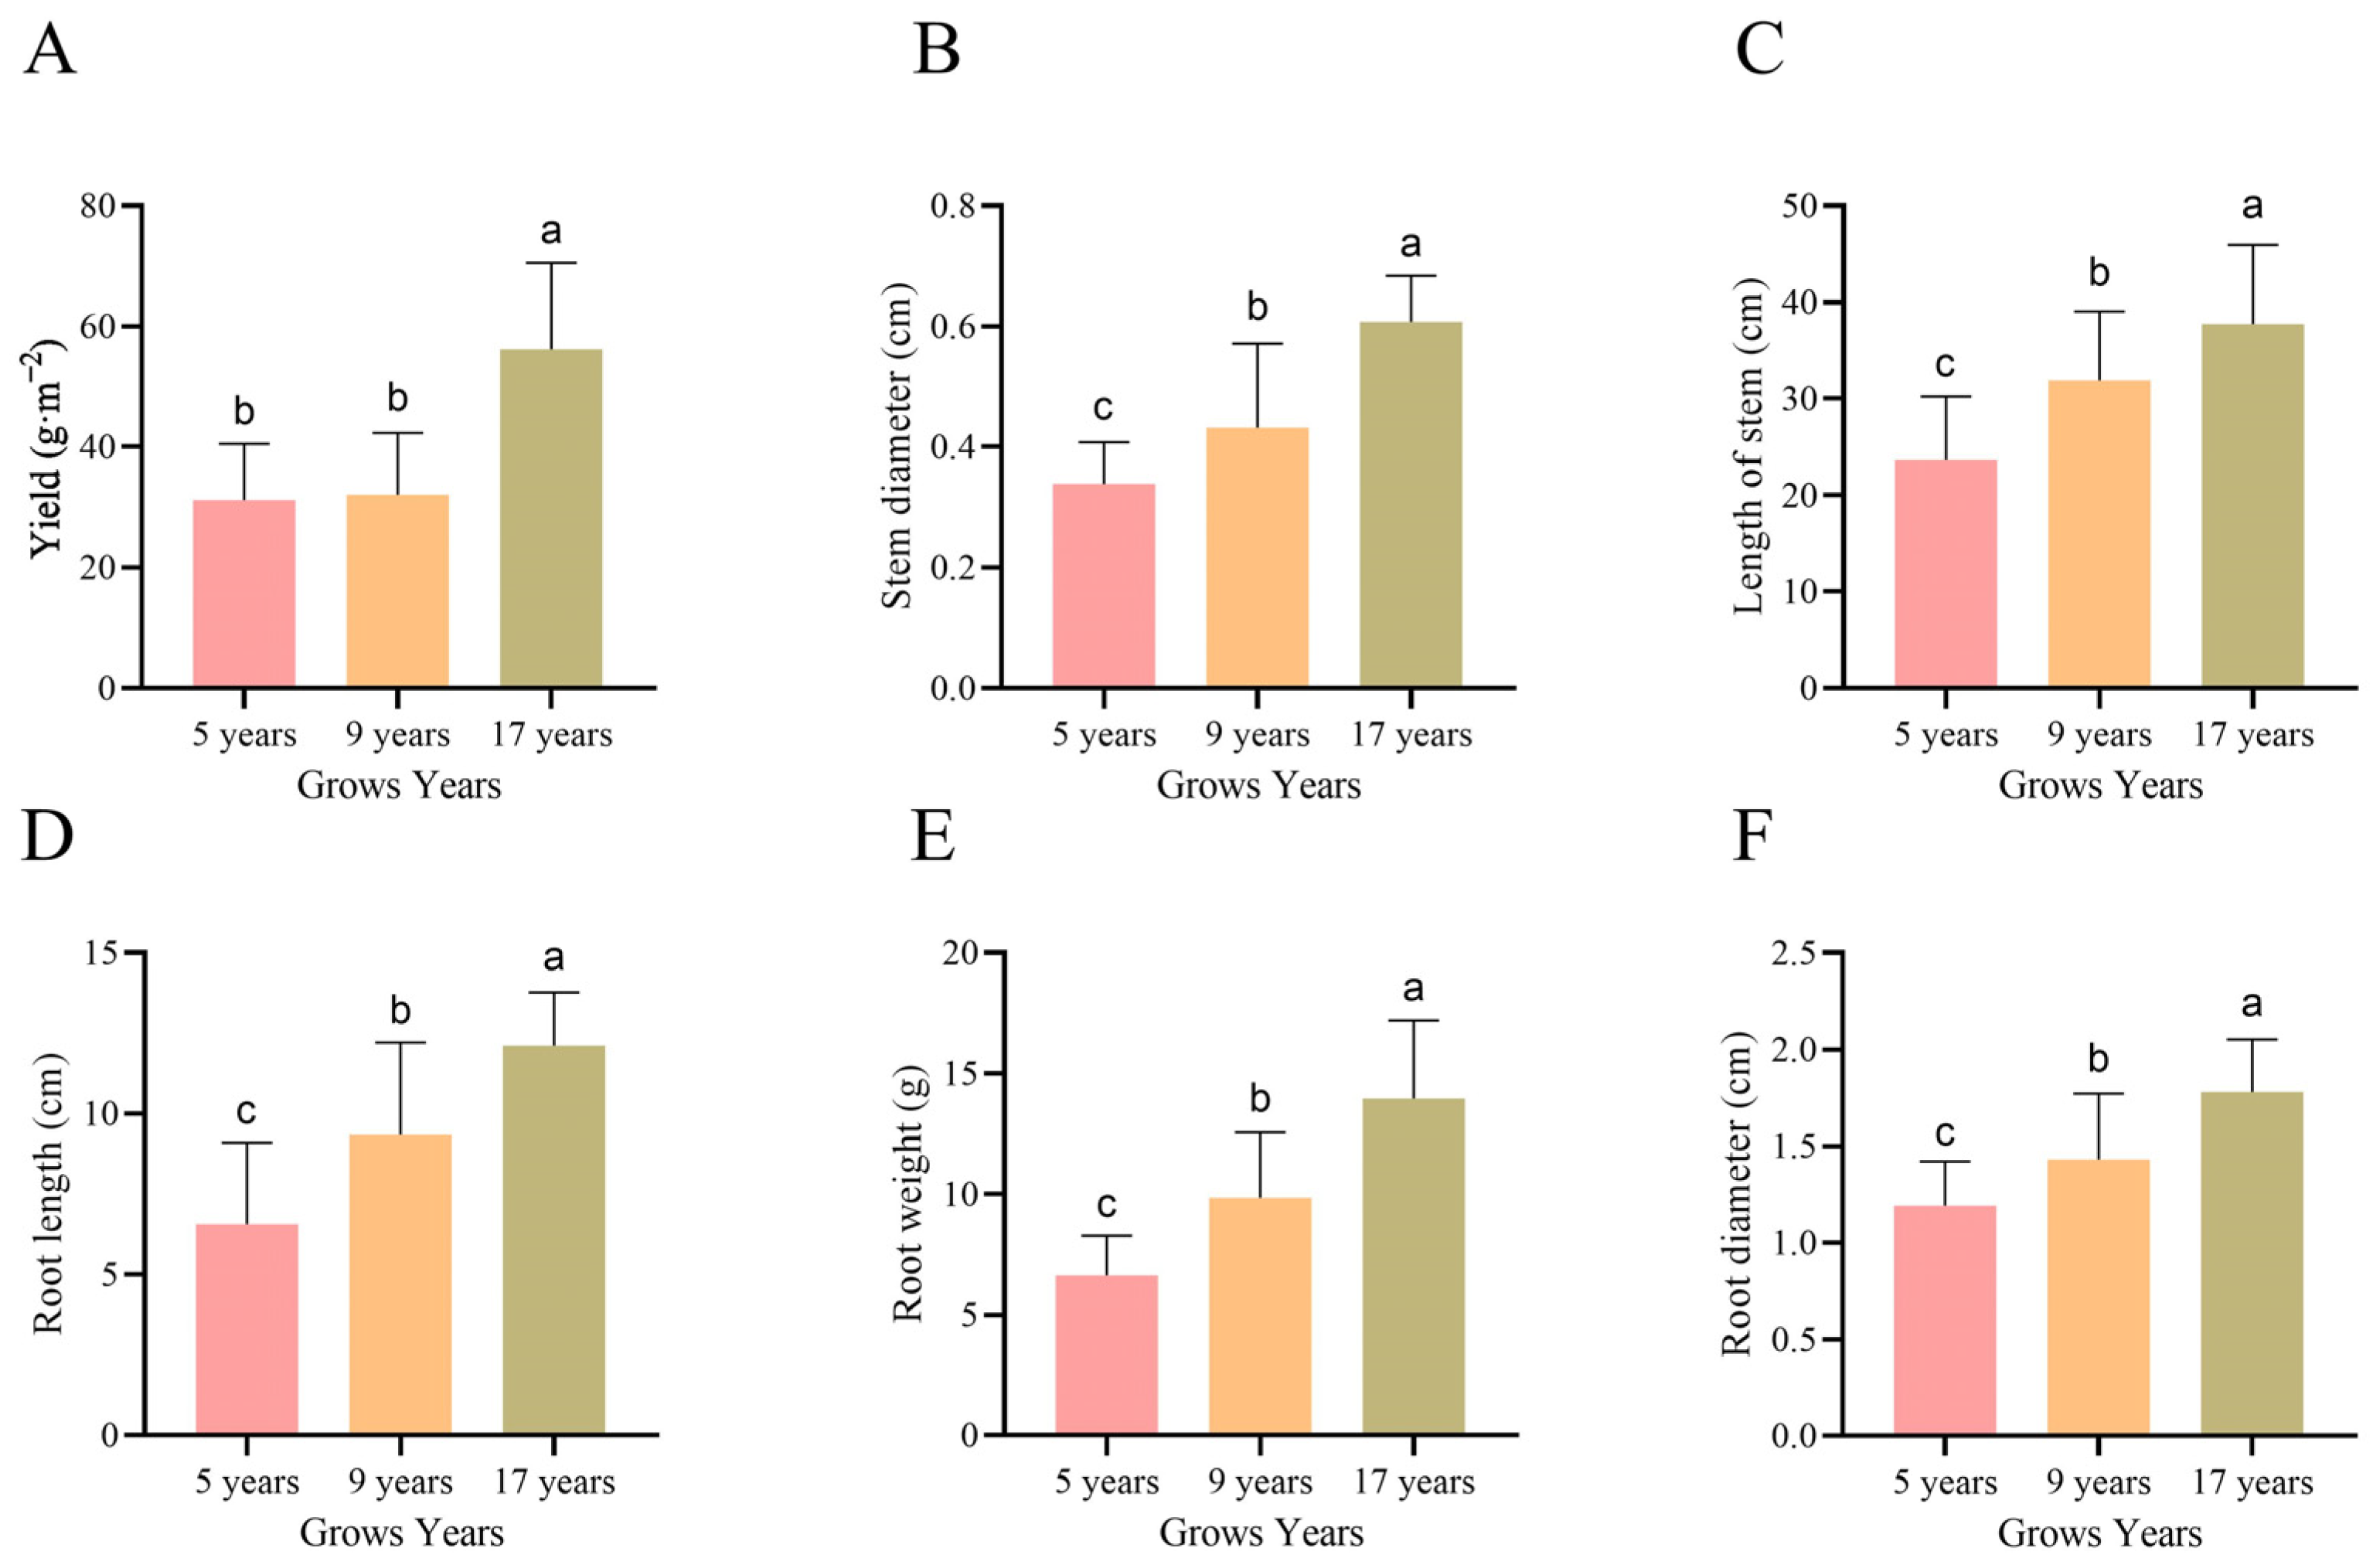
2.3. Determination of Understory Ginseng Yield

The total yield of the quadrat was calculated by summing the weight of all understory ginseng roots within the plot.

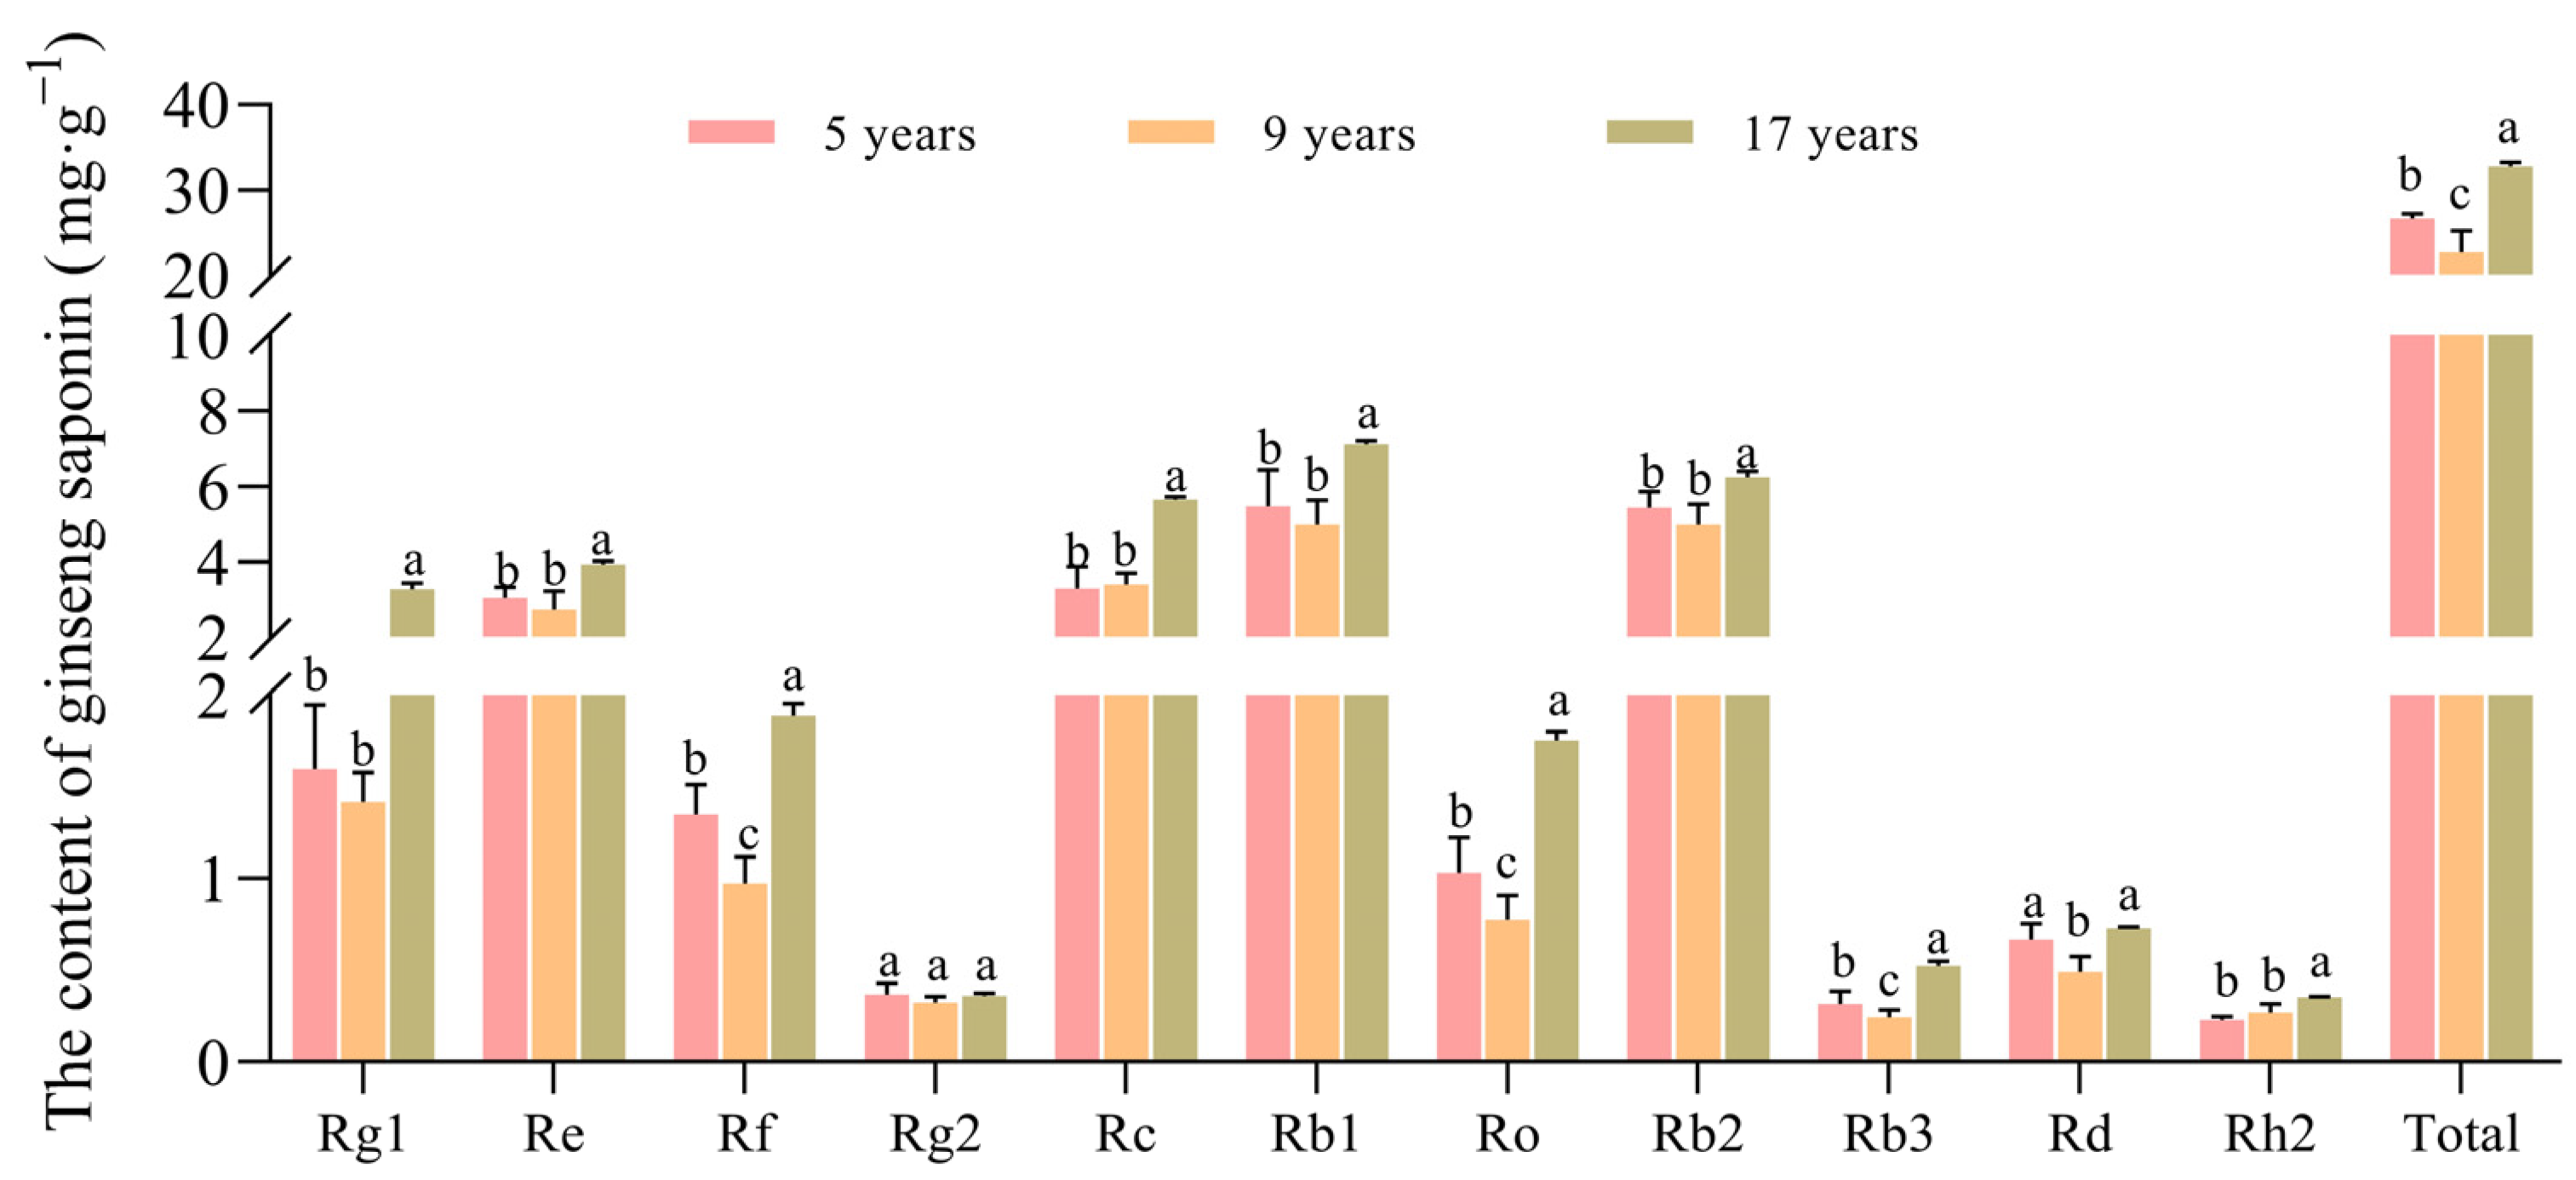
2.4. Determination of Ginsenoside Content of Understory Ginseng

Preparation of Test Samples Accurately weigh 0.400 g of the powder, and add methanol at a solid-to-liquid ratio of 1:30. Conduct five parallel determinations for each group. Perform ultrasonic extraction at 30 °C for 30 min, followed by filtration. Repeat this extraction process three times in total. Combine all the filtrates and concentrate them. Adjust the volume to 5 mL with methanol, and filter the solution through a 0.22 μm membrane for storage. Reference preparation: Precisely weigh 20.0 mg each of ginsenosides Rg2, Rc, and Rb1, 10.0 mg each of Rg1, Re, Rb2, and Rd, and 5.0 mg each of Rf and Rb3. Transfer these into a 10 mL volumetric flask, add 7 mL of methanol, and shake vigorously to ensure complete dissolution. Top up the volume to the mark with methanol. After withdrawing 1 mL of the mixed solution, dilute it to 10 mL, yielding ginseng monomer saponin solutions with concentrations of 0.2 mg·mL−1, 0.1 mg·mL−1, and 0.05 mg·mL−1. Filter the solutions through a 0.22 μm membrane before use.
Chromatographic conditions: The determination is carried out using an Agilent ZORBAX SB-C18 column (4.6 mm × 250 mm, 5 μm). The mobile phase is composed of water (A) and acetonitrile (B), with a flow rate of 0.95 mL·min−1. Set the column temperature at 25 °C, the injection volume at 10 μL, and the detection wavelength at 203 nm. The gradient elution conditions are presented in Table 1.
Standard curve plotting: The ginsenoside mixed solution was injected as samples in volumes of 2, 5, 7, 10, 12, 15, 18, and 20 μL according to the chromatographic conditions. A calibration curve was constructed by plotting the peak area values (Y-axis) against the corresponding solution mass concentrations (X-axis). The results are shown in Table 2.

2.5. Soil Chemical Analysis

Soil pH and electrical conductivity (EC) were measured using an ion meter with a 1:5 soil-water ratio as specified in international standards. For soil organic matter (OM) content, the potassium dichromate dilution heat method was employed [20]. Alkali-hydrolyzed nitrogen (AHN) was determined via the alkali-hydrolyzed diffusion technique [21]. Available phosphorus (AP) content was assessed by extracting with sodium bicarbonate followed by molybdenum–antimony resistance colorimetry [22], while available potassium (AK) was analyzed through ammonium acetate extraction and atomic absorption spectrophotometry [23]. Soil urease (S-UE) activity was assayed using indophenol colorimetry, expressed as the quantity of NH3-N released per gram of soil after 24 h of incubation [24]. The 3,5-dinitrosalicylic acid colorimetric method was used to determine sucrase (S-SC) activity, quantified as milligrams of glucose released per gram of soil over 24 h [25]. Acid phosphatase (S-ACP) activity was measured by the phenylene disodium phosphate method, with results reported as milligrams of phenol released per gram of soil after 24 h [26]. Catalase (S-CAT) activity was evaluated through potassium permanganate titration, defined as milligrams of H2O2 decomposed per gram of soil within 20 min [27].

2.6. Biolog EcoPlate Inoculation and Analyses

2.6.1. Extraction of Soil Bacterial Suspension

Soil stored at 4 °C was retrieved, and 5.0 g of fresh soil (with dry weight equivalence) was precisely weighed into a triangular flask. Subsequently, 45 mL of bacteria-free water was introduced, and the mixture underwent vigorous shaking for three minutes to completely disintegrate the soil sample. Directly after the shaking process, 10 mL of the resulting suspension was transferred to a 50 mL centrifuge tube. This tube was then centrifuged at a speed of 10,000 revolutions per minute for 20 min. The supernatant was carefully discarded, and 10 mL of sterilized normal saline was added to the tube. The mixture was shaken for another three minutes to ensure proper mixing, followed by a second centrifugation at the same speed (10,000 r·min−1) for 20 min to remove the carbon source. After discarding the supernatant once again, 10 mL of normal saline was added, and the contents were shaken and mixed thoroughly for three minutes. The mixture was then centrifuged at a lower speed of 2000 r·min−1 for 1 min. From this, 1 mL of the supernatant was extracted and added to a test tube containing 9 mL of sterile normal saline. The final optical density (A590) was adjusted to maintain a value of (0.13 ± 0.02) [28].

2.6.2. Determination of Soil Microbial Community Functional Metabolism

The Biolog-ECO plate containing 31 carbon employed was employed to measure the metabolic functionality of soil microorganisms. Prior to use, the plate was removed from storage and preheated to 25 °C. The bacterial suspension prepared as described in Section 2.6.1 was then inoculated into the plate, with 150 μL dispensed into each well. The inoculated plate was placed in a 25 °C incubator for dark incubation, and absorbance values at 590 nm and 750 nm were recorded every 24 h using a Biolog microplate reader.
The bacterial suspension prepared as described in Section 2.6.1 was then inoculated into the plate, with 150 μL dispensed into each well. The inoculated plate was placed in a 25 °C incubator for dark incubation, and absorbance values at 590 nm and 750 nm were recorded every 24 h using a Biolog microplate reader.

2.6.3. Result Calculation and Data Analysis

Average well color development (AWCD) is used to represent the overall capacity of the microbial community to utilize the 31 carbon sources at a given time point. AWCD reflects the average activity differences among different microbial communities. AWCD is calculated by averaging the absorbance values at 590 nm for all wells in the Biolog-ECO plate, accounting for the baseline absorbance at 750 nm to correct for any non-biological absorbance. The AWCD provides an indication of the overall metabolic activity of the soil microbial community.
A W C D = C i R 31
Ci is the light absorption value of each hole, and R is the light absorption value of the control hole.

2.7. Soil DNA Extraction and High-Throughput Sequencing

DNA from different soil samples was extracted using the E.Z.N.A.® Soil DNA Kit (D4015, Omega, Inc., Norcross, GA, USA) following the manufacturer’s instructions. Throughout the DNA extraction process, ultrapure water, instead of a sample solution, was used to exclude the possibility of false-positive PCR results as a negative control. This reagent, designed to extract DNA from trace amounts of samples, has been shown to be effective for the preparation of DNA from most bacteria. Nuclear-free water was used as a blank control. The total DNA was eluted in 50 μL of elution buffer and stored at −80 °C until measurement in the PCR by LC-Bio Technology Co., Ltd., Hangzhou, Zhejiang Province, China. The primers used for PCR amplification were 341F (5′-CCTACGGGNGGCWGCAG-3′) and 805R (5′-GACTACHVGGGTATCTAATCC-3′). The 5′ ends of the primers were tagged with specific barcodes for each sample, along with universal sequencing primers. PCR amplification was performed in a total reaction volume of 25 μL, containing 25 ng of template DNA, 12.5 μL of PCR Premix, 2.5 μL of each primer, and PCR-grade water to adjust the volume. The PCR conditions for amplifying prokaryotic 16S fragments were as follows: initial denaturation at 98 °C for 30 s, followed by 32 cycles of denaturation at 98 °C for 10 s, annealing at 54 °C for 30 s, and extension at 72 °C for 45 s. A final extension was performed at 72 °C for 10 min. The PCR products were confirmed by 2% agarose gel electrophoresis. Throughout the DNA extraction process, ultrapure water was used in place of the sample solution to exclude the possibility of false-positive PCR results, serving as a negative control. The PCR products were purified using AMPure XT beads (Beckman Coulter Genomics, Danvers, MA, USA) and quantified by Qubit (Invitrogen, Waltham, MA, USA). The amplicon pools were prepared for sequencing, and the size and quantity of the amplicon library were assessed using the Agilent 2100 Bioanalyzer (Agilent, Santa Clara, CA, USA) and the Library Quantification Kit for Illumina (Kapa Biosciences, Woburn, MA, USA), respectively. The libraries were then sequenced on the NovaSeq PE250 platform.

2.8. Statistical Analysis

Samples were sequenced on an Illumina NovaSeq platform according to the manufacturer’s recommendations, provided by LC-Bio. Paired-end reads were assigned to samples based on their unique barcodes and truncated by cutting off the barcode and primer sequences. The paired-end reads were then merged using FLASH. Quality filtering of the raw reads was performed under specific conditions to obtain high-quality clean tags, using the fqtrim (v0.94) tool. Chimeric sequences were removed using Vsearch software (v2.3.4). After dereplication with DADA2, a feature table and feature sequences were generated. Beta diversity was calculated using QIIME2, and the resulting graphs were created using the R package. Sequence alignment was performed using BLAST 2.14.0, and the feature sequences were annotated with the SILVA database for each representative sequence. Other diagrams were generated using the R package (v3.5.2). Pearson’s correlation analyses and ANOVA were performed using SPSS 24.0, with significant differences differentiated by lowercase letters. To control the false-positive risk associated with multiple comparisons, ANOVA was corrected using Tukey’s HSD, and the results of Pearson’s correlation analysis were corrected using the Benjamini–Hochberg method. The functional groups of bacteria were predicted based on the FAPROTAX database [29].

3. Results

3.1. Differences in Quality and Growth of Ginseng

In all samples, nine monomers of ginsenosides were detected, and their contents varied across different growth years (Figure 1). Overall, the ginsenoside content in 17-year-old ginseng was higher than in 5- and 9-year-old ginseng, especially for ginsenosides Rg1, Rf, Rc, Ro, and Rb3. Ginsenosides Rg1, Rb1, and Re are the three major components required by the “Pharmacopoeia of the People’s Republic of China”. The contents of these three ginsenosides showed no significant difference between the 5- and 9-year-old ginseng but were significantly higher in the 17-year-old ginseng compared to the other two age groups. Ginsenosides Rf, Ro, and Rb3 did not consistently increase with age; instead, their levels exhibited a trend of initially decreasing and then increasing. Due to the differences in individual ginsenoside contents, the total ginsenoside content in ginseng ultimately showed a trend of 17 years > 5 years > 9 years.
The biomass of different parts of the understory ginseng is shown in Figure 2. The stem length, stem diameter, as well as root diameter, root length, and fresh root weight of the underground part all increased with the cultivation years. Especially for the fresh root weight of the understory ginseng, significant differences were observed among the three age groups. Compared to the 5-year-old ginseng, the root weight increased by 48.78% at 9 years, and by 41.57% at 17 years compared to 9 years. While the individual fresh root weight increased with age, the total yield per plot showed no significant difference between 5- and 9-year-old ginseng, but was significantly higher in 17-year-old ginseng.

3.2. Differences in Soil Chemical Properties and Enzyme Activities

The soil chemical properties and enzyme activity of the three age groups of understory ginseng are shown in Table 3. Soil pH initially decreased and then increased with the growth years of the understory ginseng. Soil EC was significantly higher in the 5-year group compared to the other two groups. The soil AHN and OM in the 17-year group were significantly higher than those in the 5-year and 9-year groups, while the AP was significantly lower than in the other two groups.
The activity of four soil enzymes was lower in the 9-year group. The highest S-CAT and S-ACP activities were observed in the 5-year group, while the highest S-SC and S-UE activities were found in the 17-year group. As the cultivation years of understory ginseng increased, the soil S-SC and S-UE activities showed a trend of first decreasing and then increasing. The 17-year group reached the highest values of 10.7 mg·g−1·d−1 and 594.09 mg·g−1·d−1, which were 198.88% and 562.68% higher than the lowest values observed in the 9-year group, respectively. The trend for S-CAT followed a similar pattern to that of S-SC and S-UE, but the highest S-CAT activity was observed in the 5-year group.

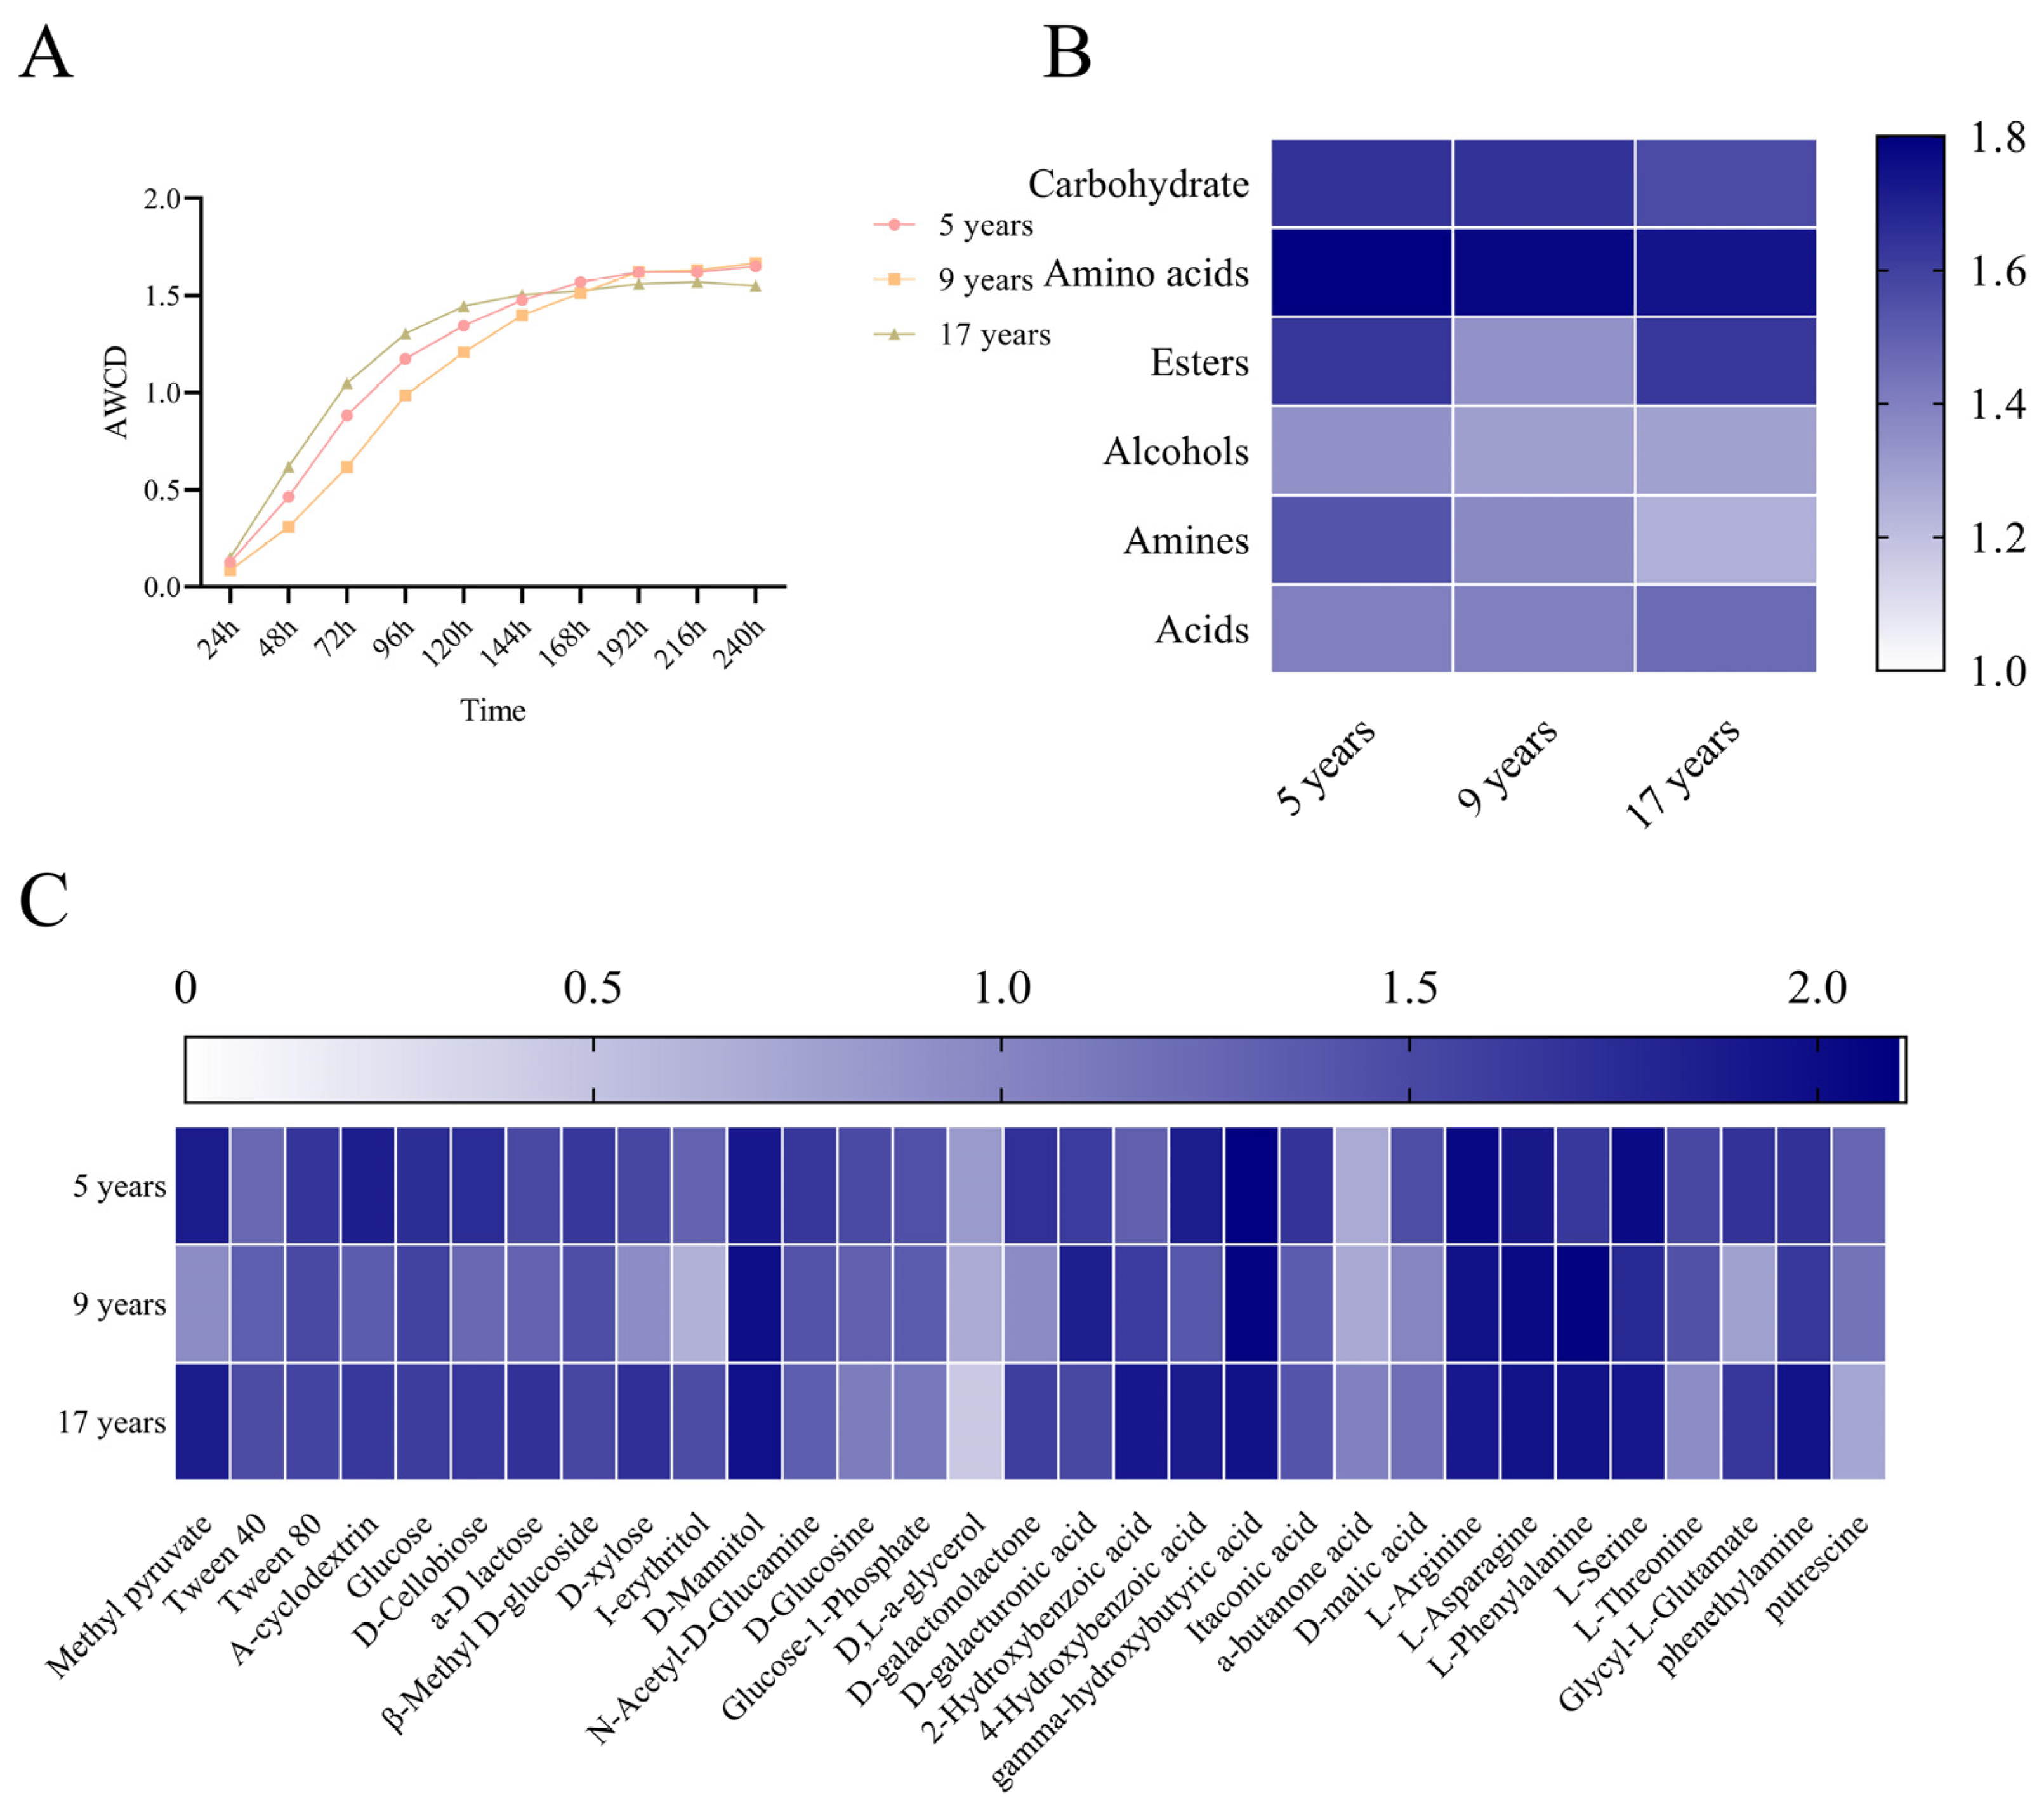
3.3. Analysis of Soil Bacterial Carbon Source Utilization

In order to understand the microbial metabolic reactions, the Biolog EcoPlate analysis was carried out. This method can characterize the metabolic fingerprints of microbial communities based on their ability to utilize different carbon sources [30]. The average well color development (AWCD) indicates the overall microbial activity in utilizing carbon sources (Figure 3A). In the early stages of cultivation, the 17-year group had the highest growth rate and reached a relatively stable trend at 120 h, while the 9-year group had the lowest growth rate and reached a relatively stable trend at 168 h.
In order to further investigate the metabolic differences of soil microorganisms under ginseng of different ages in the forest, the AWCD values for six different types of carbon sources (Figure 3B) and 31 different single compounds after 168 h of reaction on the Biolog plate were calculated (Figure 3C). The soil microorganisms of the three different age groups of understory ginseng showed the highest utilization rates for amino acids, followed by carbohydrates, with the lowest utilization rates observed for alcohols. The utilization rates for these carbon sources were similar across the three age groups. The ester utilization rate in the 9-year group was significantly lower than in the other two groups, while the utilization of amines decreased as the cultivation years of understory ginseng increased. By analyzing the soil microorganisms’ utilization of individual carbon sources, distinct patterns were clearly evident across the different age groups. Soil microorganisms in the three age groups showed higher utilization rates for D-Mannitol, gamma-hydroxybutyric acid, L-Arginine, L-Asparagine, L-Phenylalanine, and L-Serine, while their utilization rates for D,L-a-glycerol, a-butanone acid, and putrescine were relatively low. The 9-year group had lower utilization rates for methyl pyruvate, Glycyl-L-Glutamate, and I-erythritol compared to the other two groups. The 17-year group had lower utilization rates for D,L-a-glycerol, L-Threonine, and putrescine compared to the 5-year and 9-year groups, but its utilization rate for a-butanone acid was higher than the other two groups.

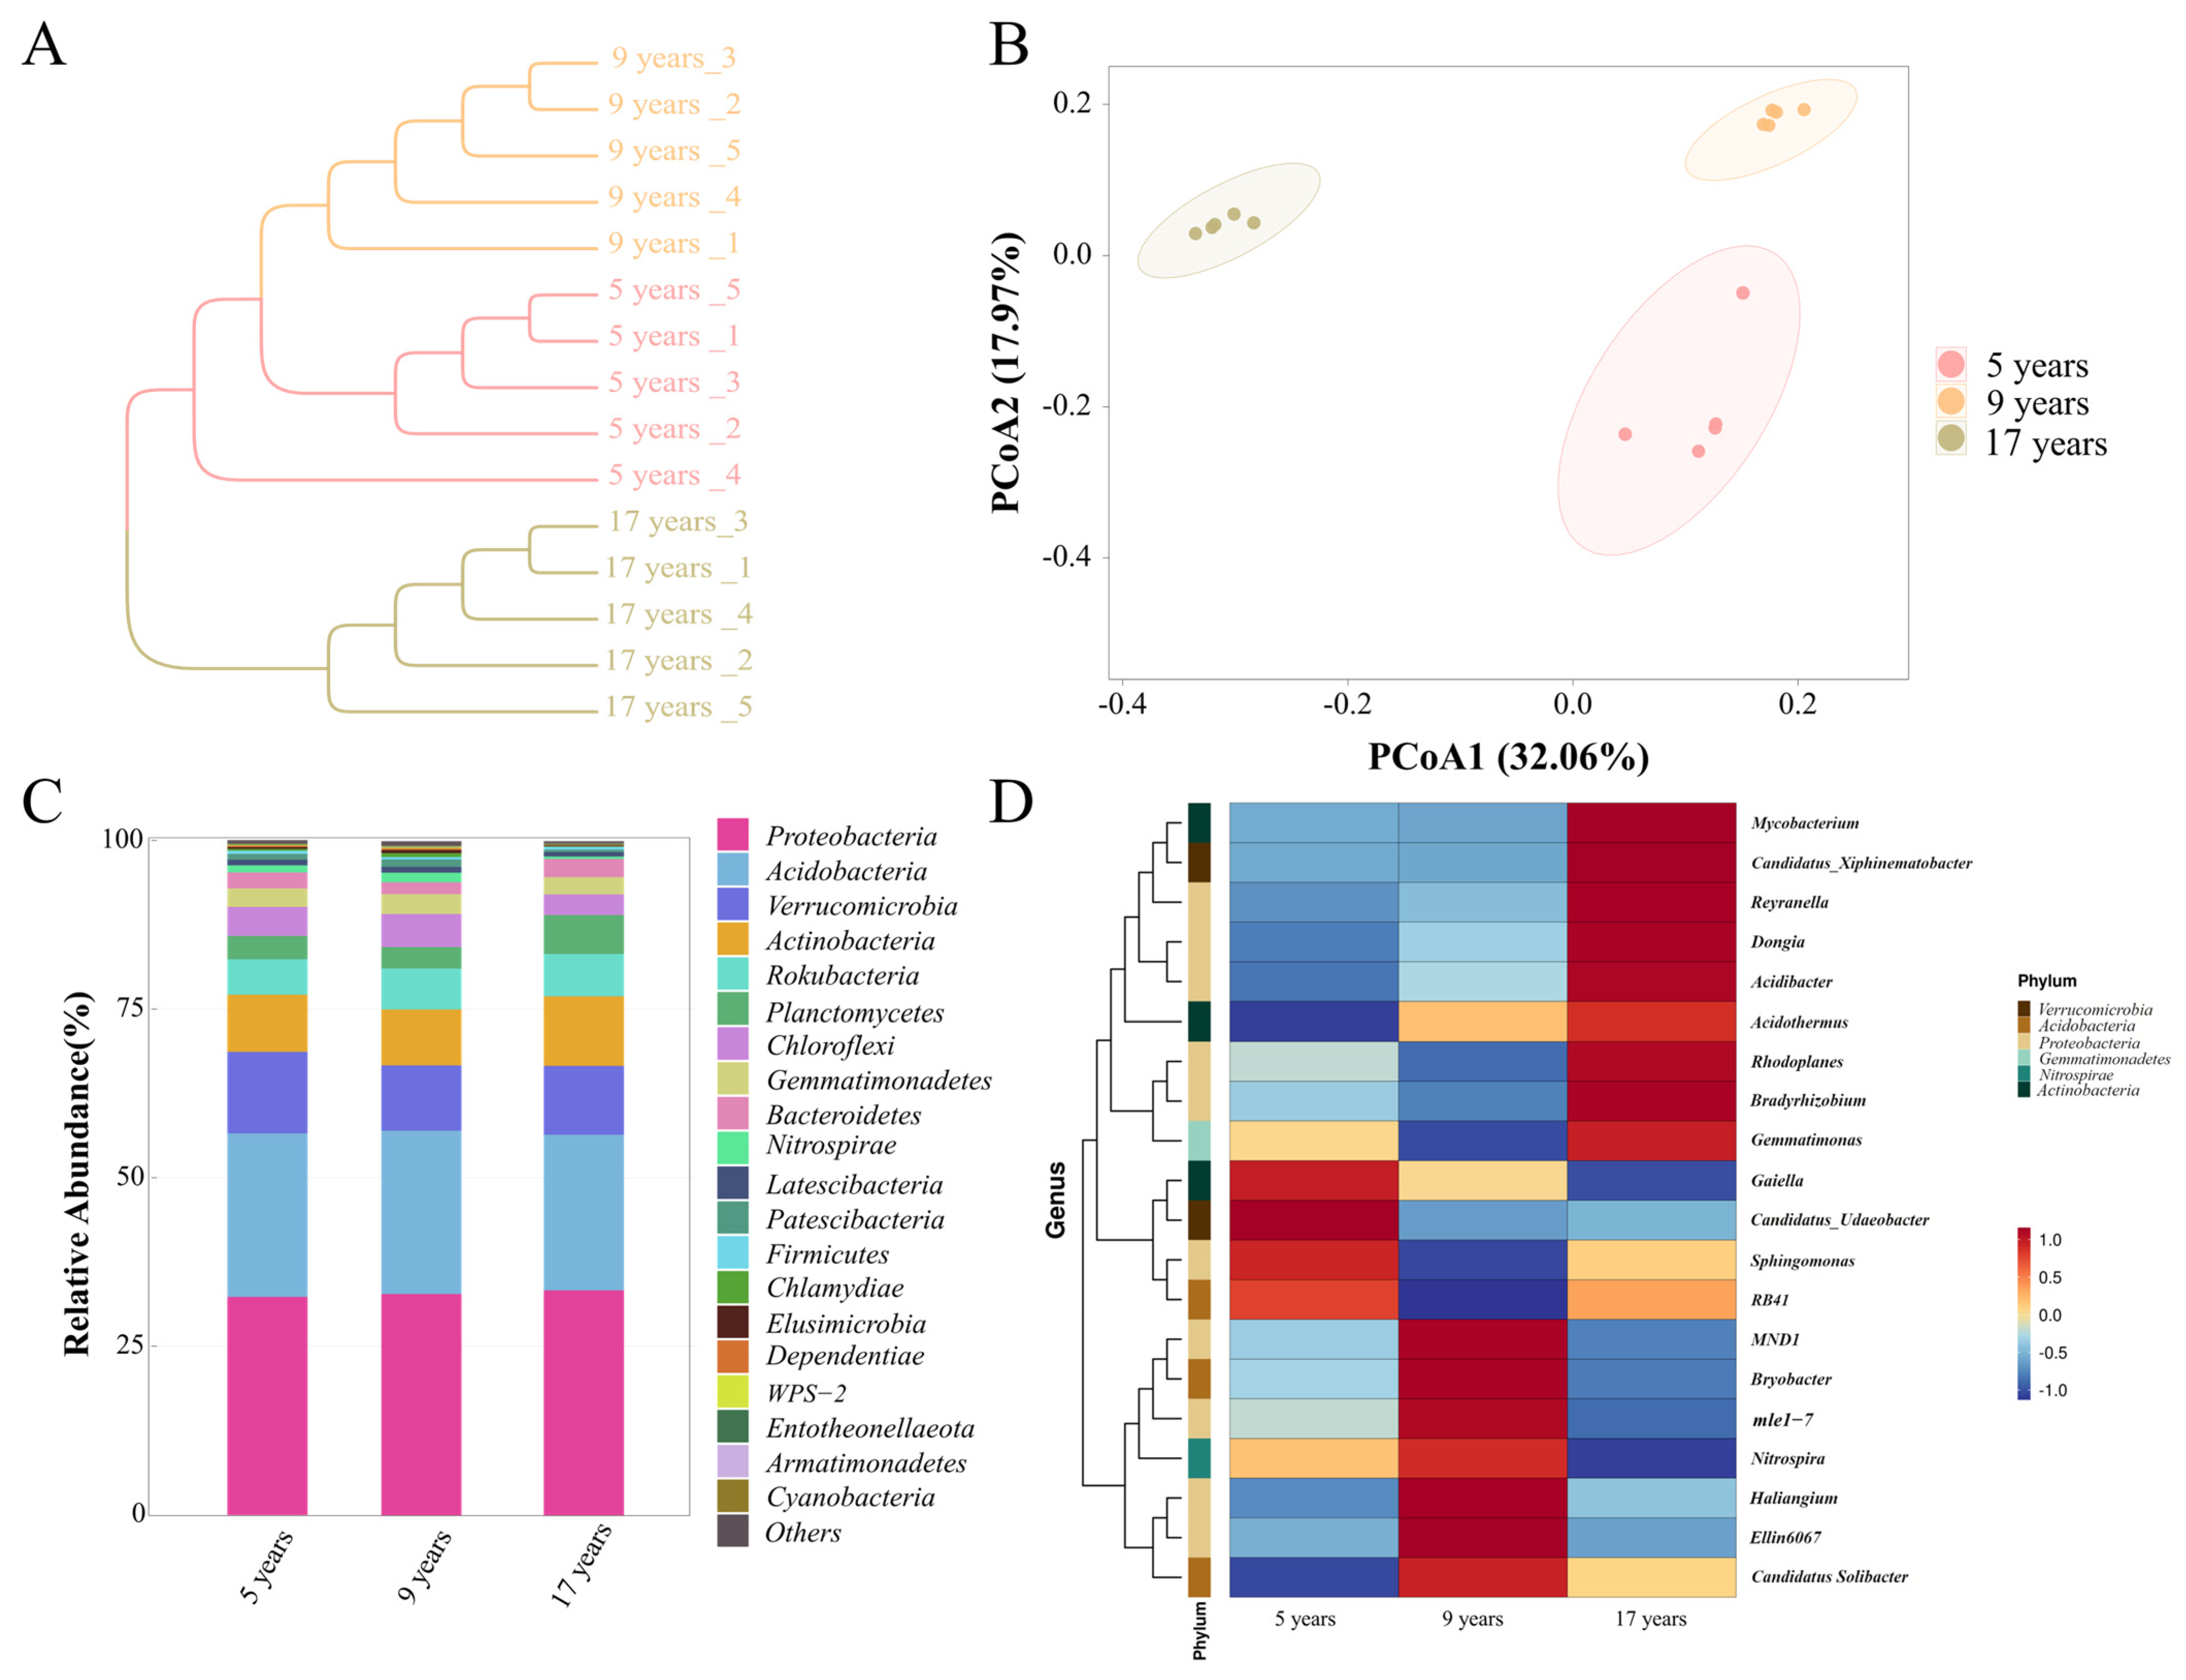
3.4. Analysis of Soil Bacterial Diversity

In all samples, there were nine bacterial communities with relative abundance greater than 1% at the phylum level, which were Proteobacteria, Acidobacteria, Verrucomicrobia, Actinobacteria, Rokubacteria, Planctomycetes, Chloroflexi, Gemmatimonadetes, and Bacteroidetes (Figure 4C). It can be seen that the two phyla with higher relative abundance in all three age groups showed little difference, while the main differences were concentrated in the phyla with lower abundance. For example, Verrucomicrobia was significantly higher in the 5-year group compared to the other two groups, while Planctomycetes was significantly higher in the 17-year group, and Chloroflexi was significantly lower in the 17-year group compared to the other two.
The heatmap of the soil bacterial community composition at the genus level (Figure 4D) shows that the composition of nine genera—Mycobacterium, Candidatus_Xiphinematobacter, Reyranella, Dongia, Acidibacter, Acidothermus, Rhodoplanes, Bradyrhizobium, and Gemmatimonas—was significantly higher in the 17-year group compared to the other two age groups; Gaiella, Candidatus_Udaeobacter, Sphingomonas, and RB41 were significantly higher in the 5-year group than in the 9-year and 17-year groups; MND1, Bryobacter, mle1-7, Nitrospira, Haliangium, Ellin6067, and Candidatus_Solibacter were significantly higher in the 9-year group compared to the other two groups. These results reveal the differences in the structure of bacterial communities in the soil of understory ginseng of different ages.
Linear discriminant analysis (LDA value > 3.5, Figure 5) showed the composition of bacterial communities across the three samples. The sample from the 5-year group had the fewest differential bacterial species, with only three types, while the 9-year and 17-year samples had more, with 13 and 14 species, respectively. This suggests that, compared to the two groups with longer growth durations, the group with a shorter growth duration had fewer differential bacterial species.

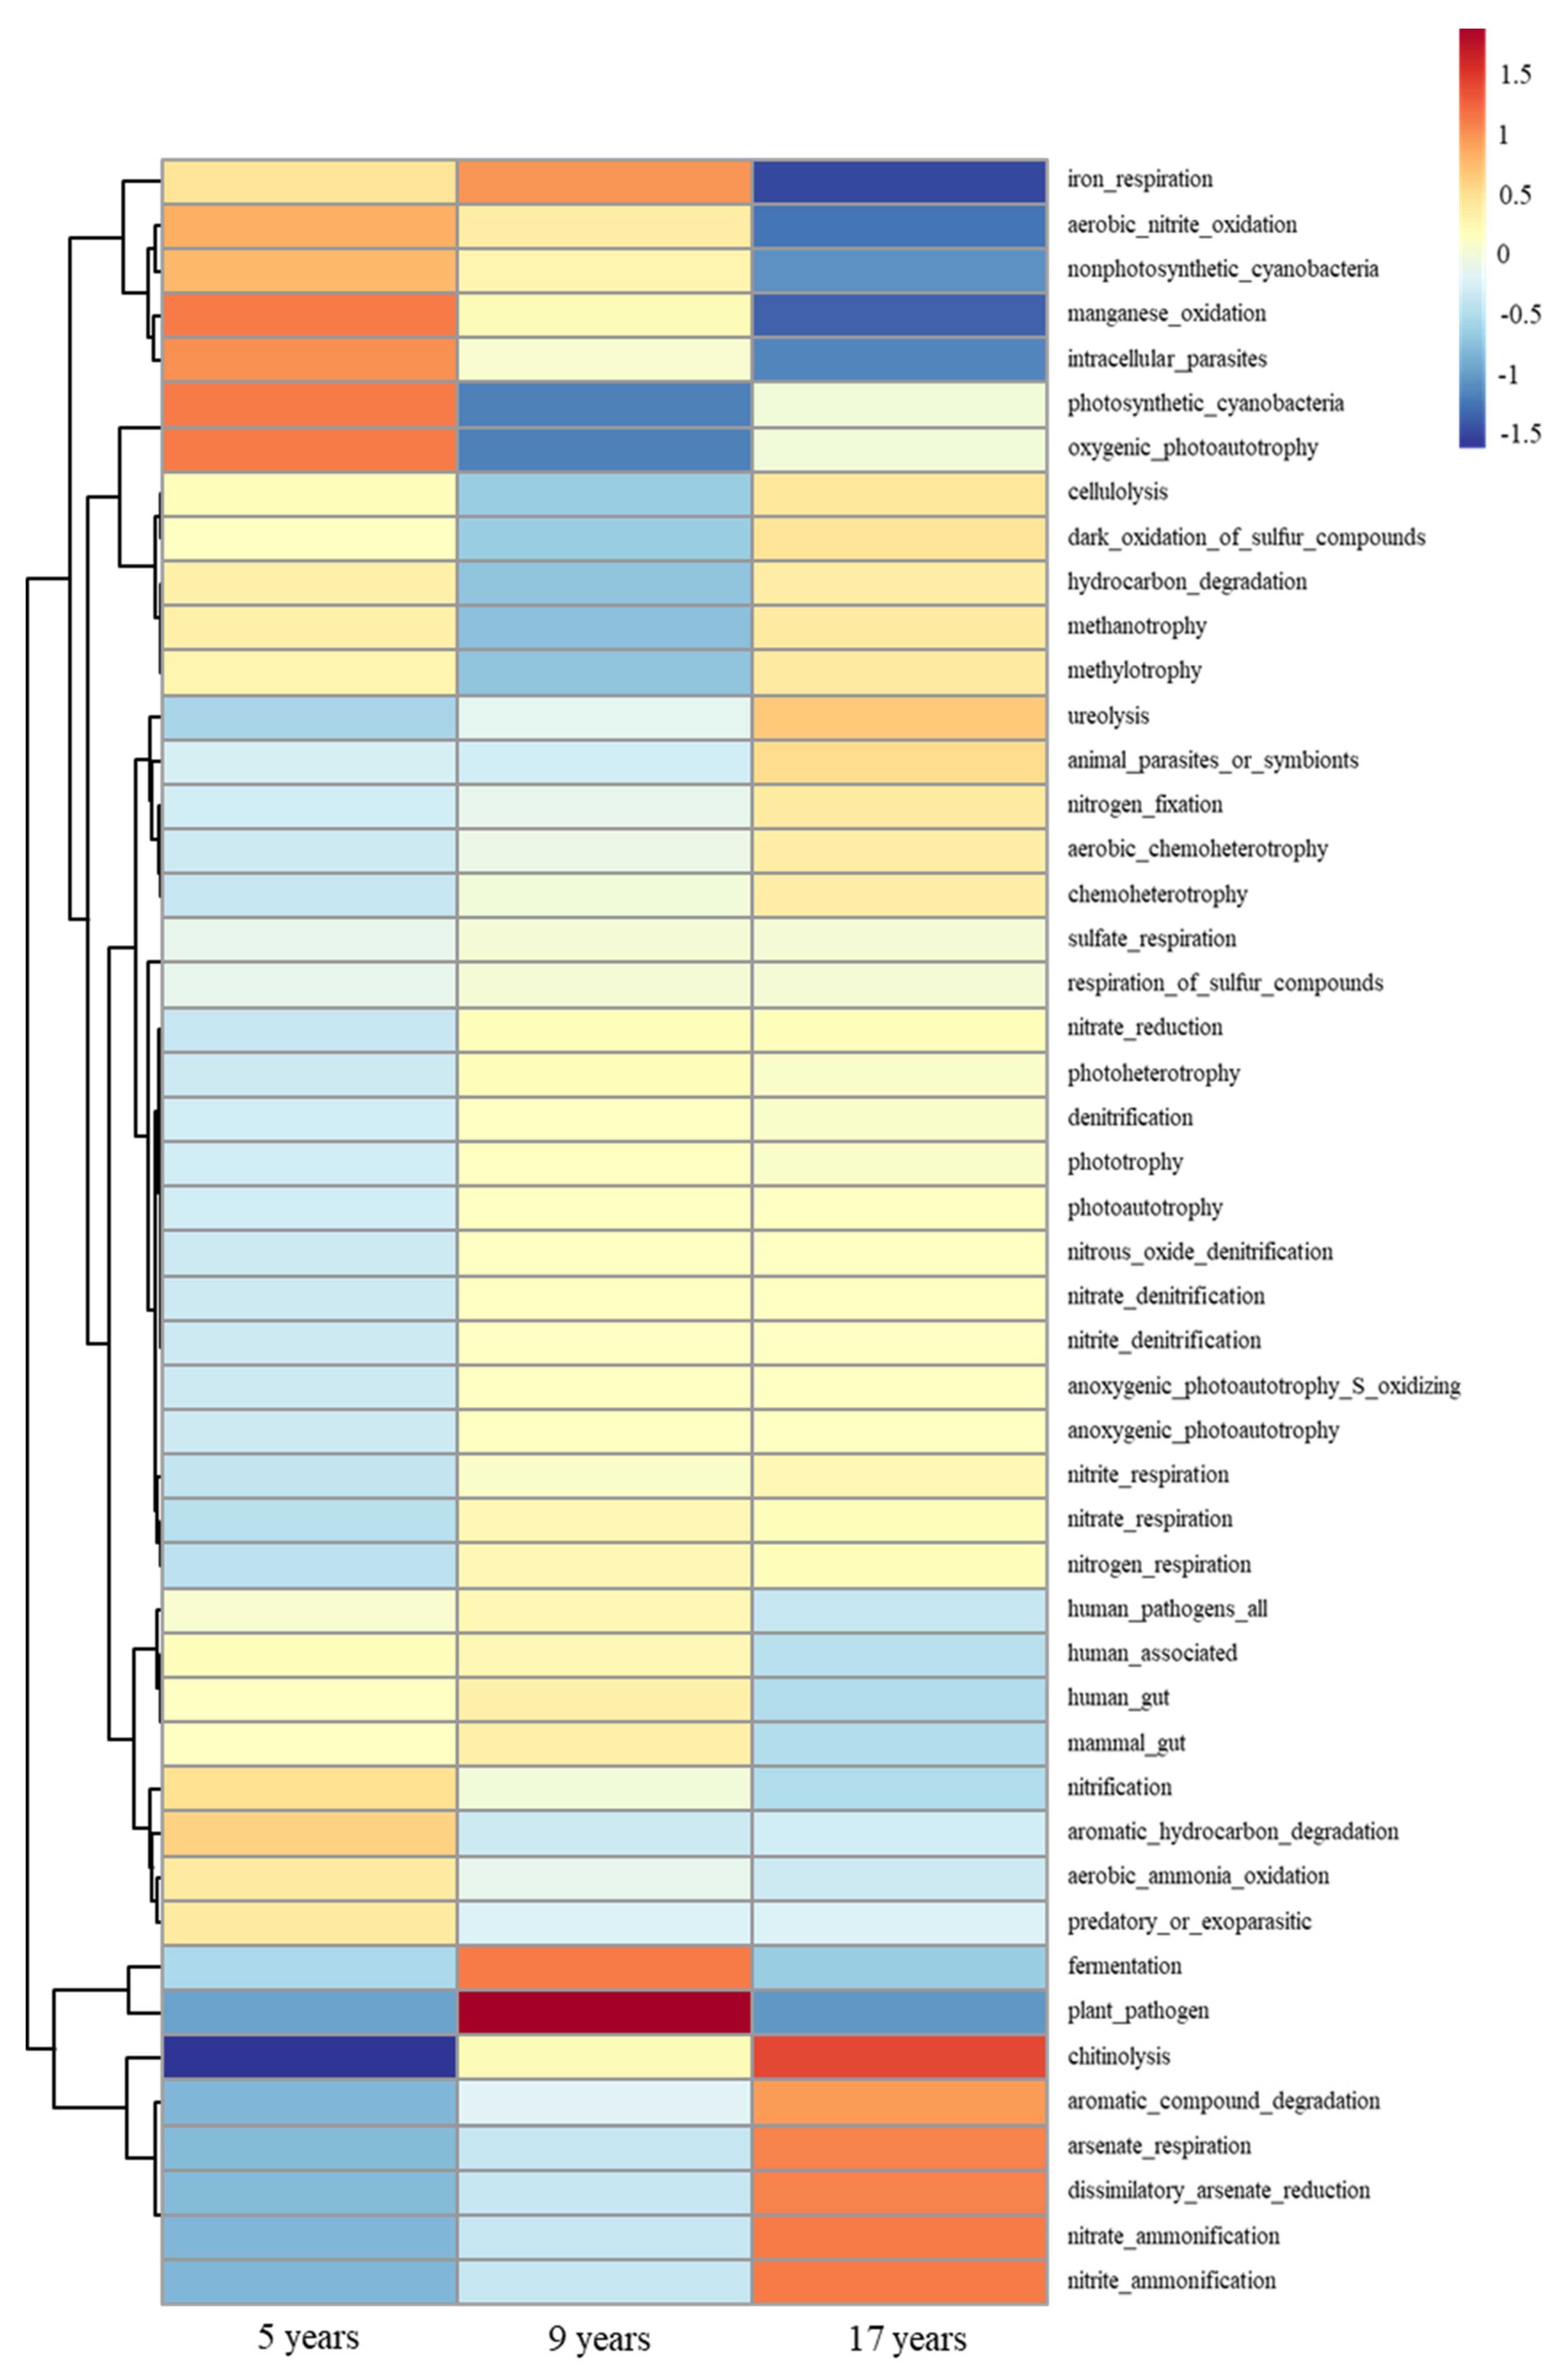
3.5. Soil Bacterial Function Prediction

The FAPROTAX annotation results indicate that for the three different age groups of ginseng grown under the forest canopy, 32.16%, 30.51%, and 35.42% of OTUs could be assigned to functional groups in the FAPROTAX database, respectively. Among the 80 functions in the FAPROTAX database, 48 microbial functional categories (OTUs > 0.1%) were assigned. Cluster analysis based on bacterial functions revealed significant differences in the soil functional bacteria of ginseng from different age groups grown under the forest floor (Figure 6). From the figure, it can be seen that the abundance of soil microbes related to aerobic_nitrite_oxidation, nonphotosynthetic_cyanobacteria, manganese_oxidation, and intracellular_parasites shows a decreasing trend with the increase in the growth years of understory ginseng. In contrast, the abundance of microbes with functions such as Chitinolysis, aromatic_compound_degradation, arsenate_respiration, dissimilatory_arsenate_reduction, and nitrite_ammonification increases with the growth years. The abundance of microbes related to nitrification and denitrification shows no significant difference between the 9 years and 17 years, but it is significantly lower in the 5 years compared to the other two. The abundance of bacteria with fermentation and plant_pathogen functions, as annotated by the FAPROTAX database, was significantly higher in the 9 years group than in the other two groups.

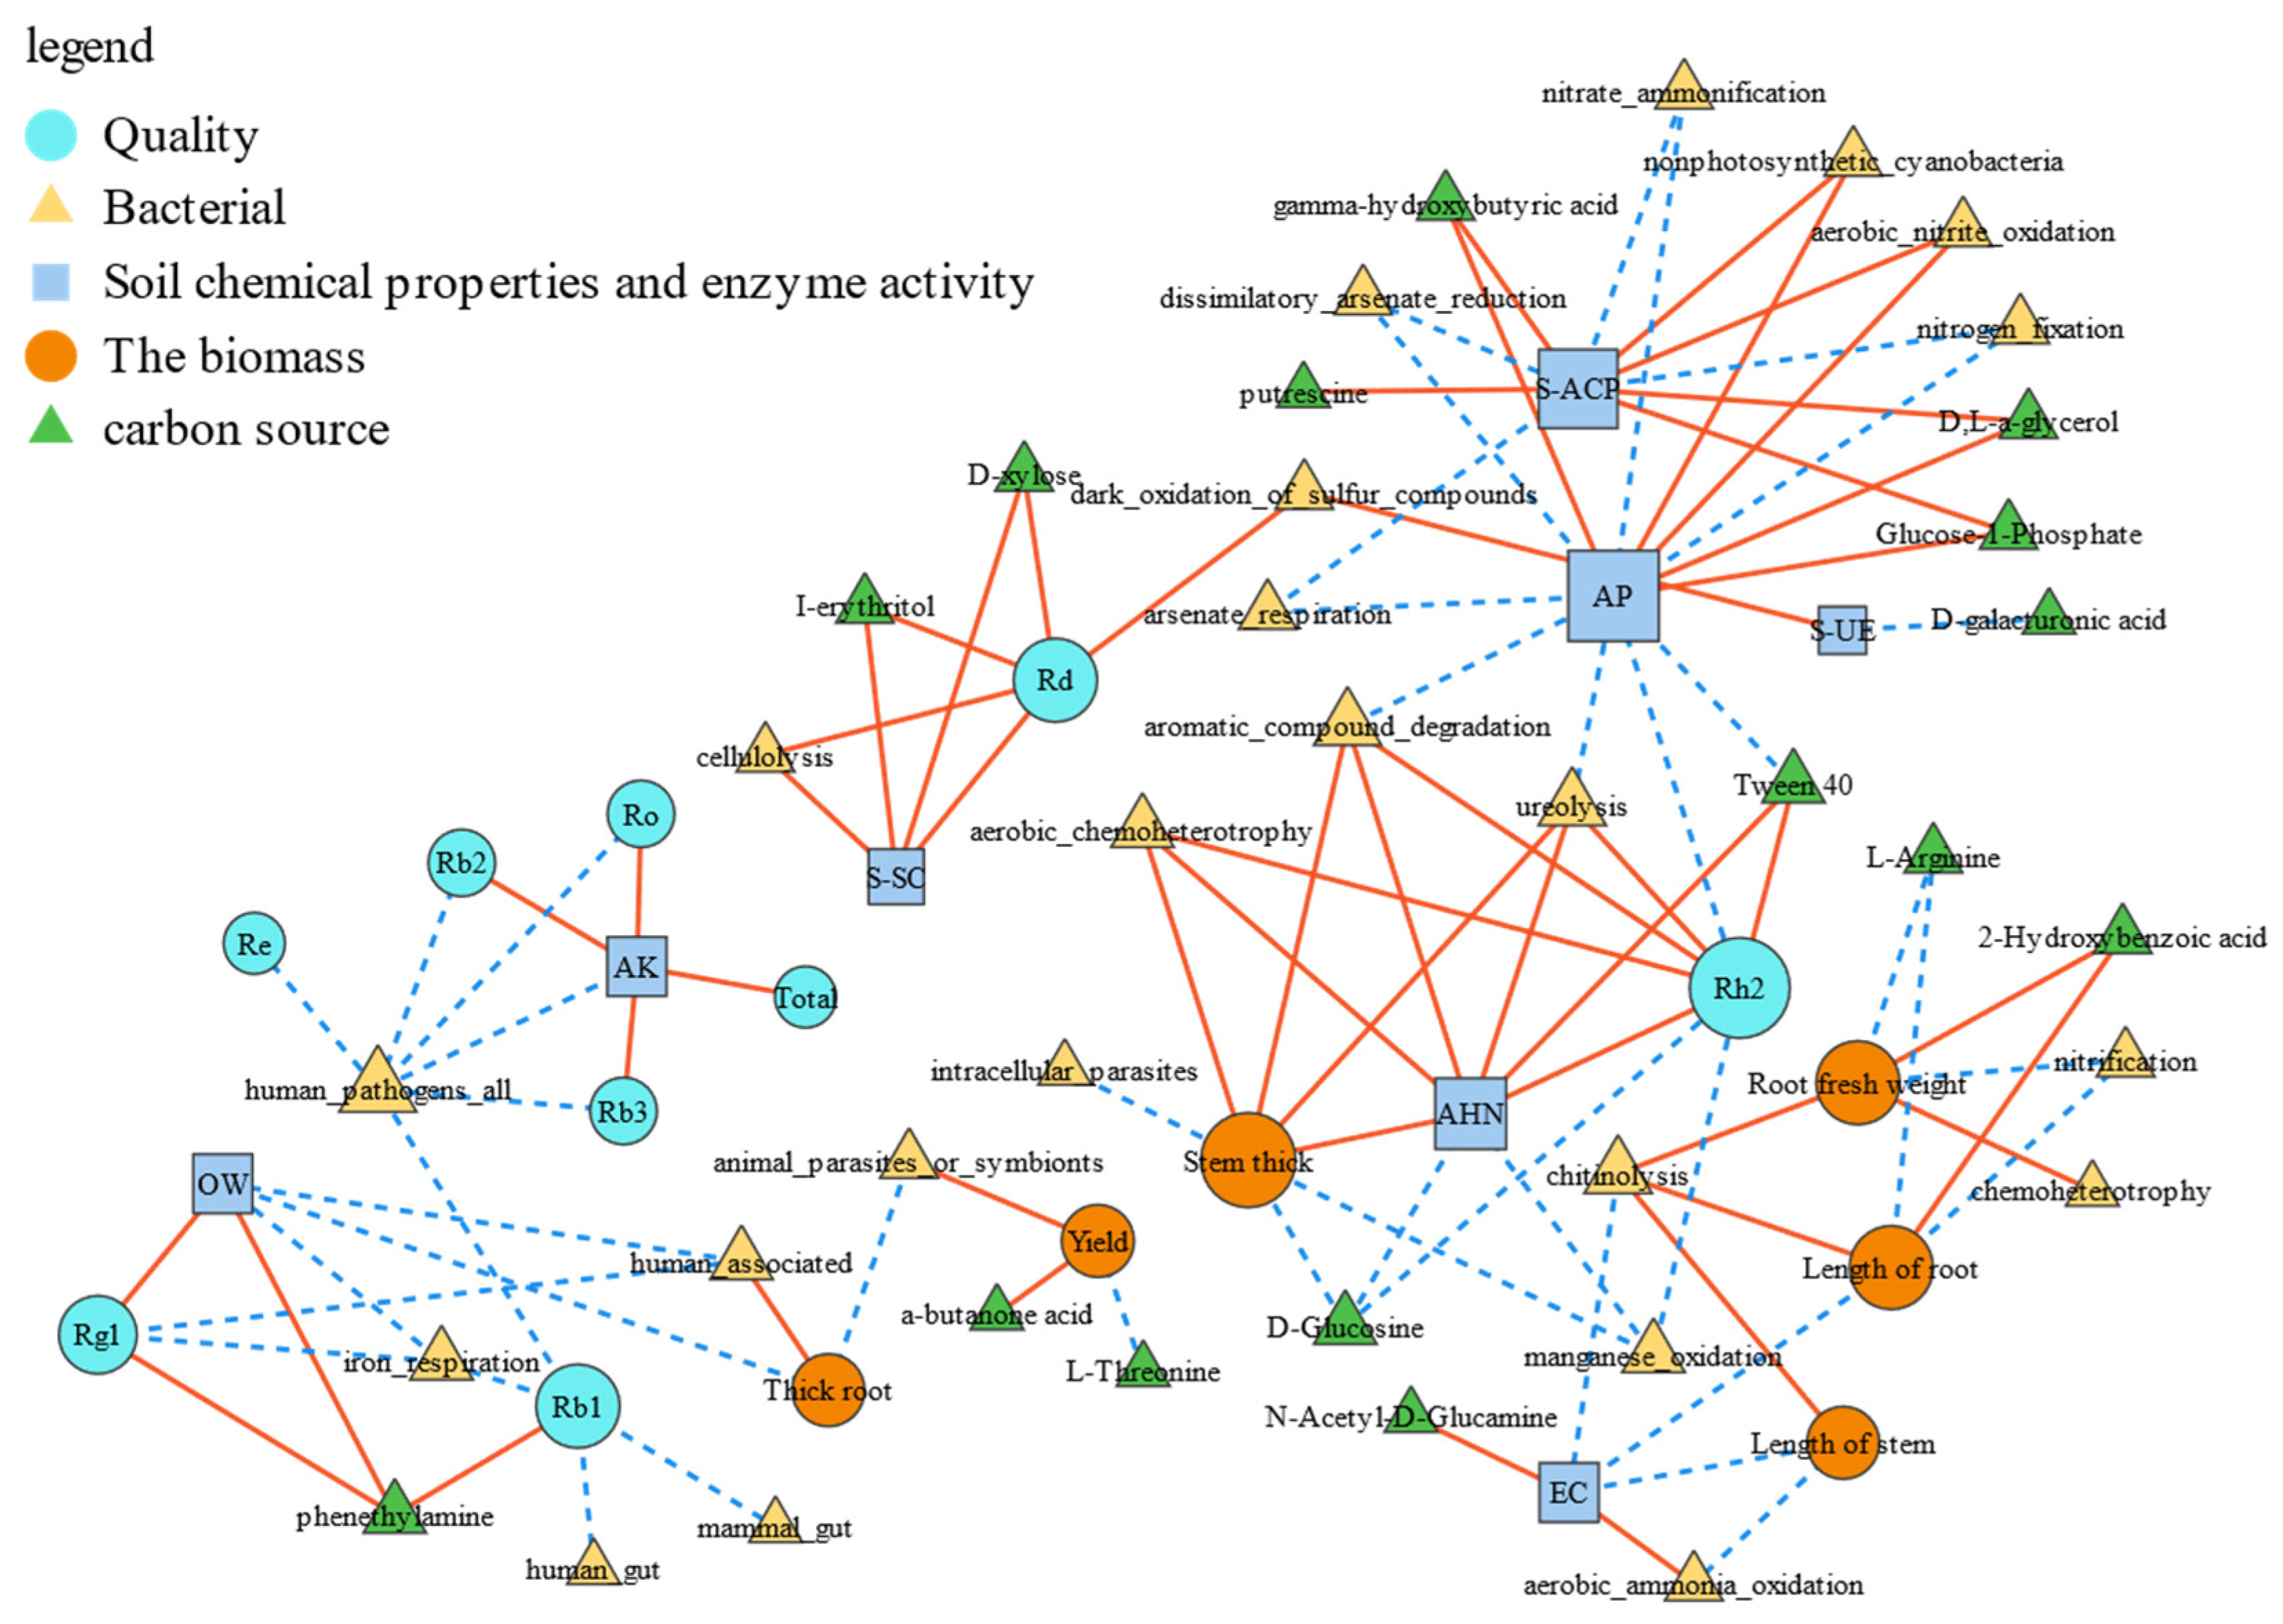
3.6. Analysis of the Correlation Between Ginseng Biomass and Quality and Soil Microecology

Correlation analysis was conducted between ginsenoside content and soil chemical properties, enzyme activities, bacterial abundance, and carbon sources. Data with |r| > 0.8 and p < 0.05 were selected and subjected to multiple comparison tests to construct the correlation network diagram (Figure 7). From the figure, it can be seen that soil available potassium is positively correlated with ginsenoside Ro, Rb2, Rb3, and total ginsenoside content, but negatively correlated with human pathogens. Ginsenosides Rd and Rh2 have strong positive correlations with many soil microorganisms and carbon sources. The root fresh weight and root length of understory ginseng are negatively correlated with L-Arginine and nitrification, while positively correlated with 2-Hydroxybenzoic acid and chemoheterotrophy. Additionally, soil available phosphorus and S-ACP show strong correlations with many soil microorganisms and carbon sources, indicating their significant role in the soil microecosystem.

4. Discussion

4.1. The Effect of Growth Duration on Ginsenoside Content and Biomass of Understory Ginseng

Traditional Chinese medicinal materials, such as ginseng, are different from regular crops because the key to their medicinal value lies in the effective compounds they contain. Therefore, their quality is more important than yield. Currently, the main cultivation method for ginseng is field cultivation; however, due to severe replanting problems, soils that have been used to grow ginseng are often unable to support the cultivation of most other crops [31,32]. Ginseng grown under the forest environment is closer to wild ginseng, both in terms of its appearance and medicinal components. Overall, ginseng with a longer growth duration has a higher ginsenoside content compared to ginseng with a shorter growth duration, which is consistent with previous research findings [33]. Interestingly, some ginsenoside contents do not increase with the growth duration, for example, they are lower in the 9-year-old ginseng compared to the 5 years, particularly for Rf and Ro. This may be due to changes in soil microorganisms or the accumulation of pathogens in the soil of 9-year-old ginseng.
The yield of understory ginseng at 17 years is significantly higher than that of 5 years and 9 years. Both above-ground and below-ground biomass increase with the growth years. The fresh root weight of 9-year-old ginseng is significantly higher than that of 5-year-old ginseng, but the yield is the same as that of the 5 years. This may be because although the individual plant weight of the 9-year-old ginseng is higher, some plants may have died, leading to a decrease in ginseng yield, and ultimately no increase in overall yield.

4.2. Differences in Soil Chemical Properties and Enzyme Activity Among Understory Ginseng Soils of Different Growth Years

Ginseng growth can lead to soil acidification, which in turn contributes to severe plant diseases. Therefore, soil pH is one of the key factors influencing ginseng growth. In farmland ginseng cultivation, soil pH often decreases with the planting duration [34,35]. This study shows that the ginsenoside content of understory ginseng significantly decreased at 9 years and then recovered to a higher level at 17 years (Figure 1). This non-linear change is closely related to the phased fluctuations in soil microecology. Specifically, the significant acidification of the soil at 9 years may have inhibited the activity of key enzymes, thereby restricting the synthesis of ginsenoside precursors. However, unlike agricultural systems, the soil pH in the understory increased to 5.33 at 17 years (Table 3), which may be due to the buffering effect of litter input and the enhanced degradation of organic acids by functional microorganisms (Figure 4C) [36]. In addition, the high organic matter and available nitrogen in the 17 year soil may indirectly enhance ginsenoside accumulation by promoting root development, which is consistent with previous findings that there is a positive correlation between soil carbon-to-nitrogen ratio and ginsenosides [15].
Soil enzyme activity holds significant ecological importance within the soil microecosystem. While not directly contributing to the accumulation of ginseng’s effective components, it underpins all biochemical processes in the soil. Specifically, these enzymes facilitate the breakdown and transformation of organic matter, thereby promoting the release of bioavailable nutrients that sustain soil functionality [37,38,39]. In this study, the trends of soil enzyme activity were different from those of nutrients. S-SC, S-UE, and S-CAT showed a pattern of first decreasing and then increasing, indicating that ginseng growth disrupts the balance of the soil enzyme system. At the same time, it leads to an unfavorable living environment for the plant itself, which, in severe cases, can result in plant death [40]. This is likely the reason why the 9 years group showed a decrease in ginseng yield despite having higher individual plant weight, as previously mentioned.

4.3. The Differences in Soil Bacteria in Understory Ginseng with Different Growth Years

Soil microorganisms, as decomposers in ecosystems, are the main drivers of biogeochemical processes [41]. Bacteria are an important component of soil microorganisms, and they play numerous roles, including the transformation of soil nutrients, decomposition, and the synthesis of chemical substances [42]. The carbon source metabolism intensity in Biolog-Eco plate reactions is generally proportional to the corresponding microbial abundance, capability, and diversity [43,44]. Based on the growth rate of the AWCD values in the early stages of cultivation (Figure 3A), it is evident that bacterial activity in the 17 years group is significantly higher than in the 5 years and 9 years groups. However, when the culture reaches equilibrium, the AWCD values of the 5 years and 9 years groups are higher than that of the 17 years group, indicating that the bacterial diversity in the former two groups is greater than in the latter. This study also shows that soil bacteria tend to utilize carbohydrate and amino acid-based carbon sources, which is consistent with previous research findings (Figure 3B) [45]. The higher bacterial activity in the 17 years group towards acids could be attributed to the increased decomposition of acidic substances in the soil, which may have contributed to the rise in soil pH [46]. Analysis of the utilization of different single carbon sources (Figure 3C) shows that in the 9 years soil, the bacterial abundance for utilizing methyl pyruvate, I-erythritol, D-galactonolactone, 4-Hydroxybenzoic acid, and Glycyl-L-Glutamate is lower compared to both 5 years and 17 years. However, it is important to note that the Biolog-Eco plate is primarily suitable for detecting metabolically active and aerobic bacteria, which represents a limitation. Therefore, 16S rRNA sequencing was conducted to obtain a more comprehensive understanding of the soil microbial community [47,48].
Nitrogen is a key nutrient for plant growth and secondary metabolite synthesis. Denitrifying bacteria influence the soil nitrogen cycle by converting nitrate into nitrogen gas. [49]. The predicted functional profiles of soil bacteria (Figure 6) indicate that some denitrifying bacteria in the 5-year group are significantly lower than in the other two age groups. This may be because the increase in nitrogen in the soil provides sufficient nutrients for denitrifying bacteria, thereby promoting denitrification [50]. The abundance of microorganisms involved in nitrate ammonification and nitrite ammonification is higher in the 17 years group, suggesting stronger assimilation and dissimilation processes. This indicates that the soil has a higher nitrate content, which could explain the stronger denitrification activity in this group [51,52]. Additionally, studies have shown that nitrogen fertilizer application can significantly increase the root biomass and ginsenoside content in Panax ginseng [53]. In this study, the higher abundance of denitrifying and nitrogen-reducing bacteria in the 17 years soil may have improved nitrogen availability, thereby promoting the accumulation of ginsenosides. The increase in pathogenic bacteria can lead to suppressed plant growth or even plant death [54]. Studies have shown that ginsenosides can significantly increase the abundance of soil pathogens [55]. In the 9-year-old ginseng, more ginsenosides are secreted into the soil, which leads to a decrease in ginsenoside content and an accumulation of pathogens in the soil, disrupting the root-associated microecology. The abundance of soil pathogens has significantly increased, and the cell wall-degrading enzymes may directly damage the root structure of ginseng, leading to an increased mortality rate of the plants [56,57]. After the ginseng plants die, the remaining plant material needs to be decomposed, which promotes the enrichment of fermentation-related microorganisms, thereby exacerbating the hypoxic environment in the rhizosphere and inhibiting the respiratory metabolism of ginseng [58]. This result highlights the trade-off between “individual growth and population survival” in the cultivation of understory ginseng, and it is necessary to intervene manually when needed to help the understory ginseng get through this stage smoothly, thereby increasing the yield. This study also found that the abundance of microbes associated with human pathogens (human_pathogens_all), human-associated, and human gut microbes was significantly lower in the 17 years group compared to the 5 years and 9 years groups. This suggests that as the growth period of understory ginseng increases, the degree of human intervention decreases, resulting in a decline in the abundance of human-associated microbes in the soil microbial community.

4.4. The Correlation Between the Quality of Understory Ginseng and Soil Microecology

The relationship between plants, soil, and microorganisms is complex and has become a hot topic of research in recent years [59,60]. By constructing a correlation network diagram of ginseng soil microorganisms (Figure 7), we can observe that soil potassium influences the content of many ginsenosides, while soil nitrogen and phosphorus are primarily strongly correlated with soil microorganisms [19,42]. Ginsenosides are the main active ingredients in understory ginseng, and their content determines whether the ginseng is of “high quality.” Ginsenosides Rh2 and Rd are influenced by many soil factors and microorganisms. It is perhaps precisely due to these complex influences that they contribute to the strong pharmacological effects of ginseng [61]. Additionally, human_pathogens_all shows a negative correlation with several ginsenosides, while human_gut and mammal_gut also negatively correlate with ginsenoside Rb1. This suggests that ginsenosides might have a similar protective role in plants as they do in humans, helping to defend against certain microbes. The ginsenoside content in understory ginseng determines its medicinal value, while the root’s morphology and size determine its economic value. Fresh root weight yield is a key factor in determining the ‘high yield’ of understory ginseng, while root length affects the ‘optimal shape’ of the plant. Chitin is a component of soil organic matter, and bacteria involved in chitin degradation contribute to the breakdown of organic matter in the soil [62]. These bacteria degrade chitin by secreting chitinase, which promotes the cycling of organic carbon in the soil, increases soil organic matter content, and ultimately enhances plant growth [63]. The higher chitinolysis in the 17 years group promotes a higher organic matter content, ultimately leading to greater root fresh weight and longer root length. At the same time, since chitin is an important component of fungal cell walls, these chitin-degrading microorganisms can also help control pathogenic fungi by breaking down their cell walls, thereby indirectly ensuring the healthy growth of ginseng and promoting the synthesis of ginsenosides [64].

4.5. Changes in Soil Microecology During the Growth Process of Forest-Grown Ginseng

Similar to field-cultivated ginseng, forest-grown ginseng also experiences a “bottleneck” during its growth process, characterized by a decrease in ginsenoside content, reduced soil pH and enzyme activity, and an increase in the abundance of pathogenic microorganisms in the 9-year-old ginseng. This phenomenon is similar to the soil microecological changes in other perennial medicinal plants. For example, after 4–5 years of continuous cropping of Panax notoginseng, the accumulation of pathogenic microorganisms such as Fusarium and the decline in urease activity lead to a decrease in quality [65]. After 3–4 years of Astragalus membranaceus planting, the increase in pathogenic microorganisms and nutrient depletion affect the yield [66]. However, due to the complexity and regulatory nature of the forest system, it helps forest-grown ginseng break through this “bottleneck” period through organic matter input and microbial regulation, restoring the ecological homeostasis of its rhizosphere. This indicates that the soil microecological bottleneck in perennial medicinal plants is somewhat universal, but its specific manifestations are influenced by the cultivation environment.

5. Conclusions

This study analyzed the factors affecting the quality and yield of understory ginseng from the perspective of soil microecology by examining the quality, biomass, soil nutrients, enzyme activity, and microorganisms of understory ginseng of three different ages, and attempted to establish a relationship network among understory ginseng, soil, and microorganisms. The results indicated that as the years increased, the biomass of understory ginseng generally showed an upward trend, while the content of ginsenosides decreased at 9 years, and soil nutrients significantly declined. The abundance of pathogenic bacteria was significantly higher in the 9 years group compared to the 5 years and 17 years groups. In actual production, we should pay attention to disease prevention and resistance at this stage, and carry out certain artificial interventions when necessary. The content of available potassium in the soil played an active role in the content of several ginsenosides, while nitrogen and phosphorus in the soil mainly influenced the soil microorganisms. Additionally, the content of ginsenosides may exert a certain inhibitory effect on microorganisms related to humans in the soil.
However, this study still has significant limitations. For example, the microbial predictions were inferred based on databases, lacking validation through qPCR or functional gene analysis. Moreover, this study did not explore the underlying mechanisms. In the next step, the sampling should be refined by including more growth years and employing both metagenomic techniques and functional gene analysis to thoroughly investigate the mechanisms and clarify the changes in microorganisms during the growth process.

Author Contributions

Conceptualization, L.Y. and M.W.; methodology, Y.L. and Y.S. (Yumu Shen); software, Y.L. and Y.S. (Yumu Shen); validation, Y.L. and Y.S. (Yingxin Sun); formal analysis, Y.L. and Y.S. (Yingxin Sun); investigation, Y.L. and Y.S. (Yumu Shen); data curation, Y.L.; writing—original draft preparation, Y.L.; writing—review and editing, M.H. and M.W.; visualization, Y.L.; supervision, Y.L. and Y.S. (Yumu Shen); project administration, M.H. and M.W.; funding acquisition, Y.L. and M.W. All authors have read and agreed to the published version of the manuscript.

Funding

This study was supported by the Key Research and Development Program of Jilin Provincial Science and Technology Development Plan (20230204001YY); the Major Science and Technology Special Project of Jilin Provincial Science and Technology Development Plan (20200504002YY); and the National Traditional Chinese Medicine Industry Technology System Project (CARS-21).

Data Availability Statement

The original contributions presented in this study are included in the article. Further inquiries can be directed to the corresponding author(s).

Conflicts of Interest

The authors declare no conflicts of interest.

References

  1. Chen, C.; Lv, Q.; Li, Y.; Jin, Y.H. The Anti-Tumor Effect and Underlying Apoptotic Mechanism of Ginsenoside Rk1 and Rg5 in Human Liver Cancer Cells. Molecules 2021, 26, 3926. [Google Scholar] [CrossRef]
  2. Chen, X.; Wang, Q.Y.; Shao, M.Y.; Ma, L.; Guo, D.Q.; Wu, Y.; Gao, P.R.; Wang, X.P.; Li, W.L.; Li, C.; et al. Ginsenoside Rb3 regulates energy metabolism and apoptosis in cardiomyocytes via activating PPARα pathway. Biomed. Pharmacother. 2019, 120, 109487. [Google Scholar] [CrossRef] [PubMed]
  3. Nakhjavani, M.; Smith, E.; Palethorpe, H.M.; Tomita, Y.; Yeo, K.; Price, T.J.; Townsend, A.R.; Hardingham, J.E. Anti-Cancer Effects of an Optimised Combination of Ginsenoside Rg3 Epimers on Triple Negative Breast Cancer Models. Pharmaceuticals 2021, 14, 633. [Google Scholar] [CrossRef]
  4. Tao, L.; Zhang, J.W.; Lan, W.F.; Liu, H.; Wu, Q.; Yang, S.L.; Song, S.X.; Yu, L.; Bi, Y.F. Neutral oligosaccharides from ginseng residues vs. neutral ginseng polysaccharides: A comparative study of structure elucidation and biological activity. Food Chem. 2025, 464, 141674. [Google Scholar] [CrossRef] [PubMed]
  5. Zhang, X.H.; Hu, Z.Y.; Duan, Y.Q.; Jiang, Y.X.; Xu, W.W.; Yang, P.C.; Zhou, W.; Sun, J.F.; Li, G. Extraction, characterization, and neuroprotective effects of polysaccharides the stems of Panax ginseng C. A. Meyer by three different solvents (water, acid, alkali). Ind. Crops Prod. 2024, 222, 119512. [Google Scholar] [CrossRef]
  6. Wan, L.; Qian, C.; Yang, C.M.; Peng, S.A.; Dong, G.L.; Cheng, P.; Zong, G.F.; Han, H.K.; Shao, M.Y.; Gong, G.W.; et al. Ginseng polysaccharides ameliorate ulcerative colitis via regulating gut microbiota and tryptophan metabolism. Int. J. Biol. Macromol. 2024, 265, 130822. [Google Scholar] [CrossRef]
  7. Zhang, H.; Abid, S.; Ahn, J.C.; Mathiyalagan, R.; Kim, Y.J.; Yang, D.C.; Wang, Y.P. Characteristics of Cultivars in Korea and China. Molecules 2020, 25, 2635. [Google Scholar] [CrossRef]
  8. Zhu, L.L.; Xu, L.; Dou, D.Q.; Huang, L.Q. The distinct of chemical profiles of mountainous forest cultivated ginseng and garden ginseng based on ginsenosides and oligosaccharides. J. Food Compos. Anal. 2021, 104, 104165. [Google Scholar] [CrossRef]
  9. Shin, S.; Park, M.S.; Lee, H.; Lee, S.; Lee, H.; Kim, T.H.; Kim, H.J. Global Trends in Research on Wild-Simulated Ginseng: Quo Vadis? Forests 2021, 12, 664. [Google Scholar] [CrossRef]
  10. Liu, D.F.; Sun, H.J.; Ma, H.W. Deciphering Microbiome Related to Rusty Roots of Panax ginseng and Evaluation of Antagonists Against Pathogenic Ilyonectria. Front. Microbiol. 2019, 10, 1350. [Google Scholar] [CrossRef]
  11. Li, Q.; Zhan, Y.; Xu, Y.H.; Zhang, L.X.; Di, P.; Lu, B.H.; Chen, C.B. Deciphering the transcriptomic response of Ilyonectria robusta in relation to ginsenoside Rg1 treatment and the development of ginseng rusty root rot. FEMS Microbiol. Lett. 2022, 369, fnac075. [Google Scholar] [CrossRef] [PubMed]
  12. Di, P.; Sun, Z.; Cheng, L.; Han, M.; Yang, L.; Yang, L.M. LED Light Irradiations Differentially Affect the Physiological Characteristics, Ginsenoside Content, and Expressions of Ginsenoside Biosynthetic Pathway Genes in Panax ginseng. Agriculture 2023, 13, 807. [Google Scholar] [CrossRef]
  13. Chen, T.T.; Wang, L.Q.; Wang, H.T.; Jiang, S.; Zhou, S. Photoperiod and Temperature as Dominant Environmental Drivers Triggering Plant Phenological Development of American ginseng Along With Its Quality Formation. Front. Earth Sci. 2022, 10, 894251. [Google Scholar] [CrossRef]
  14. Jin, Q.; Zhang, Y.Y.; Ma, Y.Y.; Sun, H.; Guan, Y.M.; Liu, Z.B.; Ye, Q.; Zhang, Y.; Shao, C.; Mu, P.; et al. The composition and function of the soil microbial community and its driving factors before and after cultivation of Panax ginseng in farmland of different ages. Ecol. Indic. 2022, 145, 109748. [Google Scholar] [CrossRef]
  15. Fang, J.; Xu, Z.F.; Zhang, T.; Chen, C.B.; Liu, C.S.; Liu, R.; Chen, Y.Q. Effects of soil microbial ecology on ginsenoside accumulation in across different cultivation years. Ind. Crops Prod. 2024, 215, 118637. [Google Scholar] [CrossRef]
  16. Zuppinger-Dingley, D.; Schmid, B.; Petermann, J.S.; Yadav, V.; De Deyn, G.B.; Flynn, D.F.B. Selection for niche differentiation in plant communities increases biodiversity effects. Nature 2014, 515, 108–111. [Google Scholar] [CrossRef]
  17. Zhao, Y.C.; Wang, Q.Y.; Feng, S.Q.; Zhang, Y.; Dong, W.W.; Ji, W.X. Effects of cultivation duration of the crop and growth stages on rhizosphere soil physicochemical properties, enzyme activities, and microbial communities of ginseng under forest. Plant Soil Environ. 2024, 70, 562–579. [Google Scholar] [CrossRef]
  18. Piao, X.M.; Huo, Y.; Kang, J.P.; Mathiyalagan, R.; Zhang, H.; Yang, D.U.; Kim, M.; Yang, D.C.; Kang, S.C.; Wang, Y.P. Diversity of Ginsenoside Profiles Produced by Various Processing Technologies. Molecules 2020, 25, 4390. [Google Scholar] [CrossRef]
  19. Zhang, T.; Xu, Z.F.; Wang, Y.B.; Gao, Q. Effects of soil properties and microbial community composition on ginsenosides accumulation in farmland ginseng. Front. Bioeng. Biotechnol. 2024, 12, 1462342. [Google Scholar] [CrossRef]
  20. Yeomans, J.C.; Bremner, J.M. A rapid and precise method for routine determination of organic carbon in soil. Commun. Soil Sci. Plant Anal. 1988, 19, 1467–1476. [Google Scholar] [CrossRef]
  21. Huang, S.H.; Fang, B.; Li, X.; He, S.S. Study on spatial heterogeneity of alkali-hydrolyzable nitrogen in paddy fields at the county scale. J. Ecol. Rural Environ. 2020, 36, 179–185. [Google Scholar] [CrossRef]
  22. Tang, J.Y.; Zhang, L.H.; Zhang, J.C.; Ren, L.H.; Zhou, Y.Y.; Zheng, Y.Y.; Luo, L.; Yang, Y.; Huang, H.L.; Chen, A.W. Physicochemical features, metal availability and enzyme activity in heavy metal-polluted soil remediated by biochar and compost. Sci. Total Environ. 2020, 701, 134751. [Google Scholar] [CrossRef] [PubMed]
  23. Papa, S.; Fusco, G.M.; Ciriello, M.; Formisano, L.; Woo, S.L.; De Pascale, S.; Rouphael, Y.; Carillo, P. Microbial and Non-Microbial Biostimulants as Innovative Tools to Increase Macro and Trace Element Mineral Composition of Tomato and Spinach. Horticulturae 2022, 8, 1157. [Google Scholar] [CrossRef]
  24. van Wyk, D.A.B.; Adeleke, R.; Rhode, O.H.J.; Bezuidenhout, C.C.; Mienie, C. Ecological guild and enzyme activities of rhizosphere soil microbial communities associated with Bt-maize cultivation under field conditions in North West Province of South Africa. J. Basic Microb. 2017, 57, 781–792. [Google Scholar] [CrossRef] [PubMed]
  25. Li, X.; Li, Y.Y.; An, S.S.; Zeng, Q.C. Effects of stem and leaf decomposition in typical herbs on soil enzyme activity and microbial diversity in the south Ningxia loess hilly region of Northwest China. J. Appl. Ecol. 2016, 27, 3182–3188. [Google Scholar]
  26. Tabatabai, M.A.; Bremner, J.M. Assay of urease activity in soils. Soil Biol. Biochem. 1972, 4, 479–487. [Google Scholar] [CrossRef]
  27. Sinha, A.K. Colorimetric assay of catalase. Anal. Biochem. 1972, 47, 389–394. [Google Scholar] [CrossRef]
  28. Zhang, Y.M.; Wang, X.C.C.; Cheng, Z.; Li, Y.Y.; Tang, J.L. Effects of additional fermented food wastes on nitrogen removal enhancement and sludge characteristics in a sequential batch reactor for wastewater treatment. Environ. Sci. Pollut. Res. 2016, 23, 12890–12899. [Google Scholar] [CrossRef]
  29. Sansupa, C.; Wahdan, S.F.M.; Hossen, S.; Disayathanoowat, T.; Wubet, T.; Purahong, W. Can We Use Functional Annotation of Prokaryotic Taxa (FAPROTAX) to Assign the Ecological Functions of Soil Bacteria? Appl. Sci. 2021, 11, 688. [Google Scholar] [CrossRef]
  30. Wolinska, A.; Galazka, A.; Kuzniar, A.; Goraj, W.; Jastrzebska, N.; Grzadziel, J.; Stepniewska, Z. Catabolic Fingerprinting and Diversity of Bacteria in Mollic Gleysol Contaminated with Petroleum Substances. Appl. Sci. 2018, 8, 1970. [Google Scholar] [CrossRef]
  31. Lu, X.H.; Jiao, X.L.; Chen, A.J.; Luo, Y.; Gao, W.W. First Report of Causing Rusty Root of Asian Ginseng in China. Plant Dis. 2015, 99, 156. [Google Scholar] [CrossRef] [PubMed]
  32. Lu, X.H.; Zhang, X.M.; Jiao, X.L.; Hao, J.J.J.; Zhang, X.S.; Luo, Y.; Gao, W.W. Taxonomy of fungal complex causing red-skin root of Panax ginseng in China. J. Ginseng Res. 2020, 44, 506–518. [Google Scholar] [CrossRef]
  33. He, J.M.; Zhang, Y.Z.; Luo, J.P.; Zhang, W.J.; Mu, Q. Variation of Ginsenosides in Ginseng of Different Ages. Nat. Prod. Commun. 2016, 11, 739–740. [Google Scholar] [CrossRef] [PubMed]
  34. Matsumoto, S.; Doi, H.; Kasuga, J. Changes over the Years in Soil Chemical Properties Associated with the Cultivation of Ginseng (Panax ginseng Meyer) on Andosol Soil. Agriculture 2022, 12, 1223. [Google Scholar] [CrossRef]
  35. Liu, S.; Wang, Z.Y.; Niu, J.F.; Dang, K.K.; Zhang, S.K.; Wang, S.Q.; Wang, Z.Z. Changes in physicochemical properties, enzymatic activities, and the microbial community of soil significantly influence the continuous cropping of Panax quinquefolius L. (American ginseng). Plant Soil 2021, 463, 427–446. [Google Scholar] [CrossRef]
  36. Li, Z.Q.; Mao, C.; Wu, Q.X.; Peng, Y.Y.; Wang, J.; Zhang, B.; Zhang, S.; Liang, X.C.; Yan, W.D.; Chen, X.Y. Temporal Variations in Aboveground Biomass, Nutrient Content, and Ecological Stoichiometry in Young and Middle-Aged Stands of Chinese Fir Forests. Plants 2024, 13, 1877. [Google Scholar] [CrossRef] [PubMed]
  37. Trasar-Cepeda, C.; Leiros, M.C.; Gil-Sotres, F. Hydrolytic enzyme activities in agricultural and forest soils. Some implications for their use as indicators of soil quality. Soil Biol. Biochem. 2008, 40, 2146–2155. [Google Scholar] [CrossRef]
  38. Tuo, Y.; Luo, X.Q.; Wang, Z.Y.; Liang, J.P.; Shi, R.; Wang, Z.X.; Wang, S.; Xiang, P.; Yang, Q.L.; He, X.H. Effects of water and fertilizer regulation on soil microbial community, fruit nutrients, and saponin content of Panax notoginseng: A three years field experiment. Ind. Crops Prod. 2024, 220, 119166. [Google Scholar] [CrossRef]
  39. Guo, C.Q.; Yang, C.; Fu, J.S.; Song, Y.; Chen, S.X.; Li, H.Y.; Ma, C.Q. Effects of crop rotation on sugar beet growth through improving soil physicochemical properties and microbiome. Ind. Crops Prod. 2024, 212, 118331. [Google Scholar] [CrossRef]
  40. Liu, W.Y.; Wang, F.; Sun, Y.M.; Yang, L.; Chen, H.H.; Liu, W.J.; Zhu, B.; Hui, C.M.; Wang, S.W. Influence of dragon bamboo with different planting patterns on microbial community and physicochemical property of soil on sunny and shady slopes. J. Microbiol. 2020, 58, 906–914. [Google Scholar] [CrossRef]
  41. Zhang, G.L.; Bai, J.H.; Zhai, Y.J.; Jia, J.; Zhao, Q.Q.; Wang, W.; Hu, X.Y. Microbial diversity and functions in saline soils: A review from a biogeochemical perspective. J. Adv. Res. 2024, 59, 129–140. [Google Scholar] [CrossRef] [PubMed]
  42. Philippot, L.; Chenu, C.; Kappler, A.; Rillig, M.C.; Fierer, N. The interplay between microbial communities and soil properties. Nat. Rev. Microbiol. 2024, 22, 226–239. [Google Scholar] [CrossRef] [PubMed]
  43. Ge, Z.W.; Du, H.J.; Gao, Y.L.; Qiu, W.F. Analysis on Metabolic Functions of Stored Rice Microbial Communities by BIOLOG ECO Microplates. Front. Microbiol. 2018, 9, 1375. [Google Scholar] [CrossRef] [PubMed]
  44. Koner, S.; Chen, J.S.; Hsu, B.M.; Rathod, J.; Huang, S.W.; Chien, H.Y.; Hussain, B.; Chan, M.W.Y. Depth-resolved microbial diversity and functional profiles of trichloroethylene-contaminated soils for Biolog EcoPlate-based biostimulation strategy. J. Hazard. Mater. 2022, 424, 127266. [Google Scholar] [CrossRef]
  45. Malik, A.A.; Puissant, J.; Buckeridge, K.M.; Goodall, T.; Jehmlich, N.; Chowdhury, S.; Gweon, H.S.; Peyton, J.M.; Mason, K.E.; van Agtmaal, M.; et al. Land use driven change in soil pH affects microbial carbon cycling processes. Nat. Commun. 2018, 9, 3591. [Google Scholar] [CrossRef]
  46. Zhou, L.-J.; Li, J.; Zhang, Y.; Kong, L.; Jin, M.; Yang, X.; Wu, Q.L. Trends in the occurrence and risk assessment of antibiotics in shallow lakes in the lower-middle reaches of the Yangtze River basin, China. Ecotoxicol. Environ. Saf. 2019, 183, 109511. [Google Scholar] [CrossRef]
  47. Stefanowicz, A. The biolog plates technique as a tool in ecological studies of microbial communities. Pol. J. Environ. Stud. 2006, 15, 669–676. [Google Scholar]
  48. Calbrix, R.; Laval, K.; Barray, S. Analysis of the potential functional diversity of the bacterial community in soil: A reproducible procedure using sole-carbon-source utilization profiles. Eur. J. Soil Biol. 2005, 41, 11–20. [Google Scholar] [CrossRef]
  49. Moreau, D.; Bardgett, R.D.; Finlay, R.D.; Jones, D.L.; Philippot, L. A plant perspective on nitrogen cycling in the rhizosphere. Funct. Ecol. 2019, 33, 540–552. [Google Scholar] [CrossRef]
  50. Chen, X.; Wei, H.; Zhang, J.E. Nitrogen and Sulfur Additions Improved the Diversity of nirK- and nirS-Type Denitrifying Bacterial Communities of Farmland Soil. Biology 2021, 10, 1191. [Google Scholar] [CrossRef]
  51. Strohm, T.O.; Griffin, B.; Zumft, W.G.; Schink, B. Growth yields in bacterial denitrification and nitrate ammonification. Appl. Environ. Microb. 2007, 73, 1420–1424. [Google Scholar] [CrossRef] [PubMed]
  52. Baggs, E.M. Soil microbial sources of nitrous oxide: Recent advances in knowledge, emerging challenges and future direction. Curr. Opin. Environ. Sustain. 2011, 3, 321–327. [Google Scholar] [CrossRef]
  53. Sun, J.; Luo, H.; Yu, Q.; Kou, B.; Jiang, Y.; Weng, L.; Xiao, C. Optimal NPK Fertilizer Combination Increases Panax ginseng Yield and Quality and Affects Diversity and Structure of Rhizosphere Fungal Communities. Front. Microbiol. 2022, 13, 919434. [Google Scholar] [CrossRef]
  54. Wang, M.; Gao, L.M.; Dong, S.Y.; Sun, Y.M.; Shen, Q.R.; Guo, S.W. Role of Silicon on Plant-Pathogen Interactions. Front. Plant Sci. 2017, 8, 701. [Google Scholar] [CrossRef]
  55. Miao, X.; Wang, E.; Zhou, Y.; Zhan, Y.; Yan, N.; Chen, C.; Li, Q. Effect of ginsenosides on microbial community and enzyme activity in continuous cropping soil of ginseng. Front. Microbiol. 2023, 14, 1060282. [Google Scholar] [CrossRef] [PubMed]
  56. Kubicek, C.P.; Starr, T.L.; Glass, N.L. Plant Cell Wall–Degrading Enzymes and Their Secretion in Plant-Pathogenic Fungi. Annu. Rev. Phytopathol. 2014, 52, 427–451. [Google Scholar] [CrossRef] [PubMed]
  57. Tao, F.; Huang, Y.; Hungate, B.A.; Manzoni, S.; Frey, S.D.; Schmidt, M.W.I.; Reichstein, M.; Carvalhais, N.; Ciais, P.; Jiang, L.; et al. Microbial carbon use efficiency promotes global soil carbon storage. Nature 2023, 618, 981–985. [Google Scholar] [CrossRef]
  58. Schroeter, S.A.; Eveillard, D.; Chaffron, S.; Zoppi, J.; Kampe, B.; Lohmann, P.; Jehmlich, N.; von Bergen, M.; Sanchez-Arcos, C.; Pohnert, G.; et al. Microbial community functioning during plant litter decomposition. Sci. Rep. 2022, 12, 7451. [Google Scholar] [CrossRef]
  59. Das, P.P.; Singh, K.R.; Nagpure, G.; Mansoori, A.; Singh, R.P.; Ghazi, I.A.; Kumar, A.; Singh, J. Plant-soil-microbes: A tripartite interaction for nutrient acquisition and better plant growth for sustainable agricultural practices. Environ. Res. 2022, 214, 113821. [Google Scholar] [CrossRef]
  60. Bhat, B.A.; Tariq, L.; Nissar, S.; Islam, S.T.; Ul Islam, S.; Mangral, Z.; Ilyas, N.; Sayyed, R.Z.; Muthusamy, G.; Kim, W.; et al. The role of plant-associated rhizobacteria in plant growth, biocontrol and abiotic stress management. J. Appl. Microbiol. 2022, 133, 2717–2741. [Google Scholar] [CrossRef]
  61. Zare-Zardini, H.; Alemi, A.; Taheri-Kafrani, A.; Hosseini, S.A.; Soltaninejad, H.; Hamidieh, A.A.; Karamallah, M.H.; Farrokhifar, M.; Farrokhifar, M. Assessment of a New Ginsenoside Rh2 Nanoniosomal Formulation for Enhanced Antitumor Efficacy on Prostate Cancer: An in vitro Study. Drug Des. Dev. Ther. 2020, 14, 3315–3324. [Google Scholar] [CrossRef] [PubMed]
  62. Hui, C.; Jiang, H.; Liu, B.; Wei, R.; Zhang, Y.P.; Zhang, Q.C.; Liang, Y.C.; Zhao, Y.H. Chitin degradation and the temporary response of bacterial chitinolytic communities to chitin amendment in soil under different fertilization regimes. Sci. Total Environ. 2020, 705, 136003. [Google Scholar] [CrossRef] [PubMed]
  63. Shahrajabian, M.H.; Chaski, C.; Polyzos, N.; Tzortzakis, N.; Petropoulos, S.A. Sustainable Agriculture Systems in Vegetable Production Using Chitin and Chitosan as Plant Biostimulants. Biomolecules 2021, 11, 819. [Google Scholar] [CrossRef] [PubMed]
  64. Wang, G.; Ren, Y.; Bai, X.; Su, Y.; Han, J. Contributions of Beneficial Microorganisms in Soil Remediation and Quality Improvement of Medicinal Plants. Plants 2022, 11, 3200. [Google Scholar] [CrossRef]
  65. Dong, L.; Xu, J.; Feng, G.; Li, X.; Chen, S. Soil bacterial and fungal community dynamics in relation to Panax notoginseng death rate in a continuous cropping system. Sci. Rep. 2016, 6, 31802. [Google Scholar] [CrossRef]
  66. Li, Y.; Liu, Y.; Zhang, H.; Yang, Y.; Wei, G.; Li, Z. The Composition of Root-Associated Bacteria and Fungi of Astragalus mongholicus and Their Relationship with the Bioactive Ingredients. Front. Microbiol. 2021, 12, 642730. [Google Scholar] [CrossRef]
Figure 1. The content of ginsenosides in wild ginseng of different growth years.
Horticulturae 11 00467 g001
Figure 2. The morphological indicators of understory ginseng at different growth years. (A) Ginseng yield. (B) The diameter of ginseng stems. (C) The length of ginseng stems. (D) The length of ginseng roots. (E) The fresh weight of ginseng roots. (F) The diameter of ginseng stems.
Horticulturae 11 00467 g002
Figure 3. Soil microorganisms’ utilization of carbon sources. (A) AWCD values of soil microorganisms. (B) Soil microorganisms’ utilization of different types of carbon sources. (C) Soil microorganisms’ utilization of single carbon sources. The depth of the color represents the utilization rate of the corresponding carbon source by soil microorganisms. The darker the color, the higher the utilization rate, and vice versa.
Horticulturae 11 00467 g003
Figure 4. (A) UPGMA cluster analysis. (B) Principal co-ordinates analysis. (C) Soil bacterial species diversity stacked bar chart at the phylum level. (D) Soil bacterial species diversity heatmap at the genus level.
Horticulturae 11 00467 g004
Figure 5. Lef Se-based linear discriminant analysis (LDA > 3.5). In the diagram, the different layers of circles radiating from the center outward represent the seven taxonomic ranks from kingdom to species. Each node represents a species classification at that level, and the size of the node is proportional to the abundance of that species.
Horticulturae 11 00467 g005
Figure 6. Bacterial function cluster heat map based on FAPROTAX prediction. The gradient color from blue to red is used to reflect the change in abundance from low to high. The more close to blue, the lower the abundance, the closer to red, and the higher the abundance. The heat map is transformed by Z value to normalize the expression abundance of the same bacteria.
Horticulturae 11 00467 g006
Figure 7. The correlation network diagram between the biomass and ginsenoside content of understory ginseng and soil chemical properties, enzyme activity, bacterial abundance, and carbon sources. In the figure, solid red lines represent positive correlations, while dashed blue lines represent negative correlations.
Horticulturae 11 00467 g007
Table 1. Gradient elution conditions.
Time (min)Elution Gradient
0–4082–79%A
40–4279–75%A
42–4875–68%A
48–7268–63%A
72–7963–51%A
79–8282–82%A
Table 2. Ginsenoside standard curve and linear range.
CompositionEquationR2Linear Range (μg·mL−1)
Rg1Y = 35.572X + 49.5940.999420~200
ReY = 17.156X + 54.9010.999320~200
RfY = 10.174X + 5.6320.999510~100
Rg2Y = 69.952X − 28.8070.998840~400
RcY = 48.479X − 10.4530.999440~400
Rb1Y = 39.498X − 27.2380.999440~400
Rb2Y = 16.629X + 5.0530.998320~200
Rb3Y = 11.230X − 7.0030.999310~100
RdY = 27.398X − 19.8520.999120~200
Table 3. Soil chemical properties and enzyme activities.
Name5 Years9 Years17 Years
pH5.46 ± 0.06 a4.74 ± 0.13 b5.33 ± 0.11 a
EC (μS·cm−1)40.83 ± 6.47 a31.38 ± 2.81 b33.82 ± 3.82 b
AHN (mg·kg−1)269.21 ± 32.49 c328.98 ± 6.56 b438.32 ± 24.43 a
AP (mg·kg−1)12.97 ± 1.4 a12.83 ± 1.14 a10.84 ± 0.51 b
AK (mg·kg−1)128.08 ± 11.92 b101.11 ± 12.3 c229.52 ± 12.93 a
OM (%)10.71 ± 0.65 b10.41 ± 0.9 b15.28 ± 1.73 a
S-SC (mg·g−1·d−1)7.89 ± 0.44 b3.58 ± 0.3 c10.7 ± 1.85 a
S-UE (mg·g−1·d−1)265.5 ± 41.8 b89.65 ± 13.72 c594.09 ± 13.15 a
S-CAT (μg·g−1·d−1)102.02 ± 0.39 a86.68 ± 0.49 c93.16 ± 1.23 b
S-ACP (μmol·g−1·d−1)19.78 ± 1.11 a17.09 ± 0.23 b15.75 ± 0.87 c
Note: EC: electrical conductivity; OM: organic matter; AHN: alkali-hydrolyzed nitrogen; AP: available phosphorus; AK: available potassium; S-UE: soil urease; S-SC: soil sucrase; S-ACP: soil acid phosphatase; S-CAT: soil catalase. Values are the means of five replicates ± SE. Treatment means with different letters are significantly different (p < 0.05).
Disclaimer/Publisher’s Note: The statements, opinions and data contained in all publications are solely those of the individual author(s) and contributor(s) and not of MDPI and/or the editor(s). MDPI and/or the editor(s) disclaim responsibility for any injury to people or property resulting from any ideas, methods, instructions or products referred to in the content.

