Article

Growth and Photosynthetic Responses of Lactuca sativa L. to Different Zinc Fertilizer Sources and Applications

by
Marina de-Francisco
1,
Esther Hernández-Montes
2,3,*,
Sarah DeSanto
4,5,
Monica Montoya
1,2,
Ana Obrador
1,2 and
Patricia Almendros
1,2,*
1
Department of Chemical and Food Technology, Universidad Politécnica de Madrid (UPM), 28040 Madrid, Spain
2
Research Centre for the Management of Agricultural and Environmental Risks (CEIGRAM), Universidad Politécnica de Madrid (UPM), 28040 Madrid, Spain
3
Department of Agricultural Production, Agronomic, Food and Biosystems Engineering School, Universidad Politécnica de Madrid (UPM), 28040 Madrid, Spain
4
Department of Environmental Studies, Hamilton College, Clinton, NY 13323, USA
5
Yale School of the Environment, Yale University, New Haven, CT 06511, USA
*
Authors to whom correspondence should be addressed.
Horticulturae 2025, 11(10), 1221; https://doi.org/10.3390/horticulturae11101221
Submission received: 17 September 2025 / Revised: 7 October 2025 / Accepted: 8 October 2025 / Published: 10 October 2025
(This article belongs to the Special Issue 10th Anniversary of Horticulturae—Recent Outcomes and Perspectives)

Abstract

Zinc (Zn) is an essential micronutrient for plant growth, serving as a co-factor in enzymatic processes and pigment biosynthesis. In horticultural crops such as lettuce, Zn fertilization is increasingly relevant for optimizing yield and nutritional quality. In this study, a greenhouse pot experiment was conducted using Lactuca sativa L. cv. Romana Verano (Ramiro Arnedo) to evaluate the effects of four Zn sources with contrasting physio-chemical properties—ZnSO4, a synthetic chelate containing DTPA, EDTA, and HEDTA, a Zn–lignosulphonate complex, and ZnO nanoparticles—applied to soil at rates of 15, 30, 60, and 120 mg Zn·kg−1. Morphometric traits, photosynthetic pigmentation, and photosystem performance were assessed to determine differences in plant response. Results showed that low to moderate Zn supply (15–60 mg Zn·kg−1) maintained growth, leaf number, stem diameter, and biomass without significant changes compared to the control. In contrast, the highest dose (120 mg Zn·kg−1), particularly in chelated forms, led to reductions in growth and yield exceeding 80%, reflecting supra-optimal effects. Although lignosulphonate and nanoparticles sources lowered soil Zn availability, they did not affect lettuce growth or yield, indicating their potential as safer agricultural alternatives to conventional Zn fertilizers. Photosynthetic efficiency, measured through chlorophyll fluorescence and electron transport activity, was positively modulated by adequate Zn levels but declined at excessive concentrations. These findings highlight that Zn efficiency strongly depends on its chemical form and applied dose, providing practical insights for optimizing Zn fertilization strategies in lettuce and other horticultural crops.

Graphical Abstract

1. Introduction

Lettuce (Lactuca sativa L.) is a widely cultivated leafy vegetable of high economic and nutritional importance in horticultural systems. As a fast-growing crop with high leaf biomass, it requires a balanced supply of essential macro- and micronutrients to ensure optimal growth, quality, and yield [1,2,3]. Among these micronutrients, zinc (Zn) plays a critical role, being involved in numerous physiological processes, including enzyme function, hormone regulation, and photosynthesis [4,5]. Although lettuce exhibits moderate sensitivity to Zn, an adequate supply is essential for its healthy growth, yield formation, and nutritional quality. Zinc acts as a structural and catalytic component of proteins and enzymes and serves as a co-factor for the normal development of pigment biosynthesis [6,7]. Lettuce is particularly responsive to Zn nutrition [2,8], making it a suitable model for studying the effects of Zn availability on plant growth and photosynthetic performance. In this context, the Romana Verano variety (Lactuca sativa L., Ramiro Arnedo), widely cultivated under Mediterranean conditions, provides a relevant system to assess Zn-related responses in leafy vegetables. Moreover, in horticultural systems, Zn fertilization has gained increasing attention, not only in lettuce but also in other high-value crops, due to its impact on yield, crop quality, and nutritional content [9,10,11,12,13]. Adequate Zn supply can improve leaf size, biomass accumulation, and the accumulation of essential nutrients, contributing to both marketable yield and biofortification efforts [9,10,11,12,13].
Zinc can be supplied to plants in various forms, including soluble salts (e.g., ZnSO4), chelates, complexes (e.g., Zn-DTPA, Zn-diethylenetriaminepentaacetic; Zn-HEDTA, Zn-N-(2-Hydroxyethyl)ethylenediamine-N,N,N″-triacetic; Zn-EDTA, Zn-ethylenediaminetetraacetic; Zn-lignosulphonate…), or as a potential fertilizer containing Zn in nanoparticle form. The efficiency of different Zn sources depends largely on their physicochemical characteristics, including solubility and stability [14]. Their availability in soils or substrates is influenced by factors such as pH, texture, and organic matter content [15]. Highly soluble and bioavailable forms can enhance Zn uptake and improve plant growth and physiological performance, while their effectiveness may vary depending on the plant species and environmental conditions [11,12,16].
In this context, synthetic chelates such as EDTA or DTPA are widely used due to their capacity to maintain Zn in soluble and plant-available forms even under unfavorable soil conditions. However, concerns regarding their persistence and potential environmental impact have stimulated the search for alternatives [17]. Natural complexes derived from organic residues, lignosulphonates, or humic substances represent an attractive option, as they may combine nutrient supply with soil conditioning effects [18]. More recently, the use of Zn nanoparticles has gained attention as an innovative strategy, offering the possibility of controlled release, higher reactivity, and potentially greater efficiency [9,16]. Nevertheless, there is growing concern that high concentrations or improper application of Zn nanoparticles may lead to phytotoxic effects, negatively affecting plant growth, physiological processes, or photosynthetic performance. For instance, the accumulation of ZnO nanoparticles in plant tissues has been shown to damage the structural organization of chloroplasts, leading to reduced photosynthetic efficiency and growth inhibition in Hordeum sativum L. [19], Hordeum vulgare L. [20], Arabidopsis thaliana [21], Vicia faba [22], or Trachyspermum ammi L. [23]. Despite these advances, experimental evidence on how these contrasting Zn sources affect lettuce physiology, particularly photosynthetic performance and pigment biosynthesis, is still limited. Therefore, evaluating and comparing these different Zn sources is of increasing interest, not only to improve crop nutrition and productivity but also to develop sustainable fertilization practices adapted to modern agricultural challenges [11,12].
When supplied in adequate doses, Zn contributes to normal plant growth by promoting stem and root elongation, increasing leaf area, and supporting biomass accumulation [4,10,11,12,24,25]. These beneficial effects are associated with its role in enzyme activation, pigment biosynthesis, and the regulation of metabolic pathways [2,3,15]. However, when Zn concentrations exceed certain thresholds, such as 100–700 mg Zn·kg−1 dry matter in leaves, growth can be adversely affected [2]. Under such conditions, reductions in stem diameter, total leaf number, and overall yield have been reported in several crops, including lettuce [2,4,5,6]. These negative responses are often linked to metabolic disturbances in the roots, such as alterations in carbohydrate metabolism, glucosinolates, and polyamines, which ultimately compromise nutrient transport and energy management in leaves [26,27]. Nevertheless, comparative studies in lettuce are still scarce, limiting our understanding of how conventional salts, synthetic chelates, organic complexes, and nanostructured fertilizers may differentially modulate growth and physiological traits.
Zinc availability also influences photosynthetic performance, particularly the activity of Photosystems II (PSII) and I (PSI), electron transport, and chlorophyll fluorescence [3,10,28]. Greater PSII and PSI efficiency reflects improved capture and conversion of solar energy within the leaf photosystems [28,29,30,31,32,33,34]. In lettuce cultivated in a substrate mixture, foliar application of Zn oxide nanoparticles (8.5–17 mg Zn per plant) has been reported to enhance chlorophyll levels, improve light absorption, promote efficient energy transfer between photosystems, and support water photolysis and oxygen evolution [13]. However, the relative contribution of Zn supplied as salts, chelates, organic complexes, or nanoparticles to photosystem activity in lettuce has not been systematically compared. In particular, it is highly relevant to determine how different doses of these Zn sources, including supra-optimal or potentially toxic levels, influence lettuce physiology. These findings are particularly relevant in horticulture, where optimizing photosynthetic efficiency and pigment content can translate directly into higher quality and more uniform leafy products.
Despite numerous studies on Zn nutrition, there is still limited information on how different Zn sources—including salts, chelates, organic complexes, and nanoparticles—differentially influence plant morphometric traits, photosynthetic pigments, and photosystem activity in lettuce (Lactuca sativa L.). This knowledge gap is particularly relevant in horticultural systems, where fertilization strategies must not only sustain crop productivity but also improve nutritional quality while maintaining economic and environmental sustainability.
The aim of this study was to evaluate how different Zn sources and application rates affect growth, morphometric traits, pigment biosynthesis, and photosystem efficiency in lettuce (Lactuca sativa L.), with special emphasis on dose-dependent physiological responses, including potential phytotoxic effects. To address this objective, four Zn sources with contrasting physicochemical properties were tested, including a highly soluble and traditionally used salt, a synthetic Zn chelate designed to maintain Zn availability across a wide pH range, an organic-complexed source obtained from sulfonated lignin wastes of the paper pulp industry with potentially slower release, and nanoparticles characterized by high surface area and reactivity. These sources were applied at different soil rates to capture both adequate and supra-optimal levels of Zn availability.
The hypothesis of this study was that the physiological response of lettuce to Zn is both dose- and source-dependent, with low to moderate doses enhancing growth and photosynthesis, whereas supra-optimal doses, particularly from highly soluble or reactive sources (chelates, nanoparticles), are expected to induce negative effects on morphometric traits and photosystem efficiency.

2. Materials and Methods

2.1. Pot Experiment

The original soil surface horizon used in this study was obtained from the National Center of Irrigation Technology “CENTER”, Madrid (latitude 40°24′59.2″ N, longitude 3°29′46.9″ W). Soil samples from the Ap horizon (0–28 cm) were air dried, sieved (<2 mm), and then analyzed according to the Spanish official methodology [35]. The selected soil, classified as a Fluvisol [36], exhibited an alkaline pH (8.2) and a silty loam texture (30.4% sand, 64.1% silt, and 5.5% clay). Electrical conductivity was low (159 μS·cm−1), indicating low salinity. It showed low oxidizable organic matter content (14.5 g·kg−1) and total nitrogen (1.3 g·kg−1), with a reduced C:N ratio (6.5), suggesting rapid organic matter mineralization. Extractable phosphorus was low (8.3 mg·kg−1), while exchangeable calcium reached high values (3499 mg·kg−1), in contrast to moderate magnesium (287 mg·kg−1) and sodium (71 mg·kg−1) levels. Available Zn (0.93 mg·kg−1) was low (<1.2 mg·kg−1), which could limit its bioavailability to crops [37].
In May 2024, pots of 3.0 kg of soil were fertilized with the macronutrients N, P, K following the fertilization recommendations for Lactuca sativa L. [1]. This fertilization involved applying 100 kg N·ha−1 as urea, 50 kg P2O5·ha−1 as K2HPO4 and 160 kg K2O·ha−1 as K2HPO4 and K2SO4. The NPK-fertilized soils were treated with different forms of Zn: Zinc sulfate heptahydrate (Merck, Darmstadt, Germany) [SULP], Synthetic Zn chelate, with DTPA (diethylenetriaminepentaacetic), HEDTA (N-(2-Hydroxyethyl)ethylenediamine-N,N,N″-triacetic acid) and EDTA (Ethylenediaminetetraacetic acid) (90.0 g water-Zn soluble·L−1, Zn chelated with DTPA: 16.7 g Zn·L−1, Zn chelated with EDTA: 50.2 g Zn·L−1, Zn chelated with HEDTA: 23.1 g Zn·L−1; ρ = 1.29 g·cm−3) (BMS Micro-Nutrients NV, Bornem. Belgium) [CHE], Zn complex: Zn lignosulphonate (complex obtained from an organic source: byproduct of the paper pulp production process from wood pulp) with sulfonated lignin wastes produced by the paper (Zn concentration: 12% p/p) (Commercial product Rayplex Zinc®, obtained from CQ Massó, Barcelona, Spain) [LIG], commercial ZnO Nanoparticles (Aldrich Chemistry, Stenheim, Germany) [NANO] and treatment with only NPK fertilization [CONTROL]. The Zn treatments were applied at doses of 15, 30, 60 and 120 mg Zn·kg−1 soil. Three replicates were used for each treatment, with a total of 51 pots in a randomized complete block design.
ZnO nanoparticles (ZnO NPs) presented a primary particle size ≤ 50 nm and a specific surface area of 15–25 m2·g−1. Transmission electron microscopy (TEM) revealed an elongated, rod-like morphology with a mean length of 55 ± 27 nm. The zeta potential in solution was −7.2 mV, indicating low colloidal stability [16]. Dynamic light scattering (DLS) showed two main aggregate populations with average hydrodynamic diameters of 503 ± 142 nm (10% intensity) and 1486 ± 244 nm (90% intensity), suggesting that micrometer-scale aggregates predominate in aqueous suspension [38].
Lettuce plants (Lactuca sativa L., Romana Verano, Ramiro Arnedo) at 25 days of growth were individually placed in pots and transferred to a controlled greenhouse environment on the Universidad Politécnica de Madrid Campus (Madrid, Spain). This variety, widely cultivated under Mediterranean conditions, is reported to exhibit moderate sensitivity to Zn nutrition, making it suitable for the purposes of this study. The temperature (from 4 °C at night to 38 °C during the day) and relative humidity (between 20 and 85%) were selected to simulate real growing conditions in a Mediterranean climate. Due to the low water-holding capacity of this soil, the soil moisture was controlled by weighing three times a week, at 100% of its water-holding capacity using tap water. Although the soil had an alkaline pH (8.2) and a silty loam texture, pots were well-aerated under greenhouse conditions, ensuring sufficient oxygen availability. Consequently, redox potential dynamics were not considered a limiting factor in this experimental setup.

2.2. Plant and Soil Analysis

At 20 days after sowing, physiological measurements were carried out on lettuce plants using the MultispeQ device (PhotosynQ, East Lansing, MI, USA) on the third mature leaf from the base of each plant. Plants were visually monitored for typical Zn deficiency or toxicity symptoms, including interveinal chlorosis, leaf deformation, necrotic spots, or stunted growth. A portable MultispeQ device (PhotosynQ, East Lansing, MI, USA) was used to perform non-destructive assessments of photosynthetic, physiological, and structural parameters.
Leaf morphology and structural traits were measured, including leaf mass per area (LMA, g·m−2), leaf angle, and relative chlorophyll content (SPAD index). Chlorophyll fluorescence and Photosystem II (PSII) parameters were determined in light-adapted leaves following the standard MultispeQ protocol. Minimal (Fo′) and maximal (Fm′) fluorescence, as well as steady-state fluorescence (Fs), were recorded under ambient light without prior dark adaptation. Variable fluorescence relative to Fm′ (Fv′/Fm′, PSII efficiency), photochemical quenching (qL), effective quantum yield of PSII [ΦPSII], total non-photochemical quenching (NPQt), fraction of energy dissipated by regulated non-photochemical quenching (ΦNPQ), fraction of energy dissipated non-regulated (ΦNO), and linear electron flow (LEF) were also determined.
Additionally, Photosystem I (PSI) parameters were measured, including the kinetic constant of P700 (kP700), P700 relaxation time (tP700), initial rate of P700 oxidation (vinitialP700), and the proportion of active, open, over-reduced, and oxidized PSI centers. Values of PSI Over-reduced Centers were not considered in the analysis, as negative values were occasionally obtained, which are attributable to measurement noise rather than biologically meaningful variation. Proton gradient and electrochromic shift (ECS) parameters were also quantified, namely ECS relaxation time constant (ECS_τ), total ECS amplitude (ECSt, mAU), proton conductance through ATP synthase (gH+), and proton flux rate (vH+). Finally, environmental and light-related conditions were monitored, including leaf temperature, leaf-to-air temperature differential, and photosynthetically active radiation (PAR).
A detailed description of all photosynthetic, physiological, and environmental parameters, along with their abbreviations and physiological meaning, is provided in Supplementary Table S1. The plants were harvested 40 days after treatment application, cut at the collar and the stem diameter was measured. The plants were then weighed and washed with distilled water. The number of leaves on each lettuce plant was counted, and samples of young (youngest fifth leaf) and mature (second and third oldest leaves) lettuce leaves were separated for various analyses of the plant material. Total Zn concentrations in dry leaves (in young and mature leaves) were determined by wet digestion in Teflon vessels using a sample preparation block system (SPB Probe, Perkin-Elmer, Waltham, MA, USA). For this procedure, 0.5 g of dry matter samples were used along with 10 mL of an acid mixture (5 mL HNO3 (65%), 2 mL HF (48%), and 3 mL H2O).
Following the harvest, the soil from each pot was naturally dried and homogenized. Bioavailable Zn concentration was assessed using the rhizosphere-based extraction method with low-molecular-weight organic acids (LMWOAs). A 10 mM combination of organic acids solution containing acetic, lactic, citric, malic, and formic acids in a molar ratio of 4:2:1:1:1 was used [39]. The Zn concentration in the extracts was quantified using flame atomic absorption spectrophotometry (FAAS) (AAnalyst 900, Perkin Elmer, Waltham, MA, USA).

2.3. Statistical Analysis

Statistical analyses were done using Statgraphics Centurion 19 software (Manugistic, Rockville, MD). Multifactor analyses of variance were conducted using the optimized Box–Cox general linear model. The main effects were differentiated using Fisher’s LSD test at a probability level of p ≤ 5%.

3. Results

3.1. Effect of Zn Treatments on Soil

Soil concentrations of available Zn differed significantly among treatments (p < 0.001; Table 1). The highest values were recorded in the CHE treatment at the maximum application rate (120 mg Zn·kg−1), followed by SULP at the same dose. In contrast, the NANO and LIG treatment at 120 mg Zn·kg−1 resulted in bioavailable Zn concentrations comparable to those observed in CHE at 60 mg Zn·kg−1. Significant differences among Zn sources were observed (p < 0.001), with CHE consistently yielding the highest soil Zn availability. In addition, bioavailable Zn concentrations increased progressively with the application rate (p < 0.001).

3.2. Effect of Zn Treatments on Lettuce

Agronomic efficiency and crop quality parameters related to Zn content are shown in Figure 1. The SULP, NANO and LIG sources applied at any dose showed no significant differences in yield compared to the control treatment (Figure 1a). However, the CHE applied at doses equal to or greater than 30 mg Zn·kg−1 showed a significant reduction in lettuce yield (reductions of 78.3, 93.3 and 95.3% compared to the control, with doses of 30, 60 and 120 mg Zn·kg−1, respectively).
The concentration of Zn in both young and mature leaves reached the highest values with the CHE source at application rates of 30, 60, and 120 mg Zn·kg−1. In young leaves, Zn concentrations were 14.0-, 13.4-, and 11.1-fold higher than those of the control treatments at the corresponding doses (Figure 1b). In mature leaves, the increases were even greater, with Zn concentrations 19.4-, 29.5-, and 75.6-fold higher than those of the control treatments at 30, 60, and 120 mg Zn·kg−1, respectively (Figure 1c). It is also noteworthy that in the case of the control treatment and the SULP, NANO and LIG sources applied at a dose of 15, the concentration of Zn in young leaves was higher than the concentration in mature leaves. However, in the rest of the treatments, the concentration of Zn in mature leaves was higher than in young leaves.
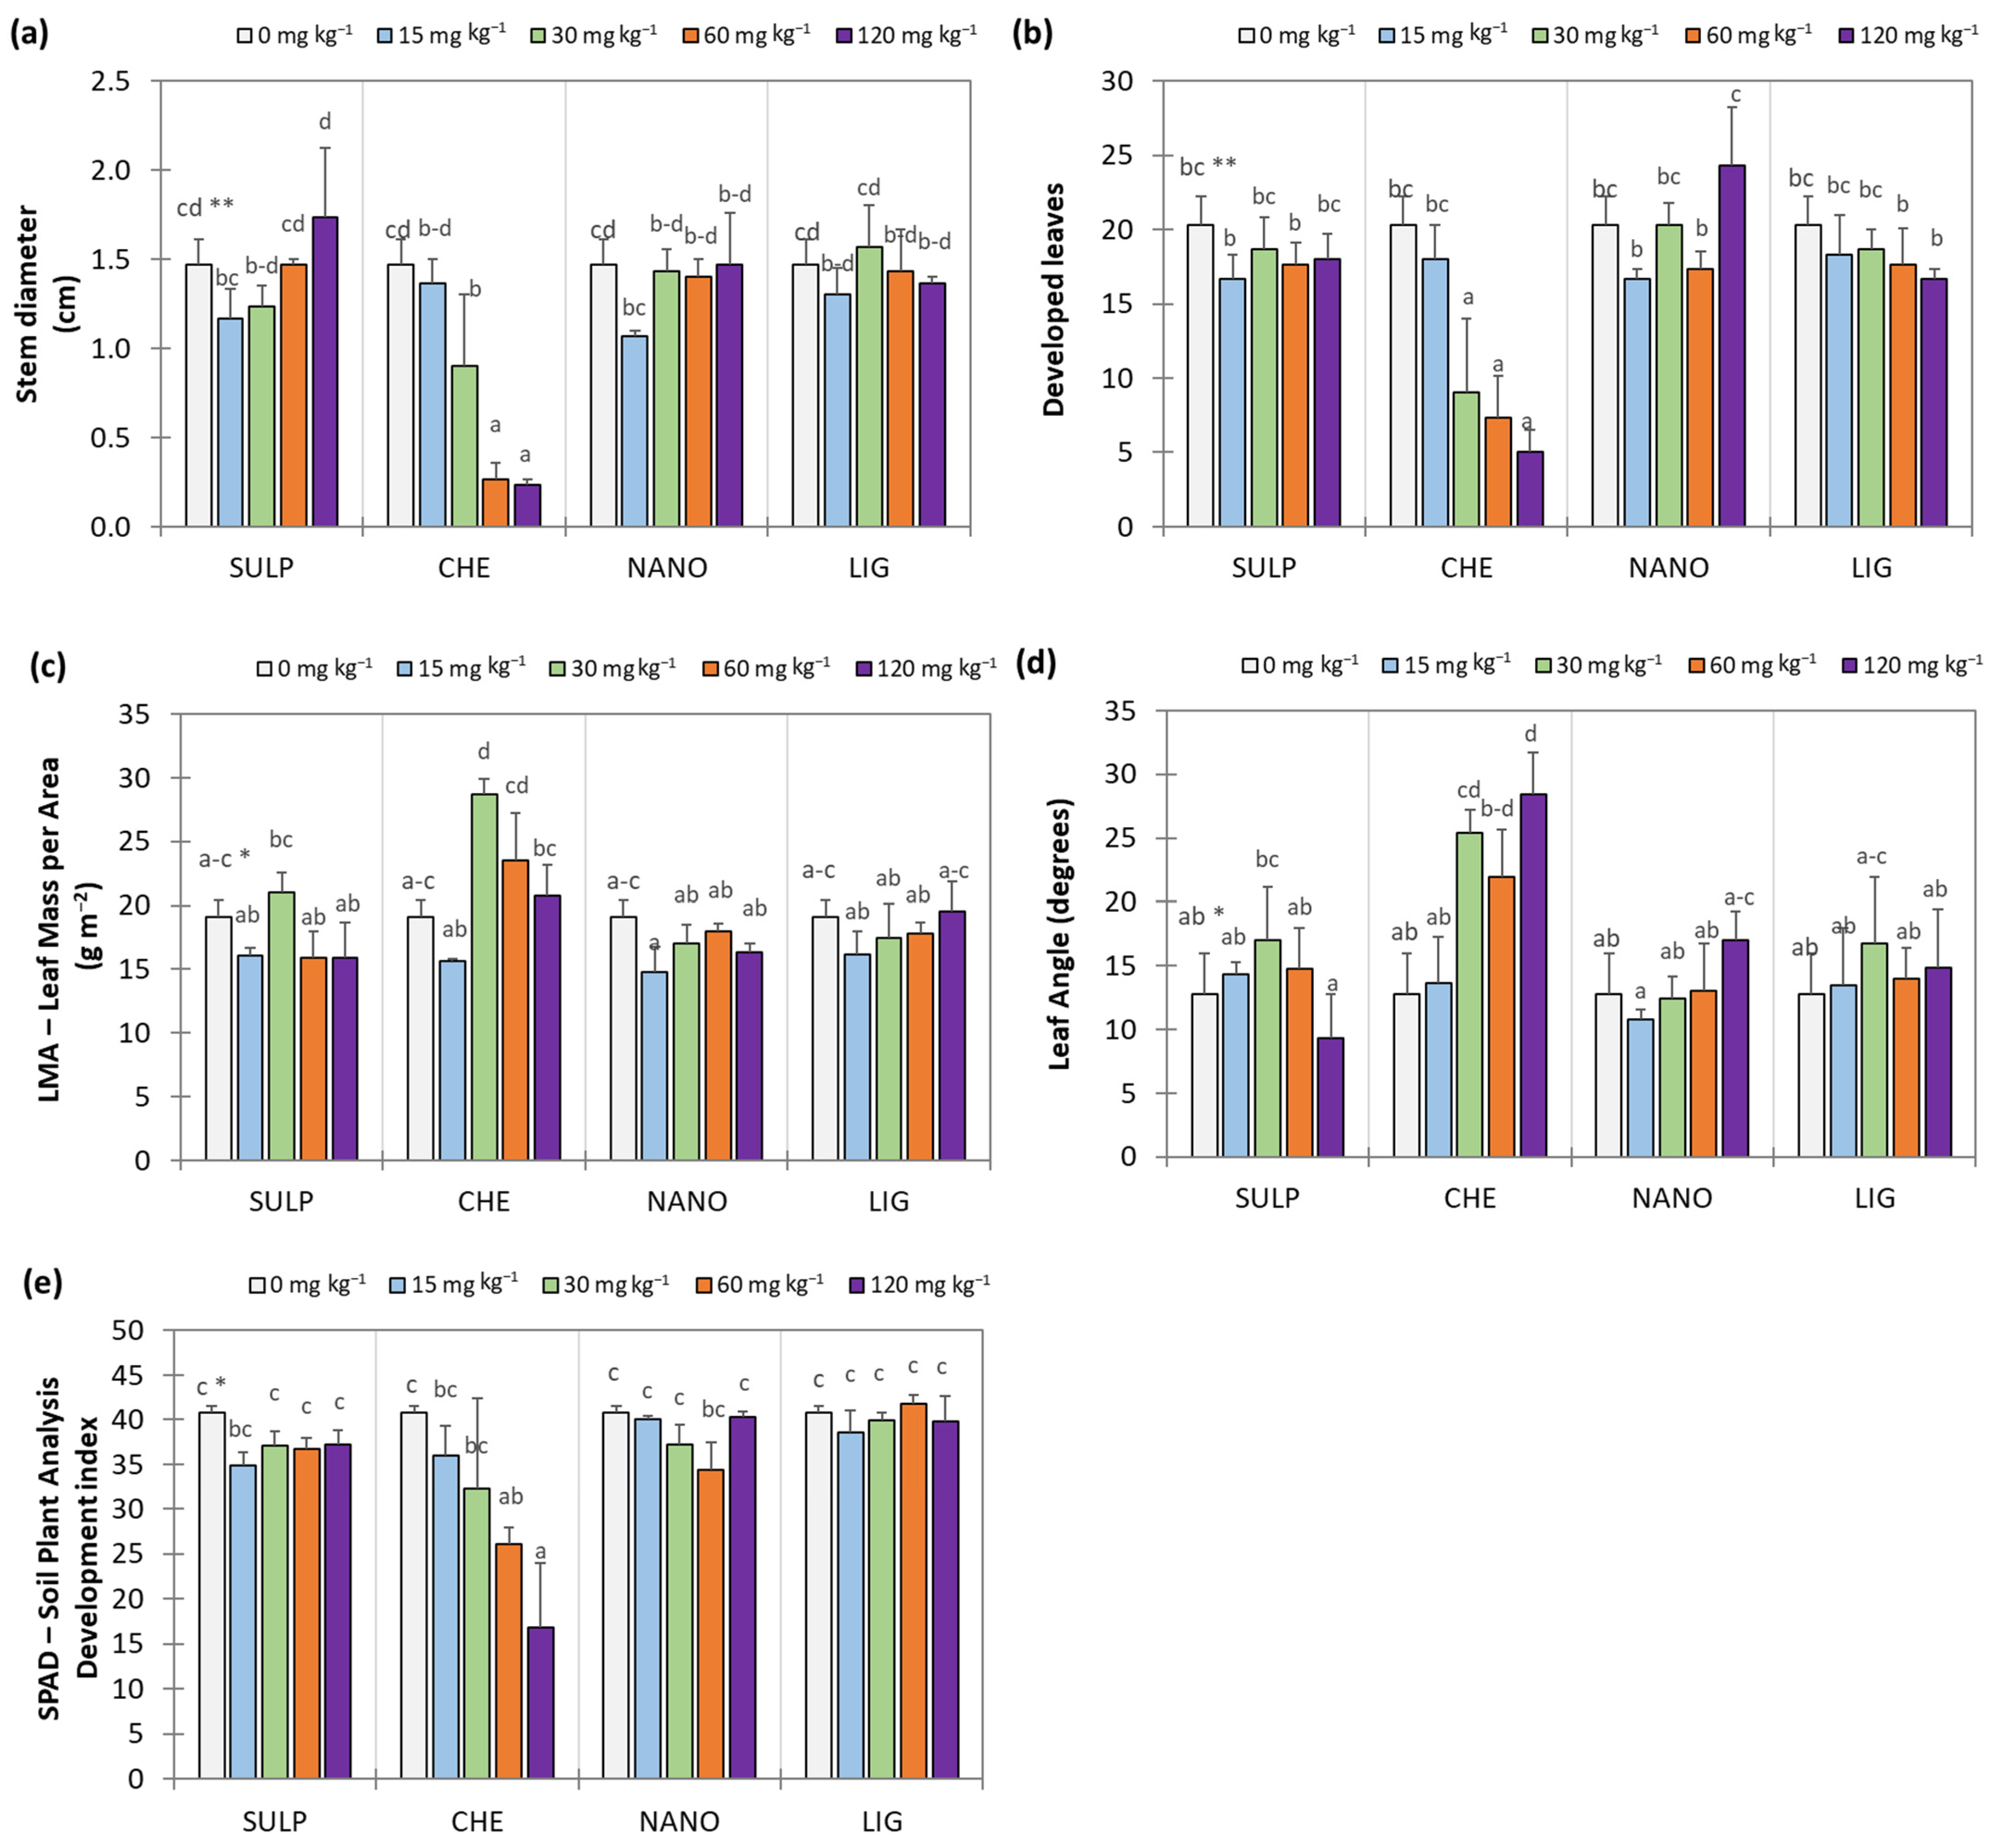
At the whole-plant level, morphological and structural traits showed pronounced responses to Zn treatments. The application of CHE at rates of 30 mg Zn·kg−1 or higher resulted in a decrease in stem diameter and total leaf number. Stem diameter was reduced by 38.6, 81.8, and 84.1% relative to the control at 30, 60, and 120 mg Zn·kg−1, respectively (Figure 2a). Similarly, the number of developed leaves decreased by 55.7, 63.9, and 75.4% compared to the control at the same application rates (Figure 2b).
At the leaf level, significant differences were observed in LMA, leaf angle, and SPAD values. The highest LMA values were observed with CHE at 30 mg Zn·kg−1, representing an increase of 50.2% compared to the control (Figure 2c). At 60 mg Zn·kg−1, CHE also promoted higher LMA than at 15 mg Zn·kg−1, with an increase of 50.6%. However, at the highest application rate, LMA values were statistically comparable to those at 15 mg Zn·kg−1. For the other treatments, no statistically significant differences from the control were detected. For leaf angle, the highest values were again observed with the CHE source, at application rates of 30 and 120 mg Zn·kg−1, showing increases of 26.9% and 20.5% compared to the control, respectively (Figure 2d). For the other treatments, values were not significantly different from those of the control. SPAD values revealed a negative effect of CHE application at high doses, with a reduction of up to 58.6% compared to the control when CHE was applied at 120 mg Zn·kg−1 (Figure 2e). The remaining treatments showed values statistically similar to the control.
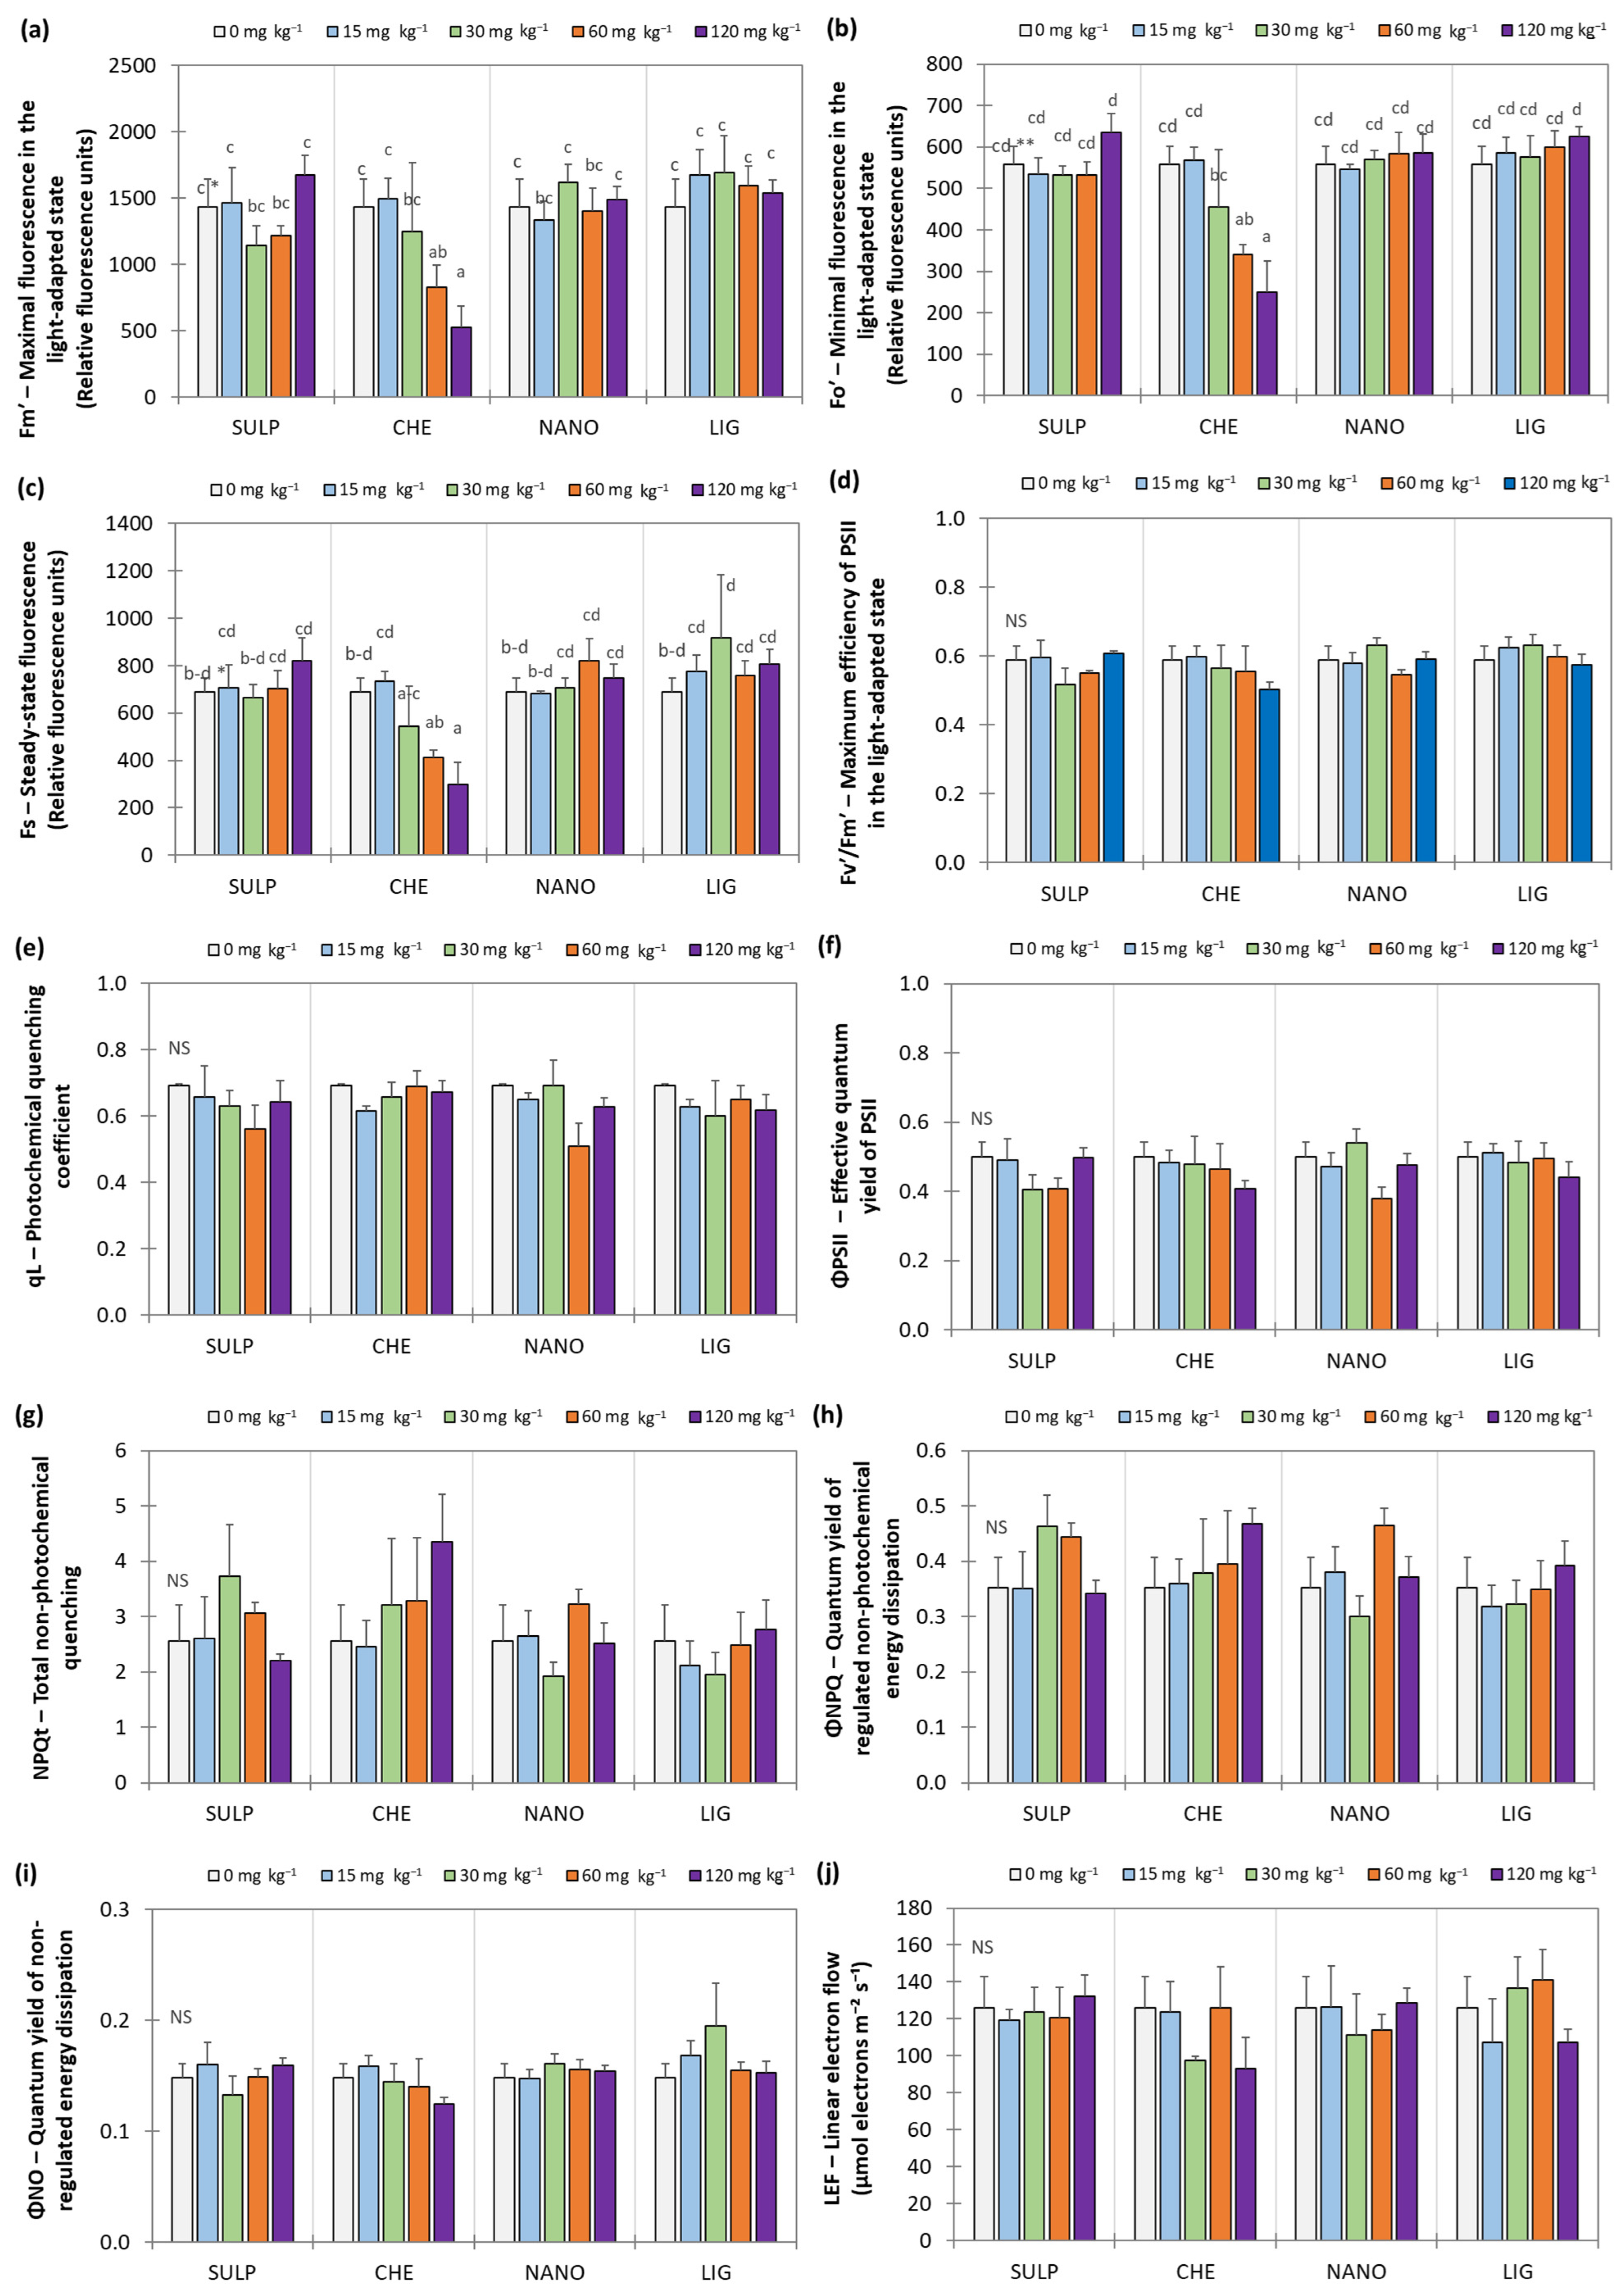
The results also revealed differential effects of the treatments on parameters related to chlorophyll fluorescence and PSII (Figure 3). A marked decrease in both maximal fluorescence (Fm′, Figure 3a) and minimal fluorescence in the light-adapted state (Fo′, Figure 3b) was observed following CHE application at 60 and 120 mg Zn·kg−1. Specifically, Fm′ decreased by 42.3% and 63.3%, respectively, compared to the control, while Fo′ decreased by 39.1% and 55.3%, respectively, relative to the control. For the other treatments and doses, no statistically significant differences from the control were detected. Steady-state fluorescence (Fs, Figure 3c) reached its highest value with LIG at 30 mg Zn·kg−1, showing an increase of 33.3% relative to the control. In contrast, CHE at 60 and 120 mg Zn·kg−1 produced significant reductions in Fs compared with the other Zn sources at the same rates, with average decreases of 45.9% and 62.1%, respectively. For the remaining evaluated parameters—Fv′/Fm′ (maximum efficiency of PSII in the light-adapted state, Figure 3d), qL (photochemical quenching coefficient, Figure 3e), ΦPSII (effective quantum yield of PSII, Figure 3f), NPQt (total non-photochemical quenching, Figure 3g), ΦNPQ (quantum yield of regulated non-photochemical energy dissipation, Figure 3h), ΦNO (quantum yield of non-regulated energy dissipation, Figure 3i), and LEF (linear electron flow, Figure 3j)—no significant differences were observed among treatments.
Photosystem I (PSI)–related parameters, including kP700 (kinetic constant of P700), tP700 (relaxation time of P700), v_initial P700 (initial rate of P700 oxidation/reduction), and PSI Open Centers, did not differ significant differences among treatments (Figure 4). In contrast, PSI Active Centers were significantly reduced compared to the control under LIG at 15 mg Zn·kg−1 (55.7% reduction) and CHE at 30, 60, and 120 mg Zn·kg−1 (67.2, 68.1, and 88.4% reductions, respectively) (Figure 4d). PSI Oxidized Centers increased significantly under LIG at 15 mg Zn·kg−1 and CHE at 30 and 60 mg Zn·kg−1, with increments of 284.2, 171.4, and 200.7% relative to the control (Figure 4f). Notably, CHE at 120 mg Zn·kg−1 almost completely suppressed this parameter, showing a 99.7% decrease relative to the control. No other treatments caused significant differences. These results indicate that high doses of CHE strongly affect PSI function, whereas LIG exerts moderate effects, highlighting the dose- and source-dependent sensitivity of PSI in lettuce.
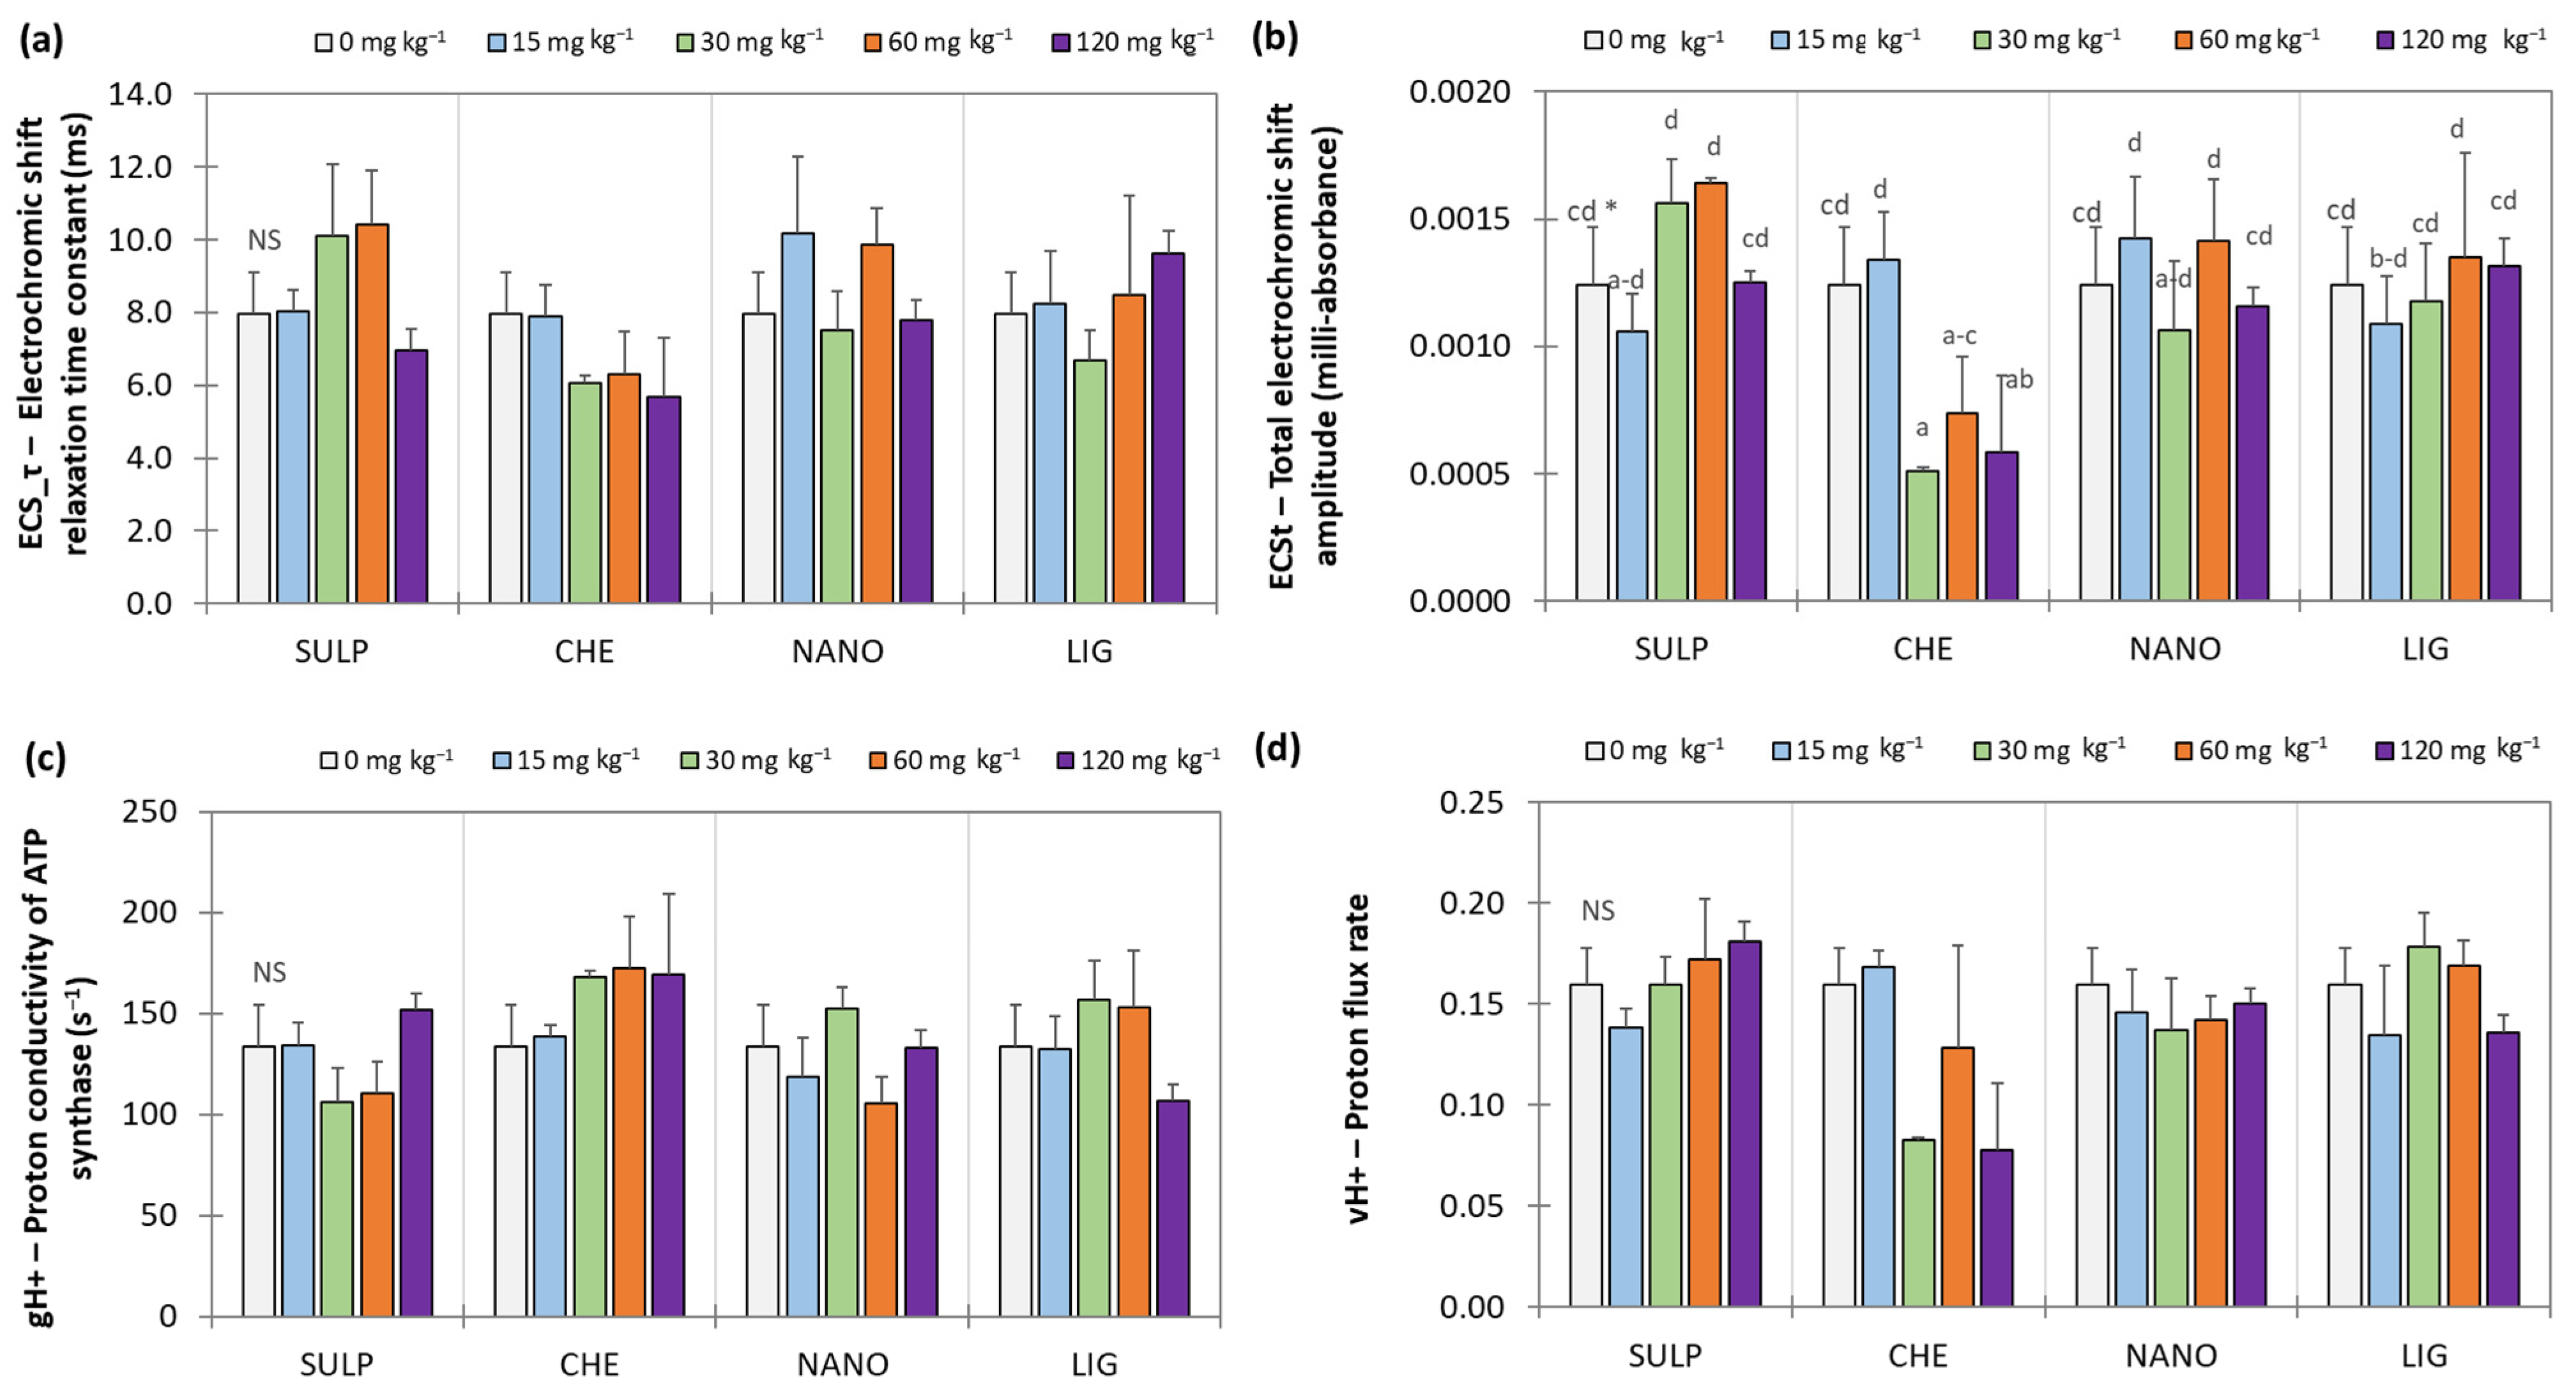
The results for proton gradient and ECS-related parameters indicated no significant differences among treatments for ECS_τ (relaxation time constant of the ECS), gH+ (proton conductance through ATP synthase), or vH+ (proton flux rate) (Figure 5). However, the total amplitude of the ECS (ECSt, expressed in mAU) showed a marked reduction compared with the control in CHE treatments at application rates of 30, 60, and 120 mg Zn·kg−1, with decreases of 58.8, 40.7, and 53.0%, respectively (Figure 5b). No differences among Zn sources were detected at the 15 mg·kg−1 dose. In contrast, at 30, 60, and 120 mg·kg−1, ECSt values for CHE were significantly lower than those of the other sources, with average reductions of 59.6, 49.1, and 53.1%, respectively.
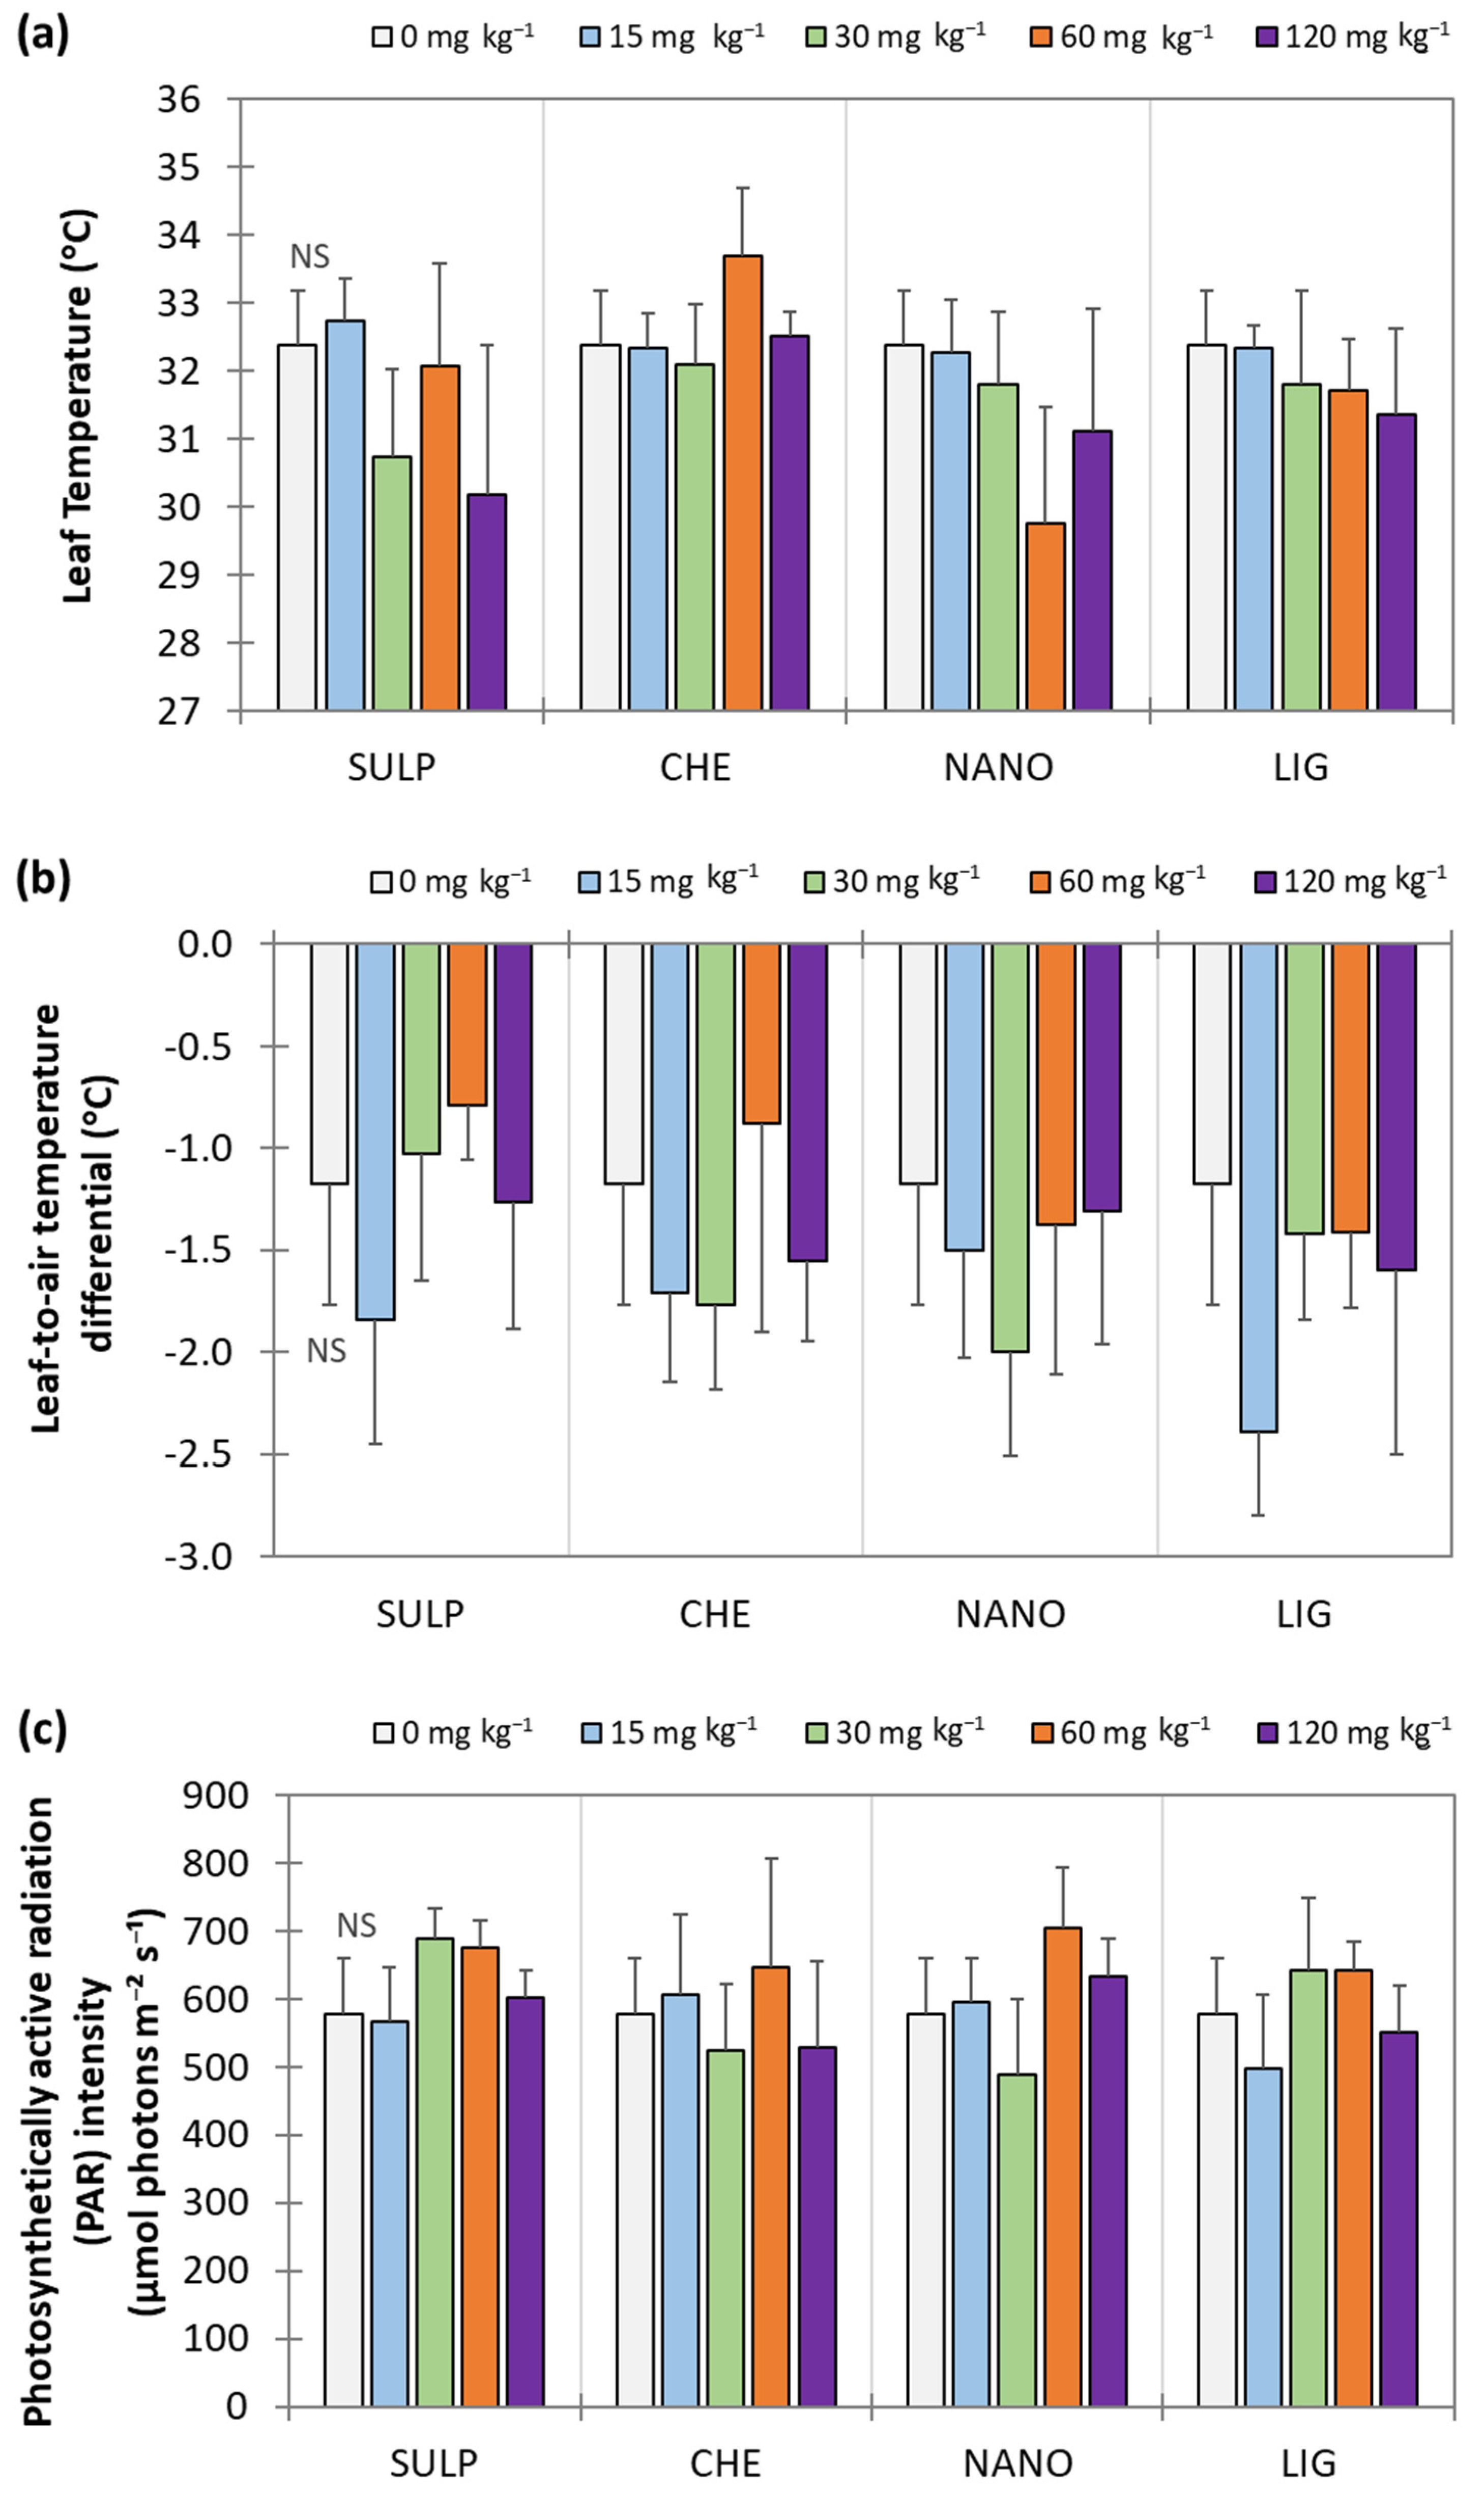
In addition, the evaluation of environmental and light-related parameters—leaf temperature, leaf-to-air temperature differential, and light intensity (PAR)—showed no significant differences among the treatments evaluated (Figure 6).
Significant negative correlations were detected between Zn concentration in leaves and several evaluated parameters, including yield, stem diameter, total leaf number, SPAD, Fm′, Fo′, Fs, Fv′/Fm′, ΦNO, LEF, tP700, v_initial P700, PSI Active Centers, ECS_τ, ECSt, and vH+ (Table 2). These results indicate that excessive Zn accumulation in leaf tissue is associated with impairments in both growth and photosynthetic performance. In contrast, significant positive correlations were found between Zn concentration in mature leaves and LMA, leaf angle, NPQt, and gH+, suggesting that plants may undergo structural and physiological adjustments to cope with elevated Zn levels.

4. Discussion

This study provides new insights into how different Zn sources and application rates influence lettuce physiology, highlighting the importance of both source and dose in determining plant growth, photosynthetic performance, and potential phytotoxic effects. The results of this study demonstrate that the effects of Zn fertilization in lettuce strongly depend on the source and rate of Zn applied. Among the evaluated sources, the chelated form (CHE) consistently produced the highest concentrations of bioavailable Zn in the soil. Previous studies have reported the high effectiveness of this chelated Zn source (DTPA-HEDTA-EDTA), which enables the release of elevated Zn concentrations in the soil, even in soils with limited Zn availability, such as calcareous soils [24,40]. The behavior of this chelated Zn source may be attributed to the stability constants (K) of the chelates. Chelating agents like EDTA and DTPA have high stability (log K Zn-EDTA = 17.5 and log K Zn-DTPA = 19.5 at an ionic strength of 0.01 mol·L−1) [41], maintaining a high concentration of Zn in the soil solution. In contrast, HEDTA provides greater Zn release (log K Zn-HEDTA = 15.3 at an ionic strength of 0.01 mol·L−1), facilitating Zn retention by soil components. Properly applied chelated sources offer advantages such as improved nutrient uptake, increased mobility and accessibility of nutrients, root absorption, and translocation from root to shoots [42]. Chelating agents also prevent the formation of insoluble compounds and enhance desorption of metals from the soil, promoting metal absorption by plants from the reversible and irreversible phases [43]. However, this high solubility, while beneficial for Zn availability, can lead to excessive uptake, with potential negative consequences for plant performance. Excess Zn can reduce growth, induce leaf chlorosis, and interfere with the uptake of other essential nutrients such as Fe, Mn, and Cu. It may also impair photosynthetic efficiency and, in extreme cases, generate oxidative stress that damages cellular structures, ultimately lowering yield and crop quality [2,4,9,40].
At the whole-plant level, CHE application at rates ≥ 30 mg Zn·kg−1 resulted in pronounced reductions in yield, stem diameter, and total leaf number. These findings indicate that Zn supplied in highly available forms can reach toxic levels. From a practical standpoint, this suggests that moderate CHE doses should be applied in field conditions to enhance growth without inducing toxicity. Consistent with other studies, when Zn concentrations exceed certain thresholds (e.g., 100–700 mg Zn·kg−1 dry matter in leaves or exposures of several tens to hundreds of µM in solution), plants typically exhibit symptoms such as inhibited stem and root elongation, reduced leaf area, lower leaf number, and decreased yield [2,4,5,6]. Toxicity thresholds, however, vary considerably depending on the plant species, the chemical form of Zn, and the soil or substrate pH [7,8].
At the leaf level, increases in leaf mass per area (LMA) and leaf angle were observed in lettuce treated with high Zn doses from the CHE source, likely reflecting morphological adjustments to stress. Higher LMA indicates thicker, denser leaves [29], while increased leaf angle reduces direct light interception [30], both serving to mitigate photoinhibition and oxidative stress [31]. In contrast, SPAD values were strongly reduced, reflecting chlorophyll loss and leaves appeared smaller and exhibited chlorosis, particularly at the highest Zn doses. These morphological and pigmentary changes are consistent with Zn-induced phytotoxicity, supporting the attribution of the observed physiological responses to excessive Zn availability [3]. However, other authors as Ponce-García et al. (2022) [10] reported that moderate Zn supply can enhance pigment levels in green bean; for example, soils amended with ZnSO4 at 100 mg·kg−1, Zn-chelate (Zn-DTPA) at 25 mg·kg−1, or Zn nanoparticles at 50–100 mg·kg−1 led to increased chlorophyll and carotenoid contents. Notably, these authors did not observe a reduction in total chlorophyll even at 100 mg·kg−1 of Zn applied to alkaline soil, regardless of whether Zn was supplied as ZnSO4, Zn-DTPA, or ZnO nanoparticles. Similar results were reported in a study on lettuce by Ortiz (2023) [11], in which different Zn products were applied to soil at a dose of 8 mg Zn·kg−1. In that case, Zn-glycine and ZnSO4 treatments enhanced photosynthetic efficiency, with chlorophyll levels increasing by 29.8% and 32.9%, respectively, compared to unfertilized alkaline soil. However, in a subsequent study on lettuce conducted on acidic soil, Ortiz et al. (2024) [12] found no significant differences in photosynthetic pigments among treatments, as neither total chlorophyll nor carotenoid contents were affected by the application of Zn-citrate, Zn-glycine, or ZnSO4 at the same rate of 8 mg Zn·kg−1 soil. In line with these findings, our results indicate that the NANO and LIG sources, despite generating lower levels of Zn availability in the soil, did not negatively affect plant growth, morphological traits, or yield, supporting their potential as safer alternatives for agricultural application. These sources may offer practical benefits for field management, providing stable growth and photosynthetic performance while minimizing phytotoxic risk.
Physiological analyses revealed that Zn source also strongly influenced photosynthetic performance. Greater PSII and PSI performance reflect enhanced capture of light energy by PSII and more efficient conversion of this energy into chemical energy via the electron transport chain and PSI activity. In our study, CHE treatments at high doses reduced maximal and minimal fluorescence (Fm′ and Fo′) and lowered steady-state fluorescence (Fs), suggesting impaired excitation energy transfer and damage to reaction centers [32,33,34]. In PSI, the strong reduction in PSI active centers, accompanied by an increase in oxidized centers at intermediate CHE doses, suggests impaired electron transport, possibly related to oxidative stress or disruption of the electron transport chain [44,45]. At the highest dose, oxidized centers were nearly eliminated, reflecting severe disruption of PSI function and a collapse of photosynthetic efficiency [7,45].
In contrast, NANO and LIG treatments maintained PSI and PSII performance comparable to the control. Parameters related to the proton gradient and the electrochromic shift (ECS), which reflect the generation and use of a proton motive force across the thylakoid membrane, provided further evidence of CHE-induced dysfunction. While relaxation time, proton conductance, and flux were unaffected, the total ECS amplitude (ECSt) was significantly reduced under CHE treatments, indicating a diminished capacity to generate and maintain proton motive force across the thylakoid membrane [28]. This loss of energy coupling efficiency likely contributes to the observed impairment of photosynthesis.
Different studies conducted by Lucini and Bernardo (2015) [26] and Rouphael et al. (2016) [27] in lettuce reported that exposure to elevated ZnSO4 concentrations induces metabolic alterations in the roots, including changes in carbohydrates, glucosinolates, and polyamines. Such root-level effects may, in turn, influence the leaves’ capacity to manage electrons and energy, thereby modulating PSII efficiency, chlorophyll fluorescence, PSI activity, and electron transport. A more recent study by Garza-Alonso et al. (2023) [13] investigated foliar applications of Zn nanoparticles at 8.5–17 mg Zn per plant in lettuce and found increases in chlorophyll content. The authors suggest that these nanoparticles enhance photosynthetic activity by improving light absorption, accelerating energy transfer between photosystems, and promoting water photolysis and oxygen evolution.
Correlation analyses reinforced our observations. Excess Zn accumulation in leaves was also negatively correlated with Fv′/Fm′, ΦNO, LEF, tP700, v_initial P700, ECS_τ, and vH+, indicating that Zn toxicity broadly compromises PSII efficiency, PSI activity, electron transport, and proton flux dynamics, thereby constraining photosynthetic performance and growth. In contrast, positive correlations with NPQt and gH+ suggest that plants activate regulatory mechanisms such as enhanced non-photochemical quenching and adjustments in proton conductance, to dissipate excess energy and maintain energetic balance under elevated Zn levels [46].
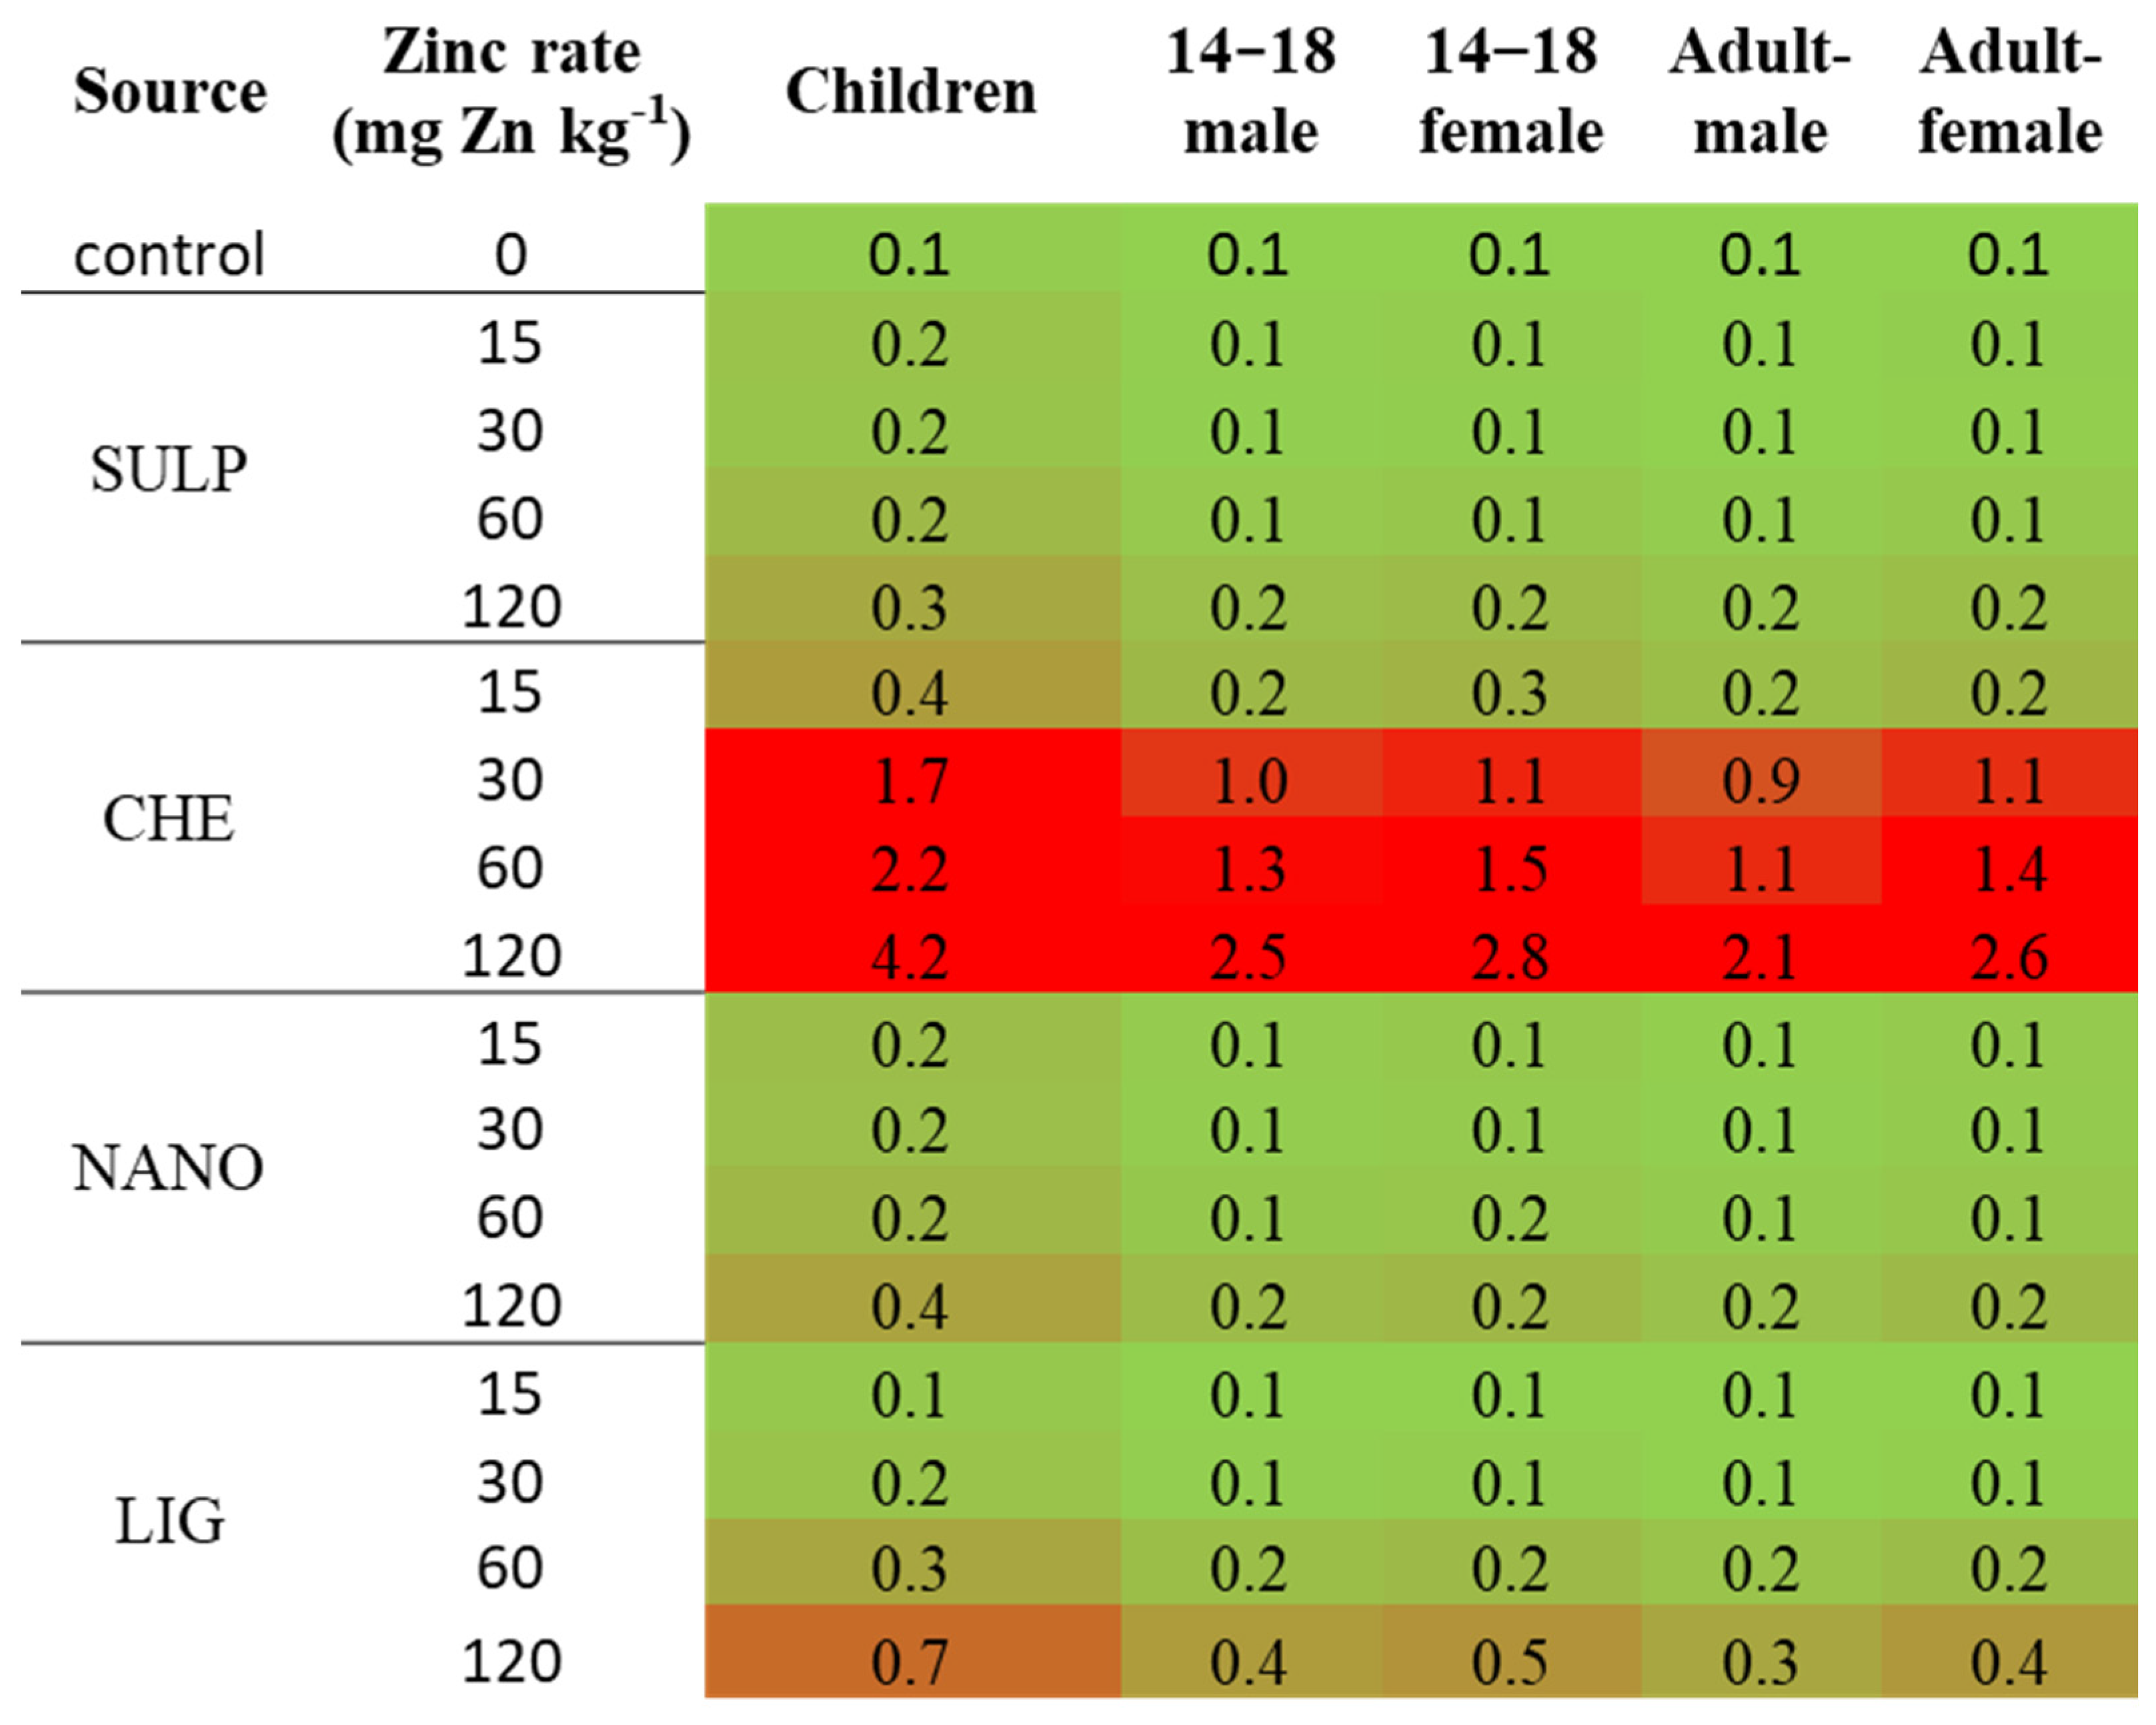
The Zn concentrations measured in lettuce leaves in this study varied according to the source and dose applied. For example, CHE at high doses resulted in leaf Zn contents exceeding 100 mg·kg−1 dry matter, whereas NANO, SULP, and LIG sources produced moderate leaf Zn levels (20–60 mg·kg−1). These values are comparable to those reported for lettuce grown in traditional soils (15–70 mg·kg−1) and hydroponic systems (25–80 mg·kg−1) [2,5]. Optimal Zn levels for growth and photosynthetic performance in lettuce were generally achieved with moderate applications (15–60 mg Zn·kg−1 soil), consistent with previous studies [47]. From a food safety perspective, the Health Risk Index (HRI) calculations provide further insight into the implications of Zn fertilization. For most treatments with ZnSO4, NANO, and LIG, HRI values remained below 1 across all population groups, indicating that lettuce consumption under these conditions does not pose health risks (Figure 7). However, in the case of the chelated source (CHE), HRI values exceeded 1 at doses of 30 mg Zn·kg−1 and above, particularly in children and adolescents, highlighting a potential risk of excessive Zn intake when lettuce is consumed regularly. These findings emphasize that while Zn fertilization can improve crop nutritional value, the choice of source and rate is critical not only for agronomic performance but also for ensuring consumer safety.
Marked differences were also observed in the accumulation of Zn between young and mature leaves. In CHE treatments, Zn was preferentially accumulated in mature tissues, while in control, SULP, NANO, and LIG, concentrations were higher in young leaves. This reversal suggests that, under conditions of elevated Zn supply, plants may sequester excess metal in older tissues as a detoxification mechanism [48,49,50], consistent with reports of heavy metal compartmentalization in senescent leaves [6,51]. In line with this, Doolette et al. [25] reported that foliar application of ZnSO4 and Zn-chelate in wheat resulted in rapid complexation of Zn by endogenous ligands such as phytate and citrate, likely as a defense response to localized Zn toxicity. These findings reinforce the notion that plants activate compartmentalization and chelation processes to mitigate the detrimental effects of Zn overload at both tissue and cellular levels.

5. Conclusions

This study demonstrates that both the source and application rate of Zn critically influence lettuce growth, physiology, and photosynthetic performance. Chelated Zn (CHE) provided the highest soil bioavailability, improving nutrient uptake and translocation, but high doses (≥30 mg Zn·kg−1) caused toxicity, reducing yield, leaf number, stem diameter, and chlorophyll content, and impairing PSII and PSI activity. Zinc accumulation patterns indicated detoxification strategies: under high CHE doses, Zn was preferentially sequestered in mature leaves, while in control, NANO, SULP, and LIG treatments, Zn concentrations were higher in young leaves. At intermediate CHE doses, PSI electron transport was impaired, indicated by a strong reduction in active centers and an accumulation of oxidized centers, whereas at the highest dose, PSI function collapsed, severely reducing photosynthetic efficiency. In contrast, NANO, SULP, and LIG sources, maintained growth, morphology, and photosynthetic efficiency, suggesting safer alternatives for agricultural use. Overall, Zn fertilization must balance bioavailability with phytotoxic risk, and future research could explore novel nanoparticle-based Zn sources, alternative chelates, or foliar application strategies to enhance nutrient efficiency while minimizing toxicity.
From an agronomic perspective, these results provide practical guidance for Zn fertilization in lettuce cultivation. Moderate doses of CHE can enhance nutrient uptake and growth without causing toxicity, whereas NANO, SULP, and LIG sources offer safer alternatives that preserve photosynthetic performance and leaf quality. Future research could explore novel nanoparticle-based Zn sources, alternative chelates, or foliar application strategies to further improve nutrient efficiency while minimizing toxicity.

Supplementary Materials

The following supporting information can be downloaded at: https://www.mdpi.com/article/10.3390/horticulturae11101221/s1, Table S1. Photosynthetic, physiological, and environmental parameters measured in lettuce, grouped by functional category

Author Contributions

Conceptualization, E.H.-M. and P.A.; methodology, E.H.-M. and P.A.; validation, E.H.-M. and P.A.; formal analysis, M.d.-F., E.H.-M. and P.A.; investigation, M.d.-F., E.H.-M., S.D. and P.A.; resources, P.A.; data curation, M.d.-F., E.H.-M. and P.A.; writing—original draft preparation, M.d.-F., E.H.-M. and P.A.; writing—review and editing, M.d.-F., E.H.-M., S.D., M.M., A.O. and P.A.; visualization, M.d.-F., E.H.-M., S.D., M.M., A.O. and P.A.; supervision, E.H.-M. and P.A.; project administration, P.A.; funding acquisition, P.A. All authors have read and agreed to the published version of the manuscript.

Funding

This research was funded by the Comunidad de Madrid through the call Research Grants for Young Investigators from the Universidad Politécnica de Madrid (project: ECOnanoZn, reference APOYO-JOVENES-21-FUF0C0-61-VOXTPR).

Data Availability Statement

Data sets supporting the conclusions of this article are available from the corresponding author upon reasonable request.

Acknowledgments

Thanks to Laura Sanchez-Martin for her help in maintaining the experiment.

Conflicts of Interest

The authors declare no conflicts of interest.

Abbreviations

The following abbreviations are used in this manuscript:
ZnZinc
SULPzinc sulfate heptahydrate
CHEZn chelated with DTPA, EDTA and HEDTA
DTPAdiethylenetriaminepentaacetic acid
EDTAethylenediaminetetraacetic acid
HEDTAN-(2-Hydroxyethyl)ethylenediamine-N,N,N″-triacetic acid
LIGZn–lignosulphonate complex
NANOZnO nanoparticles
TEMTransmission electron microscopy
DLSDynamic light scattering
LMAleaf mass per area
PSIPhotosystem I
PSIIPhotosystem II
Fm′maximum fluorescence in the light-adapted state
Fo′minimal fluorescence in the light-adapted state
Fssteady-state fluorescence
Fv′/Fm′variable fluorescence relative to Fm′
qLphotochemical quenching
ΦPSIIeffective quantum yield of PSII
NPQttotal non-photochemical quenching
ΦNPQfraction of energy dissipated by regulated non-photochemical quenching (NPQ)
ΦNOfraction of energy dissipated non-regulated
LEFlinear electron flow
kP700kinetic constant of P700
tP700P700 relaxation time
vinitialP700initial rate of P700 oxidation
ECSProton gradient and electrochromic shift
ECS_τECS relaxation time constant
ECSt, mAUtotal ECS amplitude
gH+proton conductance through ATP synthase
vH+proton flux rate
PARphotosynthetically active radiation
LMWOAslow-molecular-weight organic acids
FAASflame atomic absorption spectrophotometry

References

  1. Ramos, C.; Pomares, F. Abonado de Los Cultivos Hortícolas. In Guía Práctica de la Fertilización Racional de los Cultivos en España. Parte II; Ministerio de Medio Ambiente y Medio Rural y Marino, Ed.; Secretaría General Técnica: Madrid, Spain, 2010; pp. 181–192. ISBN 978-84-491-0997-3. [Google Scholar]
  2. Marschner, H. Marschner’s Mineral Nutrition of Plants, 4th ed.; Rengel, Z., Cakmak, I., White, P., Eds.; Elsevier: London, UK, 2023; ISBN 978-0-12-819773-8. [Google Scholar]
  3. Fu, C.; Li, M.; Zhang, Y.; Zhang, Y.; Yan, Y.; Wang, Y. Morphology, Photosynthesis, and Internal Structure Alterations in Field Apple Leaves under Hidden and Acute Zinc Deficiency. Sci. Hortic. 2015, 193, 47–54. [Google Scholar] [CrossRef]
  4. White, P.J.; Broadley, M.R. Physiological Limits to Zinc Biofortification of Edible Crops. Front. Plant Sci. 2011, 2, 80. [Google Scholar] [CrossRef] [PubMed]
  5. Chaney, R.L. Zinc Phytotoxicity. In Zinc in Soils and Plants. Developments in Plant and Soil Sciences; Robson, A., Ed.; Springer: Dordrecht, The Netherlands, 1993; Volume 55, pp. 135–150. ISBN 978-94-011-0878-2. [Google Scholar]
  6. Balafrej, H.; Bogusz, D.; Triqui, Z.-E.A.; Guedira, A.; Bendaou, N.; Smouni, A.; Fahr, M. Zinc Hyperaccumulation in Plants: A Review. Plants 2020, 9, 562. [Google Scholar] [CrossRef] [PubMed]
  7. Kaur, H.; Garg, N. Zinc Toxicity in Plants: A Review. Planta 2021, 253, 129. [Google Scholar] [CrossRef] [PubMed]
  8. de Almeida, H.; Carmona, V.M.V.; Inocêncio, M.F.; Furtini Neto, A.E.; Cecílio Filho, A.B.; Mauad, M. Soil Type and Zinc Doses in Agronomic Biofortification of Lettuce Genotypes. Agronomy 2020, 10, 124. [Google Scholar] [CrossRef]
  9. Almendros, P.; Gonzalez, D.; Fernandez, M.D.; Garcia-Gomez, C.; Obrador, A. Both Zn Biofortification and Nutrient Distribution Pattern in Cherry Tomato Plants Are Influenced by the Application of ZnO Nanofertilizer. Heliyon 2022, 8, e09130. [Google Scholar] [CrossRef]
  10. Ponce-García, O.C.; Noperi-Mosqueda, L.C.; Soto-Parra, J.M.; Yáñez-Muñoz, R.M.; Pérez-Leal, R.; Navarro-León, E.; Sánchez, E. Assaying the Efficiency of Sulfate, Chelate and Zinc Nanoparticle Fertilizers in Green Bean Grown in Alkaline Soil. J. Plant Nutr. 2023, 46, 653–664. [Google Scholar] [CrossRef]
  11. Ortiz, R.; Gascó, G.; Méndez, A.; Sanchez-Martín, L.; Obrador, A.; Almendros, P. Comparative Study of Traditional and Environmentally Friendly Zinc Sources Applied in Alkaline Fluvisol Soil: Lettuce Biofortification and Soil Zinc Status. Agronomy 2023, 13, 3014. [Google Scholar] [CrossRef]
  12. Ortiz, R.; Gascó, G.; Méndez, A.; Obrador, A.; González, D.; Almendros, P. Zinc Biofortification of Lettuce Using Environmentally Friendly Zinc Sources in an Acidic Soil. Sci. Hortic. 2024, 338, 113620. [Google Scholar] [CrossRef]
  13. Garza-Alonso, C.A.; Juárez-Maldonado, A.; González-Morales, S.; Cabrera-De la Fuente, M.; Cadenas-Pliego, G.; Morales-Díaz, A.B.; Trejo-Téllez, L.I.; Tortella, G.; Benavides-Mendoza, A. ZnO Nanoparticles as Potential Fertilizer and Biostimulant for Lettuce. Heliyon 2023, 9, e12787. [Google Scholar] [CrossRef]
  14. Alloway, B. Bioavailability of Elements in Soil. In Essentials of Medical Geology; Selinus, O., Ed.; Springer Netherlands: Dordrecht, The Netherlands, 2013; pp. 351–373. ISBN 9789400743755. [Google Scholar]
  15. Kabata-Pendias, A. Trace Elements in Soils and Plants, 4th ed.; CRC Press: Boca Raton, FL, USA, 2011; ISBN 9780429192036. [Google Scholar]
  16. De-Francisco, M.; Romeiro, A.; Durães, L.; Álvarez-Torrellas, S.; Ibañez, M.; Almendros, P. Environmental Behaviour of Synthesized and Commercial Agricultural Zinc Products: Leaching, Migration, and Availability in Soils. J. Soil Sci. Plant Nutr. 2024, 24, 5293–5308. [Google Scholar] [CrossRef]
  17. Sillanpää, M. Environmental Fate of EDTA and DTPA. Rev. Environ. Contam. Toxicol. 1997, 152, 85–111. [Google Scholar] [CrossRef] [PubMed]
  18. Wurzer, G.K.; Hettegger, H.; Bischof, R.H.; Fackler, K.; Potthast, A.; Rosenau, T. Agricultural Utilization of Lignosulfonates. Holzforschung 2022, 76, 155–168. [Google Scholar] [CrossRef]
  19. Rajput, V.D.; Minkina, T.; Fedorenko, A.; Chernikova, N.; Hassan, T.; Mandzhieva, S.; Sushkova, S.; Lysenko, V.; Soldatov, M.A.; Burachevskaya, M. Effects of Zinc Oxide Nanoparticles on Physiological and Anatomical Indices in Spring Barley Tissues. Nanomaterials 2021, 11, 1722. [Google Scholar] [CrossRef] [PubMed]
  20. Azarin, K.; Usatov, A.; Minkina, T.; Duplii, N.; Kasyanova, A.; Fedorenko, A.; Khachumov, V.; Mandzhieva, S.; Rajput, V.D. Effects of Bulk and Nano-ZnO Particles on Functioning of Photosynthetic Apparatus in Barley (Hordeum vulgare L.). Environ. Res. 2023, 216, 114748. [Google Scholar] [CrossRef]
  21. Wang, X.; Yang, X.; Chen, S.; Li, Q.; Wang, W.; Hou, C.; Gao, X.; Wang, L.; Wang, S. Zinc Oxide Nanoparticles Affect Biomass Accumulation and Photosynthesis in Arabidopsis. Front. Plant Sci. 2015, 6, 1243. [Google Scholar] [CrossRef]
  22. Pedruzzi, D.P.; Araujo, L.O.; Falco, W.F.; Machado, G.; Casagrande, G.A.; Colbeck, I.; Lawson, T.; Oliveira, S.L.; Caires, A.R.L. ZnO Nanoparticles Impact on the Photosynthetic Activity of Vicia Faba: Effect of Particle Size and Concentration. NanoImpact 2020, 19, 100246. [Google Scholar] [CrossRef]
  23. Mazaheri-Tirani, M.; Dayani, S. Growth, Flowering and Physiological Response of Trachyspermum ammi L. to Zinc Oxide Micro- and Nanoparticles. Russ. J. Plant Physiol. 2022, 69, 14. [Google Scholar] [CrossRef]
  24. Montoya, M.; Vallejo, A.; Recio, J.; Guardia, G.; Alvarez, J.M. Zinc–Nitrogen Interaction Effect on Wheat Biofortification and Nutrient Use Efficiency. J. Plant Nutr. Soil Sci. 2020, 183, 169–179. [Google Scholar] [CrossRef]
  25. Doolette, C.L.; Read, T.L.; Li, C.; Scheckel, K.G.; Donner, E.; Kopittke, P.M.; Schjoerring, J.K.; Lombi, E. Foliar Application of Zinc Sulphate and Zinc EDTA to Wheat Leaves: Differences in Mobility, Distribution, and Speciation. J. Exp. Bot. 2018, 69, 4469–4481. [Google Scholar] [CrossRef]
  26. Lucini, L.; Bernardo, L. Comparison of Proteome Response to Saline and Zinc Stress in Lettuce. Front. Plant Sci. 2015, 6, 240. [Google Scholar] [CrossRef]
  27. Rouphael, Y.; Colla, G.; Bernardo, L.; Kane, D.; Trevisan, M.; Lucini, L. Zinc Excess Triggered Polyamines Accumulation in Lettuce Root Metabolome, as Compared to Osmotic Stress under High Salinity. Front. Plant Sci. 2016, 7, 842. [Google Scholar] [CrossRef] [PubMed]
  28. Baker, N.R.; Harbinson, J.; Kramer, D.M. Determining the Limitations and Regulation of Photosynthetic Energy Transduction in Leaves. Plant. Cell Environ. 2007, 30, 1107–1125. [Google Scholar] [CrossRef] [PubMed]
  29. Witkowski, E.T.F.; Lamont, B.B. Leaf Specific Mass Confounds Leaf Density and Thickness. Oecologia 1991, 88, 486–493. [Google Scholar] [CrossRef] [PubMed]
  30. Falster, D.S.; Westoby, M. Leaf Size and Angle Vary Widely across Species: What Consequences for Light Interception? New Phytol. 2003, 158, 509–525. [Google Scholar] [CrossRef]
  31. Zeng, Z.-L.; Sun, H.; Wang, X.-Q.; Zhang, S.-B.; Huang, W. Regulation of Leaf Angle Protects Photosystem I under Fluctuating Light in Tobacco Young Leaves. Cells 2022, 11, 252. [Google Scholar] [CrossRef]
  32. Flexas, J.; Escalona, J.; Evain, S.; Gulas, J.; Moya, I.; Osmond, C.; Medrano, H. Steady-State Chlorophyll Fluorescence (Fs) as an Indicator of Leaf Photosynthesis and Stomatal Conductance under Drought Conditions. In Proceedings of the 12th International Congress on Photosynthesis; Brisbane Convention & Exhibition Centre: Queensland, Australia, 2001; Volume 3, pp. 231–240. Available online: https://www.publish.csiro.au (accessed on 10 September 2025).
  33. Ritchie, G. A Chlorophyll Fluorescence: What Is It and What Do the Numbers Mean? In National Proceedings: Forest and Conservation Nursery Associations; Riley, L., Dumroese, R., Landis, T., Eds.; U.S. Department of Agriculture, Forest Service, Rocky Mountain Research Station: Fort Collins, CO, USA, 2006; pp. 34–43. Available online: https://research.fs.usda.gov/treesearch/26654 (accessed on 10 September 2025).
  34. Makhtoum, S.; Sabouri, H.; Gholizadeh, A.; Ahangar, L.; Katouzi, M.; Mastinu, A. Genomics and Physiology of Chlorophyll Fluorescence Parameters in Hordeum vulgare L. under Drought and Salt Stresses. Plants 2023, 12, 3515. [Google Scholar] [CrossRef]
  35. MAPA Métodos Oficiales de Análisis. Tomo III; Ministerio de Agricultura, Pesca y Alimentación: Madrid, Spain, 1994.
  36. IUSS. Working Group WRB World Reference Base for Soil Resources. In International Soil Classification System for Naming Soils and Creating Legends for Soil Maps, 4th ed.; International Union of Soil Sciences (IUSS): Vienna, Austria, 2022; ISBN 9798986245119. [Google Scholar]
  37. Lindsay, W.L.; Norvell, W.A. Development of a DTPA Soil Test for Zinc, Iron, Manganese, and Copper. Soil Sci. Soc. Am. J. 1978, 42, 421–428. [Google Scholar] [CrossRef]
  38. García-Gómez, C.; García, S.; Obrador, A.; Almendros, P.; González, D.; Fernández, M.D. Effect of Ageing of Bare and Coated Nanoparticles of Zinc Oxide Applied to Soil on the Zn Behaviour and Toxicity to Fish Cells Due to Transfer from Soil to Water Bodies. Sci. Total Environ. 2020, 706, 135713. [Google Scholar] [CrossRef]
  39. Feng, M.H.; Shan, X.; Zhang, S.; Wen, B. A Comparison of the Rhizosphere-Based Method with DTPA, EDTA, CaCl2, and NaNO3 Extraction Methods for Prediction of Bioavailability of Metals in Soil to Barley. Environ. Pollut. 2005, 137, 231–240. [Google Scholar] [CrossRef]
  40. Almendros, P.; Obrador, A.; Alvarez, J.M.; Gonzalez, D. Zn-DTPA-HEDTA-EDTA Application: A Strategy to Improve the Yield and Plant Quality of a Barley Crop While Reducing the N Application Rate. J. Soil Sci. Plant Nutr. 2019, 19, 920–934. [Google Scholar] [CrossRef]
  41. Smith, R.M.; Martell, A.E.; Motekaitis, R.J. NIST Critically Selected Stability Constants of Metal Complexes Database. NIST Standard Reference Database 46; National Institute of Standard and Technology: Gaithersburg, MD, USA, 2004; Volume 2. [Google Scholar] [CrossRef]
  42. Huang, J.W.; Chen, J.; Berti, W.R.; Cunningham, S.D. Phytoremediadon of Lead-Contaminated Soils: Role of Synthetic Chelates in Lead Phytoextraction. Environ. Sci. Technol. 1997, 31, 800–805. [Google Scholar] [CrossRef]
  43. Tewari, G.; Pareek, N.; Pachauri, S.; Pandey, S. Impact of Chelation/Complexation Phenomenon on Soil Environment. Int. J. Agric. Sci. 2018, 9107, 7314–7316. Available online: https://bioinfopublication.org/pages/article.php?id=BIA0004599 (accessed on 10 September 2025).
  44. Kılıç, M.; Käpylä, V.; Gollan, P.J.; Aro, E.-M.; Rintamäki, E. PSI Photoinhibition and Changing CO2 Levels Initiate Retrograde Signals to Modify Nuclear Gene Expression. Antioxidants 2023, 12, 1902. [Google Scholar] [CrossRef] [PubMed]
  45. Miyake, C. Molecular Mechanism of Oxidation of P700 and Suppression of ROS Production in Photosystem I in Response to Electron-Sink Limitations in C3 Plants. Antioxidants 2020, 9, 230. [Google Scholar] [CrossRef] [PubMed]
  46. Zuo, G. Non-Photochemical Quenching (NPQ) in Photoprotection: Insights into NPQ Levels Required to Avoid Photoinactivation and Photoinhibition. New Phytol. 2025, 246, 1967–1974. [Google Scholar] [CrossRef]
  47. de Francisco, M.; Ortiz, R.; Obrador, A.; Gonzalez, D.; Gascó, G.; Almendros, P. The Effect of Complexed, Nanosized, and Conventional Zinc Sources Applied at Varying Rates to an Acidic Mediterranean Soil on Two Successive Lettuce Crops. Agronomy 2025, 15, 896. [Google Scholar] [CrossRef]
  48. Hall, J.L. Cellular Mechanisms for Heavy Metal Detoxification and Tolerance. J. Exp. Bot. 2002, 53, 1–11. [Google Scholar] [CrossRef]
  49. Ejaz, U.; Khan, S.M.; Khalid, N.; Ahmad, Z.; Jehangir, S.; Fatima Rizvi, Z.; Lho, L.H.; Han, H.; Raposo, A. Detoxifying the Heavy Metals: A Multipronged Study of Tolerance Strategies against Heavy Metals Toxicity in Plants. Front. Plant Sci. 2023, 14, 1154571. [Google Scholar] [CrossRef]
  50. Zhao, F.-J.; Tang, Z.; Song, J.-J.; Huang, X.-Y.; Wang, P. Toxic Metals and Metalloids: Uptake, Transport, Detoxification, Phytoremediation, and Crop Improvement for Safer Food. Mol. Plant 2022, 15, 27–44. [Google Scholar] [CrossRef]
  51. Saraswat, S.; Rai, J.P.N. Complexation and Detoxification of Zn and Cd in Metal Accumulating Plants. Rev. Environ. Sci. Bio/Technology 2011, 10, 327–339. [Google Scholar] [CrossRef]
Figure 1. Effect of different Zn sources (SULP, Zn sulfate heptahydrate; CHE, Zn chelated with DTPA-HEDTA-EDTA; NANO, commercial ZnO nanoparticles; and LIG, Zn lignosulfonate) and Zn application rates (0, 15, 30, 60, and 120 mg·kg−1) on fresh weight (a) and Zn concentration in young (b) and mature (c) leaves of lettuce (Lactuca sativa L.). Vertical bars represent standard deviations. Statistical differences at p < 0.05 (LSD test) are indicated by different letters. *** corresponds to significance at 0.01 level.
Horticulturae 11 01221 g001
Figure 2. Effect of different Zn sources (SULP, Zn sulfate heptahydrate; CHE, Zn chelated with DTPA-HEDTA-EDTA; NANO, commercial ZnO nanoparticles; and LIG, Zn lignosulfonate) and Zn application rates (0, 15, 30, 60, and 120 mg·kg−1) on morphological and structural traits: stem diameter (a), number of total leaves (b), LMA (c), leaf angle (d) and SPAD (e). Vertical bars represent standard deviations. Statistical differences at p < 0.05 (LSD test) are indicated by different letters. ** and * corresponds to significance at 0.1 and 5% levels.
Horticulturae 11 01221 g002
Figure 3. Effect of different Zn sources (SULP, Zn sulfate heptahydrate; CHE, Zn chelated with DTPA-HEDTA-EDTA; NANO, commercial ZnO nanoparticles; and LIG, Zn lignosulfonate) and Zn application rates (0, 15, 30, 60, and 120 mg·kg−1) on chlorophyll fluorescence and Photosystem II parameters: Fm′—Maximal fluorescence in the light-adapted state (a), Fo′—Minimal fluorescence in the light-adapted state (b), Fs—Steady-state fluorescence (c), Fv′/Fm′—Maximum efficiency of PSII in the light-adapted state (d), qL—Photochemical quenching coefficient (e), ΦPSII—Effective quantum yield of PSII (f), NPQt—Total non-photochemical quenching (g), ΦNPQ—Quantum yield of regulated non-photochemical energy dissipation (h), ΦNO—Quantum yield of non-regulated energy dissipation (i) and LEF—Linear electron flow (j). Vertical bars represent standard deviations. Statistical differences at p < 0.05 (LSD test) are indicated by different letters. ** and * corresponds to significance at 0.1 and 5% levels.
Horticulturae 11 01221 g003
Figure 4. Effect of different Zn sources (SULP, Zn sulfate heptahydrate; CHE, Zn chelated with DTPA-HEDTA-EDTA; NANO, commercial ZnO nanoparticles; and LIG, Zn lignosulfonate) and Zn application rates (0, 15, 30, 60, and 120 mg·kg−1) on Photosystem I parameters: kP700—kinetic constant of P700 (a), tP700—relaxation time of P700 (b), v_initial_P700—initial rate of P700 oxidation/reduction (c), PSI Active Centers (d), PSI Open Centers (e), and PSI Oxidized Centers (f). Vertical bars represent standard deviations. Statistical differences at p < 0.05 (LSD test) are indicated by different letters. * corresponds to significance at 5% level.
Horticulturae 11 01221 g004
Figure 5. Effect of different Zn sources (SULP, Zn sulfate heptahydrate; CHE, Zn chelated with DTPA-HEDTA-EDTA; NANO, commercial ZnO nanoparticles; and LIG, Zn lignosulfonate) and Zn application rates (0, 15, 30, 60, and 120 mg·kg−1) on proton gradient and electrochromic shift (ECS) parameters: (a) ECS_τ—relaxation time constant of the ECS, (b) ECSt—total amplitude of the ECS (mAU), (c) gH+—proton conductance through ATP synthase, and (d) vH+—proton flux rate. Vertical bars represent standard deviations. Statistical differences at p < 0.05 (LSD test) are indicated by different letters. * corresponds to significance at 5% level.
Horticulturae 11 01221 g005
Figure 6. Effect of different Zn sources (SULP, Zn sulfate heptahydrate; CHE, Zn chelated with DTPA-HEDTA-EDTA; NANO, commercial ZnO nanoparticles; and LIG, Zn lignosulfonate) and Zn application rates (0, 15, 30, 60, and 120 mg·kg−1) on environmental and light-related parameters: (a) leaf temperature, (b) leaf-to-air temperature differential, and (c) light intensity (photosynthetically active radiation, PAR). Vertical bars represent standard deviations. NS, no significant differences at p < 0.05 (LSD test).
Horticulturae 11 01221 g006
Figure 7. Health Risk Index (HRI) of zinc in lettuce leaves for different Zn sources (SULP, Zn sulfate heptahydrate; CHE, Zn chelated with DTPA-HEDTA-EDTA; NANO, commercial ZnO nanoparticles; and LIG, Zn lignosulfonate) and Zn application rates (0, 15, 30, 60, and 120 mg·kg−1) calculated for different population groups (children, adolescents, and adults). Values above 1 indicate potential health risks associated with regular consumption. Color scale represents HRI values, green = low risk (HRI < 1) and red = high risk (HRI > 1).
Horticulturae 11 01221 g007
Table 1. Effect of different Zn sources and Zn application rates on available Zn concentration in soil.
Source 1RateAvailable Zn Concentration in Soil 2
mg Zn·Kg−1 Soilmg Zn·Kg−1 Soil
control00.40 ± 0.01a
SULP150.29 ± 0.00a
300.53 ± 0.03a
600.86 ± 0.17ab
1205.15 ± 2.22c
CHE150.56 ± 0.09a
301.88 ± 0.77ab
602.96 ± 0.66b
12012.55 ± 1.32d
NANO150.47 ± 0.05a
300.55 ± 0.07a
600.73 ± 0.04a
1203.06 ± 0.84b
LIG150.40 ± 0.02a
300.58 ± 0.06a
601.18 ± 0.27ab
1202.30 ± 0.41ab
p-value 0.0000
Source effectCHE4.49 ± 1.47B
LIG1.11 ± 0.25A
NANO1.20 ± 0.37A
SULP1.79 ± 0.84A
p-value 0.0000
Zn rate effect150.43 ± 0.04A
300.88 ± 0.24B
601.48 ± 0.34C
1205.77 ± 1.36D
p-value 0.0000
1 SULP, Zn sulfate heptahydrate; CHE, Zn chelated with DTPA-HEDTA-EDTA; NANO, commercial ZnO nanoparticles; and LIG, Zn lignosulfonate. 2 Statistical differences at p < 0.05 (LSD test) are indicated by different letters. Lowercase letters indicate differences among treatments considering the combined factors (source × Zn rate). Uppercase letters indicate differences within each factor analyzed separately (source or Zn rate).
Table 2. Linear correlation coefficients (r) for relationships between zinc concentration in mature leaves and the different groups of parameters evaluated.
ParameterCorrelation with Zn Conc
Agronomic and crop quality
Yield−0.682 ***
Zn concentration (young leaves)0.694 ***
Available Zn conc. in soil0.847 ***
Morphological and structural leaf traits
Stem diameter−0.677 ***
Total leaves−0.667 ***
LMA0.393 *
Leaf angle0.576 ***
SPAD−0.712 ***
Chlorophyll fluorescence & PSII
Fm′−0.599 ***
Fo′−0.717 ***
Fs−0.610 ***
Fv′/Fm′−0.338 *
qLNS
ΦPSIINS
NPQt0.378 *
ΦNPQNS
ΦNO−0.334 *
LEF−0.283 *
Photosystem I (PSI) parameters
kP700NS
tP700−0.417 *
vinitial P700−0.386 *
PSI Active Centers−0.548 ***
PSI Open CentersNS
PSI Oxidized CentersNS
Proton gradient & ECS parameters
ECS_τ−0.366 *
ECSt−0.489 **
gH+0.280 *
vH+−0.490 **
Environmental & light-related parameters
Leaf temperatureNS
Leaf-to-air temperature differentialNS
PARNS
LMA = leaf mass per area; SPAD = chlorophyll content index; Fm′ = maximum fluorescence in light-adapted state; Fo′ = minimal fluorescence in light-adapted state; Fs = steady-state fluorescence; qL = fraction of open PSII centers; ΦPSII = effective quantum yield of PSII; NPQt = non-photochemical quenching; ΦNPQ = quantum yield of regulated energy dissipation; ΦNO = quantum yield of non-regulated energy dissipation; LEF = linear electron flow; kP700 = kinetic constant of P700; tP700 = relaxation time of P700; vinitial P700 = initial rate of P700 oxidation/reduction; ECS = electrochromic shift; gH+ = proton conductance; vH+ = proton flux; PAR = photosynthetically active radiation. ***, ** and *: significant at 0.01, 0.1 and 5% levels; NS: no significant; (n = 51).
Disclaimer/Publisher’s Note: The statements, opinions and data contained in all publications are solely those of the individual author(s) and contributor(s) and not of MDPI and/or the editor(s). MDPI and/or the editor(s) disclaim responsibility for any injury to people or property resulting from any ideas, methods, instructions or products referred to in the content.