Abstract
Momordica charantia (bitter cucumber) is a tropical and subtropical plant with a long history of use in traditional medicine. Salinity is a major problem that limits plant growth and biomass production. The aim of this work was to determine the salinity tolerance of bitter cucumber, through the spectral analyses of some metabolites involved in their response to abiotic stress factors. To carry out the experiment, two varieties of bitter cucumber and three experimental lines were subjected to saline stress by applying treatments with saline solutions in different concentrations (control—0 mM NaCl; V1—100 mM NaCl; and V2—200 mM NaCl). After applying the treatments, analyses were carried out on the amount of free proline (Pro), ascorbic acid, and aromatic amino acids. For proline and ascorbic acid, the tendency was for their concentration to decrease in the variants treated with saline solutions" with "the tendency was for their absorbance to decrease in the variants treated with saline solutions. The differences between the controls and the treated variants, as well as between the studied genotypes, highlight their capacity for resistance and adaptation to saline stress.
1. Introduction
Momordica charantia L. (2x = 2n = 22), popularly called bitter cucumber, balsamic pear, karela, and bitter gourd, is a climbing plant from the Cucurbitaceae family, used both in traditional medicine and in food [1,2,3]. The green bitter cucumber fruit has a diversity of vitamins and minerals: vitamin A, thiamin (B1), riboflavin (B2), niacin (B3), vitamin C, calcium, and iron [4,5]. Momordica charantia presents a high number of biologically active chemicals including saponins, triterpenes, flavonoids, proteins, steroidal acids, and alkaloids, thus presenting important medicinal properties, including anticancer, antiobesity, hypotensive, antioxidant, and antihyperlipidemic properties. In Africa, Asia, and Latin America, bitter cucumber has a rich history of use as a hypoglycemic agent; the plant extract has been called vegetable insulin [6,7,8,9].
Salinity is a problem encountered globally, affecting almost 20% of arable land [10]. Soil degradation resulting from high salt accumulation is predominantly found in arid and semi-arid regions where rainfall is insufficient to maintain a regular circulation of rainwater through the soil [11,12]. Salinity affects plant growth and development through water stress, cytotoxicity due to the excessive uptake of ions such as sodium (Na+) and chloride (Cl−), and nutritional imbalance. In addition, salinity is usually accompanied by oxidative stress due to the generation of reactive oxygen species (ROS) [13,14,15,16].
The occurrence of this abiotic stress triggers cell signaling pathways and cellular responses, such as the accumulation of compatible solutes and the upregulation of antioxidants [17]. Soil osmotic potential (Ψs) and total water potential (Ψw) are decreased when ions are dissolved in excess in soil water. Plants must keep their internal water potential lower than that of the soil to maintain their water absorption capacity and turgor under such conditions [18,19]. The osmotic adjustment of plants exposed to saline stress is mediated by the accumulation of absorbed ions, which at some point reach the toxic level of concentration, but also by osmolytes represented by organic acids, sugars, and synthesized amino acids. Osmolyte accumulation enhances water absorption from saline soils [20,21]. When the internal mechanisms of ion exclusion and compartmentalization are overcome, ion toxicity appears, manifested by the chlorosis and/or necrosis of the leaves [22].
One of the best known osmolytes that acts in the fight against saline stress is Proline (Pro). This amino acid acts as an enzyme protector, free radical scavenger, cellular redox balancer, cytosolic pH buffer, and stabilizer for subcellular structures [11,23]. The capture of radicals generated in the biological environment (R●) takes place in response to abiotic stress. The radical species is taken over by the secondary amine group, forming a molecular compound by eliminating a H● radical [24]. Proline metabolism involves the oxidation of NAD(P)H in the cytosol and the reduction of NAD+ in the mitochondria, having an important role as a redox regulator in eukaryotic cells. Proline can act as a pH buffer because it is a compound with mixed functions, one acidic and one basic [25,26]. Proline has a chelating effect, by complexing various metal ions [27,28]. These biochemical properties make proline an important metabolite for determining plant responses to salt stress. Under optimal conditions, reactive oxygen species (ROS) are constantly generated in the plant at low levels. Under these conditions, they cannot cause damage because they are absorbed by various antioxidant mechanisms [29,30]. The balance between ROS generation and ROS scavenging can be affected by abiotic stress factors including salinity [31]. Reactive oxygen species are presented as hydrogen peroxide (H2O2), perhydroxyl radicals (HO2•), hydroxyl radicals (OH−), ozone (O3), singlet oxygen (1O2), etc. [32,33]. The increased level of ROS is mitigated by proteins and other compounds such as glutathione (GSH) and ascorbate [34,35].
L-ascorbic acid (AsA), or vitamin C, is one of the most abundant water-soluble antioxidants in plants and animals. L-ascorbic acid is a non-enzymatic metabolite that plays a vital role in stress perception, redox homeostasis, regulation of oxidative stress, and physio-biochemical responses of plants both under optimal growth and development conditions and under stress conditions [36]. It is involved in many functions such as the antioxidant defense system, redox signaling, biosynthesis of phytohormones, modulation of gene expression, photoprotection, and regulation of photosynthesis and growth [37,38]. There is a consensus on the important role of the relationship between reactive oxygen species (ROS) and AsA in the regulation of cell signaling and metabolic processes. These characteristics make AsA a major plant antioxidant that detoxifies ROS and an important metabolite to be studied under salt stress conditions [39].
Aromatic amino acids are important components in the metabolic network of plants, supporting vital processes such as macromolecule synthesis, environmental adaptation, and stress responses [40,41]. Amino acids are the precursors of several hormones and various primary and secondary metabolites, which are essential for plant growth and combating abiotic stress. Phenylalanine (Phe), tyrosine (Tyr), and tryptophan (Trp) are aromatic amino acids (AAAs) characterized by the presence of an aromatic ring in their structures. In addition to their essential function in protein synthesis, AAAs serve as fundamental precursors for a diverse range of primary and secondary aromatic metabolites in plants. The synthesis of these metabolites occurs via the shikimate pathway, thus representing a significant contribution to the ability of plants to respond and adapt to biotic and abiotic stress [42]. The carbon skeletons required for the synthesis of aromatic amino acids are provided by the shikimate pathway, which is characterized by a significant flux. The estimates indicate that more than 30% of the total fixed carbon is directed through this pathway [43]. The role of these amino acids in the resistance of plants to abiotic stress conditions represents the premise of their study. The aim of this study was to emphasize the species Momordica charantia’s response to salt stress and to find some genotypes that were resistant to this abiotic stress by examining certain metabolites.
2. Materials and Methods
2.1. Materials
Ferric chloride (FeCl3)—Sigma Aldrich (Darmstadt, Germany); potassium chloride (KCl)—Sigma Aldrich; nitric acid (HNO3)—Sigma Aldrich; hydrochloric acid (HCl 37%)—Merck (Darmstadt, Germany); potassium hexacyanoferrate(III) (K3[Fe(CN)6])—Roth (Schoemperlenstr, Germany); L-ascorbic acid (C6H8O6)—Sigma Aldrich; ninhydrin (C9H6O4)—Merck; sulfosalicylic acid (C7H6O6S)—Chemical Company (Iași, Romania); glacial acetic acid (C2H4O2)—Merck; acid phosphoric (H3PO4)—Merck; toluene (C7H7)—Merck; L-proline (C5H9NO2)—Sigma Aldrich; ammonium hydroxide NH4OH—Chemical Company.
2.2. Methods of Characterization
UV-Vis spectra were recorded on a Specord 210 Plus AnalitikJena spectrophotometer, in cuvettes with a diameter of 1 cm; Fourier-transform infrared (FTIR) spectra in transmission mode (400–4000 cm−1 spectral range, 2 cm−1 resolution, with the accumulation of 32 scans, room temperature) were recorded on a Bruker Vertex 70 FT-IR spectrometer. Studying bonding in the mid-IR range (400–4000 cm–1) reveals numerous significant and practical bonds. The most basic and popular kind of FTIR experiment is the transmission-mode experiment. The amount of infrared beam transmitted through the sample is measured using a detector. The pure medium’s spectrum is first gathered and utilized as a guide in order to acquire the sample spectrum. The sample’s spectrum is then obtained by gathering its spectra in the medium and comparing it to the reference. Once the functional groups are identified, the chemical structure of the analyzed substance can be deduced.
2.3. Procedure for Obtaining Plant Material
Five genotypes of bitter cucumbers were used for the experiment, of which two were Romanian varieties (Brâncusi and Rodeo) and three were experimental lines (Line 1, Line 3, and Line 4). The seedlings were obtained from the greenhouse of the Research Institute for Agriculture and the Environment (ICAM) belonging to the “Ion Ionescu de la Brad” University of Life Sciences, Iași, Romania. A total of three treatments were applied, and their application began when the plants reached phenophase 201 of the BBCH scale, corresponding to the appearance of the first lateral shoot. The second treatment was applied in phenophase 501 of the BBCH scale, corresponding to the appearance of the first flower, and the third treatment was applied in phenophase 701 of the BBCH scale, corresponding to the appearance of the first fruit. The treatments involved different concentrations of saline solutions (M—control plants treated with 0 mM NaCl; V1—plants treated with 100 mM NaCl; and V2—plants treated with 200 mM NaCl). The analyses were carried out on the bitter cucumber fruits harvested 7 days after the application of the third saline treatment. The plants were treated with an amount of 300 mL of saline solution per treatment. The procedure for growing the plants was similar to that presented in our previous work on bitter cucumber [44].
2.4. Procedures for the Determination of Different Metabolites
2.4.1. Procedure for the Determination of Proline
In total, 1 g of plant tissue was triturated in 5 mL sulfosalicylic acid 3%; after trituration, the mixture was centrifuged at 5000 rpm for 20 min. Then, 2 mL of the supernatant was pipetted and added over 2 mL of acidic ninhydrin solution (prepared by dissolving 1.25 g of ninhydrin in 30 mL of glacial acetic acid (AcAc) and 20 mL of 6M phosphoric acid, at 60 °C) and 2 mL of glacial AcAc. The resulting mixture was subjected to thermal treatment at 100 °C for 1 h. After the heat treatment, the solution was left to cool to room temperature, after which it was placed in an ice bath. Afterwards, the mixture was extracted with 4 mL of toluene. A reaction time of 1h and temperature of 100 °C were required to ensure the decarboxylation and addition reaction of the tetrahydropyrrole ring.
2.4.2. Procedure for the Determination of Ascorbic Acid
The solution to be analyzed was prepared by mixing 1 mL of FeCl3 solution (2 × 10⁻³ M), 1 mL of K3[Fe(CN)6] solution (2 × 10⁻³ M), 1 mL of KCl solution (0.1 M), 1 mL HCl solution (0.01 M), and 1 mL sample. The solution was prepared by appropriately diluting a stock solution of AsA (1 g/L) with a solution of HNO3 (0.01 M). To analyze the AsA from the fruits of Momordica charantia, the following procedure was followed: After crushing 1 g of fruit, 15 mL of HNO3 (0.01M) was added, and the resulting mixture was heated at 90 °C for 15 min. The mixture was then cooled and centrifuged at 2000 rpm for 5 min. Then, 1 mL of the supernatant was diluted with 9 mL of HNO3 (0.01 M). From the final solution, 1 mL was used for the analysis. Three tests were performed for each analyzed sample.
2.4.3. Procedure for Identification of Aromatic Amino Acids in Proteins
A total of 0.77 g fruit was thermally treated at 60 °C with 10 mL of distilled water for 20 min. From the resulting extract, 2 mL was pipetted and subsequently treated with 0.5 mL HNO3 65% at 60 °C for 15 min. After approximately 3 min of treatment, the solutions of interest turn yellow. After another 15 min of heat treatment, the solutions were cooled to room temperature; later, 1 mL of 20% ammonia solution was added to neutralize the acid, so the color was slightly intensified. The solutions of interest were subjected to centrifugation at 2000 rpm for 10 min; 100 µL was pipetted from the supernatant and diluted with 3 mL of distilled water, and the absorbance of the solutions was read at 305 nm.
For the studied metabolites, three replications were made for each variant (M, V1, V2) of each genotype.
2.5. Statistical Analysis
The statistical tests performed in this paper were the Kolmogorov–Smirnov test, the two-way ANOVA test, the Student’s t-test, and the Pearson correlation coefficient.
The Kolmogorov–Smirnov test was performed to determine the normal distribution of the data used for the two-way ANOVA tests. This test was conducted online using the following link: https://www.socscistatistics.com/tests/kolmogorov/default.aspx (accessed on 20 December 2023) Two-way ANOVA tests were performed to analyze the simultaneous impact of two factors on the studied metabolites [45]. The two factors analyzed were the saline concentration and genotypes. H0: there are no significant differences between metabolite values in the control, 100 mM, and 200 mM treated variants. This assumes that there is no influence of the tested factors (saline concentration and genotype), nor of their interaction, on the metabolite values (proline, vitamin C, and aromatic amino acids).
Student’s t-tests were performed to make comparisons between variants (M, V1, and V2) and identify statistical differences between them. To perform the Student’s statistical t-tests, the data obtained from the five genotypes were separated into three columns that represented data from the control variant, the variant treated with 100 mM NaCl, and the variant treated with 200 mM NaCl. For each metabolite studied, the t-test was performed using all the data obtained from the analyses; thus, the results of all analyzed genotypes are summarized.
Two-way ANOVA and Student’s t-test were performed using the statistical functions in Excel software. The Pearson correlation coefficient was performed to measure the degree of linear correlation between the studied metabolites. It is a number between −1 and 1 that measures the strength and direction of the relationship between two variables [46]. It was performed using Excel and represented using OriginPro 2021, v:9.8.0.200 software.
3. Results
3.1. Proline (Pro)
To plot the calibration curve in the range 1–18 mg/L, the following procedure was followed: 2 mL of solution of different concentrations of L-proline, in sulfosalicylic acid, was added over 2 mL of ninhydrin solution and 2 mL of glacial acetic acid. The resulting mixture was subjected to heat treatment at 100 °C for 1 h. After the solution was cooled, it was extracted with 4 mL of toluene, and the absorbance of the solution was read at 520 nm, considering the red shade of the compound formed (Scheme 1), using toluene as a control.
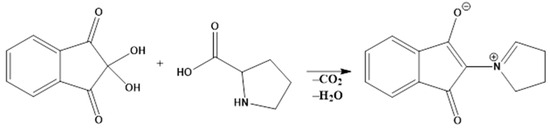
Scheme 1.
Reaction of Pro with ninhydrin.
A calibration curve in the range of 20–100 mg/L (Figure 1) was also made. To create this curve, the same procedure was followed as in the previous case, the difference being that 1 mL of the solution was pipetted from the extract in toluene, which was later diluted with 2 mL of toluene (Figure S1). The UV-Vis spectra used to plot the calibration curves are shown in Figures S2 and S3.
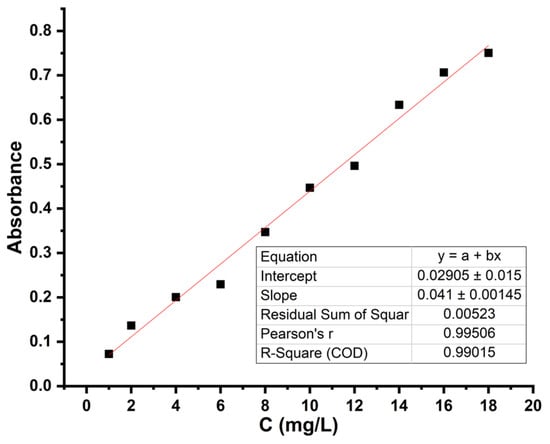
Figure 1.
Calibration curve for Pro in the range 1–18 mg/L; LOD = 0.0721; LOQ = 0.2163.
Figure 2 shows the amounts of Pro (mg/L) in the case of the two varieties of bitter cucumber (Rodeo and Brâncusi) and the three experimental lines (Line 1, Line 3, and Line 4). Comparisons were made between the control and the treated variants of each studied genotype, and also between genotypes.
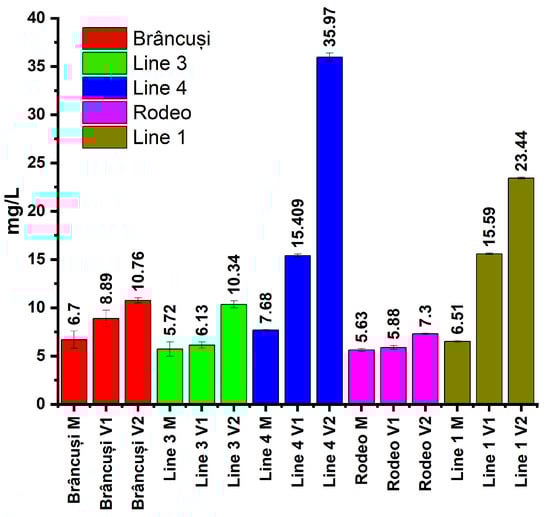
Figure 2.
The effect of NaCl stress on proline accumulation in bitter cucumber fruits. Plants were treated with 300 mL of 0 mM, 100 mM, or 200 mM NaCl solution at BBCH 201, 501, and 701 phenophases. Proline content was analyzed by the ninhydrin assay at 520 nm. Bars represent the mean of three analyses, and error bars indicate ± SD (n = 3).
Control plants recorded proline values between 5.63 mg/L in the Rodeo variety and 7.68 mg/L in Line 4. In the V1 treatment, proline values varied between 5.88 mg/L in the Rodeo variety and 15.59 in Line 1. The V2 treatment showed very high proline values compared to the untreated control. Values ranged from 7.3 for the Rodeo variety to 35.97 for Line 4.
After analysis, the toluene extract was dried, and the red solid formed was analyzed by the FTIR technique. Analyses ((408.89 vw, 472.54 vw, 516.90 m, 607.55 vw, 651.91 w, 671.20 w, 709.77 m, 725.20 m, 740.63 m, 765.71 m, 877.57 w, 918.08 w, 945.08 w, 987.51 w: 400–1000 δC-H + δC = C) (1016.44 m, 1041.52 m, 1074.31 m, 1122.52 m: 1010–1125 δC-C + δC-H) (1226.68 m, 1271.04 s, 1286.47 s: υC-N) (1332.76 m, 1379.05 s, 1427.26 m, 1463.91 m, 1562.28 s, 1585.42 s: 1330–1600 δCH), 1602.78 s(υC-N), 1618.21 s(υNin-ring), 1641.35 s(υN = CH), 1726.22 vs. (υC = O), 2860.32 m(υCH), 2871.89 m(υCH), 2929.75 s(υCH), 2956.75 s (υCH) υ-stretching, δ-bending, Figure S4) revealed the formation of the compound of interest.
With the help of the two-way ANOVA test, the interactions between the tested variables were analyzed [47]. To guarantee the normality of the data and to be able to apply the two-way ANOVA test, the Kolmogorov–Smirnov test was initially used, which resulted in the data having a normal distribution.
Two-way ANOVA with replications, applied to the values of the amount of Pro obtained, demonstrated that the null hypothesis was rejected both in the case of the two variables and the interaction between them. The alternative hypothesis was accepted, and the statistical differences were highly significant (p-value < 0.001) (Table 1).

Table 1.
Analysis of variance in bitter cucumber genotypes subjected to salt stress, regarding the Pro content of the fruit.
In the analysis of experimental data, the Student’s t-test is an essential tool to evaluate significant differences between means in two independent or correlated groups, providing a robust method for the statistical testing of research hypotheses in the context of observed variability [48].
Following the statistical analysis by means of the t-test (Table 2), distinctly significant statistical differences were revealed between the amounts of Pro recorded in the control (I) and those recorded in the variant treated with NaCl 100 mM (p two-tail < 0.01); highly significant statistical differences between the control (I) and the 200 mM NaCl-treated variant (p two-tail < 0.001) and significant statistical differences between the 100 mM NaCl-treated variant and the 200 mM NaCl-treated variant (p two-tail < 0.05) were observed. The results obtained led to the rejection of the null hypothesis, and it is stated that there are statistically significant differences between the amounts of Pro recorded in the three analyzed variants.
Table 2.
Statistical differences in bitter cucumber varieties and lines, between the control variant (I) and the variants treated with saline concentrations of 100 mM (II) and 200 mM (III), regarding the Pro content of the fruit.
3.2. Ascorbic Acid (AsA)
For the spectrophotometric determination of AsA, the formation reaction of Prussian blue was used. Prussian blue can be created in situ by the reduction reaction of Fe3+ to Fe2+ (Scheme 2), which takes place in the presence of AsA. FeCl3 was used as the source of Fe3+ ions, and potassium hexacyanoferrate(III) (K3[Fe(CN)6]) was used as the CN source. Prussian blue is a complex that has a relatively low solubility in water, but this can be improved if chloride or fluoride ions are present in the water. For this reason, it was decided to use KCl and HCl solutions as a reaction medium [49].
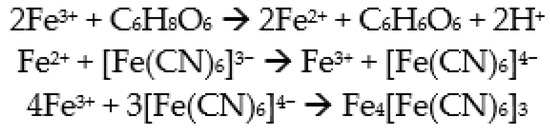
Scheme 2.
Formation of the Prussian blue complex.
Prussian blue (Fe4[Fe(CN)6]3) shows an absorption band at 700 nm, used for plotting the calibration curve in the concentration range 1–10 mg/L. The calibration curve was made by successive dilutions of the AsA solution. The purpose of the nitric acid dilution is to create an acidic environment to stabilize the ascorbic acid. The calibration curve is shown in Figure 3, and the spectra used to plot the curve are shown in Figure S5.
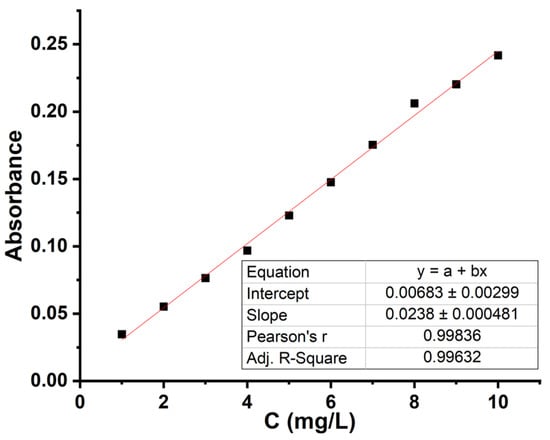
Figure 3.
Calibration curve for determining the concentration of vitamin C; LOD = 0.02165; LOQ = 0.0649.
Figure 4 presents the amounts of ascorbic acid (mg/100 g plant material) in the case of the two bitter cucumber varieties (Rodeo and Brâncusi) and the three experimental lines (Line 1, Line 3, and Line 4). Comparisons were made between the control and the treated variants of each studied genotype but also between genotypes.
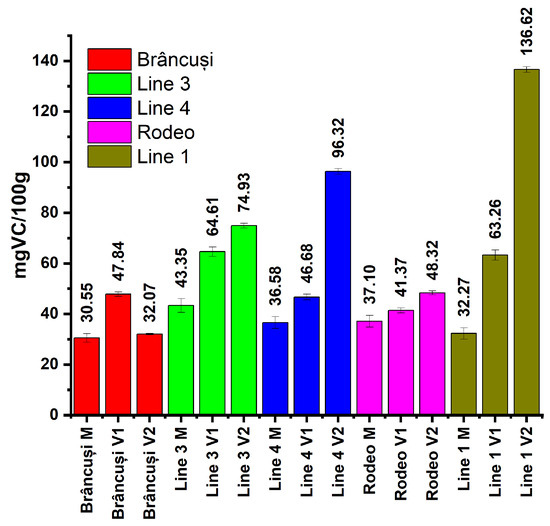
Figure 4.
The effect of NaCl stress on ascorbic acid accumulation in bitter cucumber fruits. Plants were treated with 300 mL of 0 mM, 100 mM, or 200 mM NaCl solution at BBCH 201, 501, and 701 phenophases. Ascorbic acid content was analyzed by the Prussian blue formation assay at 700 nm. Bars represent the mean of three analyses, and error bars indicate ± SD (n = 3).
After analyzing the amount of AsA in the control plants, the highest value was observed in the case of Line 3 (43.35 mg/100 g) and the lowest value in the case of the Brâncusi variety (30.55 mg/100 g). In the V1 treatment, vitamin C values fluctuated between 41.37 mg/100 g in the Rodeo variety and 64.61 mg/100 g in the case of Line 3. The biggest differences recorded between the controls and treatments were observed in the V2 treatment. The amounts of vitamin C ranged between 32.07 mg/100 g (Brâncusi variety) and 136.2 mg/100 g (Line 1) (Figure 4).
In the case of the Brâncuși variety, the values of the amount of vitamin C decreased when the V2 treatment was applied, and the appearance of this variant is highlighted in Figure 5.
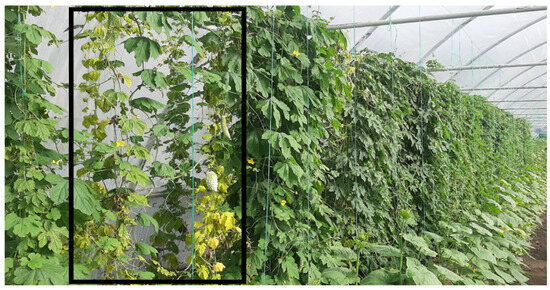
Figure 5.
Bitter cucumber—Brâncusi variety; the appearance of the variant treated with 200 mM NaCl in the phenophase 701 BBCH.
Following the performance of the two-way ANOVA test with replications (Table 3), vitamin C levels showed highly significant statistical differences (p < 0.001) in the case of the two variables taken into account (genotype and treatment concentration); the rejection of the null hypothesis and acceptance of the alternative hypothesis in the case of their interaction results from this.
Table 3.
Analysis of variance in bitter cucumber genotypes subjected to salt stress, regarding the content of ascorbic acid in the fruit.
The statistical analysis by means of the t-test (Table 4) revealed very significant differences both between the amount of vitamin C recorded in the control (I) and the amount recorded in the variant treated with NaCl 100 mM (II) as well as between the amount of vitamin C in the control (I) and that recorded in the variant treated with 200 mM (III) NaCl (p two-tail < 0.001). Statistically significant differences were recorded between 100 mM NaCl-treated variants and 200 mM NaCl-treated variants (p two-tail < 0.05). Following these results, the null hypothesis was rejected, which implies that there are statistically significant differences between the amounts of vitamin C recorded in the three analyzed groups.
Table 4.
Statistical differences in the varieties and lines of bitter cucumber, between the control variant (I) and the variants treated with saline concentrations of 100 mM (II) and 200 mM (III), regarding the vitamin C content of the fruit.
3.3. Aromatic Amino Acids (AAAs)
For the identification of water-soluble proteins, it was decided to use the Biuret method, but during the experiments, a strong interference of the matrix with the analysis reagent was observed, obtaining yellow or red precipitates. Thus, it was decided to investigate aromatic amino acids through the xanthoproteic reaction (Scheme 3).
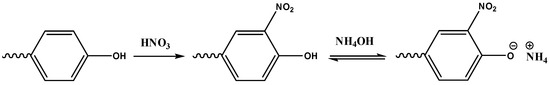
Scheme 3.
Xanthoproteic reaction.
The absorption band with the maximum at 305 nm is characteristic of compounds with conjugated bonds (aromatic amino acids). The yellow-colored solution was dried, and the formed solid was analyzed by FTIR. Analysis ((715.56 m, 827.43 s: δC-C) (1045.38 w, 1099.38 vw, 1384.83 vs. 1400.26 vs.: υNO2 + υNH) (1726.22 w, 1762.86 w, 1789.87 m υC = O) (2339.56 vw, 2362.70 w, 2395.49 w, 2428.28 m, 2476.50 w: CO2 + υSH) (2765.81 w, 2798.60 m, 2848.74 w: υCH) (3031.97 m, 3132.27 s υOH + υNH) Figure S6) υ-stretching, δ-bending (Figure S7)) revealed the presence of bands characteristic of aromatic and aliphatic C-H vibrations, C = O bands of carboxylic acids, and NO vibration of nitroderivatives. The solutions were centrifuged to separate the finely formed precipitate. The precipitate was dried and analyzed by FTIR analysis ((462.90 s, 833.21 m: peptide) (1082.02 vs. 1361.69 vs. 1384.83 vs. 1400.26 vs: υNO2 + υNH) 1633.64 vw, 1645.21 vw, (1766.72 vw, 1789.87 w: C = O) 2430.21 w CO2 υSH, 2802.45 w CH (3035.83 m, 3143.84 s: υOH) (Figure S7)), highlighting the formation of nitroderivatives.
Figure 6 shows the absorbances of the solutions recorded according to the described procedure. UV-Vis spectra for aromatic amino acids are presented in Figure S8.
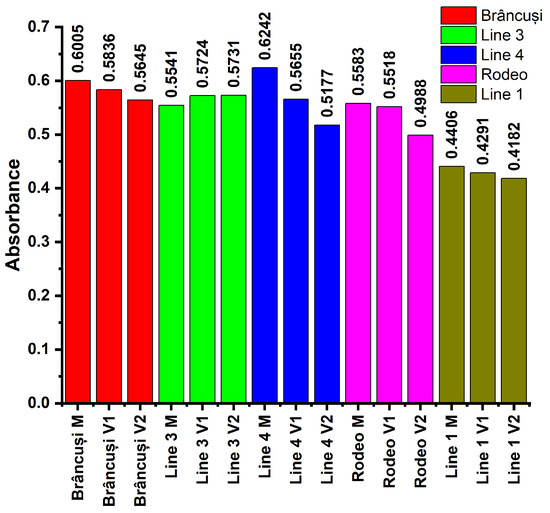
Figure 6.
The effect of NaCl stress on ascorbic acid accumulation in bitter cucumber fruits. Plants were treated with 300 mL of 0 Mm, 100 Mm, or 200 Mm NaCl solution at BBCH 201, 501, and 701 phenophases. Aromatic amino acids were analyzed by the xanthoproteic reaction assay at 305 nm. Bars indicate the absorbance for every genotype studied.
Aromatic amino acids showed the lowest absorbances in the case of Line 1 where the values fluctuated between 0.4182 in plants treated with V2 and 0.4406 in control plants. Line 3 showed higher AAA absorbance values in treated plants. They ranged from 0.5541 in the control to 0.5731 in V2-treated plants.
After carrying out the two-way ANOVA test with replications (Table 5), very significant statistical differences in the content of aromatic amino acids were found (p < 0.001) both in the case of the two variables taken into account (genotype and treatment concentration) and in the case of the interaction between the two variables. These results reject the null hypothesis, and the alternative hypothesis is accepted.
Table 5.
Analysis of the variance of aromatic amino acid absorbance in bitter cucumber genotypes subjected to salt stress.
Following the analysis of the t-test (Table 6), it was observed that there are no statistically significant differences between the control (I) and the treated variants (II and III) nor between the two variants treated with saline solutions.
Table 6.
Statistical differences in bitter cucumber varieties and lines, between the control variant (I) and the variants treated with saline concentrations of 100 mM (II) and 200 mM (III), regarding the aromatic amino acids in the fruit.
In Figure 7, the Pearson correlation coefficient was calculated for the analyses previously presented in this paper. In order to perform the Pearson correlation, specific notations were made; thus, B, R, L1, L3, and L4 represent the five studied genotypes: Brâncusi variety, Rodeo variety, Line 1, Line 3, and Line 4. To these, the following notations were added: M, V1, and V2 originating from the control, the variant treated with 100 mM NaCl, and the variant treated with 200 mM NaCl. The AsA, Pro, and AAA ratings come from ascorbic acid (vitamin C), Pro, and aromatic amino acids.
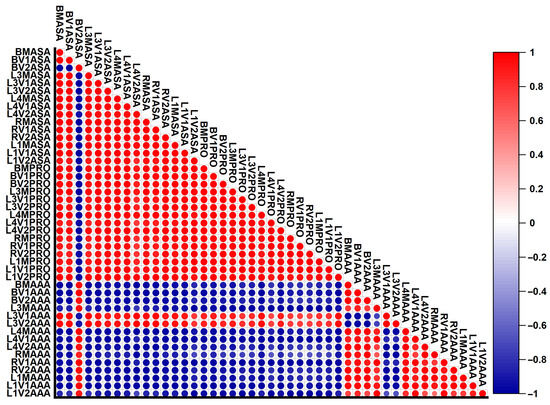
Figure 7.
Pearson correlation results for the determinations made (Pro—proline; AsA—ascorbic acid; and AAAs—aromatic amino acids). The red color represents a positive linear correlation; the blue color represents a negative linear correlation. The white color indicates no linear correlation. The intensity of the color and the size of the dots indicate the strength of the correlation.
4. Discussion
4.1. Proline
The appearance of Pro is a consequence of changes in cell metabolism induced by salinity [50]. Plants produce a large amount of Pro in response to abiotic stress [27].
Data analysis (Figure 2) indicated that there is variability in the amounts of Pro recorded in the five genotypes within the V1 and V2 saline treatments. An increase in the amount of proline was evident in the plants treated with saline solutions. In the case of the controls, the differences between the amounts of Pro were low among the five genotypes. The highest amount of Pro in the control was recorded in the case of Line 4, which denotes the genetic predisposition of this genotype to produce high amounts of Pro. The application of treatments with different concentrations of NaCl determined the proportional increase in the amount of Pro in green bitter cucumber fruits. In the case of plants treated with 100 mM NaCl, the amount of Pro increased by 100.6% compared to the control, and in plants treated with 200 mM NaCl, the amount of Pro increased by 368.35%. This pronounced increase in Pro highlights its role in salt stress, being an important cellular marker under abiotic stress conditions [51]. Significant increases in the amount of Pro were recorded in the case of Line 1 and Line 4. Line 4 presented the highest amount of Pro among the five genotypes of Momordica charantia studied. Treatment with 100 mM NaCl caused a 2.1-fold increase compared to the untreated control, and treatment with 200 mM NaCl increased the amount of Pro in the green fruit by 4.68 times. This increase in Pro may demonstrate the struggle of this genotype to adapt to the new environmental conditions. Jing Li et al. (2022) reported significantly lower Pro content in Momordica charantia fruits than in other species [52]. The relatively low content of Pro in the case of the variants treated in the Rodeo variety but also in the case of Line 3 may indicate their gradual adaptation to the salt stress conditions to which they were subjected, thus confirming the studies carried out by Jing Li et al. (2022). In contrast to these, regarding Lines 1 and 4, the high values of the Pro content in the case of the treated variants highlight the effort of these genotypes to adapt to abiotic stress conditions; thus, a lower resistance to saline stress could be concluded.
4.2. Ascorbic Acid
The amounts of vitamin C recorded following the analysis of the green fruits of bitter cucumber showed differences both between the control and the treated variants of each genotype and between genotypes (Figure 4). The differences between the amounts of AsA in untreated plants highlight the ability of some genotypes to naturally synthesize higher amounts of vitamin C, something highlighted by Meghashree et al. (2023) [53]. Following the application of saline treatments, a tendency for the amounts of vitamin C to increase in proportion to the increase in the concentration of the saline solution applied was observed (Figure 4), with the exception of the Brâncusi variety where, in the case of the variant treated with 200 mM saline solution, the concentration of vitamin C was higher than in the control but lower than in the variant treated with 100 mM saline. This indicates that the studied bitter cucumber genotypes fit into the biphasic salinity reaction model proposed by Munns (1993), manifested by osmotic stress (phase I) and ionic toxicity (phase II). The duration of the transition from the phase of osmotic stress to that of ion toxicity depends on the intensity of the salt stress but especially on the cultivated genotype [54]. In the case of the present study, in the Brâncusi variety treated with 200 mM, a lower resistance to excess salt can be highlighted due to the fact that at the time of collecting the samples for analysis, the plants were already in the IInd phase, namely that of the manifestation of ionic toxicity. The effect of toxic stress on the Brâncusi cultivar treated with 200 mM NaCl was correlated with the tendency of plants to yellow and dry, a phenomenon highlighted in Figure 5.
The lowest amounts of vitamin C were recorded in the Rodeo and Brâncuși varieties. Compared to the control plant group, the treated variants showed the smallest differences. Significant differences between the control and saline-treated samples were highlighted for Line 1 and Line 4, similar to the observations for Pro content.
For Line 1, vitamin C increased by 323.36%, reaching a value of 136.60 mg/100 g in plants treated with 200 mM NaCl. These results can be interpreted as a manifestation of the efforts of these genotypes to counteract the adverse effects of saline conditions through the synthesis and mobilization of this metabolite. The low differences in the amount of vitamin C in the variety Rodeo and Line 3 may highlight a gradual adaptation of these genotypes to salt stress conditions. Our previous investigations on the content of ascorbic acid in bitter cucumber leaves revealed the most notable differences within Line 3 in the treated variants compared to the control one. Contrary to this aspect, slight differences were found in Line 4. These findings underline a phenomenon of preferential accumulation of metabolites in various organs of the bitter cucumber plant and simultaneously the different level of tolerance of the genotypes to salt stress.
4.3. Aromatic Amino Acids
By examining the results obtained (Figure 6), a decreasing trend of the absorbances of aromatic amino acids was recorded, directly correlated with the increase in the concentration of saline solution to which the plants were subjected. This effect was noted in all varieties and lines studied except for Line 3 where the control presented lower absorbances compared to the variant treated with 100 mM saline solution and the one treated with 200 mM. According to the study carried out by Kumar et al. (2021) in the case of Cicer arietinum L. genotypes studied, among the aromatic amino acids, the only one that increased was tryptophan in the case of the salinity-resistant genotype, with tyrosine decreasing in both the resistant and the sensitive genotypes [55]. This aspect may explain the small differences between the control and treated variants in Line 3. Increased concentrations of aromatic amino acids (AAAs) and their related secondary metabolites have been positively correlated with significant plant tolerance to biotic and abiotic stress [56]. This finding may indicate a notable tolerance to salt stress in the case of Line 3. The most pronounced contrast between the plants of the control group and the bitter cucumber plants treated with saline solutions was observed in the situation of Line 4, where the control presented an absorbance value of 0.6242; variant V1 showed an absorbance of 0.5655, and variant V2 showed an absorbance of 0.5177. In the context of the previous results obtained in this research, it can be noticed that Line 4 shows a reduced adaptation to salt stress conditions.
The Pearson correlation coefficient is a statistical measure that quantifies the linear relationship between two variables. This coefficient, also called r, varies between −1 and 1, indicating the direction and strength of the correlation between the two variables. The Pearson correlation coefficient is widely used in science to measure the degree of linear dependence between two variables [57].
Following the analysis of the results obtained after performing the Pearson correlation coefficient, positive linear correlations were observed in the case of vitamin C and proline. This confirms the observations made on the basis of Figure 2 and Figure 4. Although these metabolites can preferentially accumulate in the plant according to its needs, under salt stress, the bitter cucumber showed a pronounced linear increase in proline and vitamin C. According to the studies conducted by Amara Hassan et al. (2021) on barley, a directly proportional increase in vitamin C and proline with soil saline was observed [58]. Although most of the values were positively correlated, in the case of the vitamin C value of the Brâncusi variety, the variant treated with 200 mM (BV2AsA), a negative correlation was observed with the proline levels obtained with the same variant (BV2Pro). This negative correlation is due to the sudden decrease in the amount of vitamin C in this variant, thus presenting a poor resistance of this variety to the treatment with 200 mM saline solution and also the occurrence of the toxic stress phase. After comparing the values of proline and aromatic amino acids, a very strong negative correlation was revealed. This correlation is due to the different behavior of these metabolites under salt stress conditions. An exception to the negative correlation is Line 3, where the values of aromatic amino acids have a slight tendency to increase in the variants treated with saline solutions (L3V1AAA and L3V2AAA), a fact that explains the appearance of an average positive correlation. In the case of the analysis of the data resulting from the comparison of the values of vitamin C and aromatic amino acids, a pronounced negative correlation was registered. The comparisons between BV2AAA and BV2AsA deviate from this due to the decrease in vitamin C in the Brâncusi variety in the variant treated with 200 mM NaCl, and the comparisons in the case of L3 deviate from this due to the increase recorded in the variants treated with saline solutions in the case of aromatic amino acids (L3V1AAA and L3V2AAA).
The results indicate that the five genotypes of Momordica charantia tested showed different responses to salt stress, showing a differential accumulation of specific metabolites for protection against abiotic stress. This different accumulation of metabolites suggests a varied adaptation to stress conditions, reflected in the preference of genotypes for the synthesis of certain metabolites according to their degree of resistance to abiotic stress conditions. The weak correlations between the values of the three determined metabolites and the occurrence of negative correlations highlight the fact that the genotypes fight abiotic stress differently, a conclusion reinforced by the research carried out by Slama et al. (2015) [59].
5. Conclusions
After the Pro content was determined, a series of geotype differences were identified in the biosynthesis capacity of this amino acid both in the control variants, which were not treated with sodium chloride, and in those that were subjected to stress saline.
Line 4 showed the highest Pro differences between the control and treated variants, which underlines its struggle for resistance to osmotic stress. In contrast, the variety Rodeo and Line 3 registered the smallest differences between the control and the group of plants treated with saline solutions. This can be attributed to their adaptation to salt stress conditions.
After the AsA content of bitter cucumber fruits was analyzed, a significant difference was observed between the control and saline-treated varieties in Lines 1 and 4, indicating the responsiveness of plants to salt stress.
Although the studied genotypes showed a tendency to increase the amount of vitamin C in proportion to the concentration of the applied treatments, the Brâncusi variety showed lower values in the case of the V2 variant, which shows the inclusion of the plants in the biphasic model proposed by Munns, being the only variant that passed from the osmotic stress phase to the toxic stress phase, from this point of view being the least resistant genotype to saline stress.
Lines 1 and 4 that were exposed to salt stress synthesize large amounts of vitamin C compared to the control, being indicated to be cultivated in soils with moderate salinity. This will lead to an increase in the amount of vitamin C in the fruit, since the salinity helps to improve the antioxidant properties of the fruit.
Apart from Line 3, which showed a slight increase, the analysis of absorbances of aromatic amino acids showed a general trend of decreasing values, inversely proportional to the increase in applied NaCl concentrations.
The results of the analyses showed that each of the five genotypes examined are affected by salt stress in a distinct way. Consequently, these genotypes react differently to stress. The accumulation of preferred metabolites depending on the genotype and the degree of adaptation to salt stress can be indicated by weak correlations between the accumulation of the studied metabolites and negative correlations between them, according to the Pearson correlation coefficient analysis.
The Brâncusi variety, which showed symptoms associated with excess ions, was the weakest genotype in terms of resistance to abiotic stress.
Compared to the control variant, Line 3 plants that were exposed to salt stress showed the least variation in the biosynthesis of the studied metabolites, indicating a good resistance to salt stress.
Supplementary Materials
The following supporting information can be downloaded at https://www.mdpi.com/article/10.3390/horticulturae10040309/s1, Figure S1: Calibration curve for proline in the range 20–100 mg/L; LOD = 0.5045; LOQ = 1.5136; Figure S2: Spectra used to plot the calibration curve for proline in the 1–18 mg/L range; Figure S3: Spectra used to plot the calibration curve for proline in the 20–100 mg/L range; Figure S4: FTIR spectrum for the residue formed after drying the extract in toluene; Figure S5: Spectra used to plot the calibration curve for ascorbic acid in the 1–10 mg/L range; Figure S6: Solvent evaporation residue from samples treated with nitric acid and ammonia; Figure S7: FTIR spectrum of the precipitate formed during the xanthoprotein reaction; Figure S8: UV-Vis spectra for aromatic amino acids.
Author Contributions
Ș.O.: Conceptualization, Investigation, Visualization, Formal Analysis, and Writing—Original Draft; C.S.: Conceptualization and Validation; A.E.M.: Data Curation, Writing—Original Draft, and Writing—Review and Editing; M.C.: Investigation; I.M.: Investigation; C.D.J.: Conceptualization, Resources, Writing—Original Draft, Writing—Review and Editing, and Supervision. All authors have read and agreed to the published version of the manuscript.
Funding
This research received no external funding.
Data Availability Statement
Data are contained within the article and Supplementary Materials.
Conflicts of Interest
The authors declare no conflicts of interest.
References
- Alisofi, S.; Einali, A.; Sangtarash, M.H. Jasmonic acid-induced metabolic responses in bitter melon (Momordica charantia) seedlings under salt stress. J. Hortic. Sci. Biotechnol. 2020, 95, 247–259. [Google Scholar] [CrossRef]
- Wang, S.; Li, Z.; Yang, G.; Ho, C.T.; Li, S. Momordica charantia: A popular health-promoting vegetable with multifunctionality. Food Funct. 2017, 8, 1749–1762. [Google Scholar] [CrossRef]
- Grover, J.; Yadav, S. Pharmacological actions and potential uses of Momordica charantia: A review. J. Ethnopharmacol. 2004, 93, 123–132. [Google Scholar] [CrossRef]
- Christine, M. Bitter Gourd: Health Benefits, Nutrition, and Uses. Available online: https://www.webmd.com/diet/health-benefits-bitter-gourd (accessed on 29 January 2024).
- Bortolotti, M.; Mercatelli, D.; Polito, L. Momordica charantia, a nutraceutical approach for inflammatory related diseases. Front. Pharmacol. 2019, 10, 486. [Google Scholar] [CrossRef]
- Basch, E.; Gabardi, S.; Ulbricht, C. Bitter melon (Momordica charantia): A review of efficacy and safety. Am. J. Health Pharm. 2003, 60, 356–359. [Google Scholar] [CrossRef] [PubMed]
- Chanda, R.; Samadder, A.; Banerjee, J. Anti-diabetic Activity of Momordica Charantia or Bitter Melon: A Review. Acta Sci. Pharm. Sci. 2019, 3, 24–30. [Google Scholar]
- Patel, A.; Patel, M.; Mori, C.V.; Kumar, M.; Patel, S. Effect of integrated nutrient management on growth and quality of bitter gourd (Momordica charantia L.). Int. J. Chem. Stud. 2020, 8, 2575–2578. [Google Scholar] [CrossRef]
- Li, Z.; Xia, A.; Li, S.; Yang, G.; Jin, W.; Zhang, M.; Wang, S. The Pharmacological Properties and Therapeutic Use of Bitter Melon (Momordica charantia L.). Curr. Pharmacol. Rep. 2020, 6, 103–109. [Google Scholar] [CrossRef]
- Negrão, S.; Schmöckel, S.M.; Tester, M. Evaluating physiological responses of plants to salinity stress. Ann. Bot. 2017, 119, 1–11. [Google Scholar] [CrossRef] [PubMed]
- Iqbal, N.; Umar, S.; Khan, N.A.; Khan, M.I.R. A new perspective of phytohormones in salinity tolerance: Regulation of proline metabolism. Environ. Exp. Bot. 2014, 100, 34–42. [Google Scholar] [CrossRef]
- Qadir, M.; Quillérou, E.; Nangia, V.; Murtaza, G.; Singh, M.; Thomas, R.; Drechsel, P.; Noble, A. Economics of salt-induced land degradation and restoration. Nat. Resour. Forum 2014, 38, 282–295. [Google Scholar] [CrossRef]
- Mohsen, A.A.; Kamal, M.; Ebrahim, H.; Fathy, W.; Ghoraba, S. Effect of salinity stress on Vicia faba productivity with respect to ascorbic acid treatment Awatif. Iran. J. Plant Physiol. 1980, 14, 725–736. [Google Scholar]
- Gamalero, E.; Bona, E.; Todeschini, V.; Lingua, G. Saline and arid soils: Impact on bacteria, plants, and their interaction. Biology 2020, 9, 116. [Google Scholar] [CrossRef] [PubMed]
- Isayenkov, S.V.; Maathuis, F.J.M. Plant salinity stress: Many unanswered questions remain. Front. Plant Sci. 2019, 10, 80. [Google Scholar] [CrossRef] [PubMed]
- Hernández, J.A.; Ferrer, M.A.; Jiménez, A.; Barceló, A.R.; Sevilla, F. Antioxidant systems and O2·−/H2O2 production in the apoplast of pea leaves. Its relation with salt-induced necrotic lesions in minor veins. Plant Physiol. 2001, 127, 817–831. [Google Scholar] [CrossRef] [PubMed]
- Zhu, J.K. Plant salt tolerance. Trends Plant Sci. 2001, 6, 66–71. [Google Scholar] [CrossRef] [PubMed]
- Wang, N.; Zhao, Z.; Zhang, X.; Liu, S.; Zhang, K.; Hu, M. Plant growth, salt removal capacity, and forage nutritive value of the annual euhalophyte Suaeda salsa irrigated with saline water. Front. Plant Sci. 2023, 13, 1040520. [Google Scholar] [CrossRef] [PubMed]
- Atta, K.; Mondal, S.; Gorai, S.; Singh, A.P.; Kumari, A.; Ghosh, T.; Roy, A.; Hembram, S.; Gaikwad, D.J.; Mondal, S.; et al. Impacts of salinity stress on crop plants: Improving salt tolerance through genetic and molecular dissection. Front. Plant Sci. 2023, 14, 1241736. [Google Scholar] [CrossRef] [PubMed]
- Munns, R.; Passioura, J.B.; Colmer, T.D.; Byrt, C.S. Osmotic adjustment and energy limitations to plant growth in saline soil. New Phytol. 2020, 225, 1091–1096. [Google Scholar] [CrossRef]
- Huang, Z.; Zhao, L.; Chen, D.; Liang, M.; Liu, Z.; Shao, H.; Long, X. Salt Stress Encourages Proline Accumulation by Regulating Proline Biosynthesis and Degradation in Jerusalem Artichoke Plantlets. PLoS ONE 2013, 8, e62085. [Google Scholar] [CrossRef]
- McParland, E.L.; Alexander, H.; Johnson, W.M. The Osmolyte Ties That Bind: Genomic Insights into Synthesis and Breakdown of Organic Osmolytes in Marine Microbes. Front. Mar. Sci. 2021, 8, 689306. [Google Scholar] [CrossRef]
- Kavi Kishor, P.B.; Suravajhala, P.; Rathnagiri, P.; Sreenivasulu, N. Intriguing Role of Proline in Redox Potential Conferring High Temperature Stress Tolerance. Front. Plant Sci. 2022, 13, 867531. [Google Scholar] [CrossRef]
- Kaul, S.; Sharma, S.S.; Mehta, I.K. Free radical scavenging potential of L-proline: Evidence from in vitro assays. Amino Acids 2008, 34, 315–320. [Google Scholar] [CrossRef]
- Edwards, L.J.; Williams, D.A.; Gardner, D.K. Intracellular pH of the mouse preimplantation embryo: Amino acids act as buffers of intracellular pH. Hum. Reprod. 1998, 13, 3441–3448. [Google Scholar] [CrossRef]
- Wu, G. Advances in Experimental Medicine and Biology 1332 Amino Acids in Nutrition and Health Amino Acids in Gene Expression, Metabolic Regulation, and Exercising Performance, 1st ed.; Springer: Berlin/Heidelberg, Germany, 2021. [Google Scholar]
- Hayat, S.; Hayat, Q.; Alyemeni, M.N.; Wani, A.S.; Pichtel, J.; Ahmad, A. Role of proline under changing environments: A review. Plant Signal. Behav. 2012, 7, 37–41. [Google Scholar] [CrossRef] [PubMed]
- Meena, M.; Divyanshu, K.; Kumar, S.; Swapnil, P.; Zehra, A.; Shukla, V.; Yadav, M.; Upadhyay, R.S. Regulation of L-proline biosynthesis, signal transduction, transport, accumulation and its vital role in plants during variable environmental conditions. Heliyon 2019, 5, e02952. [Google Scholar] [CrossRef]
- Foyer, C.H.; Noctor, G. Ascorbate and glutathione: The heart of the redox hub. Plant Physiol. 2011, 155, 2–18. [Google Scholar] [CrossRef] [PubMed]
- Shapiguzov, A.; Vainonen, J.P.; Wrzaczek, M.; Kangasjärvi, J. ROS-talk—How the apoplast, the chloroplast, and the nucleus get the message through. Front. Plant Sci. 2012, 3, 292. [Google Scholar] [CrossRef]
- Kaushik, D.; Aryadeep, R. Reactive oxygen species (ROS) and response of antioxidants as ROS-scavengers during environmental stress in plants. Front. Environ. Sci. 2014, 2, 53. [Google Scholar] [CrossRef]
- Misra, N.; Gupta, A.K. Effect of salt stress on proline metabolism in two high yielding genotypes of green gram. Plant Sci. 2005, 169, 331–339. [Google Scholar] [CrossRef]
- Hameed, A.; Ahmed, M.Z.; Hussain, T.; Aziz, I.; Ahmad, N.; Gul, B.; Nielsen, B.L. Effects of salinity stress on chloroplast structure and function. Cells 2021, 10, 2023. [Google Scholar] [CrossRef] [PubMed]
- Upadhyaya, C.P.; Venkatesh, J.; Gururani, M.A.; Asnin, L.; Sharma, K.; Ajappala, H.; Park, S.W. Transgenic potato overproducing l-ascorbic acid resisted an increase in methylglyoxal under salinity stress via maintaining higher reduced glutathione level and glyoxalase enzyme activity. Biotechnol. Lett. 2011, 33, 2297–2307. [Google Scholar] [CrossRef] [PubMed]
- Muhammad, I.; Shalmani, A.; Ali, M.; Yang, Q.H.; Ahmad, H.; Li, F.B. Mechanisms Regulating the Dynamics of Photosynthesis Under Abiotic Stresses. Front. Plant Sci. 2021, 11, 615942. [Google Scholar] [CrossRef] [PubMed]
- Naz, H.; Akram, N.A.; Ashraf, M. Impact of ascorbic acid on growth and some physiological attributes of cucumber (Cucumis Sativus) plants under water-deficit conditions. Pak. J. Bot. 2016, 48, 877–883. [Google Scholar]
- Shafiq, S.; Akram, N.A.; Ashraf, M.; Arshad, A. Synergistic effects of drought and ascorbic acid on growth, mineral nutrients and oxidative defense system in canola (Brassica napus L.) plants. Acta Physiol. Plant. 2014, 36, 1539–1553. [Google Scholar] [CrossRef]
- Shigeoka, S.; Maruta, T. Cellular redox regulation, signaling, and stress response in plants. Biosci. Biotechnol. Biochem. 2014, 78, 1457–1470. [Google Scholar] [CrossRef]
- Gest, N.; Gautier, H.; Stevens, R. Ascorbate as seen through plant evolution: The rise of a successful molecule? J. Exp. Bot. 2012, 63, 695–709. [Google Scholar] [CrossRef]
- Wang, M.; Maeda, H.A. Aromatic amino acid aminotransferases in plants. Phytochem. Rev. 2018, 17, 131–159. [Google Scholar] [CrossRef]
- Filiz, E.; Cetin, D.; Akbudak, M.A. Aromatic amino acids biosynthesis genes identification and expression analysis under salt and drought stresses in Solanum lycopersicum L. Sci. Hortic. 2019, 250, 127–137. [Google Scholar] [CrossRef]
- Tohge, T.; Watanabe, M.; Hoefgen, R.; Fernie, A.R. Shikimate and phenylalanine biosynthesis in the green lineage. Front. Plant Sci. 2013, 4, 62. [Google Scholar] [CrossRef]
- Maeda, H.; Dudareva, N. The shikimate pathway and aromatic amino acid biosynthesis in plants. Annu. Rev. Plant Biol. 2012, 63, 73–105. [Google Scholar] [CrossRef]
- Ostaci, Ș.; Slabu, C.; Marta, A.E.; Covașă, M.; Miniață, I.; Jităreanu, D.C. The Influence of Salt Stress on the Content of Vitamin C in the Leaves of some Varieties and Lines of Bitter Cucumber (Momordica charantia). Bull. Univ. Agric. Sci. Vet. Med. CLUJ-NAPOCA Hortic. 2023, 80, 65–70. [Google Scholar] [CrossRef]
- Bevans, R. Two-Way ANOVA|Examples & When to Use It; Scribbr: Amsterdam, The Netherlands, 2022; Available online: https://www.scribbr.com/statistics/two-way-anova/ (accessed on 15 January 2024).
- Turney, S. Pearson Correlation Coefficient (r)|Guide & Examples. 2024. Available online: https://www.scribbr.com/statistics/pearson-correlation-coefficient/ (accessed on 15 January 2024).
- Kenton, W. Analysis of Variance (ANOVA) Explanation, Formula, and Applications. 2023. Available online: https://www.investopedia.com/terms/a/anova.asp (accessed on 20 January 2024).
- Goulden, C.H. Methods of Statistical Analysis, 2nd. Available online: https://www.statisticshowto.com/probability-and-statistics/t-test/ (accessed on 15 January 2024).
- Matei, N.; Dobrinas, S.; Radu, G.L. Spectrophotometric determination of ascorbic acid in pharmaceutical products with the Prussian Blue reaction. Ovidius Univ. Ann. Chem. 2012, 23, 174–179. [Google Scholar] [CrossRef]
- Mansour, M.M.F.; Ali, E.F. Evaluation of proline functions in saline conditions. Phytochemistry 2017, 140, 52–68. [Google Scholar] [CrossRef]
- Marin, J.A.; Andreu, P.; Carrasco, A.; Arbeloa, A. Determination of proline concentration, an abiotic stress marker, in root exudates of excised root cultures of fruit tree rootstocks under salt stress. Sahariens 2010, 24, 722–727. [Google Scholar]
- Li, J.; Diao, Y.; Jiang, L.; He, Q.; Wang, F.; Hao, W. Exploration of ecological restoration of saline-alkali land based on NbS—Study on the salt resistance and desalination performance of three cash crops. PLoS ONE 2022, 17, e0275828. [Google Scholar] [CrossRef]
- Meghashree, J.R.; Ganiger, V.M.; Kumar, J.S.A.; Bhuvaneshwari, G.; Gopali, J.B.; Evoor, S.; Cholin, S.S.; Gunnaiah, R.; Shankarappa, T.H.; Krishnamurthy, S.L.; et al. Genetic diversity and population structure assessment of Indian bitter gourd accessions using nutritional content and molecular markers. Genet. Resour. Crop Evol. 2023. [Google Scholar] [CrossRef]
- Munns, R. Physiological processes limiting plant growth in saline soils: Some dogmas and hypotheses. Plant Cell Environ. 1993, 16, 15–24. [Google Scholar] [CrossRef]
- Kumar, M.; Patel, M.K.; Kumar, N.; Bajpai, A.B.; Siddique, K.H.M. Metabolomics and molecular approaches reveal drought stress tolerance in plants. Int. J. Mol. Sci. 2021, 22, 9108. [Google Scholar] [CrossRef] [PubMed]
- Sharma, A.; Shahzad, B.; Rehman, A.; Bhardwaj, R.; Landi, M.; Zheng, B. Response of phenylpropanoid pathway and the role of polyphenols in plants under abiotic stress. Molecules 2019, 24, 2452. [Google Scholar] [CrossRef]
- Stewart, K. Pearson’s Correlation Coefficient. 2023. Available online: https://www.britannica.com/topic/Pearsons-correlation-coefficient (accessed on 20 January 2024).
- Hassan, A.; Amjad, S.F.; Saleem, M.H.; Yasmin, H.; Imran, M.; Riaz, M.; Ali, Q.; Joyia, F.A.; Mobeen; Ahmed, S.; et al. Foliar application of ascorbic acid enhances salinity stress tolerance in barley (Hordeum vulgare L.) through modulation of morpho-physio-biochemical attributes, ions uptake, osmo-protectants and stress response genes expression. Saudi J. Biol. Sci. 2021, 28, 4276–4290. [Google Scholar] [CrossRef] [PubMed]
- Slama, I.; Abdelly, C.; Bouchereau, A.; Flowers, T.; Savouré, A. Diversity, distribution and roles of osmoprotective compounds accumulated in halophytes under abiotic stress. Ann. Bot. 2015, 115, 433–447. [Google Scholar] [CrossRef] [PubMed]
Disclaimer/Publisher’s Note: The statements, opinions and data contained in all publications are solely those of the individual author(s) and contributor(s) and not of MDPI and/or the editor(s). MDPI and/or the editor(s) disclaim responsibility for any injury to people or property resulting from any ideas, methods, instructions or products referred to in the content. |
© 2024 by the authors. Licensee MDPI, Basel, Switzerland. This article is an open access article distributed under the terms and conditions of the Creative Commons Attribution (CC BY) license (https://creativecommons.org/licenses/by/4.0/).