Article

Impact of Lactobacillus acidophilus—La5 on Composition and Metabolism of the Intestinal Microbiota of Type 2 Diabetics (T2D) and Healthy Individuals Using a Microbiome Model

by
Mateus Kawata Salgaço
1,
Fellipe Lopes de Oliveira
1,
Adilson Sartoratto
2,
Victoria Mesa
3,4,
Marcia Pinto Alves Mayer
5 and
Katia Sivieri
1,*
1
Graduate Program in Food, Nutrition, and Food Engineering, São Paulo State University—UNESP, Araraquara 14800-060, Brazil
2
Pluridisciplinary Center for Chemical, Biological and Agricultural Research, Multidisciplinary Center for Chemical, Biological and Agricultural Research, CPQBA-UNICAMP, Paulínia 13148-218, Brazil
3
INSERM, UMR-S 1139 (3PHM), Faculty of Pharmacy, Université Paris Cité, F-75006 Paris, France
4
Food and Human Nutrition Research Group, School of Nutrition and Dietetics, Universidad de Antioquia (UdeA), Medellín 050010, Colombia
5
Department of Microbiology, Institute of Biomedical Sciences, University of São Paulo, São Paulo 05508-000, Brazil
*
Author to whom correspondence should be addressed.
Fermentation 2023, 9(8), 740; https://doi.org/10.3390/fermentation9080740
Submission received: 13 June 2023 / Revised: 14 July 2023 / Accepted: 19 July 2023 / Published: 7 August 2023
(This article belongs to the Special Issue Recent Trends in Probiotics and Gut Microbiome for Human Health)

Abstract

:
Type 2 diabetes is characterized by dysbiosis in the gut, which may lead to systemic inflammation. Therefore, the use of probiotics may help to achieve a balanced microbiota and improve glycemic control. The aim of this study was to verify the impact of Lactobacillus acidophilus—La5 on the gut microbiome of type 2 diabetes adults using the Human Gut Microbial Ecosystem Simulator (SHIME®) and compare this to the microbiome of healthy subjects. Four groups (Control Group: NormoGlycemic; Treatment Group: T2D) were evaluated in SHIME® for 6 weeks. After 7 and 14 days of colonic fermentation, the intestinal microbiota (16S rRNA gene sequencing) and metabolites (short-chain fatty acids) were analyzed. La5 altered the composition of the microbiota after 14 days of treatment for both groups, by increasing the abundance of Bacteroidetes and a decrease in Firmicutes in the NormoGlycemic. Treatment with La5 resulted in a shift in the microbial community of NormoGlycemic with increased abundance of Bacteroides and Mitsuokella and a decrease in Achromobacter and Catabacter, whereas T2D gut microbiome was enriched with Faecalibacterium and reduced in Bacteroides. Megasphaera spp. stimulated with La5 treatment in NormoGlycemic has already been reported to produce intestinal metabolites and recognized to contribute to increased anti-inflammatory and immune responses. Faecalibacterium, on the other hand, can modulate the intestinal epithelium and be a major butyrate product in the microbiota. Finally, this study showed a positive and promising result of La5 treatment in increasing intestinal homeostasis in the microbiota of T2D.

1. Introduction

Diabetes is a metabolic disorder characterized by elevated blood glucose levels. The incidence of diabetes is widespread and the International Diabetes Federation (IDF) reports that 463 million people worldwide suffer from diabetes, which is estimated to reach 700 million by the year 2045 [1]. Diabetes has been classified into three classes (type 1, type 2, and gestational diabetes) depending on the underlying pathophysiology, and type 2 diabetes (T2D) accounts for more than 90% of all diabetes [1,2]. Genetic susceptibility is a critical determinant of T2D, but non-genetic factors, including diet and physical activity, also play a significant role in the development and severity of T2D.
Administration of probiotics has the potential to alter the resident microbiome, and, consequently, collaboration with the prevention and control of the imbalance of gut bacteria is associated with several conditions in humans [3], including obesity [4], inflammation [5], and T2D [6].
However, the use of these beneficial organisms has yielded controversial results, mostly due to inappropriate strains and poor clinical designs [7,8,9]. Interestingly, studies revealed that organisms of the families Lactobacillaceae and Bifidobacteriaceae are enriched in the feces of participants with T2D after antidiabetic treatment with a single use of acarbose [10] or metformin [11,12].
Among the probiotic bacteria belonging to the Lactobacillaceae family, the Lactobacillus acidophilus—La5 strain is present in a wide variety of beverages, dairy products, and supplements, and it offers a wide range of health benefits, improving gut health [13]. L. acidophilus has been shown to help regulate the composition of the gut microbiota by promoting the growth of beneficial bacteria and reducing harmful bacteria, which may lead to improved gut health [14].
Experimental animal models have shown that oral administration of L. acidophilus—La5 can reduce total and LDL cholesterol levels in hypercholesterolemic rats [15], improve fat induced obesity in mice [16], and modulate cellular processes that can be altered in senescence [17].
Clinical studies using supplementation with L. acidophilus—La5 alone or in combination with other probiotic strains revealed that it improved gastrointestinal symptoms and quality of life in patients with irritable bowel syndrome (IBS) [15], reduced the pro-inflammatory profile of PMNs in obese subjects [18], and reduced total cholesterol levels in healthy adults [19,20]. There is also evidence that consumption of L. acidophilus—La5 in combination with other probiotic strains improved glycemic control [21] and reduced risk factors for cardiovascular diseases in T2D subjects [22].
Despite these promising results, little is known about the mechanisms underlying the beneficial effects of L. acidophilus—La5. A better understanding of the link between the gut microbiota and metabolic disorders, especially T2D, may lead to advances in current treatment approaches, accurate disease monitoring, and development of new therapeutics. Thus, we aimed to evaluate the effect of L. acidophilus—La5 on the gut microbiota of healthy adult subjects and adults with type 2 diabetes using the Simulator Human Intestinal Microbial Ecosystem (SHIME®). This simulator allows the study of the human gut microbiota under highly controlled conditions in reactors that mimic different colon regions. Therefore, this model yields reproducible results in shorter periods than clinical studies, employing human intestinal microbiota derived from fecal samples under simulated physiological conditions [23].

2. Materials and Methods

2.1. Study Design

The total experimental period comprised 5 weeks for each group: the normoglycemic and T2D group, and the L. acidophilus—La5™ (CHR Hansen Holding A/S, Hørsholm, Denmark) was used as the probiotic strain. Pooled feces from healthy adult volunteers or type 2 diabetic subjects (T2D) were inoculated into the corresponding triplicate compartments of the ascending colon of the Simulator of Human Intestinal Microbial Ecosystem (SHIME®). After stabilization of the microbiota for two weeks, followed by a one-week interval of a control period, L. acidophilus—La5 was administered for two weeks. Samples were obtained from triplicate compartments of the ascending colon, and the effect of the probiotic treatment was determined by evaluating the composition of the microbiota through 16S rRNA sequencing analysis and the metabolic activity through ammonium ( NH 4 + ) and short-chain fatty acids (SCFAs) analyses. The survival of L. acidophilus—La5 in the compartment simulating the stomach and duodenum was assessed during the treatment period.

2.2. Samples Collection

Fecal samples were obtained from volunteers recruited in the city of Araraquara (São Paulo, Brazil) after approval by the Institutional Ethics Committee for Research with Humans (Universidade Estadual Paulista/UNESP, Araraquara; CAAE: 30156020.8.0000.5426). The compartments were colonized, with the inclusion criteria for the Normoglycemic and T2D groups being 45–50 years of age, with no food allergies or intolerances; the exclusion criteria were reported use of dietary supplements, medications for gastrointestinal diseases, use of antibiotics within the past 6 months, and use of probiotics or prebiotics within the past 3 months. Both groups were not to use medications for metabolic diseases, except for the treatment of the T2D group. Donor stools were collected by the volunteers and delivered to the research laboratory in 2 h, always stored under refrigeration (4 °C).

2.3. Experimental Protocol

The experimental period in the SHIME® reactor lasted 5 weeks. For the microbiota stabilization period, the feed medium (1.0 g/L arabinogalactan (Sigma, St. Louis, MO, USA), 2.0 g/L pectin (Sigma), 1.0 g/L xylan (Roth, Karlsruhe, Germany), 3.0 g/L starch (Êxodo, Hortolândia, Brazil), 0.4 g/L glucose (Synth, Diadema, Brazil), 3.0 g/L yeast extract (Neogen, Lansing, MI, USA), 1.0 g/L peptone (Kasvi, Rome, Italy), 4.0 g/L mucin (Sigma), and 0.5 g/L cysteine (Sigma)) was inserted 240mL into the system and left to stabilize for 14 days [24]. After these two weeks, for one week, daily, 210 mL of feed medium and 60 mL of pancreatic juice (12.5 g/L NaHCO3, 3.6 g/L Oxgall, 0.9 g/L pancreatin, Sigma-Aldrich, St. Louis, MO, USA) were inserted in the system (Control period). Thereafter, the treatment was administered twice daily for 14 days. NormoGlycemic Treatment: L. acidophilus (La5 108 CFU/g), twice daily for 14 days. T2D Treatment: L. acidophilus (La5 108 CFU/g), twice daily for 14 days (Figure 1).

2.4. Metabolic Activity: Ammonium ( NH 4 + ) Analysis and Short-Chain Fatty Acids (SCFAs)

Samples from the ascending colon compartment (n = 3) were collected after the control period, after 7 days of treatment, and at the end of 14 days of treatment with the probiotic, and stored at −20 °C. The ammonium ions ( NH 4 + ) were quantified according to Bianchi et al. [25], using a specific ion meter (Model 710A, Orion) coupled to a selective ammonia ion electrode (Model 95–12, Orion). To analyze SCFAs (acetic, propionic, and butyric acids), 2 mL of colonic fermented samples was centrifuged (14,000 rpm (g) for 5 min), and 1 mL of the supernatant stored for fatty acid analysis. The supernatants were injected into an Agilent gas chromatograph (model HP-6890, Santa Clara, CA, USA), equipped with an Agilent selective mass detector (model HP-5975) using a DB-WAX capillary column (60 m × 0.25 mm × 0.25 μm) under the following conditions: temperature of injector = 220 °C, column = 35 °C, 2 °C/min, 38 °C; 10 °C/min, 75 °C; 35 °C/min, 120 °C (1 min); 10 °C/min, 170 °C (2 min); 40 °C/min, 170 °C (2 min) and detector = 250 °C. Helium was used as a drag gas at a flow rate of 1 mL/min. Analytical curves were constructed using the stock solution of the acids of interest: acetic, propionic, and butyric acids. The samples were analyzed in triplicate per ascending colon replica, before and after treatment. Data are expressed in mmol/g [26].

2.5. Survival of Lactobacillus acidophilus—La5 under Simulated Conditions of the Stomach and Duodenum in the SHIME®

During the treatment period with the probiotic, samples were collected from the reactors corresponding to the stomach and duodenum to verify the survival of Lactobacillus acidophilus—La5®. A quantity of 1 mL of the samples from each reactor was suspended in 9 mL of sterile peptone water. Serial dilutions were carried out and plated in MRS agar supplemented with 1.5 g L-1 bile salts (Sigma-Aldrich®, St. Louis, MO, USA) (Lima et al., 2009). The plates were incubated in anaerobiosis (Probac, Brazil) at 37 °C for 72 h [27].

2.6. Microbiological Analysis Employing 16S rRNA Gene Sequencing

The diversity of the intestinal microbiota was analyzed by next-generation sequencing (Neoprospecta Microbiome Technologies, Florianópolis, Brazil) where specific primers amplified the V3–V4 region of the 16S rRNA, and 341F and 806R of 1 ng of DNA [28,29]. The PCR was carried out in triplicate using a Platinum Taq (Invitrogen, Carlsbad, CA, USA) under the following conditions: 95 °C for 5 min, twenty-five cycles at 95 °C for 45 s, 55 °C for 30 s and 72 °C per 45 s, with a final extension of 72 °C for 2 min for the first PCR (PCR 1). For the second PCR (PCR 2), the conditions were 95 °C for 5 min, ten cycles at 95 °C for 45 s, 66 °C for 30 s and 72 °C for 45 s, with a final extension of 72 °C for 2 min. After the last PCR, the samples were cleaned with AMPure beads (Beckman coulter) [30]. To measure the taxa present in the samples, a predictor model of the V3 and V4 regions was used (SILVA 138.99% OTUs from the 515F/806R region of sequences). The operational taxonomic units (OTUs) were grouped by cluster readings with 99% similarity. The taxonomy was assigned to OTUs using the SILVA 138 reference database (https://www.arb-silva.de/, accessed on 30 May 2023).

2.7. Statistical Analysis

Data are presented as mean ± standard deviation (SD). Paired t-test, one-way analysis of variance (ANOVA), and Tukey’s test were used to analyze the results, with p < 0.05 considered statistically significant. Statistical analysis was performed using GraphPad Prism software, version 8.0 (La Jolla, CA, USA). 16S rRNA gene sequence analyses were performed in RStudio, version 3.2.4 [31] using the phyloseq package [32] to import sample data and calculate alpha- and beta-diversity metrics. The significance of categorical variables was determined using the non-parametric Wilcoxon test for two category comparisons or the Kruskal–Wallis test when comparing three or more categories. Principal coordinate plots were based on the PERMANOVA test to estimate the p-value [33]. The p-values were adjusted for multiple comparisons using the FDR algorithm [34,35].

3. Results and Discussion

3.1. Survival of L. acidophilus—La5 under Simulated GI Condition

The survival of L. acidophilus—La5 under adverse gastrointestinal conditions in vitro was evaluated and specifically established as low pH, presence of pancreatin, and tolerance to bile salts (Table 1). Survival of the probiotic strain decreased significantly throughout the gastric (reduction of 3.64 log CFU/mL) and enteric phases (reduction of 3.80 log CFU/mL) in both treatments (Normoglycemic and Type 2 Diabetic). The effects of probiotics are known to be strain-specific. L. acidophilus showed good viability during exposure to gastric juice at pH 2. Generally, growth of lactic acid bacteria is optimal at pH 6–7 (near neutral pH). Some metabolic reactions change when pH is <5 or <4.4 [36]. The probiotic ability to survive adverse conditions in gastrointestinal tract functions is a fundamental key for probiotics to exert their beneficial effects on the colon [35]. The viability of probiotic L. acidophilus decreased significantly during exposure to intestinal juice for 60 min; a decrease in the number of free cells may reflect cell death, which may be caused by factors other than the pH of the medium [37].

3.2. Metabolic Activity

Bacterial metabolic activity was evaluated in ascending colonic vessels (ammonium ions and short-chain fatty acids production). A decrease was observed (p < 0.05) in ammonium ion production in the first 7 days of La5 treatment for both groups (NormoGlycemic and Type 2 Diabetic), and the values stabilized until the 14th day of treatment (values between 200–255 ppm) (Table 2). In the control period, the microbiota of the NormoGlycemic Group showed a higher ammonia ion production than the Type 2 Diabetics Group, but after the probiotic treatment (7 and 14 days), the values became closer in both groups and maintained the downward trend.
Protein breakdown and/or amino acid metabolism and is also produced by gut bacteria [38]. Then, this ammonia is transported through the circulation to the periportal hepatocytes, where 90% of the ammonia enters the urea cycle and is converted to urea. Furthermore, ammonia is not excreted due to its low water solubility; the remaining 10% is transported to periportal hepatocytes where ammonia is condensed with glutamate to glutamine via glutamine synthase (GS) [39].
According to Scott et al. [40], the release of ammonium ions may be associated with increased metabolic activity of some Bifidobacterium species, among others, that participate in deamination processes. The reduction in ammonia in the colon is considered beneficial because these ions in high amounts can alter the morphology as well as the metabolism of intestinal cells, increasing DNA synthesis and promoting tumor development [41]. Hughes et al. [42] demonstrated that ammonia can increase cell permeability in colonocytes, causing various diseases in the host. The presence of ammonia can reduce the uptake and utilization of short-chain fatty acids by colonocytes [43]. In addition, the blood level of ammonia must remain very low because even slightly elevated concentrations (hyperammonemia) are toxic to the central nervous system. The peak ammonia level and the duration of hyperammonemia are the main risk factors for hyperammonemia-related neurological deficits and death [44]. The increased serum ammonia levels found in patients with type 2 DM may be associated with delayed gastrointestinal transit [45] as well as increased DB monoamine oxidase activity [46]. Since the presence of elevated blood ammonia levels was not related to liver dysfunction, this could indicate that other extrahepatic cells, such as RBCs, participate in the control of nitrogen metabolism [47]. Ammonia toxicity can induce cellular damage, as occurs during neurodegeneration in aging, and Alzheimer’s disease [48], and in diabetic rats, there was a marked increase in the ammonium-dependent component of L-glutamate transport, causing higher intracellular glutamate concentration [49].
The concentrations of SFCAs are shown in Table 3. In the NormoGlycemic Group after 14 days of La5 treatment, an increase (p < 0.05) in acetic and propionic acids production was observed when compared to the control period. Short-chain fatty acids act as important anions in the colon cavity and thus increase sodium and water absorption [50], increase intestinal blood flow [51,52], promote colon epithelial cell proliferation and mucosal growth, provide metabolic energy, and serve as nutrients for the colon mucosa [53].
The fermentation of polysaccharides induced by the intestinal microbiota produces short-chain fatty acids (SCFAs), which are used by the epithelial cells of the colon as nutrition. Propionate, acetate, and butyrate are the major SCFA s produced by bacterial fermentation of dietary fiber in the intestine [54]. SCFAs provide about 6% to 10% of the body’s total daily energy [54,55]. Most SCFAs are absorbed in the colon (90–95%), while the remainder (5–10%) is secreted in the feces. About 60% of SCFA absorption occurs via epithelial membrane diffusion, while the remainder is absorbed by active cell transport, specifically by monocarboxylate transporters in colonocytes [56]. Those that are not metabolized by the colonocytes (mainly butyric acid) are transported through the portal circulation and metabolized in the liver before reaching the systemic circulation. However, the distal colon, where most of the intestinal microbiota reside, bypasses the portal circulation, allowing systemic access [57]. Therefore, SCFAs produced by the microbiota may be present in the portal blood, liver, peripheral blood, and feces [58,59]. Low levels of SCFAs in the blood and gastrointestinal system are implicated in diabetes and inflammatory diseases [60]. SCFAs in the intestinal lumen are absorbed by enterocytes and reach the bloodstream. After reaching the bloodstream, SCFAs can affect glucose storage in muscles, liver, and fat. In addition, SCFAs can activate the G-protein-coupled receptor 43 (GPR43) on intestinal epithelial cells to improve intestinal barrier function and prevent inflammatory diseases [61].
It is important to emphasize that, in the diabetic group, after 14 days of treatment with La5, an increase in the production of butyric acid was observed. Among various SCFAs, butyric acid has attracted particular attention [62,63]. Several studies have shown that an impaired glucose metabolism is associated with decreased levels of butyrate-producing bacteria in diabetic patients [63]. Butyric acid is also known to regulate the size and function of the colonial regulatory T-cell pool, improve insulin sensitivity, and reduce the inflammatory response of adipocytes by stimulating glucagon-peptide-1 (GLP-1) production [62]. In animal models, Gao et al. [19] reported that butyrate supplementation (5% w/w in the high-fat diet) prevented the development of insulin resistance and obesity in diet-induced obese mice [19]. In an animal study in diabetic rats, it was found that the cell membrane of the intestinal microbiota is more active in transporting sugars and branched-chain amino acids, but butyric acid synthesis is reduced. Therefore, the oxidative stress reaction directly related to pro-inflammatory reactions is increased [64].

3.3. Richness and Diversity of the Gut Microbiota

There were no statistical differences in the alpha-diversity indexes Chao1 (species richness) and Shannon (diversity) for the groups (NormoGlycemic Group and Type 2 Diabetics Group) or after 14 days of La5 treatment (Table 4). These results agree with a Brazilian study by Leite et al. [65] which compared the microbiota of 20 healthy individuals with 19 individuals with type 2 diabetes. The authors found no significant differences in the richness values (Chao1 and observed OTUs). Importantly, richness generally refers to the number of unique species that are present in a sample [66].
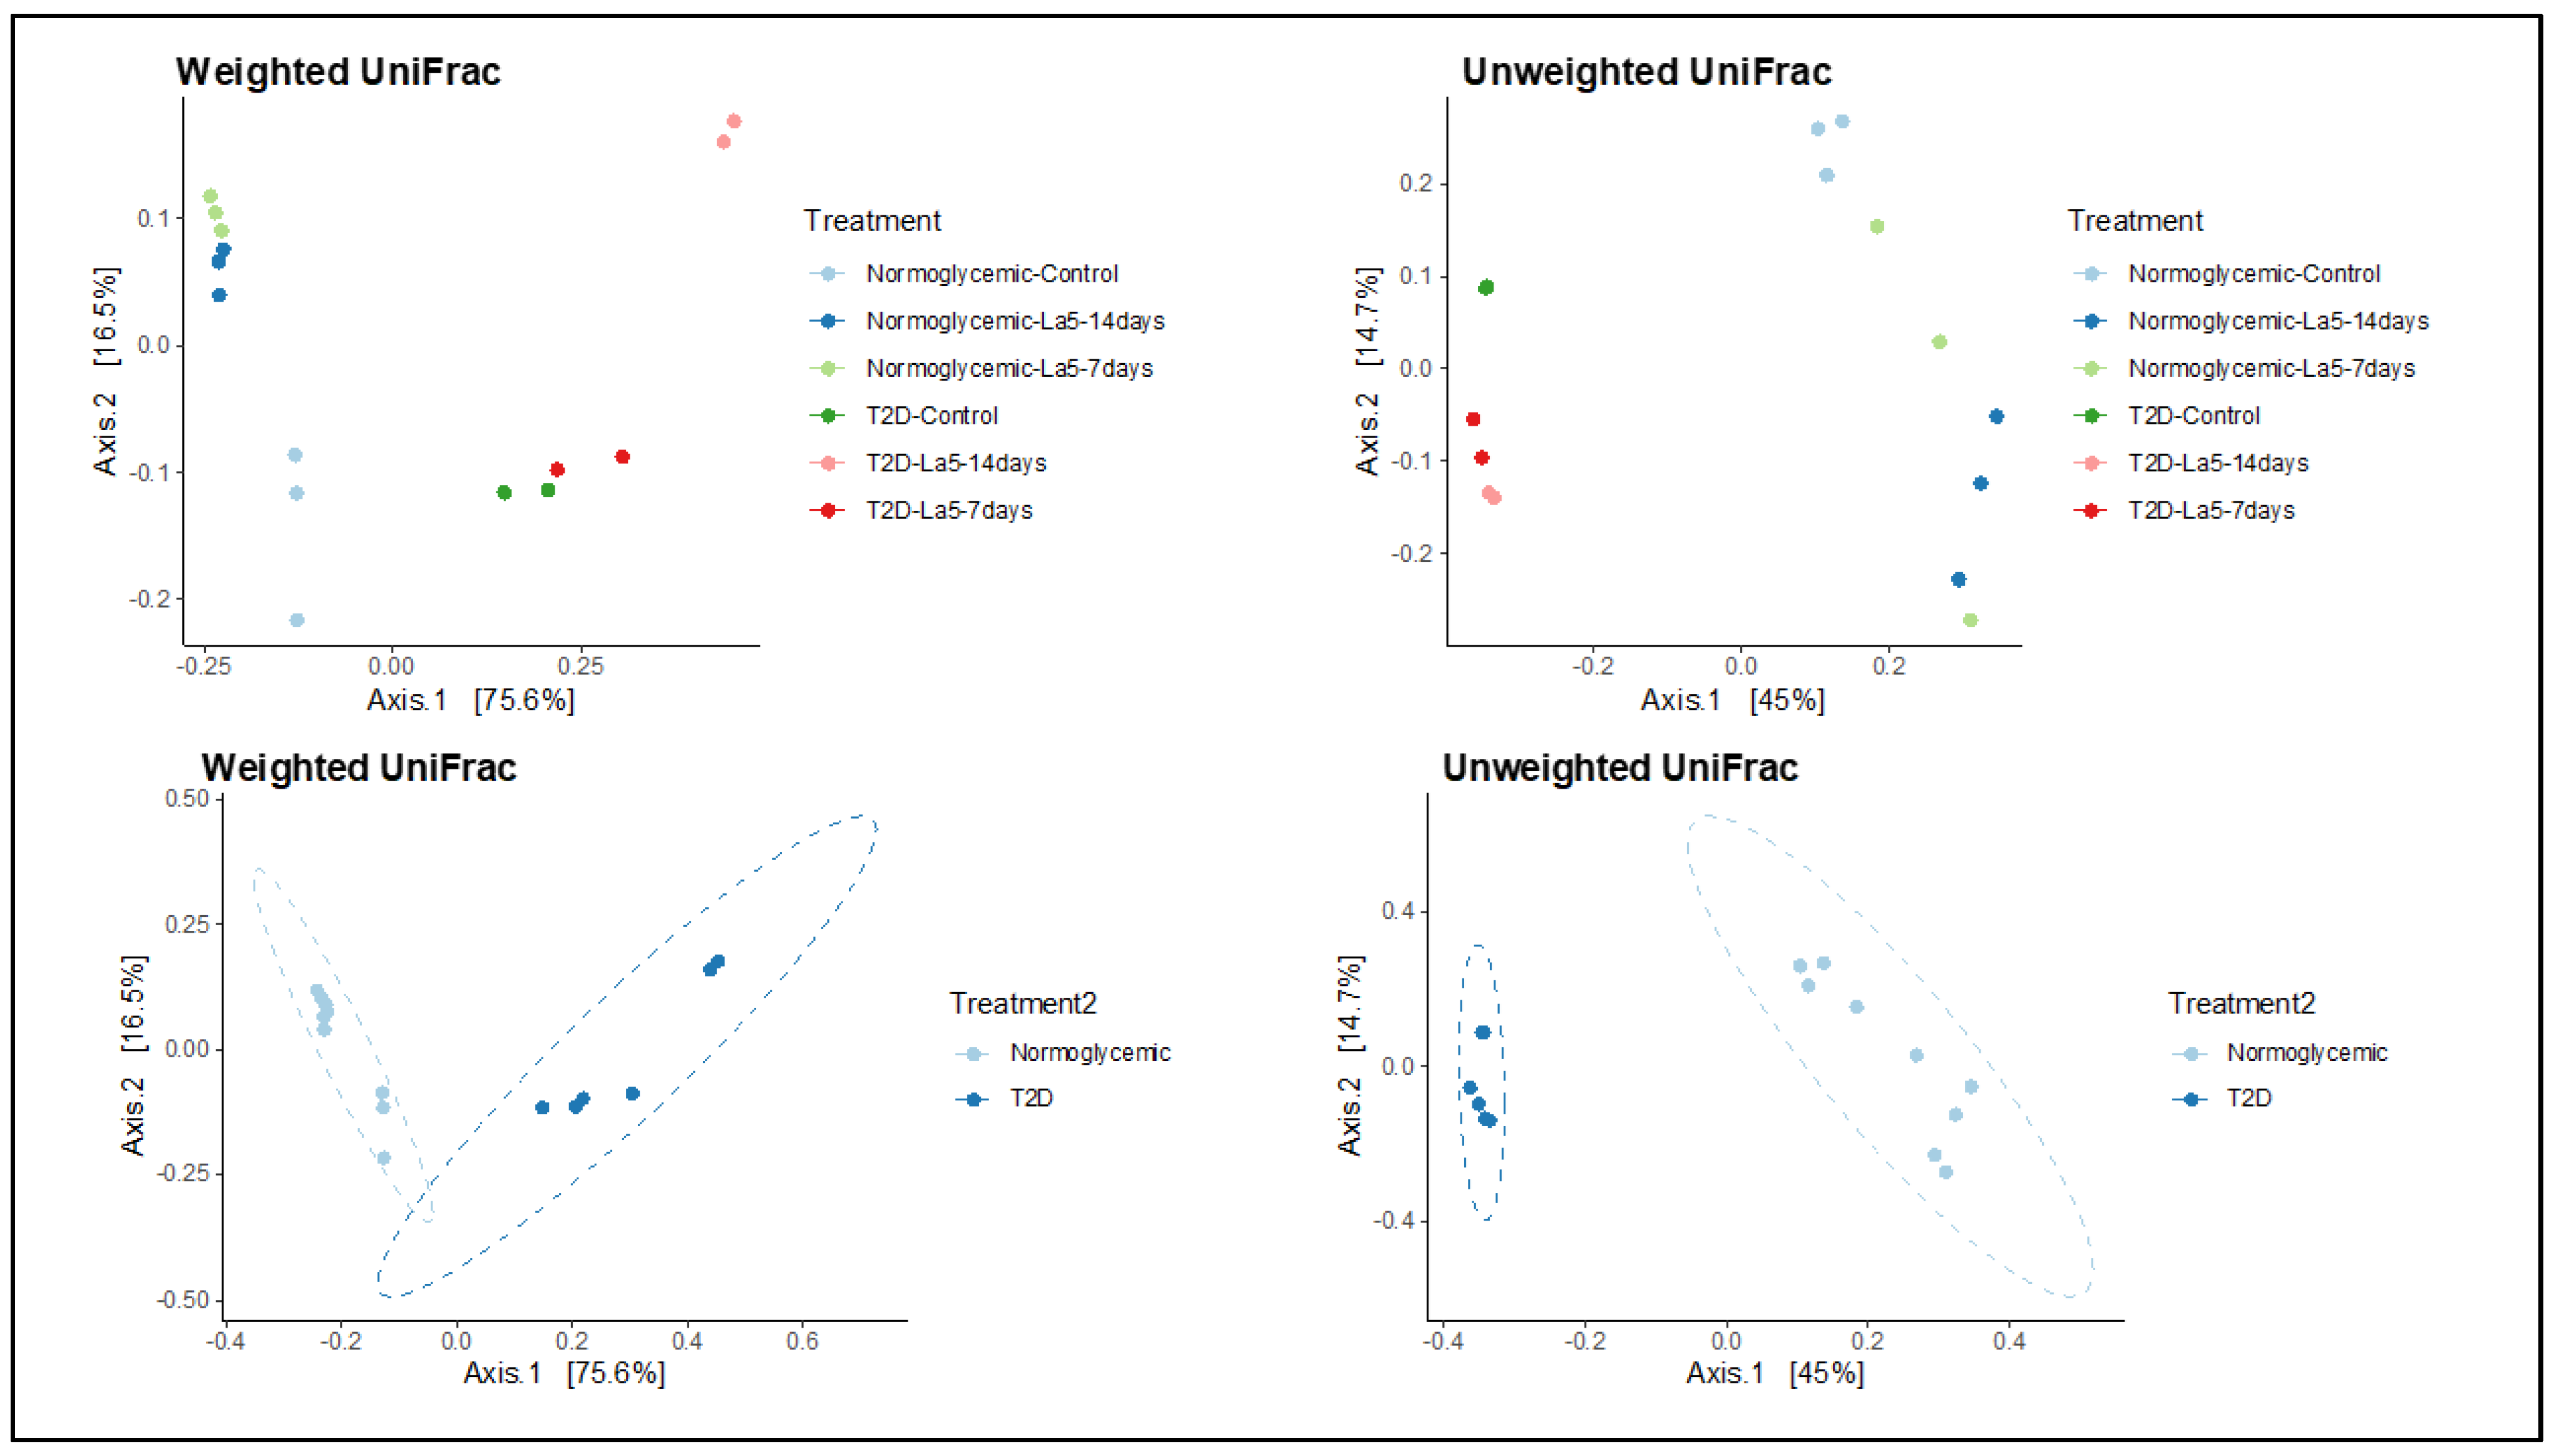
For beta diversity (Figure 2), there were significant differences between the treatment and control period for both groups when calculated by weighted and unweighted UniFrac (p = 0.001). In addition, it was possible to observe differences between the microbiota of NormoGlycemic and Type 2 Diabetics Groups (p = 0.001). These results show the effect of treatment with L. acidophilus—La5 on the composition of the microbiota and the differences between the microbiota of NormoGlycemic and Type 2 Diabetics Groups (Figure 3). Similar results were observed by Leite et al. [66], using the weighted and unweighted UniFrac metric with Bonferroni correction (beta diversity); they observed a statical difference between gut microbial communities of Type 2 Diabetics and NormoGlycemic patients.

3.4. Influence of Lactobacillus acidophilus—La5 on Gut Microbiota Composition

The composition of the gut microbiota of NormoGlycemic and Type 2 Diabetics from the SHIME® samples was evaluated using 16S rRNA gene sequencing.
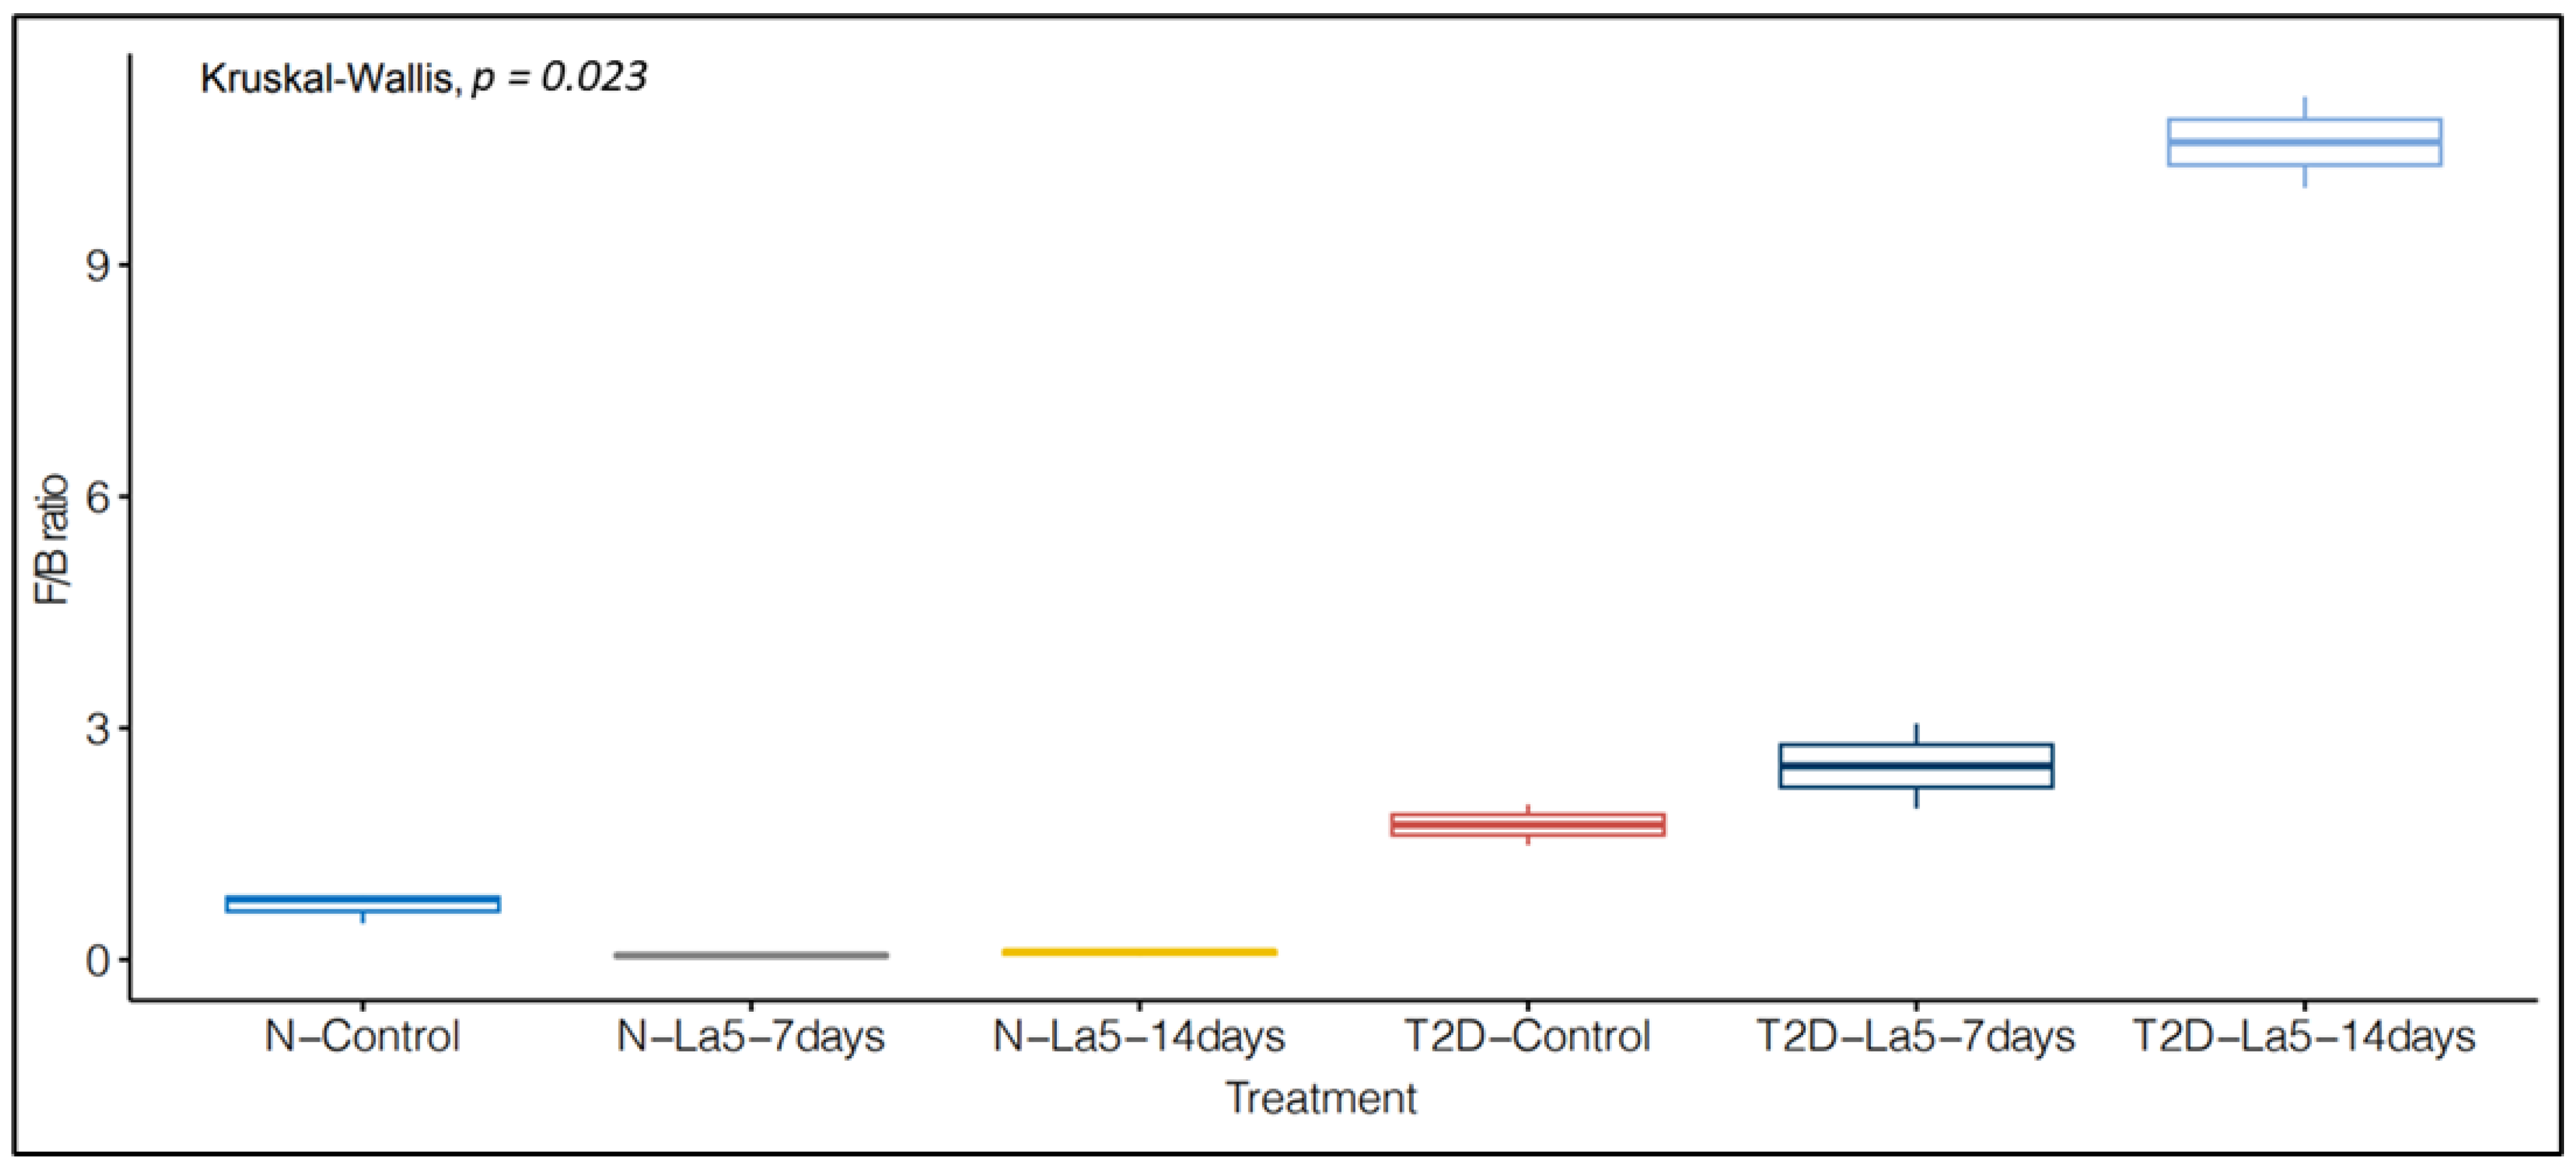
Figure 4 shows the relative abundance of the main phyla found in the gut microbiota during all experimental periods. In both groups (NormoGlycemic and Type 2 Diabetics) the main phyla were Bacteroidetes, Firmicutes, Actinobacteria, and Proteobacteria. In the control group, the Firmicutes/Bacteroides ratio was lower when compared to that of the diabetic group (Figure 5).
Some studies have shown a significant association between changes in the composition profile of the gut microbiota and the development of type 2 diabetes [67]. We understand that disrupted eubiosis of the Bacteroidetes/Firmicutes phylum is associated with increased intestinal permeability, with infiltration of bacterial by-products through a permeable intestinal barrier and, as a consequence, triggers subsequent inflammatory responses characteristic of diabetes [68]. On the other hand, several bacteria play a protective role, decreasing the risk of developing diabetes by reducing pro-inflammatory markers and maintaining the integrity of the intestinal barrier [69]. For example, L. fermentum, L. plantarum, and L. casei, Roseburia intestinalis, Akkermansia muciniphila, and Bacteroides fragilis have been shown to improve glucose metabolism and insulin sensitivity and suppress pro-inflammatory cytokines [68].
In the control group, the effect on microbiota composition occurred after 7 days of treatment, with an increase in the abundance of Bacteroidetes and a decrease in Firmicutes. However, in the experiment with the Type 2 Diabetics Group, a modulation of the microbiota was observed that was different from that of the control group, with an increase after 14 days of treatment in Firmicutes and decrease in Bacteroidetes (Figure 5). Among the main phyla of the gut microbiota, Bacteroidetes have often been assigned a prominent position as indicators of the metabolism and health [70].
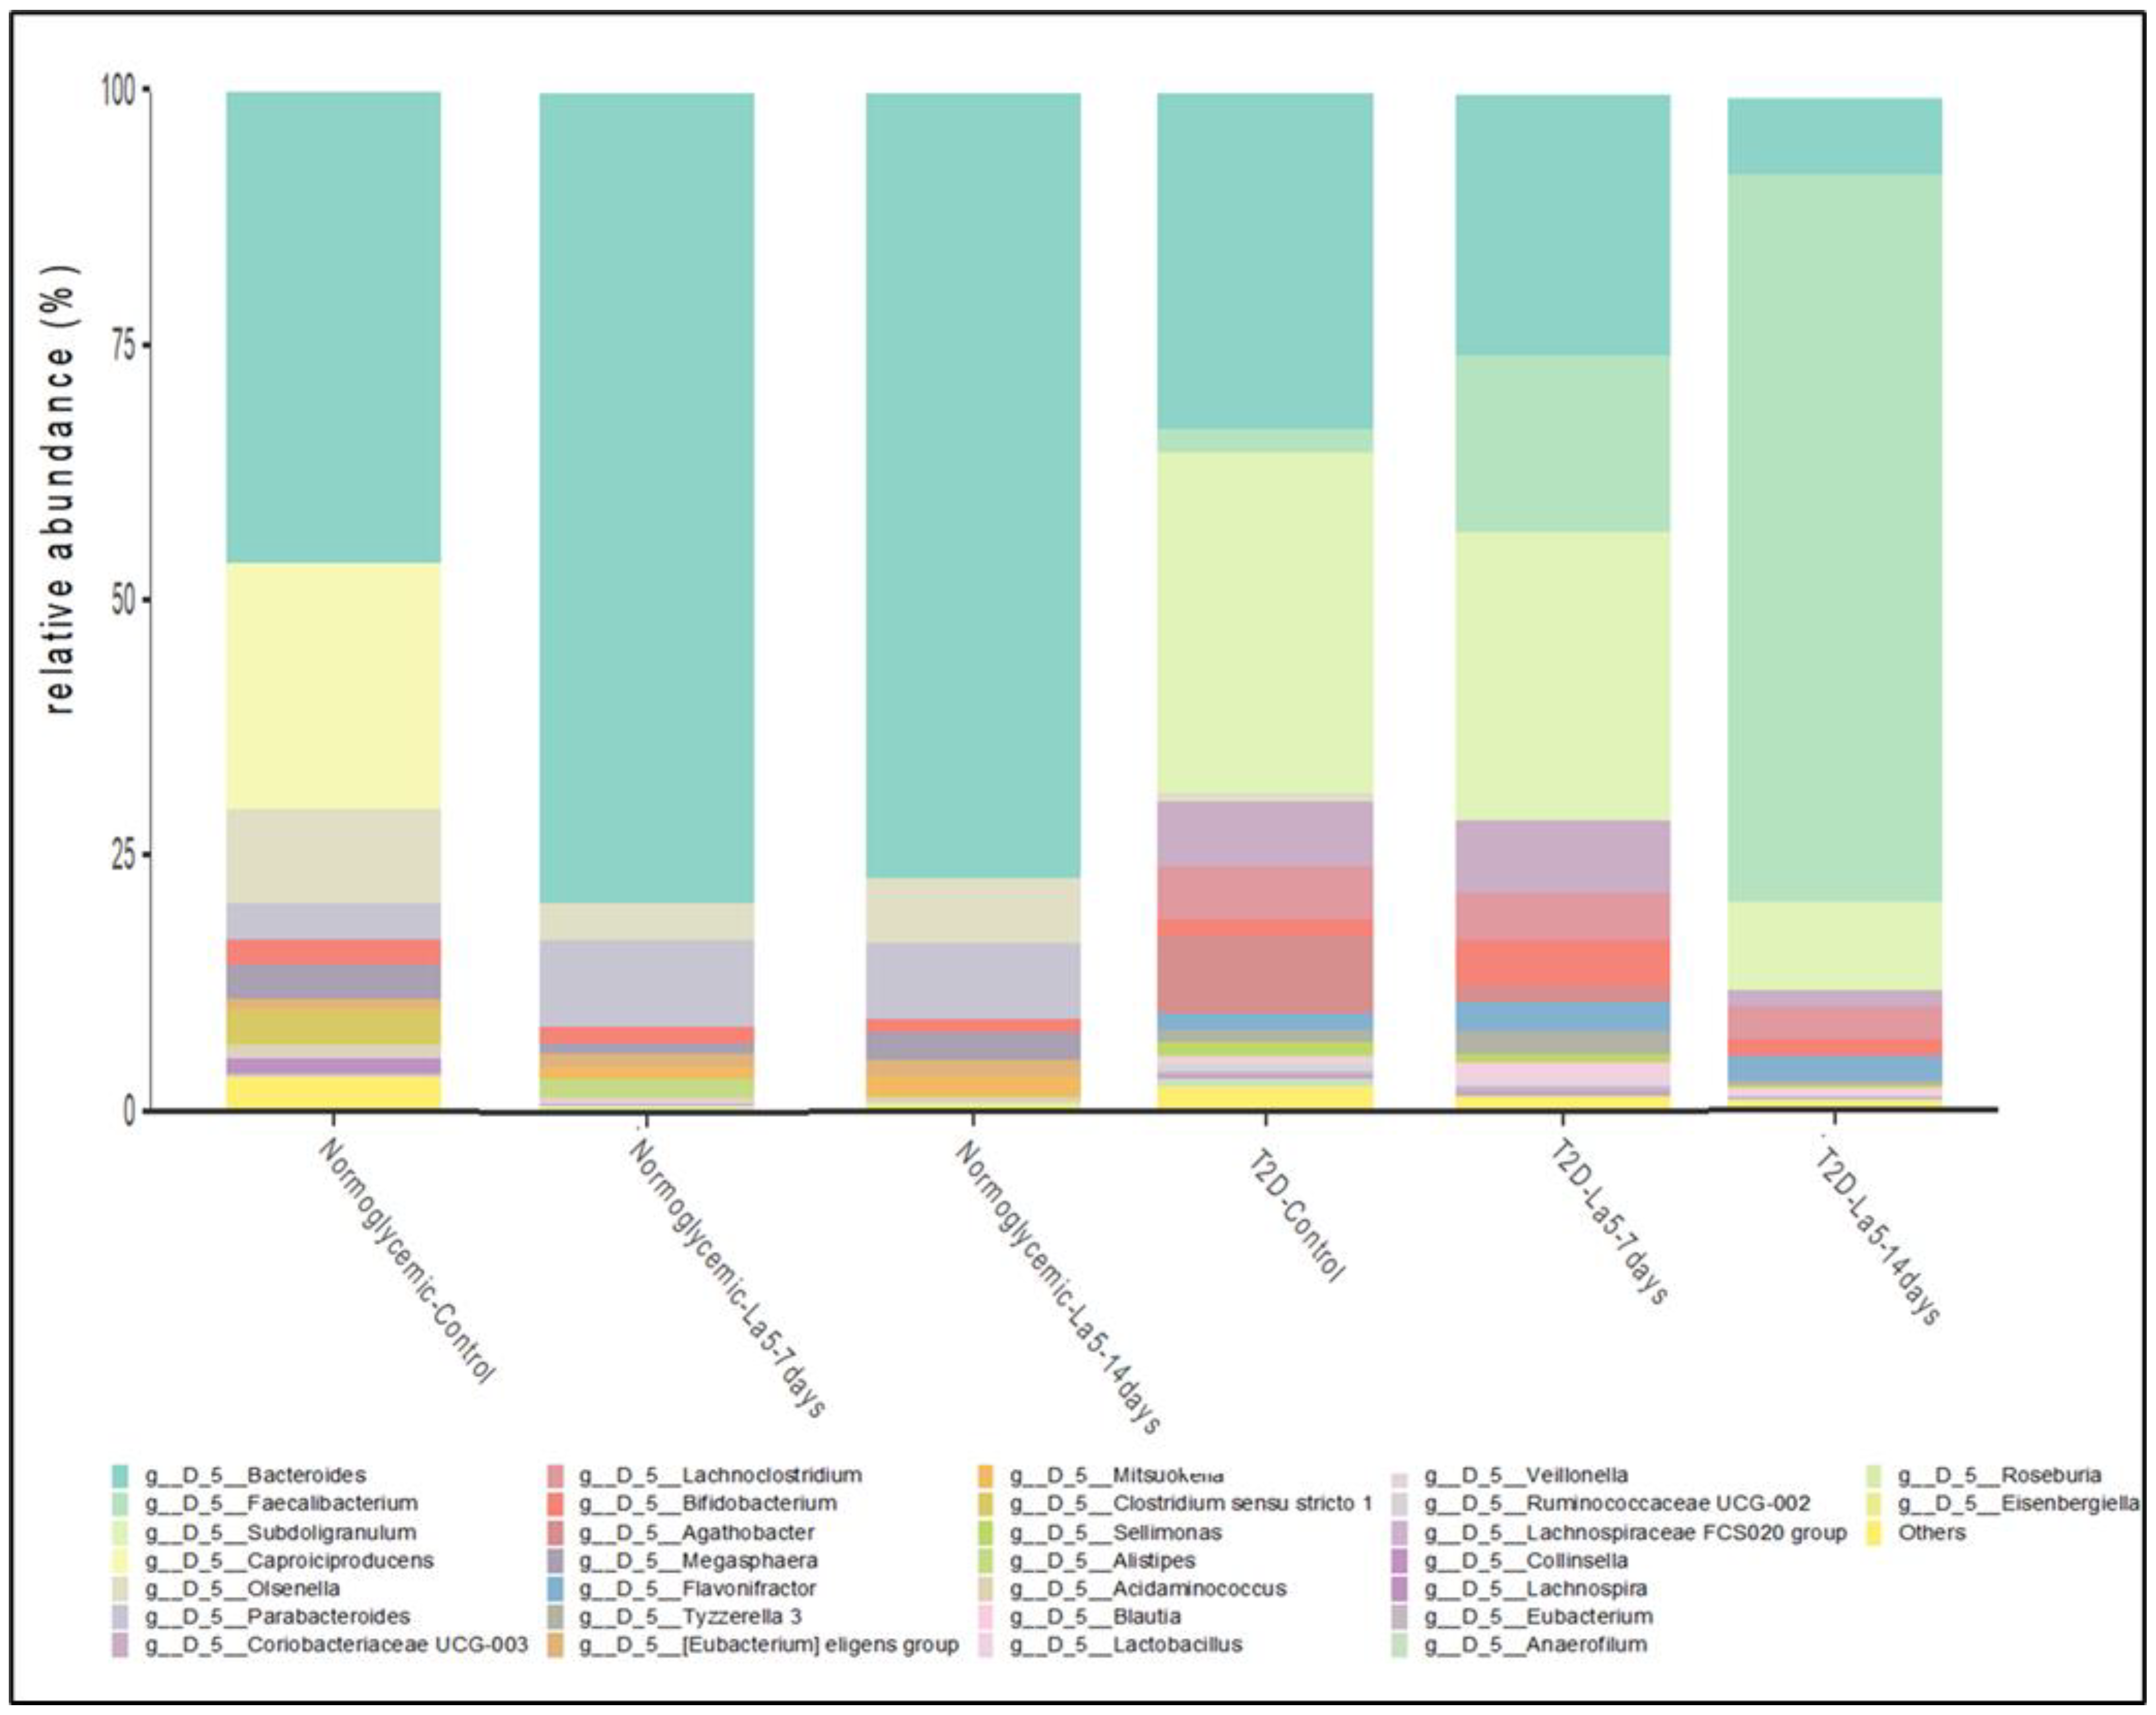
Regarding the analysis of relative abundance of the main genera (Figure 6), it is possible to observe an alteration in both groups studied; for the control group, after 7 days of treatment with La5, a significant increase (p > 0.001) in Bacteroides was observed. Regarding the diabetic group, it was clear that the modulation of the microbiota happened after 14 days of treatment with La5, where there was an increase in some important genera for the microbiota of type 2 diabetics, such as Faecalibacterium and Subdoligranulum.
Bacteroidetes is a complex phylum and the class Bacteroidia is composed of five families of bacteria (Bacteroidaceae, Marinilabiliaceae, Porphyromonadaceae, Prevotellaceae, and Rickenellaceae), each of which is commonly found in the human gut. Bacteroides is one of six genera in the highly diverse family Bacteroidaceae, composed of several species. Bacteroides spp. have a mutualistic relationship with the human host and play an important role in the fermentation of complex sugars, protein metabolism, and deconjugation of bile salts [71].
Another important genus stimulated with La5 treatment in the microbiota of healthy volunteers was Megasphaera spp., and it has been reported that this genus has the potential to produce metabolites such as short-chain fatty acids (butyrate, acetate, formate, and caproate), vitamins, and essential amino acids [72]. Interestingly, the genera Mitsuokella ssp. and Megasphaera ssp., which increased in abundance after La5 treatments, are recognized as butyrate producers and for contributing to the enhancement of anti-inflammatory and immune response [73].
In the microbiota of volunteers with type 2 diabetes, after 14 days of treatment with La5 a significant increase in butyrate-producing bacteria was observed, such as Subdoligranulum (p = 0.00043) and Faecalibacterium (p = 0.00043). These two genera presented potential anti-inflammatory effects both in vitro and in vivo [74,75]. These two genera help reduce bacterial translocation, enhance tight-junction protein expression, and stimulate mucin secretion, maintaining intestinal integrity [76].
Faecalibacterium prausnitzii, besides being an important butyrate producer, protects against inflammation in the gut [77], F. prausnitzii are commensal inhabitants of the human large intestine, with demonstrated anti-inflammatory properties in vivo [78]. Subdoligranulum, another genus found, belongs to the family Ruminococcaceae and is closely related to the genus Faecalibacterium. In fact, some studies have shown that treatment of obese and diabetic mice with prebiotics (oligofructose) increased the levels of A. muciniphila, but that the levels of Subdoligranulum also increased almost fourfold [79]. It was previously observed in obese humans that a subgroup of subjects with slight improvement in their metabolic parameters during caloric restriction had significantly lower abundance of both Akkermansia and Subdoligranulum than the subgroup with a better metabolic response to the caloric restriction intervention [80]. Interestingly, antidiabetic drugs such as metformin and acarbose increase the relative abundance of fecal Subdoligranulum [81,82]. In addition, the genus Subdoligranulum correlated negatively with glycated hemoglobin (HbA1c) and positively with HDL cholesterol [83]. In a study on some diseases, Subdoligranulum was also strongly associated with immune markers, including CD14 levels, related to chronic inflammation; one study showed that Subdoligranulum was closely related to immune markers and soluble sCD14 [84,85].
In this way, as already reported, a multitude of studies have demonstrated a significant association between changes in the compositional profile of the gut microbiota and the development of diabetes. In particular, disrupted eubiosis of the phylum Bacteroidetes/Firmicutes has been associated with increased intestinal permeability, with infiltration of bacterial byproducts across a permeable intestinal barrier triggering subsequent inflammatory responses characteristic of diabetes [86]. On the other hand, several bacteria have been shown to play a protective role, decreasing the risk of developing diabetes by reducing pro-inflammatory markers and maintaining the integrity of the intestinal barrier [83,84]. Therefore, Lactobacillus acidophilus—La5 has shown to be a promising strain in the adjuvant treatment of T2D [87].

4. Conclusions

This study using a dynamic colon model showed positive and hopeful results in modulating gut microbiota composition and metabolism using Lactobacillus acidophilus—La5 of healthy adults, and especially in dysbiosis (T2D). We reveal decreased production of ammonia ions and increased production of butyric acid, which is an important metabolite for glycemic control in the T2D group. Furthermore, the probiotic promotes a greater diversity of microorganisms present in the simulated intestinal lumen. Our research indicates promise for the use of the probiotic to promote the general improvement of the host as a whole.

Author Contributions

M.K.S. conducted the experiments at the Simulator of Human Intestinal Microbial Ecosystem (SHIME®), worked on conceptualization. F.L.d.O.: worked on conceptualization. M.P.A.M.: worked on conceptualization. V.M. performed the bioinformatics analysis. A.S. performed the SCFA analyses. K.S. was the main supervisor, responsible for the design, writing, and review of the final manuscript. All authors have read and agreed to the published version of the manuscript.

Funding

This work was carried out with the support of CAPES-Funding Code 001, FAPESP (2019/17794-6) and FAPESP (2015/18273-9).

Institutional Review Board Statement

The study was conducted in accordance with the Declaration of Helsinki, and approved by the Ethics Committee of São Paulo State University (UNESP) (CAAE:30156020.8.0000.5426) for studies involving humans.

Informed Consent Statement

Informed consent was obtained from all subjects involved in the study.

Data Availability Statement

All data generated by the current project are available upon request.

Conflicts of Interest

The authors declare no conflict of interest, and the funders had no role in the design of the study; in the collection, analyses, or interpretation of data; in the writing of the manuscript; or in the decision to publish the results.

References

  1. IDF Atlas, 9th ed.; International Diabetes Federation: Brussels, Belgium, 2019; Available online: https://www.diabetesatlas.org/en/resources/ (accessed on 10 May 2023).
  2. Control CfD, Prevention. National Diabetes Statistics Report, 2020; Centers for Disease Control and Prevention, US Department of Health and Human Services: Atlanta, GA, USA, 2020.
  3. Sekirov, I.; Russell, S.L.; Antunes, L.C.; Finlay, B.B. Gut microbiota in health and disease. Physiol. Rev. 2010, 90, 859–904. [Google Scholar] [CrossRef] [PubMed] [Green Version]
  4. Ley, R.E.; Turnbaugh, P.J.; Klein, S.; Gordon, J.I. Microbial ecology: Human gut microbes associated with obesity. Nature 2006, 444, 1022–1023. [Google Scholar] [CrossRef] [PubMed]
  5. Tilg, H.; Zmora, N.; Adolph, T.E.; Elinav, E. The intestinal microbiota fuelling metabolic inflammation. Nat. Rev. Immunol. 2020, 20, 40–54. [Google Scholar] [CrossRef]
  6. Gurung, M.; Li, Z.; You, H.; Rodrigues, R.; Jump, D.B.; Morgun, A.; Shulzhenko, N. Role of gut microbiota in type 2 diabetes pathophysiology. EBioMedicine 2020, 51, 102590. [Google Scholar] [CrossRef] [PubMed] [Green Version]
  7. Yang, F.; Wang, A.; Zeng, X.; Hou, C.; Liu, H.; Qiao, S. Lactobacillus reuteri I5007 modulates tight junction protein expression in IPEC-J2 cells with LPS stimulation and in newborn piglets under normal conditions. BMC Microbiol. 2015, 15, 32. [Google Scholar] [CrossRef] [Green Version]
  8. Di Luccia, B.; Manzo, N.; Baccigalupi, L.; Calabrò, V.; Crescenzi, E.; Ricca, E.; Pollice, A. Lactobacillus gasseri SF1183 affects intestinal epithelial cell survival and growth. PLoS ONE 2013, 8, e69102. [Google Scholar] [CrossRef] [PubMed] [Green Version]
  9. Wang, C.; Nagata, S.; Asahara, T.; Yuki, N.; Matsuda, K.; Tsuji, H.; Takahashi, T.; Nomoto, K.; Yamashiro, Y. Intestinal Microbiota Profiles of Healthy Pre-School and School-Age Children and Effects of Probiotic Supplementation. Ann. Nutr. Metab. 2015, 67, 257–266. [Google Scholar] [CrossRef]
  10. Matsuzaki, T.; Yamazaki, R.; Hashimoto, S.; Yokokura, T. Antidiabetic effects of an oral administration of Lactobacillus casei in a non-insulin-dependent diabetes mellitus (NIDDM) model using KK-Ay mice. Endocr. J. 1997, 44, 357–365. [Google Scholar] [CrossRef] [Green Version]
  11. Sato, J.; Kanazawa, A.; Ikeda, F.; Yoshihara, T.; Goto, H.; Abe, H.; Komiya, K.; Kawaguchi, M.; Shimizu, T.; Ogihara, T.; et al. Gut dysbiosis and detection of “live gut bacteria” in blood of Japanese patients with type 2 diabetes. Diabetes Care 2014, 37, 2343–2350. [Google Scholar] [CrossRef] [Green Version]
  12. Matsumoto, K.; Takada, T.; Shimizu, K.; Moriyama, K.; Kawakami, K.; Hirano, K.; Kajimoto, O.; Nomoto, K. Effects of a probiotic fermented milk beverage containing Lactobacillus casei strain Shirota on defecation frequency, intestinal microbiota, and the intestinal environment of healthy individuals with soft stools. J. Biosci. Bioeng. 2010, 110, 547–552. [Google Scholar] [CrossRef]
  13. Kerry, R.G.; Patra, J.K.; Gouda, S.; Park, Y.; Shin, H.S.; Das, G. Benefaction of probiotics for human health: A review. J. Food Drug Anal. 2018, 26, 927–939. [Google Scholar] [CrossRef]
  14. Cordeiro, B.F.; Alves, J.L.; Belo, G.A.; Oliveira, E.R.; Braga, M.P.; da Silva, S.H.; Lemos, L.; Guimarães, J.T.; Silva, R.; Rocha, R.S.; et al. Therapeutic Effects of Probiotic Minas Frescal Cheese on the Attenuation of Ulcerative Colitis in a Murine Model. Front. Microbiol. 2021, 12, 623920. [Google Scholar] [CrossRef]
  15. Moayyedi, P.; Ford, A.C.; Talley, N.J.; Cremonini, F.; Foxx-Orenstein, A.E.; Brandt, L.J.; Quigley, E.M. The efficacy of probiotics in the treatment of irritable bowel syndrome: A systematic review. Gut 2010, 59, 325–332. [Google Scholar] [CrossRef] [PubMed]
  16. Ondee, T.; Pongpirul, K.; Visitchanakun, P.; Saisorn, W.; Kanacharoen, S.; Wongsaroj, L.; Kullapanich, C.; Ngamwongsatit, N.; Settachaimongkon, S.; Somboonna, N.; et al. Lactobacillus acidophilus LA5 improves saturated fat-induced obesity mouse model through the enhanced intestinal Akkermansia muciniphila. Sci. Rep. 2021, 11, 6367. [Google Scholar] [CrossRef]
  17. Brasili, E.; Mengheri, E.; Tomassini, A.; Capuani, G.; Roselli, M.; Finamore, A.; Sciubba, F.; Marini, F.; Miccheli, A. Lactobacillus acidophilus La5 and Bifidobacterium lactis Bb12 induce different age-related metabolic profiles revealed by 1H-NMR spectroscopy in urine and feces of mice. J. Nutr. 2013, 143, 1549–1557. [Google Scholar] [CrossRef] [Green Version]
  18. Zarrati, M.; Shidfar, F.; Nourijelyani, K.; Mofid, V.; Hossein zadeh-Attar, M.J.; Bidad, K.; Najafi, F.; Gheflati, Z.; Chamari, M.; Salehi, E. Lactobacillus acidophilus La5, Bifidobacterium BB12, and Lactobacillus casei DN001 modulate gene expression of subset specific transcription factors and cytokines in peripheral blood mononuclear cells of obese and overweight people. Biofactors 2013, 39, 633–643. [Google Scholar] [CrossRef]
  19. Gao, Z.; Yin, J.; Zhang, J.; Ward, R.E.; Martin, R.J.; Lefevre, M.; Cefalu, W.T.; Ye, J. Butyrate improves insulin sensitivity and increases energy expenditure in mice. Diabetes 2009, 58, 1509–1517. [Google Scholar] [CrossRef] [PubMed] [Green Version]
  20. Lee, Y.; Siddiqui, W.J. Cholesterol Levels; StatPearls Publishing: St. Petersburg, FL, USA, 2022. [Google Scholar]
  21. Tonucci, L.B.; Olbrich, K.M.; Oliveira, L.L.; Ribeiro, S.M.R.; Martino, H.S.D. Clinical application of probiotics in type 2 diabetes mellitus: A randomized, double-blind, placebo-controlled study. Clin. Nutr. 2017, 36, 85–92. [Google Scholar] [CrossRef]
  22. Ejtahed, H.S.; Mohtadi-Nia, J.; Homayouni-Rad, A.; Niafar, M.; Asghari-Jafarabadi, M.; Mofid, V.; Akbarian-Moghari, A. Effect of probiotic yogurt containing Lactobacillus acidophilus and Bifidobacterium lactis on lipid profile in individuals with type 2 diabetes mellitus. J. Dairy Sci. 2011, 94, 3288–3294. [Google Scholar] [CrossRef]
  23. Pham, V.T.; Mohajeri, M.H. The application of in vitro human intestinal models on the screening and development of pre- and probiotics. Benef. Microbes 2018, 9, 725–742. [Google Scholar] [CrossRef] [PubMed]
  24. Bianchi, F.; Larsen, N.; de Mello Tieghi, T.; Adorno, M.A.T.; Kot, W.; Saad, S.M.I.; Jespersen, L.; Sivieri, K. Modulation of gut microbiota from obese individuals by in vitro fermentation of citrus pectin in combination with Bifidobacterium longum BB-46. Appl. Microbiol. Biotechnol. 2018, 102, 8827–8840. [Google Scholar] [CrossRef] [Green Version]
  25. Bianchi, F.; Rossi, E.A.; Sakamoto, I.K.; Adorno, M.A.T.; Van de Wiele, T.; Sivieri, K. Beneficial effects of fermented vegetal beverages on human gastrointestinal microbial ecosystem in a simulator. Food Res. Int. 2014, 64, 43–52. [Google Scholar] [CrossRef] [Green Version]
  26. Dostal, A.; Baumgartner, J.; Riesen, N.; Chassard, C.; Smuts, C.M.; Zimmermann, M.B.; Lacroix, C. Effects of iron supplementation on dominant bacterial groups on the gut, faecal SCFA and gut inflammation: Arandomised, placebo-controlled intervention trial in South African children. Br. J. Nutr. 2014, 112, 547–556. [Google Scholar] [CrossRef] [PubMed] [Green Version]
  27. Vinderola, C.G.; Prosello, W.; Ghiberto, T.D.; Reinheimer, J.A. Viability of probiotic (Bifidobacterium, Lactobacillus acidophilus and Lactobacillus casei) and nonprobiotic microflora in Argentinian Fresco cheese. JDS 2000, 83, 1905–1911. [Google Scholar] [CrossRef]
  28. Wang, Y.; Qian, P.Y. Conservative Fragments in Bacterial 16S rRNA Genes and Primer Design for 16S Ribosomal DNA Amplicons in Metagenomic Studies. PLoS ONE 2009, 4, e7401. [Google Scholar] [CrossRef] [Green Version]
  29. Caporaso, J.G.; Lauber, C.L.; Walters, W.A.; Berg-Lyons, D.; Lozupone, C.A.; Turnbaugh, P.J.; Fierer, N.; Knight, R. Global patterns of 16S rRNA diversity at a depth of millions of sequences per sample. Proc. Natl. Acad. Sci. USA 2011, 108 (Suppl. S1), 4516–4522. [Google Scholar] [CrossRef] [PubMed]
  30. Christoff, A.P.; Sereia, A.F.R.; Boberg, D.R. Bacterial Identification through Accurate Library Preparation and High-Throughput Sequencing; White Paper: Bacterial NGS Sequencing; Neoprospecta Microbiome Technologies: Florianopolis, Brazil, 2017. [Google Scholar]
  31. R Core Team. R: A Language and Environment for Statistical Computing; R Foundation for Statistical Compunting: Vienna, Austria, 2020; Available online: https://www.r-project.org (accessed on 17 January 2023).
  32. McMurdie, P.J.; Holmes, S.; Watson, M. phyloseq: An R package for reproducible interactive analysis and graphics of microbiome census data. PLoS ONE 2013, 8, e61217. [Google Scholar] [CrossRef] [Green Version]
  33. Fierer, N.; Lauber, C.L.; Zhou, N.; McDonald, D.; Costello, E.K.; Knight, R. Forensic identification using skin bacterial communities. Proc. Natl. Acad. Sci. USA 2010, 107, 6477–6481. [Google Scholar] [CrossRef]
  34. Benjamini, Y.; Drai, D.; Elmer, G.; Kafkafi, N.; Golani, I. Controlling the false discovery rate in behavior genetics research. Behav. Brain Res. 2001, 125, 279–284. [Google Scholar] [CrossRef] [PubMed] [Green Version]
  35. FAO/WHO. Guidelines for the Evaluation of Probiotics in Food; Report of a Joint FAO/WHO Working Group on Drafting Guidelines for the Evaluation of Probiotics on Food; World Health Organization: Geneva, Switzerland; Food and Agriculture Organization of the United Nations: London, ON, Canada, 2002.
  36. Park, M.K.; Lee, S.; Kim, Y.S. Effects of pH and Osmotic Changes on the Metabolic Expressions of Bacillus subtilis Strain 168 in Metabolite Pathways including Leucine Metabolism. Metabolites 2022, 12, 112. [Google Scholar] [CrossRef]
  37. Priya, A.J.; Vijayalakshmi, S.P.; Raichur, A.M. Enhanced survival of probiotic Lactobacillus acidophilus by encapsulation with nanostructured polyelectrolyte layers through layer-by-layer approach. J. Agric. Food Chem. 2011, 59, 11838–11845. [Google Scholar] [CrossRef] [PubMed]
  38. Wu, L.; Tang, Z.; Chen, H.; Ren, Z.; Ding, Q.; Liang, K.; Sun, Z. Mutual interaction between gut microbiota and protein/amino acid metabolism for host mucosal immunity and health. Anim. Nutr. 2021, 7, 11–16. [Google Scholar] [CrossRef] [PubMed]
  39. Duff, C.; Baruteau, J. Modelling urea cycle disorders using iPSCs. npj Regen. Med. 2022, 7, 56. [Google Scholar] [CrossRef]
  40. Scott, K.P.; Gratz, S.W.; Sheridan, P.O.; Flint, H.J.; Duncan, S.H. The influence of diet on the gut microbiota. Pharmacol. Res. 2013, 69, 52–60. [Google Scholar] [CrossRef]
  41. Davila, A.M.; Blachier, F.; Gotteland, M.; Andriamihaja, M.; Benetti, P.H.; Sanz, Y.; Tomé, D. Intestinal luminal nitrogen metabolism: Role of the gut microbiota and consequences for the host. Pharmacol. Res. 2013, 68, 95–107. [Google Scholar] [CrossRef]
  42. Hughes, R.; Kurth, M.J.; McGilligan, V.; McGlynn, H.; Rowland, I. Effect of colonic bacterial metabolites on Caco-2 cell paracellular permeability in vitro. Nutr. Cancer 2008, 60, 259–266. [Google Scholar] [CrossRef]
  43. He, X.; Parenti, M.; Grip, T.; Lönnerdal, B.; Timby, N.; Domellöf, M.; Hernell, O.; Slupsky, C.M. Fecal microbiome and metabolome of infants fed bovine MFGM supplemented formula or standard formula with breast-fed infants as reference: A randomized controlled trial. Sci. Rep. 2019, 9, 11589. [Google Scholar] [CrossRef] [Green Version]
  44. Mohiuddin, S.S.; Khattar, D. Biochemistry, Ammonia; StatPearls Publishing: Treasure Island, FL, USA, 2020. [Google Scholar]
  45. Kalaitzakis, E.; Olsson, R.; Henfridsson, P.; Hugosson, I.; Bengtsson, M.; Jalan, R.; Björnsson, E. Malnutrition and diabetes mellitus are related to hepatic encephalopathy in patients with liver cirrhosis. Liver Int. 2007, 27, 1194–1201. [Google Scholar] [CrossRef] [PubMed]
  46. Yu, P.H.; Zuo, D.M. Oxidative deamination of methylamine by semicarbazide-sensitive amino oxidase leads to cytotoxic damage in endothelial cells. Diabetes 1993, 42, 594–603. [Google Scholar] [CrossRef]
  47. D’Alessandro, A.; Lolla, L. Proteomic analysis of red blood cells and the potential for the clinic: What have we learned so far? Expert Rev. Proteom. 2017, 14, 243–252. [Google Scholar] [CrossRef]
  48. Li, J.J.; Voisin, D.; Quiquerez, A.L.; Bouras, C. Differential expression of advanced glycosylation end-products in neurons of different species. Brain Res. 1994, 641, 285–288. [Google Scholar] [CrossRef]
  49. Low, S.Y.; Taylor, P.M.; Hundal, H.S.; Pogson, C.I.; Rennie, M.J. Transport of L-glutamine and L-glutamate across sinusoidal membranes of rat liver. Biochem. J. 1992, 284 Pt 2, 333–340. [Google Scholar] [CrossRef] [PubMed] [Green Version]
  50. Ruppin, H.; Bar-Meir, S.; Soergel, K.H.; Wood, C.M.; Schmitt, M.G., Jr. Absorption of short-chain fatty acids by the colon. Gastroenterology 1980, 78, 1500–1507. [Google Scholar] [CrossRef] [PubMed]
  51. Topping, D.L.; Clifton, P.M. Short-Chain Fatty Acids and Human Colonic Function: Roles of Resistant Starch and Nonstarch Polysaccharides. Physiol. Rev. 2001, 81, 1031–1064. [Google Scholar] [CrossRef] [Green Version]
  52. Miller, S.J. Cellular and physiological effects of short-chain fatty acids. Mini. Rev. Med. Chem. 2004, 4, 839–845. [Google Scholar] [CrossRef]
  53. Wang, L.; Cen, S.; Wang, G.; Lee, Y.K.; Zhao, J.; Zhang, H.; Chen, W. Acetic acid and butyric acid released in large intestine play different roles in the alleviation of constipation. J. Funct. Foods 2020, 69, 103953. [Google Scholar] [CrossRef]
  54. Schroeder, B.O.; Bäckhed, F. Biological effects of propionic acid in humans; metabolism, potential applications and underlying mechanisms. Biochim. Biophys. Acta 2010, 1801, 1175–1183. [Google Scholar]
  55. McNeil, N.I. The contribution of the large intestine to energy supplies in man. Am. J. Clin. Nutr. 1984, 39, 338–342. [Google Scholar]
  56. Wong, J.M.W.; de Souza, R.; Kendall, C.W.C.; Emam, A.; Jenkins, D.J.A. Colonic Health: Fermentation and Short Chain Fatty Acids. J. Clin. Gastroenterol. 2006, 40, 235–243. [Google Scholar] [CrossRef]
  57. Cummings, J.H.; Pomare, E.W.; Branch, W.J.; Naylor, C.P.; Macfarlane, G.T. Short chain fatty acids in human large intestine, portal, hepatic and venous blood. Gut 1987, 28, 1221–1227. [Google Scholar] [CrossRef] [Green Version]
  58. Fellows, R.; Denizot, J.; Stellato, C.; Cuomo, A.; Jain, P.; Stoyanova, E.; Balázsi, S.; Hajnády, Z.; Liebert, A.; Kazakevych, J.; et al. Microbiota derived short chain fatty acids promote histone crotonylation in the colon through histone deacetylases. Nat. Commun. 2018, 9, 105. [Google Scholar] [CrossRef] [Green Version]
  59. Huang, W.; Zhou, L.; Guo, H.; Xu, Y.; Xu, Y. The role of short-chain fatty acids in kidney injury induced by gut-derived inflammatory response. Metabolism 2017, 68, 20–30. [Google Scholar] [CrossRef] [PubMed]
  60. Li, L.-Z.; Tao, S.-B.; Ma, L.; Fu, P. Roles of short-chain fatty acids in kidney diseases. Chin. Med. J. 2019, 132, 1228–1232. [Google Scholar] [CrossRef]
  61. Lin, H.; Frassetto, A.; Kowalik, E.J., Jr.; Nawrocki, A.R.; Lu, M.M.; Kosinski, J.R.; Hubert, J.A.; Szeto, D.; Yao, X.; Forrest, G.; et al. Butyrate and Propionate Protect against Diet-Induced Obesity and Regulate Gut Hormones via Free Fatty Acid Receptor 3-Independent Mechanisms. PLoS ONE 2012, 7, e35240. [Google Scholar] [CrossRef] [PubMed] [Green Version]
  62. Lu, Z. Research progress in intestinal microbiota and type 2 diabetes mellitus. Chin. J. Microecol. 2019, 31, 866–868. [Google Scholar]
  63. Scheithauer, T.P.M.; Rampanelli, E.; Nieuwdorp, M.; Vallance, B.A.; Verchere, C.B.; van Raalte, D.H.; Herrema, H. Gut Microbiota as a Trigger for Metabolic Inflammation in Obesity and Type 2 Diabetes. Front. Immunol. 2020, 16, 571731. [Google Scholar] [CrossRef]
  64. Knip, M. The role of the intestinal microbiota in type 1 diabetes mellitus. Nat. Rev. Endocrinol 2016, 12, 54–67. [Google Scholar] [CrossRef]
  65. Leite, A.Z.; Rodrigues, N.C.; Gonzaga, M.I.; Paiolo, J.C.C.; de Souza, C.A.; Stefanutto, N.A.V.; Omori, W.P.; Pinheiro, D.G.; Brisotti, J.L.; Matheucci Junior, E.; et al. Detection of Increased Plasma Interleukin-6 Levels and Prevalence of Prevotella copri and Bacteroides vulgatus in the Feces of Type 2 Diabetes Patients. Front. Immunol. 2017, 15, 1107. [Google Scholar] [CrossRef] [Green Version]
  66. Plassais, J.; Gbikpi-Benissan, G.; Figarol, M.; Scheperjans, F.; Gorochov, G.; Derkinderen, P.; Cervino, A.C.L. Gut microbiome alpha-diversity is not a marker of Parkinson’s disease and multiple sclerosis. Brain Commun. 2021, 3, fcab113. [Google Scholar] [CrossRef]
  67. Fernandes, R.; Viana, S.D.; Nunes, S.; Reis, F. Diabetic gut microbiota dysbiosis as an inflammaging and immunosenescence condition that fosters progression of retinopathy and nephropathy. Biochim. Biophys. Acta Mol. Basis. Dis. 2019, 1865, 1876–1897. [Google Scholar] [CrossRef]
  68. Lee, C.B.; Chae, S.U.; Jo, S.J.; Jerng, U.M.; Bae, S.K. The Relationship between the Gut Microbiome and Metformin as a Key for Treating Type 2 Diabetes Mellitus. Int. J. Mol. Sci. 2021, 22, 3566. [Google Scholar] [CrossRef]
  69. Sabatino, A.; Regolisti, G.; Cosola, C.; Gesualdo, L.; Fiaccadori, E. Intestinal Microbiota in Type 2 Diabetes and Chronic Kidney Disease. Curr. Diabetes Rep. 2017, 17, 16. [Google Scholar] [CrossRef]
  70. Lippert, K.; Kedenko, L.; Antonielli, L.; Kedenko, I.; Gemeier, C.; Leitner, M.; Kautzky-Willer, A.; Paulweber, B.; Hackl, E. Gut microbiota dysbiosis associated with glucose metabolism disorders and the metabolic syndrome in older adults. Benef. Microbes 2017, 8, 545–556. [Google Scholar] [CrossRef] [PubMed]
  71. Plummer, E.; Bulach, D.; Carter, G.; Albert, M.J. Gut microbiome of native Arab Kuwaitis. Gut Pathog. 2020, 26, 10. [Google Scholar] [CrossRef]
  72. Shetty, S.A.; Marathe, N.P.; Lanjekar, V.; Ranade, D.; Shouche, Y.S. Comparative genome analysis of Megasphaera sp. reveals niche specialization and its potential role in the human gut. PLoS ONE. 2013, 18, e79353. [Google Scholar] [CrossRef] [Green Version]
  73. Shivaji, S. A systematic review of gut microbiome and ocular inflammatory diseases: Are they associated? Indian J. Ophthalmol. 2021, 69, 535–542. [Google Scholar] [CrossRef] [PubMed]
  74. Zhou, L.; Zhang, M.; Wang, Y.; Dorfman, R.G.; Liu, H.; Yu, T.; Chen, X.; Tang, D.; Xu, L.; Yin, Y.; et al. Faecalibacterium prausnitzii Produces Butyrate to Maintain Th17/Treg Balance and to Ameliorate Colorectal Colitis by Inhibiting Histone Deacetylase 1. Inflamm. Bowel Dis. 2018, 24, 1926–1940. [Google Scholar] [CrossRef] [PubMed] [Green Version]
  75. De Andrés, J.; Manzano, S.; García, C.; Rodríguez, J.M.; Espinosa-Martos, I.; Jiménez, E. Modulatory effect of three probiotic strains on infants’ gut microbial composition and immunological parameters on a placebo-controlled, double-blind, randomised study. Benef. Microbes 2018, 9, 573–584. [Google Scholar] [CrossRef]
  76. Van den Abbeele, P.; Belzer, C.; Goossens, M.; Kleerebezem, M.; De Vos, W.M.; Thas, O.; De Weirdt, R.; Kerckhof, F.M.; Van de Wiele, T. Butyrate-producing Clostridium cluster XIVa species specifically colonize mucins in an in vitro gut model. ISME J. 2013, 7, 949–961. [Google Scholar] [CrossRef] [Green Version]
  77. Blatchford, P.; Stoklosinski, H.; Eady, S.; Wallace, A.; Butts, C.; Gearry, R.; Gibson, G.; Ansell, J. Consumption of kiwifruit capsules increases Faecalibacterium prausnitzii abundance in functionally constipated individuals: A randomised controlled human trial. J. Nutr. Sci. 2017, 6, e52. [Google Scholar] [CrossRef] [Green Version]
  78. Sokol, H.; Seksik, P.; Furet, J.P.; Firmesse, O.; Nion-Larmurier, I.; Beaugerie, L.; Cosnes, J.; Corthier, G.; Marteau, P.; Doré, J. Low counts of Faecalibacterium prausnitzii in colitis microbiota. Inflamm. Bowel Dis. 2009, 15, 1183–1189. [Google Scholar] [CrossRef]
  79. Everard, A.; Lazarevic, V.; Derrien, M.; Girard, M.; Muccioli, G.G.; Neyrinck, A.M.; Possemiers, S.; Van Holle, A.; François, P.; de Vos, W.M.; et al. Responses of gut microbiota and glucose and lipid metabolism to prebiotics in genetic obese and diet-induced leptin-resistant mice. Diabetes 2011, 60, 2775–2786. [Google Scholar] [CrossRef] [PubMed] [Green Version]
  80. Dao, M.C.; Everard, A.; Aron-Wisnewsky, J.; Sokolovska, N.; Prifti, E.; Verger, E.O.; Kayser, B.D.; Levenez, F.; Chilloux, J.; Hoyles, L.; et al. Akkermansia muciniphila and improved metabolic health during a dietary intervention in obesity: Relationship with gut microbiome richness and ecology. Gut 2016, 65, 426–436. [Google Scholar] [CrossRef] [Green Version]
  81. Forslund, K.; Hildebrand, F.; Nielsen, T.; Falony, G.; Le Chatelier, E.; Sunagawa, S.; Prifti, E.; Vieira-Silva, S.; Gudmundsdottir, V.; Pedersen, H.K.; et al. Disentangling type 2 diabetes and metformin treatment signatures in the human gut microbiota. Nature 2015, 528, 262–266. [Google Scholar] [CrossRef] [PubMed] [Green Version]
  82. Zhang, X.; Fang, Z.; Zhang, C.; Xia, H.; Jie, Z.; Han, X.; Chen, Y.; Ji, L. Effects of Acarbose on the Gut Microbiota of Prediabetic Patients: A Randomized, Double-blind, Controlled Crossover Trial. Diabetes Ther. 2017, 8, 293–307. [Google Scholar] [CrossRef] [PubMed] [Green Version]
  83. Leclercq, S.; Matamoros, S.; Cani, P.D.; Neyrinck, A.M.; Jamar, F.; Stärkel, P.; Windey, K.; Tremaroli, V.; Bäckhed, F.; Verbeke, K.; et al. Intestinal permeability, gut-bacterial dysbiosis, and behavioral markers of alcohol-dependence severity. Proc. Natl. Acad. Sci. USA 2014, 111, E4485–E4493. [Google Scholar] [CrossRef]
  84. Abusleme, L.; Dupuy, A.K.; Dutzan, N.; Silva, N.; Burleson, J.A.; Strausbaugh, L.D.; Gamonal, J.; Diaz, P.I. The subgingival microbiome in health and periodontitis and its relationship with community biomass and inflammation. ISME J. 2013, 7, 1016–1025. [Google Scholar] [CrossRef] [Green Version]
  85. Shi, T.T.; Xin, Z.; Hua, L.; Wang, H.; Zhao, R.X.; Yang, Y.L.; Xie, R.R.; Liu, H.Y.; Yang, J.K. Comparative assessment of gut microbial composition and function in patients with Graves’ disease and Graves’ orbitopathy. J. Endocrinol. Investig. 2021, 44, 297–310. [Google Scholar] [CrossRef]
  86. Iatcu, C.O.; Steen, A.; Covasa, M. Gut Microbiota and Complications of Type-2 Diabetes. Nutrients 2021, 14, 166. [Google Scholar] [CrossRef]
  87. Kunasegaran, T.; Balasubramaniam, V.R.M.T.; Arasoo, V.J.T.; Palanisamy, U.D.; Ramadas, A. The Modulation of Gut Microbiota Composition in the Pathophysiology of Gestational Diabetes Mellitus: A Systematic Review. Biology 2021, 10, 1027. [Google Scholar] [CrossRef] [PubMed]
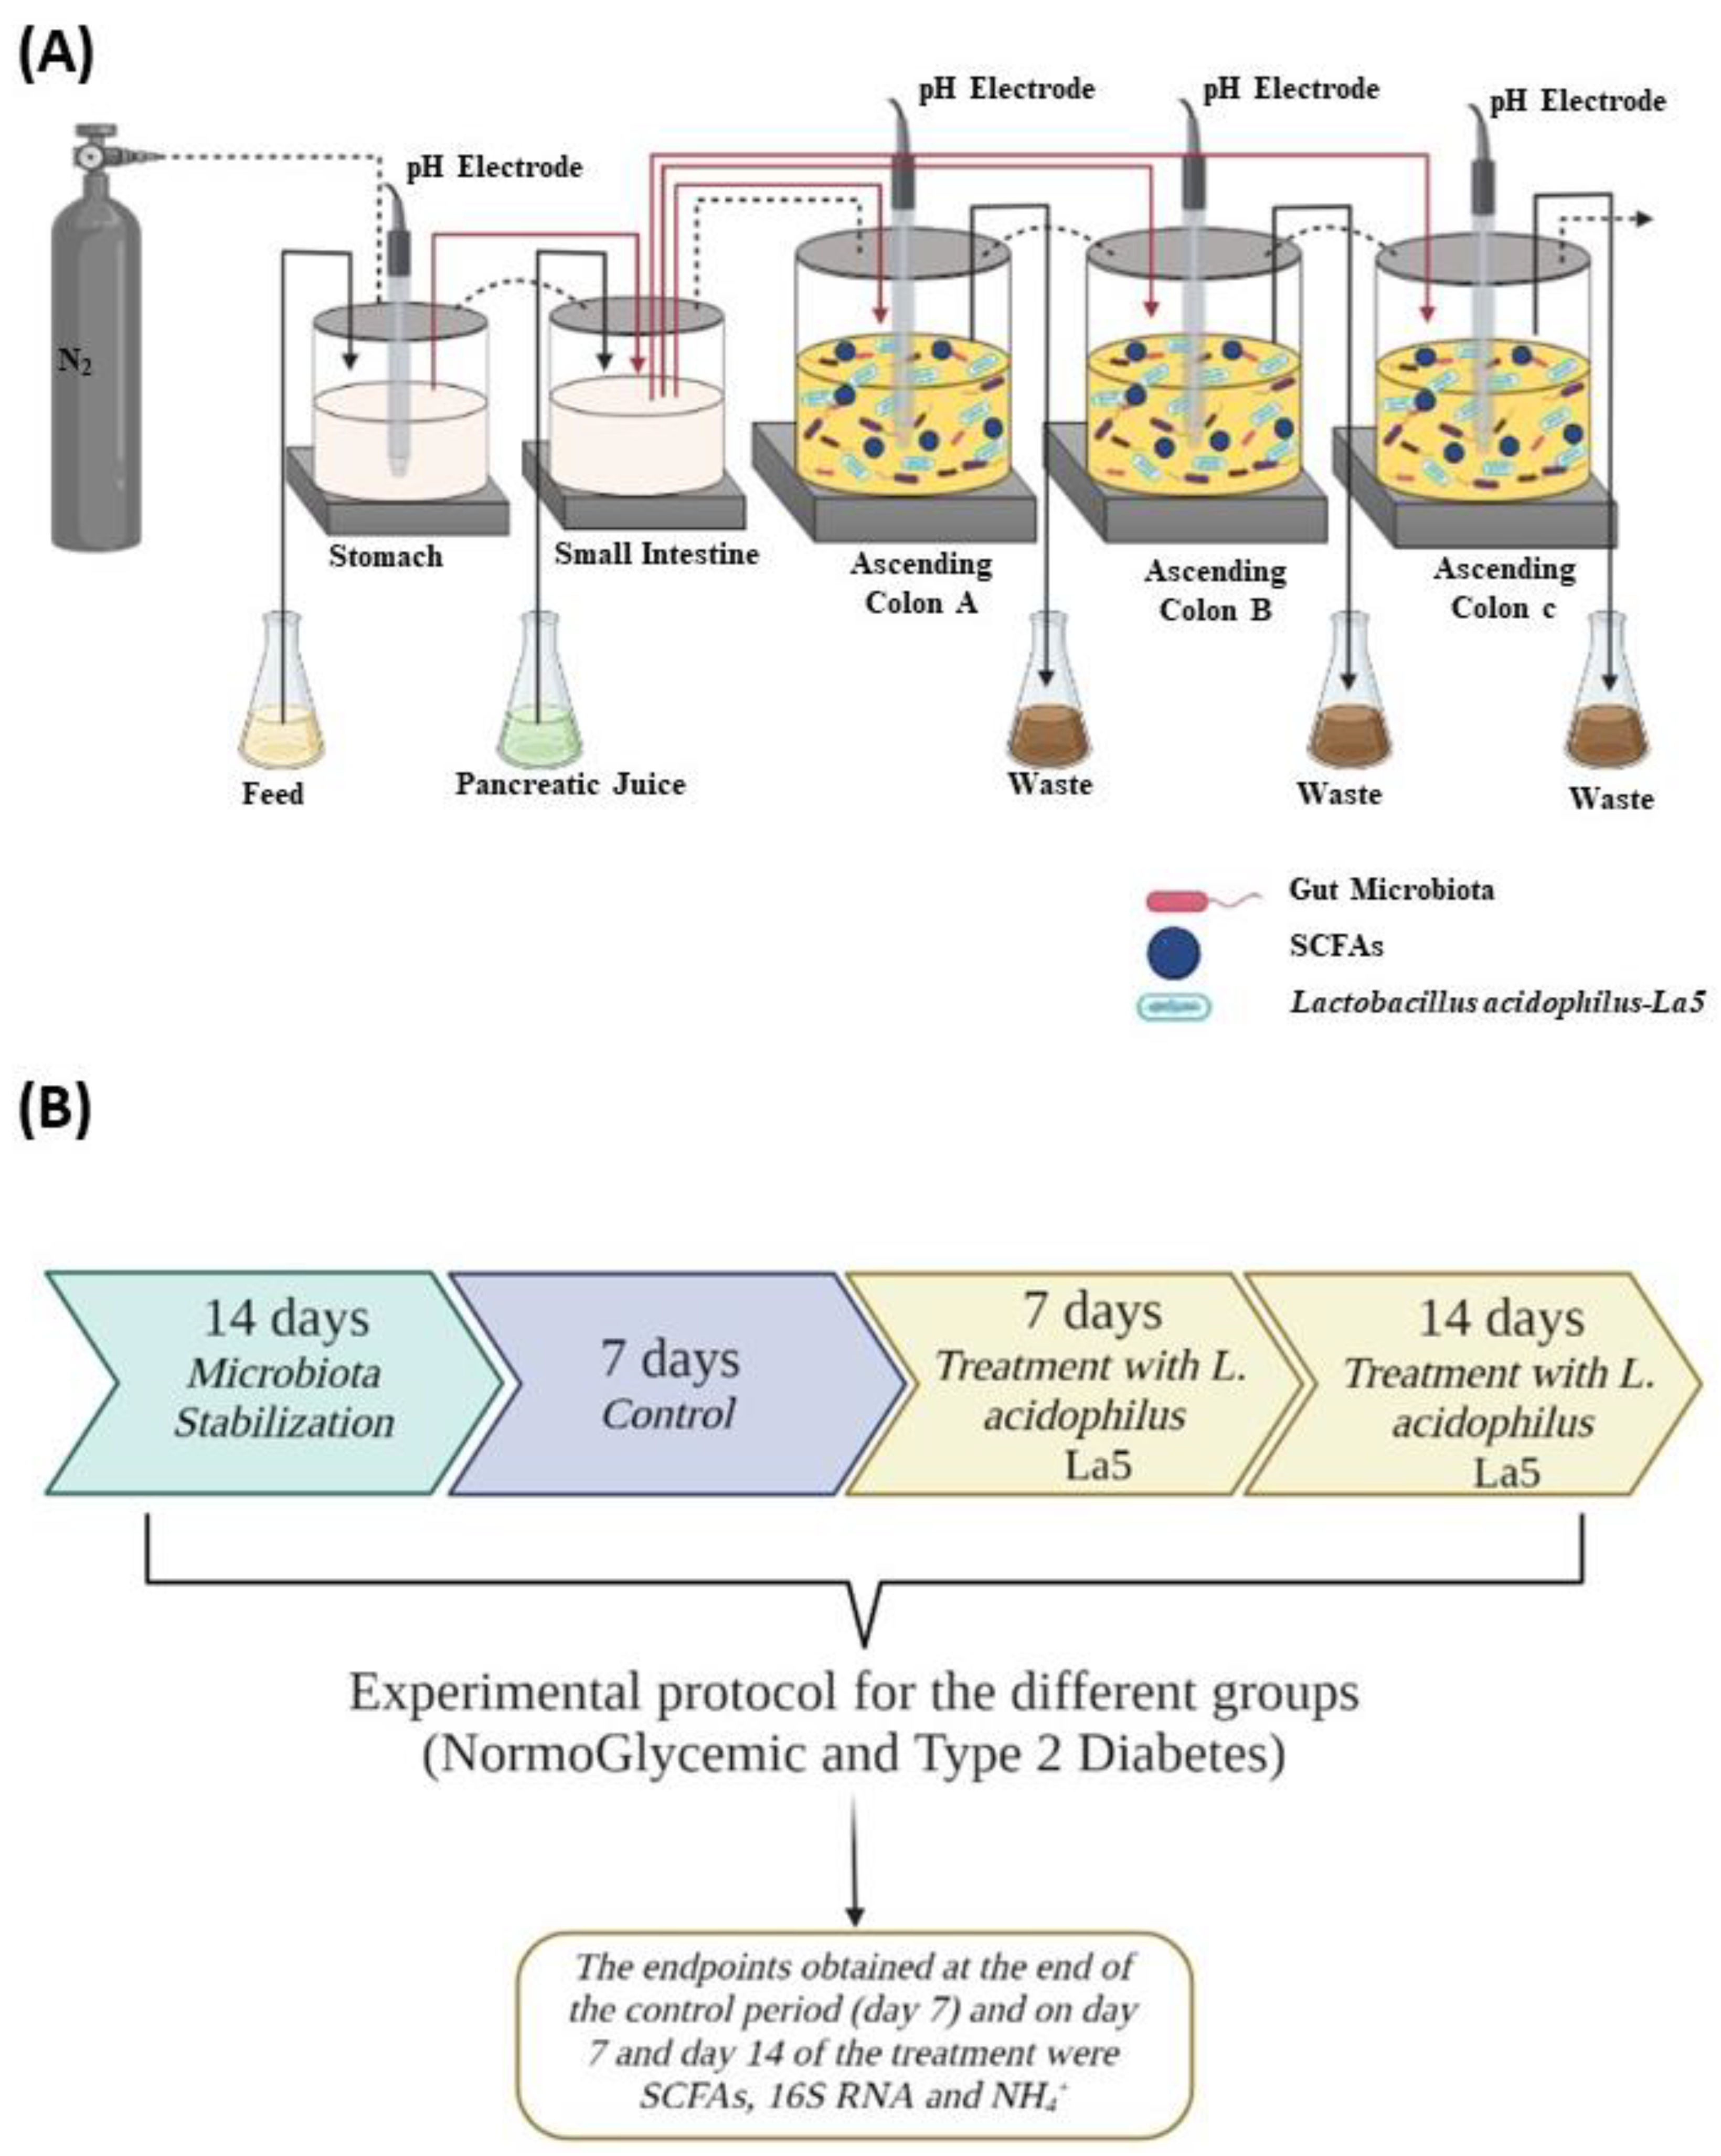
Figure 1. Illustration of the experimental protocol in Type 2 Diabetes and NormoGlycemic groups. (A) Simulator of the Human Intestinal Microbial Ecosystem (SHIME®). (B) Experimental protocol for the different treatments, and the main endpoints.
Fermentation 09 00740 g001
Figure 2. PCoA plots of beta diversity with Bray-Curtis dissimilarity measure, in the microbiota of healthy and type 2 diabetic subjects in the SHIME® colons. NormoGlycemic Group: NormoGlycemic-Control: Control period, NormoGlycemic-La 5–7 Days: treatment for 7 days with L. acidophilus-La5, NormoGlycemic-La 5–14 Days: treatment for 14 days with L. acidophilus-La5. Type 2 Diabetics Group (T2D): T2D-Control: Control Period, T2D-La 5–7 Days: Treatment during 7 days with L. acidophilus-La5, T2D-La 5–14 Days: Treatment during 14 days with L. acidophilus-La5.
Fermentation 09 00740 g002
Figure 3. Plots of PCoA with weighted and unweighted UniFrac metrics with Bonferroni correction, microbiota from healthy and type 2 diabetic subjects in the SHIME® colons. NormoGlycemic Group: NormoGlycemic-Control: Control period, NormoGlycemic-La 5–7 Days: treatment for 7 days with L. acidophilus-La5, NormoGlycemic-La 5–14 Days: treatment for 14 days with L. acidophilus-La5. Type 2 Diabetics Group (T2D): T2D-Control: Control Period, T2D-La 5–7 Days: Treatment during 7 days with L. acidophilus-La5, T2D-La 5–14 Days: Treatment during 14 days with L. acidophilus-La5.
Fermentation 09 00740 g003
Figure 4. Relative abundance of microbiota phyla from healthy and type 2 diabetic subjects in the SHIME® colons. NormoGlycemic Group: NormoGlycemic-Control: Control period, NormoGlycemic-La 5–7 Days: treatment for 7 days with L. acidophilus-La5, NormoGlycemic-La 5–14 Days: treatment for 14 days with L. acidophilus-La5. Type 2 Diabetics Group (T2D): T2D-Control: Control Period, T2D-La 5–7 Days: Treatment during 7 days with L. acidophilus-La5, T2D-La 5–14 Days: Treatment during 14 days with L. acidophilus-La5.
Fermentation 09 00740 g004
Figure 5. Firmicutes and Bacteroidetes filament relationships of the microbiota of healthy and type 2 diabetic individuals in the colons of SHIME®. Control group (NormoGlycemic): NormoGlycemic-Control: Control period, NormoGlycemic-La 5–7 Days: treatment for 7 days with L. acidophilus-La5, NormoGlycemic-La 5–14 Days: treatment for 14 days with L. acidophilus-La5. Type 2 Diabetics Group (T2D): T2D-Control: Control Period, T2D-La 5–7 Days: Treatment during 7 days with L. acidophilus-La-5, T2D-La 5–14 Days: Treatment during 14 days with L. acidophilus-La5.
Fermentation 09 00740 g005
Figure 6. Relative abundance of microbiota genera from healthy and type 2 diabetic subjects in the colons of SHIME®. Control group (NormoGlycemic): NormoGlycemic-Control: Control period, NormoGlycemic-La 5–7 Days: treatment for 7 days with L. acidophilus—La5, NormoGlycemic-La 5–14 Days: treatment for 14 days with L. acidophilus—La5. Type 2 Diabetics Group (T2D): T2D-Control: Control Period, T2D-La 5–7 Days: Treatment during 7 days with L. acidophilus—La5, T2D-La 5–14 Days: Treatment during 14 days with L. acidophilus—La5.
Fermentation 09 00740 g006
Table 1. Population (log CFU/mL) and survival rate (%) of Lactobacillus acidophilus—La5 under simulated gastrointestinal conditions.
NormoGlycemicType 2 Diabetes
Initial Time7.98 a ± 0.088.34 a ± 0.07
Gastric phase4.34 b ± 0.034.54 b ± 0.06
Enteric phase4.18 b ± 0.054.97 b ± 0.04
Lactobacillus acidophilus—La5. Initial time = 0 h; Gastric phase = 2 h; Enteric phase I = 4 h, simulated in SHIME®. a, b Different lower-case letters on the same line indicate a statistical difference according to Tukey’s post-test (p < 0.05). Data are presented as mean ± SD (n = 3).
Table 2. Ammonium ion production (mmol/L) by microbiota from healthy subjects and subjects with type 2 diabetes during all experiments in SHIME®. Period of control and treatment with La5 in both groups.
NormoGlycemic-GroupType 2 Diabetic Group
Control529.33 ± 47.64 a491.67 ± 2.52 a
La 5–7 Days255.33 ± 37.81 b222.00 ± 2.65 b
La 5–14 Days246.02 ± 40.70 b201.67 ± 3.22 c
a, b, c different letters indicate a statistical difference (p < 0.01).
Table 3. Short-chain fatty acid production (mmol/L) by microbiota from the NormoGlycemic Group and Type 2 Diabetics Group during all experiments in SHIME®. Period of control and treatment with La5 in both groups.
(mmol/L)
Acetic AcidPropionic AcidButyric Acid
NormoGlycemic GroupNormoGlycemic-Control22.42 ± 0.96 b7.15 ± 0.69 b12.00 ± 3.49 a
NormoGlycemic-La 5–7 Days13.57 ± 1.30 c4.91 ± 0.15 c6.48 ± 1.03 b
NormoGlycemic-La 5–14 Days24.71 ± 1.79 a9.25 ± 1.31 a8.78 ± 1.35 a
Type 2 Diabetics GroupT2D-Control39.59 ± 3.31 a5.73 ± 0.51 a4.08 ± 1.30 c
T2D-La 5–7 Days21.91 ± 1.25 b2.15 ± 0.20 b4.90 ± 0.31 b
T2D-La 5–14 Days20.94 ± 0.65 b2.26 ± 0.20 b8.56± 0.12 a
a, b, c Different letters indicate a statistical difference (p < 0.01) in the same column.
Table 4. Values of alpha-diversity microbiota from the NormoGlycemic Group and Type 2 Diabetics Group in the ascending colons vessels of the SHIME®.
Chao1Shannon
NormoGlycemic Group NormoGlycemic-Control53.002.38
NormoGlycemic-La 5–7 Days50.002.41
NormoGlycemic-La 5–14 Days36.002.37
Type 2 Diabetics GroupT2D-Control50.002.28
T2D-La 5–7 Days51.002.32
T2D-La 5–14 Days44.002.50
Disclaimer/Publisher’s Note: The statements, opinions and data contained in all publications are solely those of the individual author(s) and contributor(s) and not of MDPI and/or the editor(s). MDPI and/or the editor(s) disclaim responsibility for any injury to people or property resulting from any ideas, methods, instructions or products referred to in the content.