
Microbial Conversion of Cheese Whey to Polyhydroxybutyrate (PHB) via Statistically Optimized Cultures


Abstract
1. Introduction
2. Materials and Methods
2.1. Fermentative PHB Production from Cheese Whey
2.2. Design of Experiments (DoE)
2.3. Analytical Methods
3. Results and Discussion
3.1. Evaluation of Cheese Whey Conversion to PHB

| Sugar/ Substrate | OD 1 (@ 600 nm) | DCW 2 (g/L) | CPHB 3 (g/L) | %PHB 4 (% w/w) | CN 5 (g/L) | CS 6 (g/L) | Mw 7 (kDa) |
|---|---|---|---|---|---|---|---|
| Saccharose (S) | 22.3 ± 2.7 | 6.52 ± 0.7 | 4.11 ± 0.4 | 63.1 ± 5.3 | 0.12 ± 0.04 | 2.57 ± 0.6 | 852 ± 84 |
| Glucose (G) | 25 ± 2.6 | 6.25 ± 0.7 | 4.06 ± 0.5 | 65 ± 4.9 | 0.04 ± 0.02 | 1.76 ± 0.4 | 803 ± 81 |
| Lactose (L) | 15.4 ± 1.9 | 2.95 ± 0.6 | 1.09 ± 0.3 | 36.9 ± 4.4 | 0.37 ± 0.02 | 4.32 ± 0.7 | 826 ± 66 |
| Xylose (X) | 16.4 ± 1.7 | 3.15 ± 0.5 | 1.32 ± 0.4 | 41.9 ± 3.9 | 0.26 ± 0.01 | 5.34 ± 0.5 | 867 ± 74 |
| Fructose (F) | 19.1 ± 1.5 | 4.75 ± 0.6 | 2.42 ± 0.6 | 50.9 ± 5.1 | 0.13 ± 0.02 | 2.73 ± 0.5 | 795 ± 53 |
| Galactose (GL) | 20.3 ± 2.1 | 5.43 ± 0.8 | 2.41 ± 0.7 | 54.4 ± 4.7 | 0.11 ± 0.01 | 2.48 ± 0.6 | 812 ± 65 |
| Glucose + Galactose (GG) | 22.4 ± 2.0 | 6.11 ± 0.7 | 3.46 ± 0.6 | 56.6 ± 3.6 | 0.09 ± 0.03 | 1.54 ± 0.4 | 811 ± 58 |
| Cheese Whey (CW) | 18.3 ± 2.2 | 3.24 ± 0.5 | 1.33 ± 0.5 | 41 ± 4.7 | 0.44 ± 0.08 | 7.43 ± 0.3 | – |
| Enzymatically Hydrolyzed CW (CWE) | 21.6 ± 2.3 | 6.02 ± 0.6 | 3.33 ± 0.5 | 55.3 ± 6.2 | 0.14 ± 0.06 | 1.78 ± 0.6 | 801 ± 59 |
| Acid-Hydrolyzed CW (CWA) | 20.1 ± 2.4 | 5.88 ± 0.6 | 3.25 ± 0.3 | 55.3 ± 4.1 | 0.17 ± 0.03 | 1.89 ± 0.3 | 789 ± 66 |
3.2. DoE, Optimization, and Analysis of Variance
| Run # | C/N 1 (w/w) | C/P 2 (w/w) | DO 3 (%) | RT 4 (h) | %PHB 5 (% w/w) | Mw 6 (kDa) |
|---|---|---|---|---|---|---|
| 1 | 6.6 | 0.8 | 5 | 0 | 48.2 ± 4.3 | 668 ± 69 |
| 2 | 6.6 | 1.9 | 10 | 1 | 54.3 ± 5.3 | 742 ± 79 |
| 3 | 6.6 | 3 | 20 | 3 | 53.3 ± 5.4 | 717 ± 81 |
| 4 | 6.6 | 5 | 30 | 9 | 46.7 ± 4.9 | 701 ± 82 |
| 5 | 8 | 0.8 | 10 | 3 | 52.4 ± 4.7 | 702 ± 74 |
| 6 | 8 | 1.9 | 5 | 9 | 50.7 ± 5.2 | 669 ± 73 |
| 7 | 8 | 3 | 30 | 0 | 55.6 ± 6.1 | 756 ± 82 |
| 8 | 8 | 5 | 20 | 1 | 56.4 ± 5.9 | 782 ± 76 |
| 9 | 10 | 0.8 | 20 | 9 | 55.8 ± 4.9 | 704 ± 68 |
| 10 | 10 | 1.9 | 30 | 3 | 56.9 ± 5.1 | 732 ± 73 |
| 11 | 10 | 3 | 5 | 1 | 55.2 ± 5.2 | 821 ± 82 |
| 12 | 10 | 5 | 10 | 0 | 54.2 ± 5.7 | 851 ± 85 |
| 13 | 13.3 | 0.8 | 30 | 1 | 51.2 ± 5.5 | 830 ± 78 |
| 14 | 13.3 | 1.9 | 20 | 0 | 56.6 ± 5.1 | 892 ± 85 |
| 15 | 13.3 | 3 | 10 | 9 | 50.2 ± 4.9 | 789 ± 68 |
| 16 | 13.3 | 5 | 5 | 3 | 46.6 ± 4.7 | 802 ± 73 |
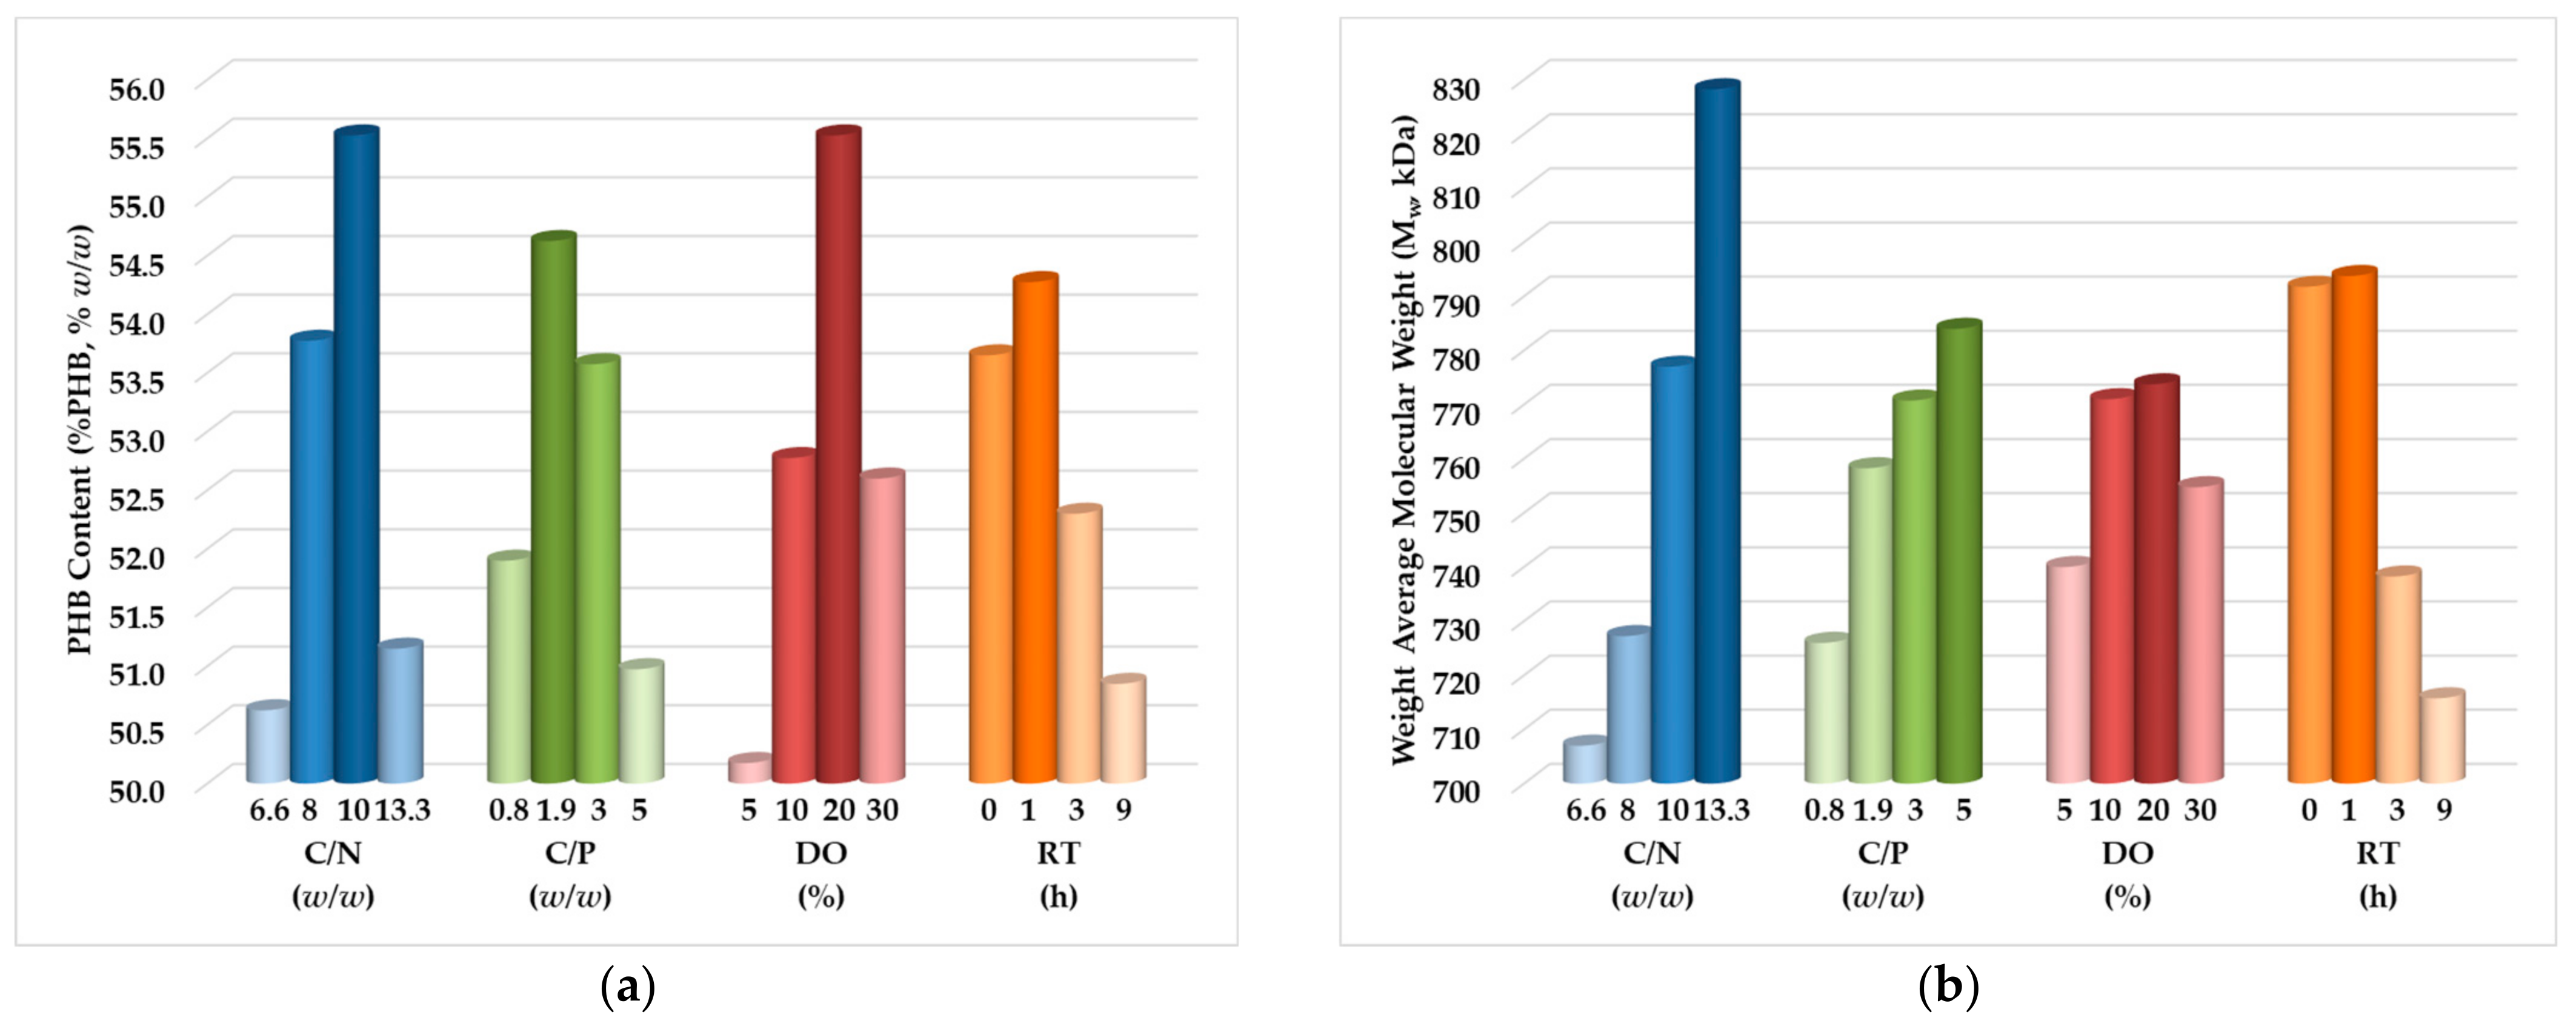
- Carbon-to-nitrogen mass ratio (C/N): 10 w/w for %PHB and 13.3 w/w for Mw.
- Carbon-to-phosphorous mass ratio (C/P): 1.9 w/w for %PHB and 5 w/w for Mw.
- Dissolved oxygen concentration (DO): 20% for both %PHB and Mw.
- Residence time in stationary phase (RT): 1 h for both %PHB and Mw.
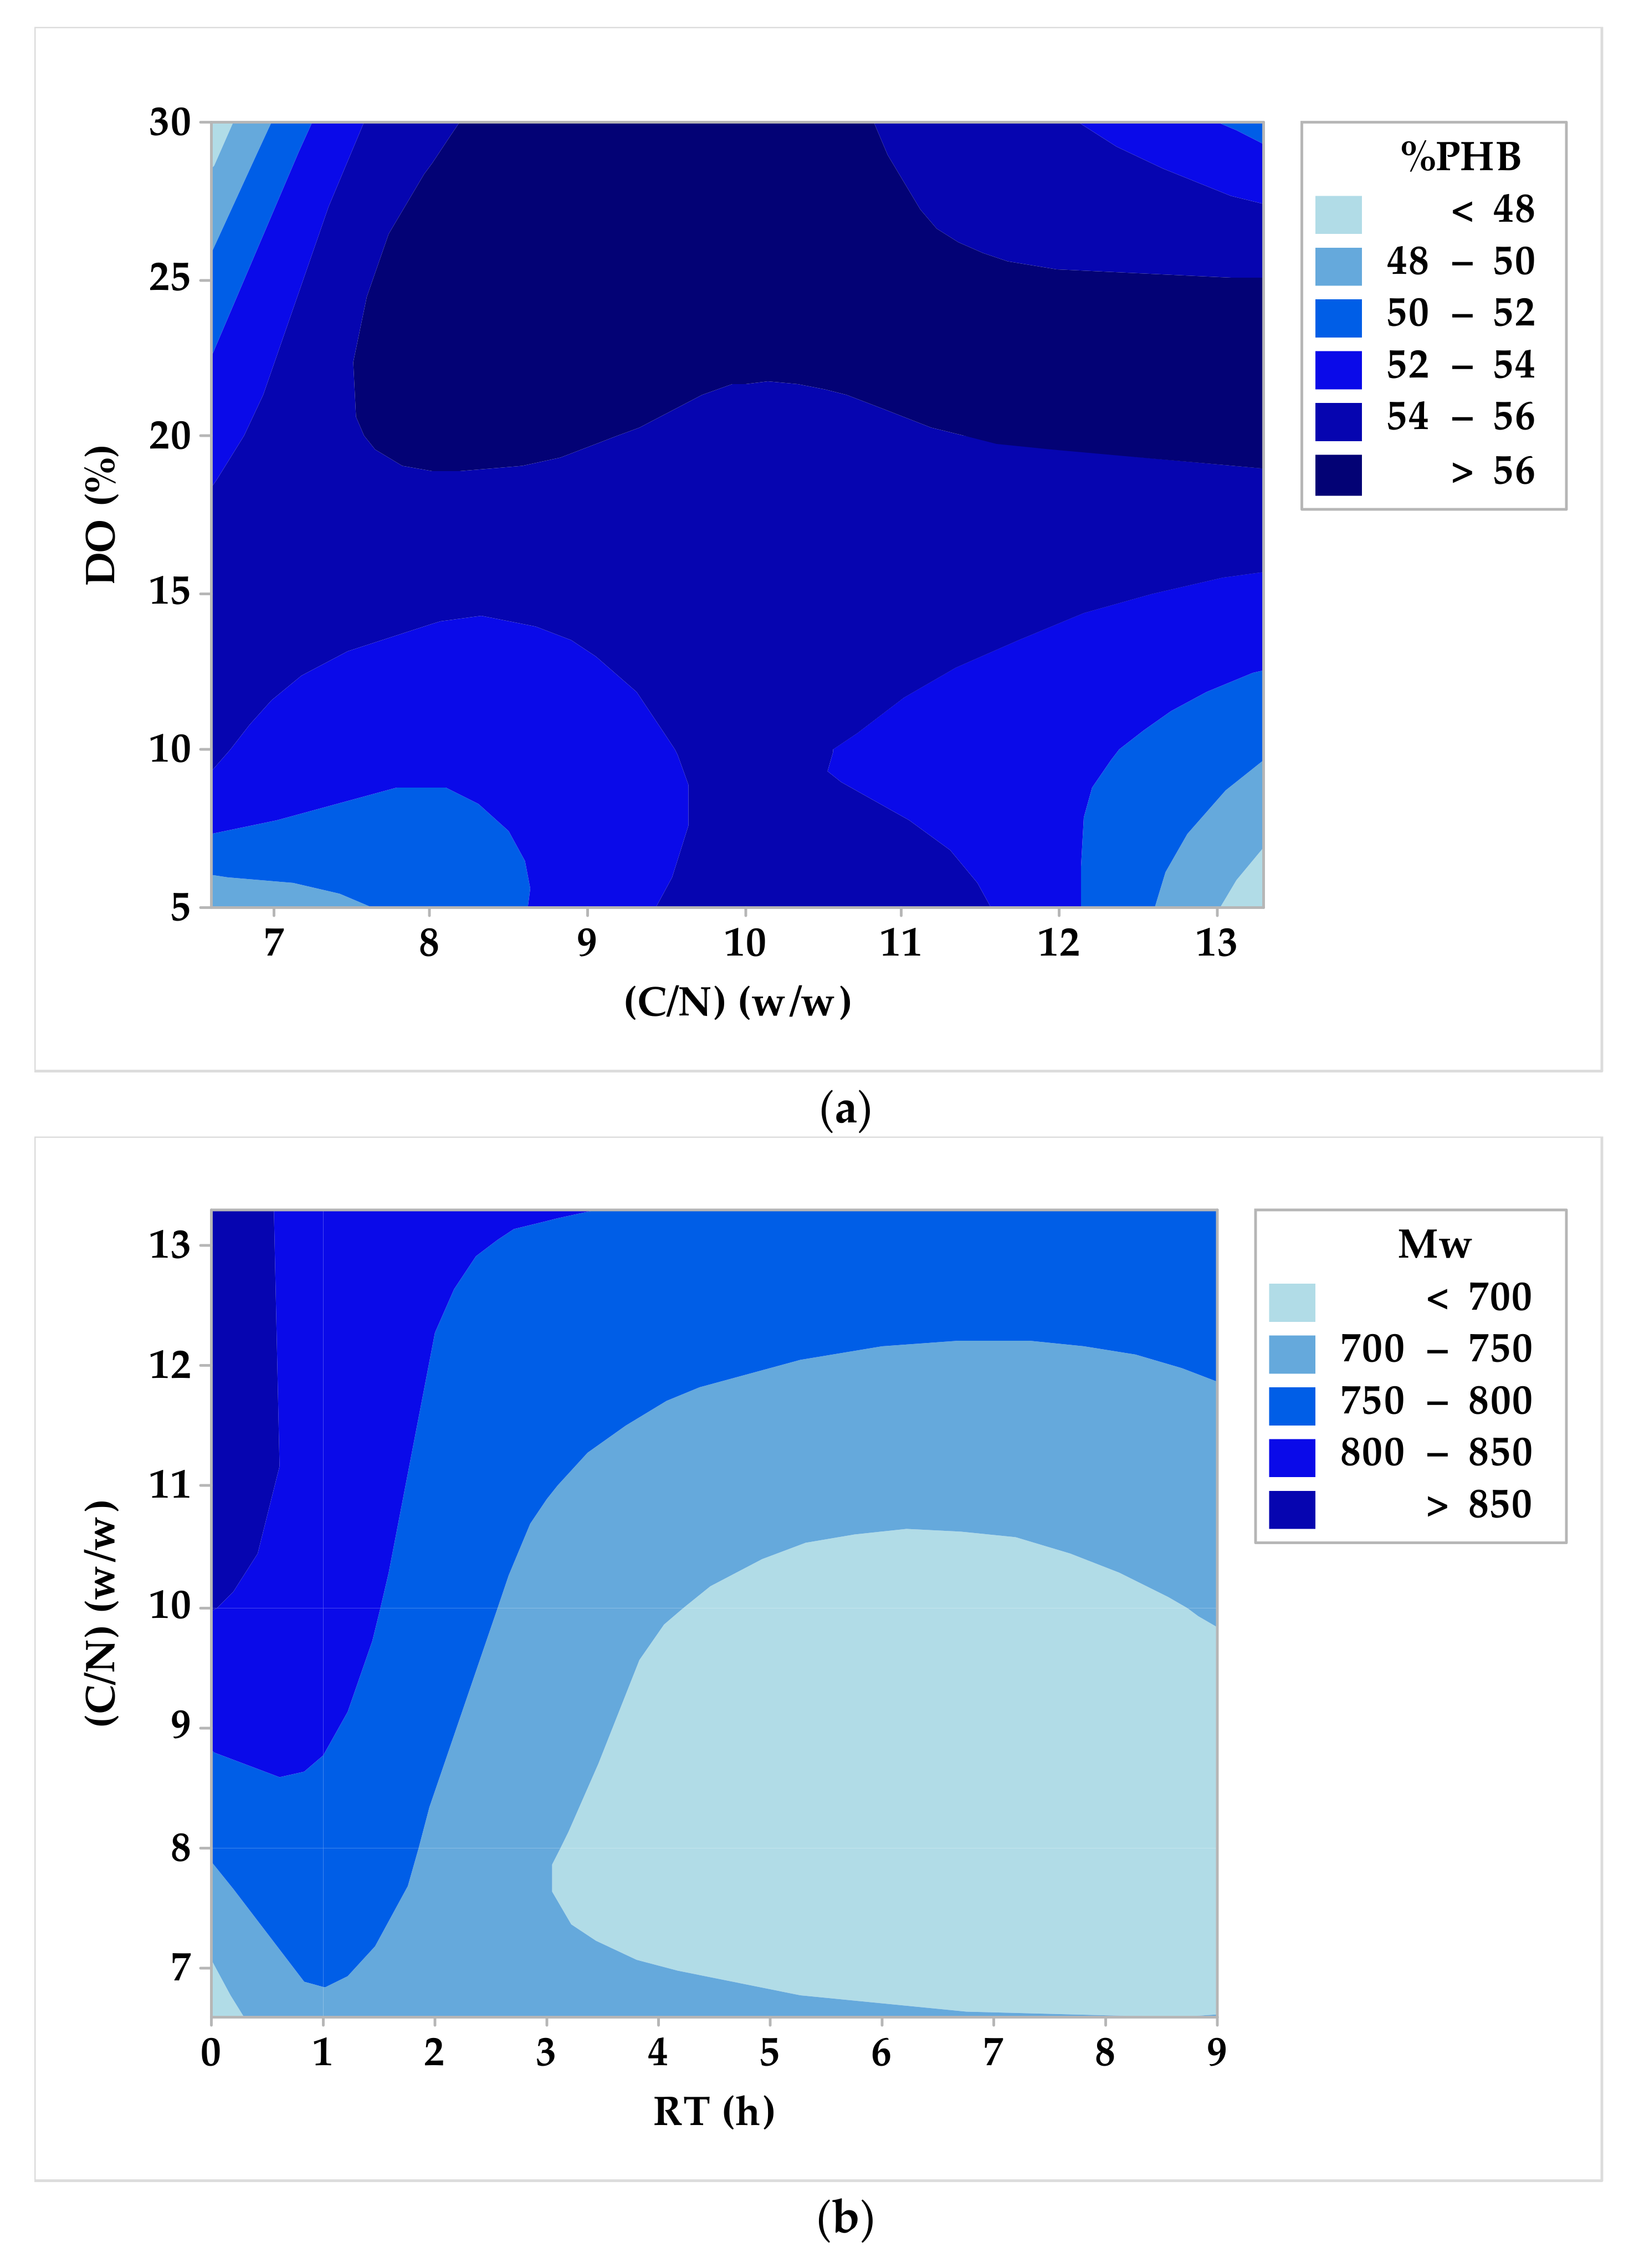
- For C/N = 10 w/w, C/P = 1.9 w/w, DO = 20%, and RT = 1 h, the maximum estimated biopolymer content value is %PHB = 61.66% w/w; this value was verified with minimal deviation (2%) by an additional experiment.
- For C/N = 13.3 w/w, C/P = 5 w/w, DO = 20%, and RT = 1 h, the maximum estimated weight average molecular weight value is Mw = 900 kDa; this value was also verified with a small deviation (5%) by a second additional experiment.
3.3. Regression Modeling and Sensitivity Analysis
4. Conclusions
Author Contributions
Funding
Data Availability Statement
Acknowledgments
Conflicts of Interest
References
- Demeneix, B.A. How fossil fuel-derived pesticides and plastics harm health, biodiversity, and the climate. Lancet Diabetes Endocrinol. 2020, 8, 462–464. [Google Scholar] [CrossRef] [PubMed]
- Kawashima, N.; Yagi, T.; Kojima, K. How do bioplastics and fossil-based plastics play in a circular economy? Macromol. Mater. Eng. 2019, 304, 1900383. [Google Scholar] [CrossRef]
- Samadhiya, K.; Sangtani, R.; Nogueira, R.; Bala, K. Insightful advancement and opportunities for microbial bioplastic production. Front. Microbiol. 2022, 12, 3755. [Google Scholar] [CrossRef] [PubMed]
- Circular Plastics Alliance. Available online: https://single-market-economy.ec.europa.eu/industry/strategy/industrial-alliances/circular-plastics-alliance_en (accessed on 8 June 2023).
- A European Green Deal. Available online: https://commission.europa.eu/strategy-and-policy/priorities-2019-2024/european-green-deal_en (accessed on 8 June 2023).
- Plastics Europe. Report: “ReShaping Plastics: Pathways to a Circular, Climate Neutral Plastics System in Europe”. Available online: https://plasticseurope.org/changingplasticsforgood/reshaping-plastics/ (accessed on 25 April 2023).
- Rosenboom, J.G.; Langer, R.; Traverso, G. Bioplastics for a circular economy. Nat. Rev. Mater. 2022, 7, 117–137. [Google Scholar] [CrossRef]
- Folino, A.; Karageorgiou, A.; Calabrò, P.S.; Komilis, D. Biodegradation of wasted bioplastics in natural and industrial environments: A review. Sustainability 2020, 12, 6030. [Google Scholar] [CrossRef]
- Zimmermann, L.; Dombrowski, A.; Völker, C.; Wagner, M. Are bioplastics and plant-based materials safer than conventional plastics? In vitro toxicity and chemical composition. Environ. Int. 2020, 145, 106066. [Google Scholar] [CrossRef]
- Bioplastics Market Data. Available online: https://www.european-bioplastics.org/market/ (accessed on 8 June 2023).
- Dietrich, K.; Dumont, M.J.; Del Rio, L.F.; Orsat, V. Producing PHAs in the bioeconomy—Towards a sustainable bioplastic. Sustain. Prod. Consum. 2017, 9, 58–70. [Google Scholar] [CrossRef]
- Alcântara, J.M.G.; Distante, F.; Storti, G.; Moscatelli, D.; Morbidelli, M.; Sponchioni, M. Current trends in the production of biodegradable bioplastics: The case of polyhydroxyalkanoates. Biotechnol. Adv. 2020, 42, 107582. [Google Scholar] [CrossRef]
- Anju, A.; Zuber, M.; Mahmood, Z.K.; Noreen, A.; Naveed, A.; Tabasum, S. Microbial production of Polyhydroxyalkanoates and its copolymers. Int. J. Biol. Macromol. 2016, 89, 161–174. [Google Scholar] [CrossRef]
- Wang, Y.; Yin, J.; Chen, G.Q. Polyhydroxyalkanoates, challenges and opportunities. Curr. Opin. Biotechnol. 2014, 30, 59–65. [Google Scholar] [CrossRef]
- Samrot, A.V.; Samanvitha, S.K.; Shobana, N.; Renitta, E.R.; Senthilkumar, P.; Kumar, S.S.; Abirami, S.; Dhiva, S.; Bavanilatha, M.; Prakash, P.; et al. The synthesis, characterization and applications of polyhydroxyalkanoates (PHAs) and PHA-based nanoparticles. Polymers 2021, 13, 3302. [Google Scholar] [CrossRef]
- Rajendran, N.; Han, J. Techno-economic analysis of food waste valorization for integrated production of polyhydroxyalkanoates and biofuels. Bioresour. Technol. 2022, 348, 126796. [Google Scholar] [CrossRef]
- Technology Readiness Levels (TRL). Available online: https://ec.europa.eu/research/participants/data/ref/h2020/wp/2014_2015/annexes/h2020-wp1415-annex-g-trl_en.pdf (accessed on 8 June 2023).
- Zheng, Y.; Chen, J.C.; Ma, Y.M.; Chen, G.Q. Engineering biosynthesis of polyhydroxyalkanoates (PHA) for diversity and cost reduction. Metab. Eng. 2020, 58, 82–93. [Google Scholar] [CrossRef]
- Bhatia, S.K.; Otari, S.V.; Jeon, J.M.; Gurav, R.; Choi, Y.K.; Bhatia, R.K.; Pugazhendhi, A.; Kumar, V.; Banu, J.R.; Yoon, J.J.; et al. Biowaste-to-bioplastic (polyhydroxyalkanoates): Conversion technologies, strategies, challenges, and perspective. Bioresour. Technol. 2021, 326, 124733. [Google Scholar] [CrossRef]
- Varghese, S.; Dhanraj, N.D.; Rebello, S.; Sindhu, R.; Binod, P.; Pandey, A.; Jisha, M.S.; Awasthi, M.K. Leads and hurdles to sustainable microbial bioplastic production. Chemosphere 2022, 305, 135390. [Google Scholar] [CrossRef]
- Nielsen, C.; Rahman, A.; Rehman, A.U.; Walsh, M.K.; Miller, C.D. Food waste conversion to microbial polyhydroxyalkanoates. Microb. Biotechnol. 2017, 10, 1338–1352. [Google Scholar] [CrossRef]
- Carucci, A.; Dionisi, D.; Majone, M.; Rolle, E.; Smurra, P. Aerobic storage by activated sludge on real wastewater. Water Res. 2001, 35, 3833–3844. [Google Scholar] [CrossRef]
- Rhu, D.H.; Lee, W.H.; Kim, J.Y.; Choi, E. Polyhydroxyalkanoate (PHA) production from waste. Water Sci. Technol. 2003, 48, 221–228. [Google Scholar] [CrossRef]
- Carvalho, G.; Oehmen, A.; Albuquerque, M.G.; Reis, M.A. The relationship between mixed microbial culture composition and PHA production performance from fermented molasses. New Biotechnol. 2014, 31, 257–263. [Google Scholar] [CrossRef]
- Dionisi, D.; Carucci, G.; Papini, M.P.; Riccardi, C.; Majone, M.; Carrasco, F. Olive oil mill effluents as a feedstock for production of biodegradable polymers. Water Res. 2005, 39, 2076–2084. [Google Scholar] [CrossRef]
- Bhatia, S.K.; Kim, J.H.; Kim, M.S.; Kim, J.; Hong, J.W.; Hong, Y.G.; Kim, H.J.; Jeon, J.M.; Kim, S.H.; Ahn, J.; et al. Production of (3-hydroxybutyrate-co-3-hydroxyhexanoate) copolymer from coffee waste oil using engineered Ralstonia eutropha. Bioprocess Biosyst. Eng. 2018, 41, 229–235. [Google Scholar] [CrossRef] [PubMed]
- Bhatia, S.K.; Shim, Y.H.; Jeon, J.M.; Brigham, C.J.; Kim, Y.H.; Kim, H.J.; Seo, H.M.; Lee, J.H.; Kim, J.H.; Yi, D.H.; et al. Starch based polyhydroxybutyrate production in engineered Escherichia coli. Bioprocess Biosyst. Eng. 2015, 38, 1479–1484. [Google Scholar] [CrossRef] [PubMed]
- Kumar, P.; Mehariya, S.; Ray, S.; Mishra, A.; Kalia, V.C. Biodiesel industry waste: A potential source of bioenergy and biopolymers. Indian J. Microbiol. 2015, 55, 1–7. [Google Scholar] [CrossRef]
- Kourmentza, C.; Costa, J.; Azevedo, Z.; Servin, C.; Grandfils, C.; De Freitas, V.; Reis, M.A.M. Burkholderia thailandensis as a microbial cell factory for the bioconversion of used cooking oil to polyhydroxyalkanoates and rhamnolipids. Bioresour. Technol. 2018, 247, 829–837. [Google Scholar] [CrossRef] [PubMed]
- Amaro, T.M.; Rosa, D.; Comi, G.; Iacumin, L. Prospects for the use of whey for polyhydroxyalkanoate (PHA) production. Front. Microbiol. 2019, 10, 992. [Google Scholar] [CrossRef] [PubMed]
- Coppola, G.; Gaudio, M.T.; Lopresto, C.G.; Calabro, V.; Curcio, S.; Chakraborty, S. Bioplastic from renewable biomass: A facile solution for a greener environment. Earth Syst. Environ. 2021, 5, 231–251. [Google Scholar] [CrossRef]
- Prazeres, A.R.; Carvalho, F.; Rivas, J. Cheese whey management: A review. J. Environ. Manage. 2012, 110, 48–68. [Google Scholar] [CrossRef]
- Kannah, R.Y.; Kumar, M.D.; Kavitha, S.; Banu, J.R.; Tyagi, V.K.; Rajaguru, P.; Kumar, G. Production and recovery of polyhydroxyalkanoates (PHA) from waste streams—A review. Bioresour. Technol. 2022, 366, 128203. [Google Scholar] [CrossRef]
- Berwig, K.H.; Baldasso, C.; Dettmer, A. Production and characterization of poly (3-hydroxybutyrate) generated by Alcaligenes latus using lactose and whey after acid protein precipitation process. Bioresour. Technol. 2016, 218, 31–37. [Google Scholar] [CrossRef]
- Zandona, E.; Blažić, M.; Jambrak, A.R. Whey utilization: Sustainable uses and environmental Approach. Food Technol. Biotechnol. 2021, 59, 147–161. [Google Scholar] [CrossRef]
- Carvalho, F.; Prazeres, A.R.; Rivas, J. Cheese whey wastewater: Characterization and treatment. Sci. Total Environ. 2013, 445, 385–396. [Google Scholar] [CrossRef]
- Tsolcha, O.N.; Tekerlekopoulou, A.G.; Akratos, C.S.; Bellou, S.; Aggelis, G.; Katsiapi, M.; Moustaka-Gouni, M.; Vayenas, D.V. Treatment of second cheese whey effluents using a Choricystis-based system with simultaneous lipid production. J. Chem. Technol. Biotechnol. 2016, 91, 2349–2359. [Google Scholar] [CrossRef]
- Russo, G.L.; Langellotti, A.L.; Oliviero, M.; Baselice, M.; Sacchi, R.; Masi, P. Valorization of second cheese whey through cultivation of extremophile microalga Galdieria sulphuraria. AIMS Environ. Sci. 2021, 8, 435–448. [Google Scholar] [CrossRef]
- Russo, G.L.; Langellotti, A.L.; Sacchi, R.; Masi, P. Techno-economic assessment of DHA-rich Aurantiochytrium sp. production using food industry by-products and waste streams as alternative growth media. Bioresour. Technol. Rep. 2022, 18, 100997. [Google Scholar] [CrossRef]
- Asunis, F.; De Gioannis, G.; Francini, G.; Lombardi, L.; Muntoni, A.; Polettini, A.; Pomi, R.; Rossi, A.; Spiga, D. Environmental life cycle assessment of polyhydroxyalkanoates production from cheese whey. Waste Manag. 2021, 132, 31–43. [Google Scholar] [CrossRef]
- Povolo, S.; Toffano, P.; Basaglia, M.; Casella, S. Polyhydroxyalkanoates production by engineered Cupriavidus necator from waste material containing lactose. Bioresour. Technol. 2010, 101, 7902–7907. [Google Scholar] [CrossRef]
- Marangoni, C.; Furigo Jr, A.; de Aragão, G.M. Production of poly (3-hydroxybutyrate-co-3-hydroxyvalerate) by Ralstonia eutropha in whey and inverted sugar with propionic acid feeding. Process Biochem. 2002, 38, 137–141. [Google Scholar] [CrossRef]
- Pais, J.; Serafim, L.S.; Freitas, F.; Reis, M.A. Conversion of cheese whey into poly (3-hydroxybutyrate-co-3-hydroxyvalerate) by Haloferax mediterranei. N. Biotechnol. 2016, 33, 224–230. [Google Scholar] [CrossRef]
- Russo, G.L.; Langellotti, A.L.; Verardo, V.; Martín-García, B.; Oliviero, M.; Baselice, M.; Di Pierro, P.; Sorrentino, A.; Viscardi, S.; Marileo, L.; et al. Bioconversion of cheese whey and food by-products by Phaeodactylum tricornutum into Fucoxanthin and n-3 Lc-PUFA through a biorefinery approach. Mar. Drugs 2023, 21, 190. [Google Scholar] [CrossRef]
- Kosseva, M.R.; Rusbandi, E. Trends in the biomanufacture of polyhydroxyalkanoates with focus on downstream processing. Int. J. Biol. Macromol. 2018, 107, 762–778. [Google Scholar] [CrossRef]
- Hamdy, S.M.; Danial, A.W.; Gad El-Rab, S.M.; Shoreit, A.A.; Hesham, A.E.L. Production and optimization of bioplastic (Polyhydroxybutyrate) from Bacillus cereus strain SH-02 using response surface methodology. BMC Microbiol. 2022, 22, 183. [Google Scholar] [CrossRef] [PubMed]
- Penloglou, G.; Kretza, E.; Chatzidoukas, C.; Parouti, S.; Kiparissides, C. On the control of molecular weight distribution of polyhydroxybutyrate in Azohydromonas lata cultures. Biochem. Eng. J. 2012, 62, 39–47. [Google Scholar] [CrossRef]
- Penloglou, G.; Chatzidoukas, C.; Kiparissides, C. Microbial production of polyhydroxybutyrate with tailor-made properties: An integrated modelling approach and experimental validation. Biotechnol. Adv. 2012, 30, 329–337. [Google Scholar] [CrossRef] [PubMed]
- Atil, H.; Unver, Y. A different approach of experimental design: Taguchi method. Pak. J. Biol. Sci. 2000, 3, 1538–1540. [Google Scholar] [CrossRef]
- Zhang, Y.; Lin, Z.; Liu, Q.; Li, Y.; Wang, Z.; Ma, H.; Chen, T.; Zhao, X. Engineering of Serine-Deamination pathway, Entner-Doudoroff pathway and pyruvate dehydrogenase complex to improve poly (3-hydroxybutyrate) production in Escherichia coli. Microb. Cell Factories 2014, 13, 172. [Google Scholar] [CrossRef]
- Zafar, M.; Kumar, S.; Dhiman, A.K.; Park, H.S. Maintenance-energy-dependent dynamics of growth and poly (3-hydroxybutyrate) [P(3HB)] production by Azohydromonas lata MTCC 2311 using simple and renewable carbon substrates. Braz. J. Chem. Eng. 2014, 31, 313–323. [Google Scholar] [CrossRef]
- Bustamante, D.; Segarra, S.; Tortajada, M.; Ramón, D.; Del Cerro, C.; Prieto, M.A.; Iglesias, J.R.; Rojas, A. In silico prospection of microorganisms to produce polyhydroxyalkanoate from whey: Caulobacter segnis DSM 29236 as a suitable industrial strain. Microb Biotechnol. 2019, 12, 487–501. [Google Scholar] [CrossRef]
- Koller, M.; Maršálek, L.; de Sousa Dias, M.M.; Braunegg, G. Producing microbial polyhydroxyalkanoate (PHA) biopolyesters in a sustainable manner. N. Biotechnol. 2017, 37, 24–38. [Google Scholar] [CrossRef]
- Baei, M.S.; Najafpour, G.; Lasemi, Z.; Tab, F.; Younesi, H.; Issazadeh, H.; Khodab, M. Optimization PHAs production from dairy industry wastewater (cheese whey) by Azohydromonas lata DSMZ 1123. Iran. J. Energy Environ. 2010, 1, 132–136. [Google Scholar]
- Arcos-Hernandez, M.V.; Pratt, S.; Laycock, B.; Johansson, P.; Werker, A.; Lant, P.A. Waste activated sludge as biomass for production of commercial-grade polyhydroxyalkanoate (PHA). Waste Biomass Valorization 2013, 4, 117–127. [Google Scholar] [CrossRef]
- Estévez-Alonso, Á.; Pei, R.; van Loosdrecht, M.C.; Kleerebezem, R.; Werker, A. Scaling-up microbial community-based polyhydroxyalkanoate production: Status and challenges. Bioresour. Technol. 2021, 327, 124790. [Google Scholar] [CrossRef]
- Rajvanshi, J.; Sogani, M.; Kumar, A.; Arora, S.; Syed, Z.; Sonu, K.; Gupta, N.S.; Kalra, A. Perceiving biobased plastics as an alternative and innovative solution to combat plastic pollution for a circular economy. Sci. Total Environ. 2023, 874, 162441. [Google Scholar] [CrossRef]
- Matsumoto, K.I.; Aoki, E.; Takase, K.; Doi, Y.; Taguchi, S. In vivo and in vitro characterization of Ser477X mutations in polyhydroxyalkanoate (PHA) synthase 1 from Pseudomonas sp. 61−3: Effects of beneficial mutations on enzymatic activity, substrate specificity, and molecular weight of PHA. Biomacromolecules 2006, 7, 2436–2442. [Google Scholar] [CrossRef]
- Tsuge, T. Fundamental factors determining the molecular weight of polyhydroxyalkanoate during biosynthesis. Polym. J. 2016, 48, 1051–1057. [Google Scholar] [CrossRef]
- Lorini, L.; Martinelli, A.; Capuani, G.; Frison, N.; Reis, M.; Ferreira, B.S.; Villano, M.; Majone, M.; Valentino, F. Characterization of polyhydroxyalkanoates produced at pilot scale from different organic wastes. Front. Bioeng. Biotechnol. 2021, 9, 628719. [Google Scholar] [CrossRef]
- Koller, M.; Mukherjee, A. A new wave of industrialization of PHA biopolyesters. Bioengineering 2022, 9, 74. [Google Scholar] [CrossRef]
- Gahlawat, G.; Srivastava, A.K. Enhancing the production of polyhydroxyalkanoate biopolymer by Azohydromonas australica using a simple empty and fill bioreactor cultivation strategy. Chem. Biochem. Eng. Q. 2017, 31, 479–485. [Google Scholar] [CrossRef]
- Penloglou, G.; Vasileiadou, A.; Chatzidoukas, C.; Kiparissides, C. Model-based intensification of a fed-batch microbial process for the maximization of polyhydroxybutyrate (PHB) production rate. Bioprocess Biosyst. Eng. 2017, 40, 1247–1260. [Google Scholar] [CrossRef]
- Zhou, W.; Colpa, D.I.; Geurkink, B.; Euverink, G.J.W.; Krooneman, J. The impact of carbon to nitrogen ratios and pH on the microbial prevalence and polyhydroxybutyrate production levels using a mixed microbial starter culture. Sci. Total Environ. 2022, 811, 152341. [Google Scholar] [CrossRef]
- Anis, S.N.S.; Mohd Annuar, M.S.; Simarani, K. Microbial biosynthesis and in vivo depolymerization of intracellular medium-chain-length poly-3-hydroxyalkanoates as potential route to platform chemicals. Biotechnol. Appl. Biochem. 2018, 65, 784–796. [Google Scholar] [CrossRef]


| Scenario | Parameter | C/N 1 | C/P 2 | DO 3 | RT 4 |
|---|---|---|---|---|---|
| Maximize %PHB 5 | Optimal Level | 10 w/w | 1.9 w/w | 20% | 1 h |
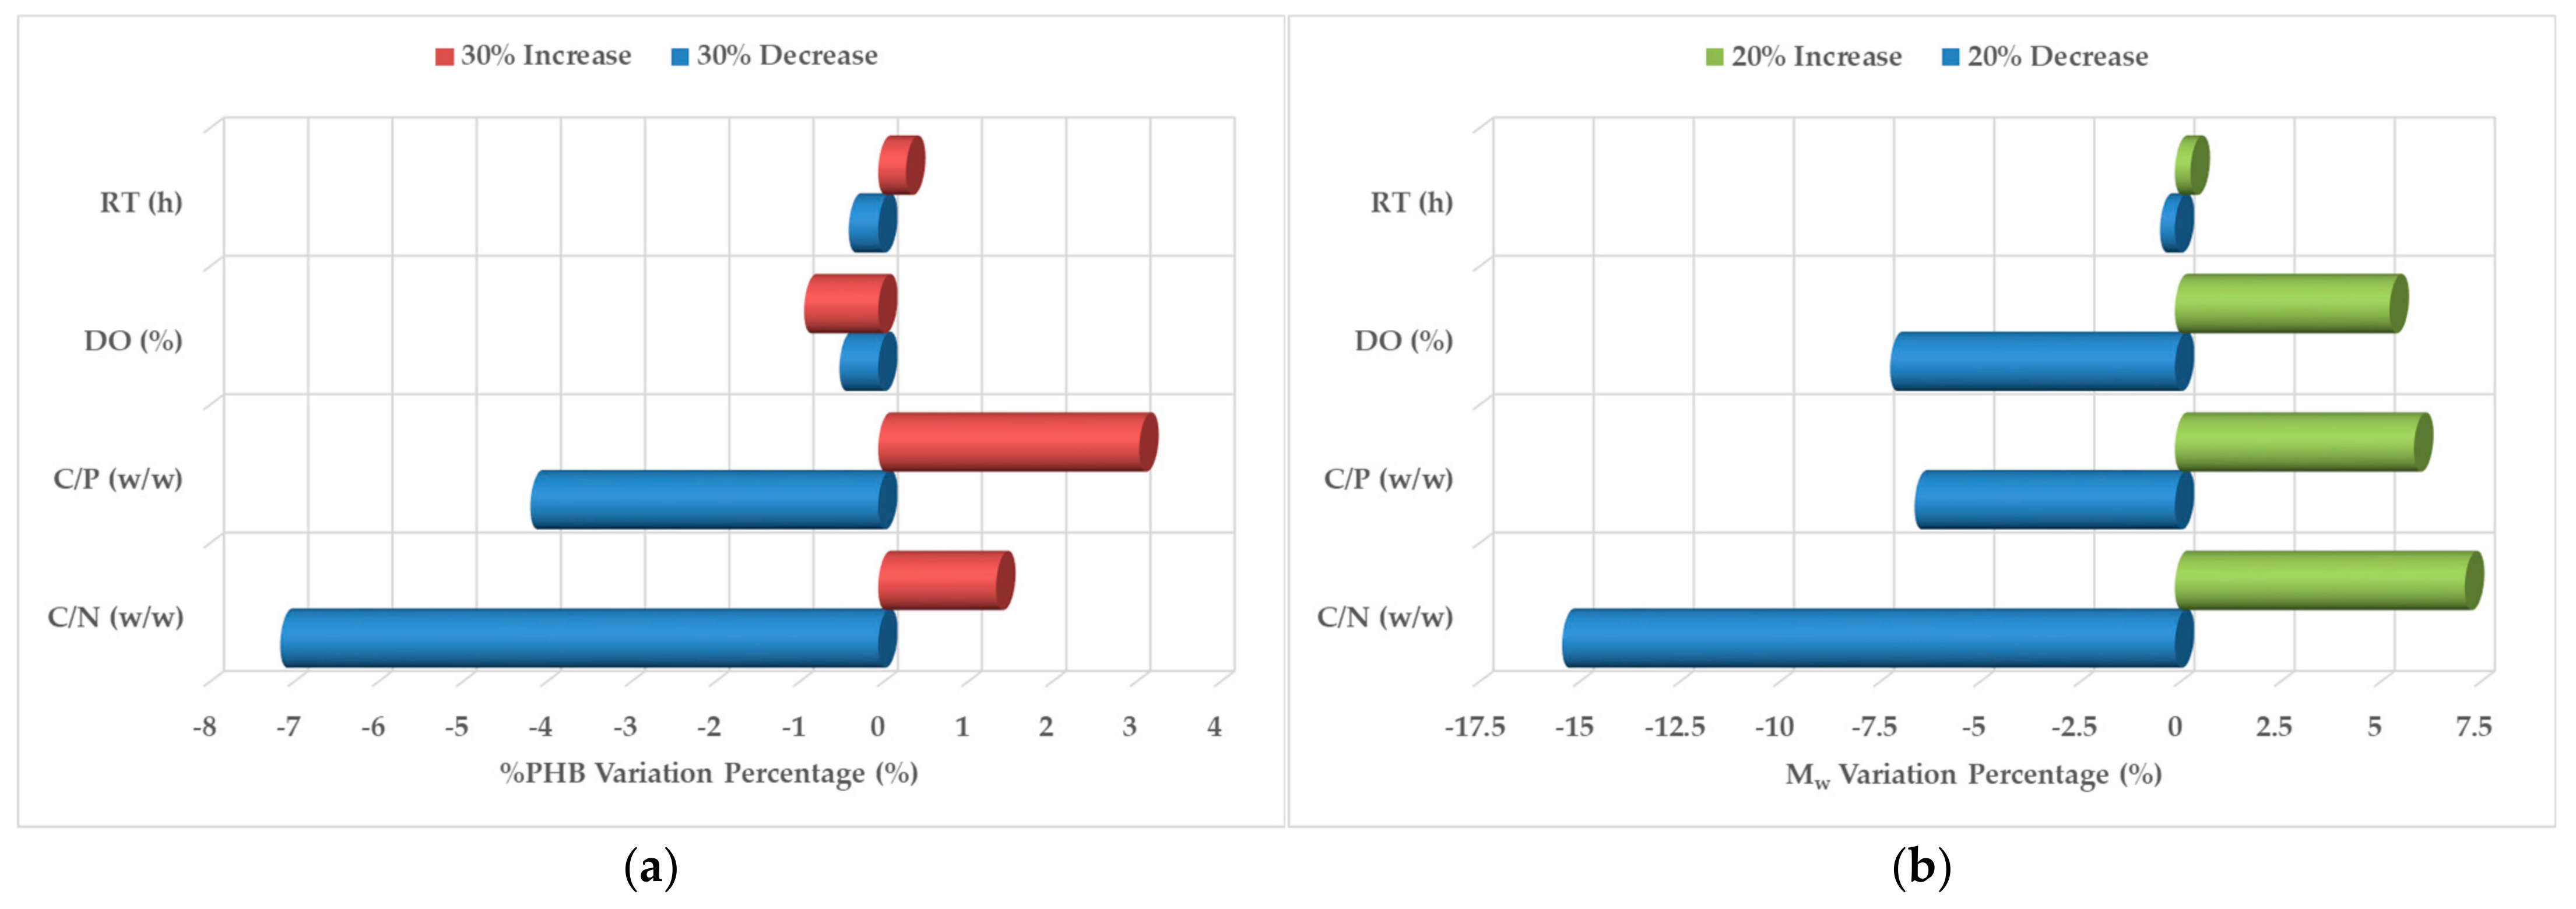
| %PHB Range of Variation (Delta, % w/w) | 4.9% | 3.65% | 5.35% | 3.42% | |
| Significance Ranking | 2 | 3 | 1 | 4 | |
| Contribution to Variance (%) | 28% | 21% | 31% | 20% | |
| Maximize Mw 6 | Optimal Level | 13.3 w/w | 5 w/w | 20% | 1 h |
| Mw Range of Variation (Delta, kDa) | 121.3 | 58 | 33.8 | 78 | |
| Significance Ranking | 1 | 3 | 4 | 2 | |
| Contribution to Variance (%) | 42% | 20% | 12% | 26% |
Disclaimer/Publisher’s Note: The statements, opinions and data contained in all publications are solely those of the individual author(s) and contributor(s) and not of MDPI and/or the editor(s). MDPI and/or the editor(s) disclaim responsibility for any injury to people or property resulting from any ideas, methods, instructions or products referred to in the content. |
© 2023 by the authors. Licensee MDPI, Basel, Switzerland. This article is an open access article distributed under the terms and conditions of the Creative Commons Attribution (CC BY) license (https://creativecommons.org/licenses/by/4.0/).
Share and Cite
Penloglou, G.; Pavlou, A.; Kiparissides, C. Microbial Conversion of Cheese Whey to Polyhydroxybutyrate (PHB) via Statistically Optimized Cultures. Fermentation 2023, 9, 624. https://doi.org/10.3390/fermentation9070624
Penloglou G, Pavlou A, Kiparissides C. Microbial Conversion of Cheese Whey to Polyhydroxybutyrate (PHB) via Statistically Optimized Cultures. Fermentation. 2023; 9(7):624. https://doi.org/10.3390/fermentation9070624
Chicago/Turabian StylePenloglou, Giannis, Alexandros Pavlou, and Costas Kiparissides. 2023. "Microbial Conversion of Cheese Whey to Polyhydroxybutyrate (PHB) via Statistically Optimized Cultures" Fermentation 9, no. 7: 624. https://doi.org/10.3390/fermentation9070624
APA StylePenloglou, G., Pavlou, A., & Kiparissides, C. (2023). Microbial Conversion of Cheese Whey to Polyhydroxybutyrate (PHB) via Statistically Optimized Cultures. Fermentation, 9(7), 624. https://doi.org/10.3390/fermentation9070624