Article

Automatic Control of Chemolithotrophic Cultivation of Cupriavidus necator: Optimization of Oxygen Supply for Enhanced Bioplastic Production

by
Vera Lambauer
1,2,*,
Alexander Permann
1,3,
Zdeněk Petrášek
2,
Vanja Subotić
4,
Christoph Hochenauer
4,
Regina Kratzer
2,* and
Markus Reichhartinger
3
1
Austrian Centre of Industrial Biotechnology (ACIB), Krenngasse 37, A-8010 Graz, Austria
2
Institute of Biotechnology and Biochemical Engineering, Graz University of Technology, NAWI Graz, Petersgasse 12/I, A-8010 Graz, Austria
3
Institute of Automation and Control, Graz University of Technology, Inffeldgasse 21B, A-8010 Graz, Austria
4
Institute of Thermal Engineering, Graz University of Technology, Inffeldgasse 25B, A-8010 Graz, Austria
*
Authors to whom correspondence should be addressed.
Fermentation 2023, 9(7), 619; https://doi.org/10.3390/fermentation9070619
Submission received: 1 June 2023 / Revised: 23 June 2023 / Accepted: 25 June 2023 / Published: 29 June 2023

Abstract

:
Gas fermentation is an upcoming technology to convert gaseous substrates into value-added products using autotrophic microorganisms. The hydrogen-oxidizing bacteria Cupriavidus necator efficiently uses CO2 as its sole carbon source, H2 as electron donor and O2 as electron acceptor. Surplus CO2 is stored in microbial storage material poly-(R)-3-hydroxybutyrate. O2 supply is the most critical parameter for growth and poly-(R)-3-hydroxybutyrate formation. A narrow O2 optimum between ~0.2 and ~4 mg/L was previously reported. Here, a standard benchtop bioreactor was redesigned for autotrophic growth of C. necator on explosive mixtures of CO2, H2 and O2. The bioreactor was equipped with mass flow control units and O2 and CO2 sensors. A controller for automated gas dosage based on a mathematical model including gas mass transfer, gas consumption and sensor response time was developed. Dissolved O2 concentrations were adjusted with high precision to 1, 2 and 4% O2 saturation (0.4, 0.8 and 1.5 mg/L dissolved O2, respectively). In total, up to 15 g/L cell dry weight were produced. Residual biomass formation was 3.6 ± 0.2 g/L under all three O2 concentrations. However, poly-(R)-3-hydroxybutyrate content was 71, 77 and 58% of the cell dry weight with 1, 2 and 4% dissolved O2, respectively.

1. Introduction

Reutilization of CO2 as feedstock of chemicals and materials is the principal route towards a net-zero CO2 emission economy. General utilization options are either direct use of CO2 without chemical conversion (e.g., for enhanced oil recovery or food or beverage production) or chemical and biological CO2 conversion into useful products [1,2,3]. The main biological assimilation pathways are phototrophic CO2 fixation by plants, algae and cyanobacteria and lithotrophic CO2 fixation by specialized bacteria [4,5]. The most efficient CO2 assimilation into biomass has been reported for aerobic hydrogen-oxidizing bacteria (HOBs or Knallgas bacteria) [6,7,8,9]. HOBs assimilate CO2 by using H2 and O2 as electron and energy donors, respectively, [10,11]. Amongst them, Cupriavidus necator (also known as Ralstonia eutropha) is considered a potential game changer in biological CO2 utilization, as it is able to convert surplus CO2 into the microbial storage material polyhydroxyalkanoate (PHA) [12]. PHAs are biodegradable thermoplasts and hold great potential as substitutes for bulk plastics such as polypropylene or polyethylene [13]. In balanced media, the organism divides until one or more nutrients become limiting (biomass growth phase). Under nutrient-limiting conditions, the organism stores surplus CO2 as short-chain-length PHA (poly-(R)-3-hydroxybutyrate, PHB) up to ≤80% of its cell dry weight (PHA storage phase) [12,14]. Substrate gas mixtures contain H2 as a major component and CO2 and O2 as minor components. The exact gas compositions vary in reported gas cultivations, but excesses of H2 and CO2 are generally used under O2-limiting conditions (as reviewed in [14]). The dissolved oxygen (dO2) concentration is considered the most critical process parameter in the chemolithotrophic cultivation of C. necator (and HOBs in general) from technical and biological points of view. The main technical challenge is that O2 and H2 form explosive oxyhydrogen mixtures with lower and upper explosion limits of 4.8 and 95.2% H2, respectively [15]. The low minimum ignition energy of 0.016   m J classifies oxyhydrogen mixtures as highly flammable, and therefore, used cultivation experiments have to satisfy appropriate safety requirements [15]. Standard lab bioreactors cannot be used with explosive gases, as stirrer motors (mostly brush motors) and control electronics inside and outside of the bioreactor (sensors for O2, pH and temperature; pumps for acids, bases, water and control boards) constitute possible ignition sources. In practice, either bioreactors designed for long-term operation with explosive gas mixtures, i.e., in ex-zone 0 (Ex-zones are areas in which explosive atmospheres may occur. Depending on the time period during which an explosive mixture is present, a distinction is made between ex-zones 0, 1 and 2, with 0 being the longest time period–“constantly or frequently”). Regulations for Europe can be found in ATEX Product Directive 2014/34/EU and ATEX Operating Directive 1999/92/EC.), [14] or bioreactors with high gas mass transfer rates were used [16,17]. The main advantage of systems with high mass transfer rates is that a sufficient O2 supply of the cells (dO2 concentration) at low O2 ratios in the substrate gas mixture are reached. Therefore, these bioreactors operate most of the time with gas mixtures outside the explosion limits. Since an ignitable gas mixture cannot be avoided in 100% here either, these bioreactors operate in the lower ex-zones (1 or 2). The safety regulations for equipment and operation are strictest in ex-zone 0. dO2 concentrations for optimal growth were previously reported to range between 1.9 and 4 mg L−1 [18]. During PHB accumulation, less O2 is required, culminating in half-saturation constant for O2-dependent PHA formation of K p O 2 1.8 × 10 2 mg L−1 [19]. Hence, fast-growing cultures have a highly dynamic O2 demand and require precise control to keep the dO2 concentration within a desired and narrow process-dependent narrow range. We recently published a continuous and cheap cultivation setup with manually adjusted O2 supply over several days. Manual O2 supply was guided by [14] and realized by in situ measurements of dO2 concentration with an O2 dipping probe. Despite the tedious and time-consuming manual work, the dO2 concentration was frequently outside of the desired range [14]. Hence, there is a need for the automatic control of O2 supply for convenient and reproducible cultivation of C. necator. In this paper, we propose a systematically designed model-based automatic regulation of O2 and CO2 for a bioreactor operating in zone 0 (In zone 0, a hazardous explosive atmosphere is frequently present during normal operation). The proposed model is supported by in situ measurements of O2 and CO2 using dipping probes. The model-based approach reported herein also enabled the design and implementation of uptake rate and disturbance estimators. As a result, the achieved closed-loop performance is improved additionally by allowing for the determination of the currently prevailing growth phase, i.e., the biomass growth phase or PHA accumulation phase. Experimental studies demonstrate that the proposed concept achieves accurate gas levels during the entire cultivation time.

2. Materials and Methods

2.1. Chemicals, Assays and Organisms

H2 (purity 99.999%), O2 (purity 99.999%), CO2 (purity 99.5%) and N2 (purity 99.999%) were purchased from Air Liquide Austria (Graz, Austria). Kanamycin sulfate (≥750 IU/mg, Art. No. T832.1) was from Carl Roth (purchased at Lactan, Graz, Austria). Poly-(R)-3-hydroxybutyric acid from Sigma Aldrich (quality level 200, Art. No. 363502, Vienna Austria) was used as the standard for GC analysis. Other chemicals used in this study were from Sigma Aldrich or Carl Roth and purchased in the highest available purity. Concentrations of ammonia and fructose were measured using K-AIMAR and K-SURFG test kits from Megazyme International (Wicklow, Ireland). The strain C. necator H16 DSM 428 (aka ATCC 17699, NCIB 10442) was obtained from DSMZ, Deutsche Sammlung für Mikroorganismen und Zellkulturen.

2.2. Media and Inoculum

Stock cultures were stored in 2 mL free-standing cryovials with external threads (Art. No. E315.1, Carl Roth). They contained 0.75 mL of liquid culture in mineral media with 20 g L−1 fructose and 0.75 mL of 1.8 M trehalose. Cryopreserved cells were reactivated on mineral media agar plates containing 20 g L−1 fructose at 30 °C for 24 h [14]. Cells were used to inoculate 50 mL of mineral medium with 20 g L−1 fructose in 300 mL baffled flasks. Precultures were incubated at 30 °C and 120 rpm in an orbital shaker for up to 24 h to capture the culture in the late exponential phase. All gas fermentations were performed in mineral media with CO2 as the sole carbon source. Mineral media composition was described in a previous publication [14].

2.3. Safety Considerations

Personal and technical safety was considered according to ATEX directives RL 1999/92/EG and RL 2014/34/EU.

2.3.1. Room and Ventilated Hood

A schematic diagram of the setup used for gas cultivations is depicted in Figure 1. H2, O2 and N2 were supplied by gas lines from outside the used facility room. CO2 was supplied from a gas bottle located in the room. The individual gas flow rates were adjusted online (LabVIEW program from National Instruments Corp., Austin, TX, USA) with the help of mass flow controllers (MFCs for H2, CO2 and O2 from Vögtlin Instruments GmbH, Muttenz, Switzerland). Substrate gas mixtures were mixed on-site. The gas lines for the substrate gas feed (H2, O2 and CO2 premixed), the gas phase of the bioreactor and the off-gas line temporarily contained H2 and O2 in explosive mixtures (defined as ex-zone 0). The ventilated hood (Secuflow, Airflow Controller from Waldner GmbH & Co. KG, Wangen im Allgäu, Germany) provided a ventilation of 580 m3/h to dilute the off-gas approx. 10,000 times before it was blown out at the top of the building. The interior of the fume hood was considered to be an area where the occurrence of an explosive gas mixture was not likely or was likely to occur only for a short period of time due to the strong ventilation (defined as ex-zone 2). Note that due to the high diffusivity of H2, there might be a low concentration of H2 in a close vicinity to the bioreactor (legally defined by default as zone 1, i.e., explosive atmospheres may occasionally form during normal operation). In practice, zone 1 is negligible because of the strong ventilated fume hood. A gas detector (detector ExTox Sens BG-WT from Gasmess-Systeme GmbH, Unna, Germany) was installed in the fume hood. H2 detection would have triggered gas stoppage (closing of a magnetic check-valve type EPS 18 ATEX 1232 X from Bürkert, Ingelfingen, Germany), bioreactor stoppage (stopping of the motor of the bioreactor) and alarm signals (on-site and remote). The room had an antistatic floor.

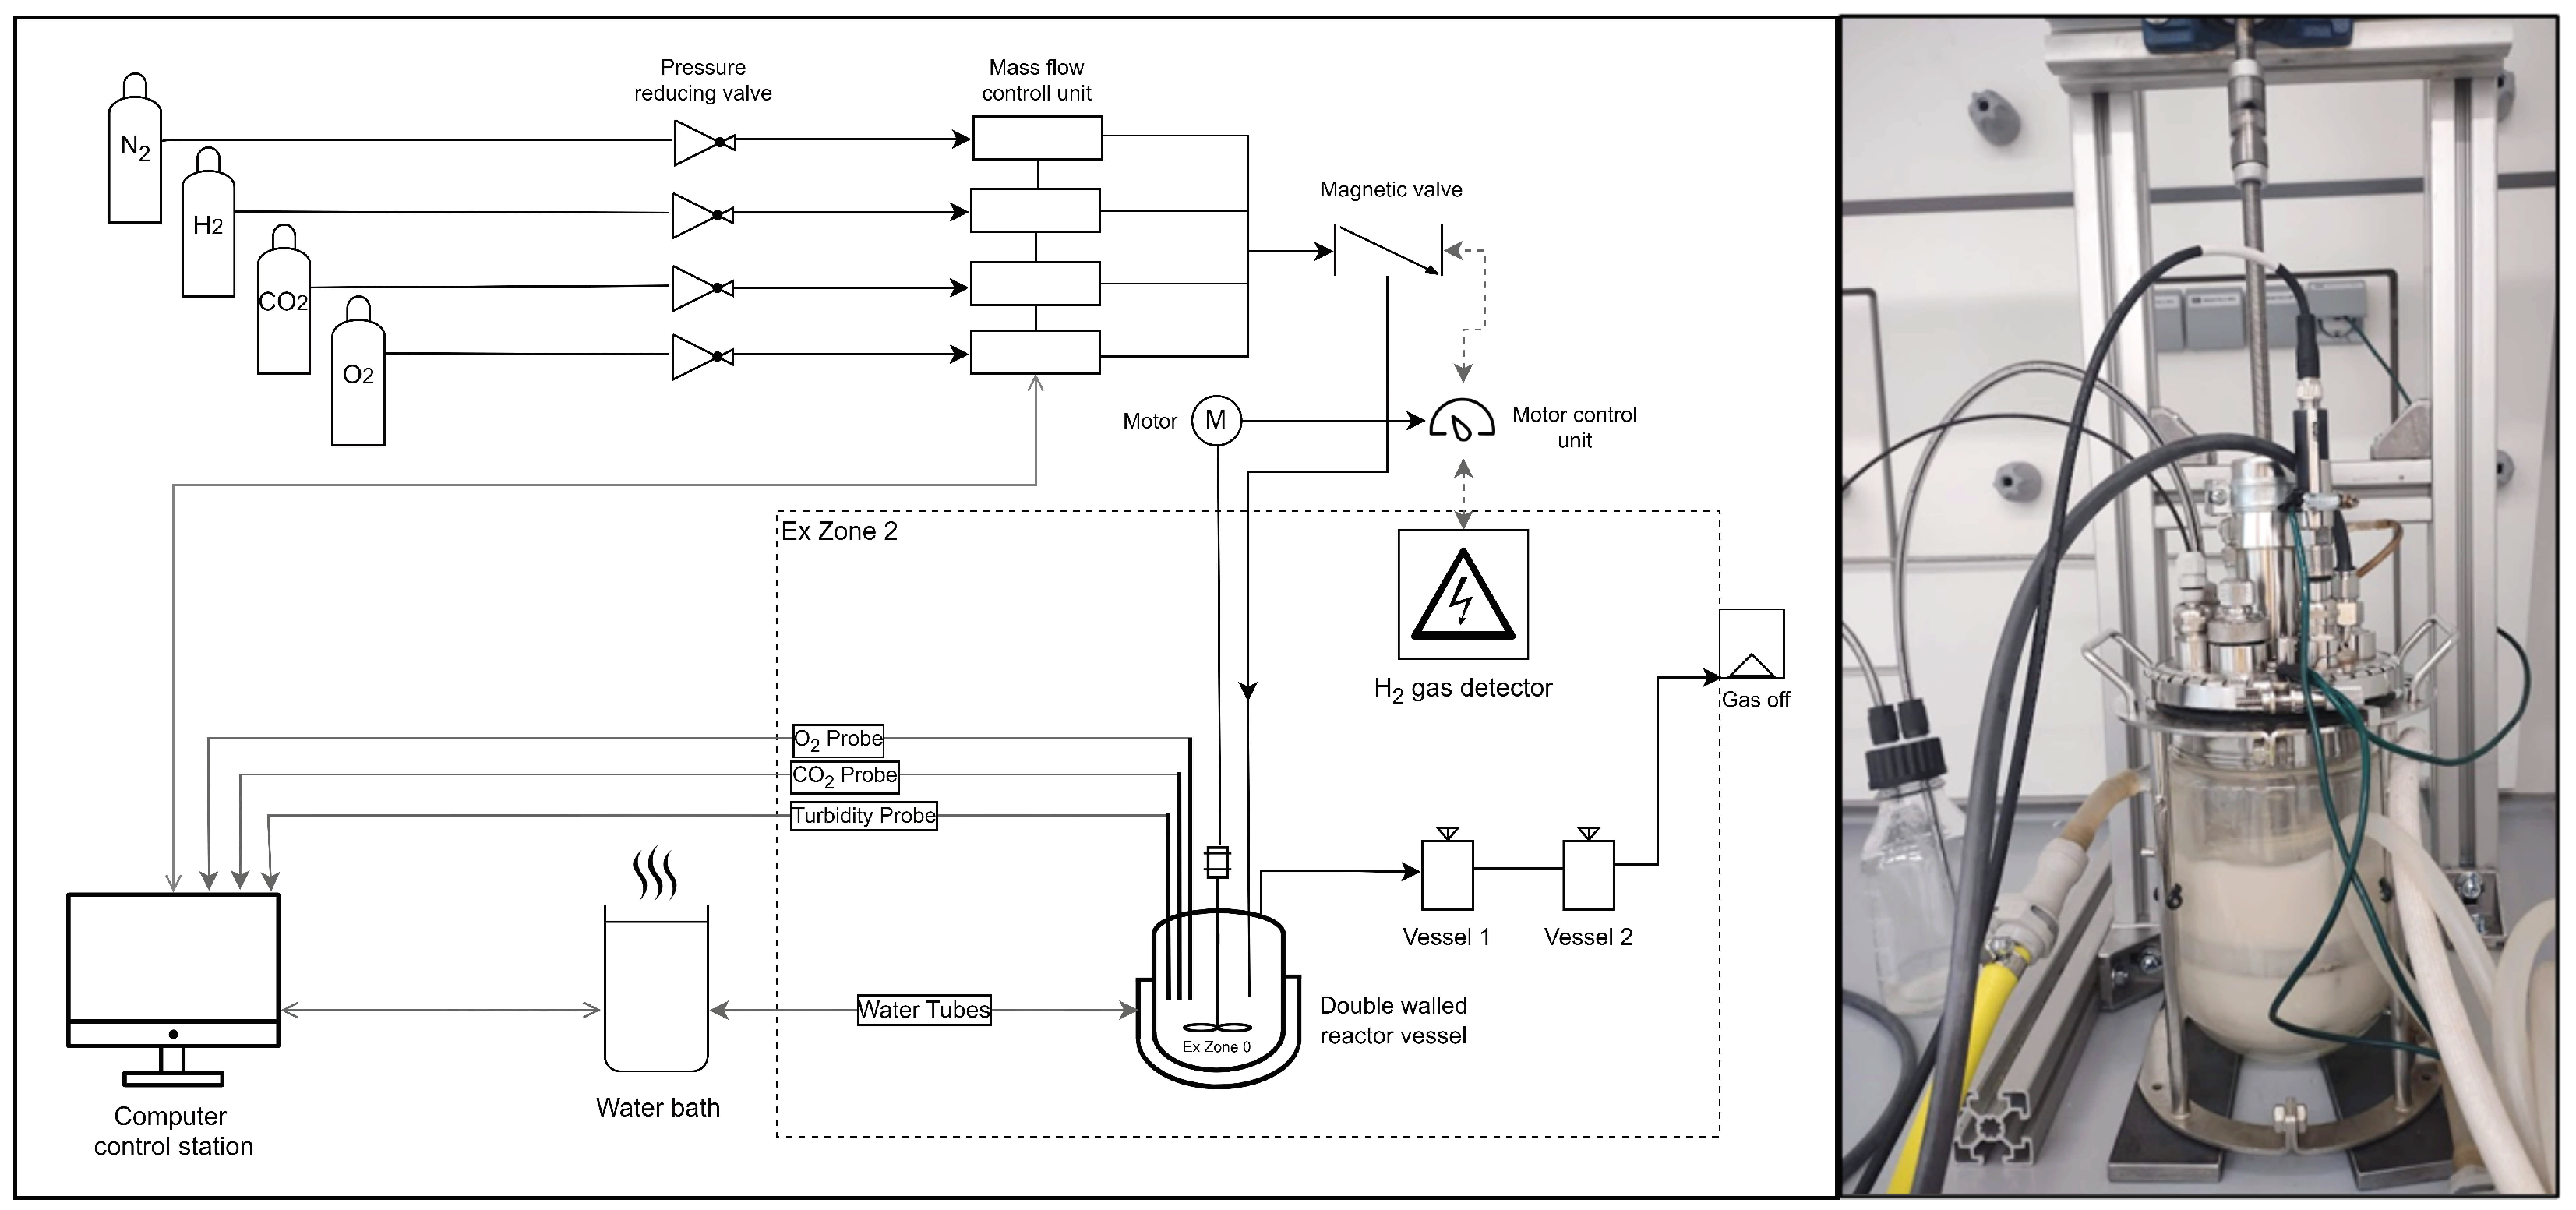
2.3.2. Bioreactor Setup: Pipe and Flow Diagram of the Lab

A Labfors bioreactor with a double-walled 1.2 L reaction vessel (from Infors HT, Bottmingen, Switzerland) was redesigned for use in the ex-zone. All electrical parts from the Labfors bioreactor were removed. The agitator motor and water circulation thermostat were replaced by an external powerdrive three-phase motor (0.75 kW from Pfeiffer Elektromotoren, Vienna, Austria) and a Lauda water bath with a circulation pump (Dr. R. Wobser GmbH & CO. KG, Königshofen, Germany). All possible ignition sources were placed outside the ventilated hood. The brush motor was mounted above the hood, and the shaft drive was elongated. The thermostat and the circulation pump were placed outside the hood, and the water tubes were elongated. No CO2 probe certified for the ex-zone zero was available on the market. Therefore, we used a submersible CO2-dipping probe based on an optical fiber that was considered intrinsically safe according to the supplier (CD1-L2.5-St5-US from Presens GmbH, Regensburg, Germany). Read-out electronics of the CO2 sensor probe were considered as possible ignition sources. Therefore, they were removed from the immediate vicinity of the bioreactor. The dissolved oxygen probe was a VisiFerm mA 225 H3 (Hamilton Bonaduz AG, Bonaduz, Switzerland) certified for use in the ex-zone (zone 0, category IIC, T4-6). The lid of the bioreactor and the sensors were grounded by connections to an equipotential socket in the hood to ensure that the whole fermentation plant was equipontentially balanced.

2.3.3. Personal Protective Measures

The researcher responsible for gas cultivation attended an explosion protection course at the TÜV AUSTRIA Academy (Graz, Austria). Personal protective equipment included safety glasses, an antistatic lab coat (Art. No. 88258, uvex SuXXeed ESD, UVEX Arbeitsschutz GMBH, Fürth, Germany) and antistatic shoes (Art. No. 7315, Abeba Dynamic, Schmuck Arbeitsschutzprodukte Vertriebs GmbH, Bad Salzungen, Germany). Additionally, the H2 gas was switched off before the researcher entered the laboratory.

2.4. Operation of the Gas Cultivation System

The k L a of the bioreactor was determined by the static gassing-out method [14]. Calibrations of the CO2 and O2 probes were achieved by two-point calibrations. Zero (0% dissolved O2 or CO2) was determined by purging the reactor with N2. The oxygen probe was calibrated to 100% dissolved oxygen by purging the reactor with 100% pure O2. The CO2 probe was calibrated to 20% dissolved carbon dioxide by purging the reactor with a gas mixture of 20% CO2 and 80% N2. The Labfors cultivation vessel was autoclaved with the mounted dissolved oxygen dipping probe. Under sterile conditions, the chemically sterilized (ethanol 70% (v/v)) CO2-dipping probe was fitted into the reactor, and the presterilized mineral medium (1 L) was added. Heterotrophically grown preculture was added aseptically through a septum (start OD600 ≤ 1). The filled bioreactor was connected to the substrate gas and off-gas lines. The tightness of the bioreactor and gas connections was checked with the purge gas N2 and a leak detector spray. Stirrer speed velocity and temperature were held constant at 887 rpm and 30 °C, respectively. Under chemolithotrophic conditions, dissolved CO2 and O2 were kept constant at 5% and 2%, respectively, by automation and control in LABVIEW. H2 was manually set constant at 400 mL min−1 to ensure an excess of dissolved hydrogen. N2 was used as a filling gas to ensure a total and constant gas supply rate of 1 L min−1. Prior to sampling, H2 was set to 0% in the substrate gas mixture, and the bioreactor was purged with substrate gas lacking H2 for 10 min (flow rate of 1 L min−1). Sampling was performed using a syringe with a needle. The needle was inserted through a septum by opening a blind plug. After sampling, the blind plug was closed again, and the bioreactor tightness checked with the purge gas and a leak detector spray. Bioreactor cultivation was performed for 5–7 days. Biomass was harvested by centrifugation, and the supernatant and pellet were stored separately at −20 °C.

2.5. Data Acquisition and Processing

Oxygen probe readings were gathered at a 2 s interval. The measured parameter was the dissolved oxygen ( C O 2 ). The main program cycle used to estimate uptake rates and adjust inlet gas compositions was executed every 2 s according to the presented control laws. The CO2 probe was prone to light-induced aging of the reactive dye in the sensor membrane. Therefore, the CO2 measurement intervals were increased to 300 s to maintain reliable probe readings throughout the cultivation experiment. The measured parameter was the dissolved CO2. Read-outs of gas probes were presented as % saturation, and 100% and 0% saturations were obtained by purging the aqueous media with the respective pure gas (O2 or CO2) and N2, respectively.

2.6. Analytics

2.6.1. Optical Density and Cell Dry Mass

Optical densities of culture broth samples were measured at 600 nm (OD600). Mineral medium was used as a blank reading and, if necessary, to dilute the samples. Cell dry mass was determined using the volumetric method with drying of the biomass at 105 °C as described previously [14].

2.6.2. PHA Determination

PHA was extracted from lyophilized cells by a multistep method. First, ethanol was added to dissolve lipids. Then, ethanol and dissolved lipids were removed by centrifugation, and the remaining pellet was dried. PHA was extracted with chloroform from the degreased pellet. Finally, PHA was precipitated by the addition of ice-cold ethanol, subsequently concentrated by filtration and dried. Methanolysis of PHA was performed in order to determine the PHA content by GC. The GC was equipped with a ZB-5 column (Phenomenex; 30 m length; 0.32 mm inner diameter; 0.25 μm film thickness) and an FID detector. PHA determination was previously described in detail [14,20].

3. Theory/Calculation

In this section, we present a mathematical model and a controller design for the purpose of automatically regulating O2 and CO2 concentrations.

3.1. Mathematical Modelling and Automatic Control Problem Formulation

The dynamics of the dissolved concentrations of O2 and CO2 in the fermentation broth are assumed to be captured by
d C i d t = N i + Θ i Q i ,
where C i denotes the dissolved concentration in %, N i covers the gas-to-liquid mass transfer rate in %s−1, Θ i represents the impact of the considered chemical reactions in %s−1 and Q i refers to remaining non-modeled effects mainly caused by the bacterial uptake rate in %s−1. Note that this model structure is applied to the concentrations of both O2 and CO2; hence, i { O 2 ,   CO 2 } .
Gas-to-liquid mass transfer is modeled using the two-film theory [21,22]. Hence, it is assumed that the mass transfer is proportional to the difference in concentrations of the gaseous state and the dissolved state. The concentration in the gaseous state refers to the fraction of the respective gas within the inlet gas composition. A sufficiently fast exchange of gas inside the bioreactor is assumed; hence, the gas concentrations can be directly adjusted by the mass flow controllers. The dissolved concentration, on the other hand, refers to the maximum solubility of the respective gas in the fermentation broth. Consequently, for each gas, a dissolved liquid concentration of 100% is reached after applying a 100% inlet gas concentration of the respective gas for a sufficiently long time. The mass transfer from gas to liquid is modeled by
N i = k L a i ( C i * C i ) ,
where k L a i represents a transfer-rate coefficient in s−1, which depends on the total inlet gas flow ( u 1 ) given in mL min−1. The transfer rate coefficient is approximated by
k L a i ( u 1 ) = α i u 1 + β i .
where α i and β i denote liquid-dependent positive constants. Furthermore, the respective gas concentration is labeled by C i * and is given in %. Note that the temperature impact on k L a is neglected. This is motivated by the assumption that the temperature is kept constant by the temperature bath during the fermentation. The variations in the liquid properties that may influence the transfer rate coefficient ( k L a ) during the process are neglected.
The effect of chemical reactions takes into account CO2 only, since O2 does not react with H2O. The reaction of CO2 with H2O triggers a series of reversible reactions, forming a so-called buffer system. CO2 first reacts to carbonic acid, as described by
CO 2 + H 2 O H 2 C O 3 ,
and further to bicarbonate, as expressed by
H 2 C O 3 H + + HCO 3 ,
which eventually yields
HCO 3 H + + CO 3 2 .
The reaction’s equilibrium depends on the pH value of the liquid. In this process, the pH value is kept constant by the addition of a phosphate buffer, ensuring a pH value between 6.5 and 7.0. No further pH control or adjustment during fermentation was necessary. The chemical reaction shown in reaction (6) is omitted in the presented mathematical model, since the concentration of CO32− is negligibly small at the given pH value [23]. The dynamics of reversible reactions (4) and (5) are modeled by
d d t [ HCO 3 ] = k 1 C CO 2 k 1 [ H + ] [ HCO 3 ]
to describe the time evolution of the bicarbonate concentration. The square brackets denote the respective concentration in the liquid, and k 1 and k 1 denote constant reaction-rate coefficients. The concentrations of H+ ions can be calculated from the known pH level (p) and by replaced by the constant k H = 10 p .
The dynamic conversion of CO2 shown in Equation (7) describes the reduction in the CO2 concentration in the fermentation broth. Given the reversible nature of the considered process, increasing the HCO3 concentration results in an increase in CO2 as well. This coupling effect is modeled by
Θ CO 2 = k 1 C CO 2 + k 1 k h [ HCO 3 ]
The terms Q O 2 and Q CO 2 are not mathematically modeled in this paper, while Q O 2 refers to the bacterial oxygen uptake rate, Q CO 2 includes several parameters due to the dependence of CO2 solubility on pH, temperature and ionic strength. During fermentation, slight pH changes in a range of 6.5–7.0 may occur as ions are consumed by bacteria. Therefore, pH, as well as ionic strength, may differ over time [24]. In addition, metabolites from the cells are exported into the aqueous solution, which also changes the ionic strength [25]. In comparison with the dynamic effects described above, the individual O2 and CO2 uptake rates are assumed to be time-dependent and changing with a variety of process parameters and with the current biomass growth phase. From a control engineering point of view, they are regarded as a disturbance later on.
Introducing the state variables x 1 , x 2 , x 3 and x 4 and the input variables u 1 , u 2 and u 3 , as explained in Table 1, yields the overall dynamic model.
d d t x 1 = k L a O 2 ( u 1 ) ( u 2 x 1 ) Q O 2 ,
d d t x 2 = k L a CO 2 ( u 1 ) ( u 3 x 2 ) k 1 x 2 + k 1 k h x 3 Q CO 2 ,
    d d t x 3 = k 1 x 2 k 1 k h x 3 ,
d d t x 4 = ξ ( x 2 x 4 ) ,
with
k L a O 2 ( u 1 ) = a O 2 u 1 + β O 2 and k L a CO 2 ( u 1 ) = a CO 2 u 1 + β CO 2 .
Note that in the proposed mathematical model (9), the dynamics of the CO2 concentration measurement transducer are also considered by a lag element represented by (9d) with time constant ξ 1 . In the case of the O2 probe, i.e., the measurement of x 1 , the introduction of additional dynamics was not required.
The overall goal of the controller design presented in Section 3.2 is to adjust u 1 , u 2 and u 3 in such a manner that the dissolved concentrations of O2 and CO2, i.e., x 1 and x 2 , respectively, approach the constant given levels ( r i ).

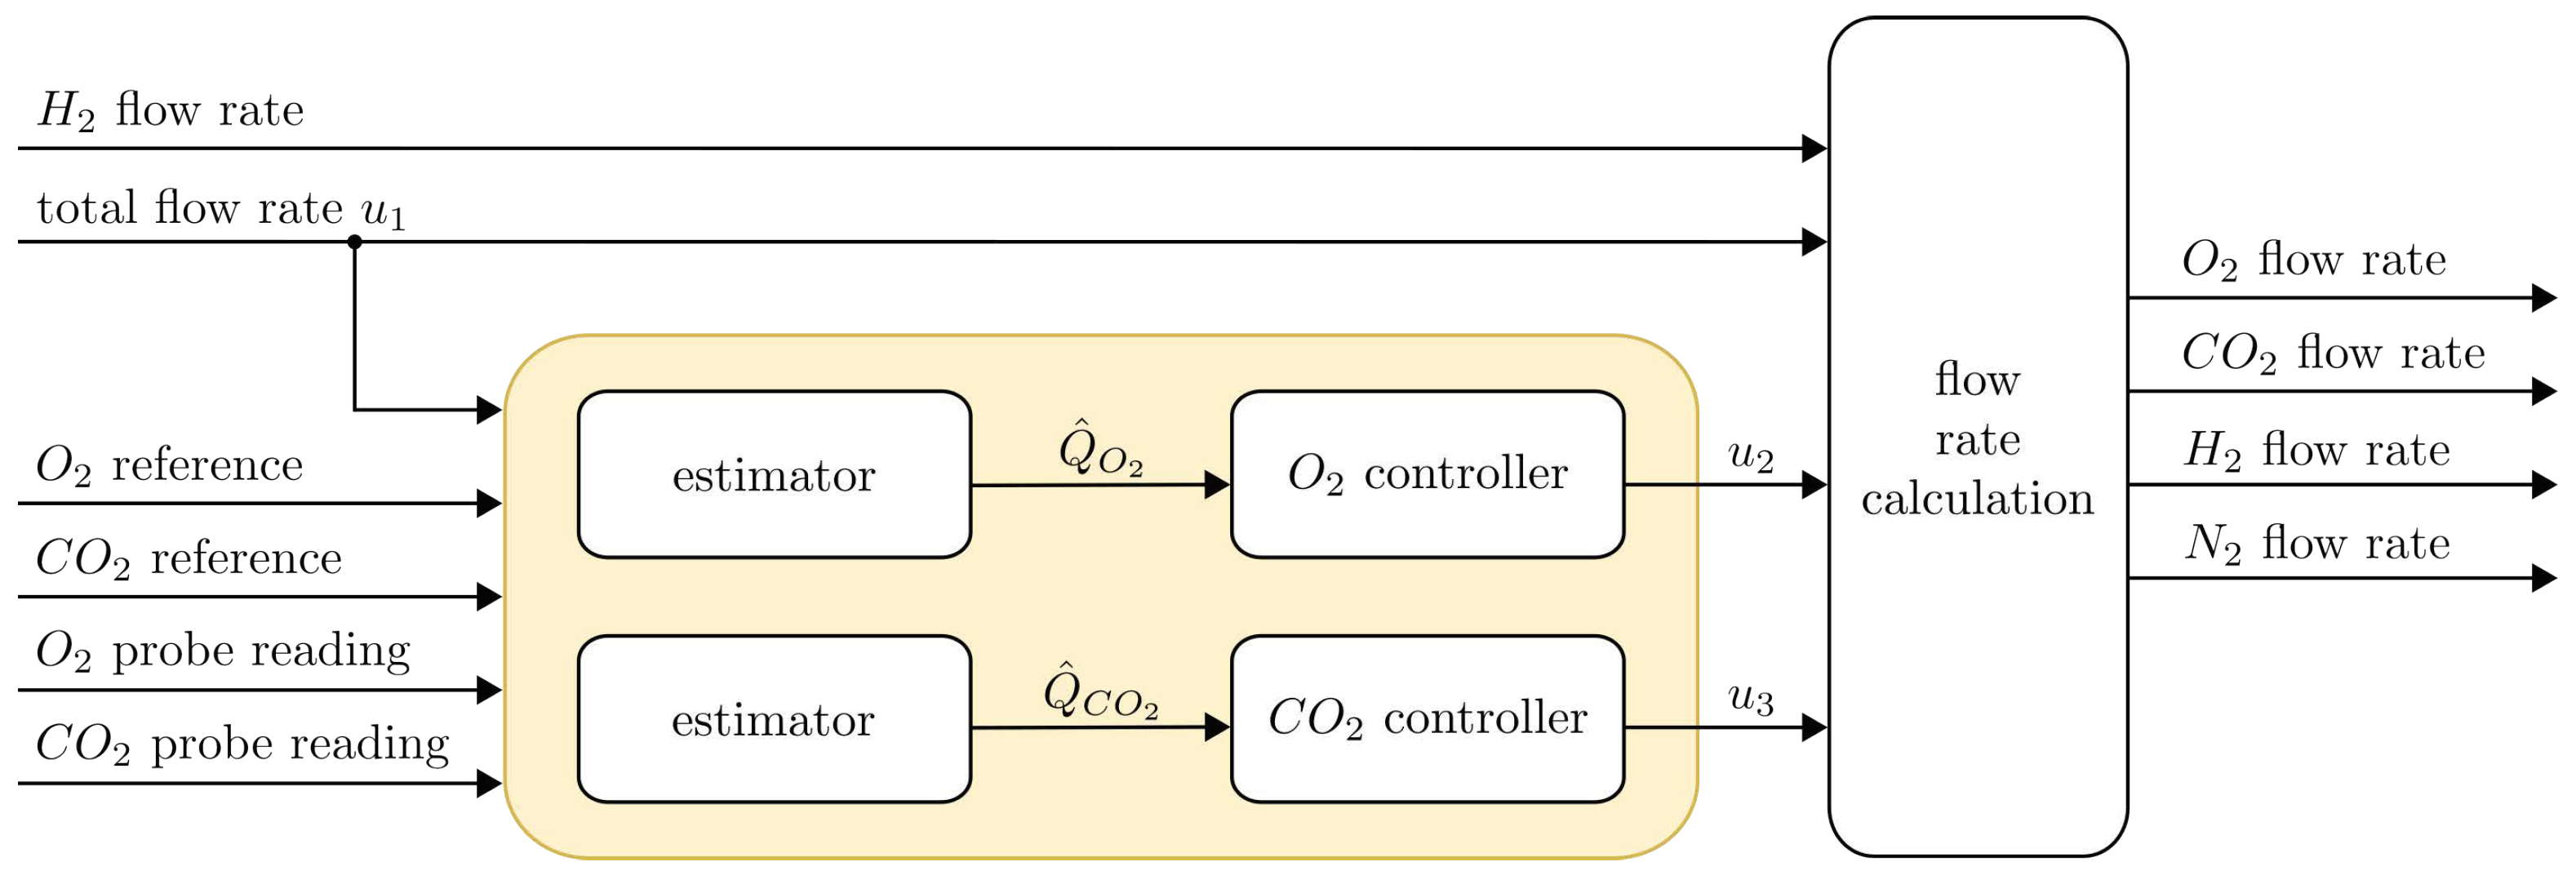
3.2. Controller Design

The design of the controllers relies on the assumption that the total mass flow ( u 1 ) is specified by the bioreactor’s operator. Therefore, it is known and should not be adjusted automatically by the automatic control algorithms designed in this section. Furthermore, the reference signals ( r i ) are assumed to be constant. Any sensor dynamics are neglected for the design of the controllers as well. The rates ( Q i ) are regarded as slowly (More precisely, the dynamics of Q i are regarded significantly slower than the dynamics of dissolved concentrations of O2 and CO2 captured by (9a) and (9b)) time-varying. In a first step of the controller design, it is also assumed that the functions ( Q i ) are known. This assumption is relaxed in Section 3.2.4 when estimators are presented.
Both the O2 controller design and the CO2 controller design rely on the definition of the tracking error.
e i = r i x i ,
where r O 2 and r CO 2 denote the constant O2 and CO2 reference, respectively. Figure 2 shows an overview of the control system and its individual components presented in the following subsections. Values for the total flow ( u 1 ), the H2 flow and the reference signals are chosen directly by the operator. The O2 and CO2 controllers compute u 2 and u 3 , which allows for the calculation of the respective flow rates that are passed on to the mass flow controllers.

3.2.1. O2 Controller

Computing the dynamics of the tracking error ( e 1 ) yields
d e 1 d t = k L a O 2 ( u 1 ) ( u 2 x 1 ) + Q O 2 ,
where u 2 is regarded as the O2 controller’s control signal. Prescribing the above tracking error dynamics by
d e 1 d t = k O 2 e 1 with k O 2 > 0
allows Equations (12) and (13) to be solved and for the control signal to be rearranged.
u 2 = k O 2 e 1 + Q O 2 k L a O 2 ( u 1 ) + x 1 .
It is interesting to note that the control signal ( u 2 ) is automatically adjusted depending on the total flow ( u 1 ), which is selected such that no singularity occurs in the computation of u 2 . The presented model-based design of control law (14) can easily be extended towards dynamic controllers by adopting the prescribed error dynamics shown in Equation (13). This allows for systematic generation of standard regulators such as PID controllers [26]. However, in experimental studies, the presented control algorithm was found to be capable of achieving the desired tracking error accuracy. Furthermore, the O2 control algorithm presented in Equation (14) can easily be implemented in discrete-time operated control hardware. Note that due to static control action, no antiwindup method needs to be implemented [27]. The discretized control algorithm is given by
u 2 , n = k O 2 e 1 , n + Q ^ O 2 , n k L a O 2 , n + x 1 , n   ,
where e 1 , n = r O 2 x 1 , n with x 1 , n = x 1 ( n T d ) , the constant discretization time T d and n = 0 , 1 , 2 . In this discrete time realization of the control law, the uptake rate ( Q O 2 ) is already replaced by its discrete time estimate ( Q ^ O 2 , n ) presented in Section 3.2.4.

3.2.2. CO2 Controller

The design of the CO2 controller also follows the method of prescribing the tracking error dynamics. Hence, the same method as in the previously presented O2 controller development is applied. However, a more sophisticated specification of the error dynamics was required to obtain the desired closed feedback loop tracking performance. More precisely, the tracking error,
e 2 = r CO 2 x 2 ,
which is governed by
d e 2 d t = k L a CO 2 ( u 1 ) ( u 3 x 2 ) + k 1 x 2 k 1 k h x 3 + Q CO 2 ,
is specified to follow the total flow-dependent dynamics:
d e 2 d t = ( k CO 2 + k L a CO 2 ( u 1 ) ) e 2 ,
where k CO 2 is a positive constant tuning parameter. Note that
k CO 2 + k L a CO 2 ( u 1 ) > 0
ensures that the error ( e 2 ) vanishes as time tends toward infinity. This inequality holds within the admissible range of the flow ( u 1 ). In contrast to the O2 control loop, this design takes into account the fact that the dynamics of the CO2 concentration vary with the total flow ( u 1 ). In particular, the tracking error convergence rate is “large” if the total flow ( u 1 ) is “high”. On the other hand, slow convergence is adjusted for “low” total flow situations. For the calculation of the control law ( u 3 ), the Equations (17) and (18) are equated, and the definition of the error ( e 2 = r CO 2 x 2 ) is used. Rearranging for u 3 yields the following control law:
u 3 = k CO 2 e 2 + k 1 x 2 k 1 k h x 3 + Q CO 2 k L a CO 2 ( u 1 ) + r CO 2
This control law is, as in the O2 control case, a static relation, and the implementation as a discrete time control law is straightforward. However, taking into account the measurement time interval of the CO2 probe mentioned in Section 2.5 allows for further simplification of the control law. The equilibrium of the bicarbonate buffer dynamics from Equation (9c) is characterized by
0 = k 1 x 2 k 1 k h x 3 k 1 x 2 = k 1 k h x 3 .
As a consequence of this steady-state consideration of the bicarbonate buffer, the following control law results:
u 3 = k CO 2 e 2 + Q CO 2 k L a CO 2 ( u 1 ) + r CO 2
The corresponding discrete time realization including the CO2 estimator ( Q ^ CO 2 , n ) from Section 3.2.4 is given by
u 3 , n = r CO 2 + k CO 2 e 2 , n + Q ^ CO 2 , n k L a CO 2 ( u 1 , n )
where e 2 , n = r CO 2 x 2 , n with x 2 , n = x 2 ( n T d ) .

3.2.3. Flow Rate Calculation

Control laws (15) and (23) provide the fractions of O2 and CO2 in the inlet gas composition. Besides O2 and CO2, the inlet gas composition contains H2 and N2. The flow rate of H2, i.e., q H 2 , is directly chosen by the operator, while the N2 flow rate ( q N 2 ) is used as a filling gas to maintain the desired concentrations. The actual flow rates can therefore be calculated as
q O 2 = u 1   u 2 , n ,
q CO 2 = u 1   u 3 , n ,
q N 2 = u 1 q O 2 , n q CO 2 , n q H 2 , n ,
where u 1 represents the total flow rate, as defined by the operator.

3.2.4. Estimator Design

The estimators are based on a steady-state assumption for which all dynamics of the mass transfer, the bicarbonate buffer and the probe reading are settled. Equations (9a)–(9d) in a steady state are given by
0 = k L a O 2 ( u 1 ) ( u 2 x 1 ) Q O 2 ,
0 = k L a CO 2 ( u 1 ) ( u 3 x 2 ) k 1 x 2 + k 1 k h x 3 Q CO 2 ,
  0 = k 1 x 2 k 1 k h x 3 ,
0 = ξ ( x 2 x 4 ) ,
which further simplifies to
0 = k L a O 2 ( u 1 ) ( u 2 x 1 ) Q O 2 ,
0 = k L a CO 2 ( u 1 ) ( u 3 x 4 ) Q CO 2 .
The similarity of Equations (28a) and (28b) allows suitable estimators to be derived for Q O 2 and Q CO 2 based on the follow general formulation:
0 = k L a ( u 1 ) ( u j x ) Q ,
with j 2 , 3 , and x, k L a and Q are replaced, respectively, for O2 and CO2. Rewriting Equation (29) yields the uptake rate:
Q = k L a ( u 1 ) ( u j x ) .
Note that all quantities on the right-hand side of Equation (30) are known either by measurement or due to the control algorithms. In order to account for the slowly time-varying uptake rates and model inaccuracies, a recursive least squares estimation of the individual uptake rates is proposed in this paper. Defining the error ( ϵ ) as the deviation of the uptake rate (Q) relative to its corresponding estimate Q ^ , i.e.,
ϵ = Q Q ^ = k L a ( u 1 ) ( u j x ) Q ^ ,
allows for computation of the estimated uptake rates by minimizing the cost function,
J = min Q ^ ϵ 2 ,
with respect to Q ^ . This least squares optimization problem is solved by the recursive algorithm
Q ^ n + 1 = Q ^ n + k Q · ϵ
= Q ^ n + k Q ( Q Q ^ n )
    = Q ^ n + k Q k L a ( u 1 ) ( u j x ) Q ^ n ,
given an initial rate ( Q ^ 0 ) and a constant tuning parameter ( k Q ) (see, e.g., [28]). The algorithm eventually converges to
lim n Q ^ n = Q   ,
assuming that the estimator iterates sufficiently rapidly compared to the volatility of the actual bacterial uptake rate.

3.2.5. Parameter Identification

The parameters given in Table 2 were verified with the help of the Matlab (Copyright 1990–2020 The MathWorks, Inc.) software package. Several experiments were conducted in the lab by applying various inlet gas compositions to the bioreactor while measuring the dissolved concentrations of O2 and CO2 inside the fermentation broth. The measured results were then compared with the simulation results of the model (see Section 3.1). Least squares optimization, which minimizes the error between the measurement results and the simulation output, was performed to determine the optimal set of model parameters listed in Table 2.

3.2.6. Controller Parameters

The derived controllers were implemented together with the identified model in Matlab and Simulink. The simulation allowed identified the appropriate initial values for the estimation and control parameters ( k Q , O 2 , k Q , CO 2 , k O 2 and k CO 2 ). These parameters were then fine-tuned during preliminary experiments on the fermenter in order to optimize for rise time, stability and tracking performance. The parameters used in the fermentation experiment (see Section 4) are shown in Table 3.

4. Results

Automatic control of chemolithotrophic fermentations is a key element to provide constant growth conditions for reproducible cultivation results. Elements of the setup reported herein included a standard bioreactor adapted for use in ex-zone 0 (removal of all possible ignition sources from the bioreactor and its immediate environment) and an automated controller of gas supply. The installation of an accurate controller with low deviations from target values requires tests of sensors without the biologic system and development of a mathematical model including gas mass transfer, gas consumption and sensor response time (in the case of CO2). After implementation of the control system, fermentations were performed under controlled conditions. Fine tuning of dissolved O2 concentrations facilitated a detailed study on the influence of dissolved O2 on growth and PHB production.

4.1. Parameter Identification

The proposed mathematical model (9) consisted of the parameters listed in Table 2, which were identified using measurement data (see Section 3.2.5). As an evaluation of the obtained mathematical model, known inlet gas mixtures were supplied to the reactor, and the dissolved concentrations of O2 and CO2 were measured with sensor probes inside the fermentation broth. Using the presented model parameters, a comparison between data obtained by measurement and simulation was carried out. As shown in Figure 3, the measured and simulated dissolved gas concentrations are in close accordance. The deviations between measurement data and simulation results for the dissolved O2 are approximately 1% up to a gas concentration of 75% O2 in the gas phase (a maximal error of ±3% was experienced at O2 concentrations of 100% O2 in the gas phase). The agreement between measured and simulated values of dissolved CO2 was higher for gas concentrations of 15% CO2 (error below 1%). The results for the CO2 simulation were less accurate for higher CO2 concentrations in the gas mixture. The dissolved CO2 concentration was overestimated by 4% at an CO2 concentration of 25% in the gas mixture. However, as maximal CO2 concentrations of 10% were previously used in experiments and the model captures the main dynamics of the process, the model is regarded as sufficiently accurate to serve as the basis for the design of model-based control algorithms.

4.2. Experimental Evaluation

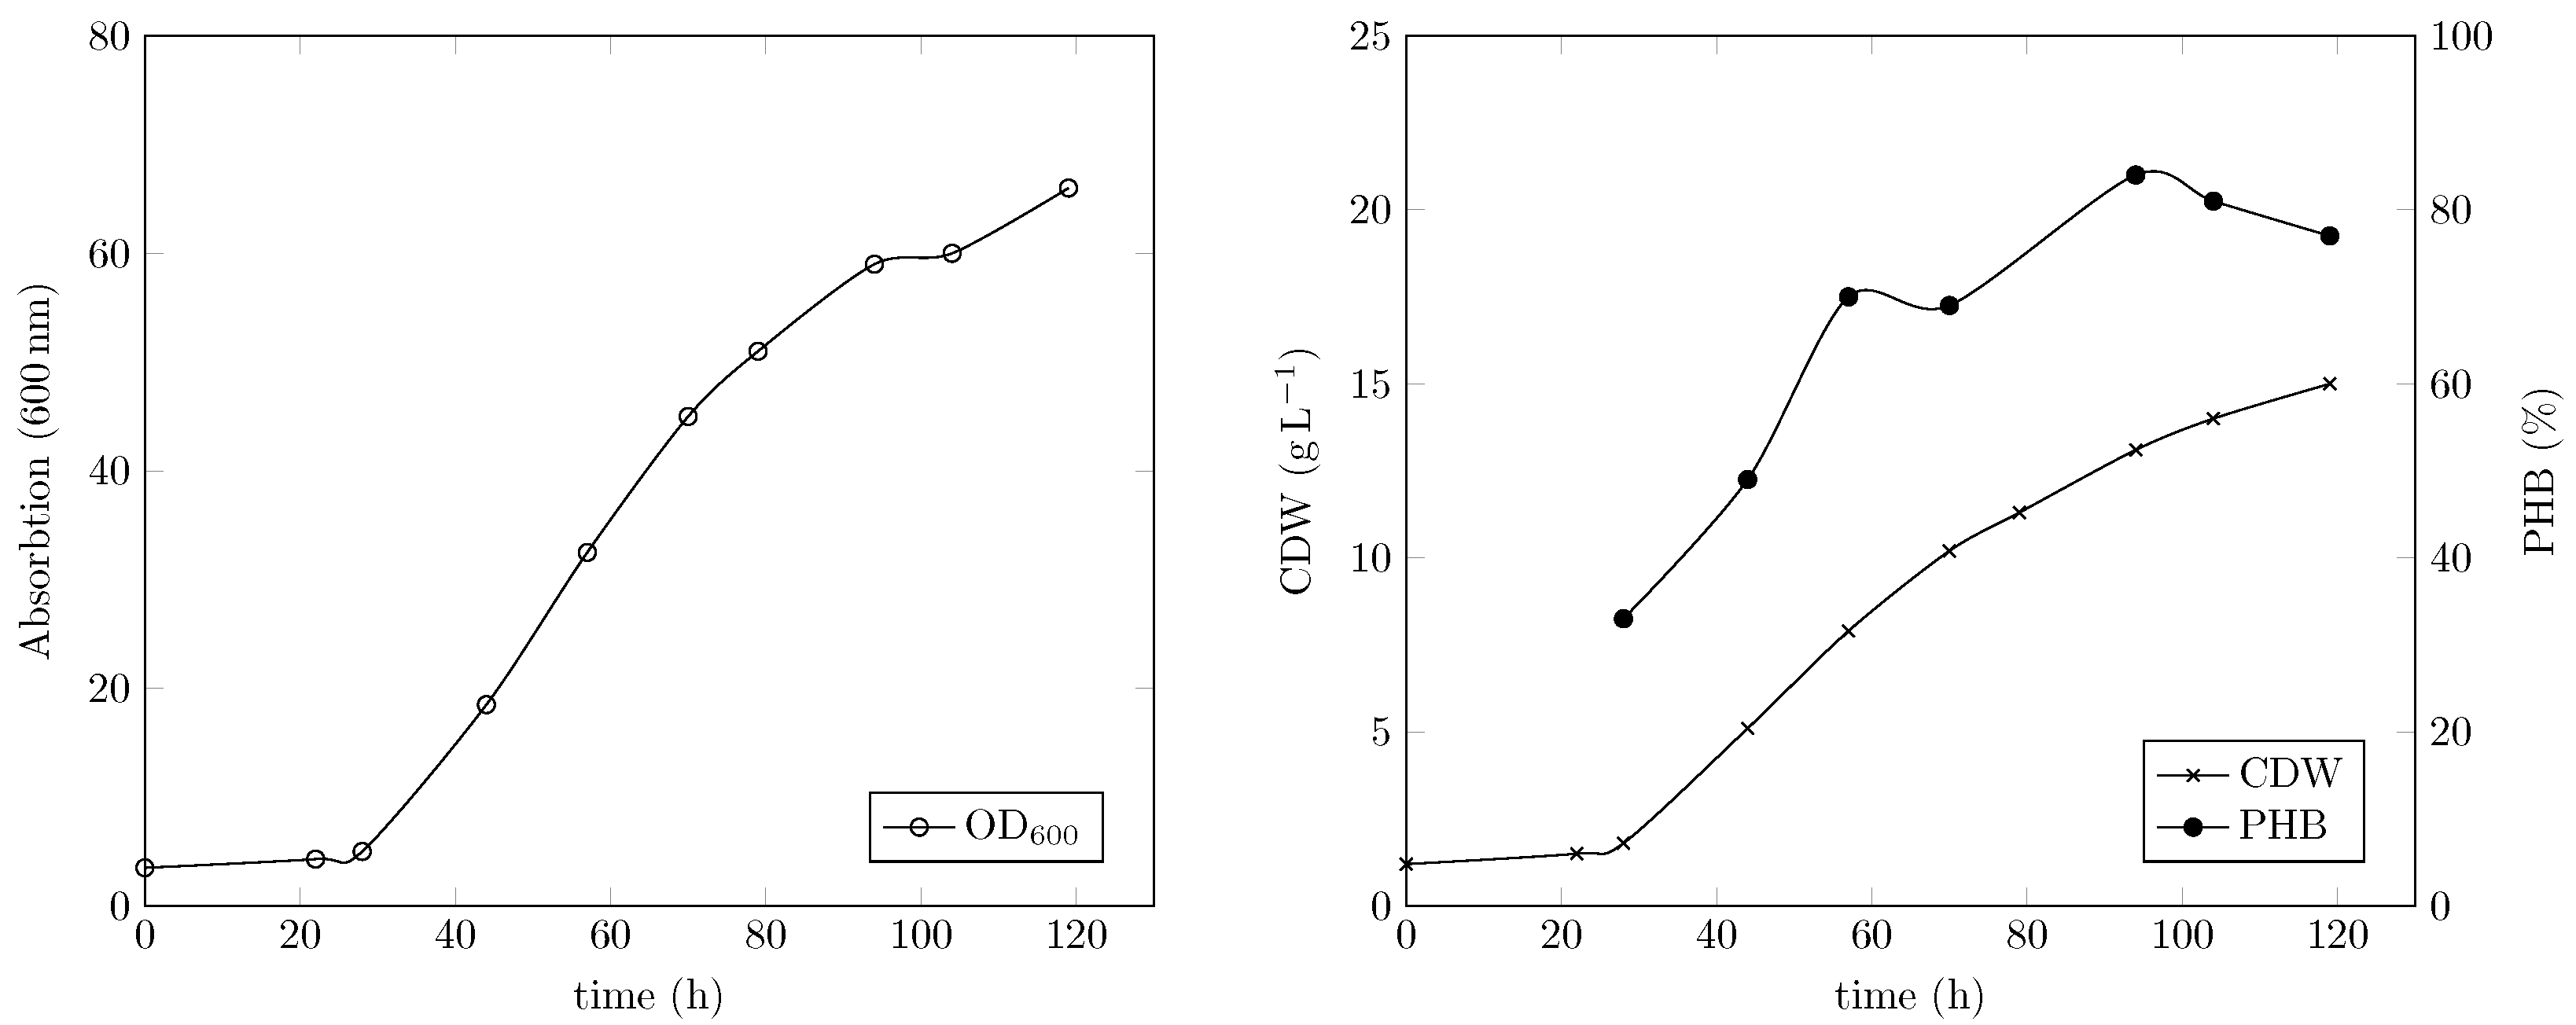
4.2.1. Fermentation Results and PHB Output

We previously reported a simple gas fermentation setup with manual O2 supply lacking temperature and pH control. Growth curves of C. necator, biomass concentrations and PHB content obtained in the used 1 L stirred jar reactor were highly reproducible. However, manual adaptation of gas flow rates was restricted to personal effort, and the accuracy of manual dosage was limited [14]. The obtained growth curves including cell dry weights and PHB contents were in agreement with results of the cultivations reported herein with the same C. necator strain and the same medium composition. The change in temperature from room temperature (22–24 °C [14]) to 30 °C (this study Figure 4) did not seem to impact growth. A comparison of growth curves obtained with automatically controlled or manually supplied O2 can be found in the Supplementary Data (Supplementary Figure S1). Furthermore, the change from gentle mixing (340 rpm) with a magnetic anchor stirrer in a Duran glass bottle to maximum speed (887 rpm) with a Rushton turbine in a baffled bioreactor did not affect the cells. Shear stress response of small microbial cells is highly unlikely, as C. necator has a maximal length of about 1.3 µm [16,25]. The difference in mixing efficiency was reflected in the k L a values obtained with the used bioreactors. The previously used stirred Duran bottle had a k L a value of 33 h−1 at 340 rpm and a gas flow of 400 NmL/min, while the Labfors bioreactor had a k L a value of 110 h−1 at 887 rpm and a gas flow of 1000 NmL/min (measured with the “static gassing-out” method [14]). The higher k L a value in the Labfors bioreactor allowed the use of lower O2 concentrations in the gas mixture, achieving sufficient O2 supply (2). The maximally required O2 content in the stirred Duran bottle was 21%, whereas with the Labfors, 8% was sufficient (Supplementary Figure S2). Therefore, the risk of explosion was significantly reduced, as the explosion pressure and rate are directly connected to O2 availability. Unfortunately, 887 rpm represented the maximal impeller speed from a technical point of view.

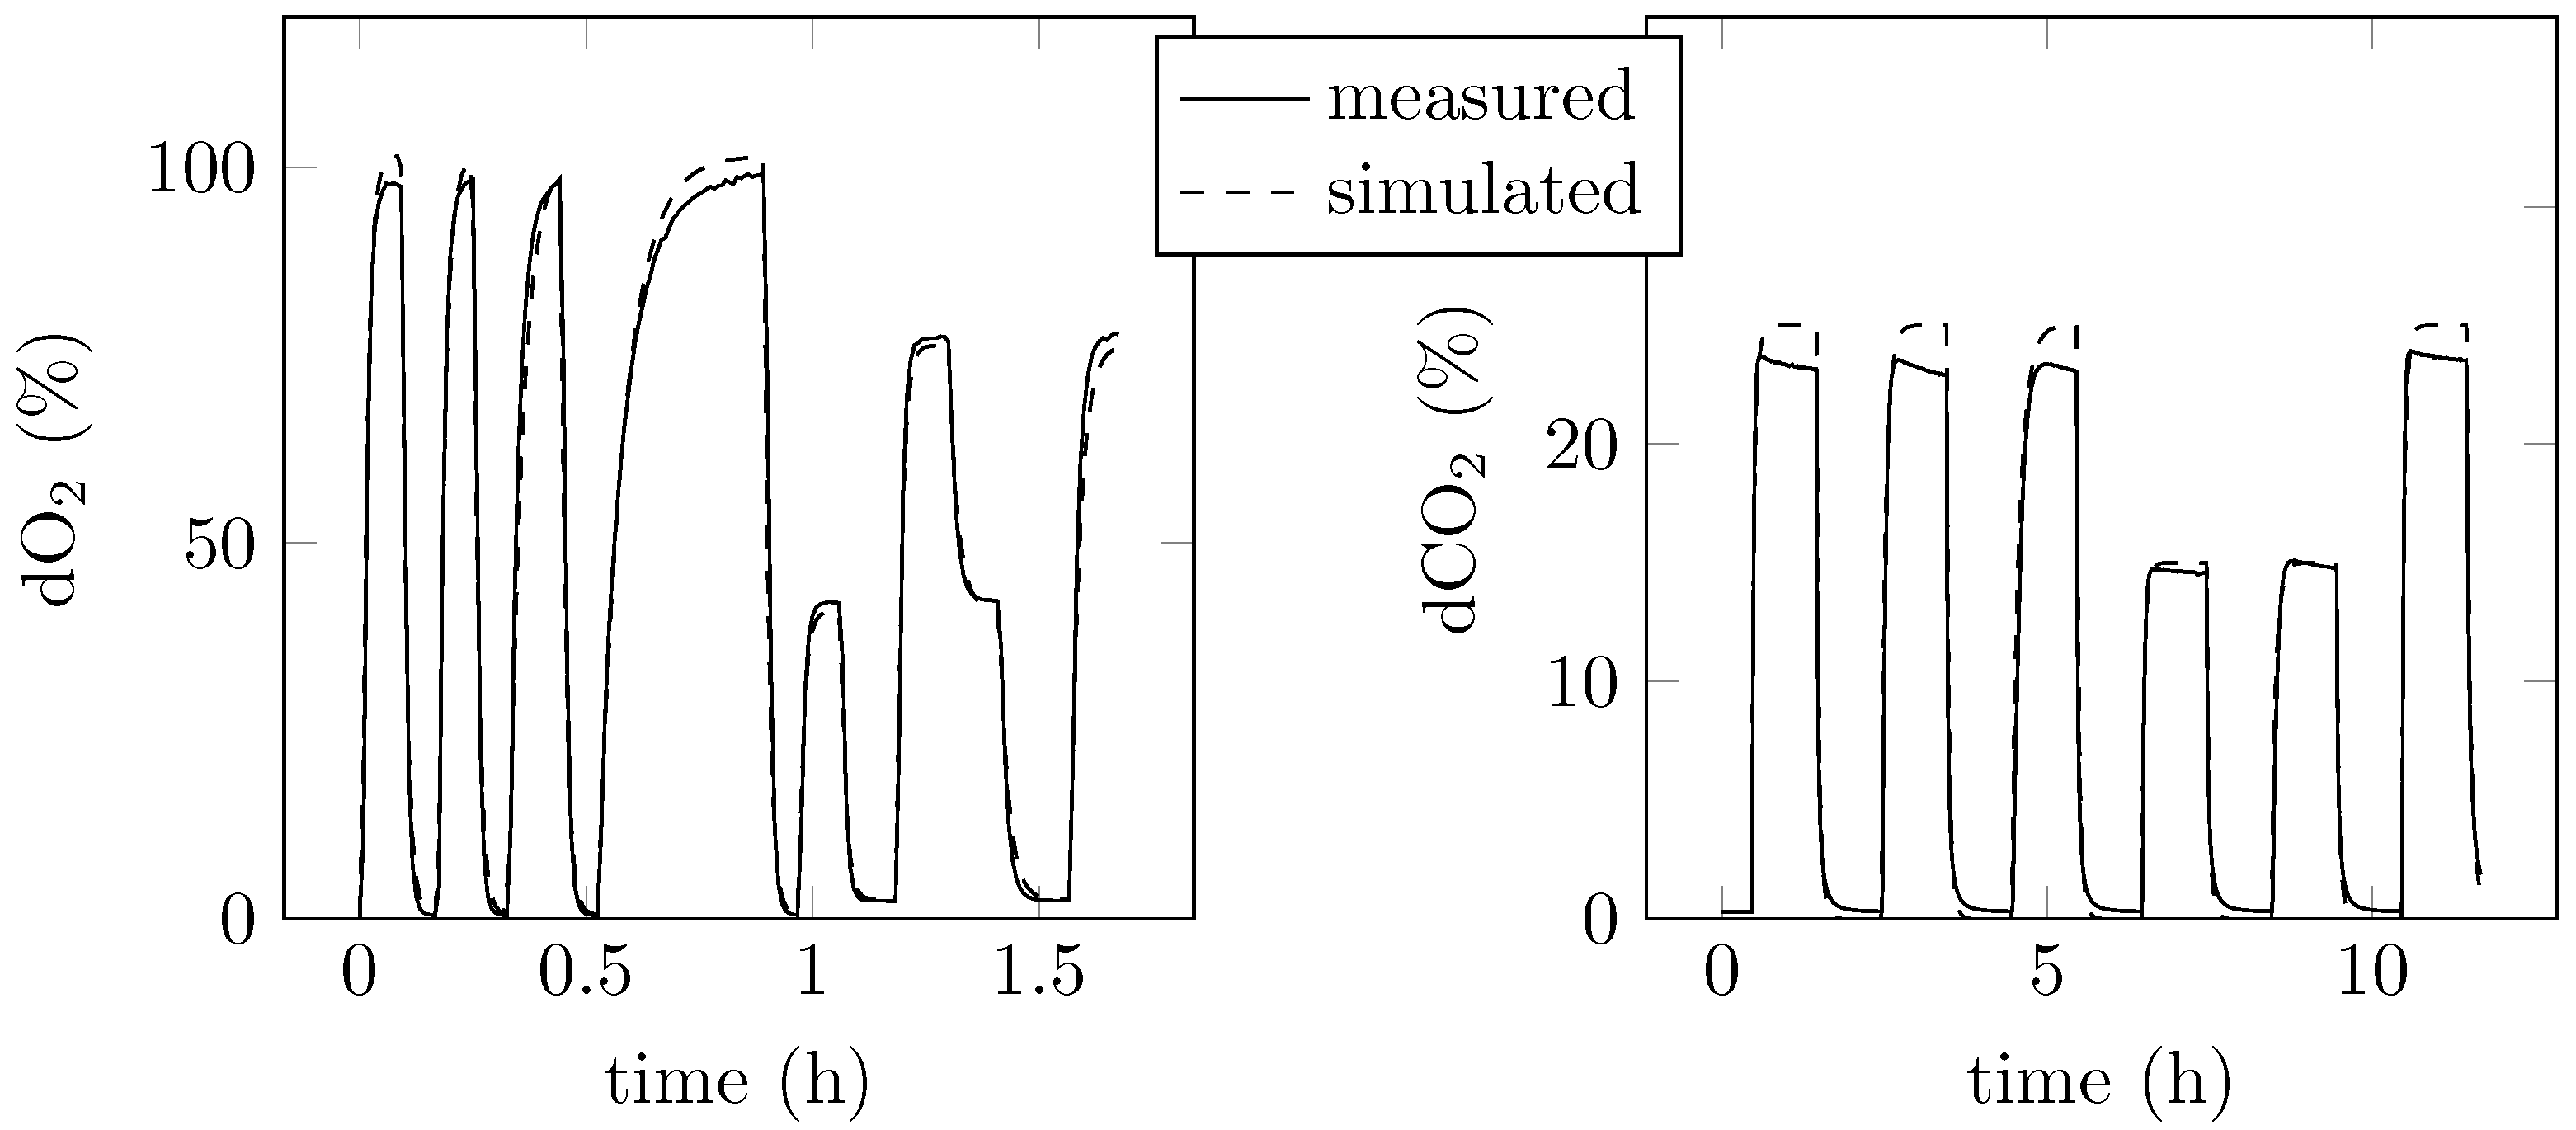
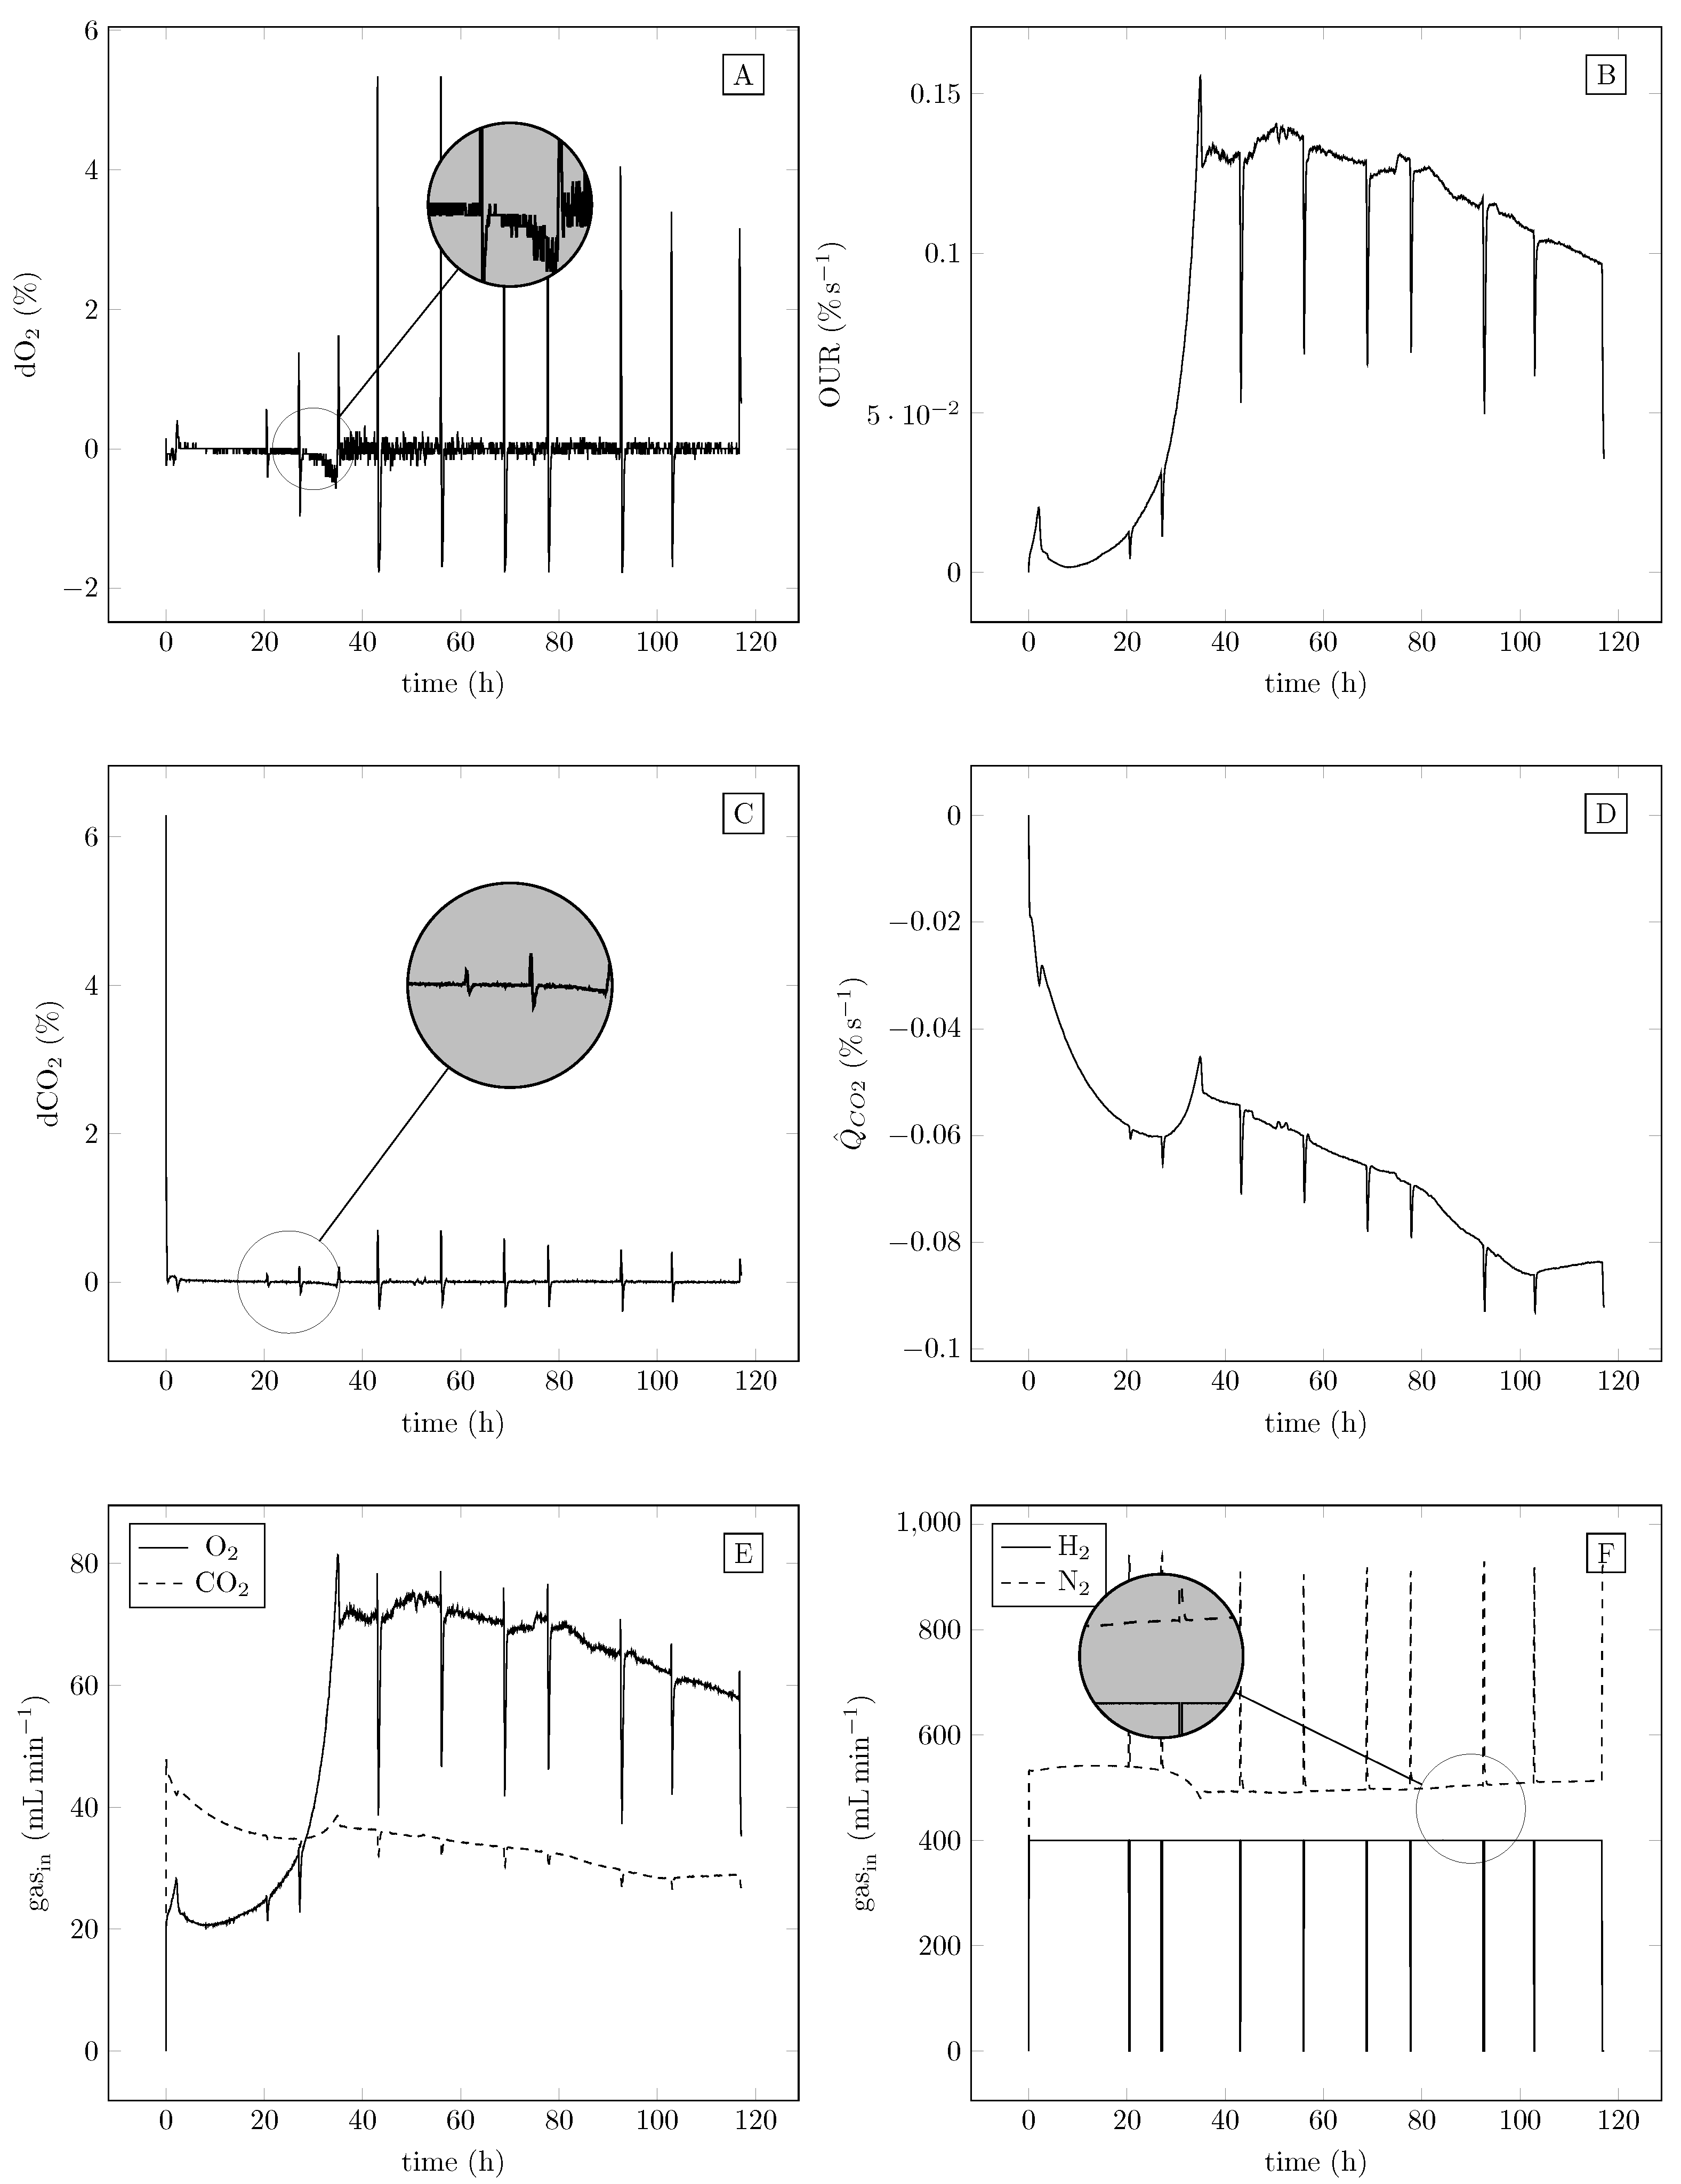
4.2.2. Data and Controller Performance

The performance of the controllers and estimators is shown by the experimental results presented in Figure 5. Note that the spikes in the individual subplots of Figure 5 occur due to measurement sampling events, as during sampling, the H2 gas flow was switched off. The control errors of both the O2 controller and the CO2 controller were negligibly small during the entire course of the experiment. This can be seen in the zoomed-in plots (located in the individual plots) of the control error evolutions. Hence, the measured O2 and CO2 values were close to their reference values. The estimated uptake rate with respect to the O2 dynamics also indicates reasonable behavior. Under non-limiting conditions, gas cultivation up to 2.8 mmol L−1 per CDW per hour (87 mg O2 per CDW per hour) was utilized by the cells. This is slightly lower than that reported by Lu and Yu 2017 [29], who obtained values between 4.4 and 85 mmol per CDW per hour depending on the limiting gas (H2, O2 or CO2). Looking into O2 inlet gas concentrations and OUR, it is possible to track the different growth phases of C. necator (Figure 5). In the first hours, remaining fructose from preculture was consumed, as evidenced by a rapid increase in O2 inlet gas flow concentration. Afterwards, the flow rate decreased as cells changed their metabolism to adapt to the new chemolithotrophic environment. The end of the lag phase was detected by a further increase in OUR and O2 concentration. N limitation was detected, as OUR stagnated (after approx. 30 h, Figure 5) when cells could no longer divide and started to store PHB. Over time, less O2 is needed to hold the desired level, as cells need less O2 during the PHB storage phase as they enter resting mode (PHB saturation). The evolution of the estimation of Q CO 2 showed negative values throughout the entire experiment, indicating that the uptake rate with respect to CO2 was dominated by the sum of other effects, such as inaccuracies in the model of k L a CO 2 ( u 1 ) , the neglected effect of sensor drift and a violation of the bicarbonate buffer steady-state assumption used in the development of the estimator. The time evolution of the automatically computed inlet gases is depicted in the lower plots in Figure 5. The controllers computed reasonable control actions, which were realized by the controlled valves. Furthermore, the spikes due to sampling events when H2 gas flow was switched off did not deteriorate the control loop performance. Note that this would not be the case if dynamic control algorithms without antiwindup methods were applied.

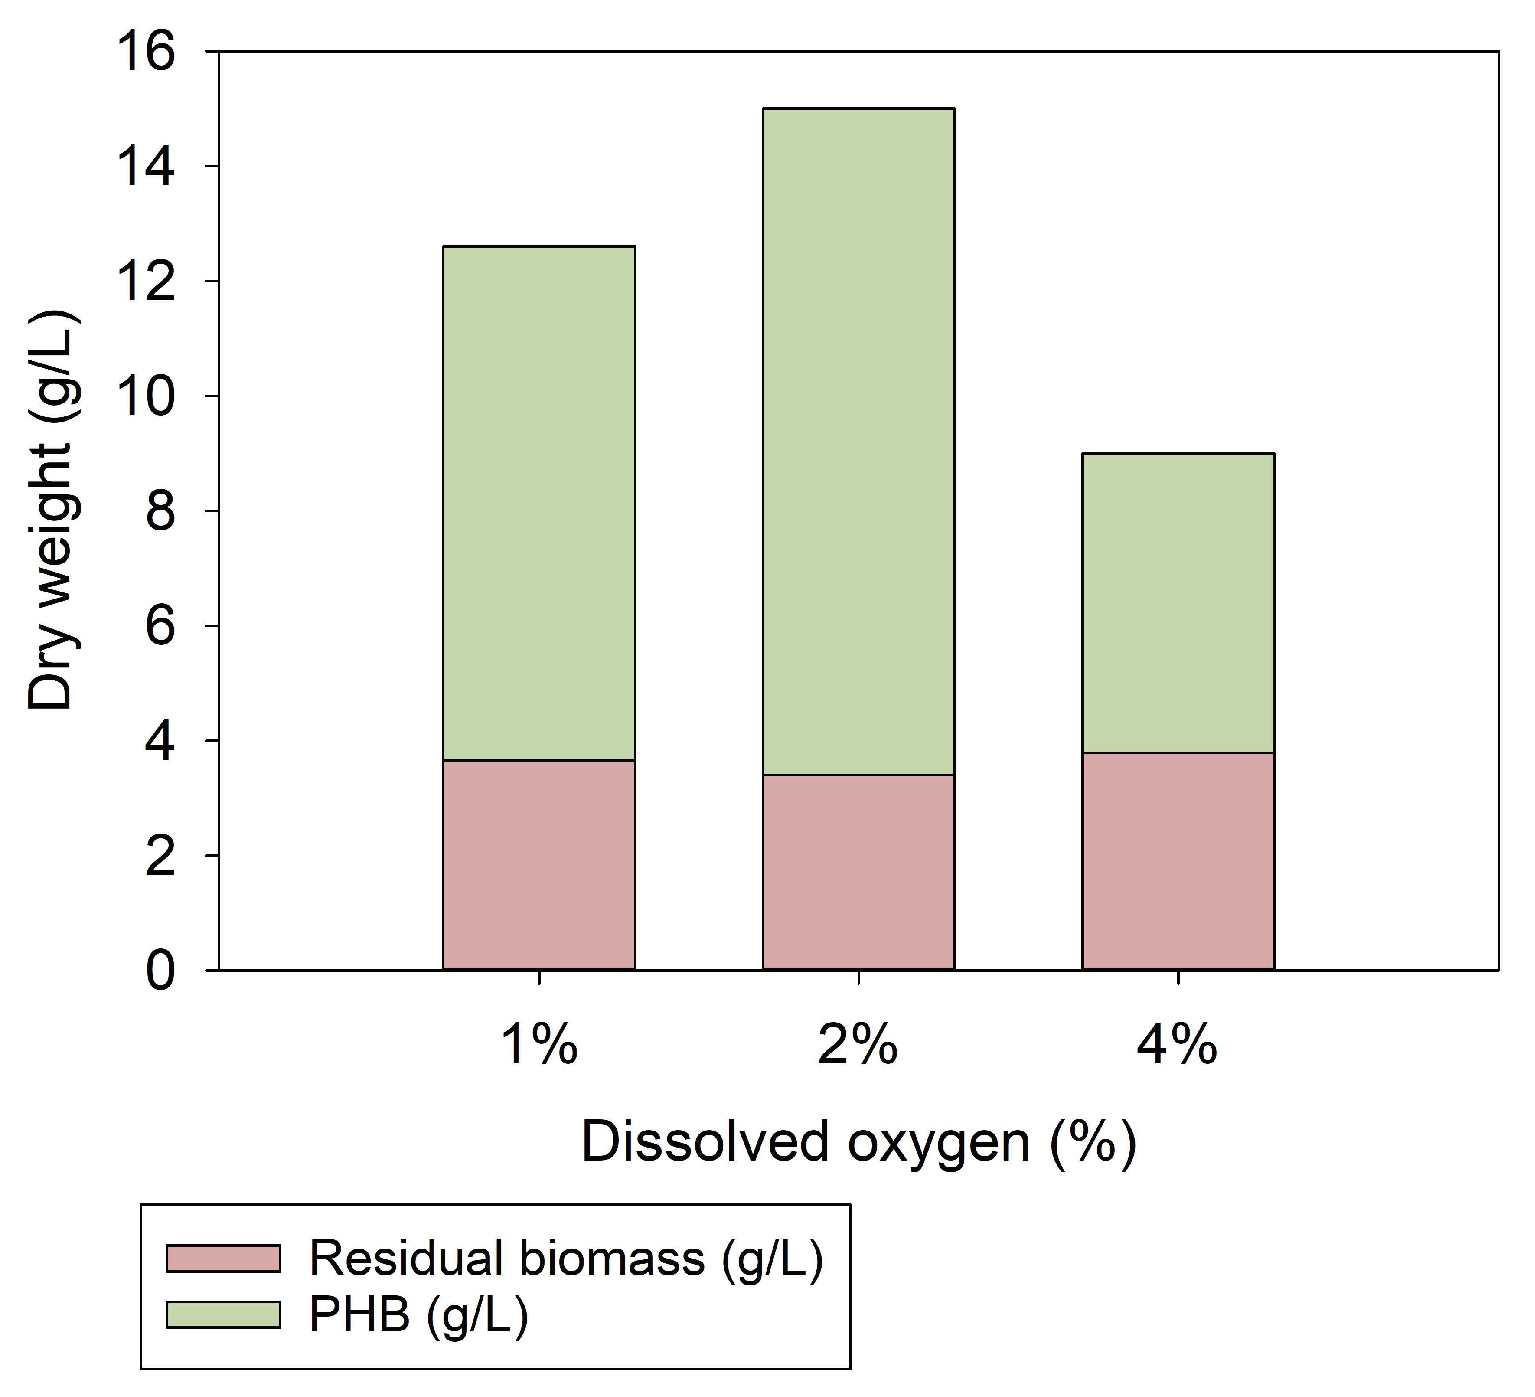
4.2.3. Gas Fermentation at Different dO2 Concentrations

During microbial batch and fed-batch cultivations, substrate uptake kinetics gradually changed with the increase in biomass. Furthermore, sudden changes may occur when, e.g., substrates are added or samples are withdrawn. The supply of O2 (and of other gases) to bioreactors can be manipulated by the gas content in the feed gas mixture, the gas flow rate, the reactor pressure and the stirrer speed. Standard benchtop bioreactors use conventional control algorithms such as PID connected to an agitation and airflow control cascade for the control of O2, pH and other parameters [30]. O2 demand is highly dynamic. The most-often cultivated fast-growing microbes (Escherichia coli and yeasts) are facultative anaerobes, i.e., they survive under aerobic and anaerobic conditions. Hence, oxygen limitation leads to slower growth but not to culture loss of facultative anaerobes. For growth and PHB production of C. necator under heterotrophic conditions, optimal dissolved oxygen concentrations of 40% (3.17 mg/L) and 20% (1.59 mg/L) air saturation were previously reported [31]. Sonnleitner et al. (1979) showed that oxygen concentrations >2.8 mg/L reduce growth and PHB production of C. necator H16 with lactic acid or CO2 as the carbon source [18]. Hence, it has been suggested that a general optimum for the dO2 concentration is independent of the carbon source. Higher O2 sensitivity of C. necator under chemolithotrophic growth conditions was attributed to O2 inhibition of the involved [NiFe]-hydrogenases [32]. We previously used an oxygen concentration of less than 5% dO2 (1.89 mg/L) [14]. However, the number of biotechnological labs equipped for tightly controlled Knallgas fermentations is restricted [17,30,33,34,35]. More often, C. necator is grown in closed bottles that are flushed with gases once or twice a day [36,37].
The bioreactor designed herein (ex-safe with tight control of dO2) allowed for precise adjustment of dissolved oxygen in very low concentration ranges. The effect of 1, 2 and 4% dO2 on biomass and PHB formation in cultivations of C. necator is summarized in Figure 6. The residual biomass in all gas cultivations was 3.6 ± 0.2 g/L. By doubling the oxygen concentration from 2% (0.75 mg/L) to 4% (1.51 mg/L) dO2, growth rates (µmax(2%) = 0.056, µmax(4%) = 0.016) were up to 70% reduced while PHB production rates (µmaxPHB(2%) = 0.057, µmaxPHB(4% = 0.038) were 33% reduced (Supplementary Table S2, Figures S3–S5). Reducing the dO2 from 2% to 1% (0.38 mg/L) slightly lowered the total biomass (20%) and PHB content (8%), while growth and PHB storage rates were approximately the same. With 1% dO2, however, the oxygen concentration in the gas phase remained below the lower explosion limit (LEL) throughout the whole gas cultivation. The maximal O2 concentration in the supply gas was 4% [15]. Although the maximally applied 4% O2 was below the LEL of 4.8% O2, the directives for the minimum safety requirements for workplaces and equipment still applied. A reduction in the O2 concentration in the gas phase to 50% of the LEL (hence, 2.4% O2) would be required to offset Austrian and European safety regulations (ATEX directives RL 1999/92/EG and RL 2014/34/EU). However, a permanent reduction in the prevailing ex-zone from 0 to 1 or 2 would render the cultivation setup drastically cheaper and lower the explosion risk. The observed high impact of dO2 on the biomass production (residual biomass plus PHB) might shed a different light on previously published data. Inconstant dO2 concentrations might have covered effects and led to more complex relationships than assumed.

5. Discussion

Gas fermentation is an upcoming technology utilizing microorganisms to convert (waste) gases such as CO2, CO, syngas or CH4 into value-added products (platform chemicals, fuels, polymers or amino-acid-rich biomass). Handling gaseous substrates is, in itself, technically difficult. However, it becomes particularly difficult with toxic, flammable or even explosive gases or gas mixtures. In this context, the cultivation of HOBs stands out in particular, as they are efficiently grown on a gas mixture composed of CO2, H2 and O2 with H2 as the main part. The gaseous substrates H2 and O2 form explosive oxyhydrogen mixtures within wide mixing ratios (explosion limits of 4.8 and 95.2% H2) and very low minimum ignition energies (MIE ≥ 0.016 mJ). Ignition of stoichiometric H2 and O2 mixtures (H2:O2 = 2:1) leads to maximum pressure peaks and pressure rise rates [38]. From a technological point of view, it is therefore advantageous to remain as far below the stoichiometric O2 concentration as possible—in the best case, below the lower explosion limit of 4.8% O2. Therefore, it is important to add just enough O2 for the growth of microorganisms. Narrow limits for dissolved O2 were reported for the growth of C. necator and PHB formation: for growth, approximately 0.4 to 1.5 mg/mL (corresponding to 1.3 and 4% O2 saturation) was considered optimal. For PHB production, microbial O2 demand is considered to be approximately halved (14, 19). Reasons for vague data specifications include, on the one, hand technical difficulties in fine tuning and precise measurement of very low O2 concentrations and, on the other hand, the high number of C. necator strains used in the literature. High-precision control of O2 supply is therefore a cornerstone of process safety and of paramount importance from a biological point of view. A low O2 concentration in the gas phase reduces the probability of an explosion, as well as the explosion pressure in case of an accident (O2 below the LEL). Automation increases process reliability and reproducibility and reduces manual work at the bioreactor, which constitutes a further level of personal safety and reduced personnel costs.

Supplementary Materials

The following supporting information can be downloaded at https://www.mdpi.com/article/10.3390/fermentation9070619/s1, Table S1: Comparison of fermentation conditions. Figure S1: Comparison of two independent fermentations. Figure S2: Comparison of oxygen concentration in gas feed during fermentation. Table S2: Maximal rate (µmax) of growth, PHB storage and death phase at different dissolved oxygen concentrations of 1, 2 and 4%. Table S3: All data points from the fermentations. Figure S3: Growth phases and corresponding maximal rates during fermentation with 1% dissolved oxygen. Figure S4: Growth phases and corresponding maximal rates during fermentation with 2% dissolved oxygen. Figure S5: Growth phases and corresponding maximal rates during fermentation with 4% dissolved oxygen. Raw data of all fermentations can be found in the corresponding excel file.

Author Contributions

Conceptualization, V.L., V.S., M.R. and R.K.; methodology, V.L., A.P., Z.P. and M.R.; software, A.P., Z.P. and M.R.; validation, V.L., A.P. and M.R.; formal analysis, A.P. and M.R.; investigation, V.L.; resources, R.K. and C.H.; data curation, V.L. and A.P.; writing—original draft preparation, V.L., A.P., R.K. and M.R.; writing—review and editing, Z.P., V.S., C.H., R.K. and M.R.; visualization, V.L. and A.P.; supervision, Z.P., V.S., R.K. and M.R.; project administration, V.L., V.S. and R.K.; funding acquisition, C.H. and R.K. All authors have read and agreed to the published version of the manuscript.

Funding

The COMET center ACIB: Next Generation Bioproduction was funded by BMK, BMDW, SFG, Standortagentur Tirol, the Government of Lower Austria and the Vienna Business Agency within the framework of COMET—Competence Centers for Excellent Technologies. The COMET-Funding Program was managed by the Austrian Research Promotion Agency FFG (funding number 872161). Role of funding: employment of Vera Lambauer and Alexander Permann, financing cultivation equipment (portable).

Institutional Review Board Statement

Not applicable.

Informed Consent Statement

Informed consent was obtained from all subjects involved in the study.

Data Availability Statement

The data presented in this study are available in Supplementary material.

Acknowledgments

We thank TU Graz for supporting our publication through the TU Graz Open Access Publishing Fund. We thank the Faculty of Technical Chemistry, Chemical and Process Engineering, Biotechnology, Graz University of Technology, for providing gas cultivation equipment (non-portable). We thank Markus Raiber, Markus Sackl, Markus Müller and Heinz Strauß from the Institute of Thermal Engineering, Graz University of Technology, for discussions and practical support in H2 handling and bioreactor setup. We thank Alexander Sigg for process engineering support. We thank Robert Kourist for GC measurements. Open Access Funding by the Graz University of Technology.

Conflicts of Interest

The authors declare no conflict of interest. The funders had no role in the design of the study; in the collection, analyses or interpretation of data; in the writing of the manuscript; or in the decision to publish the results.

Abbreviations

The following abbreviations are used in this manuscript:
CDWCell dry weight (g L−1)
OD600Optical density at 600 nm
PHBPoly-(R)-3-hydroxybutyrate
PHAPolyhydroxyalkanoates
ATEXAbbreviation from french “atmosphères explosibles” = explosive atmosphere
HOBsHydrogen-oxidizing bacteria
MFCsMass flow controllers (mL min−1)
dO2Dissolved oxygen concentration (%)
dCO2Dissolved carbon dioxide concentration (%)
LELLower explosion limit

References

  1. Honegger, M.; Michaelowa, A.; Roy, J. Potential implications of carbon dioxide removal for the sustainable development goals. Clim. Policy 2021, 21, 678–698. [Google Scholar] [CrossRef]
  2. Hilaire, J.; Minx, J.C.; Callaghan, M.W.; Edmonds, J.; Luderer, G.; Nemet, G.F.; Rogelj, J.; del Mar Zamora, M. Negative emissions and international climate goals-learning from and about mitigation scenarios. Clim. Chang. 2019, 157, 189–219. [Google Scholar] [CrossRef] [Green Version]
  3. Bistline, J.E.T.; Blanford, G.J. Impact of carbon dioxide removal technologies on deep decarbonization of the electric power sector. Nat. Commun. 2021, 12, 3732. [Google Scholar] [CrossRef]
  4. Ghiat, I.; Mahmood, F.; Govindan, R.; Al-Ansari, T. CO2 utilisation in agricultural greenhouses: A novel ‘plant to plant’ approach driven by bioenergy with carbon capture systems within the energy, water and food Nexus. Energy Convers. Manag. 2021, 228, 113668. [Google Scholar] [CrossRef]
  5. Anwar, M.; Fayyaz, A.; Sohail, N.; Khokhar, M.; Baqar, M.; Yasar, A.; Rasool, K.; Nazir, A.; Raja, M.; Rehan, M.; et al. CO2 utilization: Turning greenhouse gas into fuels and valuable products. J. Environ. Manag. 2020, 260, 110059. [Google Scholar] [CrossRef]
  6. Lu, Y.; Yu, J. Comparison analysis on the energy efficiencies and biomass yields in microbial CO2 fixation. Process. Biochem. 2017, 62, 151–160. [Google Scholar] [CrossRef]
  7. Köpke, M.; Simpson, S.D. Pollution to products: Recycling of ‘above ground’ carbon by gas fermentation. Curr. Opin. Biotechnol. 2020, 65, 180–189. [Google Scholar] [CrossRef]
  8. Fackler, N.; Heijstra, B.D.; Rasor, B.J.; Brown, H.; Martin, J.; Ni, Z.; Shebek, K.M.; Rosin, R.R.; Simpson, S.D.; Tyo, K.E.; et al. Stepping on the gas to a circular economy: Accelerating development of carbon-negative chemical production from gas fermentation. Annu. Rev. Chem. Biomol. Eng. 2021, 12, 439–470. [Google Scholar] [CrossRef] [PubMed]
  9. Teixeira, L.V.; Moutinho, L.F.; Romão-Dumaresq, A.S. Gas fermentation of C1 feedstocks: Commercialization status and future prospects. Biofuels Bioprod. Biorefining 2018, 12, 1103–1117. [Google Scholar] [CrossRef]
  10. Kusian, B.; Bowien, B. Organization and regulation of cbb CO2 assimilation genes in autotrophic bacteria. FEMS Microbiol. Rev. 1997, 21, 135–155. [Google Scholar] [CrossRef]
  11. Pohlmann, A.; Fricke, W.F.; Reinecke, F.; Kusian, B.; Liesegang, H.; Cramm, R.; Eitinger, T.; Ewering, C.; Pötter, M.; Schwartz, E.; et al. Genome sequence of the bioplastic-producing “Knallgas” bacterium Ralstonia eutropha H16. Nat. Biotechnol. 2006, 24, 1257–1262. [Google Scholar] [CrossRef] [Green Version]
  12. Sohn, Y.J.; Son, J.; Jo, S.Y.; Park, S.Y.; Yoo, J.I.; Baritugo, K.A.; Na, J.G.; il Choi, J.; Kim, H.T.; Joo, J.C.; et al. Chemoautotroph Cupriavidus necator as a potential game-changer for global warming and plastic waste problem: A review. Bioresour. Technol. 2021, 340, 125693. [Google Scholar] [CrossRef] [PubMed]
  13. Markl, E. PHB - Bio based and biodegradable replacement for PP: A review. Nov. Tech. Nutr. Food Sci. 2018, 2, 206–209. [Google Scholar] [CrossRef]
  14. Lambauer, V.; Kratzer, R. Lab-scale cultivation of Cupriavidus necator on explosive gas mixtures: Carbon dioxide fixation into polyhydroxybutyrate. Bioengineering 2022, 9, 204. [Google Scholar] [CrossRef]
  15. Schröder, V. Explosionsgrenzen von Wasserstoff und Wasserstoff/Methan-Gemischen; Technical Report; Wirtschaftsverlag NW: Bremerhaven, Germany, 2003. [Google Scholar]
  16. Tanaka, K.; Ishizaki, A.; Kanamaru, T.; Kawano, T. Production of poly(D-3-hydroxybutyrate) from CO2, H2, and O2 by high cell density autotrophic cultivation of Alcaligenes eutrophus. Biotechnol. Bioeng. 1995, 45, 268–275. [Google Scholar] [CrossRef]
  17. Garrigues, L.; Maignien, L.; Lombard, E.; Singh, J.; Guillouet, S.E. Isopropanol production from carbon dioxide in Cupriavidus necator in a pressurized bioreactor. New Biotechnol. 2020, 56, 16–20. [Google Scholar] [CrossRef]
  18. Sonnleitner, B.; Heinzle, E.; Braunegg, G.; Lafferty, R.M. Formal kinetics of poly-β-hydroxybutyric acid (PHB) production in Alcaligenes eutrophus H 16 and Mycoplana rubra R 14 with respect to the dissolved oxygen tension in ammonium-limited batch cultures. Eur. J. Appl. Microbiol. Biotechnol. 1979, 7, 1–10. [Google Scholar] [CrossRef]
  19. Islam Mozumder, M.S.; Garcia-Gonzalez, L.; Wever, H.D.; Volcke, E.I. Poly(3-hydroxybutyrate) (PHB) production from CO2: Model development and process optimization. Biochem. Eng. J. 2015, 98, 107–116. [Google Scholar] [CrossRef]
  20. Juengert, J.; Bresan, S.; Jendrossek, D. Determination of polyhydroxybutyrate (PHB) content in Ralstonia eutropha using gas chromatography and Nile red staining. Bio Protoc. 2018, 8, e2748. [Google Scholar] [CrossRef] [Green Version]
  21. Lewis, W.K.; Whitman, W.G. Principles of gas absorption. Ind. Eng. Chem. 1924, 16, 1215–1220. [Google Scholar] [CrossRef]
  22. Whitman, W.G. The two film theory of gas absorption. Int. J. Heat Mass Transf. 1962, 5, 429–433. [Google Scholar] [CrossRef]
  23. Lagneau, V.; Pipart, A.; Catalette, H. Reactive transportmodelling and long term behaviour of CO2 sequestration in saline aquifers. Oil Gas Sci. Technol.—Rev. IFP 2005, 60, 231–247. [Google Scholar] [CrossRef] [Green Version]
  24. Pedersen, O.; Colmer, T.; Sand-Jensen, K. Underwater photosynthesis of submerged plants—Recent advances and methods. Front. Plant Sci. 2013, 4, 140. [Google Scholar] [CrossRef] [PubMed] [Green Version]
  25. Doran, P.M. Chapter 10—Mass Transfer. In Bioprocess Engineering Principles, 2nd ed.; Doran, P.M., Ed.; Academic Press: London, UK, 2013; pp. 379–444. [Google Scholar] [CrossRef]
  26. Åström, K.J.; Hägglund, T.; Astrom, K.J. Advanced PID Control; ISA—The Instrumentation, Systems, and Automation Society: Research Triangle Park, NC, USA, 2006; Volume 461. [Google Scholar]
  27. Hippe, P. Windup in Control: Its Effects and Their Prevention; Springer Science & Business Media: Berlin/Heidelberg, Germany, 2006. [Google Scholar]
  28. Simon, D. Optimal State Estimation: Kalman, H Infinity, and Nonlinear Approaches; Wiley-Interscience: Hoboken, NJ, USA, 2006. [Google Scholar] [CrossRef]
  29. Lu, Y.; Yu, J. Gas mass transfer with microbial CO2 fixation and poly(3-hydroxybutyrate) synthesis in a packed bed bioreactor. Biochem. Eng. J. 2017, 122, 13–21. [Google Scholar] [CrossRef]
  30. Milder, R.; Kramer, W.; Doblhoff-Dier, O.; Bayer, K. Strategies for optimal dissolved oxygen (DO) control. IFAC Proc. Vol. 1995, 28, 292–295, In Proceedings of the 6th International Conference on Computer Applications in Biotechnology (CAB 6), Garmisch-Partenkirchen, Germany, 14–17 May 1995. [Google Scholar] [CrossRef]
  31. Atlić, A.; Koller, M.; Scherzer, D.; Kutschera, C.; Grillo-Fernandes, E.; Horvat, P.; Chiellini, E.; Braunegg, G. Continuous production of poly([R]-3-hydroxybutyrate) by Cupriavidus necator in a multistage bioreactor cascade. Appl. Microbiol. Biotechnol. 2011, 91, 295–304. [Google Scholar] [CrossRef]
  32. Lukey, M.J.; Roessler, M.M.; Parkin, A.; Evans, R.M.; Davies, R.A.; Lenz, O.; Friedrich, B.; Sargent, F.; Armstrong, F.A. Oxygen-tolerant [NiFe]-hydrogenases: The individual and collective importance of supernumerary cysteines at the proximal Fe-S cluster. J. Am. Chem. Soc. 2011, 133, 16881–16892. [Google Scholar] [CrossRef]
  33. Milker, S.; Sydow, A.; Torres-Monroy, I.; Jach, G.; Faust, F.; Kranz, L.; Tkatschuk, L.; Holtmann, D. Gram-scale production of the sesquiterpene α-humulene with Cupriavidus necator. Biotechnol. Bioeng. 2021, 118, 2694–2702. [Google Scholar] [CrossRef]
  34. Nyyssölä, A.; Ojala, L.S.; Wuokko, M.; Peddinti, G.; Tamminen, A.; Tsitko, I.; Nordlund, E.; Lienemann, M. Production of endotoxin-free microbial biomass for food applications by gas fermentation of Gram positive H2-oxidizing bacteria. ACS Food Sci. Technol. 2021, 1, 470–479. [Google Scholar] [CrossRef]
  35. Lai, Y.H.; Lan, J.C.W. Enhanced polyhydroxybutyrate production through incorporation of a hydrogen fuel cell and electro-fermentation system. Int. J. Hydrog. Energy 2021, 46, 16787–16800, In Proceedings of the SEGT-2019, Bangkok, Thailand, 11–14 December 2019. [Google Scholar] [CrossRef]
  36. Nangle, S.N.; Ziesack, M.; Buckley, S.; Trivedi, D.; Loh, D.M.; Nocera, D.G.; Silver, P.A. Valorization of CO2 through lithoautotrophic production of sustainable chemicals in Cupriavidus necator. Metab. Eng. 2020, 62, 207–220. [Google Scholar] [CrossRef] [PubMed]
  37. Tanaka, K.; Yoshida, K.; Orita, I.; Fukui, T. Biosynthesis of poly(3-hydroxybutyrate-co-3-hydroxyhexanoate) from CO2 by a recombinant Cupriavidus necator. Bioengineering 2021, 8, 179. [Google Scholar] [CrossRef] [PubMed]
  38. Xing, H.; Yu, R.; Xu, G.; Li, X.; Qiu, Y.; Wang, D.; Li, B.; Xie, L. Theoretical and experimental investigation of explosion characteristics of hydrogen explosion in a closed vessel. Energies 2022, 15, 8630. [Google Scholar] [CrossRef]
Figure 1. Schematic diagram of lab installations, the bioreactor equipped for gas cultivations and defined ex-zones (left). Image of the fermentation vessel during cultivation (right). (Open-source program diagrams.net © 2005–2021 JGraph Ltd. was used for figure preparation). Gas flow rates were regulated by mass flow controllers (MFCs). Statically mixed gas flowed into the bioreactor by passing through a magnetic valve. The magnetic valve was connected to the motor control unit, as well as the H2 gas detector placed in the fume hood (ex-zone 2). In case of H2 detection in ex-zone 2, the magnetic valve would be closed and the motor stopped. The bioreactor was equipped with a double-walled vessel for temperature control by a water bath, as well as O2 and CO2 sensors to measure dissolved gas concentrations in the liquid phase. MFCs, sensors and the temperature bath were connected to the computer and controlled via LabVIEW (National Instruments Corp.).
Fermentation 09 00619 g001
Figure 2. Overview of the control scheme with O2 and CO2 estimators.
Fermentation 09 00619 g002
Figure 3. Results of parameter identification for the dissolved oxygen (dO2 in %) and dissolved carbon dioxide (CO2 in %) models.
Fermentation 09 00619 g003
Figure 4. Cell density is provided in terms of optical density at 600 nm (OD600). Cell dry weight (CDW) is given in g. PHB is given in % relative to CDW.
Fermentation 09 00619 g004
Figure 5. Time course of controlled gas fermentation. Panels (A,C) show the evolution of the control errors for O2 and CO2, respectively. Panels (B,D) show the uptake rate estimations for O2 and CO2, respectively. Panel (E) shows the inlet gas flows of O2 and CO2, and panel (F) shows the inlet gas flows of H2 and N2. While O2, CO2 and N2 flows were automatically applied by the controller, H2 was switched off manually during sampling.
Fermentation 09 00619 g005
Figure 6. Dependence of biomass production on levels of dissolved oxygen. dO2 concentrations of 1%, 2% and 4% were tested. Doubling the oxygen concentration in the liquid phase from 2% to 4% (1.51 mg/L) reduced the total biomass and therefore the PHB by up to 50%. Reduction of dO2 from 2% to 1% led to a reduction of 20% in biomass and 5% in PHB. The residual biomass in all fermentations was 3 g/L.
Fermentation 09 00619 g006
Table 1. Description of the variables of the O2-CO2 mass transfer model. (* Disturbances).
VariableExplanation
States x 1 O2 dissolved concentration
x 2 CO2 dissolved concentration
x 3 HCO3 concentration
x 4 CO2 probe reading
Inputs u 1 Total inlet gas flow q g e s
u 2 O2 concentration in the inlet gas C O 2 *
u 3 CO2 concentration in the inlet gas C CO 2 *
Parameters k L a i O2 or CO2 mass transfer rate coefficient as a function of u 1
α i , β i O2 or CO2  k L a model parameters
k 1 Reaction rate from CO2 to HCO3
k 1 Reverse reaction rate from HCO3 to CO2
k H pH-dependent constant
ξ Reciprocal of the CO2 probe reading time constant
Dis * Q O 2 O2 estimator
Q CO 2 CO2 estimator
Table 2. Identified parameters of the proposed model (9).
O2 model α O 2 β O 2
0.08229.4149
CO2 model α CO 2 β CO 2 k 1 k 1 ξ
0.1440−1.26160.01856.4943 · 1040.0167
Table 3. Identified controller parameters.
k O 2 k CO 2 k Q , O 2 k Q , CO 2
0.0200.00010.0001
Disclaimer/Publisher’s Note: The statements, opinions and data contained in all publications are solely those of the individual author(s) and contributor(s) and not of MDPI and/or the editor(s). MDPI and/or the editor(s) disclaim responsibility for any injury to people or property resulting from any ideas, methods, instructions or products referred to in the content.

