
Assessment of the Microbiological Quality and Biochemical Parameters of Traditional Hard Xinotyri Cheese Made from Raw or Pasteurized Goat Milk


Abstract
:1. Introduction
2. Materials and Methods
2.1. Cheese-Making
2.2. Sampling
2.3. Microbiological Analyses
2.4. Biochemical Analyses
2.5. Statistical Analysis
3. Results and Discussion
3.1. Microbiological Characteristics of Hard Xinotyri Cheeses during Ripening and Storage
3.2. Biochemical Analyses
3.2.1. Composition
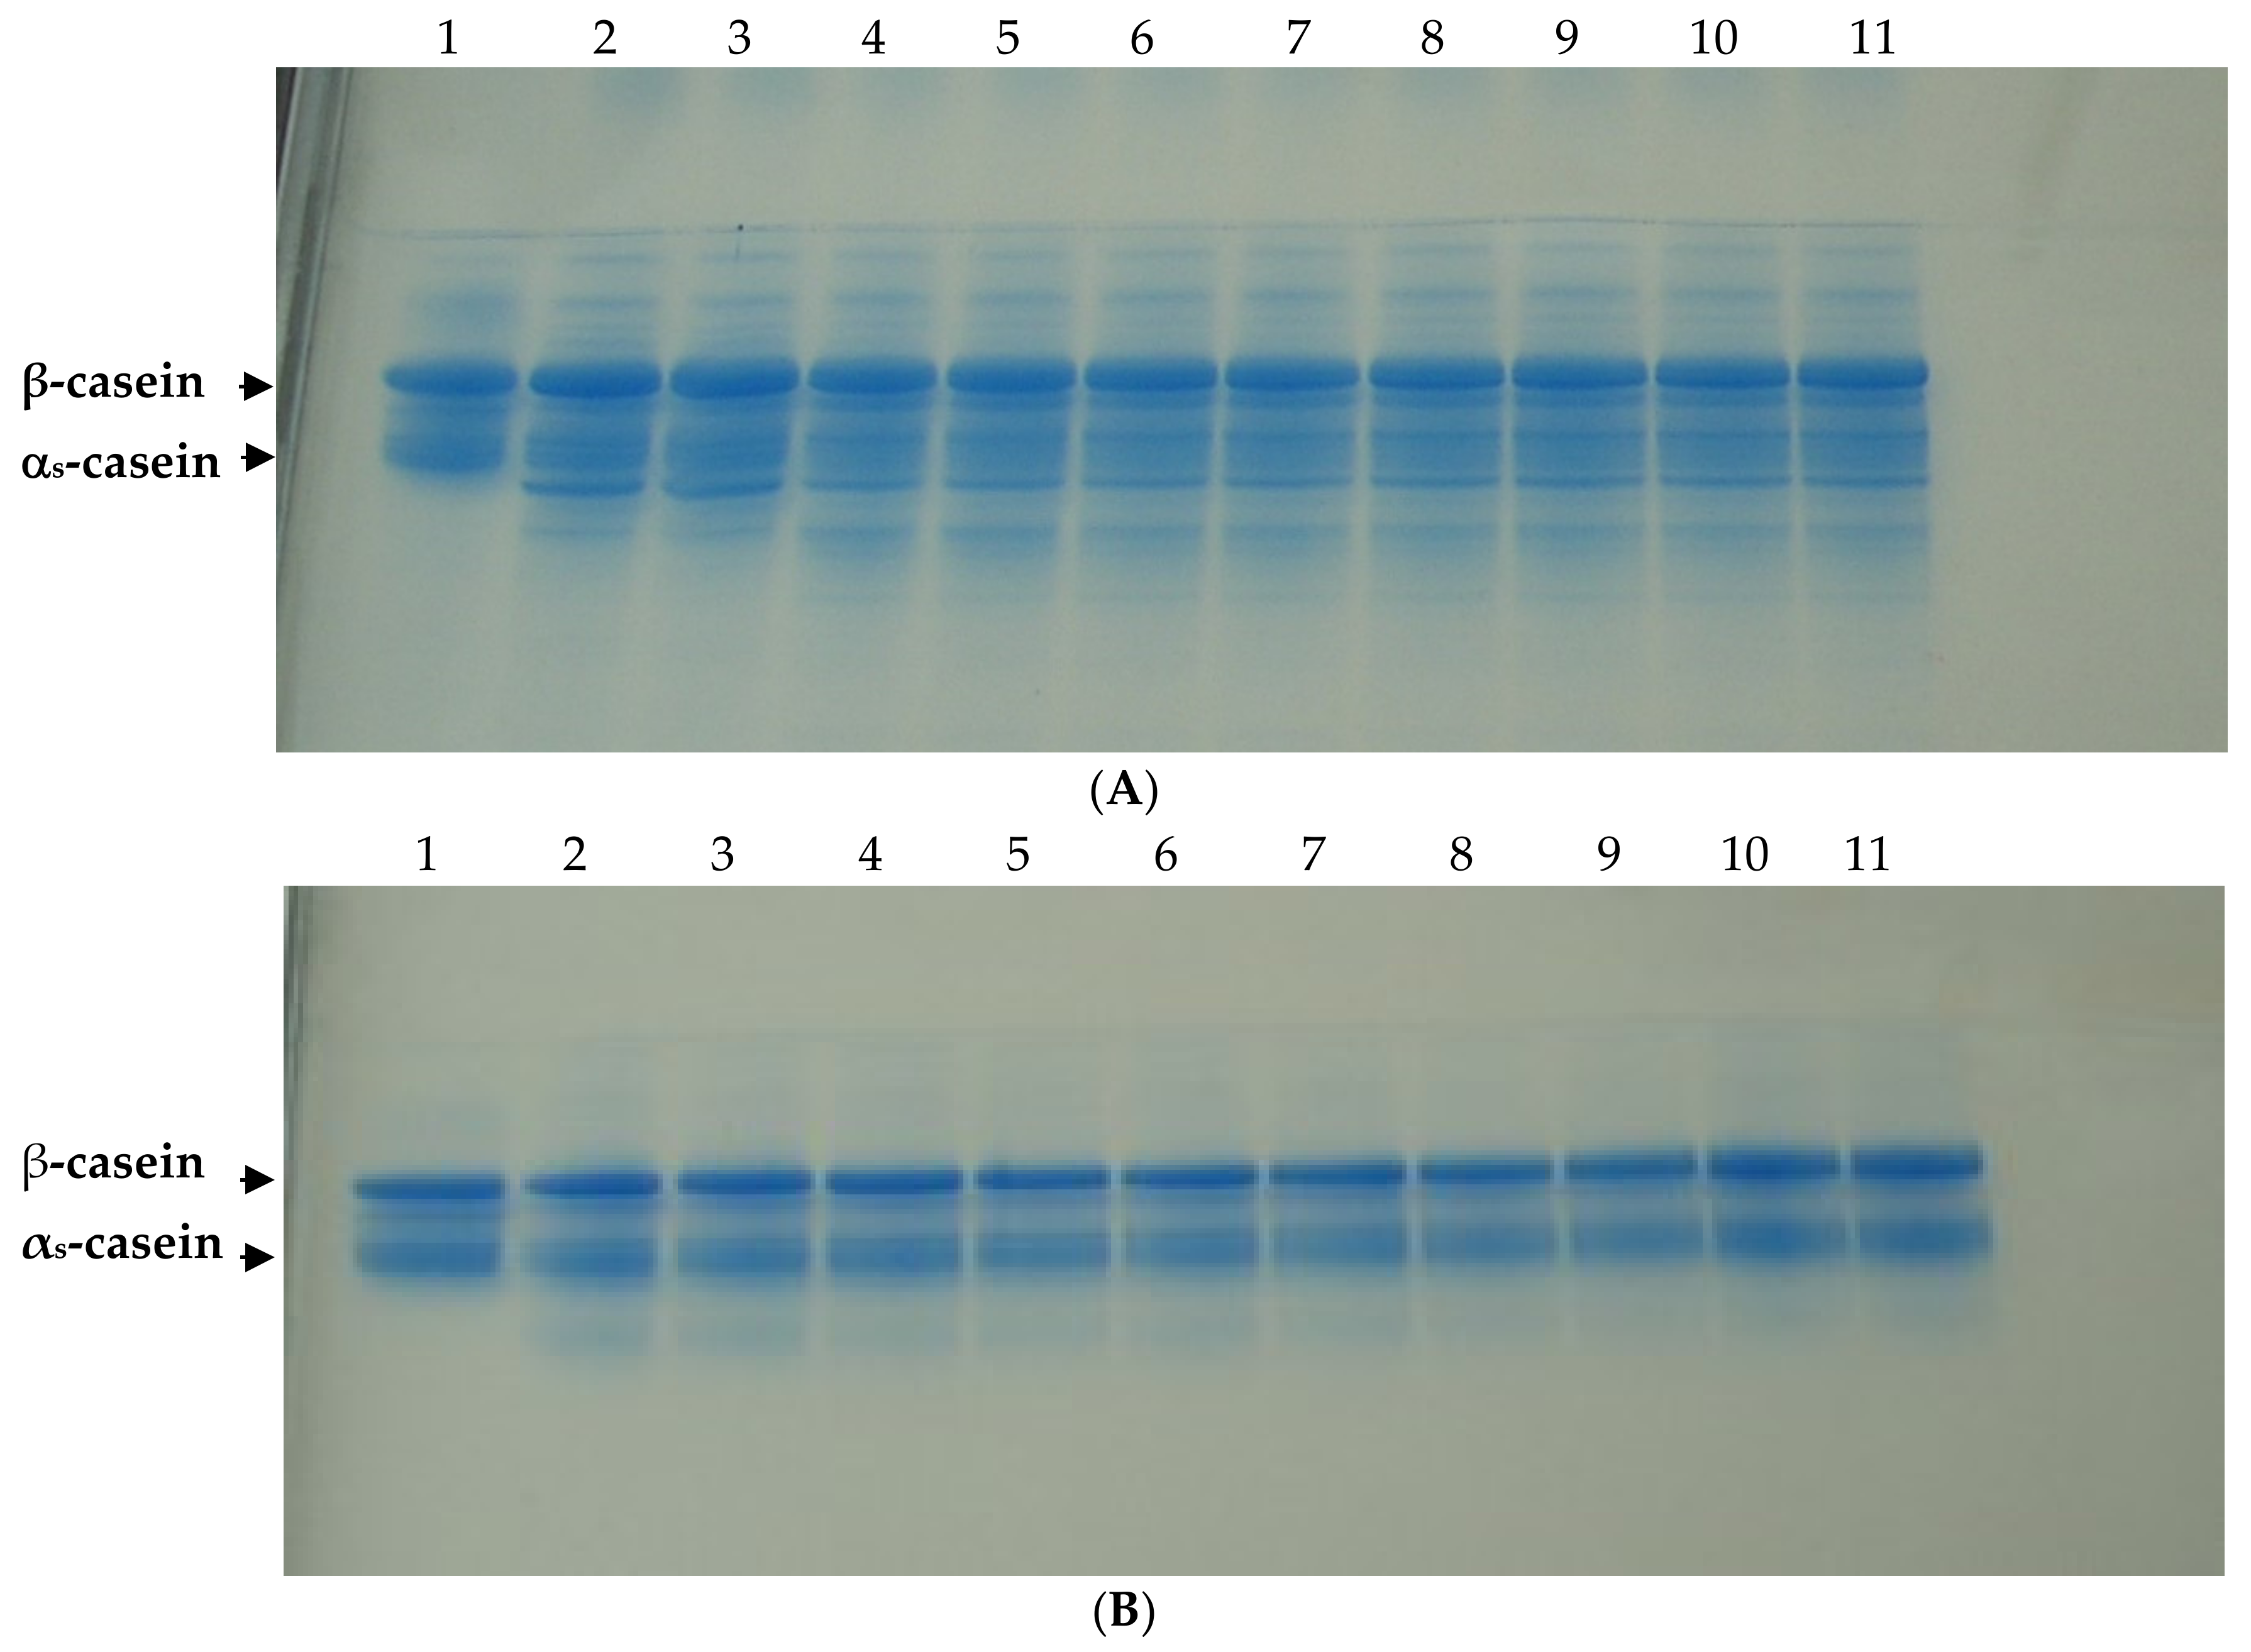
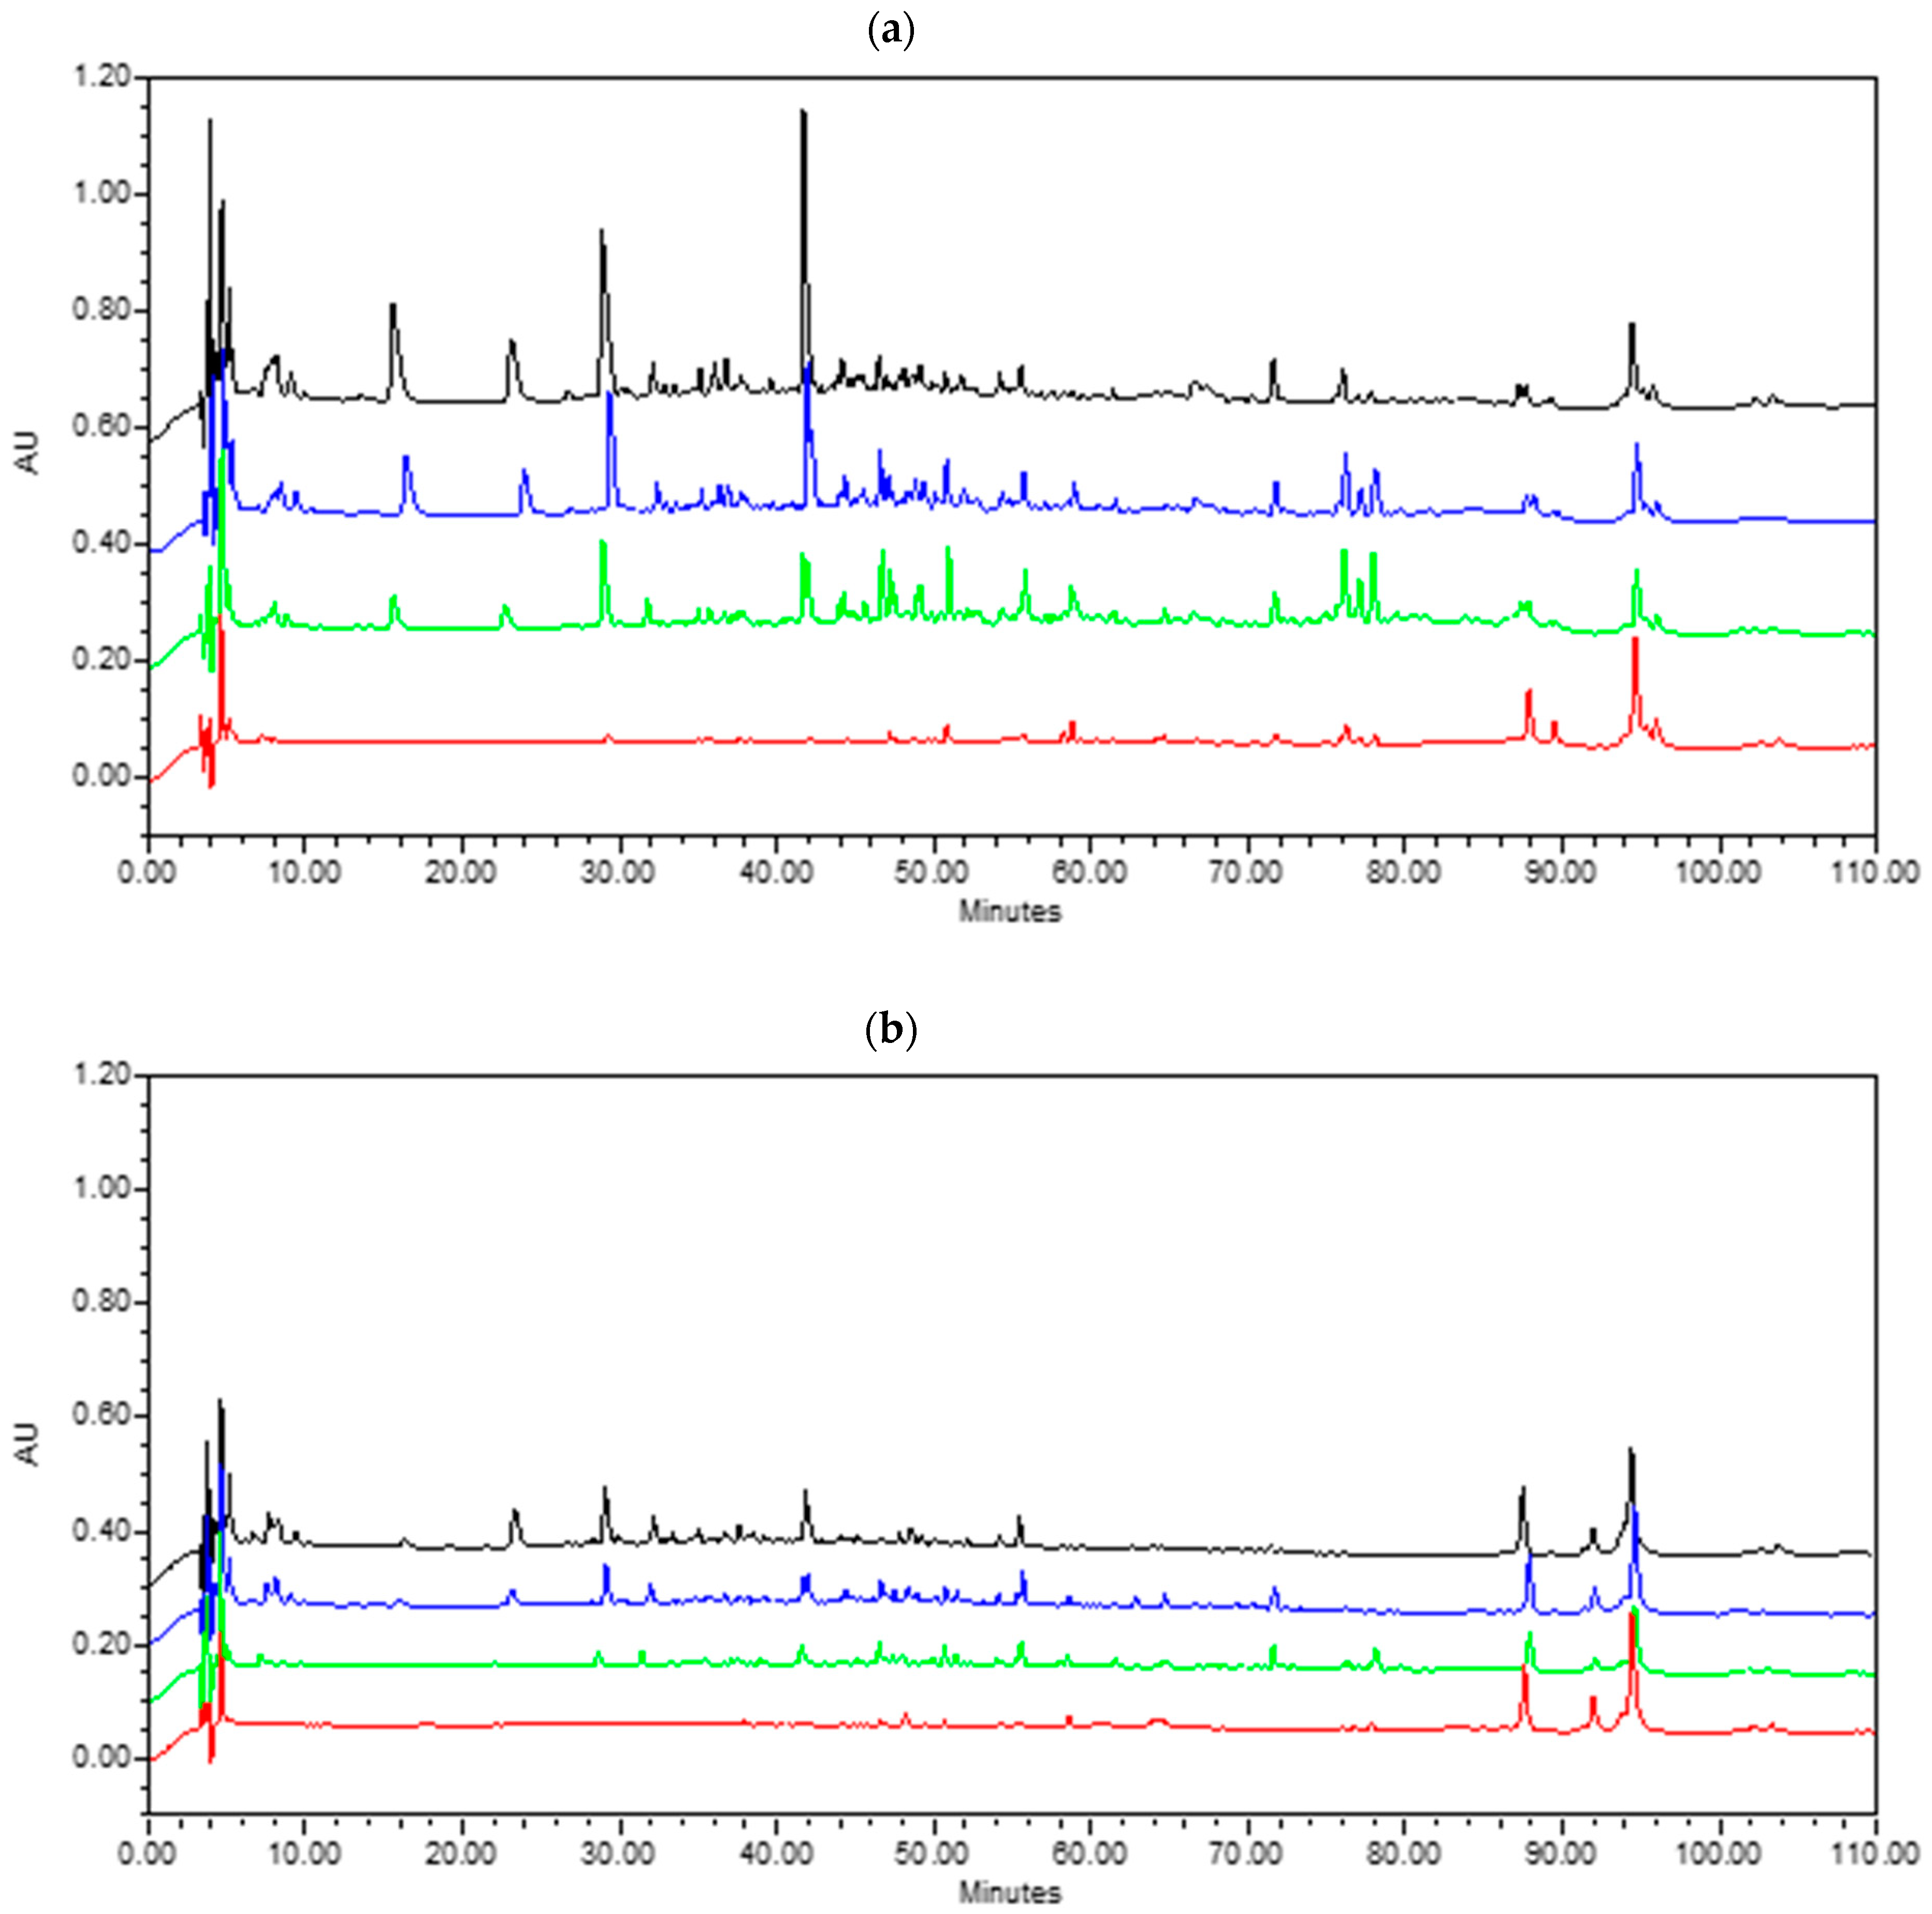
3.2.2. Proteolysis
3.2.3. Lipolysis
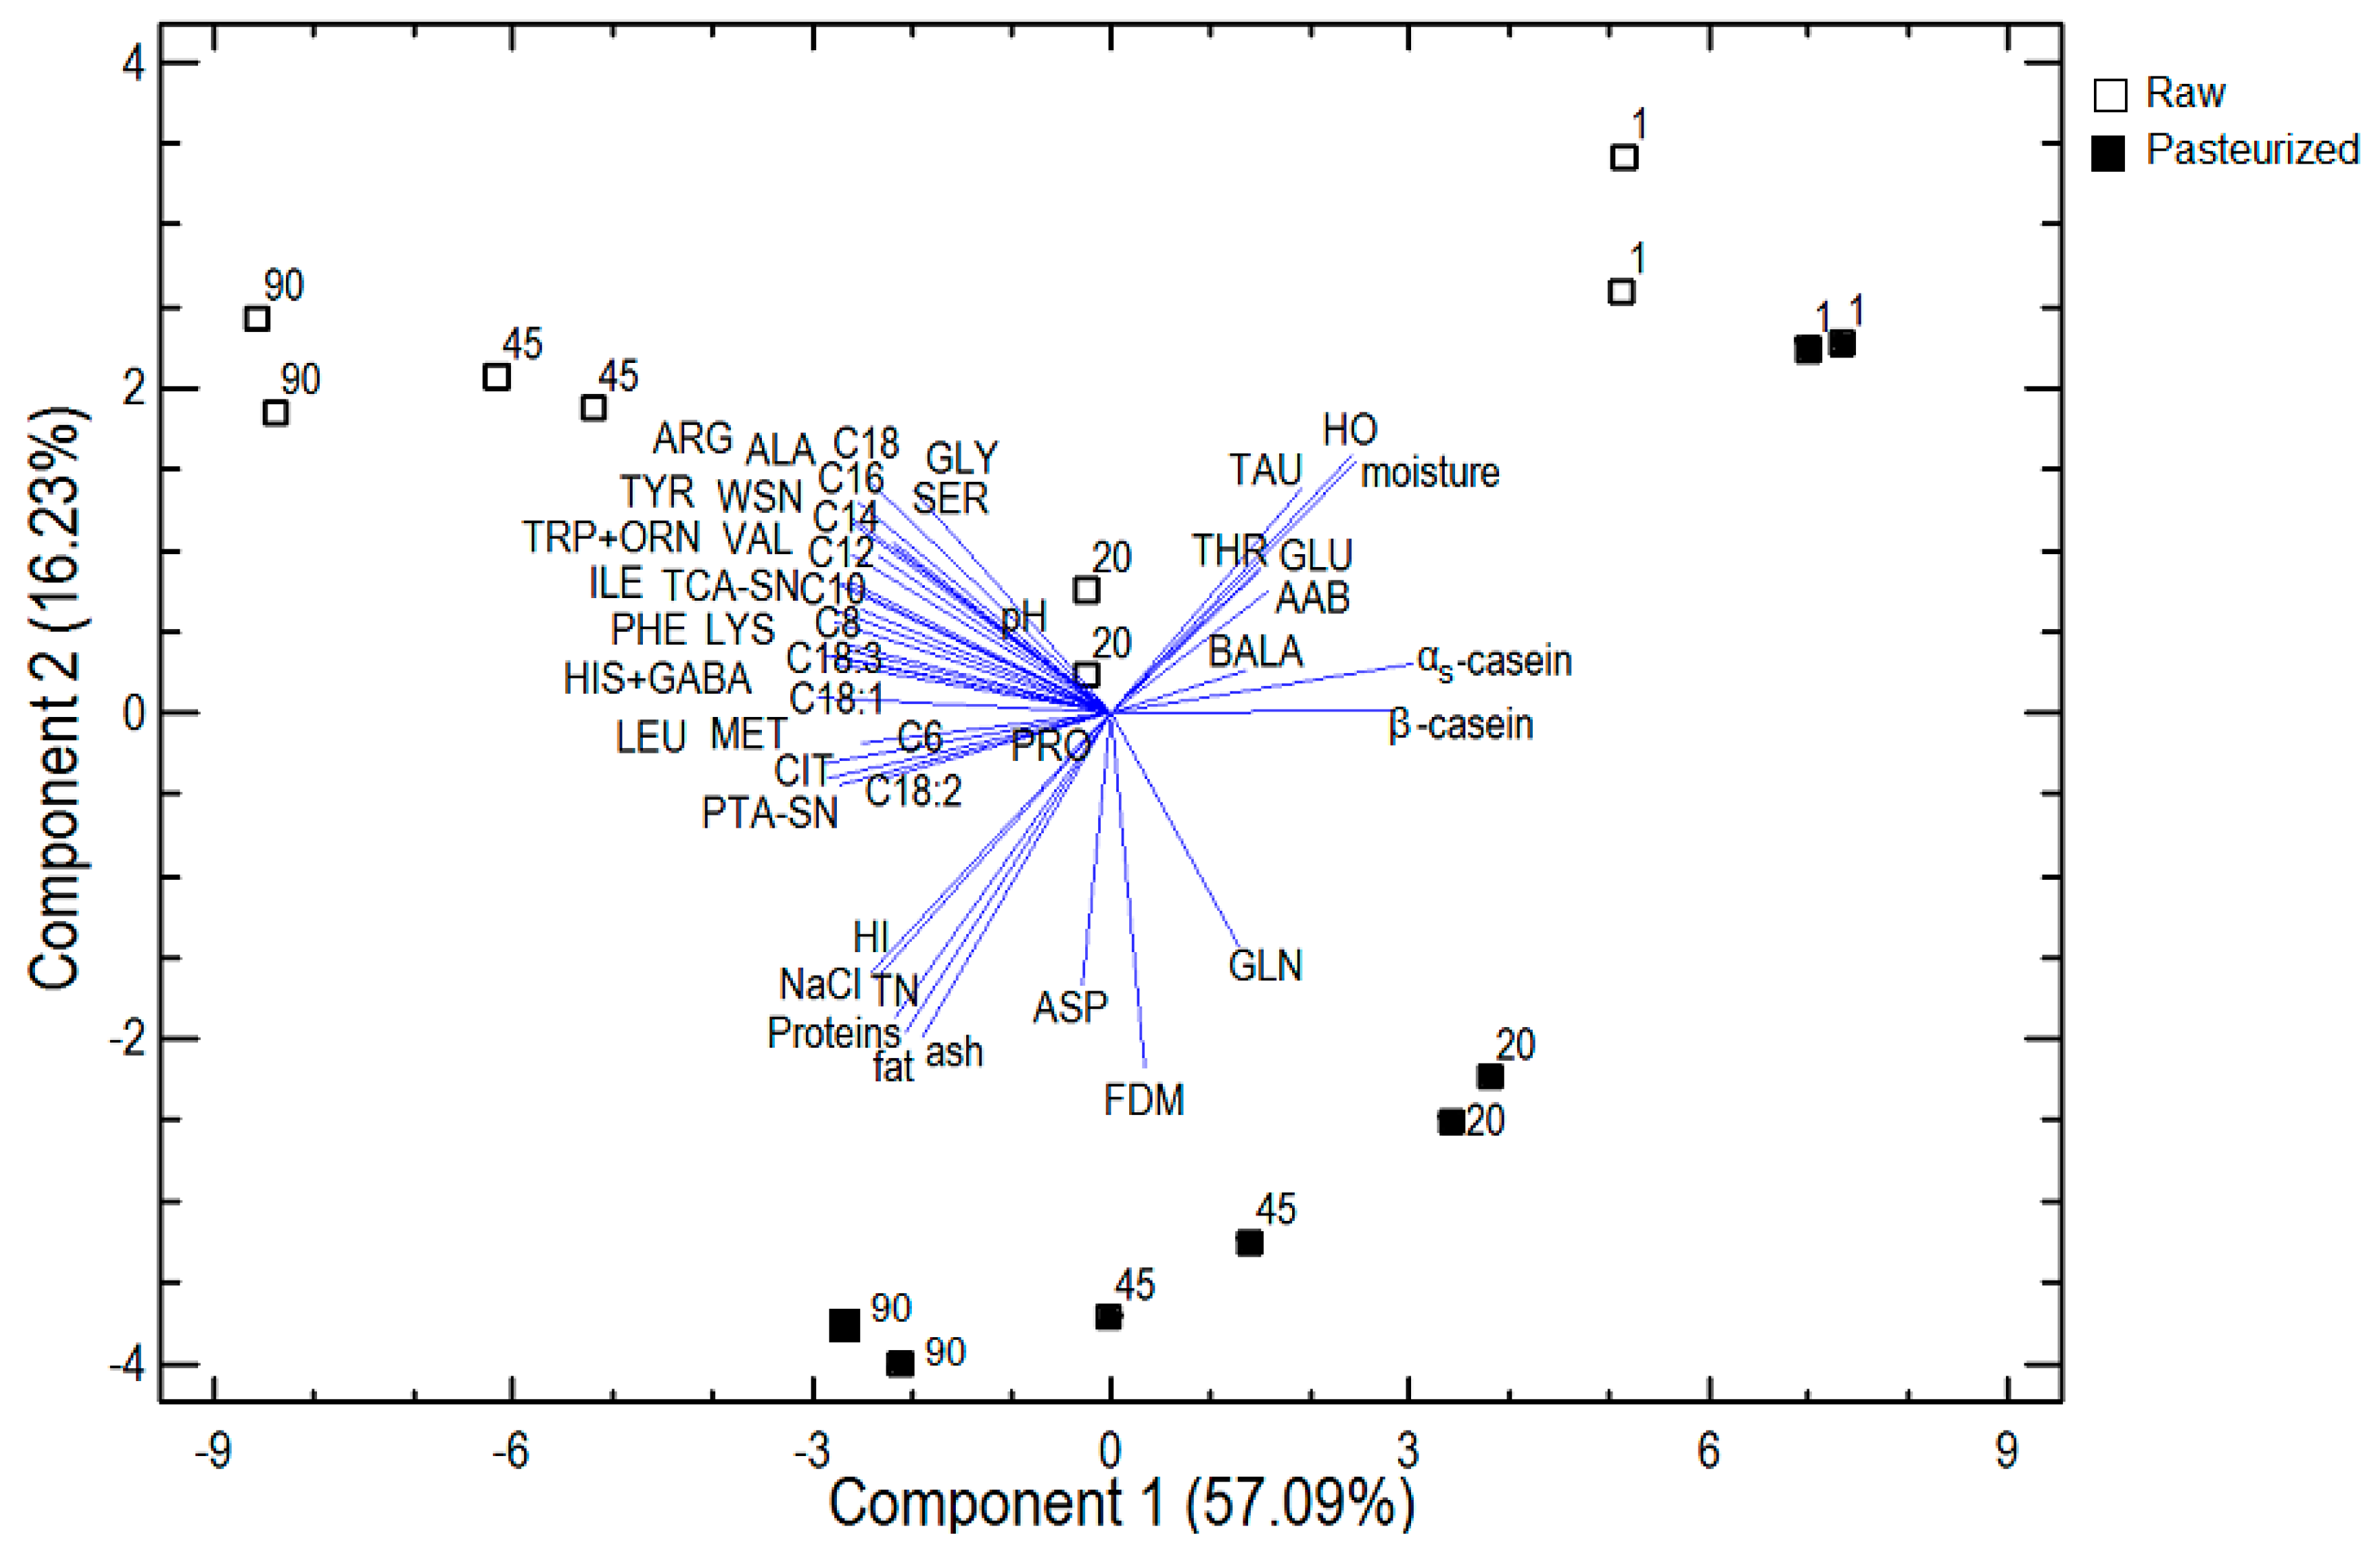
3.2.4. Principal Component Analysis
4. Conclusions
Author Contributions
Funding
Acknowledgments
Conflicts of Interest
References
- McSweeney, P.L.H. Biochemistry of cheese ripening. Int. J. Dairy Technol. 2004, 57, 127–144. [Google Scholar] [CrossRef]
- Grappin, R.; Beuvier, E. Possible implications of milk pasteurization on the manufacture and sensory quality of ripened cheese. Int. Dairy J. 1997, 7, 751–761. [Google Scholar] [CrossRef]
- Committee of the Regions. Opinion of the Committee of the Regions on Promoting and Protecting Local Products—A Trump-Card for the Regions. 1996. Available online: https://op.europa.eu/en/publication-detail/-/publication/dcd34e04-fce5-4af8-9966-b3d35be2f52d (accessed on 7 October 2021).
- Manzo, N.; Santini, A.; Pizzolongo, F.; Aiello, A.; Marrazzo, A.; Meca, G.; Durazzo, A.; Lucarini, M.; Romano, R. Influence of Ripening on Chemical Characteristics of a Traditional Italian Cheese: Provolone del Monaco. Sustainability 2019, 11, 2520. [Google Scholar] [CrossRef] [Green Version]
- Donelly, C. The Oxford Companion to Cheese; Oxford University Press: New York, NY, USA, 2016. [Google Scholar]
- Tagliazucchi, D.; Martini, S.; Shamsia, S.; Helel, A.; Conte, A. Biological activities and peptidomic profile of in vitro-digested cow, camel, goat and sheep milk. Int. Dairy J. 2018, 81, 19–27. [Google Scholar] [CrossRef] [Green Version]
- Haenlein, G.F.W. Goat milk in human nutrition. Small Rum. Res. 2004, 51, 155–163. [Google Scholar] [CrossRef]
- FAO STAT. 2018. Available online: www.fao.org (accessed on 7 October 2021).
- Bontinis, T.G.; Mallatou, H.; Alichanidis, E.; Kakouri, A.; Samelis, J. Physicochemical, microbiological and sensory changes during ripening and storage of Xinotyri, a traditional Greek cheese from raw goat’s milk. Int. J. Dairy Technol. 2008, 61, 229–236. [Google Scholar] [CrossRef]
- Bontinis, T.G.; Mallatou, H.; Pappa, E.C.; Massouras, T.; Alichanidis, E. Study of proteolysis, lipolysis and volatile profile of a traditional Greek goat cheese (Xinotyri) during ripening. Small Rum. Res. 2012, 105, 193–201. [Google Scholar] [CrossRef]
- Pappa, E.C.; Bontinis, T.G.; Tasioula-Margari, M.; Samelis, J. Microbial Quality of and Biochemical Changes in Fresh Soft, Acid-Curd Xinotyri Cheese Made from Raw or Pasteurized Goat’s Milk. Food Technol. Biotechnol. 2017, 55, 496–510. [Google Scholar] [CrossRef]
- Samelis, J.; Doulgeraki, A.I.; Bikouli, V.; Pappas, D.; Kakouri, A. Microbiological and metagenomic characterization of a retail delicatessen Galotyri-like fresh acid-curd cheese product. Fermentation 2021, 7, 67. [Google Scholar] [CrossRef]
- Mallatou, H.; Pappa, E.C.; Boumba, V.A. Proteolysis in Teleme cheese made from sheep’s, goats’ or a mixture of sheep’s and goats’ milk. Int. Dairy J. 2004, 14, 977–987. [Google Scholar] [CrossRef]
- Pappa, E.C.; Sotirakoglou, K. Changes of free amino acid content of Teleme cheese made with different types of milk and culture. Food Chem. 2008, 111, 606–615. [Google Scholar] [CrossRef]
- Mallatou, H.; Pappa, E.C.; Massouras, T. Changes in free fatty acids during ripening of Teleme cheese made with ewes’, goats’, cows’ or mixture of ewes’ and goats’ milk. Int. Dairy J. 2003, 13, 211–219. [Google Scholar] [CrossRef]
- Moreno, M.R.F.; Sarantinopoulos, P.; Tsakalidou, E.; De Vuyst, L. The role and application of enterococci in food and health. Int. J. Food Microbiol. 2006, 106, 1–24. [Google Scholar] [CrossRef]
- Pappa, E.C.; Kondyli, E.; Samelis, J. Microbiological and biochemical characteristics of Kashkaval cheese produced using pasteurised or raw milk. Int. Dairy J. 2019, 89, 60–67. [Google Scholar] [CrossRef]
- Dapkevicious, M.L.E.; Sgardioli, B.; Câmara, S.P.A.; Poeta, P.; Malcata, F.X. Current trends of enterococci in dairy products: A comprehensive review of their multiple roles. Foods 2021, 10, 821. [Google Scholar] [CrossRef]
- Montel, M.C.; Buchin, S.; Mallet, A.; Delbés-Paus, C.; Vuitton, D.A.; Desmasures, N.; Berthier, F. Traditional cheeses: Rich and diverse microbiota with associated benefits. Int. J. Food Microbiol. 2014, 177, 136–154. [Google Scholar] [CrossRef]
- Albenzio, M.; Corbo, M.R.; Rehman, S.U.; Fox, P.F.; De Angelis, M.; Corsetti, A.; Sevi, A.; Gobbetti, M. Microbiological and biochemical characteristics of Canestrato Pugliese cheese made from raw milk, pasteurized milk or by heating the curd in hot whey. Int. J. Food Microbiol. 2001, 67, 35–48. [Google Scholar] [CrossRef]
- Beresford, T.P.; Fitzsimons, N.A.; Brennan, N.L.; Cogan, T.M. Recent advances in cheese microbiology. Int. Dairy. J. 2001, 11, 259–274. [Google Scholar] [CrossRef]
- Joishy, T.K.; Dehingia, M.; Khan, M.R. Bacterial diversity and metabolite profiles of curd prepared by natural fermentation of raw milk and back sloping of boiled milk. World J. Microbiol. Biotechnol. 2019, 35, 102. [Google Scholar] [CrossRef]
- Di Cagno, R.; Upadhyay, V.K.; Mc Sweeney, P.L.H.; Corbo, M.R.; Faccia, M.; Gobbetti, M. Microbiological, compositional and biochemical characterization of PDO Canestrato Pugliese cheese. Ital. J. Food Sci. 2004, 16, 45–58. [Google Scholar]
- Piraino, P.; Zotta, T.; Ricciardi, A.; Parente, E. Discrimination of commercial Caciocavallo cheeses on the basis of the diversity of lactic microflora and primary proteolysis. Int. Dairy J. 2005, 15, 1138–1149. [Google Scholar] [CrossRef]
- Vandera, E.; Kakouri, A.; Koukkou, A.I.; Samelis, J. Major ecological shifts within the dominant nonstarter lactic acid bacteria in mature Greek Graviera cheese as affected by the starter culture type. Int. J. Food Microbiol. 2019, 290, 15–26. [Google Scholar] [CrossRef]
- Samelis, J.; Kakouri, A. Major technological differences between an industrial-type and five artisan-type Greek PDO Galotyri market cheeses as revealed by great variations in their lactic acid microbiota. AIMS Agric. Food 2019, 4, 685–710. [Google Scholar] [CrossRef]
- Turner, K.W.; Morris, H.A.; Martley, F.G. Swiss-type cheese II. The role of thermophilic lactobacilli in sugar fermentation. N. Z. J. Dairy Sci. Technol. 1983, 18, 117–124. [Google Scholar]
- Litopoulou-Tzanetaki, E.; Tzanetakis, N. Microbiological characteristics of Greek traditional cheeses. Small Rum. Res. 2011, 101, 17–32. [Google Scholar] [CrossRef]
- Litopoulou-Tzanetaki, E.; Tzanetakis, N. The microfloras of traditional Greek cheeses. Microbiol. Spectr. 2014, 2, 1–34. [Google Scholar] [CrossRef] [Green Version]
- Pappa, E.C.; Samelis, J.; Kondyli, E.; Pappas, A.C. Characterization of Urda whey cheese: Evolution of main biochemical and microbiological parameters during ripening and vacuum packaged cold storage. Int. Dairy J. 2016, 58, 54–57. [Google Scholar] [CrossRef]
- Samelis, J.; Kakouri, A.; Kondyli, E.; Pappa, E.C. Effects of curd heating with or without previous milk pasteurization on the microbiological quality and safety of craft-made ‘Pasta Filata’ Kashkaval cheese curds. Int. J. Dairy Technol. 2019, 72, 447–455. [Google Scholar]
- Gobbetti, M.; Folkertsma, B.; Fox, P.F.; Corsetti, A.; Smacchi, E.; De Angelis, M.; Rossi, J.; Kilcawley, K.; Cortini, M. Microbiology and biochemistry of Fossa pit cheese. Int. Dairy J. 1999, 9, 763–773. [Google Scholar] [CrossRef]
- De Angelis, M.; Corsetti, A.; Tosti, N.; Rossi, J.; Corbo, M.R.; Gobbetti, M. Characterization of non-starter lactic acid bacteria from Italian ewe cheeses based on phenotypic, genotypic and cell wall protein analyses. Appl. Environ. Microbiol. 2001, 67, 2011–2020. [Google Scholar] [CrossRef] [Green Version]
- Settanni, L.; Moschetti, G. Non-starter lactic acid bacteria used to improve cheese quality and provide health benefits. Food Microbiol. 2010, 27, 691–697. [Google Scholar] [CrossRef]
- Samelis, J.; Kakouri, A.; Pappa, E.C.; Matijašic, B.B.; Georgalaki, M.D.; Tsakalidou, E.; Rogelj, I. Microbial stability and safety of traditional Greek Graviera cheese: Characterization of the lactic acid bacterial flora and culture-independent detection of bacteriocin genes in the ripened cheeses and their microbial consortia. J. Food Prot. 2010, 73, 1294–1303. [Google Scholar] [CrossRef]
- Bottari, B.; Levante, A.; Neviani, E.; Gatti, M. How the fewest become the greatest. L. casei’s impact on long ripened cheeses. Front. Microbiol. 2018, 9, 2866. [Google Scholar] [CrossRef] [Green Version]
- Tofalo, R.; Fusco, V.; Böhnlein, C.; Kabisch, J.; Logrieco, A.F.; Habermann, D.; Cho, G.S.; Benomar, N.; Abriouel, H.; Schmidt-Heydt, M.; et al. The life and times of yeasts in traditional food fermentations. Crit. Rev. Food Sci. Nutr. 2020, 60, 3103–3132. [Google Scholar] [CrossRef]
- European Commission. Commission Regulation (EC) No 1441/2007 of 5 December 2007 amending Regulation (EC) No. 2073/2005 on microbiological criteria for foodstuffs. Off. J. Europ. Union 2007, L322, 12–29. [Google Scholar]
- Fox, P.F. Proteolysis during cheese manufacture and ripening. J. Dairy Sci. 1989, 72, 1379–1400. [Google Scholar] [CrossRef]
- Rezaei, A.; Alirezalu, K.; Damirchi, S.A.; Hesari, J.; Papademas, P.; Domínguez, R.; Lorenzo, J.M.; Yaghoubi, M. Effect of Pasteurization and Ripening Temperature on Chemical and Sensory Characteristics of Traditional Motal Cheese. Fermentation 2020, 6, 95. [Google Scholar] [CrossRef]
- Greek Codex Alimentarius. Official Journal of the Hellenic Republic; Volume B, Article 83, No. 899, Paragraphs 1.6–1.8; National Printing Office: Athens, Greek, 2009. [Google Scholar]
- Ballesteros, C.; Poveda, J.M.; Gonzalez-Vinas, M.A.; Cabezas, L. Microbiological, biochemical and sensory characteristics of artisanal and industrial Manchego cheeses. Food Contr. 2006, 17, 249–255. [Google Scholar] [CrossRef]
- Rashtchi, P.; Bazmi, A.; Noshirvani, N.; Moosavy, M.H. Comparison of the microbial, physicochemical, and sensorial properties of raw and pasteurized Lighvan cheeses during ripening time. Food Sci. Nutr. 2021, 9, 5527–5535. [Google Scholar] [CrossRef]
- Moatsou, G.; Κandarakis, I.; Moschopoulou, Ε.; Anifantakis, Ε.; Alichanidis, Ε. Effect of technological parameters onthe characteristics of Κasseri cheese made from raw and pasteurized ewes milk. Int. J. Dairy Technol. 2001, 54, 69–77. [Google Scholar] [CrossRef]
- Phelan, J.A.; Guiney, J.; Fox, P.F. Proteolysis of β-casein in Cheddar cheese. J. Dairy Res. 1973, 40, 105–112. [Google Scholar] [CrossRef]
- Gaya, P.; Sanchez, C.; Nunez, M.; Fernandez-Garcia, E. Proteolysis during ripening of Manchego cheese made from raw or pasteurized ewes’ milk. Seasonal variation. J. Dairy Res. 2005, 72, 287–295. [Google Scholar] [CrossRef]
- Trujillo, A.J.; Buffa, Μ.; Casals, Ι.; Fernández, P.; Guamis, Β. Proteolysis in goat cheese made from raw, pasteurized or pressure-treated milk. Innov. Food Sci. Emerg. Technol. 2002, 3, 309–319. [Google Scholar] [CrossRef]
- Lau, K.Y.; Barbano, D.M.; Rasmussen, R.R. Influence of pasteurization of milk on protein breakdown in Chaddar cheese during aging. J. Dairy Sci. 1991, 74, 727–740. [Google Scholar] [CrossRef]
- Polo, C.; Ramos, M.; Sanchez, R. Free amino acids by high performance liquid chromatography and peptides by gel electrophoresis in Mahon cheese during ripening. Food Chem. 1985, 16, 85–96. [Google Scholar] [CrossRef]
- Paskas, S.; Miocinovic, J.; Savic, M.; Jesic, G.; Raseta, M.; Becskei, Z. Comparison of the chemical composition of whey cheeses: Urda and Ricotta. Maced. Vet. Rev. 2019, 42, 151–161. [Google Scholar] [CrossRef] [Green Version]
- Gonzalez de Llno, D.; Polo, M.C.; Ramos, M.; Martin-Alvarez, P. Free and total amino acids in the non-protein fraction of an artisanal blue cheese during ripening. Z. Lebensm.-Unters. Forsch. 1991, 193, 529–532. [Google Scholar] [CrossRef]
- Skeiea, S.; Lindberg, C.; Narvhus, J. Development of amino acids and organic acids in Norvegia, influence of milk treatment and adjunct Lactobacillus. Int. Dairy J. 2001, 11, 399–411. [Google Scholar] [CrossRef]
- Butikofer, U. Cheese characterization with free amino acids pattern in several hard and semi-hard cheeses. Bull. Int. Dairy Fed. 1996, 317, 22. [Google Scholar]
- Buffa, M.; Guamis, B.; Trujillo, A.J. Specific effect of high-pressure treatment of milk on cheese proteolysis. J. Dairy Res. 2005, 72, 385–392. [Google Scholar] [CrossRef]
- Buffa, M.; Guamis, B.; Pavia, M.; Trujillo, A.J. Lipolysis in cheese made from raw, pasteurized or high-pressure treated goats’ cheese. Int. Dairy J. 2001, 11, 175–179. [Google Scholar] [CrossRef]
- Jandal, J.M. Some factors affecting lipase activity in goat milk. Small Rum. Res. 1995, 16, 87–91. [Google Scholar] [CrossRef]
- Freitas, A.C.; Malcata, F.X. Lipolysis in Picante cheese: Influence of milk type and ripening time on free fatty acid profile. Lait 1998, 78, 251–258. [Google Scholar] [CrossRef] [Green Version]


| Milk | 1d | 20d | 45d | 60d | |
|---|---|---|---|---|---|
| Total viable mesophilic bacteria | R P | 8.58 ± 0.04 aA 8.74 ± 0.09 aA | 8.51 ± 0.34 aA 7.99 ± 0.70 aAB | 7.84 ± 0.06 aB 7.51 ± 0.39 aB | 8.30 ± 0.23 aAB 7.95 ± 0.39 aAB |
| Total dairy lactic acid bacteria | R P | 8.68 ± 0.04 aA 8.62 ± 0.23 aA | 8.46 ± 0.32 aA 8.06 ± 0.68 aA | 7.71 ± 0.07 aB 7.62 ± 0.39 aA | 8.27 ± 0.17 aAB 7.92 ± 0.43 aA |
| Total mesophilic lactic acid bacteria | R P | 8.43 ± 0.15 aA 8.88 ± 0.18 aA | 8.45 ± 0.33 aA 7.98 ± 0.57 aAB | 8.10 ± 0.18 aA 7.53 ± 0.48 aB | 8.47 ± 0.19 aA 8.27 ± 0.18 aAB |
| Enterococci | R P | 6.39 ± 0.47 aA 5.71 ± 0.16 aA | 6.46 ± 0.50 aA 5.92 ± 0.21 aA | 5.46 ± 0.63 aA 4.67 ± 0.22 bB | 5.52 ± 0.62 aA 4.59 ± 0.32 bB |
| Yeasts -Moulds | R P | 3.59 ± 0.14 aA 3.71 ± 0.24 aA | 5.18 ± 0.18 aB 5.43 ± 0.43 aB | 4.68 ± 0.84 aAB 5.45 ± 0.63 aB | 5.86 ± 0.24 aB 5.69 ± 0.33 aB |
| Total Enterobacteriaceae | R P | 5.35 ± 0.31 aA 4.06 ± 0.59 bA | 1.70 ± 0.70 aB 1.86 ± 0.20 aB | <1.00 aC 1.10 ± 0.10 bB | <1.00 aC <1.00 aC |
| Total staphylococci | R P | 5.41 ± 1.28 aA 2.72 ± 1.25 bA | <2.00 aB <2.00 aB | <2.00 aB <2.00 aB | <2.00 aB <2.00 aB |
| Pseudomonas-like bacteria | R P | 5.19 ± 0.45 aA 4.05 ± 0.10 bA | <2.00 aB <2.00 aB | <2.00 aB <2.00 aB | <2.00 aB <2.00 aB |
| Milk | 1d | 20d | 45d | 60d | 90d | |
|---|---|---|---|---|---|---|
| pH | R P | 4.54 ± 0.04 aA 4.53 ± 0.07 aA | 4.19 ± 0.06 aB 4.33 ± 0.12 aA | 4.43 ± 0.06 aAB 4.51 ± 0.11 aA | 4.44 ± 0.01 aAB 4.48 ± 0.05 aA | 4.77 ± 0.19 aA 4.57 ± 0.01 aA |
| moisture, % | R P | 71.97 ± 3.47 aA 71.62 ± 0.58 aA | 47.00 ± 0.40 aB 45.82 ± 0.09 aB | 39.33 ± 0.04 aC 38.6 ± 1.90 aBC | 36.68 ± 1.33 aC 28.75 ± 1.40 bC | 35.49 ± 1.14 aC 28.97 ± 1.17 bC |
| fat, % | R P | 14.13 ± 2.13 aA 16.00 ± 0.00 aA | 28.50 ± 2.00 aB 32.00 ± 0.50 aB | 32.50 ± 1.50 aB 36.50 ± 1.50 aC | 33.50 ± 1.00 aB 41.75 ± 0.25 bD | 34.50 ± 1.50 aB 42.20 ± 0.20 bD |
| fat-in-dry matter, % | R P | 50.21 ± 1.37 aA 56.40 ± 1.15 aA | 53.77 ± 3.39 aA 59.05 ± 0.83 aA | 53.57 ± 2.44 aA 59.43 ± 0.61 aA | 52.96 ± 0.69 aA 58.61 ± 0.80 bA | 53.40 ± 0.14 aA 59.43 ± 1.26 bA |
| salt, % | R P | 0.19 ± 0.01 aA 0.22 ± 0.03 aA | 1.98 ± 0.06 aB 1.99 ± 0.04 aB | 2.12 ± 0.02 aBC 2.39 ± 0.13 aBC | 2.21 ± 0.08 aC 2.78 ± 0.17 aCD | 2.68 ± 0.07 aD 2.87 ± 0.16 aD |
| ash, % | R P | 0.85 ± 0.08 aA 0.73 ± 0.03 aA | 1.55 ± 0.34 aB 2.43 ± 0.23 aB | 2.28 ± 0.18 aC 2.66 ± 0.13 aBC | 2.57 ± 0.03 aC 2.97 ± 0.07 bCD | 2.47 ± 0.03 aC 3.28 ± 0.07 bD |
| Milk | 1d | 20d | 45d | 60d | 90d | |
|---|---|---|---|---|---|---|
| TN% | R P | 1.69 ± 0.22 aA 1.54 ± 0.01 aA | 3.59 ± 0.08 aB 2.97 ± 0.06 bB | 4.10 ± 0.13 aC 3.75 ± 0.10 aC | 4.27 ± 0.01 aC 3.83 ± 0.05 bC | 4.48 ± 0.08 aC 3.87 ± 0.02 aC |
| WSN%TN | R P | 5.78 ± 0.06 aA 5.79 ± 0.13 bA | 6.83 ± 0.29 aB 4.73 ± 0.03 bB | 7.56 ± 0.12 aC 5.42 ± 0.25 aAB | 7.12 ± 0.03 aBC 6.34 ± 0.26 aAC | 9.12 ± 0.14 aD 6.92 ± 0.46 bC |
| TCA-SN%TN | R P | 3.10 ± 0.71 aA 2.28 ± 0.08 aA | 4.01 ± 0.04 aAB 2.71 ± 0.15 bB | 5.25 ± 0.70 aBC 3.12 ± 0.04 aC | 6.60 ± 0.03 aC 3.52 ± 0.08 bD | 8.76 ± 0.08 aD 4.88 ± 0.08 bE |
| PTA-SN%TN | R P | 0.80 ± 0.03 aA 0.74 ± 0.11 aA | 1.62 ± 0.03 aB 1.08 ± 0.03 bB | 1.60 ± 0.07 aB 1.08 ± 0.02 bB | 1.81 ± 0.13 aC 1.29 ± 0.02 aC | 1.94 ± 0.16 aC 1.40 ± 0.03 aC |
| Milk | 1d | 20d | 45d | 60d | 90d | |
|---|---|---|---|---|---|---|
| Residual αs- casein | R P | 100A 100A | 89.1 ± 0.3 aB 94.7 ± 1.0 bB | 83.1 ± 1.6 aC 90.6 ± 0.1 bC | 77.5 ± 1.5 aD 86.7 ± 0.6 bD | 75.6 ± 0.8 aD 83.9 ± 0.5 bE |
| Residual β-casein | R P | 100A 100A | 90.0 ± 1.1 aB 97.5 ± 1.1 bAB | 88.9 ± 1.9 aBC 93.0 ± 3.0 aB | 87.6 ± 0.5 aBC 93.4 ± 0.9 bB | 85.6 ± 1.1 aC 93.2 ± 1.0 bB |
| Milk | 1d | 20d | 45d | 90d | |
|---|---|---|---|---|---|
| HI%TA | R P | 54.56 ± 2.17 aA 55.73 ± 0.15 Aa | 71.93 ± 2.66 aB 74.99 ± 2.12 aB | 80.02 ± 3.48 aBC 78.88 ± 2.91 aB | 83.31 ± 1.74 aC 88.78 ± 2.46 aC |
| HO%TA | R P | 45.44 ± 2.17 aA 44.27 ± 0.15 AA | 28.07 ± 2.66 aB 25.01 ± 2.12 aB | 19.99 ± 3.48 aBC 21.12 ± 2.91 aB | 16.69 ± 1.74 aC 11.23 ± 2.46 aC |
| HO/HI | R P | 0.84 ± 0.08 aA 0.80 ± 0.01 aA | 0.39 ± 0.05 aB 0.34 ± 0.04 aB | 0.26 ± 0.06 aB 0.27 ± 0.05 aB | 0.21 ± 0.03 aB 0.13 ± 0.03 aC |
| Milk | 1d | 20d | 45d | 90d | |
|---|---|---|---|---|---|
| aspartic acid (asp) | R P | 1.7 ± 0.3 aA 8.9 ± 1.9 aA | 2.3 ± 0.2 aA 3.9 ± 1.0 aC | 4.6 ± 0.5 aAB 14.6 ± 0.5 bB | 7.1 ± 1.6 aB 12.7 ± 0.3 aAB |
| glutamic acid (glu) | R P | 0.7 ± 0.2 aA 8.4 ± 1.1 bA | 0.7 ± 0.5 aA 1.1 ± 0.2 aB | 0.8 ± 0.6 aA 0.9 ± 0.1 aB | 1.5 ± 0.5 aA 0.6 ± 0.3 aB |
| serine (ser) | R P | 4.1 ± 0.7 aA 6.6 ± 0.1 aA | 6.2 ± 1.9 aAB 1.7 ± 0.5 aA | 10.9 ± 0.9 aAB 6.2 ± 2.0 aA | 12.3 ± 2.7 aB 5.6 ± 1.9 aB |
| glycine (gly) | R P | 2.3 ± 1.5 aA 5.2 ± 1.1 aA | 3.9 ± 1.1 aA 1.3 ± 1.1 aA | 13.9 ± 0.3 aB 2.8 ± 1.5 bA | 9.4 ± 0.1 aC 2.6 ± 1.4 bA |
| glutamine (gln) | R P | 3.0 ± 1.0 aA 8.6 ± 1.4 aA | 1.0 ± 0.4 aA 2.9 ± 1.1 aA | 0.8 ± 0.7 aA 10.9 ± 1.7 bA | 0.8 ± 0.3 aA 8.0 ± 1.4 bAB |
| β-aminobutyric acid (BALA) | R P | 0.4 ± 0.2 aA 3.0 ± 0.7 aA | 0.9 ± 0.6 aA 1.0 ± 0.4 aB | 0.8 ± 0.5 aA 1.0 ± 0.4 aB | 0.6 ± 0.2 aA 1.0 ± 0.5 aB |
| taurine (tau) | R P | 11.8 ± 1.4 aA 16.8 ± 2.2 aA | 2.2 ± 0.5 aB 6.3 ± 1.0 aB | 6.7 ± 3.0 aAB 4.7 ± 0.9 aB | 5.3 ± 0.7 aA 4.3 ± 0.8 aB |
| histidine + γ aminobutyric acid (His + GABA) | R P | 14.6 ± 4.2 aA 12.9 ± 1.1 aA | 52.9 ± 4.4 aA 26.8 ± 5.6 aAB | 163.5 ± 21.9 aB 83.5 ± 18.4 aC | 194.3 ± 15.2 aB 73.7 ± 6.2 bBC |
| citrulline (cit) | R P | 1.8 ± 0.1 aA 3.7 ± 2.0 aA | 25.9 ± 3.2 aB 11.2 ± 2.2 aAB | 37.4 ± 4.9 aBC 22.0 ± 11.5 aAB | 40.6 ± 4.1 aC 32.4 ± 3.0 aB |
| threonine (thr) | R P | 42.9 ± 6.8 aA 98.8 ± 13.0 aA | 26.0 ± 11.5 aA 60.7 ± 7.2 aB | 35.0 ± 9.4 aA 32.0 ± 2.6 aBC | 51.6 ± 10.4 aA 28.7 ± 2.3 aC |
| alanine (ala) | R P | 23.3 ± 2.1 aA 10.3 ± 0.3 bA | 42.9 ± 18.0 aAB 11.2 ± 0.8 aA | 64.7 ± 1.9 aB 24.0 ± 3.8 bB | 48.7 ± 2.8 aAB 21.5 ± 3.4 bB |
| arginine (arg) | R P | 16.9 ± 0.5 aA 1.6 ± 0.8 bA | 18.5 ± 0.9 aA 2.0 ± 1.1 bA | 53.4 ± 5.6 aAB 4.7 ± 1.9 bA | 60.9 ± 20.8 aB 5.8 ± 3.3 bA |
| proline (pro) | R P | 0.9 ± 0.6 aA 14.8 ± 1.8 bA | 2.5 ± 1.7 aA 5.7 ± 0.4 aC | 4.3 ± 2.5 aA 10.7 ± 1.1 aAB | 14.7 ± 3.4 aB 9.6 ± 0.9 aBC |
| α aminobutyric acid (ABA) | R P | 6.0 ± 0.5 aA 44.9 ± 3.5 bA | 3.9 ± 0.6 aA 6.6 ± 0.4 aB | 6.8 ± 1.3 aA 8.4 ± 0.9 aB | 7.3 ± 1.0 aA 7.8 ± 0.7 aB |
| tyrosine (tyr) | R P | 26.4 ± 0.4 aA 4.0 ± 1.1 bA | 16.1 ± 0.7 aA 4.6 ± 2.4 bA | 21.2 ± 5.7 aA 11.2 ± 4.5 aAB | 46.7 ± 2.2 aB 19.9 ± 3.9 bB |
| valine (val) | R P | 8.4 ± 0.2 aA 2.6 ± 1.2 bA | 15.3 ± 1.1 aA 5.5 ± 0.9b AB | 41.1 ± 6.1 aB 12.7 ± 2.4 bAB | 42.6 ± 11.4 aB 14.6 ± 5.3 aB |
| methionine (met) | R P | 1.3 ± 0.2 aA 1.2 ± 0.4 aA | 7.7 ± 1.6 aA 5.2 ± 2.4 aA | 15.1 ± 2.2 aAB 16.0 ± 6.3 aA | 34.8 ± 10.8 aB 16.4 ± 7.7 aA |
| isoleucine (Ile) | R P | 3.0 ± 0.9 aA 0.9 ± 0.3 aA | 9.9 ± 0.7 aA 2.0 ± 0.2b AB | 28.3 ± 3.6 aB 8.1 ± 0.2 bB | 26.7 ± 5.7 aB 7.9 ± 2.6 aB |
| leucine (leu) | R P | 14.2 ± 0.5 aA 8.2 ± 1.9 aA | 34.1 ± 2.1 aB 19.3 ± 8.9 aAB | 67.3 ± 4.1 aC 41.9 ± 15.3 aAB | 71.2 ± 3.2 aC 55.1 ± 11.3 aB |
| phenylalanine (phe) | R P | 6.2 ± 1.8 aA 5.4 ± 1.8 aA | 17.2 ± 0.6a AB 12.3 ± 3.6 aA | 38.7 ± 0.8 aBC 19.9 ± 3.4 bA | 50.3 ± 12.1 aC 21.0 ± 6.2 aA |
| tryptophan + ornithine (trp + orn) | R P | 6.3 ± 1.0 aA 18.3 ± 4.4 aA | 18.0 ± 1.1 aB 13.4 ± 3.4 aA | 54.5 ± 2.0 aC 26.8 ± 4.8 bA | 46.5 ± 2.6 aD 17.1 ± 2.6 bA |
| lysine (lys) | R P | 7.7 ± 0.6 aA 8.5 ± 0.9 aA | 22.0 ± 1.0 aA 14.2 ± 1.8 aB | 83.7 ± 11.9 aB 38.3 ± 1.8 aC | 77.3 ± 11.3 aB 35.9 ± 1.0 aC |
| Total Free Amino Acids | R P | 203.4 ± 20.0 aA 293.2 ± 11.0 bAB | 329.5 ± 40.5 aA 218.4 ± 36.1 bA | 753.2 ± 63.2 aB 400.7 ± 63.6 bB | 850.9 ± 75.8 aB 401.6 ± 51.1 bB |
| Milk | 1d | 20d | 45d | 90d | |
|---|---|---|---|---|---|
| C6 Caproic | R P | 87.05 ± 2.96 aA 94.88 ± 3.07 aA | 92.28 ± 2.73 aA 88.98 ± 0.12 aA | 99.66 ± 17.61 aA 101.37 ± 6.82 aA | 167.28 ± 20.46 aB 146.59 ± 36.59 aA |
| C8 Caprylic | R P | 99.59 ± 4.55 aA 85.75 ± 0.21 aA | 156.61 ± 18.18 aAB 92.77 ± 3.51 aA | 233.68 ± 50.21 aBC 116.53 ± 0.41 aA | 336.37 ± 25.21 aC 203.1 ± 70.04 aA |
| C10 Capric | R P | 98.17 ± 7.24 aA 87.17 ± 2.03 aA | 182.73 ± 19.02 aA 107.43 ± 14.96 aA | 281.38 ± 62.07 aAB 127.03 ± 13.32 aAB | 417.67 ± 69.60 aB 189.58 ± 26.26 bB |
| C12 Lauric | R P | 123.15 ± 10.27 aA 85.59 ± 8.3 aA | 141.71 ± 10.92 aAB 96.4 ± 2.16 aA | 180.79 ± 41.17 aAB 103.82 ± 13.43 aA | 232.53 ± 33.19 aB 142.14 ± 7.21 aB |
| C14 Myristic | R P | 185.60 ± 24.73 aA 118.31 ± 2.23 aA | 312.73 ± 71.56 aAB 128.72 ± 5.76 aA | 412.46 ± 56.71 aB 144.98 ± 4.37 bA | 488.29 ± 19.98 aB 189.78 ± 13.66 bB |
| C16 Palmitic | R P | 556.72 ± 17.51 aA 212.99 ± 11.02 bA | 1153.64 ± 48.57 aB 304.52 ± 18.83 bAB | 1480.28 ± 43.29 aC 374.78 ± 10.9 bB | 1548.02 ± 82.38 aC 545.60 ± 55.29 bC |
| C18 Stearic | R P | 251.76 ± 38.12 aA 143.08 ± 19.94 aA | 427.28 ± 15.71 aB 162.09 ± 9.20 bAB | 554.24 ± 30.89 aB 182.85 ± 11.98 bAB | 587.71 ± 64.16 aB 218.60 ± 23.77 bB |
| C18:1 Oleic | R P | 641.73 ± 48.12 aA 312.03 ± 67.29 bA | 1290.79 ± 72.37 aB 447.56 ± 27.26 bA | 2311.09 ± 185.9 aC 988.72 ± 16.54 bB | 2977.26 ± 76.51 aD 2219.92 ± 25.94 bC |
| C18:2 Linoleic | R P | 181.43 ± 8.92 aA 125.73 ± 29.59 aA | 323.39 ± 3.51 aB 155.41 ± 20.32 bA | 504.24 ± 55.7 aC 292.55 ± 44.30 aB | 586.11 ± 7.75 aC 624.42 ± 37.57 aC |
| C18:3 Linolenic | R P | 92.31 ± 13.81 aA 77.63 ± 1.23 aA | 129.20 ± 27.98 aAB 76.93 ± 2.98 aA | 200.74 ± 19.10 aBC 112.07 ± 15.74 aA | 227.1 ± 29.37 aC 161.71 ± 61.19 aA |
| Total FFA | R P | 2317.49 ± 41.6 aA 1343.16 ± 123.7 bA | 4210.33 ± 41.63 aB 1660.78 ± 8.46 bA | 6258.53 ± 563.24 aC 2544.69 ± 20.68 bB | 7568.31 ± 428.59 aC 4641.42 ± 291.22 bC |
| Short chain FFA | R P | 284.80 ± 14.74 aA 267.80 ± 0.84 aA | 431.61 ± 39.92 aA 289.18 ± 18.59 aAB | 614.71 ± 129.88 aAB 344.93 ± 6.09 aAB | 921.31 ± 115.26 aB 539.27 ± 132.89 aB |
| Medium chain FFA | R P | 308.74 ± 14.46 aA 203.9 ± 6.07 bA | 454.44 ± 82.48 aAB 225.12 ± 7.92 aAB | 593.24 ± 98.49 aB 248.8 ± 17.8 aB | 720.82 ± 53.17 aB 331.92 ± 6.46 bC |
| Long chain FFA | R P | 1723.95 ± 12.4 aA 871.46 ± 129.0 bA | 3324.28 ± 80.77 aB 1146.49 ± 34.96 bA | 5050.59 ± 334.87 aC 1950.96 ± 44.57 bB | 5926.19 ± 260.16 aD 3770.27 ± 151.87 bC |
Publisher’s Note: MDPI stays neutral with regard to jurisdictional claims in published maps and institutional affiliations. |
© 2022 by the authors. Licensee MDPI, Basel, Switzerland. This article is an open access article distributed under the terms and conditions of the Creative Commons Attribution (CC BY) license (https://creativecommons.org/licenses/by/4.0/).
Share and Cite
Pappa, E.C.; Bontinis, T.G.; Samelis, J.; Sotirakoglou, K. Assessment of the Microbiological Quality and Biochemical Parameters of Traditional Hard Xinotyri Cheese Made from Raw or Pasteurized Goat Milk. Fermentation 2022, 8, 20. https://doi.org/10.3390/fermentation8010020
Pappa EC, Bontinis TG, Samelis J, Sotirakoglou K. Assessment of the Microbiological Quality and Biochemical Parameters of Traditional Hard Xinotyri Cheese Made from Raw or Pasteurized Goat Milk. Fermentation. 2022; 8(1):20. https://doi.org/10.3390/fermentation8010020
Chicago/Turabian StylePappa, Eleni C., Thomas G. Bontinis, John Samelis, and Kyriaki Sotirakoglou. 2022. "Assessment of the Microbiological Quality and Biochemical Parameters of Traditional Hard Xinotyri Cheese Made from Raw or Pasteurized Goat Milk" Fermentation 8, no. 1: 20. https://doi.org/10.3390/fermentation8010020
APA StylePappa, E. C., Bontinis, T. G., Samelis, J., & Sotirakoglou, K. (2022). Assessment of the Microbiological Quality and Biochemical Parameters of Traditional Hard Xinotyri Cheese Made from Raw or Pasteurized Goat Milk. Fermentation, 8(1), 20. https://doi.org/10.3390/fermentation8010020