Article

Sensory Profile of Kombucha Brewed with New Zealand Ingredients by Focus Group and Word Clouds

Department of Wine, Food and Molecular Biosciences, Lincoln University, Lincoln 7647, New Zealand
*
Author to whom correspondence should be addressed.
Fermentation 2021, 7(3), 100; https://doi.org/10.3390/fermentation7030100
Submission received: 10 June 2021 / Revised: 21 June 2021 / Accepted: 22 June 2021 / Published: 23 June 2021
(This article belongs to the Special Issue Implementation of Digital Technologies on Beverage Fermentation)

Abstract

:
Kombucha is a yeast and bacterially fermented tea that is often described as having an acetic, fruity and sour flavour. There is a particular lack of sensory research around the use of Kombucha with additional ingredients such as those from the pepper family, or with hops. The goal of this project was to obtain a sensory profile of Kombucha beverages with a range of different ingredients, particularly of a novel Kombucha made with only Kawakawa (Piper excelsum) leaves. Other samples included hops and black pepper. Instrumental data were collected for all the Kombucha samples, and a sensory focus group of eight semi-trained panellists were set up to create a sensory profile of four products. Commercially available Kombucha, along with reference training samples were used to train the panel. Kawakawa Kombucha was found to be the sourest of the four samples and was described as having the bitterest aftertaste. The instrumental results showed that the Kawakawa Kombucha had the highest titratable acidity (1.55 vs. 1.21–1.42 mL) as well as the highest alcohol percentage (0.40 vs. 0.15–0.30%). The hops sample had the highest pH (3.72 vs. 3.49–3.54), with the lowest titratable acidity (1.21), and, from a basic poll, was the most liked of the samples. Each Kombucha had its own unique set of sensory descriptors with particular emphasis on the Kawakawa product, having unique mouthfeel descriptors as a result of some of the compounds found in Kawakawa. This research has led to a few areas that could be further studied, such as the characteristics of the Piperaceae family under fermentation and the different effects or the foaminess of the Kawakawa Kombucha, which is not fully explained.

Graphical Abstract

1. Introduction

Consumers are pushing a phenomenal surge for the potentially probiotic beverage known as Kombucha. The global sales volume reached USD 1779 million in 2020, with a compound annual growth rate (CAGR) projected at an astonishing 28.9% from 2020 to 2026, according to 360ResearchReports [1]. Kombucha is a sweetened tea that is fermented using a Symbiotic Culture of Bacteria and Yeast (or SCOBY). Examples of SCOBY are a combination of numerous lactic acid bacteria (Acetobacter, Brettanomyces, and Gluconacetobacter) and yeast (Saccharomyces, Zygosaccharomyces). These microorganisms form a biofilm-like structure at the top of the fermenting vessel. Kombucha is said to be well accepted in a sensory way by providing a unique drink that has an element of sweetness, while giving fruitiness and sour and acidic flavours. Ivanišová et al. [2] found that their Kombucha had a slightly better sensory preference overall compared to the sweetened black tea control, as well as improvements in taste and flavour intensity. Common flavours that are described by sensory panels seem to include lemon, vinegar, sour, and yeast flavours and aromas [3,4]. Mouthfeel is another sensory element to be considered. Gramza-Michałowska and collaborators [3] made Kombucha with different tea types (e.g., green, black, or yellow) and found that black tea had the poorest sensory acceptability, perhaps due to its lack of clarity and smoothness/mouthfeel in comparison to the other three tea types used, which were white, yellow, and green teas.
Currently, there is a lack of research around the sensory profile of Kombucha using different ingredients, such as the New Zealand native Kawakawa, or even simple Kombucha [5]. This has driven the need for research into the instrumental quality and flavour profiles of Kombucha made with New Zealand ingredients or other additives.
Black pepper (Piper nigrum L.) and the New Zealand plant Kawakawa (Piper excelsum) are both of the Piperaceae or pepper family and, therefore, have a unique spiciness. In New Zealand, Kawakawa has a history of being used as a medicinal plant for a range of small ailments [6]. In comparison, black pepper is a commonly found seasoning that also has a range of health benefits attributed to it, such as improvement to digestion and the ability to cure colds [7].
Hops are the flowers of the Humulus lupulus L. vine that are most commonly known for their role in beer production and flavour. Hops have concentrations of alpha acids that give bitterness to beer when they are boiled and isomerised. Other components of note are essential oils, resins, and phenolics that can be imparted during a process called dry hopping or during boiling [8]. Beta acids, found in hops, may be an issue for SCOBY growth since they have antibacterial properties. Hops can impart citrus flavours when dry-hopped (added after boiling), which may or may not have similar effects in Kombucha [9]. The hops variety used for this experiment was Riwaka™, which has a moderately low level of alpha acids and is described as having grapefruit and passionfruit aromas.
Word clouds, also known as tag clouds, are a valid visual tool to highlight the results of consumer studies such as focus groups. Word clouds are applied to qualitative analyses. The principle is to display those words that occur more often in a given description. The occurrence and size of each word reveals the relevance of each specific result, allowing observers to quickly notice differences among samples and the reasons behind them.
The hypothesis of this research is that each ingredient will produce a different response in the panellists, resulting in unique descriptors for each type of Kombucha. These may include acetic tastes, cloudiness or clarity, etc. The different ingredient additions may impact the growth of the microorganisms within, thereby impacting the instrumental quality of the Kombucha.
The aims of this research include testing the sensory characteristics of the Kombucha through the use of a semi-trained focus group consisting of at least eight people. This panel will test four samples of Kombucha, including a control Kombucha. The panellists will look at the various sensory qualities of the Kombucha, including areas such as clarity, bubble and foam formation, and colour. The second aim includes collecting instrumental data, including °Brix, pH, titratable acidity, and alcohol percentage. Instrumental data can be useful to support the discussion of sensory profiles, providing objective information on sensory-affecting parameters such as acidity and sweetness. Word clouds were used to visually highlight the results of the focus group, providing a novel, clear tool to describe food quality.

2. Materials and Methods

2.1. Materials

The Kombucha beverages were prepared using 1 L of boiling water, 70 g of white sugar (Pams, Auckland, New Zealand), 5 g of tea, 75 g of mother liquid, and 30 g of SCOBY (Get Cultured, Tauranga, New Zealand). The composition of this SCOBY can vary based on batches, but it usually comprises the following microorganisms: Acetobacter aceti, A. intermedius, A. nitrogenifigens, A. pasteurianus, A. xylinum, Bacterium gluconicum, B. xylinum, Gluconacetobacter kombuchae, G. oxydans, Brettanomyces bruxellensis, B. claussenii, B. intermedius, Candida collecolusa, C. famata, C. guilliermondii, C. kefyr, C. obtusa, Koleckera apiculata, Mycoderma sp., Mycotorula sp., Pichia membranefaciens, Saccharomyces bisporus, S. cerevisiae, S. ludwegii, Saccharomycodes sp., Schizosaccharomyces pombe, Torulaspora delbrueckii, Zygosaccharomyces bailii, Z. kombuchaensis, Z. lentus, and Z. rouxii, The adjuncts were ‘Empire’ cracked black pepper and Riwaka hops (brewshop.co.nz). The Kawakawa leaves used were from PureNature NZ (Auckland, New Zealand) and the black tea was from Bell Tea (Dunedin, New Zealand). The composition of Kawakawa dry leaves was determined in our laboratories, expressed in g/100 g of dry weight, and is as follows: protein, 17.1; minerals, 13.8; lipids, 8.41; soluble carbohydrates, 1.84; and insoluble carbohydrates, 48.2. The mineral profile was the following, expressed in mg/100 g dry weight: potassium, 3433; calcium, 1664; phosphorous, 603; magnesium, 557; sodium, 90.1; and iron, 11.9.

2.2. Kombucha Production

The SCOBY (30 g) and mother liquid (75 g) were from the same batch date, and the mother liquids were mixed, trying to maintain consistency through the four types. The boiling water, tea, and sugar were added to a pot, weighed, and kept boiling on a stove for 15 min, being stirred throughout. After boiling, boiling water was added to make up the initial weight. The tea was then filtered using a cheesecloth in a sieve before being placed in a pre-prepared ice bath to cool to approximately 22 °C. The tea was then transferred to a clean jar that had been sprayed with 70% ethanol, and the mother liquid and SCOBY were then added. The lid of the jar was placed on top but not screwed on in order to let any gas escape. The jars were transferred to a temperature-controlled room at 22 °C for seven days. The newly formed SCOBY as well as the original SCOBY were then removed, and any adjuncts added. The Kombucha was then kept in the fridge (+4 °C) overnight and in the morning was filtered using a sieve and cheesecloth.

2.3. pH Testing

The pH testing was performed using a Metrohm 730 Sample Changer Auto Titrator from MEP instruments, Newmarket (Auckland, New Zealand). The titrant used was 0.1 N NaOH from LabServ (Auckland, New Zealand), and this was administered using a Metrohm 702 SM Tritrino (Auckland, New Zealand). A sample size of 5 mL was used to perform the analysis. A standard pH meter was originally used, but this gave different results to the Auto Titrator; therefore, the Auto Titrator was chosen as the most accurate reading.

2.4. Titratable Acidity

Titratable acidity was performed using the Metrohm 730 Sample Changer Auto Titrator (Auckland, New Zealand). The titrant was 0.1 N NaOH from LabServ, and this was dispensed using a 702 SM Tritrino. A 5-millilitre sample was used. The corresponding software used was Tiamo 1.2.

2.5. Degrees Brix

The °Brix was obtained using a refractometer (Keg King, Springvale, Australia) calibrated with tap water. A drop of room temperature sample was placed on the testing panel, read, and was then cleaned from the panel using soft tissues. During preliminary testing, the °Brix test was performed daily, while in the final brew, °Brix was only obtained from day 0 and day 8, after the adjuncts were added.

2.6. Alcohol Testing

Alcohol testing was performed using a Dujardin-Salleron ebulliometer (Paris, France) that was calibrated using tap water. The boiling point of the tap water set the ebulliometer scale. A measure of the sample was added based on the ebulliometer equipment, and the temperature was read when the sample reached the boiling point. The boiling point was correlated to an equivalent alcohol percentage using the scale. The ebulliometer was cleaned between samples and was rinsed with the new sample.

2.7. Microbial Enumeration

Microbial enumeration was performed to establish the quantity of lactobacilli (probiotic bacteria) present in the beverages. Two serial dilutions were performed to 10−2. The MRS agar plates (Fort Richard, Auckland, New Zealand) were incubated for 48 h in an anaerobic environment with Thermo Scientific™ Oxoid AnaeroGen 2.5 L sachets (Auckland, New Zealand). Then, colony forming units (log CFU/mL) were counted [10].

2.8. Sensory Panel

Eight master’s students volunteered to be part of a sensory focus group. They were selected based on the following three criteria: experience in food science and sensory analysis, habit of drinking fermented and non-fermented beverages, and a multicultural background. The students were of different nationalities, including Chinese, Indian, and Vietnamese. They were of young age (twenties), 6 were female and 2 were male. This selection represented the consumer target of Kombucha, being mostly young females according to a recent survey by Mintel in 2019 [11]. The participants were asked to sign a consent form that included a list of potential allergens that may be in the samples. Sensory descriptors for four different categories, namely appearance, aroma, flavour, and mouthfeel, were collected for three commercial Kombucha products during a 1-h training session. The commercial samples were a control, original Kombucha by Daily Organics (Matakana Village, New Zealand), a spiced Kombucha by Daily Organics called ‘Winter’ that included a chai tea and ginger blend, and a Ginger and Kawakawa Kombucha by Mauriora (Christchurch, New Zealand) that provided a Kawakawa flavour. The most significant descriptors were chosen to use as a reference for the Kombucha samples. A set of sensory reference samples were created to use for training; these included carbonation, bitterness, sourness, sweetness, and colour. The carbonation training was performed using sparkling water, the bitterness using a hop pellet dissolved in roughly 25 mL of water, the sourness using a lemon slice, the sweetness using a 7% sugar solution, and the colour using black tea. With the reference samples as a guide, the semi-trained panel chose and agreed upon different sensory descriptors for each Kombucha sample. One sample of each product was provided in the sessions. In the second session, samples were labelled with 3-random-digit codes. Samples were presented in the following order: control, hops, Kawakawa, black pepper. This session lasted for about one hour. A 10-minute break was allowed between the two sessions (training, samples) to avoid sensory fatigue. Water was provided as a palate cleanser. All data were recorded on a whiteboard to ensure that the panellists could change their answers and could compare to previous samples. The resulting data were tabulated for discussion. The study was approved by the Ethics Committee of Lincoln University (protocol code 2020-60, approved on 11 December 2020).

2.9. Statistical Analyses

Instrumental measurements were taken in duplicate and an average was calculated with Excel 2016. Minitab 18 software was used to calculate statistical significance using a one-way analysis of variance (ANOVA) and a post hoc Tukey test, with an α value of 0.05. An online word cloud generator (www.wordclouds.com by Zigomatic, Vianen, The Netherlands, accessed on 3 May 2021 was used to summarise the results of the focus group and display the most agreed attributes for each sample.

3. Results and Discussion

3.1. Instrumental Results

The °Brix results for the four different Kombucha samples, both before and after fermentation, showed fairly similar results, with only one odd result for day zero for the hops sample, which came out at 6.8 °Brix. This result is odd since the control, black pepper, and hops all should have started the same since, in essence, they were all controls until day seven when their extra ingredients were added (Table 1).
The measurements of the day eight samples were taken after roughly a day of the adjuncts being added, i.e., the hops, and black pepper. The initial pH values for the four samples were all fairly similar and were within 0.2 pH of each other. This almost negligible difference was to be expected since the SCOBY/mother liquid batch for all the samples was the same. Three of the samples reached a fairly similar pH after fermentation, including Kawakawa, which, in preliminary results, tended to have a higher pH throughout the whole fermentation. The one interesting result from the pH measurements is the starting point of 3.8 for the hops only dropping to 3.7, which is an unexpected result. In beer, which has a somewhat similar fermentation process to Kombucha, the hops can take various components out of solution through the formation of complexes during hop filtration. One such complex that is very common is the protein–phenol complex, which may have also occurred in our hops Kombucha sample from proteins in/from the yeast and phenolic compounds in the hops. Phenolic compounds, such as tannic acid, are acidic, and therefore, when they fall out of a solution, they may increase the pH of the Kombucha and partially explain the results. Overall, our pH results are a little high compared to some other studies, where a pH of 3 was more expected; it may be that the Kombucha beverages required one to two more days to ferment [12,13].
The results for the titratable acidity (TA) for day zero and day eight are shown in Table 1. As can be seen from the table, all four samples had a very similar TA at the beginning, with no statistically significant differences (p value 0.448 for TA at Day 1), while deviations occurred after the completion of the fermentation. The first TA would likely only be from the mother liquid, which would have previously produced acids, mainly organic acids. However, as the fermentation progressed, the current microorganisms would have produced new acids, partially dependent on the growing conditions and whether they were favourable. The lactic acid bacteria are responsible for the production of acids, meaning that the samples with a higher TA had better growing conditions for bacteria to grow and produce acids. In this case, the highest TA was present in the Kawakawa Kombucha, which may have been caused by a favouring of all the bacteria or perhaps of one particular type; this requires some further investigation as there is no literature in this area. Regardless of the larger Kawakawa value, the TAs for all the samples were fairly similar (within 0.3 mL), which was not unexpected since three of the four recipes all started the same. The difference between the start and end of the fermentation was reasonably large, particularly for Kawakawa, which had a change of approximately 0.9 mL for only a 5-millilitre sample, suggesting that the bacteria produced a significant amount of acid during fermentation. The Kombucha with the smallest change in TA was the hops sample that had a 0.4 mL increase for a 5-millilitre sample. Nonetheless, these differences were not significant (p value 0.070 for TA at Day 8), thus having minimal implications on the quality of the beverages. Some of these results can be explained with the help of microbial data. The experiment measured colony forming units (CFUs) from day zero and day eight. The results from day zero ranged from 7.18 log CFU/mL for Kawakawa to 7.40 log CFU/mL for hops, these initial differences may be related to the different distribution of bacteria in the SCOBY. The results for day eight are much more useful, where there are distinct increases and decreases in the bacterial levels. The amount that the control increased, the hops Kombucha decreased as much (7.34 log CFU/mL); this shows that the bacteria, including the acetic acid bacteria, significantly drop after the hop addition, which may partially explain why the pH of the hops Kombucha was higher than the rest, as there are not any acetic acid bacteria to convert sugar or ethanol to acetic acid. The bacterial count for both Kawakawa and black pepper was higher than the increase in the control. The Kawakawa had a 7.47 log CFU/m increase, and black pepper had a 7.67 log CFU/mL increase, which was over double the control. This may explain why both the black pepper and Kawakawa were low in pH and high in TA. These differences in results must be a result of only one day, as the ingredients were added on day seven, right before the Kombucha beverages were refrigerated, which is a quick change. The research around the Piperaceae family is mixed in conclusions, as one article describes many species as having antibacterial actions, particularly against Gram-negative bacteria, which include acetic acid bacteria, while another article describes black pepper as having some prebiotic qualities [14]. This area could perhaps use some deeper research to understand the underlying factors.
The alcohol percentages for all four samples were well below 1%, with the highest being Kawakawa at an average of 0.4% and the lowest being the control at an average of 0.15%. These results suggest that the yeast in the Kawakawa Kombucha were particularly active compared to the other samples, or it may be that particular yeast strains that tend to produce significantly higher alcohol levels are favoured by the conditions that the Kawakawa Kombucha gives. In comparison to the current literature, our control alcohol percentage for eight days of fermentation is reasonably low, though this is difficult to discern as many studies measure ethanol only through chromatography methods and even then, the results cover a large range of ethanol contents, such as nearly 0.3 to 0.6 mg/mL [15,16]. However, in comparison to some commercial ethanol contents, our ethanol contents are very low [16]. This may be due to different fermentation parameters, such as temperature ranges, as higher temperatures promote yeast growth [13]. This is interesting to compare to the previously discussed bacterial levels on day eight, as they suggested that the bacteria were favoured in all the samples but the hops Kombucha. Therefore, one would almost expect that the fermented hop beverage might be the highest in alcohol. However, this is not the case; therefore, perhaps the conditions provided by black pepper and Kawakawa promote the growth of both bacteria and yeast.
No samples were taken on day seven, meaning that comparisons before the flavourings were added could not be made; this would have been a useful comparison, and in future should be added to the design. This would allow for the comparison of the samples without the flavourings, as well as the impact that the flavourings have on the instrumental results.

3.2. Training of Focus Group with Commercial Samples and Standards

The descriptors that were agreed on during the focus group training are shown in Table 2. A range of descriptors were of particular note as well as potential explanations to correspond. One of the main descriptors for flavour was sourness with each Kombucha having a sour taste either above or below the reference of lemon and having a number of agreeing panellists. Sour and acetic flavours are some of the main descriptors for plain Kombucha, along with fruitiness and freshness [3]. This can be seen in the control descriptors of sour, tomato and honey aromas, and sour and Hawthorn flavours. The sour descriptors align with the instrumental results that showed a pH of 3.5. The fruity aromas and flavours are likely due to esters that are formed by the yeast. For example, it is possible that the phenyl ethyl acetate ester is responsible for the honey aroma [17,18].
No astringency is mentioned for the control mouthfeel as it is for all other samples, this aligns with Tran and collaborators [13], who say that astringency is never mentioned as a Kombucha descriptor. This means that for all the other samples, the astringency likely comes from the additional ingredients.

3.3. Descriptive Analysis of Samples by Focus Group

The control Kombucha was described as orange and sour (in aroma and taste) (Table 3).
A result that is of particular interest is that seven of the eight panellists agreed that the black pepper sample was less sour than the lemon reference (Table 4), yet the TA was the second highest and the pH was one of the lowest, meaning that, theoretically, it should sit in a similar place to Kawakawa, yet this was not the case. This is further expounded by the agreeance of all panellists that the black pepper was sweeter than the 7% sugar reference. The sweetness result may be due to a few different reasons, such as a difference in fermentation since two different SCOBYs were divided between the four types. The difference may have been due to slightly different conditions since each Kombucha was made individually rather than separated out from one big batch. Another possible reason is that components of black pepper can promote the breakdown of proteins into amino acids [19]. Amino acids can sometimes have sweet flavours and these amino acids may also reduce the perception of acidity, though this requires further research. There are also other components in the pepper that may improve the perception of sweetness, such as the essential oils and other flavour components, including esters.
Apart from the interesting comparisons made above, there are very few other descriptors of note, except that there were three panellists that described a ‘spice’ aroma, which would be expected as a result of the black pepper. However, it would have been expected that the black pepper would produce aromas such as ‘flowery’, ‘green’, ‘intense’, or even ‘peppery’ [20]. This was not the case, however; therefore, it is likely that the components that cause these descriptors were broken down by microorganisms or other chemical processes during the cooling and refrigeration step.
The hops Kombucha (Table 5) had fewer descriptors than the other three samples. The whole panel found there to be hop aromas and flavours. Only three people described a sour flavour, which is to be expected given the instrumental results of a high pH and a low titratable acidity compared to the other Kombucha products. In beer, hops are added before or during boiling to isomerise the alpha acids to give a bitter flavour. Hops may also be added during or after fermentation to provide aromas—called dry hopping. The bitter flavour that two of the panellist’s mentioned may be related to the original Kombucha, the actual hop bitterness, or even the effect of the hop aromas on perceived bitterness [21]. The hops are also likely to be responsible for the ‘leafy’ aroma. The astringency could also be a result of the hops, as polyphenols from the hops form complexes with the proteins in saliva, giving a feeling of astringency [22].
The Kombucha that was agreed upon as being the sourest was Kawakawa (Table 6), and this corresponds well to both the pH and the TA of the Kombucha, which were comparatively low and high, respectively. An interesting descriptor to note is the alcohol descriptor for flavour, which was mentioned by one panellist. The only other mention of an alcohol flavour was for the control, where two panellists agreed. This is interesting, as the control had the lowest alcohol percentage, and the Kawakawa had the highest. Tran and collaborators [13] mentioned that the flavour threshold for ethanol is around 1–2; therefore, it is likely that the panellists were describing another flavour that is similar to ethanol, as the Kawakawa contained only 0.4% alcohol, though it may have played a slight role in the bitter flavour described. Many of the flavour and mouthfeel characteristics could be explained by the presence of compounds such as piperidides, isobutyl amides, and esters [23]. Furthermore, compounds of essential oils such as myristicin might contribute to the strong aroma and flavour found in the Kawakawa Kombucha. It was suggested that essential oils from plant secondary metabolites have a wide application in food flavouring and in fragrance industries [24].
These different compounds are found in Kawakawa and are described as being hot, astringent, bitter, tingly, dry, irritating, numbing, and cooling. The descriptors mentioned correspond well to the spice aroma, bitter taste and aftertaste, as well as the astringency and minty/cooling feeling described for mouthfeel. One other descriptor of note that is different from the control is the foamy appearance descriptor. There is little Kombucha research in this area, but the theory should be somewhat similar to beer. In beer, foam stability is often the result of protein presence as well as carbonation [25]. Therefore, in this case, it may be that there were more proteins present, perhaps from the yeast. This aligns with the higher alcohol percentage found in the Kawakawa Kombucha. The foaminess may also be a result of some other compound from the Kawakawa; this could use more research.

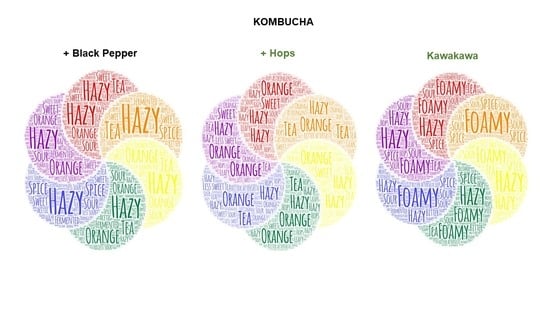
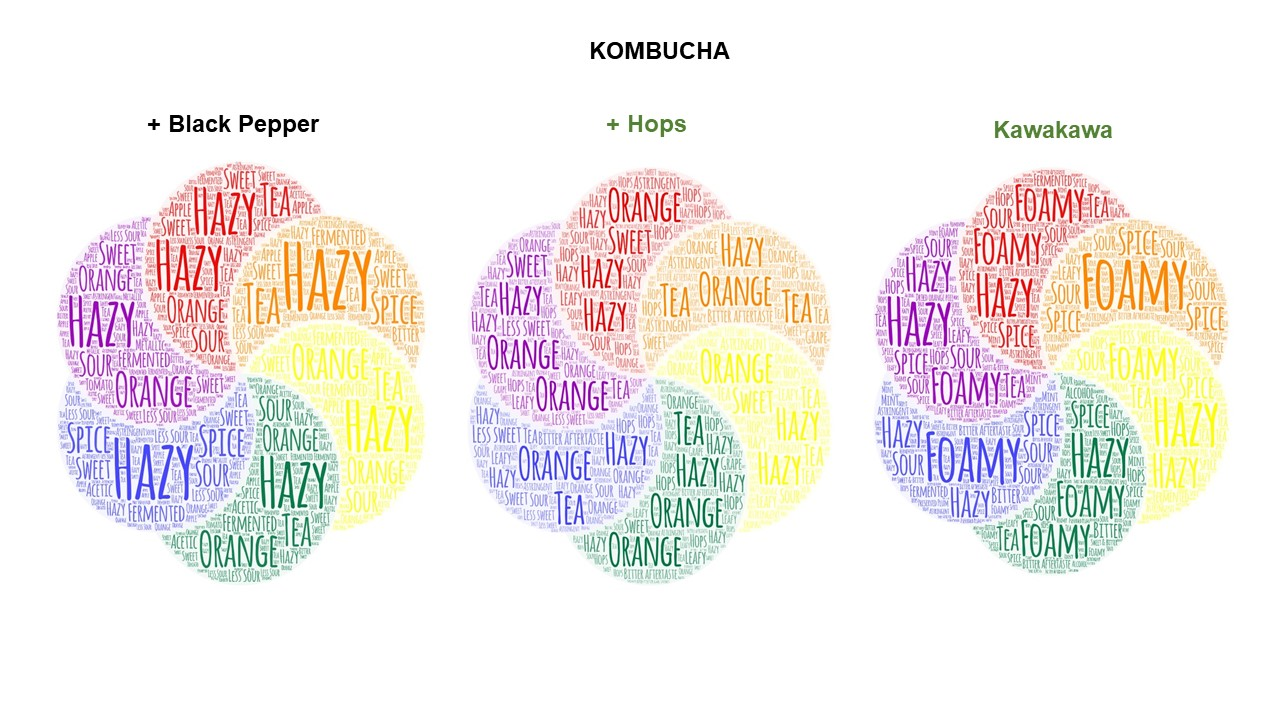
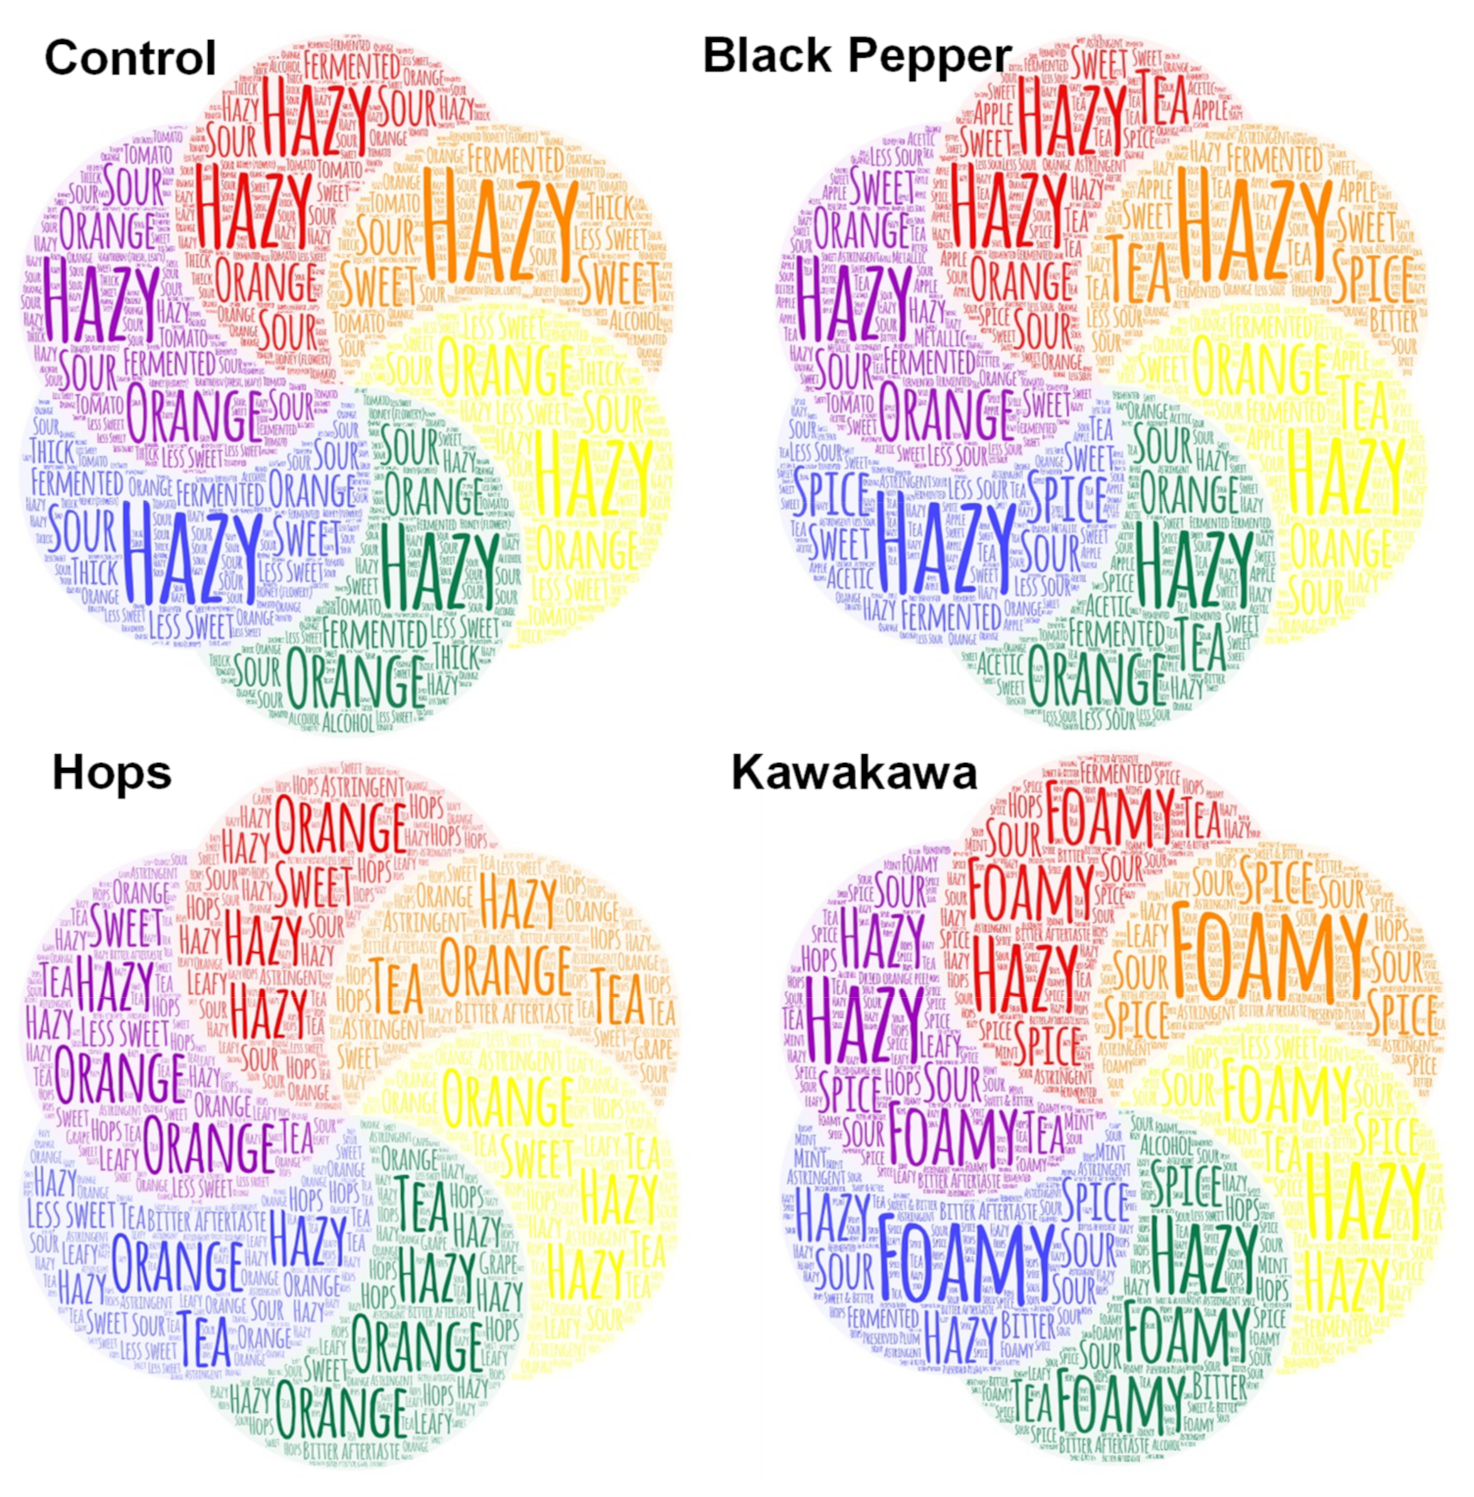
3.4. Word Clouds of Samples

The focus group has shown differences in the sensory profiles of the Kombucha samples tested. Each recipe was characterized by distinctive attributes for appearance, aroma, flavour, and mouthfeel. While Table 3, Table 4, Table 5 and Table 6 might provide an overwhelming amount of information, only some of these differences resulted in a large change in perception of the overall quality. Considering that eight panellists participated in the session, only the attributes agreed to by at least seven panellists were considered representatives of high consensus. It must be noted that word clouds do not represent a sensory profile, but rather a depiction of sensory results. Therefore, scientific conclusions were drawn based on the results listed in Table 3, Table 4, Table 5 and Table 6. Word clouds were a useful tool to display such findings.
With this logic in mind, the control Kombucha was hazy and orange in look, had a sour and tomato aroma, and was less sweet than the others in flavour. Nonetheless, the word cloud (Figure 1) highlighted hazy as the main attribute. This can be explained by the occurrence of this attribute in all the samples, which is likely due to the high biomass produced upon fermentation. The black pepper Kombucha’s sensory profile was mostly similar to the control (Figure 1). Table 3 and Table 4 indicated that the black pepper Kombucha was less sour and sweeter than the control, with a spice aroma, but no unanimous agreement was reached. This was likely due to small differences; consequently, the word cloud displayed this lack of significant difference by producing a similar representation as that for the control. Therefore, it can be deduced that these two products did not differ in sensory quality.
Alternatively, the hops and Kawakawa recipes were characterized by one key difference: an orange and less hazy appearance (hops), a foamy appearance (Kawakawa) (Figure 1). Once again, the word clouds highlighted significant differences among the samples. Interestingly, Table 5 showed a unanimous agreement on the hops Kombucha for hazy, but this attribute was only a minor component of the word cloud. This difference can be ascribed by the phenolic content of hops (orange colour) as well as a comparable amount of biomass produced (hazy appearance), resulting in a perception of a less hazy product. Finally, the Kawakawa Kombucha was described as both hazy and foamy (Table 6) due to biomass production and protein-induced foam development. Spicy and sour aromas were agreed on, as well as astringent mouthfeel, but all of these attributes were overshadowed by a visible difference in the foam volume (Figure 1).

4. Conclusions

The hypothesis was that each Kombucha would have a unique sensory profile depending on the different ingredients added. This turned out to be true, with distinct differences for the Kawakawa and hops Kombucha beverages, and subtler differences for the black pepper Kombucha. The differences were also shown in the instrumental analyses, with minor differences in the pH and alcohol levels among the fermented products, some of which were picked up in the sensory profiling. For example, the hops Kombucha was described as sour in taste by fewer panellists (3 vs. 5–7 people). This agreed with the significantly higher pH than the other beverages (3.72 vs. 3.49–3.54). In addition, an alcohol flavour was noted only for the Kawakawa Kombucha, which, in fact, was significantly more alcoholic than the other beverages (0.40 vs. 0.15–0.30%).
This experiment provided a range of information and potential explanations as to why the results occurred, though there are many areas that require more research for a surer knowledge. Some of these areas include the discrepancy between the professed antimicrobial, yet prebiotic nature of the Piperaceae family, particularly for Kawakawa, that have not been investigated in depth. The sweetness that black pepper gives could also benefit from a confirmation as to its origin. Finally, the foaminess of the Kawakawa Kombucha could use with further investigation, as there would likely be fairly low protein levels; therefore, a different compound may have a part to play.
What the focus group could not display was the extent of the differences. Word clouds provided this information and put it into context, allowing a visual description of the sensory profiles. Focus groups provide detailed information of scientific significance, while word clouds offer an easily readable overall view. An integration of both methods is a comprehensive approach to descriptive sensory analysis.

Author Contributions

Conceptualization, L.S.; the training session and the focus group—planning, organization, and management, C.L.; methodology planning, L.S. (overall), Y.Z. (fermentation), and C.L. (sensory analysis); software use, L.S. and H.S.G.; validation, L.S. and A.M.; formal analysis, L.S.; investigation, H.A., N.R.M., and Y.C.; resources, L.S.; data curation, L.S. and H.S.G.; writing—original draft preparation, H.A., S.W., and L.S.; writing—review and editing, L.S. and A.M.; visualization, L.S.; supervision, L.S.; project administration, L.S.; funding acquisition, L.S. All authors have read and agreed to the published version of the manuscript.

Funding

This research was funded by Department of Wine, Food, and Molecular Biosciences, Faculty of Agriculture and Life Sciences, Lincoln University, New Zealand. The budget was allocated to teaching the course named “FOOD399—Research Placement”.

Institutional Review Board Statement

The study was conducted according to the guidelines of the Ethics Committee of Lincoln University for sensory analysis (Application No: 2020-35, Approved on 14 August 2020).

Informed Consent Statement

Informed consent was obtained from all subjects involved in the study.

Acknowledgments

Authors would like to thank Shiyun Li for her preliminary work on Kawakawa Kombucha and Jamel Elizabeth Barber for her study of black pepper as an aromatic compound in fermented beverages. In addition, the authors would like to acknowledge the technical work of Roger Cresswell (protein analysis of Kawakawa dry leaves) and Rosy Tung (dry matter, ash, lipid, and soluble carbohydrates of dry Kawakawa leaves). Finally, the authors would like to thank Leo Vanhanen for his help with the instrumental analysis of pH and titratable acidity.

Conflicts of Interest

The authors declare no conflict of interest.

References

  1. 360 Research Reports. Available online: https://www.360researchreports.com/-global-kombucha-market-17759175 (accessed on 2 June 2021).
  2. Ivanišová, E.; Meňhartová, K.; Terentjeva, M.; Harangozo, Ľ.; Kántor, A.; Kačániová, M. The evaluation of chemical, antioxidant, antimicrobial and sensory properties of kombucha tea beverage. J. Food Sci. Technol. 2019, 57, 1840–1846. [Google Scholar] [CrossRef]
  3. Gramza-Michałowska, A.; Kulczyński, B.; Xindi, Y.; Gumienna, M. Research on the effect of culture time on the kombucha tea beverage’s antiradical capacity and sensory value. Acta Sci. Pol. Technol. Aliment. 2016, 15, 447–457. [Google Scholar] [CrossRef]
  4. Neffe-Skocińska, K.; Sionek, B.; Ścibisz, I.; Kołożyn-Krajewska, D. Acid contents and the effect of fermentation condition of Kombucha tea beverages on physicochemical, microbiological and sensory properties. CYTA J. Food 2017, 15, 601–607. [Google Scholar] [CrossRef] [Green Version]
  5. Kim, J.; Adhikari, K. Current Trends in Kombucha: Marketing Perspectives and the Need for Improved Sensory Research. Beverages 2020, 6, 15. [Google Scholar] [CrossRef] [Green Version]
  6. Butts, C.A.; van Klink, J.W.; Joyce, N.I.; Paturi, G.; Hedderley, D.I.; Martell, S.; Harvey, D. Composition and safety evaluation of tea from New Zealand kawakawa (Piper excelsum). J. Ethnopharmacol. 2019, 232, 110–118. [Google Scholar] [CrossRef]
  7. Gülçin, İ. The antioxidant and radical scavenging activities of black pepper (Piper nigrum) seeds. Int. J. Food Sci. Nutr. 2009, 56, 491–499. [Google Scholar] [CrossRef]
  8. Teghtmeyer, S. Hops. J. Agric. Food Inf. 2018, 19, 9–20. [Google Scholar] [CrossRef]
  9. Lafontaine, S.R.; Shellhammer, T.H. Impact of static dry-hopping rate on the sensory and analytical profiles of beer. J. Inst. Brew. 2018, 124, 434–442. [Google Scholar] [CrossRef] [Green Version]
  10. Dave, R.I.; Shah, N.P. Evaluation of media for selective enumeration of Streptococcus thermophilus, Lactobacillus delbrueckii ssp. bulgaricus, Lactobacillus acidophilus, and bifidobacteria. J. Dairy Sci. 1996, 79, 1529–1536. [Google Scholar] [CrossRef]
  11. Mintel. Tea and RTD Teas—US—August 2019. Reasons for Drinking Kombucha. 2019. Available online: www.reports.mintel.com (accessed on 8 June 2021).
  12. Goh, W.N.; Rosma, A.; Kaur, B.; Fazilah, A.; Karim, A.A.; Rajeev, B. Fermentation of black tea broth (Kombucha): I. Effects of sucrose concentration and fermentation time on the yield of microbial cellulose. Int. Food Res. J. 2012, 19, 109. [Google Scholar]
  13. Tran, T.; Grandvalet, C.; Verdier, F.; Martin, A.; Alexandre, H.; Tourdot-Maréchal, R. Microbiological and technological parameters impacting the chemical composition and sensory quality of kombucha. Compr. Rev. Food Sci. Food Saf. 2020, 19, 2050–2070. [Google Scholar] [CrossRef] [PubMed]
  14. Cvetković, D.; Markov, S.; Djurić, M.; Savić, D.; Velićanski, A. Specific interfacial area as a key variable in scaling-up Kombucha fermentation. J. Food Eng. 2008, 85, 387–392. [Google Scholar] [CrossRef]
  15. Perigo, C.V.; Torres, R.B.; Bernacci, L.C.; Guimarães, E.F.; Haber, L.L.; Facanali, R.; Vieira, M.A.R.; Quecini, V.; Marques, M.O.M. The chemical composition and antibacterial activity of eleven Piper species from distinct rainforest areas in Southeastern Brazil. Ind. Crop. Prod. 2016, 94, 528–539. [Google Scholar] [CrossRef]
  16. Narendra Babu, K.; Hemalatha, R.; Satyanarayana, U.; Shujauddin, M.; Himaja, N.; Bhaskarachary, K.; Dinesh Kumar, B. Phytochemicals, polyphenols, prebiotic effect of Ocimum sanctum, Zingiber officinale, Piper nigrum extracts. J. Herb. Med. 2018, 13, 42–51. [Google Scholar] [CrossRef]
  17. Wang, S.; Zhang, L.; Qi, L.; Liang, H.; Lin, X.; Li, S.; Yu, C.; Ji, C. Effect of synthetic microbial community on nutraceutical and sensory qualities of kombucha. Int. J. Food Sci. Technol. 2020, 55, 3327–3333. [Google Scholar] [CrossRef]
  18. Pires, E.J.; Teixeira, J.A.; Brányik, T.; Vicente, A.A. Yeast: The soul of beer’s aroma—A review of flavour-active esters and higher alcohols produced by the brewing yeast. Appl. Microbiol. Biotechnol. 2014, 98, 1937–1949. [Google Scholar] [CrossRef] [Green Version]
  19. Meghwal, M.; Goswami, T.K. Piper nigrum and Piperine: An Update. Phytother. Res. 2013, 27, 1121–1130. [Google Scholar] [CrossRef]
  20. Narasimhan, S.; Rajalakshmi, D.; Chand, N. Quality of powdered black pepper (Piper nigrum L.) during storage: II. Principal Components Analyses of GC and sensory profiles. J. Food Qual. 1992, 15, 67–83. [Google Scholar] [CrossRef]
  21. Oladokun, O.; James, S.; Cowley, T.; Dehrmann, F.; Smart, K.; Hort, J.; Cook, D. Perceived bitterness character of beer in relation to hop variety and the impact of hop aroma. Food Chem. 2017, 230, 215–224. [Google Scholar] [CrossRef] [PubMed]
  22. François, N.; Guyot-Declerck, C.; Hug, B.; Callemien, D.; Govaerts, B.; Collin, S. Beer astringency assessed by time—Intensity and quantitative descriptive analysis: Influence of pH and accelerated aging. Food Qual. Prefer. 2006, 17, 445–452. [Google Scholar] [CrossRef]
  23. Obst, K.; Lieder, B.; Reichelt, K.V.; Backes, M.; Paetz, S.; Geißler, K.; Krammer, G.; Somoza, V.; Ley, J.P.; Engel, K.-H. Sensory active piperine analogues from Macropiper excelsum and their effects on intestinal nutrient uptake in Caco-2 cells. Phytochemistry 2017, 135, 181–190. [Google Scholar] [CrossRef] [PubMed]
  24. Richardson, A.T. Hot new chemistry from a kiwi pepper tree. Chem. N. Z. 2015, 79, 91–93. [Google Scholar]
  25. Steiner, E.; Gastl, M.; Becker, T. Protein changes during malting and brewing with focus on haze and foam formation: A review. Eur. Food Res. Technol. 2011, 232, 191–204. [Google Scholar] [CrossRef]
Figure 1. Word clouds originated from the focus group, showing the most agreed attributes for the Kombucha samples.
Fermentation 07 00100 g001
Table 1. Parameters used to monitor the fermentation performance of different Kombucha samples. TA stands for titratable acidity. Different superscript letters refer to statistically significant samples (α 0.05).
Monitoring of Fermentation
DayTea Type°BrixpHTA (mL)Alcohol (%)
1Control6.2 ± 0 b3.90 ± 0.03 b0.77 ± 0.07 a
Black Pepper6.0 ± 0 d3.82 ± 0.00 c0.76 ± 0.07 a
Hops6.8 ± 0 a3.80 ± 0.01 c0.79 ± 0.05 a
Kawakawa6.1 ± 0 c3.98 ± 0.01 a0.67 ± 0.08 a
8Control6.2 ± 0 a3.54 ± 0.02 b1.28 ± 0.05 a0.15 ± 0.07 c
Black Pepper6.0 ± 0 b3.49 ± 0.00 b1.42 ± 0.03 a0.30 ± 0.00 ab
Hops6.2 ± 0 a3.72 ± 0.04 a1.21 ± 0.18 a0.20 ± 0.00 bc
Kawakawa6.0 ± 0 b3.50 ± 0.04 b1.55 ± 0.01 a0.40 ± 0.00 a
Table 2. The training table for the focus group using three commercially available Kombucha beverages. The words in bold refer to those used as base descriptors for the final Kombucha samples.
Commercial Sample Sensory Training
Sample1. Mauriora ‘Ginger & Kawakawa’2. Daily Organics ‘Original’3. Daily Organics ‘Winter’
AppearanceClearHazyDarker than 2
Orange/yellowFoamyBright orange/yellow
Piece of SCOBYLight colourHazier than 2
Less foamyPale ale colourFoamy
AromaGingerFermented (beer)Sour (more than 2)
TeaApple ciderLess ‘fermented’ than 2
Ginger beerMaltyFermented juice
SpiceNot teaTea
CinnamonPearNot like tea
Sweet/sour (in between) Less fruity, more smoky
Rotten apple (in a nice way)
Flavour and TasteSour!Acetic acidBitter
Bad aftertaste (bitter)Bitter aftertasteSour
AstringentBeerPear
Acetic acidSlightly sweetSlightly sweet
MetallicAlcoholFruity
Bread aftertaste Acrid
MouthfeelLightCarbonatedCarbonated
Not very rich/thick Not as fizzy
Table 3. The results from the sensory focus group of eight panellists. The descriptors were based on the commercial Kombucha beverages, and the new descriptors were from the control Kombucha sample.
SensoryControl
DescriptorsNew Descriptors
AppearanceHazy7Thick5
Orange8
AromaFermented6Tomato8
Sweet3Honey (flowery)6
Sour8
Flavour and TasteLess sweet8Hawthorn (fresh, leafy)3
Sour5
Alcohol2
Mouthfeel
Table 4. The results from the sensory focus group of eight panellists. The descriptors were based on the commercial Kombucha beverages, and the new descriptors were from the black pepper Kombucha sample.
SensoryBlack Pepper
DescriptorsNew Descriptors
AppearanceHazy7
Orange7
AromaSpice3Tomato1
Tea4
Sweet1
Fermented6
Sour5
Flavour and TasteSweet8Apple6
Bitter1
Less sour7
Metallic1
Acetic3
MouthfeelAstringent3
Table 5. The results from the sensory focus group of eight panellists. The descriptors were based on the commercial Kombucha beverages, and the new descriptors were from the hops Kombucha sample.
SensoryHops
DescriptorsNew Descriptors
AppearanceOrange8
Hazy8
AromaTea4Leafy3
Sweet3Hops8
Grape1
Flavour and TasteLess sweet2Hops8
Bitter aftertaste2
Sour3
MouthfeelAstringent4
Table 6. The results from the sensory focus group of eight panellists. The descriptors were based on the commercial Kombucha beverages, and the new descriptors were from the Kawakawa Kombucha sample.
SensoryKawakawa
DescriptorsNew Descriptors
AppearanceFoamy8
Hazy8
AromaSpice8Leafy2
Tea4Dried orange peel2
Less sweet (ref)1
Sour8
Fermented3
Flavour and TasteBitter2Hops7
Sour7Preserved plum2
Bitter aftertaste5Sweet and bitter6
Alcohol1Spice7
MouthfeelAstringent7Mint (cooling feeling)6
Publisher’s Note: MDPI stays neutral with regard to jurisdictional claims in published maps and institutional affiliations.

