Communication

Saccharomyces cerevisiae Fermentation of 28 Barley and 12 Oat Cultivars

1
Department of Plant Sciences, University of Saskatchewan, 51 Campus Drive, Saskatoon, SK S7N 5A8, Canada
2
Prairie Tide Diversified Inc., 102 Melville Street, Saskatoon, SK S7J 0R1, Canada
3
Guangdong Saskatchewan Oilseed Joint Laboratory, Department of Food Science and Engineering, Jinan University, 601 Huangpu Avenue West, Guangzhou 510632, China
*
Authors to whom correspondence should be addressed.
Fermentation 2021, 7(2), 59; https://doi.org/10.3390/fermentation7020059
Submission received: 12 March 2021 / Revised: 5 April 2021 / Accepted: 8 April 2021 / Published: 10 April 2021

Abstract

:
As barley and oat production have recently increased in Canada, it has become prudent to investigate these cereal crops as potential feedstocks for alcoholic fermentation. Ethanol and other coproduct yields can vary substantially among fermented feedstocks, which currently consist primarily of wheat and corn. In this study, the liquified mash of milled grains from 28 barley (hulled and hull-less) and 12 oat cultivars were fermented with Saccharomyces cerevisiae to determine concentrations of fermentation products (ethanol, isopropanol, acetic acid, lactic acid, succinic acid, α-glycerylphosphorylcholine (α-GPC), and glycerol). On average, the fermentation of barley produced significantly higher amounts of ethanol, isopropanol, acetic acid, succinic acid, α-GPC, and glycerol than that of oats. The best performing barley cultivars were able to produce up to 78.48 g/L (CDC Clear) ethanol and 1.81 g/L α-GPC (CDC Cowboy). Furthermore, the presence of milled hulls did not impact ethanol yield amongst barley cultivars. Due to its superior ethanol yield compared to oats, barley is a suitable feedstock for ethanol production. In addition, the accumulation of α-GPC could add considerable value to the fermentation of these cereal crops.

1. Introduction

Barley and oats are major crops grown in Canada, with production of 10.4 and 4.2 Mt in 2019, respectively [1]. Barley and value-added barley products return over CAD $2 billion in Canadian exported goods alone [2]. Demand for these grains continues to be strong, with an increase of 14.0% and 18.1% acres planted in 2019 compared to the prior year for barley and oats, respectively [3]. These crops are primarily used as animal feed, but are also used to produce food and alcohol [2,3,4]. Oats and barley are excellent sources of carbohydrates and fibre (e.g., β-glucans) [5,6], and have an abundance of starch (>60% of the grain dry weight) [7,8].
The abundant starch in these grains is suitable for renewable fuel production via alcoholic fermentation by the yeast Saccharomyces cerevisiae. With increasing barley and oats production in Canada, it is beneficial to investigate these cereal crops as feedstocks for producing ethanol, as lower grades and damaged crops can still be suitable for fermentation. In addition to ethanol, valuable organic solutes can also be coproduced during fermentation [9]. Recovery of these compounds could increase the profitability of ethanol production by fermentation [9,10,11]. These coproducts include isopropanol, acetic acid, succinic acid, α-glycerylphosphorylcholine (α-GPC), and glycerol [12,13]. Therefore, monitoring for these coproducts is essential in optimizing fermentation conditions and increasing ethanol product yields.
n-Propanol is naturally synthesized from amino acids and simple sugars during fermentation processes (e.g., Ehrlich pathway reactions) [14,15,16]. Isopropanol can also be produced through acetone reduction by lactic acid bacteria [17], a common contaminant of fermentation [18]. The presence of nuisance organisms can also result in increased production of acetic acid [19] and lactic acid [20]. Production of succinic acid is also gaining attention due the potential of converting this compound to a range of industrial chemicals (e.g., plastics and organic solvents) [21]. However, successful biological production of succinic acid requires the selection/development of succinic acid producing microorganism [22,23], selection of feedstock, specific productivity of the fermenters, and the development of efficient recovery processes [24]. Nonetheless, the production and purification of succinic acid from renewable feedstocks could potentially create supplemental value.
Glycerol is also coproduced during anaerobic fermentation via Saccharomyces cereivisae [20,21]; however, it is relatively inexpensive. Glycerol is produced by yeast to maintain the balance between the NAD+/NADH ratio during cell growth [25]. However, this compound is also produced under osmotic stress conditions, as a means to protect the cells against lysis [26,27,28]. Therefore, fermentation conditions can play an important role in decreasing glycerol production and improving ethanol yield [29]. Nonetheless, the glycerol in the fermentation mash can be upgraded through conversion to 1,3-propanediol (a more valuable compound) using lactobacilli [10,11].
Finally, α-GPC is a biosynthetic precursor of the neurotransmitter acetylcholine, as well as membrane phospholipids [30]. This compound can improve cognitive abilities [31] and isometric strength [32], and appears to have benefits for various other physical and mental performance tasks [33]. More importantly, α-GPC is marketed as a nootropic nutraceutical and pharmaceutical for the treatment of Alzheimer’s disease [34]. It is estimated that by 2050, more than 130 million people will be diagnosed with Alzheimers [35]. The potential to treat neurodegenerative diseases using α-GPC has increased the value of this compound substantially [36,37,38]. Therefore, there is great potential in developing alternative, inexpensive, and sustainable means for commercial production to supply this compound.
In this study, 28 cultivars of barley and 12 cultivars of oats were subjected to Saccharomyces cerevisiae fermentation to identify which cultivars produced optimum yields of ethanol and organic solutes (α-GPC, acetic acid, ethanol, succinic acid, glycerol, isopropanol, and lactic acid).

2. Materials and Methods

2.1. Fermentation Conditions

Barley and oat cultivars (Table 1) were obtained from the Crop Development Centre, University of Saskatchewan (Saskatoon, SK, Canada). Commercial enzymes, yeast (Saccharomyces cerevisiae), and urea were obtained from Terra Grain Fuels, Belle Plaine, SK, Canada. Whole barley and oat kernels were milled to a coarse flour using a Glen Mills Type C/11/1 tabletop grinder/disc mill, with the coarseness set to 18 (Clifton, NJ, USA). Milled whole barley and oat flour were gelatinized with boiled distilled water (36%, w/v) and incubated at 130 °C for 15 min using a VWR Constant Temperature Oven (Model 1350GM; Mississauga, ON, Canada). Saccharification was initiated by adding ⍺-amylase (0.2%, v/v) and the mash was incubated at 80 °C for 60 min. A 1:3 mixture of glucanase:xylanase was then added to the mash (0.01%, v/v) which was then heated for an additional 30 min at 55 °C. The mash was stirred every 15 min during heating after enzyme additions. Samples were then cooled to 37 °C and glucoamylase (0.1%, v/v), liquid yeast (0.5%, v/v; Saccharomyces cerevisiae), and liquid urea (0.05%, v/v) were added, and a gas trap was fitted to the fermenter. The total liquified fermentation volume was 1 L. Each fermentation broth was incubated at 37 °C until completion at 72 h. An aliquot of 500 μL was collected for analysis at 0, 24, 48, and 72 h.

2.2. NMR Spectroscopy

Immediately following yeast inoculation, an aliquot (2 mL) was taken from each fermentation mash using a VWR® disposable transfer pipets (Mississauga, ON, Canada), with additional samples taken every 24 h. Aliquots were dispensed into VWR microcentrifuge tubes (2 mL) and centrifuged at 10,000 rpm for 10 min, using a Labnet Spectrafuge 24D Digital Microcentrifuge (NJ, USA). The samples were then filtered using a 3 mL BD syringe (New Jersey, USA) equipped with a VWR 0.45 μm nylon membrane syringe filter (25 mm; Mississauga, ON, Canada). After filtration, an aliquot (500 μL) was dispensed into a nuclear magnetic resonance (NMR) tube containing deuterium oxide (50 μL; EMD Millipore, Oakville, ON, Canada) and pyrazine (40 μL of 20 mg/μL; Sigma Millipore, Oakville, ON, Canada) as an internal standard. Double-pulse field gradient spin echo 1H-NMR spectroscopy was conducted according to Ratanapariyanuch et al. [39] Spectra were recorded at 500 MHz (AMX 500, NMR Bruker, Mississauga, ON, Canada) with 16 scans per spectrum. Spectroscopy data collection and analyses were conducted with TopSpin™ 3.8 software (Bruker BioSpin GmbH, Billerica, MA, USA).

2.3. Statistical Analysis

Statistical analyses of organic solute content, determined via 1H-NMR, were performed using the Statistical Package for the Social Sciences (SPSS) version 25.0 (IBM Corp., Armonk, NY, USA). A Pearson coefficient correlation test was used to identify significance between average oat and barley fermentation. Significant differences were reported at the 95% confidence interval (p < 0.05).

3. Results

The concentrations of ethanol, isopropanol, acetic acid, succinic acid, α-GPC, and glycerol found during barley and oat fermentations are reported in Figure 1 and Figure 2. Fermentation was deemed complete after 72 h, as observed glucose in the barley and oat mash was largely consumed (≤14% remaining). The average concentrations of compounds found in barley and oat mashes over 72 h were calculated (Figure 3). Concentrations of glucose were also monitored throughout the barley and oat fermentations (Figure 1G and Figure 2G).

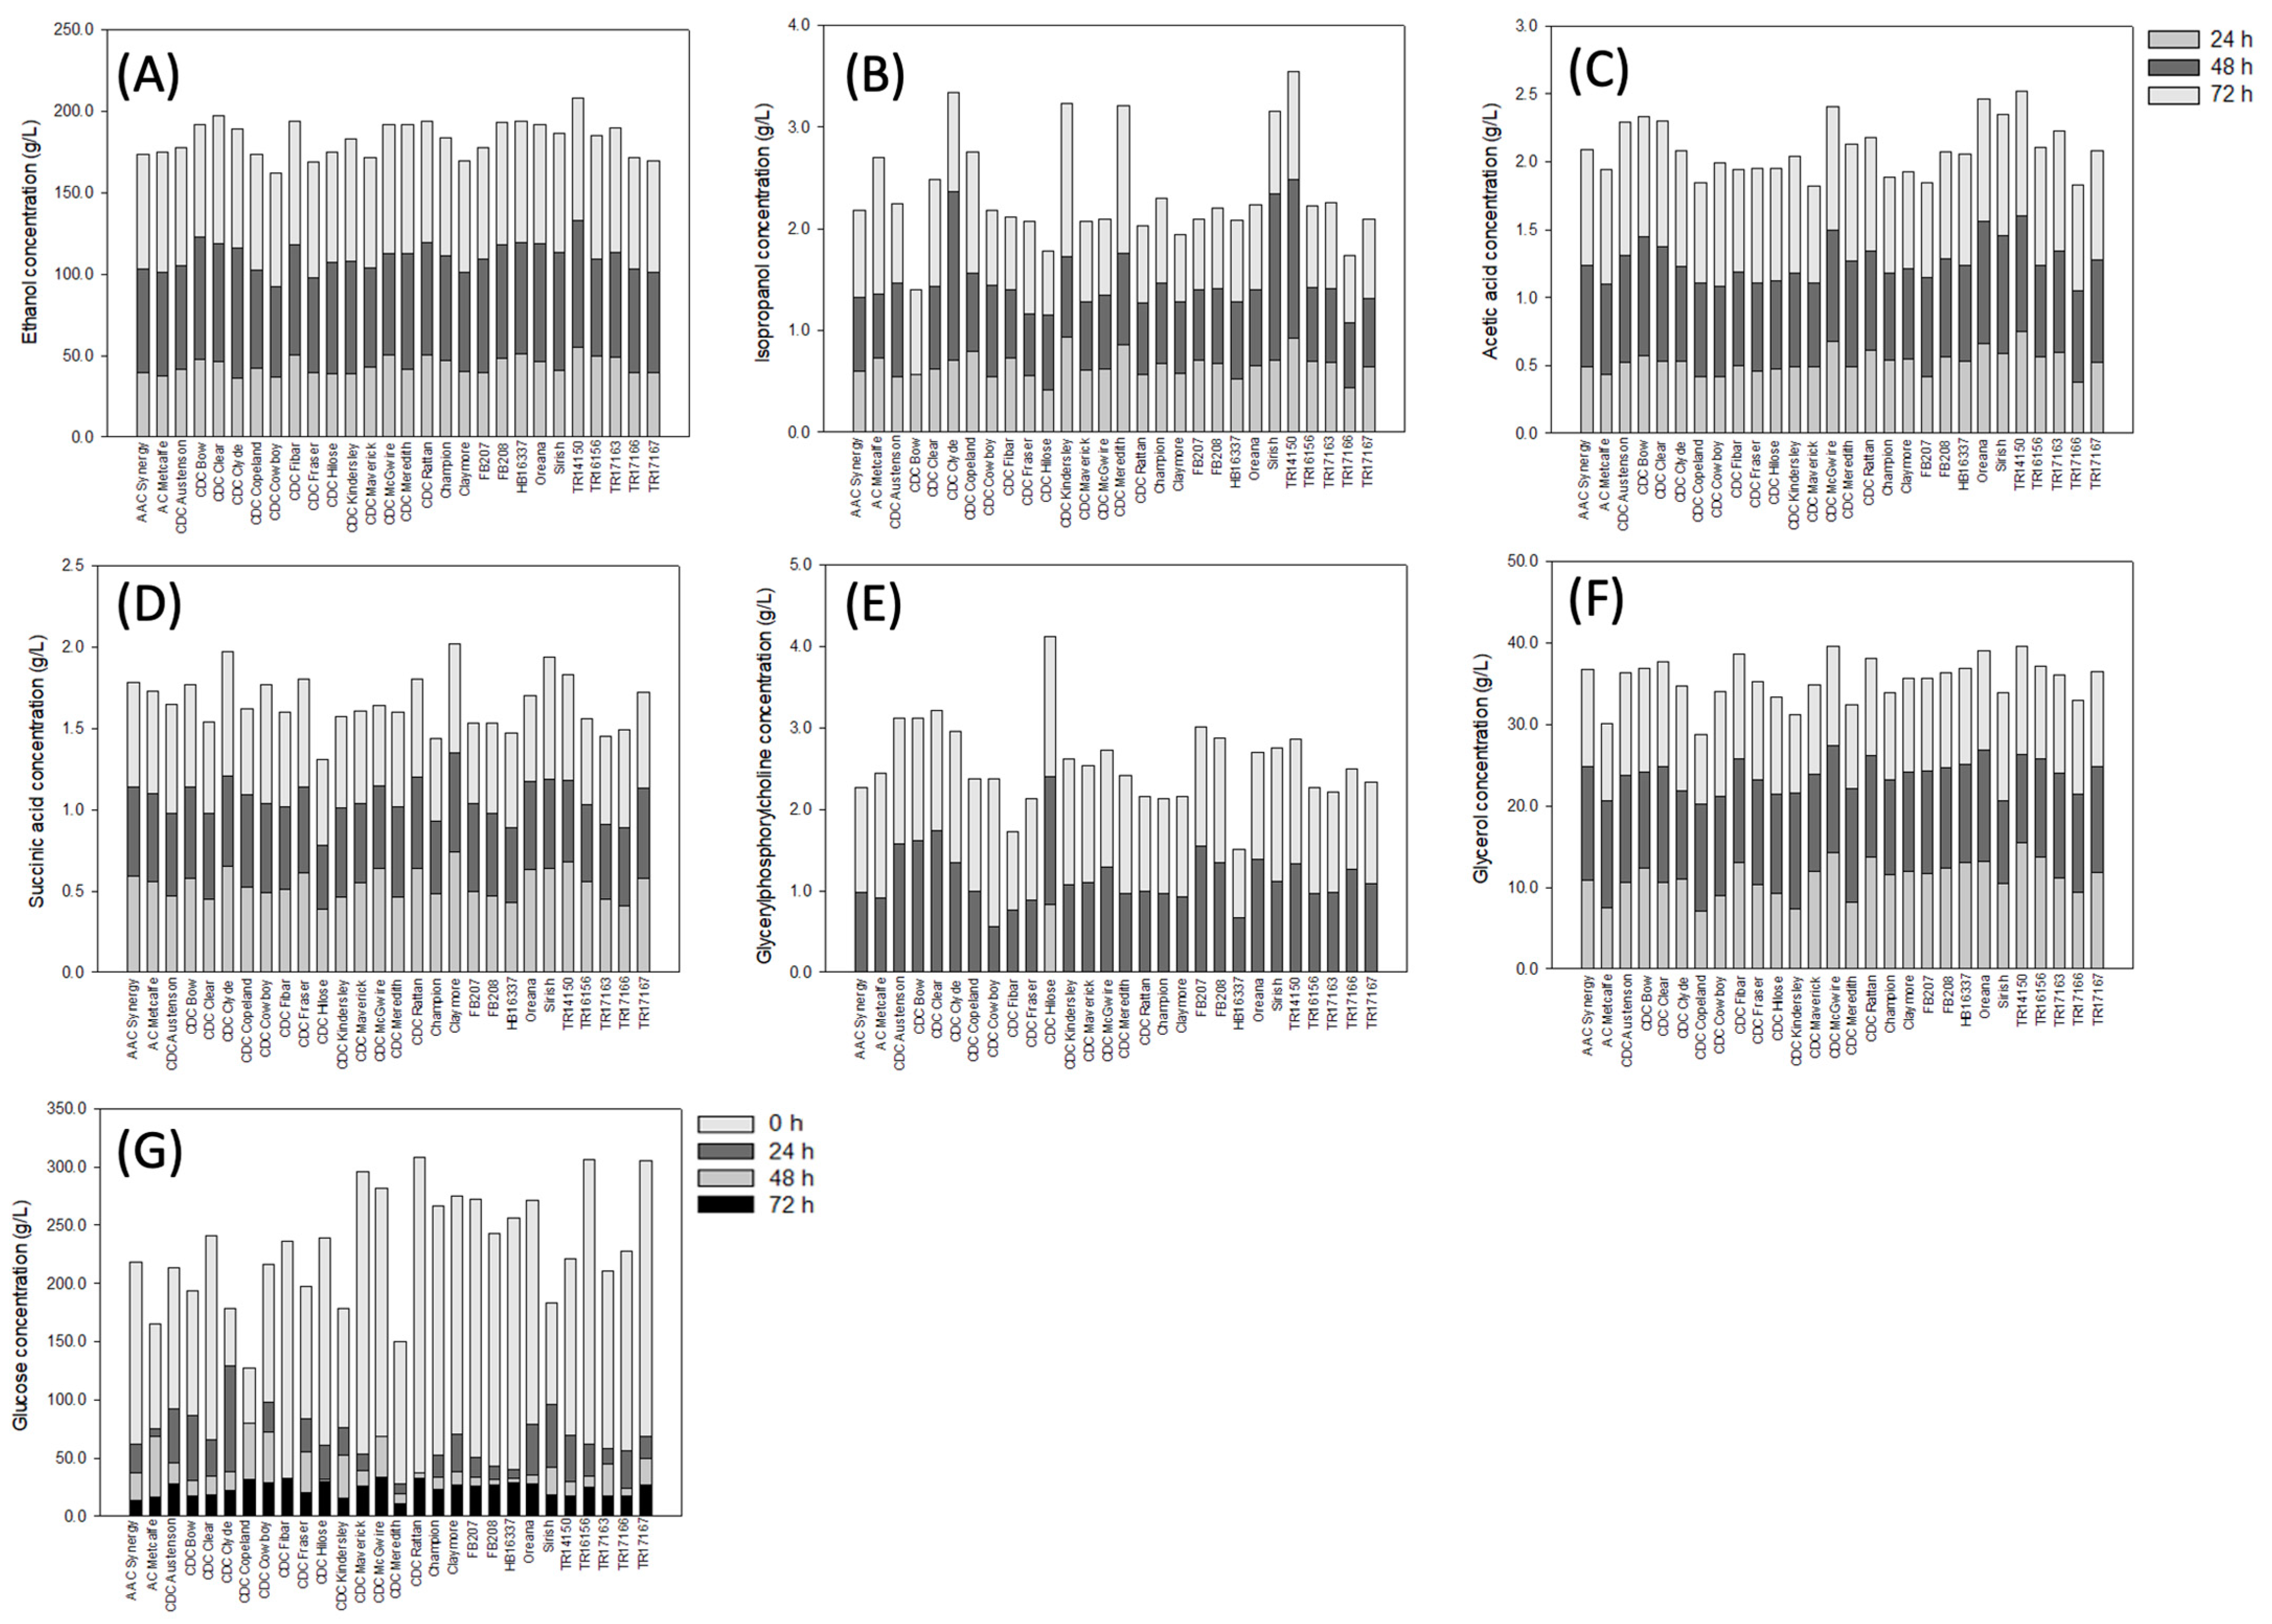
3.1. Concentration of Organic Solutes in Barley

Glucose content after saccharification (Figure 1G) varied between 191.7 (CDC Morrison) and 366.3 g/L (Claymore) with an average of 318.8 ± 55.2 g/L (Figure 3A, Figure 4A and Figure 5A). Average ethanol content after fermentation of the various barley cultivars was 72.7 ± 3.4 g/L (Figure 3A) after 72 h (Figure 4A), with CDC Hilose exhibiting the lowest yield at 68.0 g/L and CDC McGwire achieving the highest yield at 78.5 g/L (Figure 1A). The average production of isopropanol, acetic acid, and succinic acid was 0.89 ± 0.23, 0.83 ± 0.07, and 0.60 ± 0.07 g/L, respectively (Figure 3B–D). The highest concentrations for isopropanol, acetic acid, and succinic acid were found in CDC Kindersley, CDC Austenson, and CDC Clyde, respectively, with the lowest concentrations found in Claymore, FB207, and CDC McGwire, respectively (Figure 1B–D). Interestingly, α-GPC was observed in all barley cultivars, with an average α-GPC across cultivars at 72 h of 1.38 ± 0.22 g/L (Figure 3E). The difference in α-GPC concentration between barley cultivars was considerable, with the concentration at 72 h varying from 0.84 g/L for HB13667 to 1.81 g/L for CDC Cowboy (Figure 1E). In contrast, glycerol content was more similar among barley cultivars, with a range of 8.54 (CDC Copeland) to 13.23 g/L (TR14150), and an average across cultivars of 11.69 ± 1.15 g/L after 72 h of fermentation (Figure 3F). Furthermore, glycerol content plateaued after 24 h of fermentation (Figure 5A). The average yield of all measured fermentation products was similar between cultivars with hulls and those without (Figure 6). Barley mash had significantly higher average concentrations of ethanol (p < 0.01), isopropanol (p < 0.05), acetic acid (p < 0.01), α-GPC (p < 0.05), and glycerol (p < 0.01) when compared to oats.

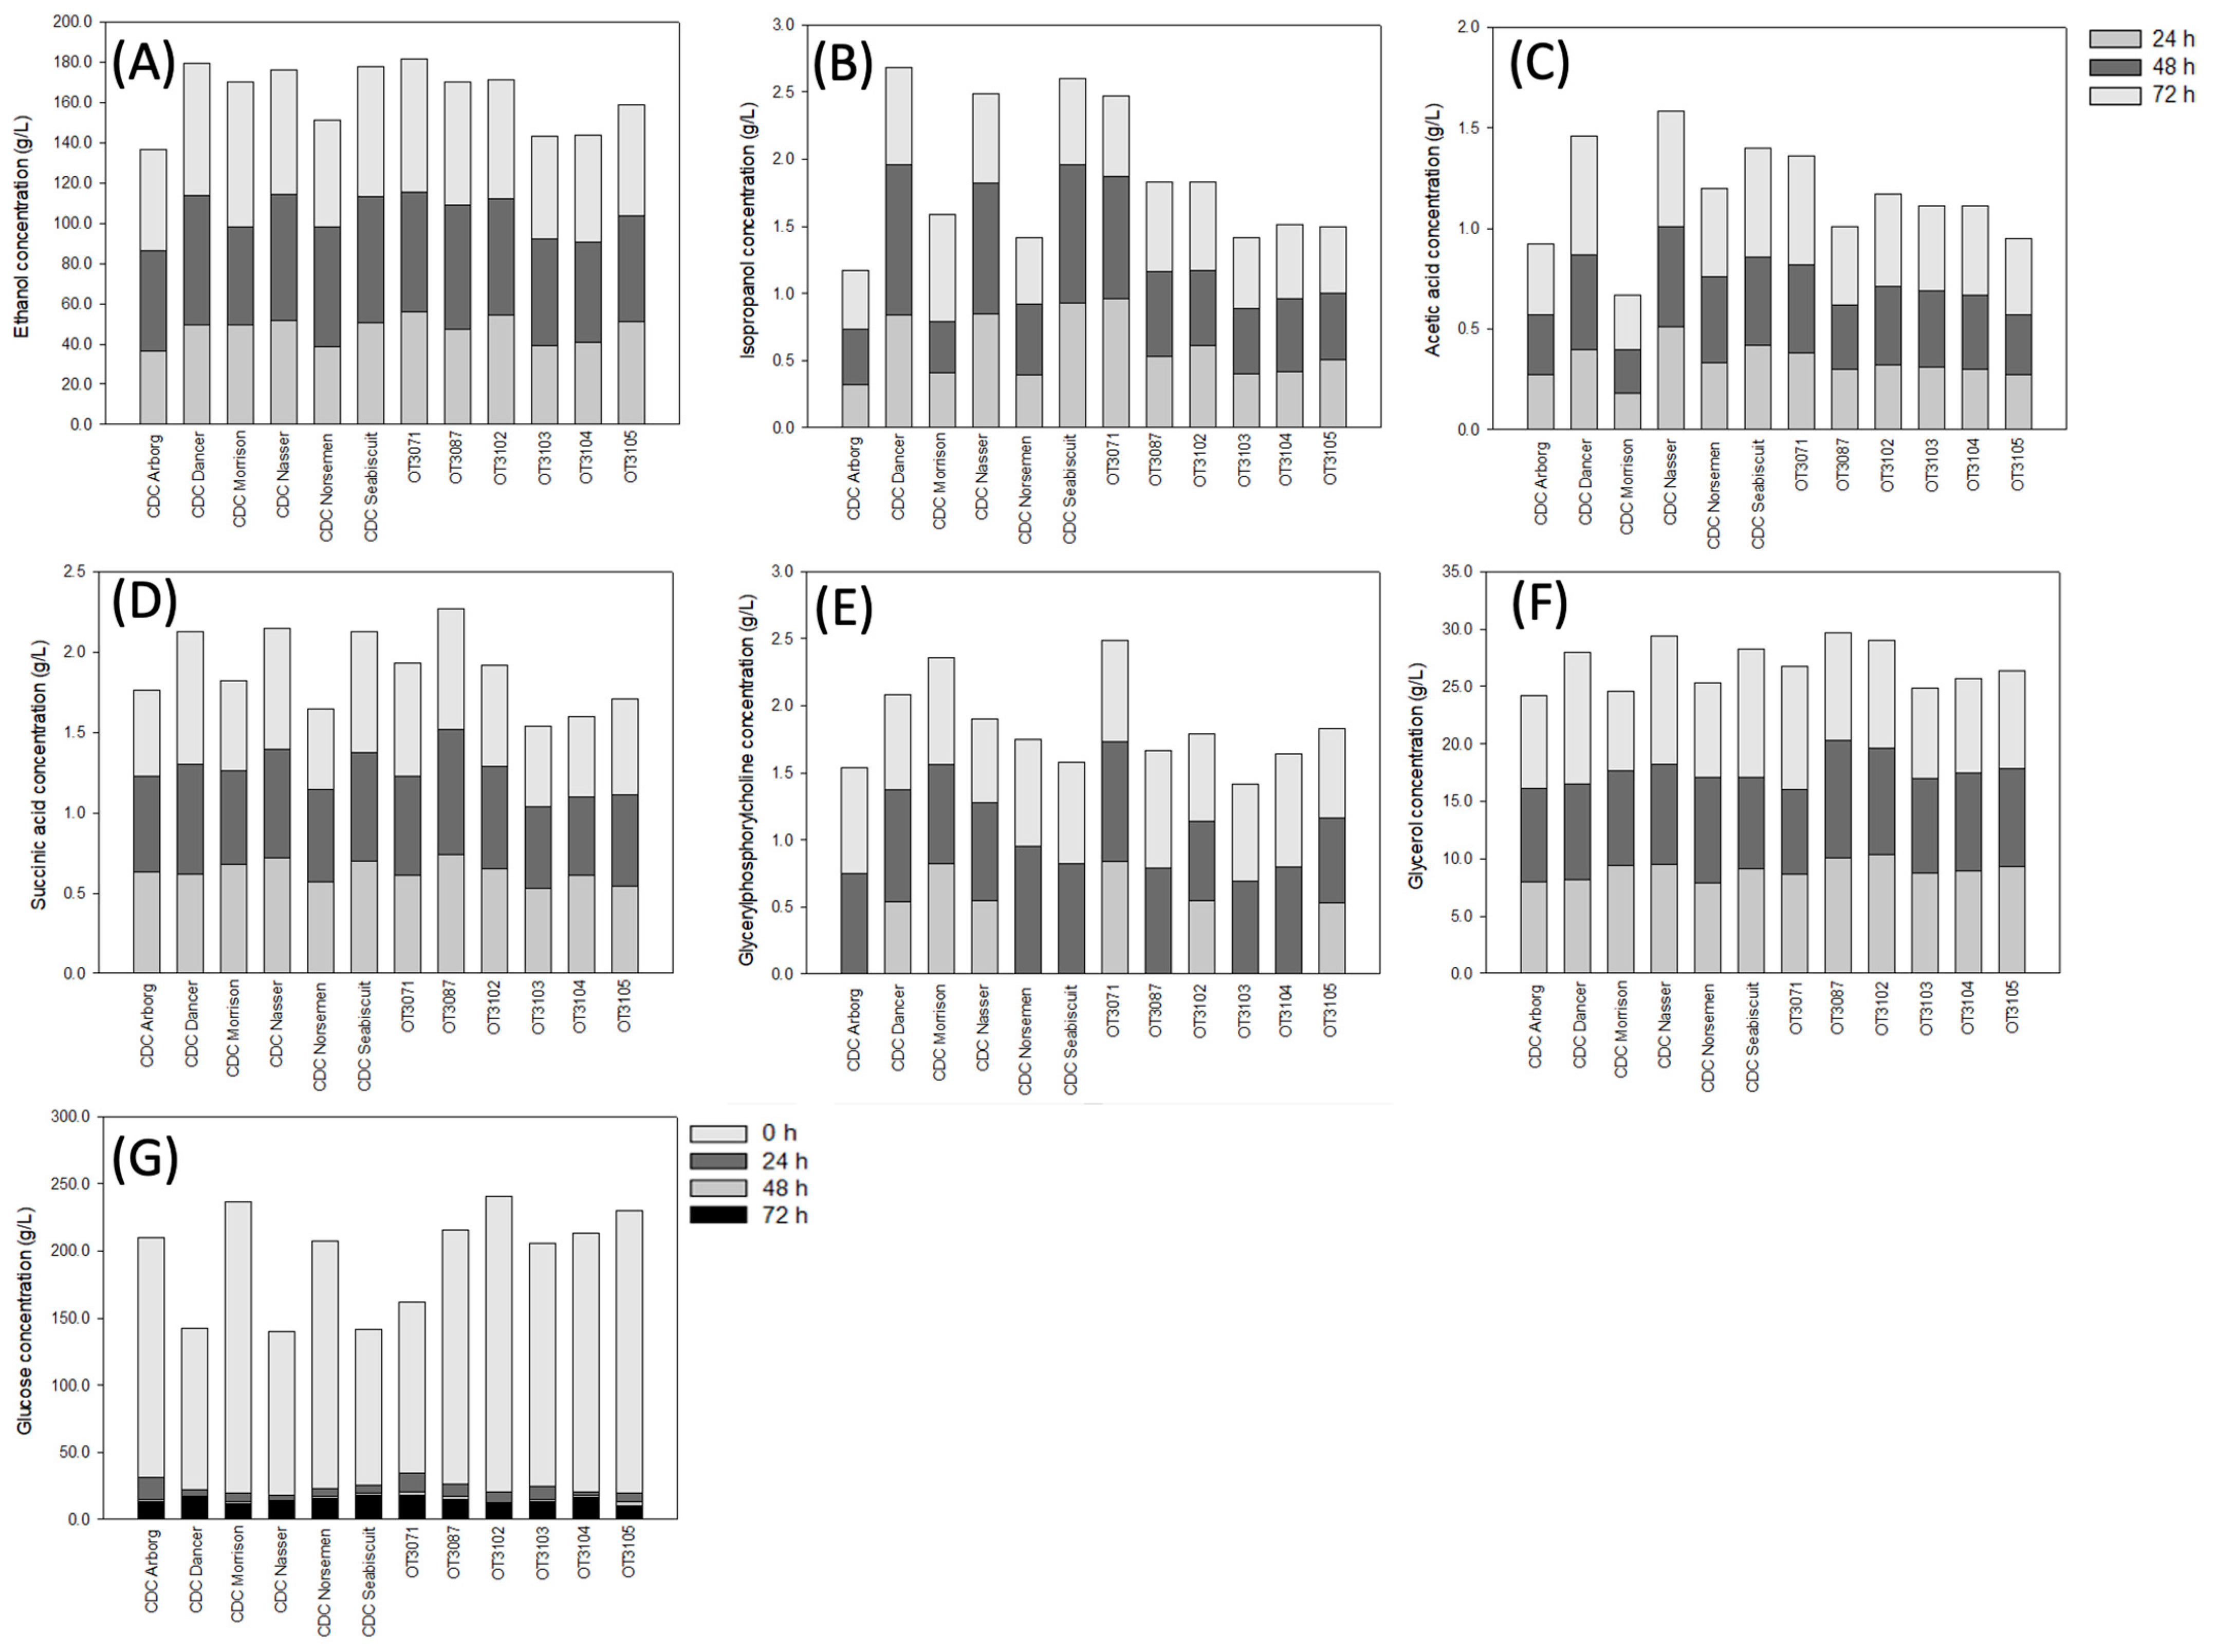
3.2. Concentration of Organic Solutes in Oat Cultivars

Compared to the average product accumulation observed in the fermented barley mash, oat mash accumulated less ethanol, isopropanol, acetic acid, α-GPC, and glycerol (Figure 3A–C,E,F). However, succinic acid production was similar between mash from the two crops (Figure 3D). Average ethanol content for mash from the 12 oat cultivars was 59.4 ± 6.9 g/L after 72 h of fermentation (Figure 4B), with a range of 50.6 (CDC Arborg) to 72.0 g/L (CDC Morrison) (Figure 2A). Meanwhile, oat glucose content (Figure 2G) after saccharification was substantially less than in barley, varying between 169.3 (CDC Nasser) and 265.3 g/L (OT3104) with an average of 230.3 ± 39.9 g/L (Figure 4B). Similar to the barley mash, the isopropanol, acetic acid, and succinic acid content were lower than ethanol, with averages of 0.61 ± 0.10, 0.45 ± 0.09 and 0.63 ± 0.12 g/L, respectively (Figure 3B–D). Yeast fermentation of milled oats also produced mash with α-GPC, although the concentrations were much lower than for barley mash (Figure 3E). The average accumulation of α-GPC was 0.75 ± 0.08 g/L, with CDC Nasser accumulating the lowest concentration at 0.62 g/L and OT3087 the highest at 0.88 g/L (Figure 2E). Finally, average glycerol in oat mash was 9.26 ± 1.54 g/L, varying between 6.89 (CDC Morrison) and 11.48 g/L (CDC Dancer) (Figure 2F). Similar to barley, the average glycerol content plateaued after 24 h of fermentation (Figure 5B). Interestingly, average succinic acid concentration in oat mash was significantly greater than that observed in barley (p < 0.01).

4. Discussion

Ethanol production is a billion-dollar industry [40], with important implications for the food, pharmaceutical, and fuel industries. In the United States, corn is the primary feedstock used in the production of fuel ethanol, due to its low price and abundance [41]. Both corn and wheat are routinely used in the production of ethanol in Canada [42]. These crops can produce variable yields of ethanol, with some wheat cultivars producing between 59.9 and 71.8 g/L of ethanol after 72 h of fermentation [9]. Fermentation of barley produced greater amounts of ethanol in this study (up to 78.5 g/L). The presence of milled hulls did not appear to impact ethanol yield. However, hull-less barley has been previously observed to ferment faster than wheat mashes, as well as producing higher yields of ethanol compared to wheat mashes [43].
The differences in ethanol and glycerol production among individual cultivars could be attributed to differences in starch content among grain type, variety and the environment in which the crop was grown [44,45,46]. This was observed in the differences in glucose content among cultivars, after saccharificiation. However, the use of 1H-NMR spectroscopy has limitations in accurately quantifying the concentration of sugars, as the C-H units of the carbohydrate backbone can lead to “accidental overlap” [47]. Furthermore, measurement of glucose in a complex solution with changing pH can be difficult [48] and as this molecule undergoes mutarotation [49] accurate measurement of glucose can be complicated using these methodologies. Nonetheless, on average, barley observed substantially higher amounts of glucose than in oats.
In contrast, oat cultivars did not perform nearly as well, owing to the lower glucose content observed in oats. The average ethanol content in oats was observed to be 59.4 ± 6.8 g/L. Only the cultivar CDC Morrison yielded >70 g/L of ethanol when fermented. Corn bioethanol production is even lower at 20–25 g/L when using solid state fermentation [50,51] and liquid state fermentation [52]. However, pre-treatment processes and immobilization techniques can increase ethanol production while reducing process costs [53]. The fermentation of corn meal via the immobilization of yeast can result in approximately 90 g/L of ethanol [54]; unfortunately, the industrial use of immobilized cells is still limited [55].
Isopropanol, acetic acid, and succinic acid were minor components produced during the fermentation process. Acetic acid is a normal by-product of alcoholic fermentation by Saccharomyces cerevisiae, and of contaminating lactic acid and acetic acid bacteria [56,57,58,59]. In fact, acetic acid typically does not surpass 0.4 g/L in bacteria-free fermentations [60]. In typical alcoholic fermentations, 0.2 to 0.6 g/L acetic acid does not appear to impair fermentation [59]. The average concentrations of acetic acid observed after fermentation of barley and oats were 0.83 ± 0.07 and 0.45 ± 0.09 g/L, respectively. The relatively low accumulation of acetic acid in oat mash suggests minimal contamination from acetic or lactic acid bacteria. However, the significantly higher acetic acid accumulation in barley mash (p < 0.01) might be attributed to endogenous acidogenic bacteria. Furthermore, the hydrolysis of lignocelluloses in these cereal crops may have also contributed to the formation of acetic acid [61,62]. Therefore, the concentration of acetic acid does not appear to suggest consequential negative effects on the progression of fermentation in oat mash [59]. Although barley mash showed a somewhat elevated acetic acid content, the fermentations did not stagnate or halt, which can result with high acetic acid levels [59].
Glycerol is also produced during alcoholic fermentation, and is the main solute produced by Saccharomyces cerevisiae in response to osmotic stress, in order to prevent dehydration [11]. Increased glycerol production by yeast can result in decreased ethanol [63] and carbon dioxide production [62] through the redirection of the yeast’s carbon metabolism [64]. Consequently, minimizing glycerol production can result in increased ethanol yields [65]. The sudden increase in glycerol in oats and barley at 24 h can most likely attributed to the efficiency for yeast to adapt to the osmotic stress [12] in the fermentation medium. After 24 h, it appears that glycerol production ceased (concentration plateaued) and ethanol production increased, suggesting that the consumption of glucose was primarily due to the production of ethanol.
Glycerol content in barley and oat mash (11.7 ± 1.2 and 9.3 ± 1.5 g/L, respectively) were comparable to wheat (~10 g/L) [9]. Mash produced from some barley cultivars (i.e., TR14150) accumulated up to 13 g/L glycerol. Through metabolic and stress management, decreased glycerol and increased ethanol production during fermentation can be attained [11]. Conversely, glycerol found in the thin stillage by-product could also be used in a second fermentation with lactobacilli [10,11]. These organisms can convert inexpensive glycerol into higher value products, such as 1,3-propanediol, which is used in the manufacturing of textiles. The presence of these organisms can also increase protein content in distillers’ grains [10,11], which can then be used as domestic feed. In regard to protein content, hull-less barley cultivars contain similar amounts to wheat and are typically higher than hulled barley cultivars [43].
Alpha-glycerylphosphorylcholine was another important substance found in the barley and oat mash. This compound is a naturally produced endogenous choline derivative; however, it is rarely found at high concentrations in nature. Therefore, there is great potential in developing alternative, inexpensive, and sustainable means for commercial production to supply this compound. Production of α-GPC can be catalyzed chemically or enzymatically through phosphatidylcholine (PC) hydrolysis [13,36,37,38]. It can also be produced through the condensation of glycerol derivatives [13,66,67], although published methods require the use of toxic substrates such as trimethylamine, strong acids and harmful solvents [68]. As a result, enzymatic hydrolysis of PC [69,70,71] is preferred as it avoids the use of harmful substrates and is relatively inexpensive.
This compound has previously been observed in wheat mash, with concentrations ranging between 1.03 and 1.34 g/L [9]. Similarly, most of the barley mash produced more than 1 g/L of α-GPC, including CDC Cowboy, which produced the highest amount of α-GPC observed in this study. The compound α-GPC has considerable value [36,37], and can be used as a supplement to treat cognitive disorders (e.g., Alzheimer’s disease) and improve muscle strength [29,30].
Increases in phosphatidylcholine have been observed in plant cells deprived of phosphate [72]. Deprivation of phosphate results in a decrease in the phospholipid content of plants leading to mobilization in the phosphate reserve, and an increase in the production of non-phosphorous membrane lipids (e.g., digalactosyldiacylglycerol) [72]. In this study, CDC Cowboy mash accumulated similar concentrations of ethanol to wheat [9], while also accumulating considerably more α-GPC. Therefore, future studies should investigate pre-treatment methods to increase PC content, followed by developing methods to decrease metabolic and osmotic stress during yeast fermentation. This could provide optimum conditions to increase α-GPC and ethanol yields, while minimizing glycerol accumulation.

5. Conclusions

Overall, barley mash accumulated greater concentrations of ethanol, isopropanol, acetic acid, α-GPC, and glycerol than oat mash. Alpha-GPC for mash prepared from the barley cultivars such as CDC Cowboy exceeded the amounts previously found from wheat mash. The isolation and purification of this compound can create new opportunities for commercial growth in the food and health industries. The use of barley as a feedstock for bioethanol production may therefore be appealing, due to its affordability, abundance, and comparable ethanol yields to wheat. The optimization of ethanol and α-GPC production via the minimization of glycerol production and phosphate deprivation, respectively, should be investigated to fully maximize the economic return of barley fermentation. Like wheat thin stillage, barley thin-stillage could also undergo a two-stage fermentation process with lactobacilli organisms to convert the relatively high yield of inexpensive glycerol into a more valuable product [10,11]. Overall, barley appears to be a suitable replacement for wheat in fermentation for ethanol, producing mash with similar or higher ethanol yields and increased α-GPC concentrations after 72 h of anaerobic fermentation.

Author Contributions

Conceptualization, T.J.T., D.J.W., and M.J.T.R.; methodology, T.J.T., D.J.W. and A.D.B.; data analysis, T.J.T. and J.S.; writing—original draft, T.J.T.; writing—review and editing, D.J.W., J.S., A.D.B. and M.J.T.R.; supervision, M.J.T.R.; funding acquisition, M.J.T.R. All authors have read and agreed to the published version of this manuscript.

Funding

This work was supported by the Saskatchewan Agricultural Development Fund (grant numbers 20190155, 20190154, 20180281, 20180248, 20180255, 20170133); National Sciences and Engineering Research Council of Canada Discovery Grant (grant number RGPIN-2018-06631); and Mitacs (grant numbers IT19122, IT16156).

Institutional Review Board Statement

Not applicable.

Informed Consent Statement

Not applicable.

Data Availability Statement

The data presented in this study are available on request from the corresponding authors. The data are not publicly available due to storage at a private facility.

Acknowledgments

The authors wish to thank: the Bioprocessing Pilot Plant, University of Saskatchewan for use of their facilities to conduct this study and to Fina Nelson for her technical help.

Conflicts of Interest

Martin J. T. Reaney is the founder of, and has an equity interest in, Prairie Tide Diversified Inc. (PTD, Saskatoon, SK, Canada: previous company name is Prairie Tide Chemicals Inc.).

References

  1. Statistics Canada. Production of Principal Field Crops, November 2019. The Daily, 6 December 2019. Available online: https://www150.statcan.gc.ca/n1/daily-quotidien/191206/dq191206b-eng.htm (accessed on 8 April 2021).
  2. Canadian Agri-Food Trade Alliance (CAFTA). Barley. 2017. Available online: http://cafta.org/agri-food-exports/cafta-exports/ (accessed on 5 November 2020).
  3. Statistics Canada. Principal Field Crop Areas. June 2019. Available online: https://www150.statcan.gc.ca/n1/daily-quotidien/190626/dq190626b-eng.htm (accessed on 24 November 2020).
  4. Boczkowska, M.; Podyma, W.; Łapiński, B. Oat. In Genetic and Genomic Resources for Grain Cereals Improvement; Academic Press: Cambridge, MA, USA, 2016; pp. 159–225. [Google Scholar]
  5. Punia, S.; Sandhu, K.S.; Dhull, S.B.; Siroha, A.K.; Purewal, S.S.; Kaur, M.; Kidwai, M.K. Oat starch: Physico-chemical, morphological, rheological characteristics and its applications—A review. Int. J. Biol. Macromol. 2020, 154, 493–498. [Google Scholar] [CrossRef]
  6. Chibbar, R.N.; Ganeshan, S.; Båga, M.; Khandelwal, R.L. Carbohydrate Metabolism. In Encylopedia of Grain Science; Wrigley, C., Ed.; Elsevier: Oxford, UK, 2004; pp. 168–179. [Google Scholar]
  7. Sayar, S.; White, P.J. Oat starch: Physicochemical properties and function. In Otas: Chemistry and Technology, 2nd ed.; American Association of Cereal Chemists, Inc. (AACC): Saint Paul, MN, USA, 2011; pp. 109–122. [Google Scholar]
  8. Bhatty, R.S.; Rossnagel, B.G. Comparison of pearled and unpearled Canadian and Japanese barleys. Cereal Chem. 1998, 75, 15–21. [Google Scholar] [CrossRef]
  9. Oyeneye, A.; Shen, J.; Shim, Y.Y.; Tse, T.J.; Reaney, M.J.T. Production of α-glycerylphosphorylcholine and other compounds from wheat fermentation. ACS Omega 2020, 5, 12486–12494. [Google Scholar] [CrossRef]
  10. Ratanapariyanuch, K.; Shin, Y.Y.; Emami, S.; Reaney, M.J.T. Production of protein concentrate and 1,3-propanediol by wheat-based thin stillage fermentation. J. Agric. Food Chem. 2017, 65, 3858–3867. [Google Scholar] [CrossRef] [PubMed]
  11. Tse, T.J.; Shen, J.; Shim, Y.Y.; Reaney, M.J.T. Changes in bacterial populations and their metabolism over 90 sequential cultures on wheat-based thin stillage. J. Agric. Food Chem. 2020, 68, 4717–4729. [Google Scholar] [CrossRef]
  12. Aslankoohi, E.; Rezaei, M.N.; Vervoort, Y.; Courtin, C.M.; Verstrepen, K.J. Glycerol production by fermenting yeast cells is essential for optimal bread dough fermentation. PLoS ONE 2015, 10, e0119364. [Google Scholar] [CrossRef] [PubMed]
  13. Li, Z.; Vance, D.E. Phosphatidylcholine and choline homeostasis. J. Lipid Res. 2008, 49, 1187–1194. [Google Scholar] [CrossRef] [PubMed] [Green Version]
  14. Shabtai, Y.; Bendelac, L.; Jubran, H.; Hirschberg, J.; Fainsod, A. Acetaldehyde inhibits retinoic acid biosynthesis to mediate alcohol teratogenicity. Sci. Rep. 2018, 8, 347. [Google Scholar] [CrossRef] [PubMed]
  15. Sentheshanmuganathan, S. The mechanism of the formation of higher alcohols from amino acids by Saccharomyces cerevisiae. Biochem. J. 1960, 74, 568–576. [Google Scholar] [CrossRef] [PubMed] [Green Version]
  16. Janssen, P.H. Propanol as an end product of threonine fermentation. Arch. Microbiol. 2004, 182, 482–486. [Google Scholar] [CrossRef] [PubMed]
  17. Pielech-Przybylska, K.; Balcerek, M.; Dziekońska-Kubczak, U.; Pacholczyk-Sienicka, B.; Ciepielowski, G.; Albrecht, Ł.; Patelski, P. The role of Saccharomyces cerevisiae yeast and lactic acid bacteria in the formation of 2-propanol from acetone during fermentation of rye mashes obtained using thermal-pressure method of starch liberation. Molecules 2019, 24, 610. [Google Scholar] [CrossRef] [PubMed] [Green Version]
  18. Narendranath, N.V.; Hynes, S.H.; Thomas, K.C.; Ingledew, W.M. Effects of lactobacilli on yeast-catalyzed ethanol fermentations. Appl. Environ. Microbiol. 1997, 63, 4158–4163. [Google Scholar] [CrossRef] [PubMed] [Green Version]
  19. Pielech-Przybylska, K.; Balcerek, M.; Ciepielowski, G.; Pacholczyk-Sienicka, B.; Albrecht, Ł.; Dziekońska-Kubczak, U.; Bonikowski, R.; Patelski, P. Effect of Co-Inoculation with Saccharomyces cerevisiae and Lactic Acid Bacteria on the Content of Propan-2-ol, Acetaldehyde and Weak Acids in Fermented Distillery Mashes. Int. J. Mol. Sci. 2019, 20, 1659. [Google Scholar] [CrossRef] [Green Version]
  20. Walker, G.M.; Stewart, G.G. Saccharomyces cerevisiae in the production of fermented beverages. Beverages 2016, 2, 30. [Google Scholar] [CrossRef]
  21. Nghiem, N.P.; Kleff, S.; Schwegmann, S. Succinic acid: Technology development and commercialization. Fermentation 2017, 3, 26. [Google Scholar] [CrossRef]
  22. Ahn, J.H.; Jang, Y.-S.; Lee, S.Y. Production of succinic acid by metabolically engineering microorganisms. Curr. Opin. Biotechnol. 2016, 42, 54–66. [Google Scholar] [CrossRef] [PubMed]
  23. Raab, A.M.; Lang, C. Oxidative versus reductive succinic acid production in the yeast Saccharomyces cerevisiae. Bioeng. Bugs 2011, 2, 120–123. [Google Scholar] [CrossRef]
  24. Ferone, M.; Raganati, F.; Ercole, A.; Olivieri, G.; Salatino, P.; Marzochella, A. Continuoous succinic acid fermentation by Actinobacillus succinogenes in a packed-bed biofilm reactor. Biotechnol. Biofuels 2018, 11, 138. [Google Scholar] [CrossRef] [Green Version]
  25. Nissen, T.L.; Hamann, C.W.; Kielland-Brandt, M.C.; Nielsen, J.; Villadsen, J. Anaerobic and aerobic batch cultivations of Saccharomyces cerevisiae mutants impaired in glycerol synthesis. Yeast 2000, 16, 463–474. [Google Scholar] [CrossRef]
  26. André, L.; Hemming, A.; Adler, L. OOsmoregulation in Saccharomyces cerevisiae. Studies on the osmotic induction of glycerol production and glycerol-3-phosphate dehydrogenase (NAD+). FEBS Lett. 1991, 286, 13–17. [Google Scholar] [CrossRef] [Green Version]
  27. Larsson, K.; Ansell, R.; Eriksson, P.; Adler, L. A gene encoding sn-glycerol 3-phosphate dehydrogenase (NAD+) complements an osmosensitive mutant of Saccharomyces cerevisiae. Mol. Microbiol. 1993, 10, 1101–1111. [Google Scholar] [CrossRef]
  28. Ansell, R.; Granath, K.; Hohmann, S.; Thevelein, J.M.; Adler, L. The two isoenzymes for yeast NAD+-depedent glycerol 3-phosphate dehydrogenase encoded by GPD1 and GPD2 hav distinct roles in osmoadaptation and redox regulation. EMBO J. 1997, 16, 2179–2187. [Google Scholar] [CrossRef] [Green Version]
  29. Pagliardini, J.; Hubmann, G.; Alfenore, S.; Nevoigt, E.; Bideaux, C.; Guillouet, S.E. The metabolic costs of improving ethanol yield by reducing glycerol formation capacity under anaerobic conditions in Saccharomyces cerevisiae. Microb. Cell Fact. 2013, 12, 29. [Google Scholar] [CrossRef] [PubMed] [Green Version]
  30. AC Immune. Alzheimer’s Disease. Available online: http://www.acimmune.com/en/alzheimer-s-disease/ (accessed on 12 February 2020).
  31. Lopez, C.M.; Govoni, S.; Battaini, F.; Bergamaschi, S.; Longoni, A.; Giaroni, C.; Trabucchi, M. Effect of a new cognition enhancer, alpha-glycerylphosphorylcholine, on scopolamine-induced amnesia and brain acetylcholine. Pharmacol. Biochem. Behav. 1991, 39, 835–840. [Google Scholar] [CrossRef]
  32. Bellar, D.; LeBlanc, N.R.; Campbell, B. The effect of 6 days of alpha glycerylphosphorylcholine on isometric strength. J. Int. Soc. Sports Nutr. 2015, 12, 42. [Google Scholar] [CrossRef] [PubMed] [Green Version]
  33. Parker, A.G.; Byars, A.; Purpura, M.; Jäger, R. Effect of alpha-glycerylphosphorylcholine, caffeine or placebo on markers of mood, cognitive function, power, speed, and agility. J. Int. Soc. Sports Nutr. 2015, 21, 41. [Google Scholar] [CrossRef] [Green Version]
  34. DeFina, P.A.; Moser, R.S.; Glenn, M.; Lichtenstein, J.D.; Fellus, J. Alzheimer’s Disease Clinical and Research Update for Health Care Practitioners. J. Aging Res. 2013, 2013, 207178. [Google Scholar] [CrossRef]
  35. Miljić, U.; Puškaš, V.; Vučurović, V.; Muzalevski, A. Fermentation characteristics and aromatic profile of plum wines produced with indigeous microbiota and pure cultures of selected yeasts. J. Food Sci. 2017, 82, 1443–1450. [Google Scholar] [CrossRef]
  36. Sonkar, K.; Ayyappan, V.; Tressler, C.M.; Adelaja, O.; Cai, R.; Cheng, M.; Glunde, K. Focus on the glycerophosphocholine pathway in choline phospholipid metabolism of cancer. NMR Biomed. 2019, 32, e4112. [Google Scholar] [CrossRef]
  37. Fernández-Murray, J.P.; McMaster, C.R. Glycerophosphocholine catabolism as a new route for choline formation for phosphatidylcholine syntehsis by the Kennedy Pathway. J. Biol. Chem. 2005, 280, 38290–38296. [Google Scholar] [CrossRef] [Green Version]
  38. Wood, L. Global Brain Health Supplements Market, 2017 to 2025—ResearchAndMarkets.com. Available online: https://www.businesswire.com/news/home/20180404005510/en/Global-Brain-Health-Supplements-Market-2017-2025 (accessed on 8 January 2019).
  39. Ratanapariyanuch, K.; Shen, J.; Jia, Y.; Tyler, R.T.; Shin, Y.Y.; Reaney, M.J.T. Rapid NMR method for the quantification of organic compounds in thin stillage. J. Agric. Food Chem. 2011, 59, 10454–10460. [Google Scholar] [CrossRef] [PubMed]
  40. Renewable Fuels Association. 2019 Ethanol Industry Outlook. 2019. Available online: https://ethanolrfa.org/wp-content/uploads/2019/02/RFA2019Outlook.pdf (accessed on 3 December 2020).
  41. U.S. Energy Information Adminstration (EIA). Biofuels Explained—Ethanol. 2020. Available online: https://www.eia.gov/energyexplained/biofuels/ethanol.php (accessed on 3 December 2020).
  42. Government of Canada. Ethanol. 2020. Available online: https://www.nrcan.gc.ca/energy-efficiency/energy-efficiency-transportation/alternative-fuels/biofuels/ethanol/3493 (accessed on 3 December 2020).
  43. Ingledew, W.M.; Jones, A.M.; Bhatty, R.S.; Rossnagel, B.G. Fuel alcohol production from hull-less barley. Cereal Chem. 1995, 72, 147–150. [Google Scholar]
  44. Holtekjølen, A.K.; Uhlen, A.K.; Bråthen, E.; Sahlstrøm, S.; Knutsen, S.H. Contents of starch and non-starch polysaccharides in barley varieties of different origin. Food Chem. 2006, 94, 348–358. [Google Scholar] [CrossRef]
  45. Gous, P.W.; Warren, F.; Mo, O.W.; Gilbert, R.G.; Fox, G.P. The effects of variable nitrogen application on barley starch structure under drought stress. J. Inst. Brew. 2015, 121, 502–509. [Google Scholar] [CrossRef] [Green Version]
  46. Tester, R.F. Influence of growth conditions on barley starch properties. Int. J. Biol. Macromol. 1997, 21, 37–45. [Google Scholar] [CrossRef]
  47. Brown, G.D.; Bauer, J.; Osborn, H.M.I.; Kuemmerle, R. A solution NMR approach to determine the chemical structures of carbohydrates using the hydroxyl groups as starting points. ACS Omega 2018, 3, 17957–17975. [Google Scholar] [CrossRef]
  48. Stolz, M.; Schlawne, C.; Hoffmann, J.; Hartman, V.; Marini, I.; Fritsche, A.; Peter, A.; Bakchoul, T.; Schick, F. Feasibility of precise and reliable glucose quantification in human whole blood samples by 1 tesla benchtop NMR. NMR Biomed. 2020, 33, e4358. [Google Scholar] [CrossRef]
  49. Rudd, T.; Skidmore, M.A.; Yates, E.A. Chapter 12—Surface-Based Studies of Heparin/Heparan Sulfate-Protein Interactions: Considerations for Surface Immobilisation of HS/Heparin Saccharides and Monitoring Their Interactions with Binding Proteins. In Chemistry and Biology of Heparin and Heparana Sulfate; Garg, H.G., Linhardt, R.J., Hales, C.A., Eds.; Elsevier Science: Amsterdam, The Netherlands, 2005; pp. 345–366. [Google Scholar]
  50. Öhgren, K.; Bura, R.; Lesnicki, G.; Saddler, J.; Zacchi, G. A comparison between simultaneous saccharification and fermentation seperate hydrolysis and fermentation using steam-pretreated corn stover. Process Biochem. 2007, 42, 834–839. [Google Scholar] [CrossRef]
  51. Öhgren, K.; Rudolf, A.; Galbe, M.; Zacchi, G. Fuel ethanol production from steam-pretreated corn stover using SSF at higher dry matter content. Biomass Bioenergy 2006, 30, 863–869. [Google Scholar] [CrossRef]
  52. Latif, F.; Rajoka, M.I. Production of ethanol and xylitol from corn cobs by yeasts. Bioresour. Technol. 2001, 77, 57–63. [Google Scholar] [CrossRef]
  53. Djordjevic, V.; Willaert, R.; Gibson, B.; Nedovic, V. Immobilized yeast cells and secondary metabolites. In Fungal Metabolites; Merillion, J.M., Ramawat, K.G., Eds.; Springer: Cham, Switzerland, 2016; pp. 1–40. [Google Scholar]
  54. Nikolic, S.; Mojovic, L.; Pejin, D.; Rakin, M.; Vukasinov, M. Production of bioethanol from corn meal hydrolyzates by free and immobilized cells of Saccharomyces cerevisiae var. ellipsoideus. Biomass Bioenergy 2010, 34, 1449–1456. [Google Scholar] [CrossRef]
  55. Berbegal, C.; Spano, G.; Tristezza, M.; Griego, F.; Capozzi, V. Microbial resources and innovation in the wine production sector. S. Afr. J. Enol. Vitic. 2017, 38, 156–166. [Google Scholar] [CrossRef]
  56. Du Toit, W.J.; Lambrechts, M.G. The enumeration and identification of acetic acid bacteria from south african red wine fermentatioons. Int. J. Food Microbiol. 2002, 74, 57–64. [Google Scholar] [CrossRef]
  57. Pinto, I.; Cardoso, H.; Leão, C. High enthalpy and low enthalpy death in Saccharomyces cerevisiae induced by acetic acid. Biotechnol. Bioeng. 1989, 33, 1350–1352. [Google Scholar] [CrossRef] [PubMed] [Green Version]
  58. Vilela-Mourra, A.; Schullar, D.; Mendes-Faia, A.; Silva, R.D.; Chaves, S.R.; Sousa, M.J.; Côrte-Real, M. The impact of acetate metabolism on yeast fermentative performance and wine quality: Reduction of volatile acidity of grape musts and wines. Appl. Microbiol. Biotechnol. 2011, 89, 271–280. [Google Scholar] [CrossRef] [Green Version]
  59. Sousa, M.J.; Ludovico, P.; Rodrigues, F.; Leão, C.; Côrte-Real, M. Stress and cell death in yeast induced by acetic acid. In Cell Metabolism—Cell Homeostasis and Stress Response; InTech: Rijeka, Croatia, 2012. [Google Scholar]
  60. Thoukis, G.; Ueda, M.; Wright, D. The formation of succinic acid during alcoholic fermentation. Am. J. Enol. Vitic. 1965, 16, 1–8. [Google Scholar]
  61. Lee, Y.Y.; Iver, P.; Torget, R.W. Dilute-acid hydrolysis of lignocellulosic biomass. Adv. Biochem. Eng. Biotechnol. 1999, 65, 93–115. [Google Scholar]
  62. Maiorella, B.; Blanch, H.W.; Wilke, C.R. By-product inhibition effects on ethanolic fermentation by Saccharomyces cereivisiae. Biotechnol. Bioeng. 1983, 25, 103–121. [Google Scholar] [CrossRef]
  63. Wu, K.J.; Lin, Y.H.; Lo, Y.C.; Chen, C.Y.; Chen, W.M.; Chang, J.S. Converting glycerol into hydrogen, ethanol, and diols with a Klebsiella sp. HE1 strain via anaerobic fermentation. J. Taiwan Inst. Chem. Eng. 2011, 42, 20–25. [Google Scholar] [CrossRef]
  64. Goold, H.D.; Kroukamp, H.; Williams, T.C.; Paulsen, I.T.; Varela, C.; Pretorius, I.S. Yeast’s balancing act between ethanol and glycerol production in low-alcohol wines. Microb. Biotechnol. 2017, 10, 264–278. [Google Scholar] [CrossRef]
  65. Bideaux, C.; Alfenore, S.; Cameleyre, X.; Molina-Jouve, C.; Uribelarrea, J.; Guillouet, S.E. Minimization of glycerol production during the high-performance fed-batch ethanolic fermentation process in Saccharomyces cerevisiae using a metabolic model as a prediction tool. Appl. Environ. Microbiol. 2006, 72, 2134–2140. [Google Scholar] [CrossRef] [Green Version]
  66. Baer, E.; Kates, M. L-α-Glycerylphosphorylcholine. J. Am. Chem. Soc. 1948, 70, 1394–1399. [Google Scholar] [CrossRef] [PubMed]
  67. Brockerhoff, H.; Yurkowski, M. Simplified preparation of L-α-Glycerylphosphoryl choline. Can. J. Biochem. 1965, 43, 1777. [Google Scholar] [CrossRef]
  68. Kim, H.J.; Song, Y.S.; Song, E.S.; Kang, D.S.; Song, I.W.; Kang, P.G.; Oh, S.S.; Moon, S.C.; Lee, B.G. A Process for Preparation of I-Alpha-Glycerophosphoeyl Choline. W.O. Patent 2007145476 A1 21 December 2007. [Google Scholar]
  69. Zhang, K.; Wang, X.; Huang, J.; Liu, Y. Purification of L-alpha-glycerylphosphorylcholine by column chromatography. J. Chromatogr. A 2012, 1220, 108–114. [Google Scholar] [CrossRef] [PubMed]
  70. Blasi, F.; Cossignani, L.; Simonetti, M.S.; Brutti, M.; Ventura, F.; Damiani, P. Enzymatic deacylation of of 1,2-diacyl-sn-glycero-3-phosphocholines to sn-glycerol-3-phosphocholine. Enzym. Microb. Technol. 2006, 39, 1405–1408. [Google Scholar] [CrossRef]
  71. Zhang, K.; Liu, Y.; Wang, X. Enzymatic preparation of L-α-Glycerylphosphorylcholine in an aqueous medium. Eur. J. Lipid Sci. Technol. 2012, 114, 1254–1260. [Google Scholar] [CrossRef]
  72. Jouhet, J.; Maréchal, E.; Bligny, R.; Joyard, J.; Block, M.A. Transient increase of phosphatidylcholine in plant cells in response to phosphate deprivation. FEBS Lett. 2003, 544, 63–68. [Google Scholar] [CrossRef]
Figure 1. Concentration of ethanol (A), isopropanol (B), acetic acid (C), succinic acid (D), ⍺-glycerylphosphorylcholine (E), glycerol (F) and glucose (G) in mash sampled every 24 h during yeast fermentation of different barley cultivars.
Fermentation 07 00059 g001
Figure 2. Concentration of ethanol (A), isopropanol (B), acetic acid (C), succinic acid (D), ⍺-glycerylphosphorylcholine (E), glycerol (F) and glucose (G) in mash sampled every 24 h during yeast fermentation of different oat cultivars.
Fermentation 07 00059 g002
Figure 3. Average barley and oat fermentation product accumulation among cultivars over 72 h for ethanol (A), isopropanol (B), acetic acid (C), succinic acid (D), ⍺-glycerylphosphorylcholine (E), and glycerol (F).
Fermentation 07 00059 g003
Figure 4. Average consumption of glucose and average production of ethanol by Saccharomyces cerevisiae fermentations of barley (A) and oats (B).
Fermentation 07 00059 g004
Figure 5. Average consumption of glucose and average production of glycerol for barley (A) and oats (B).
Fermentation 07 00059 g005
Figure 6. Average fermentation product yields for ethanol (A), isopropanol (B), acetic acid (C), succinic acid (D), ⍺-glycerylphosphorylcholine (E), and glycerol (F) for barley with and without hulls.
Fermentation 07 00059 g006
Table 1. Barley cultivars (28 cultivars; all 2-row except for 6-row CDC Clyde) and oats (12 cultivars) subjected to Saccharomyces cerevisiae fermentation.
Barley CultivarsOat Cultivars
CultivarHulled vs. Hull-lessCultivarHulled
AAC SynergyHulledCDC ArborgHulled
AC MetcalfeHulledCDC DancerHulled
CDC AustensonHulledCDC MorrisonHulled
CDC BowHulledCDC NasserHulled
CDC ClearHull-lessCDC NorsemenHulled
CDC ClydeHulledCDC SeabiscuitHulled
CDC CopelandHulledOT3071Hulled
CDC CowboyHulledOT3087Hulled
CDC FibarHull-lessOT3102Hulled
CDC FraserHulledOT3103Hulled
CDC HiloseHull-lessOT3104Hulled
CDC KindersleyHulledOT3105Hulled
CDC MaverickHulled
CDC McGwireHull-less
CDC MeredithHulled
CDC RattanHull-less
ChampionHulled
ClaymoreHulled
FB207Hulled
FB208Hulled
HB16337Hull-less
OreanaHulled
SirishHulled
TR14150Hulled
TR16156Hulled
TR17163Hulled
TR17166Hulled
TR17167Hulled
Publisher’s Note: MDPI stays neutral with regard to jurisdictional claims in published maps and institutional affiliations.

