
Article

Valorizing Red Seaweed Spent Biomass into Reducing Sugars for β-Carotene Production by Rhodotorula paludigena

by
Chatchol Kongsinkaew
1,2,
Chutipol Tangsattayatithan
1,
Supenya Chittapun
1,2,
Parivat Phiphatbunyabhorn
1,
Tunyaboon Laemthong
3,
Mariena Ketudat-Cairns
4,
Soisuda Pornpukdeewattana
5,
Awanwee Petchkongkaew
2,6 and
Theppanya Charoenrat
1,2,*
1
Department of Biotechnology, Faculty of Science and Technology, Thammasat University (Rangsit Center), Pathum Thani 12120, Thailand
2
Center of Excellence in Global Food Security, Thammasat University (Rangsit Center), Pathum Thani 12120, Thailand
3
Department of Chemical Engineering, Faculty of Engineering, Thammasat School of Engineering, Thammasat University (Rangsit Center), Pathum Thani 12120, Thailand
4
Center for Molecular Structure, Function, and Application, School of Biotechnology, Institute of Agricultural Technology, Suranaree University of Technology, Nakhon Ratchasima 30000, Thailand
5
School of Food Industry, King Mongkut’s Institute of Technology Ladkrabang, Bangkok 10520, Thailand
6
Department of Food Science and Technology, Faculty of Science and Technology, Thammasat University (Rangsit Center), Pathum Thani 12120, Thailand
*
Author to whom correspondence should be addressed.
Fermentation 2026, 12(5), 210; https://doi.org/10.3390/fermentation12050210
Submission received: 1 April 2026 / Revised: 20 April 2026 / Accepted: 21 April 2026 / Published: 24 April 2026

Abstract

Seaweed bioactive extraction generates de-extracted residual solids that remain carbohydrate-rich but are often underutilized. This study developed an integrated valorization route for Gracilaria fisheri spent biomass to produce fermentable sugars for β-carotene production by Rhodotorula paludigena CM33. Reducing sugar production was optimized using response surface methodology (Box–Behnken design) by varying reaction time, sulfuric acid concentration, and biomass loading at 90 °C. The predicted optimum (47.39 min, 2.50% (w/v) H2SO4, and 7.13% (w/v) biomass) yielded 22.41 g/L reducing sugars and was validated experimentally at 22.22 ± 0.19 g/L, indicating that the model reliably predicted reducing sugar production. The optimized condition was scaled up in a 22 L bioreactor with sequential acid hydrolysis followed by enzyme-assisted hydrolysis, increasing reducing sugars from ~30 to ~40 g/L. FTIR and SEM analyses indicated progressive modification of the carbohydrate matrix across processing stages. Batch cultivation of R. paludigena on the hydrolysate showed that ammonium sulfate supplementation significantly increased biomass, whereas β-carotene titers were not significantly different. Repeated-batch operation on non-supplemented hydrolysate sustained production over four cycles with β-carotene titers of 13.75–17.27 mg/L, demonstrating the operational feasibility of the hydrolysate-based system. Overall, this work demonstrates a practical seaweed biorefinery approach to upgrade G. fisheri spent biomass into sugars and carotenoid-rich yeast biomass.

1. Introduction

Seaweeds are increasingly recognized as renewable marine biomass resources with high potential for conversion into fuels [1,2], chemicals [3], and functional bioproducts [4,5]. In addition to their established roles in food and hydrocolloid industries, seaweeds are rich in polysaccharides that can be transformed into fermentable sugars, providing a promising feedstock for biorefinery applications [6]. However, as seaweed-based extraction industries expand, large quantities of spent or residual biomass are generated after recovery of high-value bioactives. This de-extracted biomass is often underutilized despite retaining substantial carbohydrate content, creating both an environmental burden and a missed opportunity for circular bioeconomy development.
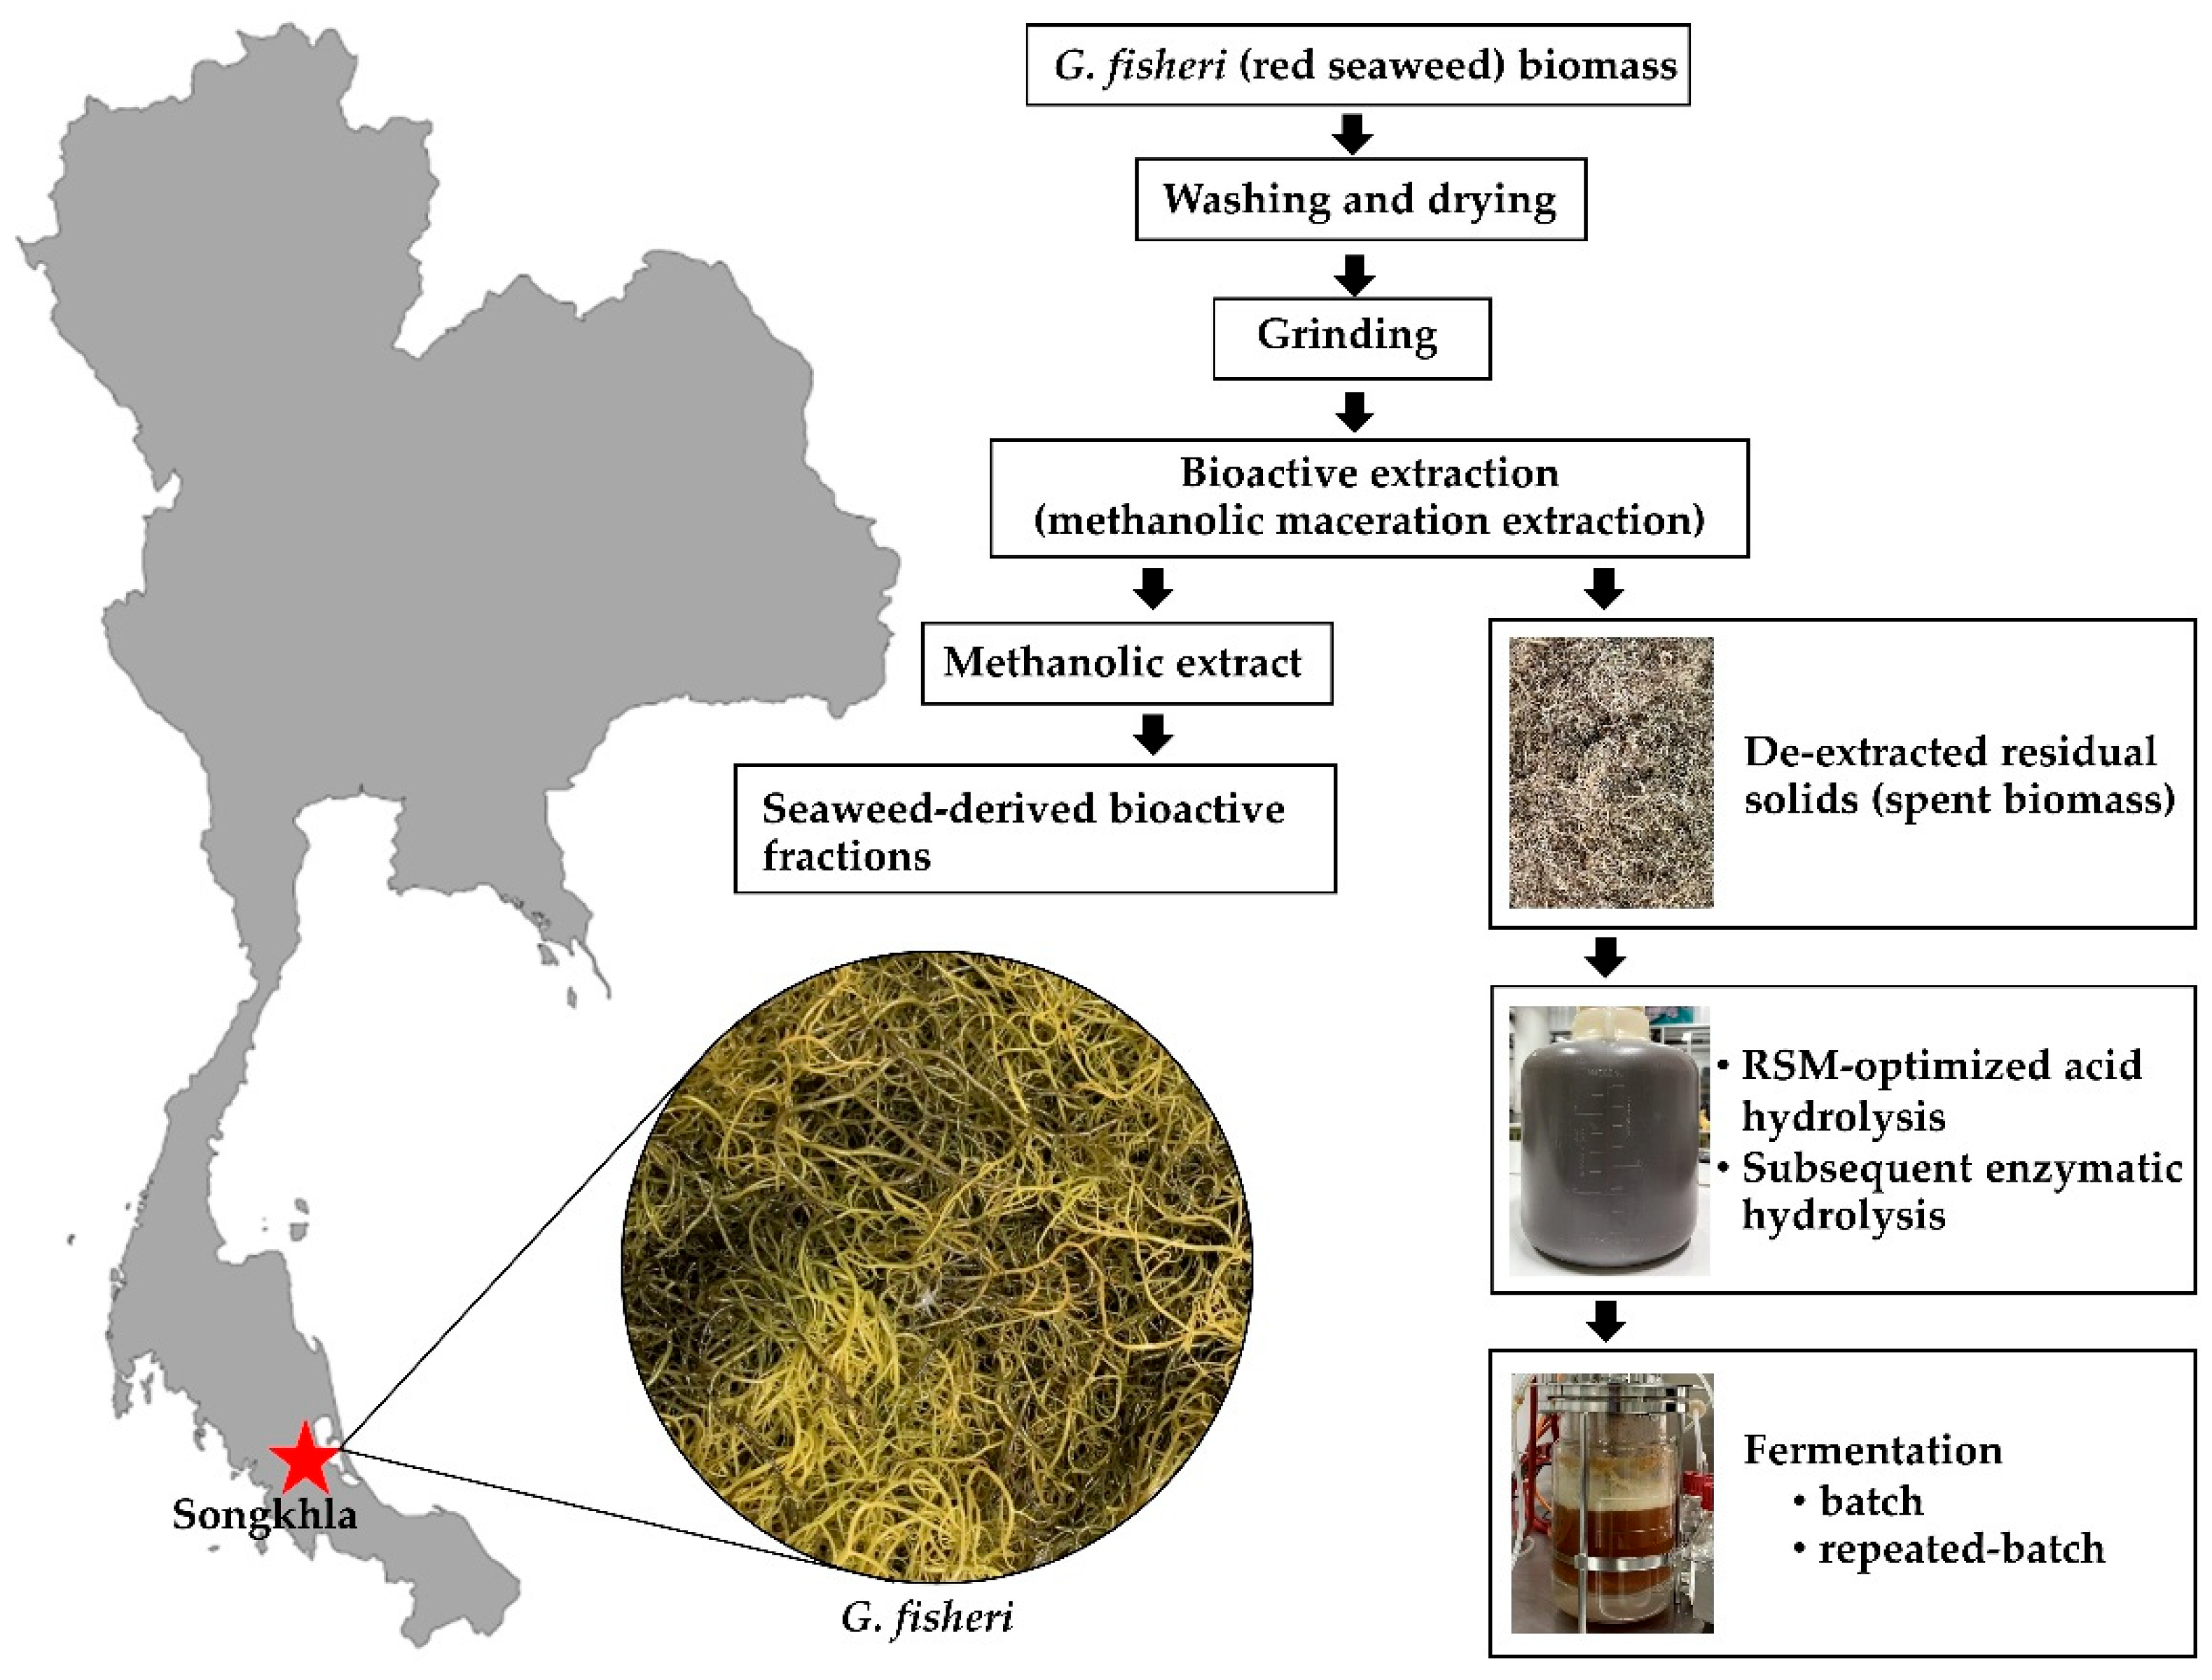
Red seaweeds of the genus Gracilaria (Rhodophyta), commonly occurring in warm temperate and tropical shallow waters, are widely distributed and of considerable economic importance [7]. Their biomass is rich in polysaccharides, particularly agar-related carbohydrates, which can be hydrolyzed to generate reducing sugars suitable for microbial cultivation [8,9]. Polysaccharide composition strongly influences sugar release during hydrolysis; as a result, the carbohydrate-related composition of Gracilaria fisheri collected in Thailand has been reported. As summarized in Table 1 [10], G. fisheri exhibits a high total carbohydrate content (63.0 g/100 g TS) and low lignin (1.60% DW), supporting its potential as a feedstock for hydrolysate-based fermentation. Importantly, G. fisheri has recently been investigated as a source of cosmetic-related bioactive compounds [11]. This extraction process generates de-extracted residual solids (spent biomass) that remain available for further processing. Figure 1 provides a schematic overview of the integrated workflow adopted in this study, in which the bioactive extraction step (methanolic maceration) follows a previously reported protocol [11], and the resulting spent biomass serves as the feedstock for downstream conversion. While the methanolic extract has been explored for cosmetic bioactives [11], the remaining spent biomass is typically treated as a low-value by-product and is often underutilized. To the best of our knowledge, the systematic valorization of spent G. fisheri biomass into fermentable sugars and its subsequent upgrading via yeast fermentation have received limited attention. Therefore, coupling methanol-based bioactive extraction with downstream carbohydrate conversion offers a practical route to improve overall resource efficiency within a seaweed biorefinery framework.
A key challenge in valorizing seaweed residues is achieving efficient hydrolysis while maintaining a hydrolysate compatible with microbial fermentation. Acid hydrolysis is attractive due to its operational simplicity and scalability [10,12]; however, sugar release is highly dependent on reaction severity, including acid concentration, residence time, and solids loading. Overly severe conditions can lead to sugar degradation and the formation of fermentation-inhibitory by-products, potentially compromising downstream bioconversion [13], whereas insufficient severity results in low sugar yields. Therefore, systematic optimization is required to identify practical conditions that maximize reducing sugar production from seaweed residues. Response surface methodology (RSM) provides an efficient approach to evaluate the combined and interactive effects of key operating variables and to locate optimal conditions with a limited number of experiments. RSM-based optimization has been applied to enhance fermentable sugar production from several seaweed species, as reported in previous studies [14,15,16]. In addition to optimizing acid hydrolysis, a subsequent enzyme-assisted step can be employed to further enhance sugar recovery under milder chemical conditions [17]. However, the application of such enzyme-assisted hydrolysis to G. fisheri biomass, particularly de-extracted residual solids, has received limited attention, motivating the present work.
Beyond sugar generation, seaweed-derived sugars can be coupled to microbial bioconversion to produce high-value bioproducts. Rhodotorula paludigena CM33 is a robust non-conventional, oleaginous yeast that synthesizes β-carotene, a natural colorant, functional ingredient, and a provitamin A precursor. The global carotenoids market is projected to reach approximately US$ 2.7 billion by 2027 [18], and the applications of carotenoids in foods, feeds, and health products have been widely reviewed [19,20,21,22]. Biomass of CM33 and related R. paludigena strains has also shown promise as an aquaculture feed supplement, improving growth performance, pigmentation, and health outcomes in shrimp and ornamental fish [23,24,25]. The genome sequence of CM33 has been reported [26]. In addition, controlled cultivation strategies have demonstrated the feasibility of achieving high β-carotene production with R. paludigena CM33 [27,28,29,30], supporting its potential for industrial bioprocess development. Therefore, using seaweed-residue hydrolysates as a carbon source offers a sustainable route to upgrade marine biomass residues into value-added carotenoids.
In this study, we propose an integrated valorization route for de-extracted G. fisheri residual biomass sourced from a prior bioactive extraction process. The overall workflow is schematically summarized in Figure 1. Reducing sugar production was optimized using RSM (Box–Behnken design; BBD) by varying reaction time, sulfuric acid concentration, and biomass loading under fixed temperature conditions. The optimized acid hydrolysis condition was experimentally validated and followed by subsequent cellulase-assisted enzymatic hydrolysis to further increase fermentable sugar availability. The resulting hydrolysate was then evaluated as a substrate for bioreactor cultivation of R. paludigena CM33 to produce biomass and β-carotene under batch and repeated-batch modes. Overall, this work demonstrates a practical seaweed biorefinery concept that links upstream bioactive extraction with downstream carbohydrate conversion and microbial biomanufacturing, thereby improving value recovery from red seaweed biomass residues.

2. Materials and Methods

2.1. The Spent Biomass of G. fisheri and Yeast Strain

The de-extracted residual solids of G. fisheri were sourced from the Algae and Plankton Research Unit at Thammasat University, Rangsit Center, Pathum Thani, Thailand. The biomass was prepared according to a previously reported method [11]. Briefly, G. fisheri biomass was harvested, washed, dried, and blended, followed by methanol extraction to isolate bioactive compounds. After removing methanol, the biomass was dried, yielding the biomass used in this study (Figure 1).
The R. paludigena CM33 [31] pure culture provided by the Center for Molecular Structure, Function, and Application, School of Biotechnology, Institute of Agricultural Technology, Suranaree University of Technology, Nakhon Ratchasima, Thailand, was used in this study.

2.2. Acid Hydrolysis Using Response Surface Methodology

RSM using the BBD was applied to optimize reducing sugar production from seaweed residue, with reaction time (A), sulfuric acid concentration (B), and biomass loading (C) as factors selected for the present experimental design, ranging from 0 to 60 min, 0 to 3% (w/v), and 1 to 9% (w/v), respectively (Table 2).
Seventeen experiments were conducted according to the experimental design (Table 3) and analyzed using Design-Expert software (version 7.0). Briefly, seaweed biomass was transferred to a reaction vessel and mixed with sulfuric acid at the specified concentrations, with the total reaction volume adjusted to 100 mL. The hydrolysis was performed in an autoclave at 90 °C for the designated reaction times. After hydrolysis, the mixtures were centrifuged at 2656× g for 10 min, and the supernatants were collected for reducing sugar determination. The experimental data were then fitted to a second-order polynomial (quadratic) model, as described in Equation (1).
Y = β 0 + Σ β i X i + Σ β i X i 2 + Σ β i j X i X j
The quadratic model and regression equation were validated by performing confirmatory experiments at the predicted optimal levels of the three variables. Optimization was conducted using a desirability function, in which the three independent variables were set to be in range, while the reducing sugar response was set to be maximized. The validation experiment was conducted as described above in triplicate. The mean reducing sugar concentration (actual value) was compared with the model-predicted value and reported as the percentage difference.

2.3. Acid Hydrolysis and Subsequent Enzymatic Treatment

A 22 L bioreactor (Biostat C Plus; Sartorius Stedim Biotech, Göttingen, Germany) was used for reducing sugar production at a larger scale. The bioreactor was equipped with pH and temperature probes. The hydrolysis conditions (reaction time, sulfuric acid concentration, and biomass loading) were set to the same optimal levels used for model validation (Section 2.2); however, the working volume was scaled up 15-fold compared with the RSM experiments, from 100 mL to 15 L. Agitation was set at 500 rpm. The process was initiated by heating the reactor to 90 °C using the bioreactor’s automatic temperature control. Once the target temperature was reached, it was maintained for the optimized reaction time. The temperature was then reduced to 50 °C, which was used as the optimum temperature for cellulase activity. The pH was adjusted to 5.0 by automatic addition of 5 M NaOH. Cellulase enzyme blend (Cellic® CTec2; Sigma-Aldrich, St. Louis, MO, USA; product no. SAE0020), containing cellulases, β-glucosidases, and hemicellulase activities, was added at a loading of 20 FPU/g dry biomass. The cellulase loading was fixed and not independently optimized for the residual G. fisheri biomass. Samples were collected at regular intervals during enzymatic hydrolysis and analyzed for reducing sugar concentration until values remained approximately constant for at least two consecutive sampling points. To terminate enzymatic activity, the reactor temperature was increased to 90 °C and held for 10 min. The hydrolysate was then harvested by centrifugation, and the clarified supernatant was stored at 4 °C and used within 2 weeks. Solid biomass samples were collected at three stages: (i) initial biomass, (ii) biomass after acid pretreatment followed by pH adjustment to 5.0 in the bioreactor, and (iii) biomass after enzymatic hydrolysis followed by enzyme inactivation at 90 °C. The solids were washed with distilled water and dried at 50 °C prior to Fourier transform infrared (FTIR) spectroscopy and scanning electron microscopy (SEM) analyses.

2.4. Starter Preparation

Two-step starter preparation, as described previously [27], was used. Briefly, the primary starter was prepared by transferring a single colony of R. paludigena CM33 into a 250 mL Erlenmeyer flask, containing 50 mL of Yeast Extract Peptone Dextrose (YPD; 10 g/L yeast extract, 20 g/L peptone, and 22 g/L glucose monohydrate) broth. This was incubated at 200 rpm, 30 °C for 20 h. Afterward, the culture was diluted with YPD broth to an absorbance of 10 at 600 nm, as measured using a spectrophotometer (LIBRA S22; Biochrom, Cambridge, UK), to obtain the primary starter. The cell-free YPD broth served as a blank.
The secondary starter was prepared by transferring 10 mL of the primary starter into a 500 mL Erlenmeyer flask, containing 100 mL of minimal medium as recently developed [28]. This medium comprised the following (per L of distilled water): 22 g glucose monohydrate, 7 g KH2PO4, 0.5 g yeast extract, 2.5 g Na2HPO4, 6.2 g (NH4)2SO4, 1.5 g MgSO4·7H2O, 0.075 g FeCl3, 0.199 g CaCl2·2H2O, and 0.02 g ZnSO4·7H2O. The cells were incubated at 200 rpm, 30 °C for 20 h. Then, the absorbance at 600 nm was adjusted to 6 to obtain the secondary starter. The cell-free minimal medium served as a blank.

2.5. Batch Fermentation

Batch fermentation was conducted in a 2 L stirred-tank bioreactor (Biostat B; Sartorius Stedim Biotech, Göttingen, Germany) with a working volume of 1.5 L. The bioreactor was filled with either (i) seaweed hydrolysate alone or (ii) seaweed hydrolysate supplemented with ammonium sulfate at 6.2 g/L, and inoculated with 150 mL of the secondary seed culture. The culture media were sterilized by autoclaving at 121 °C for 15 min prior to fermentation. Agitation was maintained at 700 rpm, and the temperature was controlled at 30 °C. The pH was controlled at 5.0 by automatic addition of 5 M NaOH and 5 M H3PO4. Aeration was set at 1.0 L/min. The fermentation was carried out for 48 h. Samples were collected during cultivation and analyzed for dry cell weight, reducing sugars, ammonium sulfate, and β-carotene.

2.6. Repeated-Batch Fermentation

Repeated-batch fermentation was performed in the same 2 L stirred-tank bioreactor under the same operating conditions as batch fermentation (agitation 700 rpm, temperature 30 °C, pH 5.0 controlled with 5 M NaOH and 5 M H3PO4, and aeration 1.0 L/min). The bioreactor was operated using seaweed hydrolysate alone (working volume 1.5 L). The hydrolysate medium was sterilized by autoclaving at 121 °C for 15 min prior to use. Each cycle was run for 48 h. At the end of each cycle, the culture broth was harvested, leaving 10% (v/v) as the inoculum for the next cycle (150 mL). Fresh hydrolysate (1.35 L) was then added to restore the working volume to 1.5 L, and the next cycle was initiated. The repeated-batch operation was conducted for four consecutive cycles. Samples were collected during each cycle for analysis of dry cell weight, reducing sugars, ammonium sulfate, and β-carotene.

2.7. Analytical Methods

2.7.1. Reducing Sugar Determination

Reducing sugar was determined using the dinitrosalicylic acid (DNS) method [32]. In brief, 250 µL of the sample was mixed with 250 µL of DNS reagent (10 g/L DNS, 16 g/L NaOH, and 300 g/L sodium potassium tartrate). The mixture was heated in a boiling water bath for 10 min, immediately cooled in cold water, and diluted with 5 mL of distilled water. Absorbance was measured at 540 nm using a spectrophotometer, and reducing sugar concentrations were expressed as g/L glucose equivalents, based on a glucose standard curve.

2.7.2. Ammonium Sulfate Determination

Ammonium sulfate concentration was determined by using a phenol–hypochlorite colorimetric method [28]. Briefly, 1 mL of the sample was mixed with 5 mL of phenol–nitroprusside reagent (10 g/L phenol and 50 mg/L sodium nitroprusside in distilled water), followed by 5 mL of alkaline hypochlorite solution (5.0 g/L NaOH and 8.4 mL/L sodium hypochlorite in distilled water). The reaction mixture was incubated at 37 °C for 20 min, and the absorbance was measured at 625 nm using a spectrophotometer (SP-880; Metertech Inc., Taipei, Taiwan). Ammonium sulfate concentrations were calculated from a calibration curve prepared with ammonium sulfate standards.

2.7.3. Dry Cell Weight Determination

Dry cell weight was determined according to a previously reported method [29]. Briefly, 1.5 mL of the culture sample was transferred into a 2 mL centrifuge tube and centrifuged at 7378× g for 5 min. The supernatant was collected and stored at −20 °C for reducing sugar analysis. The resulting cell pellet was washed with 1% (w/v) phosphoric acid, followed by washing with distilled water. The washed cell pellet was dried at 80 °C for 24 h and then cooled in a desiccator prior to weighing. The dry cell weight was subsequently recorded.

2.7.4. β-Carotene Determination

At each sampling time corresponding to dry cell weight determination, a 1.5 mL culture sample was transferred into a 2 mL centrifuge tube and centrifuged at 7378× g for 5 min. The resulting cell pellet was washed twice, first with 1% (w/v) phosphoric acid and subsequently with distilled water. The washed cell pellet was lyophilized until a constant weight was obtained. The dried biomass was then used for β-carotene determination.
β-carotene was quantified following a previously reported method [28]. Briefly, 850 µL of dimethyl sulfoxide (DMSO) was added to the dried biomass, and the mixture was incubated in the dark at 25 °C for 24 h. Subsequently, 600 µL of acetone was added, and the mixture was vortexed for 1 min. The resulting suspension was centrifuged at 7378× g for 5 min. The β-carotene content in the clear supernatant was determined spectrophotometrically by measuring the absorbance at 450 nm. The β-carotene concentration was calculated using a previously established calibration curve.

2.7.5. Calculation of Kinetic Parameters

The specific growth rate (µ, h−1), biomass yield on reducing sugar (Yx/s, g/g), β-carotene yield on biomass (YP/x, mg/g), β-carotene yield on reducing sugar (YP/s, mg/g), β-carotene productivity (QP, mg/L∙h), and biomass productivity (Qx, g/L∙h) were calculated according to a previous study [27].

2.8. Statistical Analysis

Data are presented as means ± standard deviation. The RSM experimental data were analyzed by analysis of variance (ANOVA) using Design-Expert software (version 7.0), and model significance was assessed at p < 0.05. Statistical differences between batch fermentation runs were evaluated using Student’s t-test performed in IBM SPSS Statistics (version 26.0), with significance defined at p < 0.05.

3. Results

3.1. Impact of Independent Variables on Reducing Sugar Production

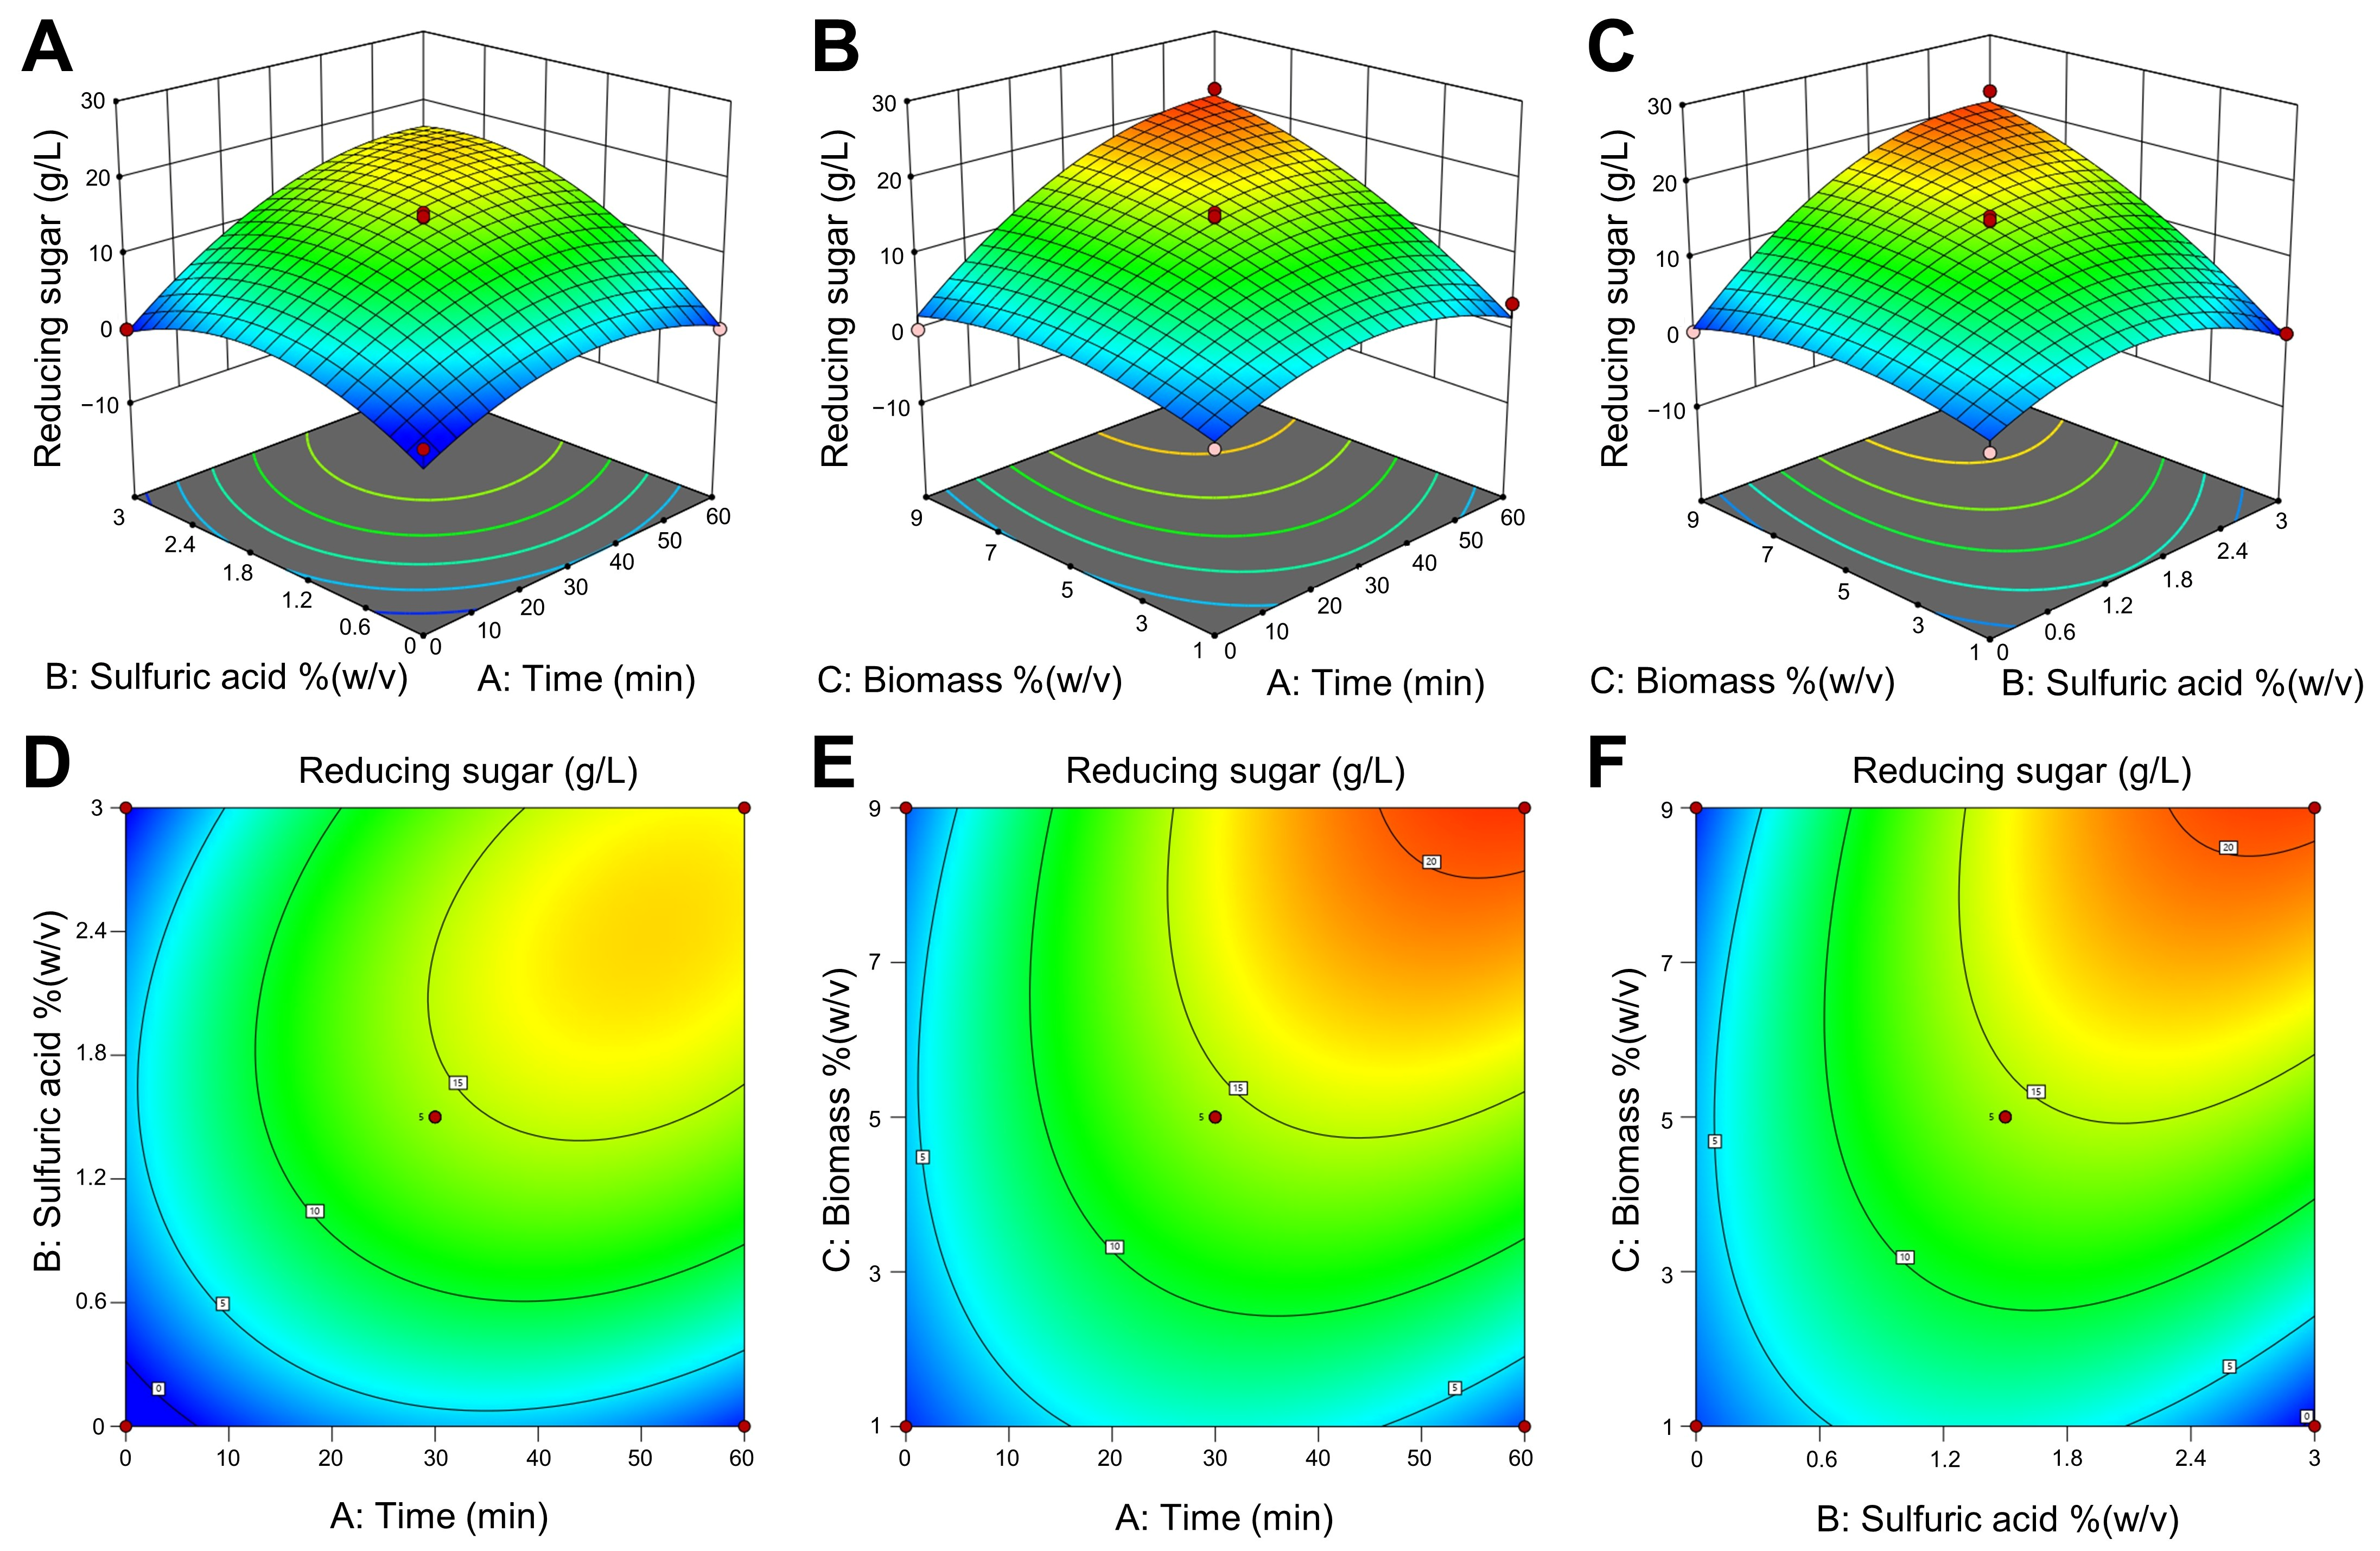
The reducing sugar concentrations obtained from the BBD experiments are summarized in Table 3. Analysis of variance (ANOVA) confirmed that the quadratic regression model was significant (F = 26.16, p = 0.0001), while the lack-of-fit was not significant (p = 0.0960), indicating that the model adequately described the experimental data within the studied range (Table 4). The model showed a good fit, with R2 = 0.9711 and an adjusted R2 of 0.9340. The significance of individual terms is presented in Table 4. The linear effects of reaction time (A), sulfuric acid concentration (B), and biomass loading (C) were all significant (p < 0.001), demonstrating that each factor contributed to the reducing sugar response. In addition, the interaction terms (AB, AC, and BC) and the quadratic terms (A2, B2, and C2) were significant (p < 0.05), suggesting the presence of factor interactions and curvature in the response surface.
Based on the regression analysis, the relationship between the coded independent variables and reducing sugar concentration (g/L) was expressed by the quadratic model in Equation (2). In general, the positive coefficients of the linear terms indicate increasing reducing sugar concentration with increasing levels of A, B, and C within the experimental domain, whereas the negative quadratic coefficients (A2, B2, and C2) reflect a declining trend at higher levels of each factor, consistent with a maximum response occurring at intermediate-to-high factor levels.
Reducing sugar = 14.28 + 4.92A + 4.46B + 5.06C + 3.44AB + 4.56AC + 5.44BC − 4.98A2 − 5.75B2 − 2.97C2
The combined effects of the independent variables are further illustrated by the three-dimensional response surface plots (Figure 2A–C) and the corresponding contour plots (Figure 2D–F). These plots visualize the interactive influence of reaction time, sulfuric acid concentration, and biomass loading on reducing sugar production and support the statistical significance of interaction terms observed in the ANOVA (Table 4).

3.2. Parameter Optimization for Sugar Production

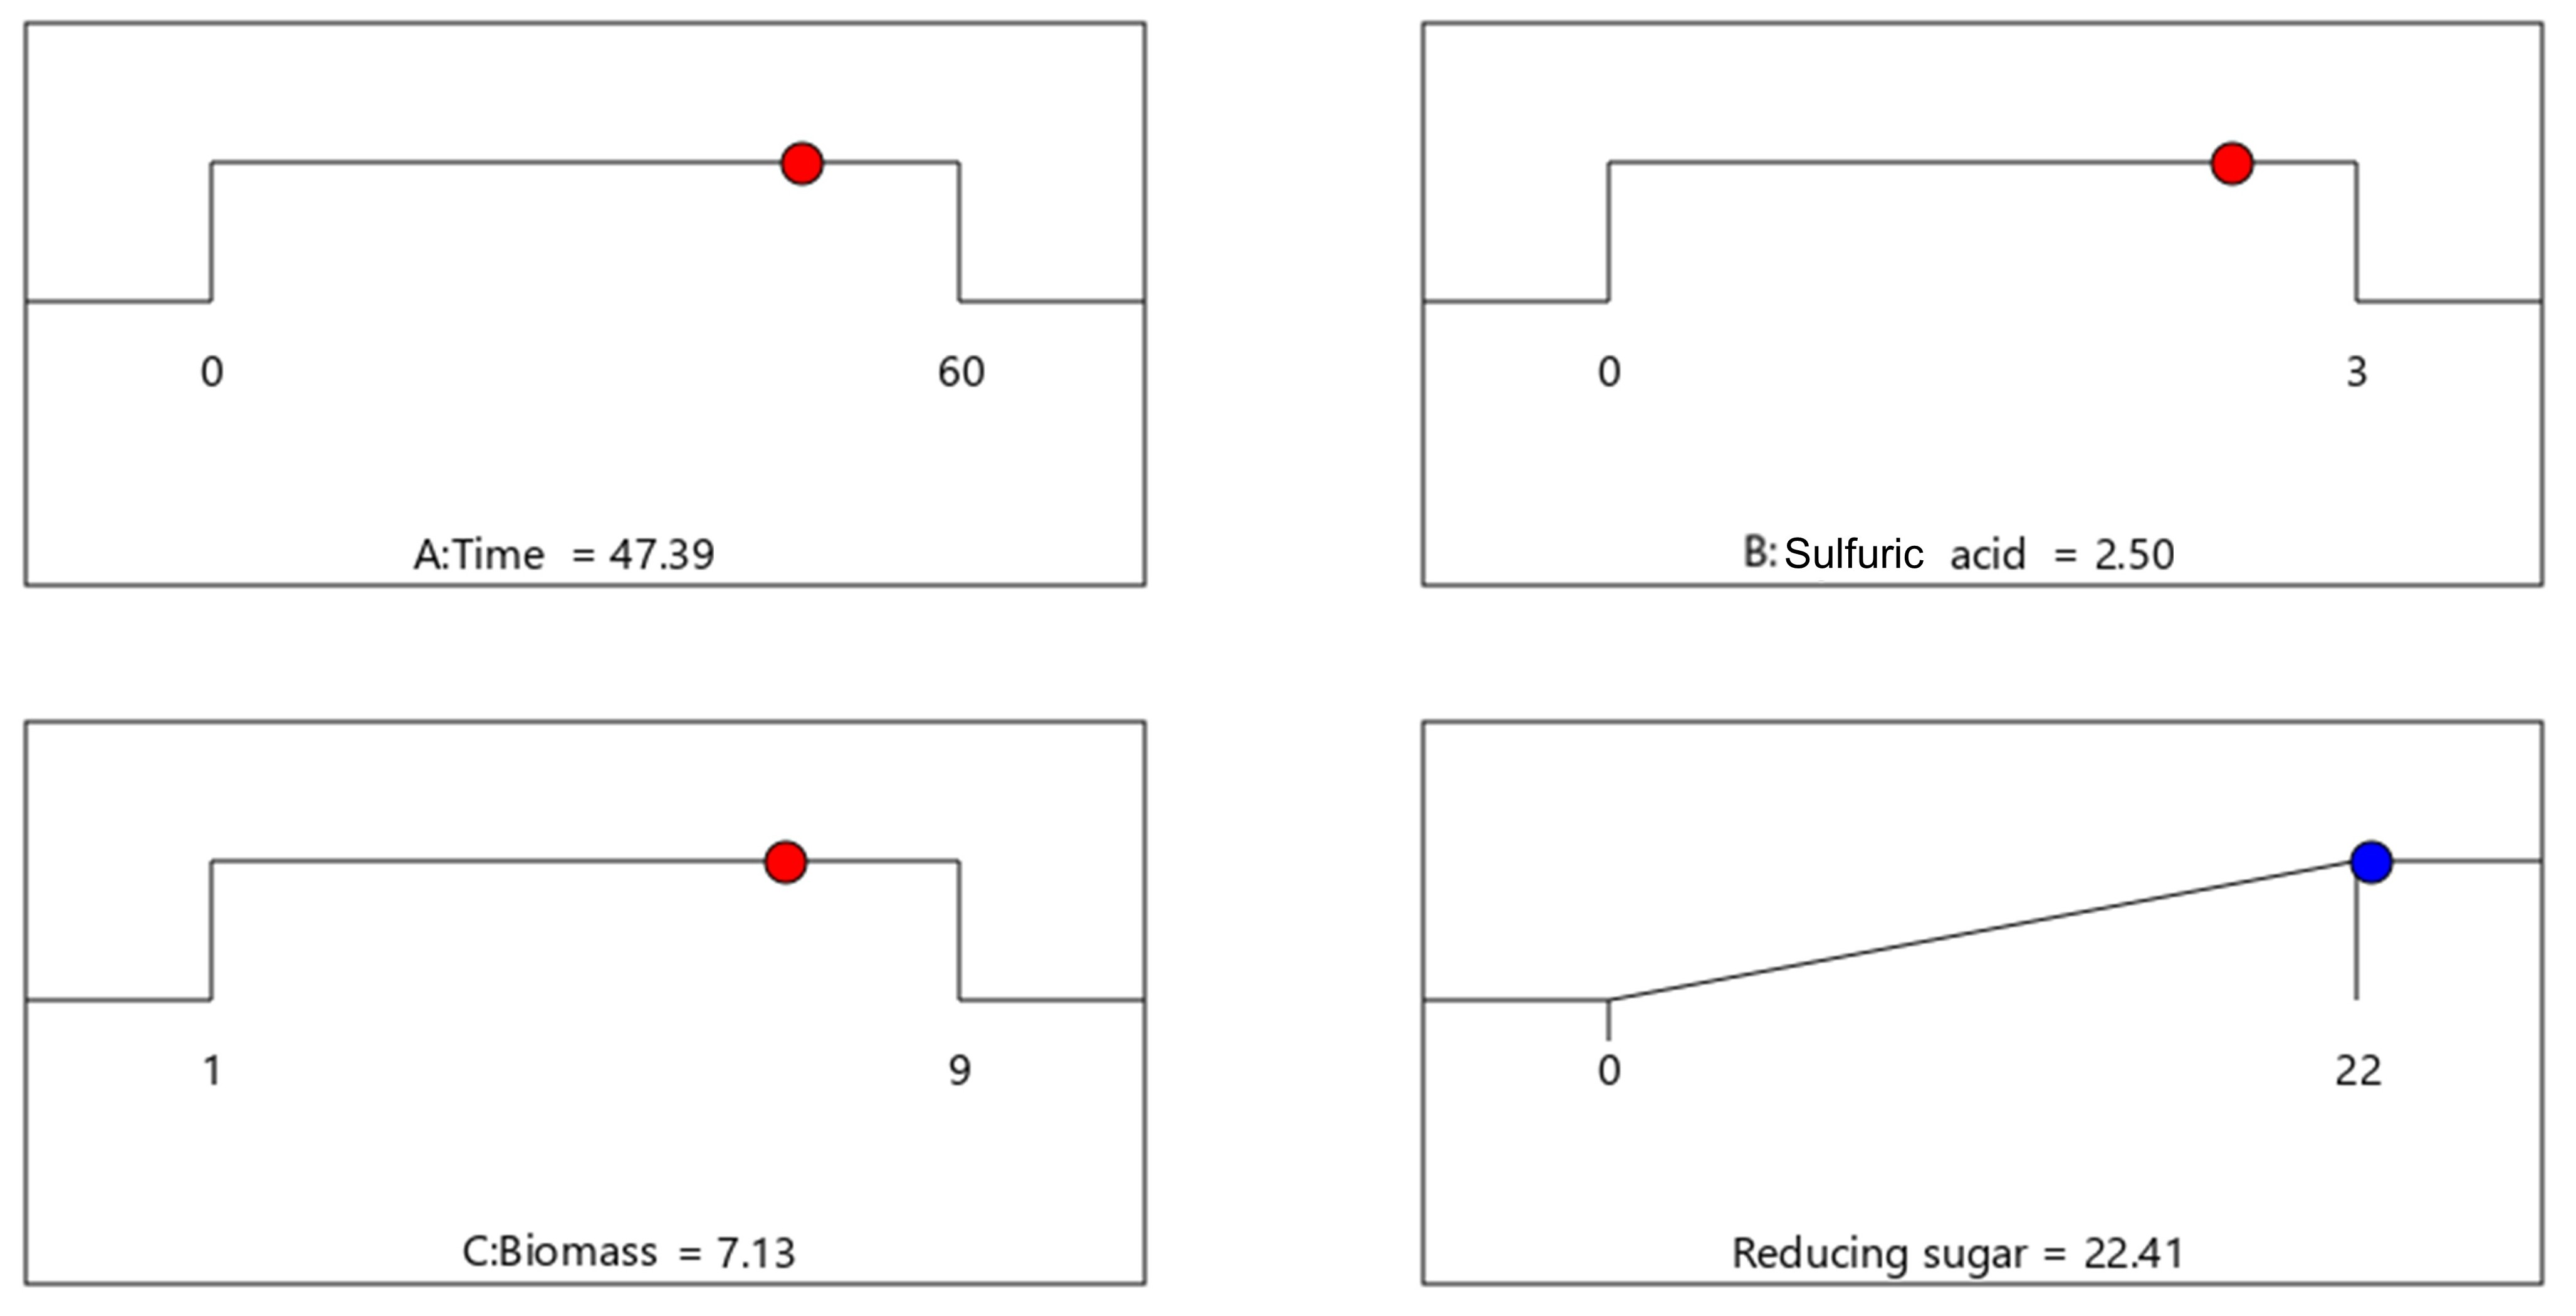
Numerical optimization was carried out using the desirability function to maximize the reducing sugar concentration, while the three independent variables (reaction time, sulfuric acid concentration, and biomass loading) were constrained within the studied ranges. The optimization predicted an optimum at 47.39 min (A), 2.50% (w/v) H2SO4 (B), and 7.13% (w/v) biomass loading (C), yielding a predicted reducing sugar concentration of 22.41 g/L (Figure 3). Notably, the predicted optimum was located within the interior of the experimental domain rather than at the boundary levels, supporting the presence of curvature described by the quadratic model.
Model validation was performed by conducting confirmatory experiments at the predicted optimum condition in triplicate. The measured reducing sugar concentration was 22.22 ± 0.19 g/L, which was in close agreement with the predicted value (22.41 g/L), corresponding to a difference of 0.85% (Table 5). The small deviation between predicted and experimental results demonstrates that the developed quadratic model reliably predicts reducing sugar production under the optimized hydrolysis condition.

3.3. Scale-Up Production of Reducing Sugars in a 22 L Bioreactor via Sequential Acid and Cellulase-Assisted Hydrolysis

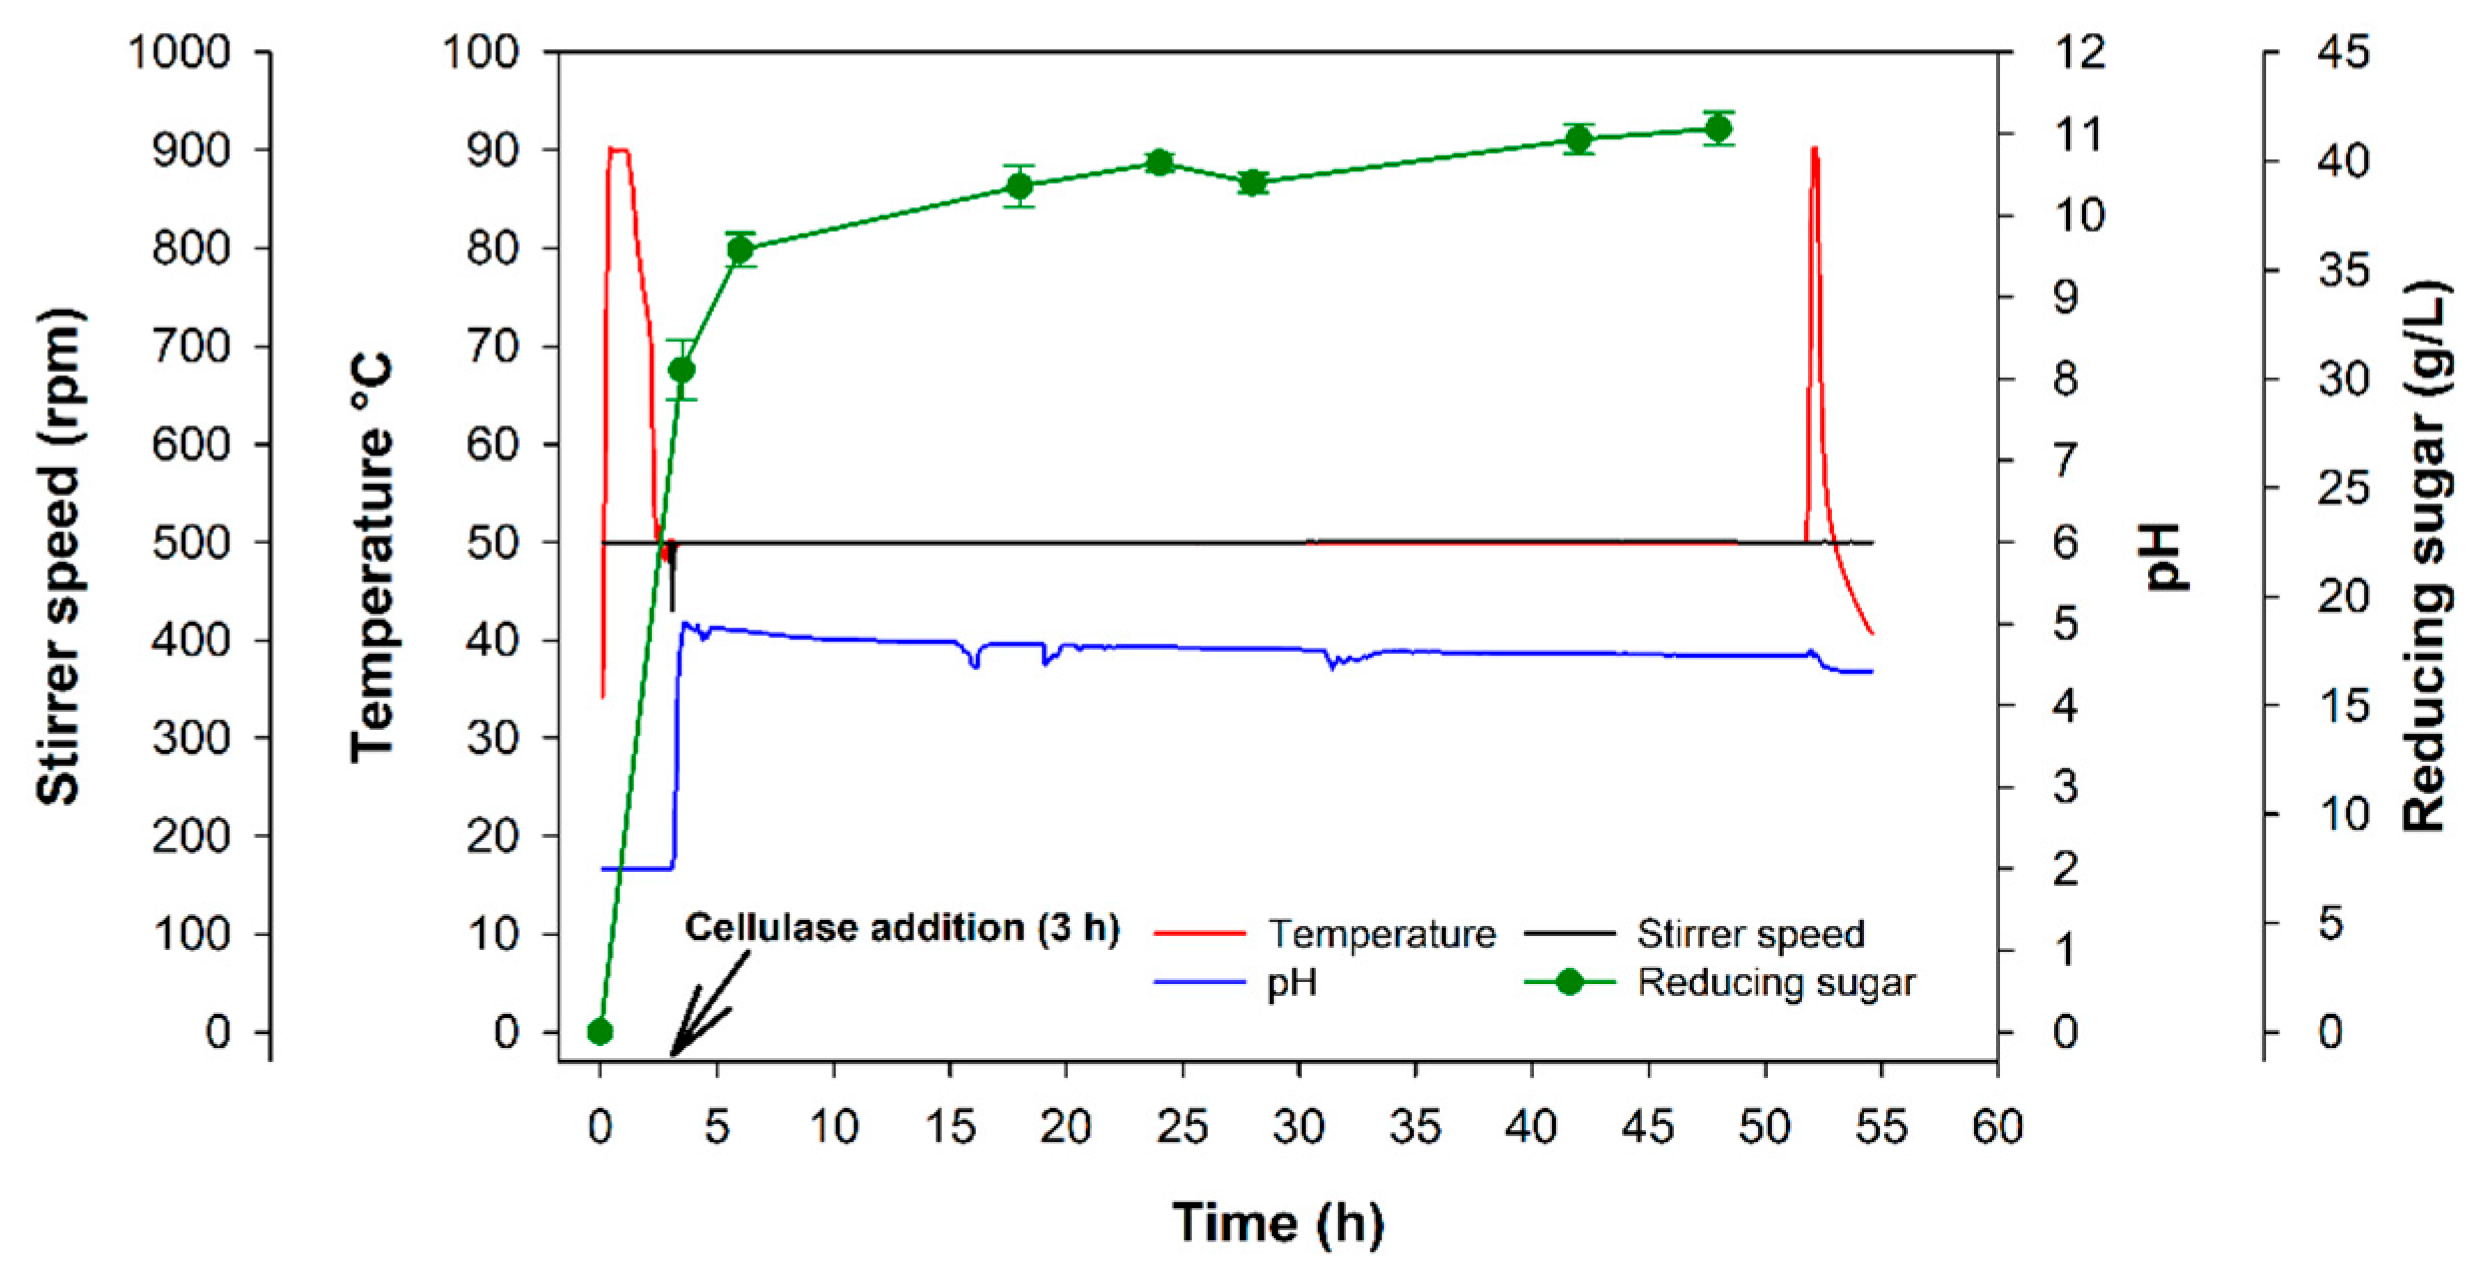
Scale-up hydrolysis was conducted in a 22 L bioreactor using the optimized acid hydrolysis conditions, followed by cellulase-assisted hydrolysis. The time-course profiles of temperature, pH, agitation speed, and reducing sugar concentration during the scale-up run are shown in Figure 4. The process was initiated by heating the reactor to 90 °C and maintaining it for 47 min for acid hydrolysis, followed by cooling to 50 °C and adjusting the pH to 5.0 prior to enzymatic hydrolysis, while agitation was maintained at 500 rpm. Cellulase was added at 3 h of process time, marking the start of enzymatic hydrolysis. After enzyme addition, reducing sugar concentration increased rapidly and approached a near-plateau by approximately 24 h of process time, after which only modest changes were observed. Overall, the reducing sugar concentration increased from approximately 30 g/L to ~40 g/L following cellulase-assisted hydrolysis (Figure 4).
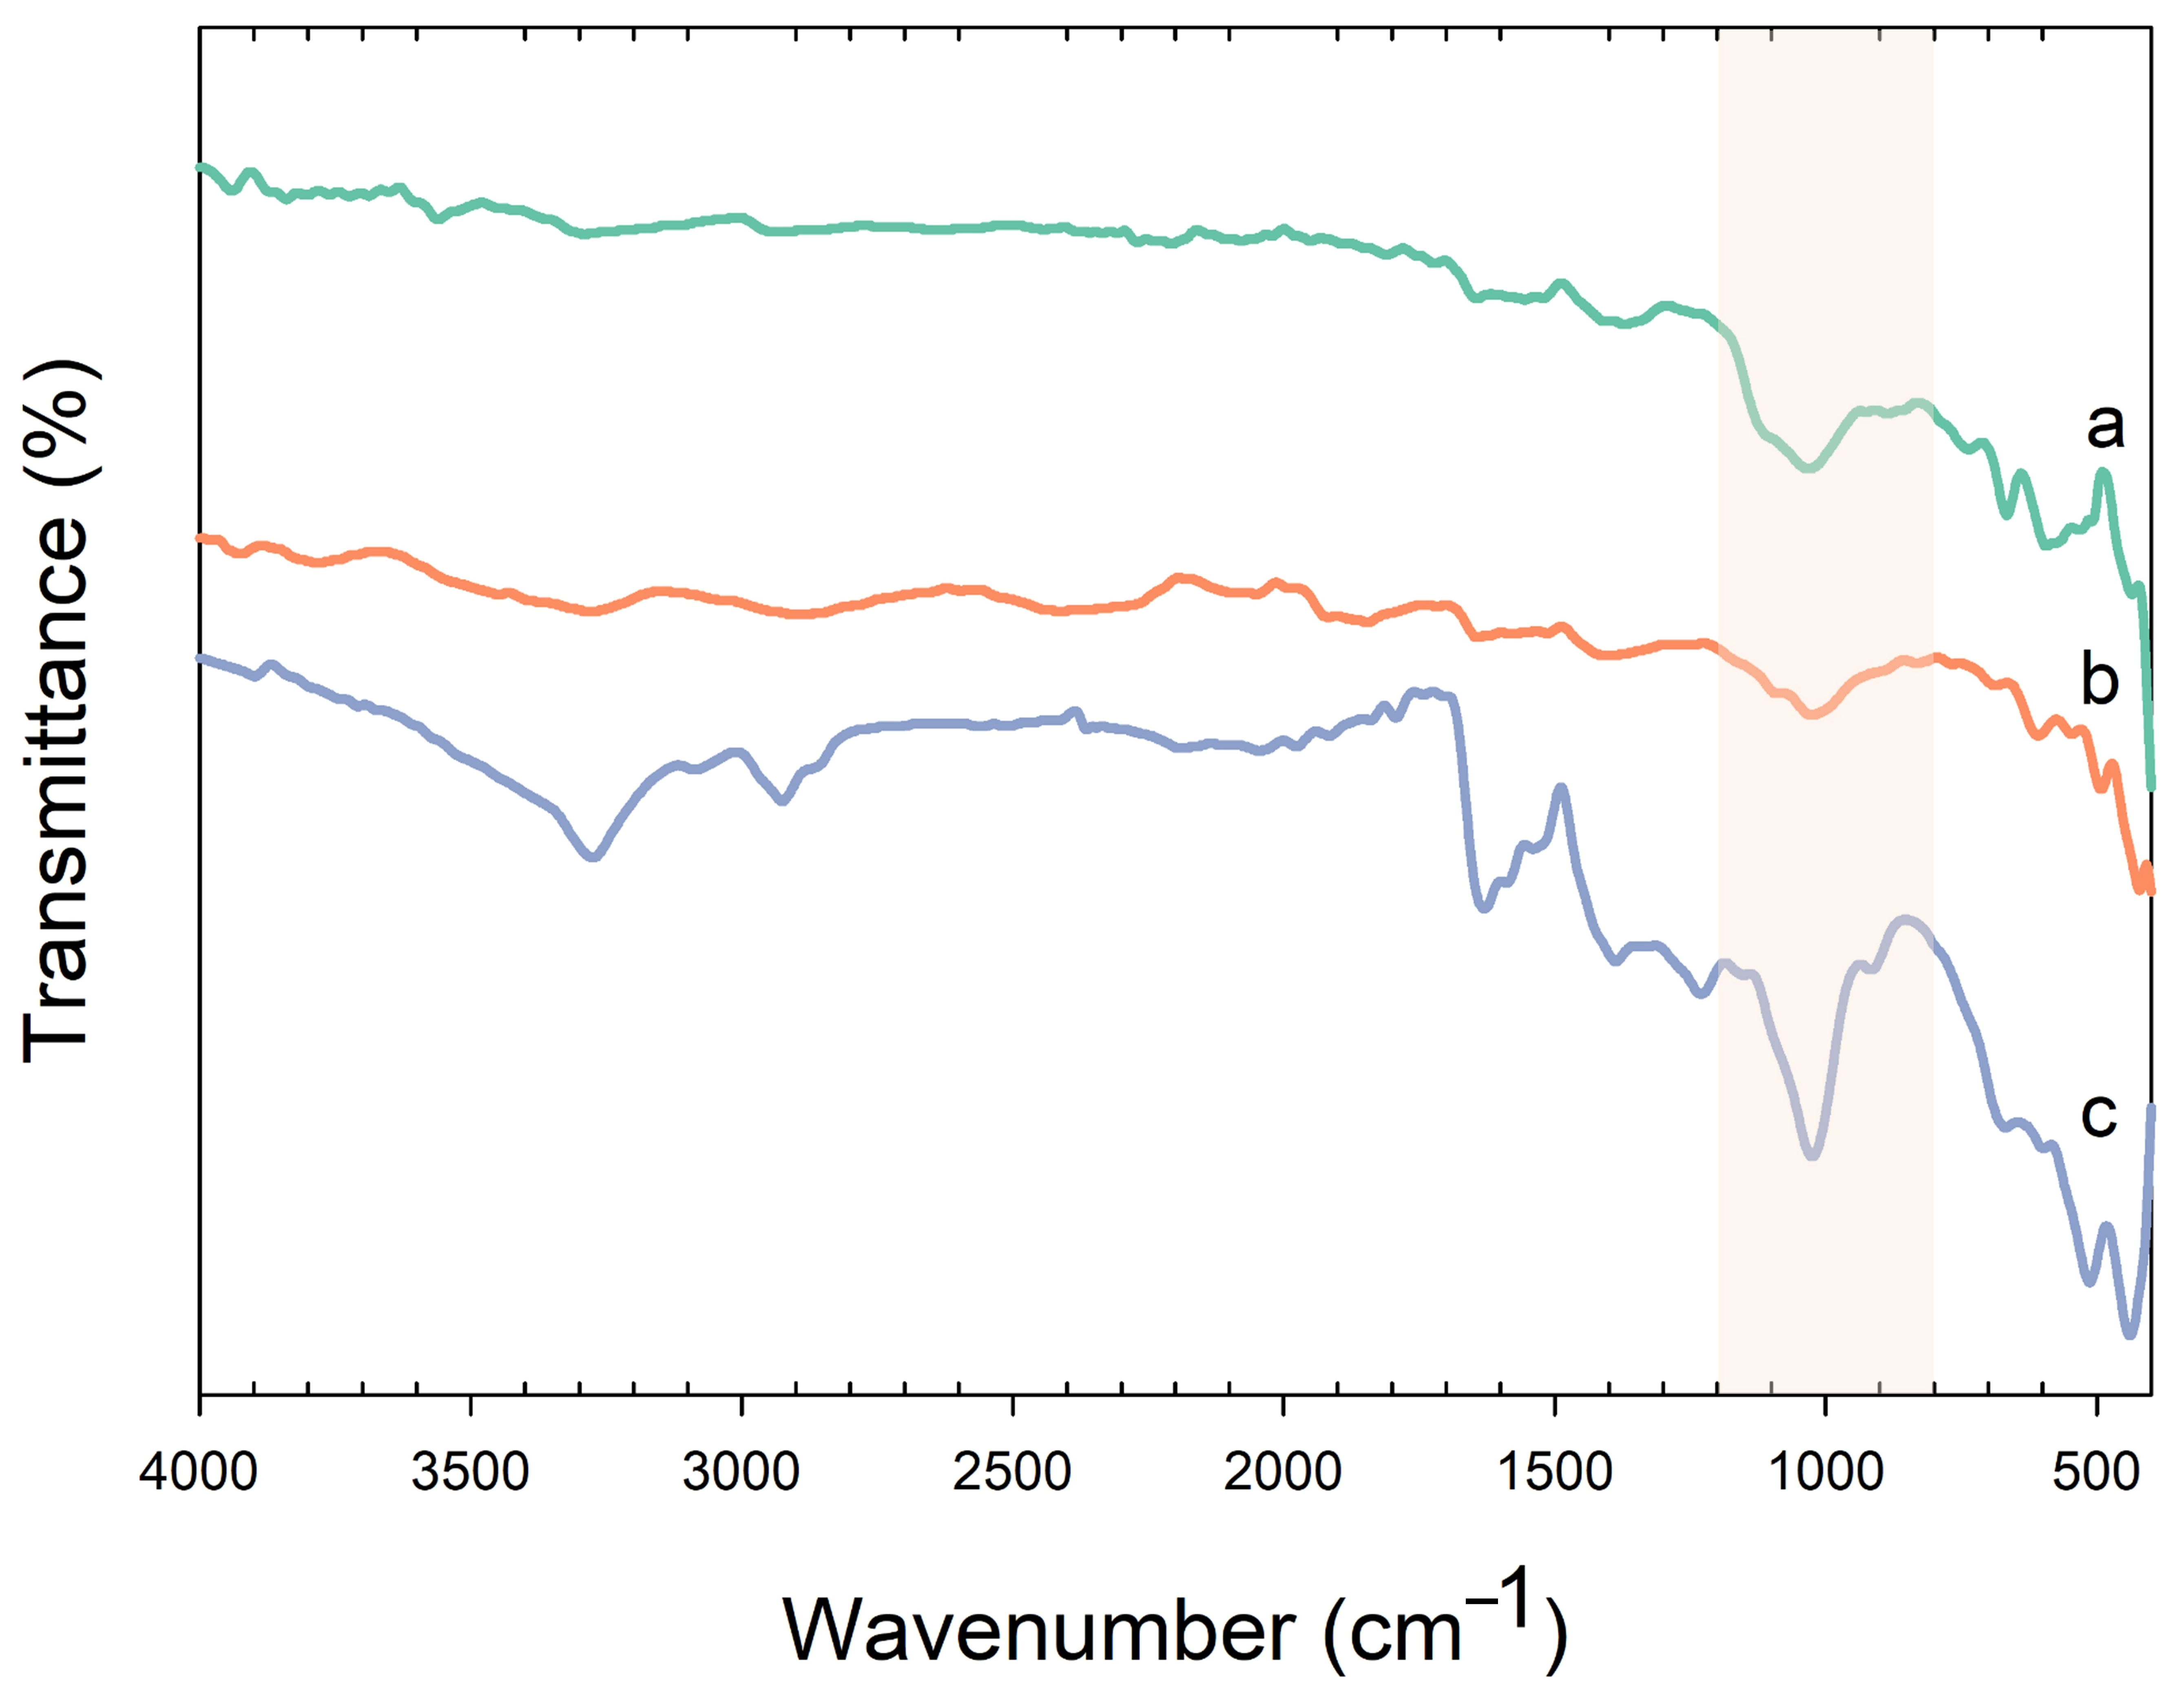
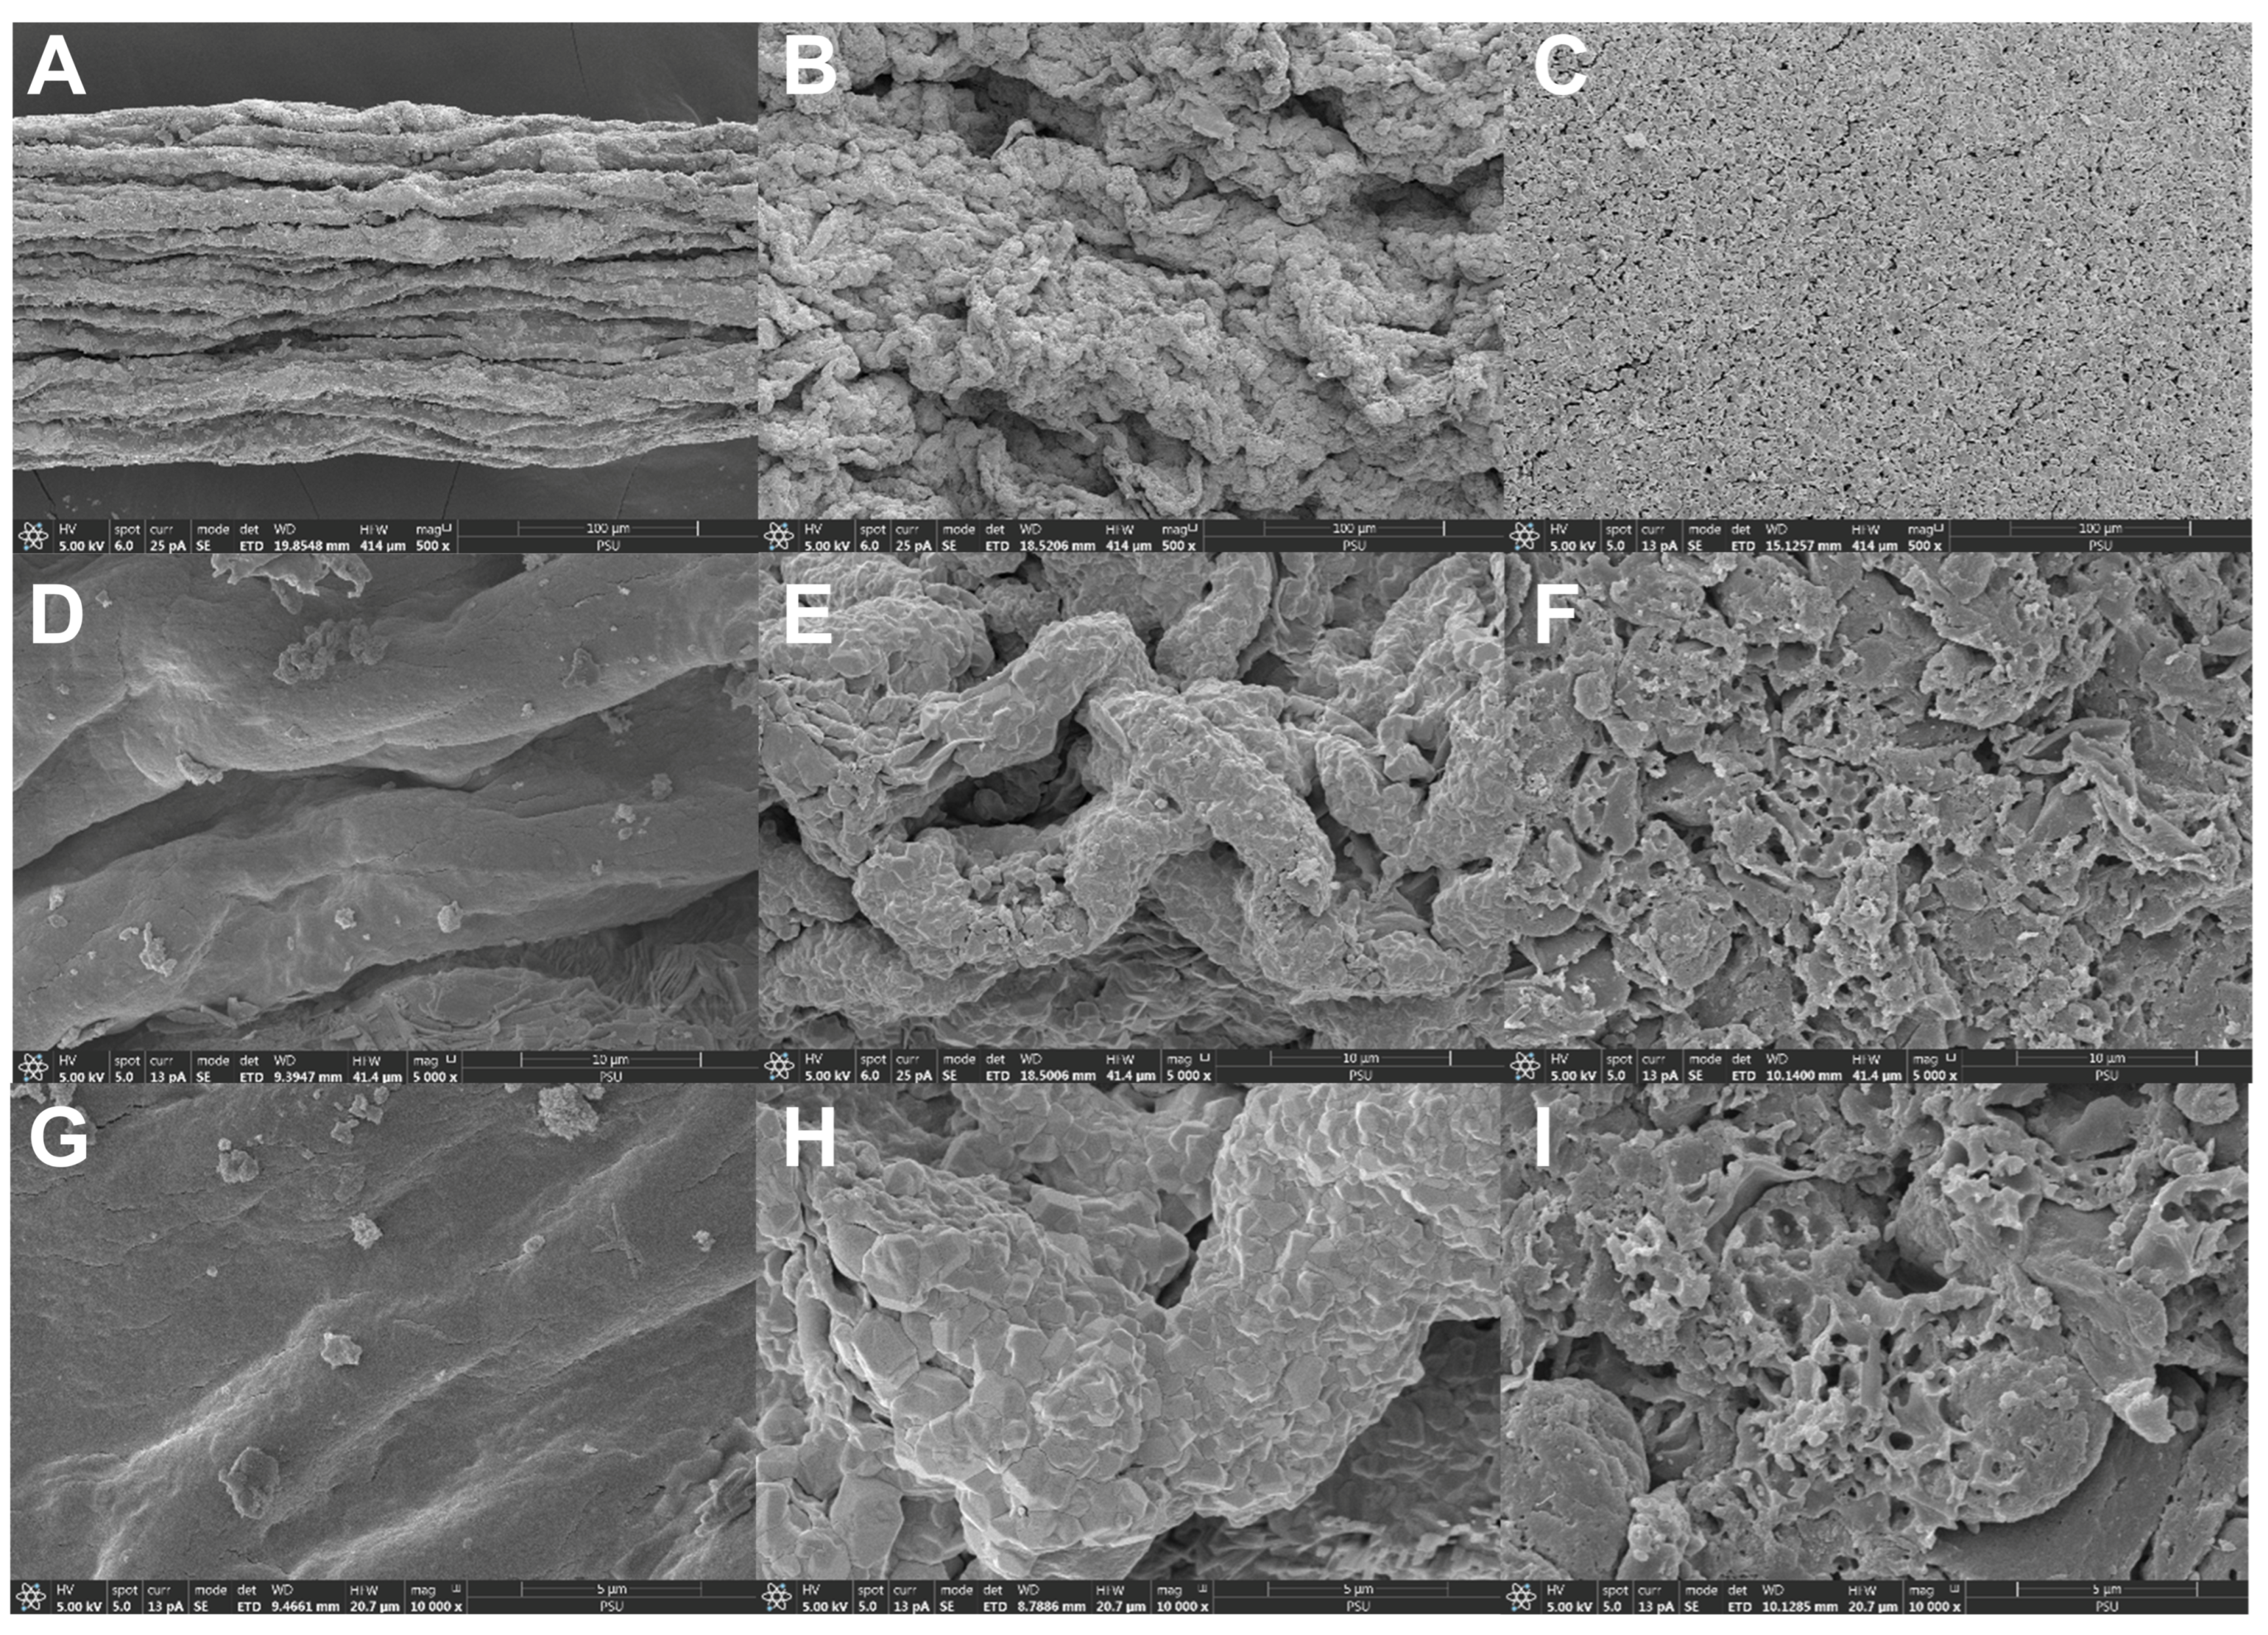
Chemical and structural changes in the solids during sequential hydrolysis were further evaluated by FTIR and SEM analyses. FTIR spectra (Figure 5) showed noticeable differences among the initial biomass (a), acid-hydrolyzed biomass after pH adjustment to 5.0 (b), and biomass after cellulase-assisted hydrolysis followed by enzyme inactivation at 90 °C (c), particularly within the carbohydrate fingerprint region (approximately 1200–800 cm−1). SEM images revealed progressive morphological disruption from the initial compact, layered structure (Figure 6A,D,G) to a more irregular and fractured surface after acid hydrolysis (Figure 6B,E,H), and a markedly porous, open structure after cellulase-assisted hydrolysis (Figure 6C,F,I).

3.4. Effect of Ammonium Sulfate Supplementation on Batch Cultivation Performance

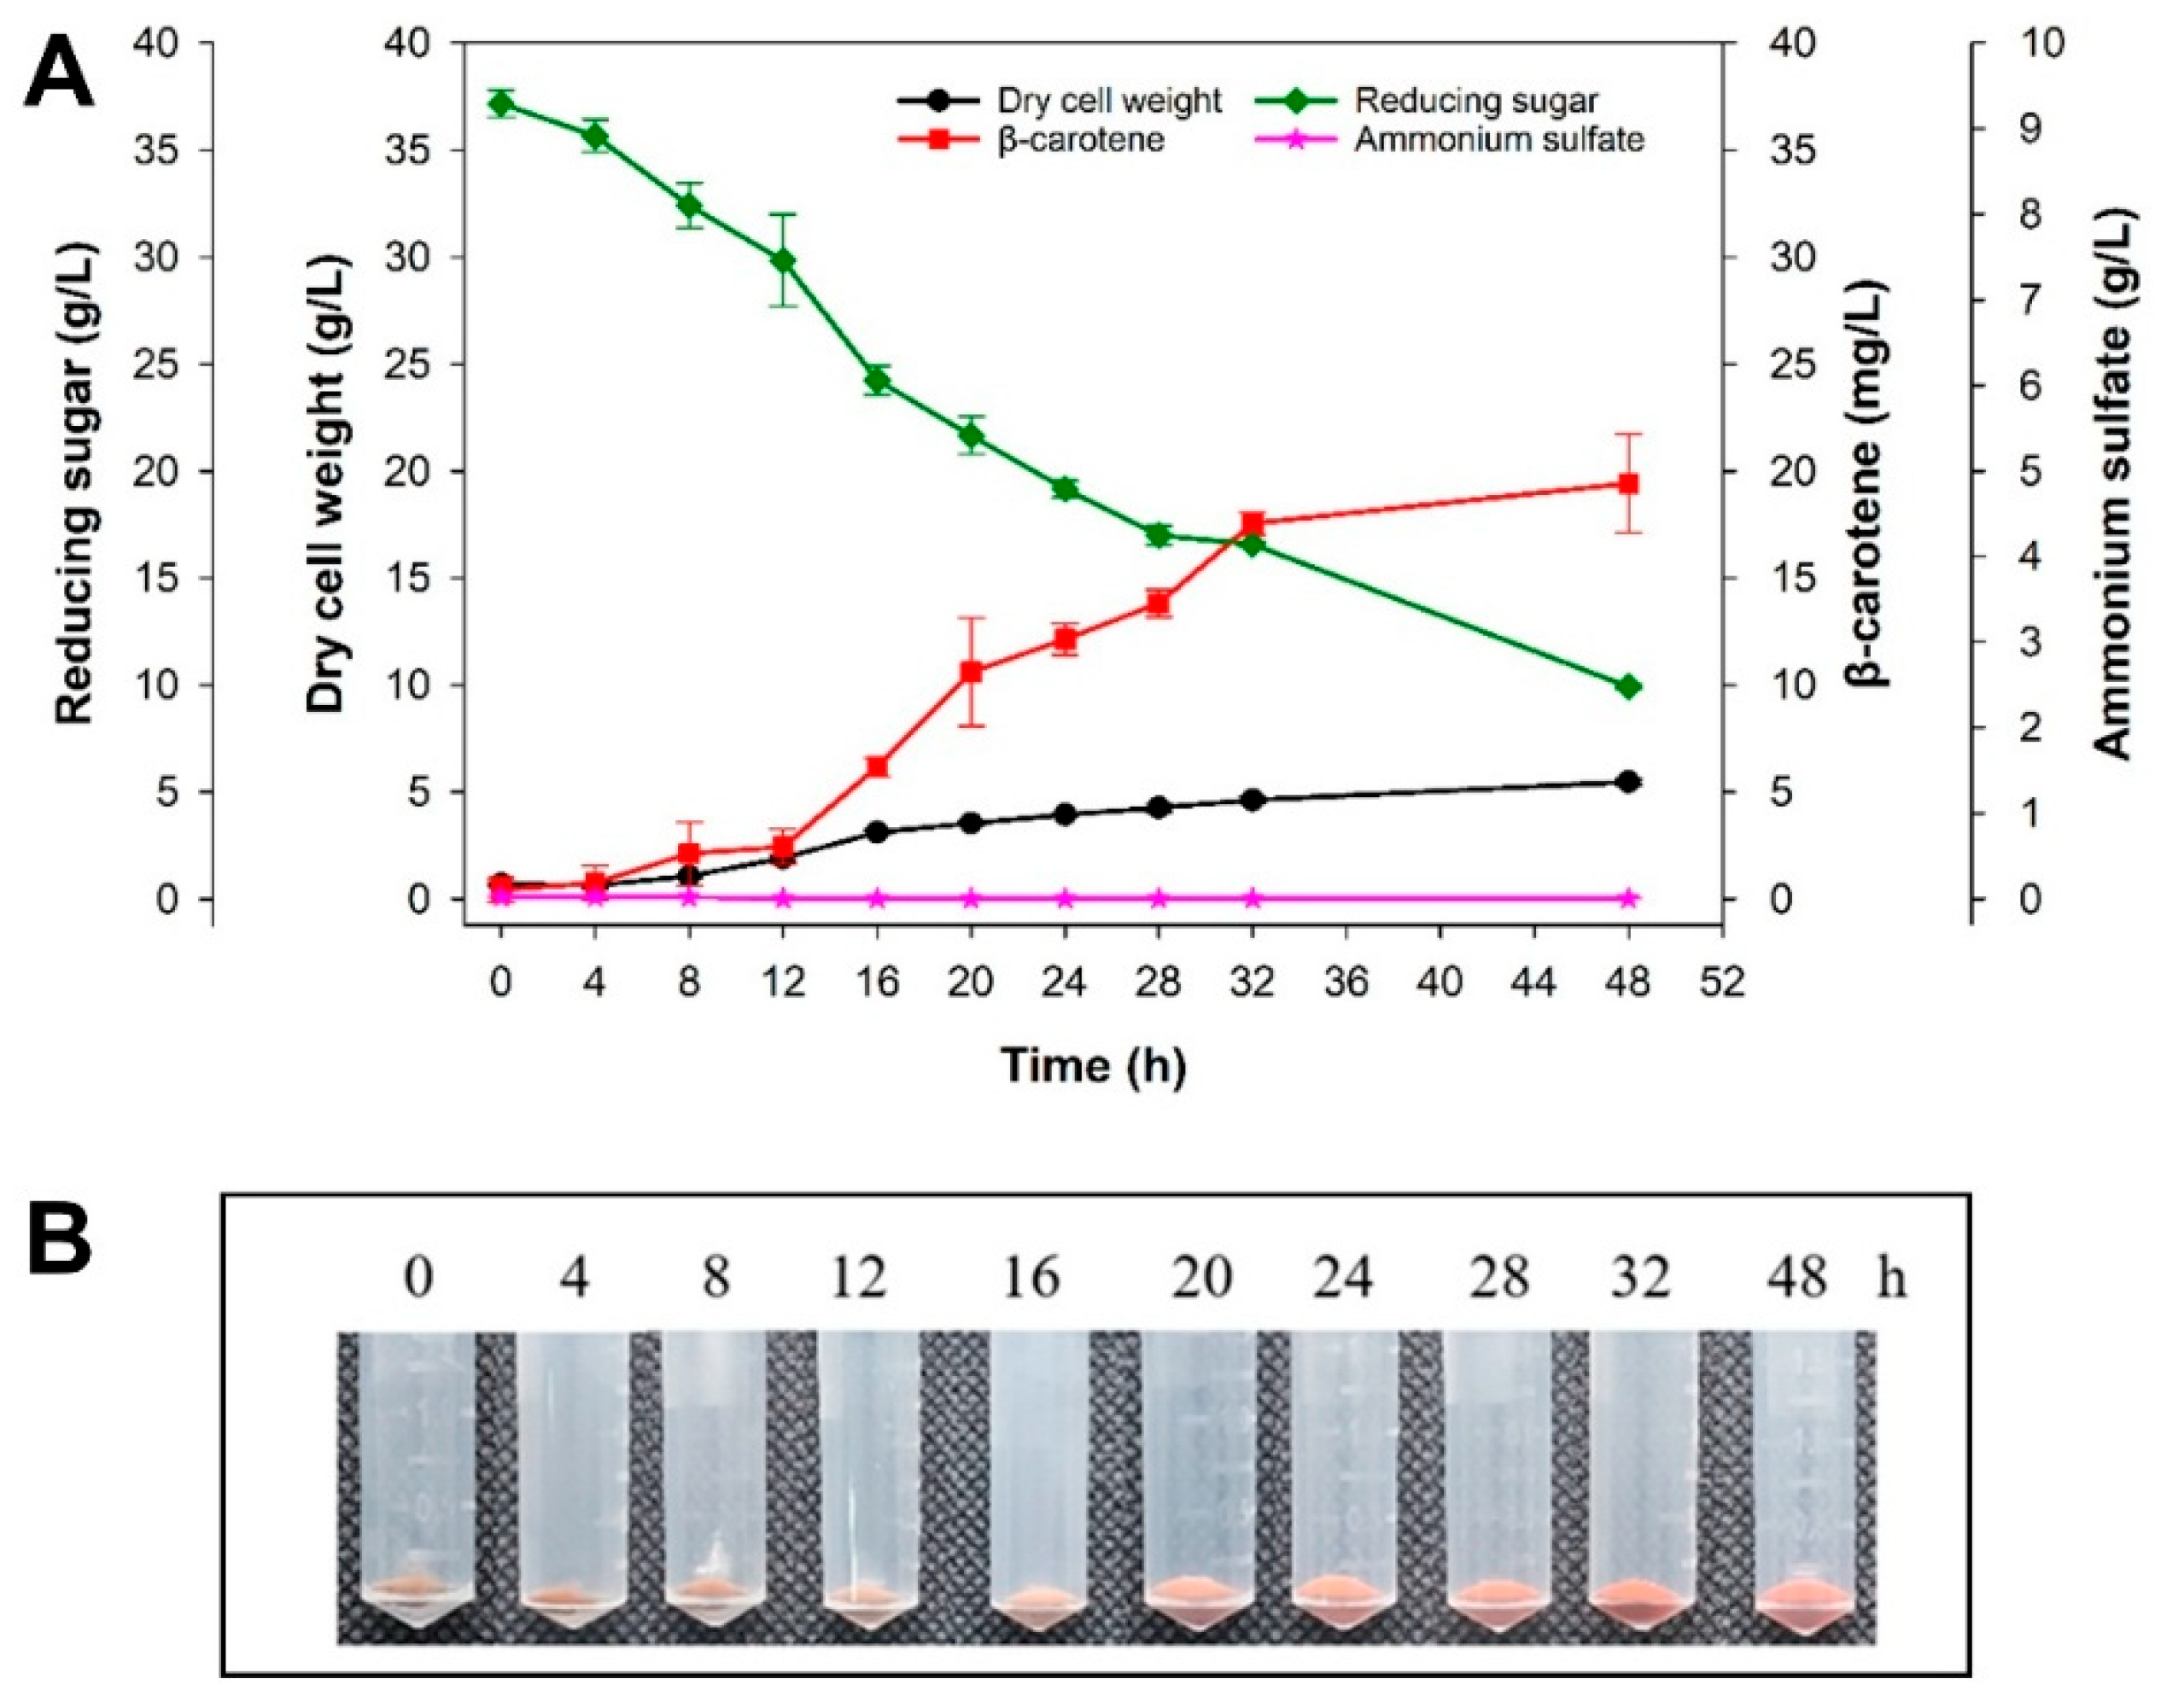
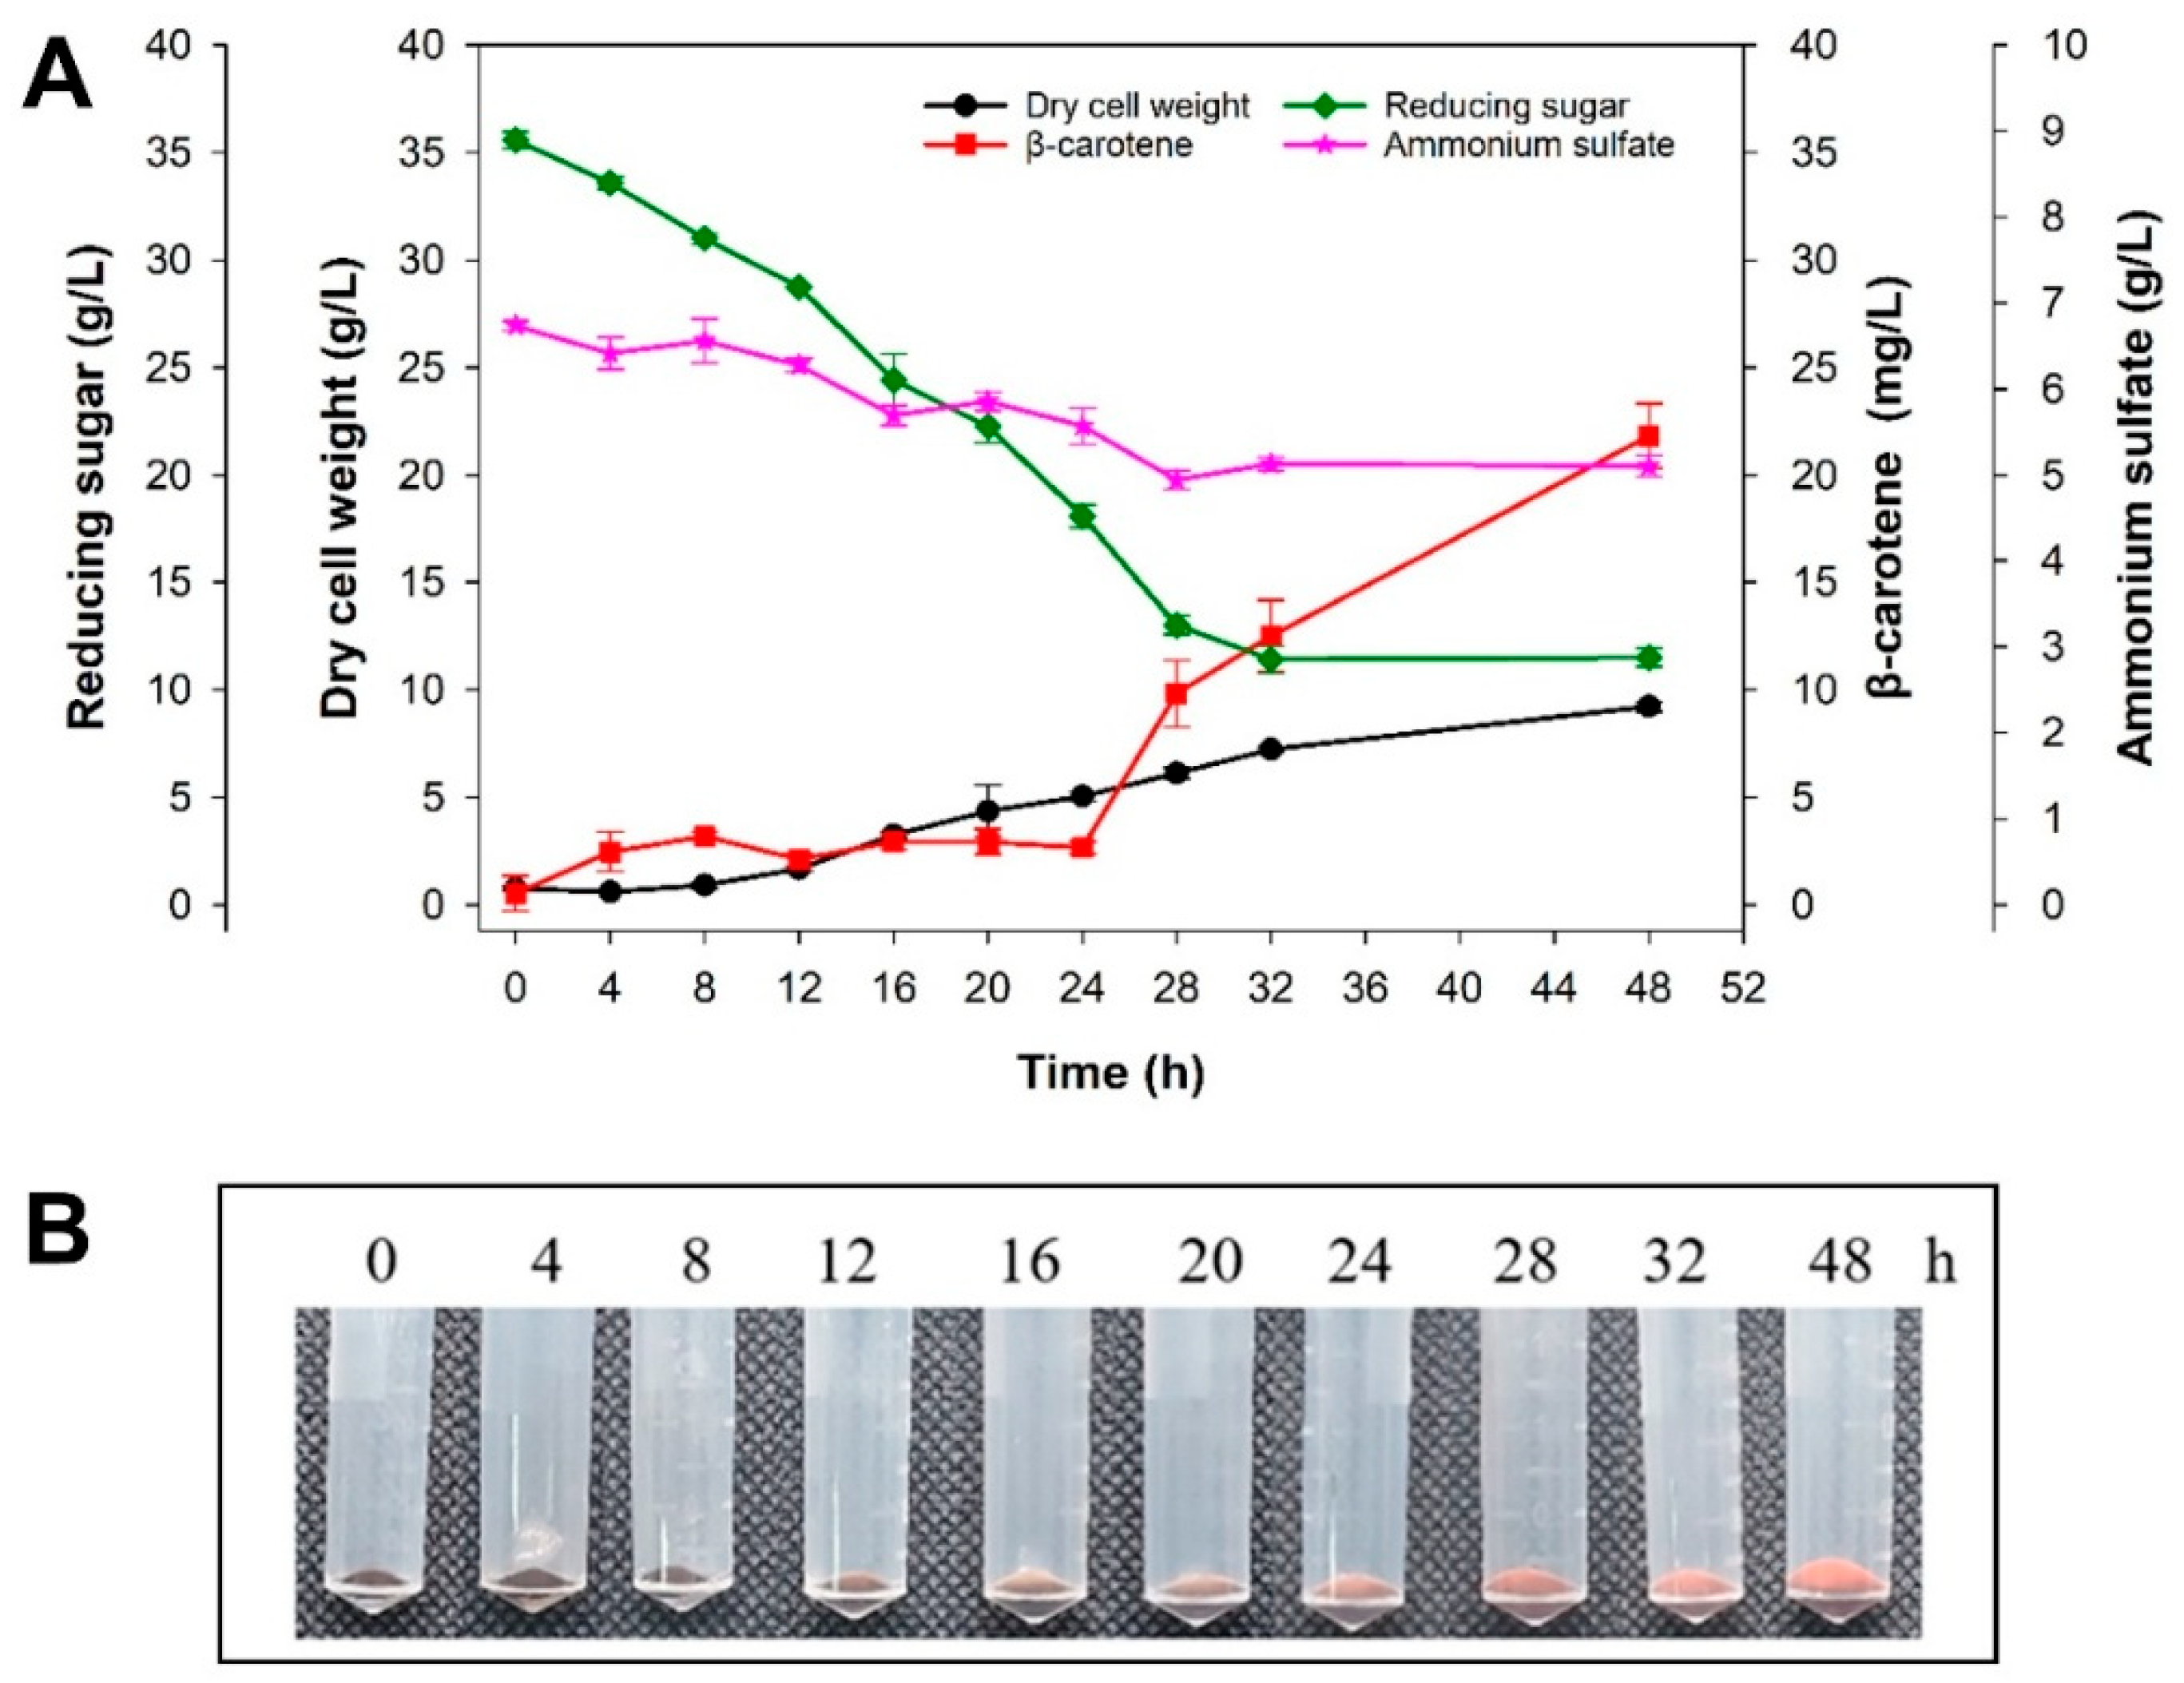
Batch cultivation of R. paludigena CM33 was conducted using G. fisheri hydrolysate with and without ammonium sulfate supplementation. Time-course profiles of dry cell weight, reducing sugar, β-carotene, and ammonium sulfate are shown in Figure 7 and Figure 8, and key kinetic and production parameters are summarized in Table 6.
In the absence of nitrogen supplementation (Figure 7), dry cell weight increased gradually over 48 h, reaching 5.47 ± 0.13 g/L (Table 6). Reducing sugar decreased continuously during cultivation, while β-carotene accumulated over time, reaching 19.43 ± 2.29 mg/L at 48 h (Table 6). Ammonium sulfate remained at negligible levels throughout the cultivation, consistent with the non-supplemented condition (Figure 7).
When the hydrolysate was supplemented with ammonium sulfate (6.2 g/L), biomass formation increased markedly (Figure 8), reaching 9.22 ± 0.23 g/L at 48 h, which was significantly higher than the non-supplemented condition (p < 0.001; Table 6). The specific growth rate also increased slightly (0.05 ± 0.00 h−1 vs. 0.04 ± 0.00 h−1, p = 0.025; Table 6). Sugar consumption proceeded rapidly during the early cultivation phase, and residual ammonium sulfate remained detectable throughout the run (Figure 8). β-carotene titer reached 21.82 ± 1.51 mg/L, which was not significantly different from the non-supplemented condition (p = 0.256; Table 6).
Yield and productivity metrics are summarized in Table 6. Supplementation significantly increased the biomass yield on substrate (Yx/s: 0.35 ± 0.01 g/g vs. 0.18 ± 0.01 g/g, p < 0.001) and volumetric biomass productivity (Qx: 0.18 ± 0.00 g/L·h vs. 0.10 ± 0.00 g/L·h, p < 0.001). For β-carotene, the yield on substrate (YP/s) increased from 0.70 ± 0.06 mg/g to 0.88 ± 0.04 mg/g (p = 0.011), whereas β-carotene yield on biomass (YP/x) decreased from 4.00 ± 0.59 mg/g to 2.52 ± 0.16 mg/g (p = 0.014). The volumetric β-carotene productivity (QP) was not significantly different between conditions (p = 0.132; Table 6).

3.5. Repeated-Batch Cultivation Performance on G. fisheri Hydrolysate

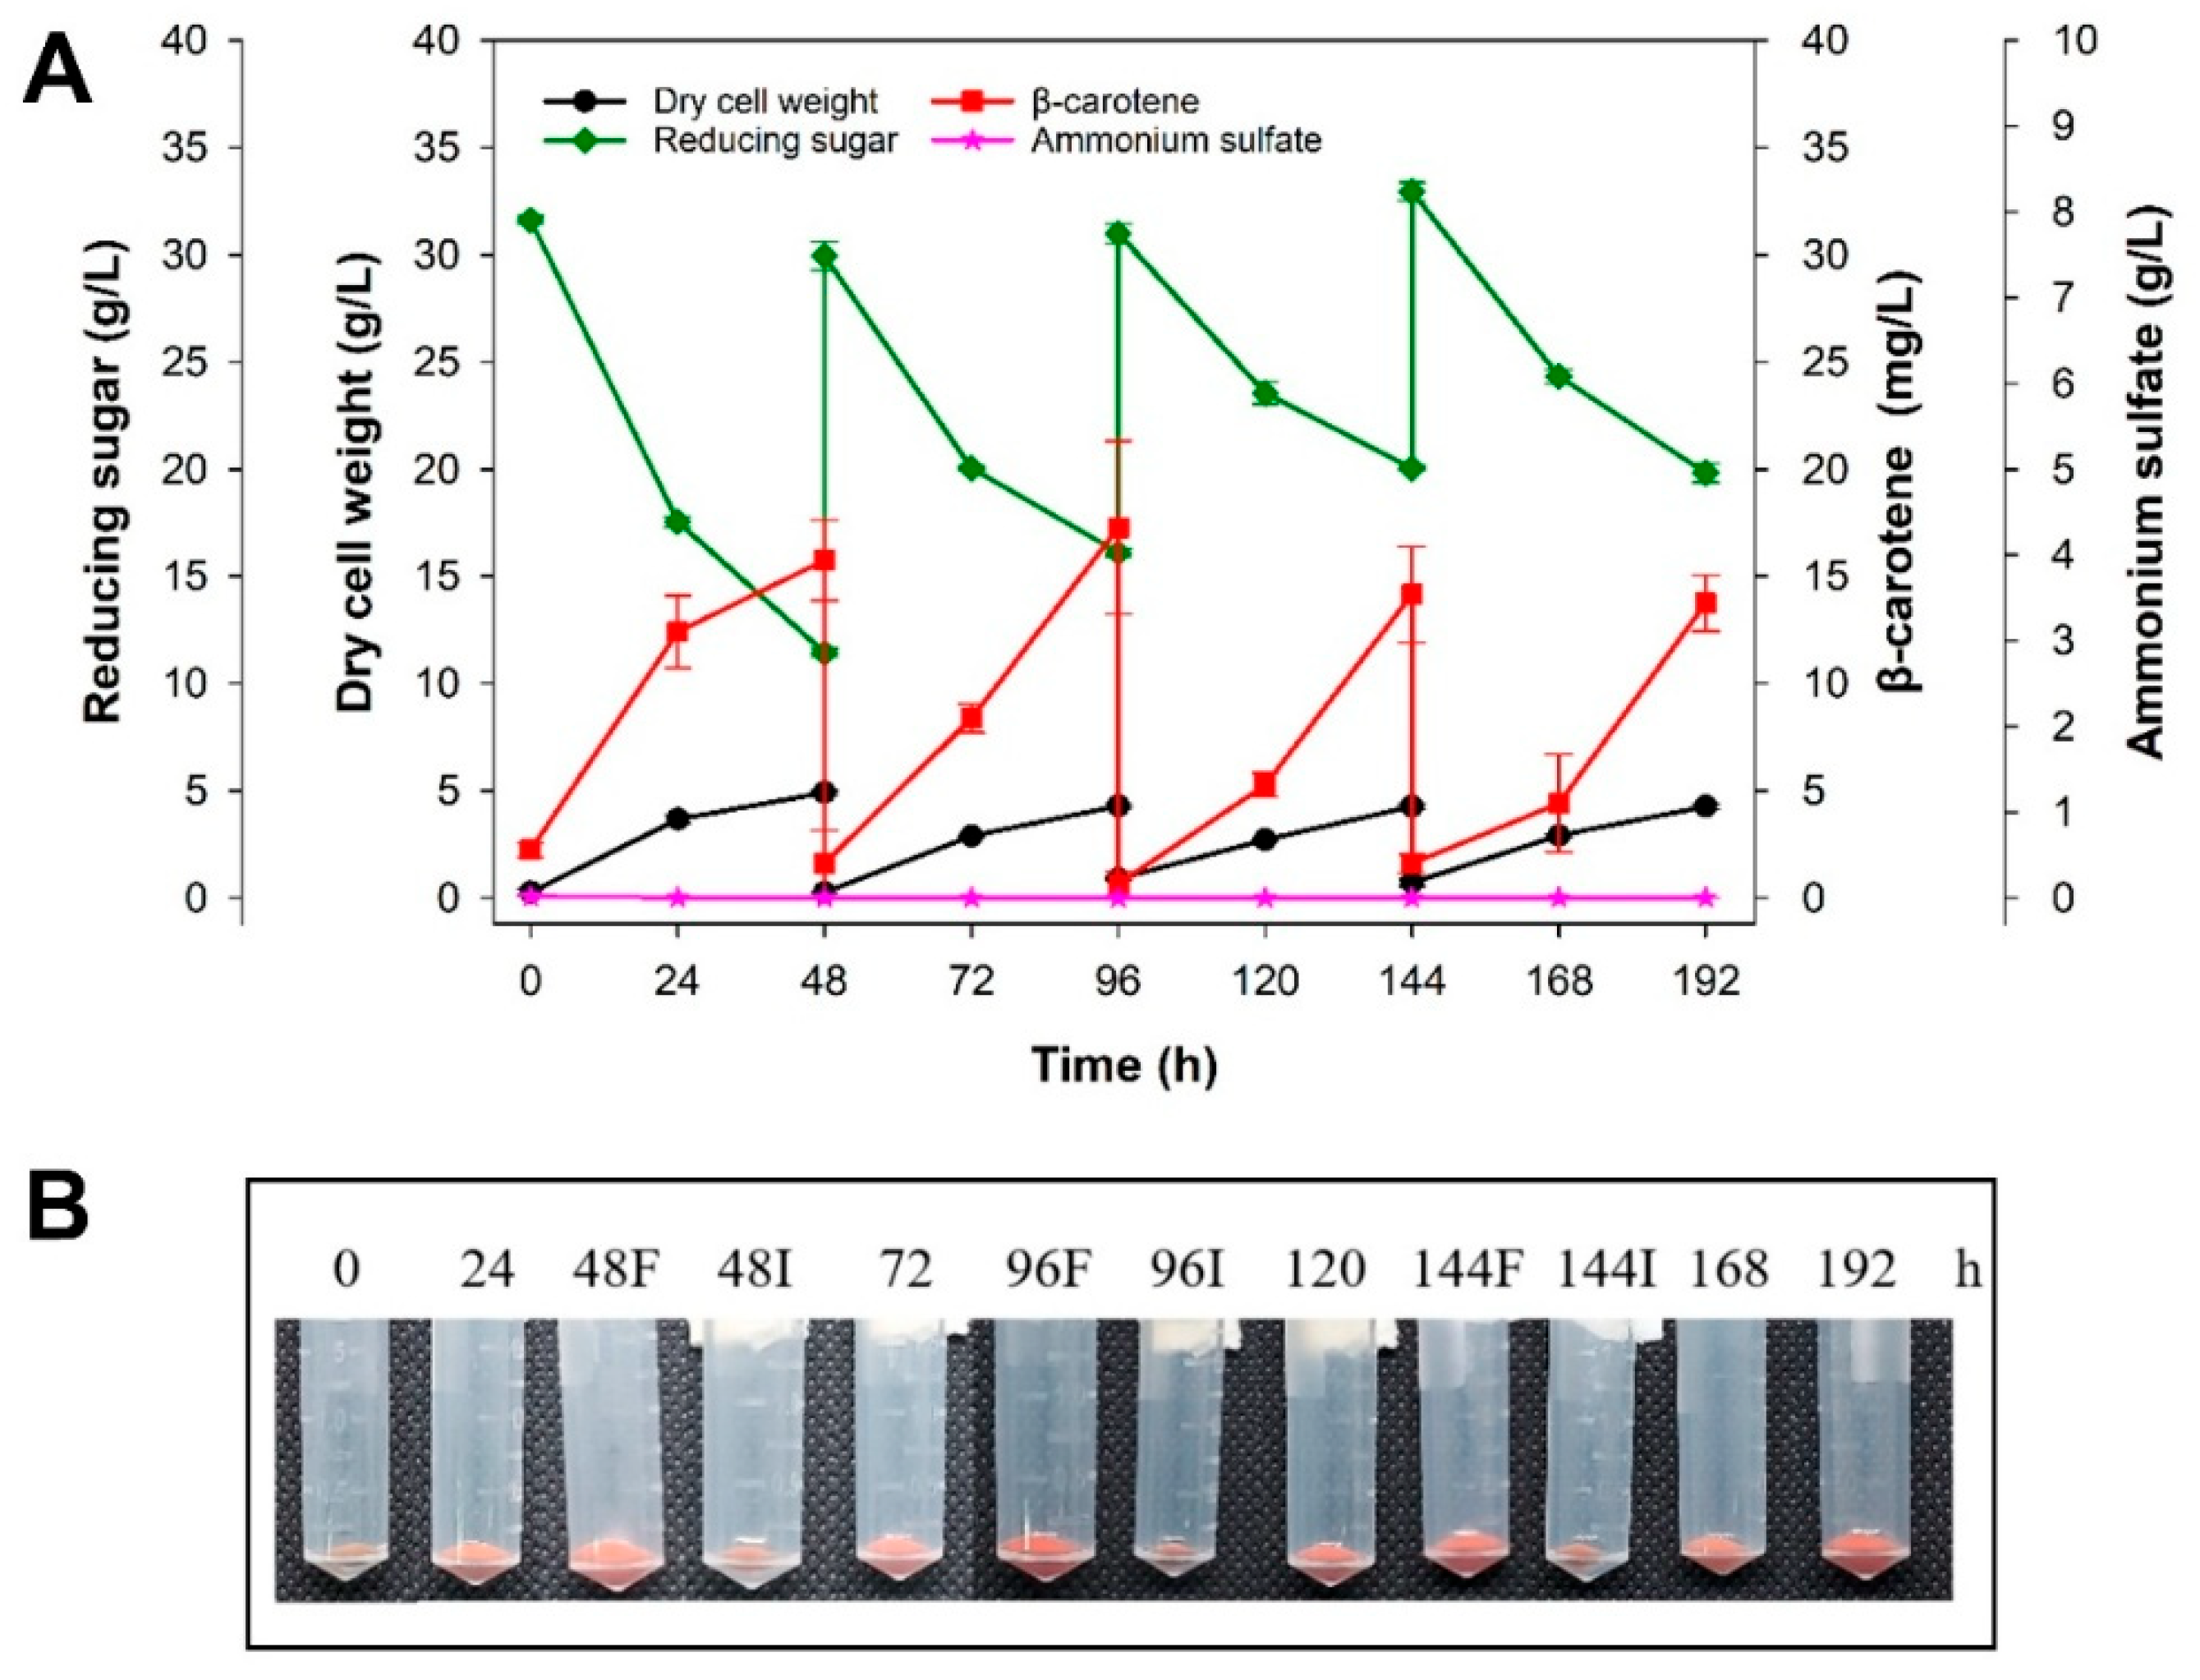
Repeated-batch cultivation of R. paludigena CM33 was performed on G. fisheri hydrolysate over four consecutive 48 H cycles. The time-course profiles of dry cell weight, reducing sugar, β-carotene, and ammonium sulfate during repeated-batch operation are shown in Figure 9, and the corresponding cycle-based performance parameters are summarized in Table 7.
Across the four cycles, biomass concentrations remained within a relatively narrow range, decreasing from 4.91 ± 0.10 g/L in Cycle 1 to 4.27 ± 0.13 g/L in Cycles 3–4 (Table 7). Reducing sugar concentration increased after medium replenishment at the start of each cycle and decreased during cultivation, showing repeated substrate consumption patterns throughout the repeated-batch operation (Figure 9A). β-carotene accumulated within each cycle (Figure 9A), with the highest β-carotene titer observed in Cycle 2 (17.27 ± 4.04 mg/L), followed by Cycle 1 (15.75 ± 1.88 mg/L), Cycle 3 (14.16 ± 2.22 mg/L), and Cycle 4 (13.75 ± 1.30 mg/L) (Table 7).
Yield and productivity metrics for each cycle are provided in Table 7. The biomass yield on substrate (Yx/s) ranged from 0.23 ± 0.01 g/g (Cycle 1) to 0.31 ± 0.03 g/g (Cycle 3). The β-carotene yield on substrate (YP/s) increased from 0.67 ± 0.12 mg/g in Cycle 1 to a maximum of 1.24 ± 0.28 mg/g in Cycle 3 and then decreased to 0.93 ± 0.19 mg/g in Cycle 4. The β-carotene content in biomass (YP/x) ranged from 2.92 ± 0.53 mg/g (Cycle 1) to 4.00 ± 0.84 mg/g (Cycle 3). Volumetric biomass productivity (Qx) decreased from 0.10 ± 0.00 g/L·h in Cycle 1 to 0.07 ± 0.00 g/L·h in Cycle 3 and 0.07 ± 0.01 g/L·h in Cycle 4, while volumetric β-carotene productivity (QP) ranged from 0.25 ± 0.03 to 0.33 ± 0.07 mg/L·h across cycles (Table 7).

4. Discussion

Reducing sugar release from de-extracted G. fisheri residual solids is strongly governed by the combined effects of reaction time, sulfuric acid concentration, and biomass loading. It should be noted that the DNS assay used in this study provides an estimate of total reducing sugars expressed as glucose equivalents and does not distinguish individual monosaccharides in the hydrolysate. The significant linear, interaction, and quadratic terms observed in the ANOVA (Table 4) indicate that sugar production is not controlled by a single factor but by the balance between severity and the availability of hydrolysable polysaccharides. Such curvature is consistent with the general behavior of acid hydrolysis of seaweed biomass, in which insufficient severity yields low sugar release, whereas excessive severity can promote sugar degradation and the formation of inhibitory by-products that may compromise subsequent bioconversion [13]. The model’s validity was supported by the close agreement between predicted and experimental sugar concentrations at the optimum condition (Table 5), suggesting that the quadratic model provides a reliable tool for selecting practical operating conditions within the studied domain. The predicted optimum (approximately 47 min, 2.5% H2SO4, and ~7% biomass loading) yielded ~22 g/L reducing sugars, with a small prediction–validation difference (% difference < 5; Table 5). Importantly, the optimum fell within the interior of the design space rather than at boundary levels, reinforcing that the process is governed by an inherent trade-off between enhanced polysaccharide depolymerization and diminishing returns at higher severities. For Gracilaria species, previous reports have shown that acid pretreatment can generate fermentable sugars and support ethanol fermentation [13,33], while also producing by-products such as levulinic acid and 5-hydroxymethylfurfural (HMF) under certain conditions [10,12,13]. In this context, the present RSM-guided selection offers a rational route to identify conditions that are both effective and operationally feasible.
A notable outcome was the further increase in reducing sugars during the subsequent cellulase-assisted step in the 22 L bioreactor, with sugar levels rising from roughly 30 g/L to ~40 g/L by the end of enzymatic hydrolysis (Figure 4). It is important to distinguish the effect of scale-up from that of the enzymatic step. The validated small-scale optimum yielded approximately 22 g/L reducing sugars, whereas after acid pretreatment in the 22 L bioreactor, the reducing sugar concentration was already approximately 30 g/L. This difference may be associated with scale-up-related process effects, particularly agitation and improved solids suspension in the controlled bioreactor environment. The subsequent increase from approximately 30 g/L to approximately 40 g/L is more appropriately attributed to the cellulase-assisted saccharification step. This supports the rationale that, even after optimized acid hydrolysis, a fraction of carbohydrate remains in enzyme-accessible forms that can be converted under milder conditions. Similar sequential approaches (physicochemical pretreatment followed by enzymatic hydrolysis) have been reported for Gracilaria biomass to improve reducing sugar production [17]. From a process perspective, the scale-up results also demonstrate that the selected conditions can be implemented under controlled pH and temperature profiles, supporting the feasibility of translating the workflow from small-scale RSM experiments to larger working volumes. Importantly, the sequential treatments were accompanied by clear chemical and structural changes in the residual solids, as evidenced by FTIR and SEM analyses. FTIR spectra showed noticeable differences across processing stages, particularly within the carbohydrate fingerprint region (~1200–800 cm−1; Figure 5) [34,35,36], indicating progressive modification of polysaccharide-associated functional groups during acid hydrolysis and subsequent enzymatic treatment. Consistently, SEM micrographs revealed a transition from an initially compact, layered morphology to a more disrupted and irregular surface after acid hydrolysis, followed by a markedly more porous and fragmented structure after cellulase-assisted hydrolysis (Figure 6). Together, these complementary observations support the process-level interpretation that the enzymatic step further deconstructs the carbohydrate matrix and enhances accessibility, consistent with the additional reducing sugar release observed at scale.
When R. paludigena CM33 was cultivated on the hydrolysate, ammonium sulfate supplementation significantly increased the final biomass concentration, specific growth rate, and biomass yield on sugar (Table 6), indicating that nitrogen availability was a key determinant of growth under these conditions. The ammonium sulfate level used in this study was selected based on a previous report [28]. Ammonium sulfate supplementation was examined here not as an essential medium component for β-carotene production, but to evaluate the effect of nitrogen availability on biomass formation and carotenoid accumulation in seaweed hydrolysate-based medium. Because nitrogen addition likely altered the medium C/N balance, this comparison was useful for assessing responses under relatively nitrogen-sufficient versus more nitrogen-limited conditions, which are known to influence growth and carotenoid accumulation in Rhodotorula [37,38]. In contrast, the β-carotene titer did not differ significantly between the supplemented and non-supplemented runs, although yield parameters suggested a shift in carbon partitioning. Although the overall reducing sugar depletion profile was not dramatically different between the two conditions, ammonium sulfate supplementation likely improved the efficiency with which consumed sugar was converted into biomass. This interpretation is supported by the higher specific growth rate, biomass yield on reducing sugar (Yx/s), and biomass productivity (Qx) observed under the supplemented condition (Table 6). In other words, improved nitrogen availability appears to have promoted biomass-associated biosynthesis and cell formation, leading to greater biomass accumulation without requiring a proportionally greater reduction in the measured total reducing sugar concentration. In particular, the β-carotene content per biomass (YP/x) decreased under nitrogen supplementation, which is consistent with the general observation that carotenoid accumulation is relatively favored under slower growth or nutrient limitation, whereas sufficient nitrogen primarily promotes biomass formation [37,38]. Although the hydrolysate supported CM33 growth, the biomass concentration achieved remained relatively low compared with batch cultivation using a defined glucose-based medium, which has been reported to yield approximately two-fold higher biomass than the best condition obtained in the present study [28]. This suggests that, beyond carbon and nitrogen, additional nutritional factors in the hydrolysate may limit growth. Therefore, supplementation with selected micronutrients or trace elements previously reported to influence yeast biomass formation and carotenoid biosynthesis may be required to further optimize biomass and β-carotene production on seaweed-derived hydrolysates [29]. Based on the higher β-carotene content per biomass (YP/x; Table 6), the hydrolysate without nitrogen supplementation was selected for repeated-batch operation to prioritize carotenoid-rich biomass production.
Repeated-batch operation maintained biomass concentrations within a relatively narrow range over four cycles, demonstrating that the hydrolysate-supported system can sustain repeated production without catastrophic performance loss. β-carotene titers and yields varied across cycles, with the highest β-carotene titer observed in Cycle 2 and a peak YP/s in Cycle 3 (Table 7). The decline in volumetric biomass productivity (Qx) over later cycles may reflect gradual changes in physiological state, accumulation of non-consumed components, or subtle shifts in medium composition following repeated replacement. Nevertheless, the maintained β-carotene productivity across cycles indicates that repeated batch can be a practical mode for improving operational efficiency by reducing downtime associated with full re-inoculation, while still enabling pigment accumulation within each cycle. Given the reported benefits of R. paludigena biomass as an aquaculture feed supplement [23,24,25], the repeated-batch results also support the feasibility of producing β-carotene-containing biomass from seaweed-derived hydrolysate streams in a semi-continuous manner.
A key contribution of this work is the integrated valorization concept: the spent biomass from a methanol-based bioactive extraction process [11] was further converted into fermentable sugars and upgraded to a high-value microbial product. This approach addresses a common limitation in seaweed bioactive extraction workflows, where extraction residues remain underutilized despite high carbohydrate content. By coupling upstream bioactive recovery with downstream carbohydrate conversion and microbial biomanufacturing, the overall value recovery from G. fisheri biomass can be improved, supporting circular bioeconomy and biorefinery objectives. While this study demonstrates robust sugar production and successful fermentation, future work could strengthen process understanding and industrial relevance by (i) profiling monosaccharide composition (e.g., galactose vs. glucose) to link seaweed polysaccharide chemistry to fermentation kinetics, (ii) quantifying potential inhibitory compounds (e.g., HMF/levulinic acid) to better define the severity–fermentability trade-off, and (iii) conducting techno-economic or mass-balance assessments to evaluate how the additional enzymatic step impacts overall process cost and sustainability. In addition, future work should also focus on improving volumetric β-carotene productivity through higher fermentable sugar availability, medium optimization, and fed-batch cultivation strategies. These efforts would further support the scale-up and application of seaweed spent biomass in integrated biorefinery settings.

5. Conclusions

To improve value recovery from seaweed bioactive extraction residues, this study developed a biorefinery-oriented workflow linking hydrolysate generation with carotenoid-rich yeast cultivation. RSM provided a robust basis for selecting practical acid hydrolysis conditions for de-extracted G. fisheri residual solids, which were successfully validated and scaled up to a 22 L bioreactor, where sequential acid–enzyme hydrolysis increased reducing sugar availability compared with acid hydrolysis alone. FTIR and SEM confirmed progressive modification and deconstruction of the spent biomass matrix across processing stages, supporting the observed enhancement in sugar release. In fermentation, nitrogen supplementation primarily promoted biomass formation, whereas nitrogen limitation favored higher β-carotene content per biomass, indicating that nutrient management can tune product profiles. Repeated-batch operation using non-supplemented hydrolysate sustained carotenoid-containing biomass production over four cycles, supporting the feasibility of semi-continuous processing. Overall, the proposed workflow offers a practical route to upgrade G. fisheri spent biomass into fermentable sugars and value-added carotenoid-rich yeast biomass.

Author Contributions

Conceptualization, C.K., S.C. and T.C.; methodology, C.K., S.C., P.P. and T.C.; validation, C.K., S.C., P.P., T.L., S.P., M.K.-C., A.P. and T.C.; formal analysis, C.K., C.T. and T.C.; investigation, C.K. and C.T.; resources, S.C. and T.C.; data curation, C.K., P.P., and T.C.; writing—original draft preparation, C.K. and T.C.; writing—review and editing, C.K., S.C., P.P., T.L., S.P., M.K.-C., A.P. and T.C.; visualization, C.K., S.C., C.T. and T.C.; supervision, T.C.; project administration, T.C.; funding acquisition, S.C., A.P. and T.C. All authors have read and agreed to the published version of the manuscript.

Funding

Chatchol Kongsinkaew was supported by the Scholarship for Research, Internationalization, and Education from Thammasat University for the academic year 2023 (Grant No. 10/2566). This research is supported by Thailand Science Research and Innovation (TSRI) Fundamental Fund, fiscal year 2026, Thammasat University (Contract No. TUFF 27/2569).

Institutional Review Board Statement

Not applicable.

Informed Consent Statement

Not applicable.

Data Availability Statement

The original contributions presented in this study are included in the article. Further inquiries can be directed to the corresponding author.

Acknowledgments

The authors gratefully acknowledge Amolrada Khamtool for her assistance with FTIR analysis.

Conflicts of Interest

The authors declare no conflicts of interest.

Abbreviations

The following abbreviations are used in this manuscript:
ANOVAAnalysis of variance
BBDBox–Behnken design
DMSODimethyl sulfoxide
DWDry weight
FTIRFourier transform infrared
HMFHydroxymethylfurfural
FPUFilter paper unit
RSMResponse surface methodology
SEMScanning electron microscopy
TSTotal solids
QPβ-carotene productivity (mg/L·h)
QxBiomass productivity (g/L·h) 
sReducing sugar (g/L)
tTime (h)
xDry biomass (g/L)
Yx/sBiomass yield on reducing sugar (g/g)
YP/sβ-carotene yield on reducing sugar (mg/g)
YP/xβ-carotene yield on dry biomass (mg/g)
μSpecific growth rate (h−1)

References

  1. Zhao, Y.; Bourgougnon, N.; Lanoisellé, J.-L.; Lendormi, T. Biofuel production from seaweeds: A comprehensive review. Energies 2022, 15, 9395. [Google Scholar] [CrossRef]
  2. Soares Dias, A.P.; Rijo, B.; Santos, F.; Galhano dos Santos, R.; Frade, T. Overview on biofuels production in a seaweed biorefinery. Sci. Total Environ. 2023, 884, 163714. [Google Scholar] [CrossRef] [PubMed]
  3. Pravin, R.; Baskar, G.; Rokhum, S.L.; Pugazhendhi, A. Comprehensive assessment of biorefinery potential for biofuels production from macroalgal biomass: Towards a sustainable circular bioeconomy and greener future. Chemosphere 2023, 339, 139724. [Google Scholar] [CrossRef] [PubMed]
  4. Choudhary, B.; Chauhan, O.P.; Mishra, A. Edible seaweeds: A potential novel source of bioactive metabolites and nutraceuticals with human health benefits. Front. Mar. Sci. 2021, 8, 740054. [Google Scholar] [CrossRef]
  5. Thong-olran, A.; Napiroon, T.; Jaikaew, P.; Kongkiatpaiboon, S.; Tayana, N.; Wichachucherd, B.; Bacher, M.; Charoenrat, T.; Chittapun, S. Erucic acid from Sargassum polycystum: In silico and in vitro insights into a marine-derived skin-compatible compound. Algal Res. 2026, 95, 104604. [Google Scholar] [CrossRef]
  6. Yanagisawa, M.; Nakamura, K.; Ariga, O.; Nakasaki, K. Production of high concentrations of bioethanol from seaweeds that contain easily hydrolyzable polysaccharides. Process Biochem. 2011, 46, 2111–2116. [Google Scholar] [CrossRef]
  7. Torres, P.; Santos, J.P.; Chow, F.; dos Santos, D.Y.A.C. A comprehensive review of traditional uses, bioactivity potential, and chemical diversity of the genus Gracilaria (Gracilariales, Rhodophyta). Algal Res. 2019, 37, 288–306. [Google Scholar] [CrossRef]
  8. Kumar, S.; Gupta, R.; Kumar, G.; Sahoo, D.; Kuhad, R.C. Bioethanol production from Gracilaria verrucosa, a red alga, in a biorefinery approach. Bioresour. Technol. 2013, 135, 150–156. [Google Scholar] [CrossRef]
  9. Zakaria, N.Z.I.; Zhen, A.; Mohd Hassan, S.A.; Zakaria, Z. Optimization on fermentation of seaweed (Gracilaria sp.) as feedstock for bioethanol production by Saccharomyces cerevisiae. IOP Conf. Ser. Mater. Sci. Eng. 2020, 932, 012020. [Google Scholar] [CrossRef]
  10. Nunraksa, N.; Rattanasansri, S.; Praiboon, J.; Chirapart, A. Proximate composition and the production of fermentable sugars, levulinic acid, and HMF from Gracilaria fisheri and Gracilaria tenuistipitata cultivated in earthen ponds. J. Appl. Phycol. 2019, 31, 683–690. [Google Scholar] [CrossRef]
  11. Thong-olran, A.; Sermsakulwat, S.; Napiroon, T.; Jaikaew, P.; Kongkiatpaiboon, S.; Tayana, N.; Wichachucherd, B.; Charoenrat, T.; Traijitt, T.; Chittapun, S. Seaweed-derived bioactives with anti-tyrosinase activity: A potential for skin-whitening cosmetics with in silico and in vitro approaches. Biotechnol. Rep. 2025, 47, e00910. [Google Scholar] [CrossRef] [PubMed]
  12. Jeong, G.T.; Park, D.H. Production of sugars and levulinic acid from marine biomass Gelidium amansii. Appl. Biochem. Biotechnol. 2010, 161, 41–52. [Google Scholar] [CrossRef] [PubMed]
  13. Nunraksa, N.; Rattanasaensri, S.; Praiboon, J.; Chirapart, A. Comparison of ethanol production from Gracilaria fisheri and Gracilaria tenuistipitata cultivated in aquaculture system in Thailand. J. Appl. Phycol. 2018, 30, 3319–3325. [Google Scholar] [CrossRef]
  14. Siew Ling, H.; Lip, K.-F.; Loh, Y.-T.; Wong, C.-L. Statistical optimization of fermentable sugar extraction from the Malaysian brown alga Sargassum binderi. J. Appl. Phycol. 2014, 27, 2089–2098. [Google Scholar] [CrossRef]
  15. Dave, N.; Varadavenkatesan, T.; Singh, R.S.; Giri, B.S.; Selvaraj, R.; Vinayagam, R. Evaluation of seasonal variation and the optimization of reducing sugar extraction from Ulva prolifera biomass using thermochemical method. Environ. Sci. Pollut. Res. Int. 2021, 28, 58857–58871. [Google Scholar] [CrossRef]
  16. De la Lama-Calvente, D.; Fernández-Rodríguez, M.J.; Garrido-Fernández, A.; Borja, R. Process optimization of the extraction of reducing sugars and total phenolic compounds from the invasive alga Rugulopteryx okamurae by response surface methodology (RSM). Algal Res. 2024, 80, 103500. [Google Scholar] [CrossRef]
  17. Park, M.-R.; Jeong, G.-T. Production of reducing sugar in Gracilaria verrucosa using physio-chemical pretreatment and subsequent enzymatic hydrolysis. Algal Res. 2021, 60, 102531. [Google Scholar] [CrossRef]
  18. Kulczyk-Małysa, E.; Bogusławska-Wąs, E. Carotenoid yeasts and their application potential. Foods 2025, 14, 1866. [Google Scholar] [CrossRef]
  19. González-Peña, M.A.; Ortega-Regules, A.E.; Anaya de Parrodi, C.; Lozada-Ramírez, J.D. Chemistry, occurrence, properties, applications, and encapsulation of carotenoids—A review. Plants 2023, 12, 313. [Google Scholar] [CrossRef]
  20. Joshi, K.; Kumar, P.; Kataria, R. Microbial carotenoid production and their potential applications as antioxidants: A current update. Process Biochem. 2023, 128, 190–205. [Google Scholar] [CrossRef]
  21. Martínez-Cámara, S.; Ibañez, A.; Rubio, S.; Barreiro, C.; Barredo, J.-L. Main carotenoids produced by microorganisms. Encyclopedia 2021, 1, 1223–1245. [Google Scholar] [CrossRef]
  22. Swapnil, P.; Meena, M.; Singh, S.K.; Dhuldhaj, U.P.; Harish; Marwal, A. Vital roles of carotenoids in plants and humans to deteriorate stress with its structure, biosynthesis, metabolic engineering and functional aspects. Curr. Plant Biol. 2021, 26, 100203. [Google Scholar] [CrossRef]
  23. Sriphuttha, C.; Limkul, S.; Pongsetkul, J.; Phiwthong, T.; Massu, A.; Sumniangyen, N.; Boontawan, P.; Ketudat-Cairns, M.; Boontawan, A.; Boonchuen, P. Effect of fed dietary yeast (Rhodotorula paludigena CM33) on shrimp growth, gene expression, intestinal microbial, disease resistance, and meat composition of Litopenaeus vannamei. Dev. Comp. Immunol. 2023, 147, 104896. [Google Scholar] [CrossRef] [PubMed]
  24. Kaewda, J.; Sangsawad, P.; Boonanuntanasarn, S.; Manassila, P.; Boontawan, A.; Ketudat-Cairns, M.; Sriphuttha, C.; Nakharuthai, C. Effects of probiotics red yeast Rhodotorula paludigena CM33 on enhancing color pigmentation, antioxidant activity, immune response, intestinal microbiota, and growth in a commercial ornamental fish: Flowerhorn fish. Aquac. Rep. 2025, 40, 102609. [Google Scholar] [CrossRef]
  25. Rekha, R.; Nimsi, K.A.; Manjusha, K.; Sirajudheen, T.K. Marine yeast Rhodotorula paludigena VA 242 a pigment enhancing feed additive for the Ornamental Fish Koi Carp. Aquac. Fish. 2024, 9, 66–70. [Google Scholar] [CrossRef]
  26. Gosalawit, C.; Imsoonthornruksa, S.; Udomsil, N.; Ketudat-Cairns, M. Genome sequence of the oleaginous yeast Rhodotorula paludigena strain CM33, a potential strain for biofuel production. Microbiol. Resour. Announc. 2020, 9, e00286-20. [Google Scholar] [CrossRef] [PubMed]
  27. Kongsinkaew, C.; Chisti, Y.; Ketudat-Cairns, M.; Chittapun, S.; Pornpukdeewattana, S.; Charoenrat, T. Fed-batch strategies for growing β-carotene enriched yeast Rhodotorula paludigena using untreated molasses. Biocatal. Agric. Biotechnol. 2025, 69, 103750. [Google Scholar] [CrossRef]
  28. Thumkasem, N.; On-mee, T.; Chittapun, S.; Pornpukdeewattana, S.; Ketudat-Cairns, M.; Thongprajukaew, K.; Antimanon, S.; Charoenrat, T. Rhodotorula paludigena CM33 cultivation process development for high β-carotene single cell protein production. Biocatal. Agric. Biotechnol. 2023, 54, 102926. [Google Scholar] [CrossRef]
  29. Thumkasem, N.; On-mee, T.; Kongsinkaew, C.; Chittapun, S.; Pornpukdeewattana, S.; Ketudat-Cairns, M.; Thongprajukaew, K.; Antimanon, S.; Charoenrat, T. Enhanced high β-carotene yeast cell production by Rhodotorula paludigena CM33 and in vitro digestibility in aquatic animals. Sci. Rep. 2024, 14, 9188. [Google Scholar] [CrossRef]
  30. Sriphuttha, C.; Boontawan, P.; Boonyanan, P.; Ketudat-Cairns, M.; Boontawan, A. Simultaneous lipid and carotenoid production via Rhodotorula paludigena CM33 using crude glycerol as the main substrate: Pilot-scale experiments. Int. J. Mol. Sci. 2023, 24, 17192. [Google Scholar] [CrossRef]
  31. Gosalawit, C.; Imsoonthornruksa, S.; Gilroyed, B.H.; McNea, L.; Boontawan, A.; Ketudat-Cairns, M. The potential of the oleaginous yeast Rhodotorula paludigena CM33 to produce biolipids. J. Biotechnol. 2021, 329, 56–64. [Google Scholar] [CrossRef]
  32. Miller, G.L. Use of dinitrosalicylic acid reagent for determination of reducing sugar. Anal. Chem. 1959, 31, 426–428. [Google Scholar] [CrossRef]
  33. Sukwong, P.; Sunwoo, I.Y.; Jeong, D.Y.; Kim, S.R.; Jeong, G.-T.; Kim, S.-K. Improvement of bioethanol production by Saccharomyces cerevisiae through the deletion of GLK1, MIG1 and MIG2 and overexpression of PGM2 using the red seaweed Gracilaria verrucosa. Process Biochem. 2020, 89, 134–145. [Google Scholar] [CrossRef]
  34. Praiboon, J.; Chirapart, A.; Akakabe, Y.; Bhumibhamon, O.; Kajiwara, T. Physical and chemical characterization of agar polysaccharides extracted from the Thai and Japanese species of Gracilaria. ScienceAsia 2006, 32, 11–17. [Google Scholar] [CrossRef]
  35. Cerná, M.; Barros, A.; Nunes, A.; Rocha, S.; Delgadillo, I.; Copíková, J.; Coimbra, M. Use of FT-IR spectroscopy as a tool for the analysis of polysaccharide food additives. Carbohydr. Polym. 2003, 51, 383–389. [Google Scholar] [CrossRef]
  36. Trivedi, T.; Srivastava, D.; Rogers, R.; Kumar, A. Agarose processing in protic and mixed protic-aprotic ionic liquids: Dissolution, regeneration and high conductivity, high strength ionogels. Green Chem. 2012, 14, 2831–2839. [Google Scholar] [CrossRef]
  37. Braunwald, T.; Schwemmlein, L.; Graeff-Hönninger, S.; French, W.T.; Hernandez, R.; Holmes, W.E.; Claupein, W. Effect of different C/N ratios on carotenoid and lipid production by Rhodotorula glutinis. Appl. Microbiol. Biotechnol. 2013, 97, 6581–6588. [Google Scholar] [CrossRef] [PubMed]
  38. Lopes, H.J.S.; Bonturi, N.; Kerkhoven, E.J.; Miranda, E.A.; Lahtvee, P.J. C/N ratio and carbon source-dependent lipid production profiling in Rhodotorula toruloides. Appl. Microbiol. Biotechnol. 2020, 104, 2639–2649. [Google Scholar] [CrossRef]
Figure 1. Integrated biorefinery workflow for valorization of Gracilaria fisheri biomass into bioactive fractions and fermentable sugars for yeast fermentation. The de-extracted residual solids (spent biomass) were obtained from a previous study [11] and subsequently used in this work for acid and enzymatic hydrolysis, followed by batch and repeated-batch fermentation.
Fermentation 12 00210 g001
Figure 2. 3D response surface plots (AC) and corresponding contour plots (DF) showing the effects of interactions on reducing sugar concentration. (A,D) depict the interaction between reaction time and sulfuric acid concentration, (B,E) show the interaction between reaction time and biomass, and (C,F) illustrate the interaction between sulfuric acid concentration and biomass. The color gradient from blue to red represents increasing predicted reducing sugar concentration, the contour lines indicate equal predicted response levels, and the red circles represent the design points.
Fermentation 12 00210 g002
Figure 3. Numerical initial optimization conditions for reducing sugar based on response surface methodology.
Fermentation 12 00210 g003
Figure 4. Time-course profiles of temperature, pH, agitation speed, and reducing sugar concentration during scale-up hydrolysis of de-extracted G. fisheri residual biomass in a 22 L bioreactor. The process was initiated by heating to 90 °C for acid hydrolysis, followed by cooling to 50 °C and adjusting pH to 5.0 prior to cellulase-assisted hydrolysis. Reducing sugar concentrations (g/L) are shown as mean ± SD (n = 3).
Fermentation 12 00210 g004
Figure 5. Fourier transform infrared (FTIR) spectra of G. fisheri biomass at different processing stages: (a) initial biomass, (b) acid-hydrolyzed biomass after pH adjustment to 5.0 in the bioreactor, and (c) biomass after cellulase-assisted hydrolysis followed by enzyme inactivation at 90 °C. The shaded area indicates the carbohydrate fingerprint region (approximately 1200–800 cm−1), where C–O and C–O–C vibrations of polysaccharides are typically observed. Spectra are presented as transmittance (%) versus wavenumber (cm−1). Spectra are vertically offset for clarity.
Fermentation 12 00210 g005
Figure 6. Scanning electron microscopy (SEM) images of G. fisheri biomass at different processing stages. (A,D,G) initial biomass; (B,E,H) acid-hydrolyzed biomass after pH adjustment to 5.0 in the bioreactor; and (C,F,I) biomass after cellulase-assisted hydrolysis followed by enzyme inactivation at 90 °C. Images are shown at three magnifications: 100 µm (AC), 10 µm (DF), and 5 µm (GI).
Fermentation 12 00210 g006
Figure 7. Batch cultivation of R. paludigena CM33 using G. fisheri hydrolysate without nitrogen supplementation. (A) Time-course profiles of dry cell weight, reducing sugar concentration, β-carotene concentration, and ammonium sulfate concentration during 48 h cultivation. (B) Representative images of cell pellets collected at the indicated time points. Values are presented as mean ± SD (n = 3).
Fermentation 12 00210 g007
Figure 8. Batch cultivation of R. paludigena CM33 using G. fisheri hydrolysate supplemented with ammonium sulfate (6.2 g/L). (A) Time-course profiles of dry cell weight, reducing sugar concentration, β-carotene concentration, and ammonium sulfate concentration during 48 h cultivation. (B) Representative images of cell pellets collected at the indicated time points. Values are presented as mean ± SD (n = 3).
Fermentation 12 00210 g008
Figure 9. Repeated-batch cultivation of R. paludigena CM33 on G. fisheri hydrolysate. (A) Time-course profiles of dry cell weight, reducing sugar concentration, β-carotene concentration, and ammonium sulfate concentration over four consecutive 48 H cycles. Points labeled “F” indicate the end of each cycle (final time point), whereas points labeled “I” indicate the start of the subsequent cycle immediately after medium replacement (initial time point). (B) Representative images of cell pellets collected at the indicated time points. Values are presented as mean ± SD (n = 3).
Fermentation 12 00210 g009
Table 1. Reported carbohydrate-related composition of Gracilaria fisheri biomass from Thailand [10].
CompositionValues
Cellulose (% DW)6.80
Hemicellulose (% DW)57.71
Lignin (% DW)1.60 
Table 2. The variables and levels for optimizing the factors affecting the reducing sugar production using the Box–Behnken design.
VariablesCodeLevels of Each Factor
−10+1
Time (min)A03060
Sulfuric acid % (w/v)B01.53
Biomass % (w/v)C159
Table 3. Experimental design and responses on reducing sugar.
RunsFactorsResponse
Time (min)Sulfuric Acid
% (w/v)
Biomass
% (w/v)
Reducing Sugar (g/L)
160050.15 ± 0.00
2301.5512.51 ± 0.04
301.590.01 ± 0.00
40050.00 ± 0.00
501.510.00 ± 0.00
630090.24 ± 0.01
7601.513.53 ± 0.06
80350.08 ± 0.01
930310.00 ± 0.00
10601.5921.78 ± 1.07
11301.5515.69 ± 0.39
12301.5513.07 ± 0.44
13301.5514.98 ± 0.30
14603514.00 ± 0.33
15303922.00 ± 0.88
1630010.01 ± 0.01
17301.5515.16 ± 0.73
Data are presented as mean ± standard deviation (n = 3).
Table 4. Analysis of variance for the quadratic regression model of reducing sugar concentration.
SourceSum of SquaresdfMean SquareF-Valuep-Value
Model1117.609124.1826.160.0001
A-Time193.751193.7540.820.0004
B-Sulfuric acid159.131159.1333.520.0007
C-Biomass204.931204.9343.170.0003
AB47.40147.409.990.0159
AC83.17183.1717.520.0041
BC118.481118.4824.960.0016
A2104.361104.3621.990.0022
B2139.021139.0229.290.0010
C237.23137.237.840.0265
Residual33.2374.75  
Lack of Fit25.3838.464.310.0960
Pure Error7.8541.96  
Cor Total1150.8316   
p-value less than 0.0500 indicates model terms are significant. Regression analysis resulted in R2 = 0.9711; Adjusted R2 = 0.9340.
Table 5. Optimum conditions and response variables from prediction and actual experiment.
Variable FactorsOptimum ValueReducing Sugar (g/L)Difference (%)
ActualPredict
Time (min)47.3922.22 ± 0.19 22.410.85
Sulfuric acid % (w/v)2.50
Biomass % (w/v)7.13
Data are presented as the mean ± standard deviation (n = 3).
Table 6. Batch fermentation performance of R. paludigena CM33 on G. fisheri hydrolysate under two nitrogen conditions.
ParametersHydrolysate
(No N Added)
Hydrolysate + (NH4)2SO4 (6.2 g/L)p-Value
Biomass (g/L)5.47 ± 0.139.22 ± 0.23<0.001
β-carotene (mg/L)19.43 ± 2.2921.82 ± 1.510.256
Specific growth rate (h−1)0.04 ± 0.000.05 ± 0.000.025
Yx/s (g/g)0.18 ± 0.010.35 ± 0.01<0.001
YP/s (mg/g)0.70 ± 0.060.88 ± 0.040.011
YP/x (mg/g)4.00 ± 0.592.52 ± 0.160.014
Qx (g/L·h)0.10 ± 0.000.18 ± 0.00<0.001
QP (mg/L·h)0.40 ± 0.040.44 ± 0.020.132
Data are presented as the mean ± standard deviation (n = 3). p-values were determined by Student’s t-test.
Table 7. Performance of repeated-batch cultivation of R. paludigena CM33 on G. fisheri hydrolysate over four cycles.
ParametersRepeated-Batch
Cycle 1Cycle 2Cycle 3Cycle 4
Biomass (g/L)4.91 ± 0.104.29 ± 0.104.27 ± 0.134.27 ± 0.13
β-carotene (mg/L)15.75 ± 1.8817.27 ± 4.0414.16 ± 2.2213.75 ± 1.30
Yx/s (g/g)0.23 ± 0.010.29 ± 0.030.31 ± 0.030.27 ± 0.04
YP/s (mg/g)0.67 ± 0.121.13 ± 0.181.24 ± 0.280.93 ± 0.19
YP/x (mg/g)2.92 ± 0.533.90 ± 0.834.00 ± 0.843.42 ± 0.40
Qx (g/L·h)0.10 ± 0.000.08 ± 0.000.07 ± 0.000.07 ± 0.01
QP (mg/L·h)0.28 ± 0.040.33 ± 0.070.28 ± 0.060.25 ± 0.03
Time (h)48484848
Data are presented as mean ± standard deviation (n = 3).
Disclaimer/Publisher’s Note: The statements, opinions and data contained in all publications are solely those of the individual author(s) and contributor(s) and not of MDPI and/or the editor(s). MDPI and/or the editor(s) disclaim responsibility for any injury to people or property resulting from any ideas, methods, instructions or products referred to in the content.