Article

Study on Microbial Diversity and Product Quality of Corn Gluten Meal-Based Fermented Feed

1
Heilongjiang Provincial Key Laboratory of Corn Deep Processing Theory and Technoogy, College of Food and Bioengineering, Qiqihar University, Qiqihar 161006, China
2
Postdoctoral Workstation of Dalian SEM Bio-Engineering Technology Co., Ltd., Dalian 116620, China
3
School of Life Science and Biotechnology, Dalian University of Technology, Dalian 116024, China
*
Author to whom correspondence should be addressed.
Fermentation 2026, 12(2), 107; https://doi.org/10.3390/fermentation12020107
Submission received: 8 January 2026 / Revised: 6 February 2026 / Accepted: 8 February 2026 / Published: 12 February 2026

Abstract

This study aimed to evaluate the effects of mixed strain fermentation on the microbial diversity, fermentation quality, and flavor of corn gluten meal-based fermented feed (CGMFF). High-throughput sequencing techniques (16S rDNA and ITS) and GC-MS technology were used to determine microbial community succession and flavor changes during the fermentation and storage stages of CGMFF and to explore their correlations. The results showed that Xeromyces and Lactobacillus became the dominant genera at the end of storage, with a relative abundance exceeding 96%. During fermentation and storage, the contents of soluble protein and ammonia nitrogen increased while the crude protein content decreased. The protein molecular weight was concentrated in the range of 75–1100 Da (96.98%), and the free amino acid (FAA) content increased by 1.42 times. This reduction in the proportion of bitter amino acids enhanced the palatability of CGMFF. The aroma gradually developed characteristics dominated by esters and alkanes. This study is intended to provide a theoretical basis for the application of corn gluten meal as a protein-rich raw material in fermented feed.

1. Introduction

In recent years, the per capita income of Chinese people has gradually grown, and their demand for high value-added food has also increased. According to statistics, the consumption of meat products from livestock alone has increased by approximately 30 million tons over the past 20 years [1]. In the traditional animal feed industry, the main source of protein is soybean meal, which accounts for about 57% of protein consumption in animal feed [2]. The self-sufficiency rate of domestic soybeans has been declining year by year—in 2022, it was only 22%—indicating that the demand for soybeans is highly dependent on international supply [2]. Therefore, there is an urgent need to find a high-protein raw material for animal feed processing that is rich in nutrients and has good water solubility to meet the needs of the current animal feed industry.
Corn gluten meal is an important co-product of the corn starch industry, with a crude protein content of approximately 60–70%, making it an ideal source of protein for animal feed [3]. However, its application in animal feed is limited due to its low protein water solubility and severe imbalance in amino acid composition [4]. Microbial fermentation is a safe and efficient modification method. Through the action of microorganisms, macromolecular proteins in corn gluten meal can be moderately degraded, and the amino acids therein can be transformed, making its nutrition more balanced [5]. Wang et al. [6] used Lactobacillus spp., Bacillus licheniformis, and Candida utilis for the co-fermentation of rapeseed meal, which degraded most of the proteins into small peptides with a molecular weight of less than 9.5 kDa, thereby improving its nutritional value and bioavailability. Fan et al. [7] treated corn gluten meal using a synergistic method of bacteria (Bacillus subtilis and Lactobacillus spp.) and enzyme (acid protease), which increased the content of soluble proteins and small peptides in the product. It can be seen that the use of multi-strain co-fermentation on protein-rich animal feed raw materials can moderately degrade proteins and improve the nutritional value of fermented animal feed [8]. Therefore, how to find suitable fermentation strains based on the characteristics of fermentation substrates is currently a research hotspot in fermented animal feed.
B. subtilis is often used as a fermentation strain in fermented animal feed, because it can produce a variety of extracellular proteases, has strong adaptability to new environments, and is tolerant to alkaline environments and high temperatures [9]. Bai et al. [10] used B. subtilis to ferment fresh and chopped whole corn plants, which could effectively reduce the fiber content and increase the crude protein content in animal feed. Zhao et al. [11] used B. subtilis to ferment wheat gluten, which could degrade the protein in wheat gluten into polypeptides of less than 26 kDa and significantly increase the content of free amino acids.
Saccharomyces cerevisiae is a type of yeast with high nutritional value, containing abundant proteins, polysaccharides, lipids, minerals, and B vitamins [12]. Furthermore, the amino acid composition of yeast biomass is quite reasonable. It is not only an ideal protein supplement for animals [13] but it can also promote the growth of microorganisms in the fermentation system. Bayat et al. [14] used S. cerevisiae and Lactobacillus plantarum to ferment wheat germ, which increased the peptide concentration in the product by 17 times, resulting in a fermented product with better nutrition. Sukhikh S et al. [15] used S. cerevisiae mixed with B. subtilis, Aspergillus niger, and Lactiplantibacillus plantarum to ferment soybean meal, which increased the contents of easily digestible protein and amine nitrogen. At present, there are few reports on the fermentation of corn gluten meal using a mixed culture of B. subtilis and S. cerevisiae, and there are no relevant reports on the analysis of colony succession during fermentation and product quality.
This study analyzed the microbial diversity, fermentation quality, and flavor of animal feed with corn gluten meal as the main ingredient during fermentation and storage using composite strains (B. subtilis and S. cerevisiae). It explored the relationships between microbial diversity, amino compounds, and aroma components during the fermentation and storage processes.

2. Materials and Methods

2.1. Materials

B. subtilis and S. cerevisiae were preserved in the Key Laboratory of Corn Deep Processing Theory and Technology of Heilongjiang Province. Corn gluten meal (crude protein, 65%) was purchased from Longjiang Fufeng Biotechnology Co., Ltd. (Qiqihar, China). Soybean meal and wheat bran were both purchased from local markets.

2.2. Preparation of CGMFF

The preparation method of CGMFF is as follows: Corn gluten meal, soybean meal, and wheat bran were mixed uniformly in a ratio of 5:3:2, and glucose solution (5 g/100 g) was added. B. subtilis and S. cerevisiae were mixed with a bacterial concentration of 8 ± 0.5 log CFU/mL, and the inoculum amount was 6 mL/100 g. Fermentation was carried out at 35 °C for 6 d, and the product was stored at room temperature for 28 d after fermentation. During the fermentation process, the bag was deflated once a day, and during the storage process, it was deflated once every three days. Sterile sampling was conducted after inoculation (FJ_0), 3 d of fermentation (FJ_3), 6 d of fermentation (FJ_6), 7 d of storage (ZC_7), 14 d of storage (ZC_14), 21 d of storage (ZC_21), and 28 d of storage (ZC_28), with 6 replicates for each sample.

2.3. Microbial Viable Cell Count

The viable microbial cell count was performed using the plate counting method. One gram of fermented feed was dissolved in 10 mL of sterile physiological saline and mixed well, then 10-fold serial dilution was performed. One milliliter of diluted bacterial solution and an appropriate amount of different culture media was added into sterile Petri dishes and mixed well. Yeast Extract Peptone Dextrose (YPD) agar medium was inverted and cultured at 28 °C for 72 h to count the viable cells of yeast [16]. Luria–Bertani (LB) agar medium was inverted and anaerobically cultured at 37 °C for 48 h to count the viable cells of B. subtilis [7]. Man, Rogosa, and Sharpe (MRS) agar medium was inverted and anaerobically cultured at 37 °C for 48 h to count the viable cells of lactic acid bacteria [7]. The above experiment was repeated six times.

2.4. Analysis of Physicochemical Indicators

2.4.1. Determination of pH and Titratable Acidity

The determination method was performed according to the method of Wang [17]. Fermented feed (0.5 g) was dissolved in distilled water (5 mL) and extracted at 4 °C for 18 h. The pH value of the sample was measured by pH meter (PB-10, Sartorius AG, Göttingen, Germany). The titratable acidity content was determined by the pH potentiometric method.

2.4.2. Determination of Crude Protein Content

The sample was placed in an oven (DHG-9070A, Wuhan Gert Electromechanical Equipment Co., Ltd., Wuhan, China) at 65 °C for 48 h. The dried powder of the fermented feed was obtained after grinding in a mortar. The crude protein content was determined by the Dumas combustion method [18].

2.4.3. Determination of Ammonia Nitrogen Content

The determination method was performed according to the method of Wang [19]. Dried fermented feed powder (0.5 g) was added in distilled water (5 mL) and extracted for 48 h. The extract was obtained through filtration. Phenol (2.5 mL) and sodium hypochlorite (2 mL) were added in the extract (50 μL), mixed well, and placed in a 95 °C water bath for 5 min. After cooling to room temperature, the absorbance was measured at a wavelength of 630 nm, with distilled water as the blank control.

2.4.4. Determination of Soluble Protein Content

The content of soluble protein was determined by the Folin phenol method [7]. Sample Pretreatment: Dried fermented feed powder (0.5 g) was added in distilled water (5 mL), mixed well, and extracted for 1 h. The extract was obtained by centrifuge (9000× g, 15 min). The absorbance was measured at a wavelength of 640 nm, with distilled water as the blank control.

2.4.5. Determination of Soluble Sugar Content

The determination of soluble sugar content was performed according to the method by Wang [19]. One gram of sample was dissolved in 15 mL distilled water and bathed in boiling water at 100 °C for 20 min. After cooling to room temperature, the mixture was filtered and made up to 25 mL. The volumetric sample solution (1 mL) and anthrone solution (5 mL) were mixed thoroughly and bathed in a boiling water at 100 °C for 10 min. After cooling, the absorbance was measured at a wavelength of 620 nm using a 752 UV-visible spectrophotomer (Model 752, Shanghai Jinghua Technology Instrument Co., Ltd., Shanghai, China), with distilled water as the blank control.

2.5. Determination of Protein Molecular Weight Distribution

The molecular weight distribution of proteins in the fermented feed was determined by protein purifier (AKTA avant 25, GE Healthcare Bio-Sciences AB, Uppsala, Sweden). Sample Pretreatment: The sample (1 g) was added in ddH2O (4 mL), mixed well, extracted for 4 h, and centrifuged at 9000× g for 3 min. The supernatant was filtered through 0.22 μm aqueous membrane and diluted to 2 mg/mL according to the soluble protein content for later use. Chromatographic Conditions: The chromatographic column was Superdex Peptide (10/300 GL, GE Healthcare Bio-Sciences AB, Uppsala, Sweden). The mobile phase was distilled water. The elution mode was isocratic elution with a flow rate of 0.25 mL/min. The column temperature was 23 °C. The detector was ultraviolet detector with a detection wavelength of 214 nm. The injection volume was 100 μL.

2.6. Determination of Amino Acid Composition

The determination of amino acid composition was performed according to the method of Cong (2025) [20]. The sample (60 mg) and hydrochloric acid (18 mL, 6 mol/L) were added in an ampoule and hydrolyzed at room temperature for 22 h. After filtration, the volume was made up to 100 mL. Before on-machine testing, filter with a 0.45 μm aqueous membrane. Fully automatic amino acid analyzer (Model L-8900, Hitachi Co., Tokyo, Japan) was used to analyze the amino acid composition of samples.

2.7. Determination of Volatile Substances

The sample (1 g) was added in a 20 mL headspace vial and placed in a 45 °C water bath for 15 min and then desorbed into the injection port at 250 °C within 5 min.
The gas chromatograph–mass spectrometer (TRACETM 1600, Thermo Fisher Scientific, Waltham, MA, USA) coupled with triple quadrupole GC-MS (TSQTM 9610, Thermo Fisher Scientific, Waltham, MA, USA) was used for the analysis of volatile substances. GC Conditions: (1) chromatographic column: DB-5MS (30 m × 0.25 mm × 0.25 μm); (2) column temperature: initial temperature of 40 °C held for 2 min, then increased to 280 °C at 5 °C/min and held for 30 min; (3) injection port temperature: 250 °C; carrier gas flow rate: 1.0 mL/min; (4) split ratio: splitless; (5) MS conditions: ion source temperature: 300 °C; transfer line temperature: 280 °C; mode: full scan from 40 to 550.

2.8. Analysis of Microbial Diversity

The sample (15 g) was added in 50 mL centrifuge tube and quickly froze in liquid nitrogen and was then sent to Majorbio Biomedical Technology Co., Ltd. (Shanghai, China) for the detection of microbial diversity of bacteria and fungi in the fermented feed.
DNA of the sample was extracted by the SDS method. After confirming the purity, PCR amplification was performed using the 16S V4 region primers (515F/806R) and ITS1 region primers (ITS5-1737F/ITS2-2043R), respectively. The library was constructed from a library construction kit (Ion Plus Fragment Library Kit 48 rxns, Thermo Fisher Scientific, Waltham, MA, USA). The library was quantified by Qubit and passed the inspection; sequencing was performed on the machine using Thermo Fisher’s Ion S5TM XL (Waltham, MA, USA).

2.9. Data Analysis

All the above experiments were repeated six times, and the results were expressed as mean ± standard deviation. Origin 2019 (OriginLab, Northampton, MA, USA) was used to analyze the data and draw charts. SPSS 19.0 (IBM Corp., Armonk, NY, USA) was employed for significance analysis, and differences in means were determined by Duncan’s multiple comparison test, with a significance level set at p < 0.05. High-throughput sequencing data were analyzed on the online platform of Majorbio Cloud Platform (www.majorbio.com, accessed on 12 April 2025). R language (version 3.3.1) was used for Alpha and Beta diversity difference analysis as well as Spearman correlation analysis between bacterial genera and environmental factors. Canoco 5 was utilized to analyze the data and draw correlation diagrams between microorganisms and environmental factors. The correlation heatmap was drawn using ChiPlot (https://www.chiplot.online/, accessed on 18 April 2025). The odor information of aroma substances was queried using the FOODB platform (https://foodb.ca/, accessed on 24 April 2025).

3. Results and Discussion

3.1. Microbial Diversity of CGMFF

The change in microbial community was an important factor of the change in fermented feed quality [21]. Among the bacterial α-diversities, FJ_0 group had the highest bacterial species number (161 species) (Figure 1A). As fermentation and storage progressed, the bacterial species number of the samples gradually decreased, reaching a minimum (24 species) after storage for 28 days. The Shannon index for ZC_21 and ZC_28 groups were 1.149 and 1.037, respectively, while it was approximately 3 for the other groups (Figure 1B). Similar results were observed for the Simpson index, which were 0.415 and 0.436 for ZC_21 and ZC_28 groups, respectively, and it was approximately 1 for the other groups (Figure 1C). It indicated that the bacterial diversity of fermentation and at the early stage of storage was relatively similar and highly complex. At the later stage of storage, some microorganisms had achieved a relatively large microbiota advantage.
In fungal α-diversity, the trend of species number was similar to bacteria. The FJ_0 group had the highest number (40 species) (Figure 1A). It remained around 20 species at the later stage of storage. The Shannon index of the FJ_0 group (1.639) was high, while it was approximately 1 for the other groups (Figure 1B). The Simpson index of the FJ_0 group (0.269) was low, while it was the highest for the ZC_7 group (0.519), and it was 0.42 ± 0.03 for the other groups (Figure 1C). It indicated that fungal diversity also tended to simplify as time increased. The Chao A index was higher for the FJ_0 group (39.750) than for the other groups, indicating a greater number of rare species in the FJ_0 group (Figure 1D).
β-diversity analysis revealed the evolutionary processes of microorganisms before and after fermentation and storage of CGMFF (Figure 1E,F). In terms of bacteria, ZC_21 and ZC_28 groups had no significant intra- or inter-group differences, and they were relatively far apart from the other groups (Figure 1E). It corroborated the inference from the Chao A index results. In terms of fungi, the inter-group differences between FJ_3 and FJ_6 groups were small during fermentation, but intra-group differences were significant (Figure 1F). During storage, ZC_7 and ZC_21 groups had a few outlier samples, the intra-group and inter-group differences in other groups were small. It indicates that during fermentation and storage, the fermentation rates among each group are uneven. This phenomenon was normal, because the raw material fermentation method was adopted.

3.2. Microbial Community Composition of CGMFF

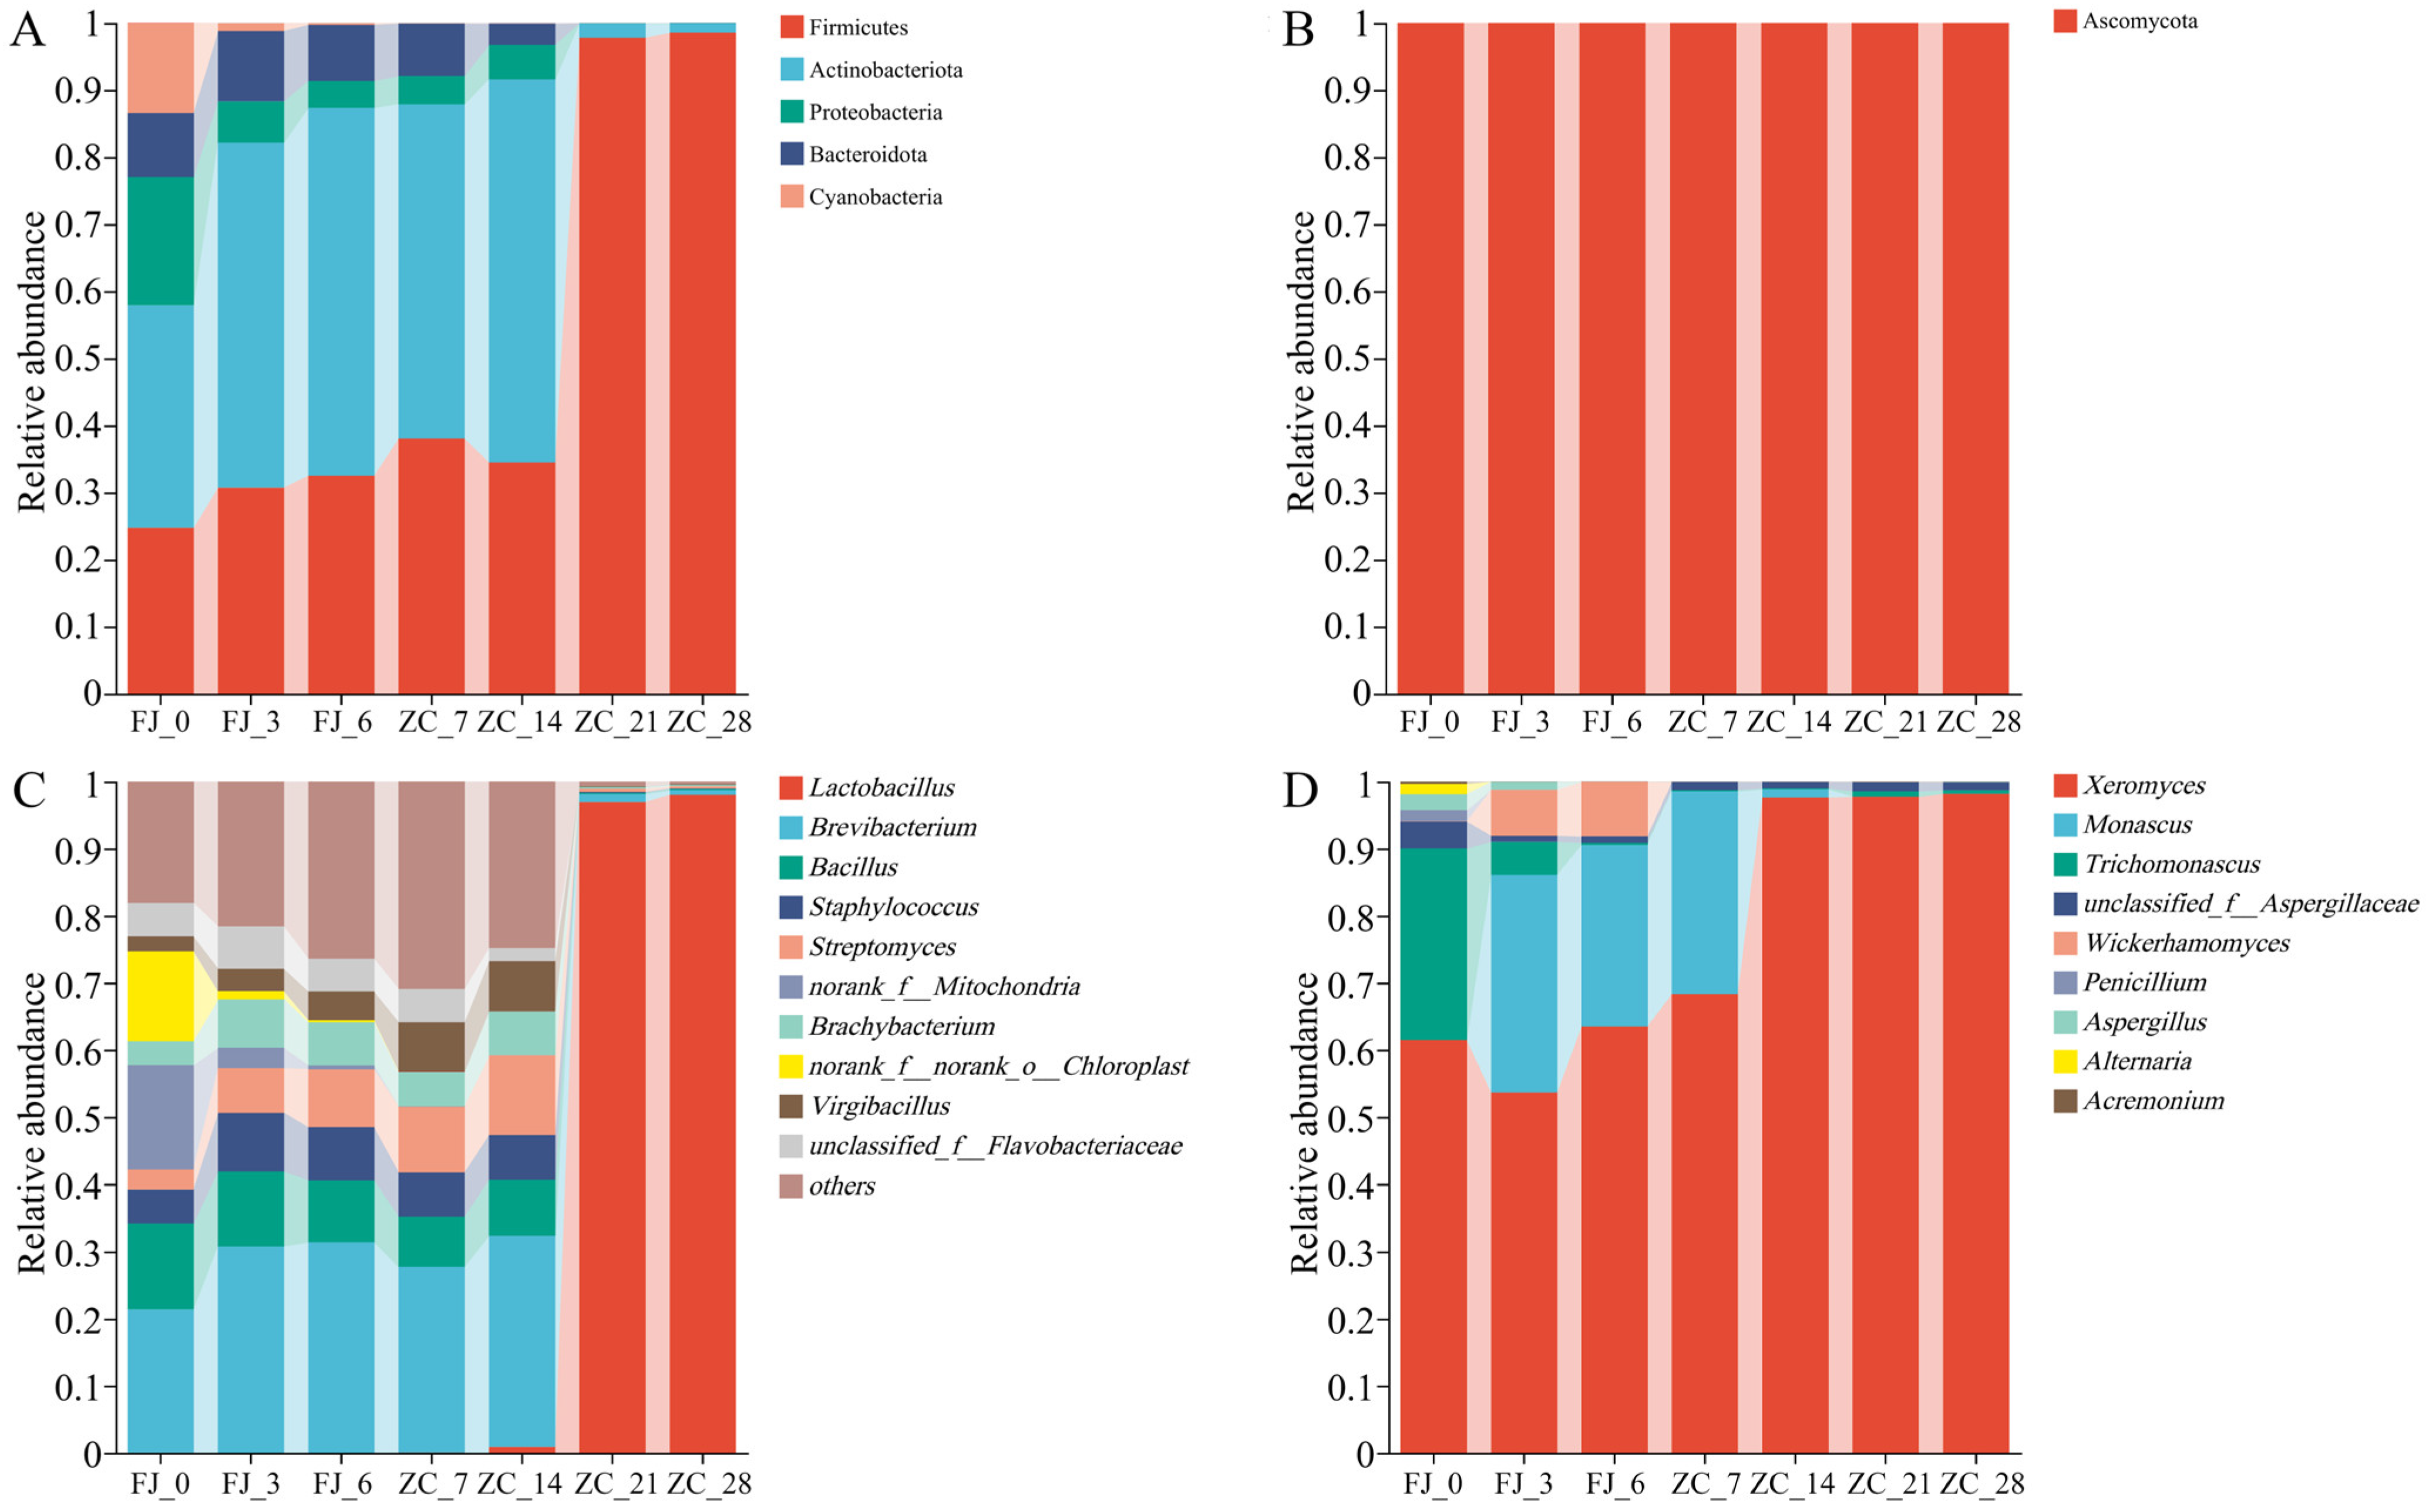
At the bacterial phylum level, Actinobacteria (33.14%) was the dominant phylum during fermentation, and its relative abundance increased by 21.72% at the end of fermentation (Figure 2A). It reached a maximum relative abundance of 57.15% after 14 days of storage then decreased rapidly. The relative abundance of Firmicutes (24.74%) increased by 7.74% during fermentation. Its relative abundance increased rapidly after 21 d of storage, eventually stabilizing at 98.56%. Actinobacteria and Firmicutes were the main microbial phyla during fermentation and storage. Liu et al. [22] fermented stipa grandis silage by lactic acid bacteria and found that Firmicutes had the highest relative abundance (exceeding 90%) after 60 d of fermentation, which was consistent with this study.
At the genus level (Figure 2C), the relative abundances of Brevibacterium, Brachybacterium, Staphylococcus, and Streptomyces increased by 10.01%, 2.85%, 3.01%, and 5.58%, respectively, during fermentation, while the relative abundances of other genera decreased. During the early stage of storage, there were no significant changes. In the ZC_21 group, lactic acid bacteria quickly dominated the microbial community, with a relative abundance of 96.92%, which remained until the end of storage. After the massive proliferation of Lactobacillus, the pH value decreased rapidly, effectively inhibiting the growth of other genera (the relative abundances of other genera were less than 1%). Previous studies had reported that lactic acid bacteria were the main fermentative bacteria in the late stage of fermentation and storage [22]. This may be determined by the combination of nutrient ratio, molecular weight, moisture content, and pH value in the fermentation broth during the late stage of fermentation and storage.
In terms of fungi, only Ascomycota was detected at the phylum level (Figure 2B). Li et al. [20] conducted high-throughput sequencing on rice from different positions in granaries and found that the relative abundance of Ascomycota reached 73.81%. Thus, Ascomycota is the main fungal phylum remaining on the plant epidermis. At the genus level, the relative abundances of Xeromyces and Monascus increased by 2.03% and 27.05%, respectively, during fermentation (Figure 2D). Xeromyces reached a relative abundance of 97.6% at 14 d of storage, becoming the dominant genus. Ma et al. [23] found that Xeromyces had the highest relative abundance at 30 d and 60 d in naturally fermented cabbage waste. This may be because, with the extension of fermentation and storage time, the moisture content in the fermentation broth decreases, and Xeromyces has a certain tolerance to low pH values [23], leading it to dominate the fungal community in the late stage of storage.

3.3. Changes in the Viable Count, pH Value, Titratable Acid, and Soluble Sugar During Fermentation and Storage

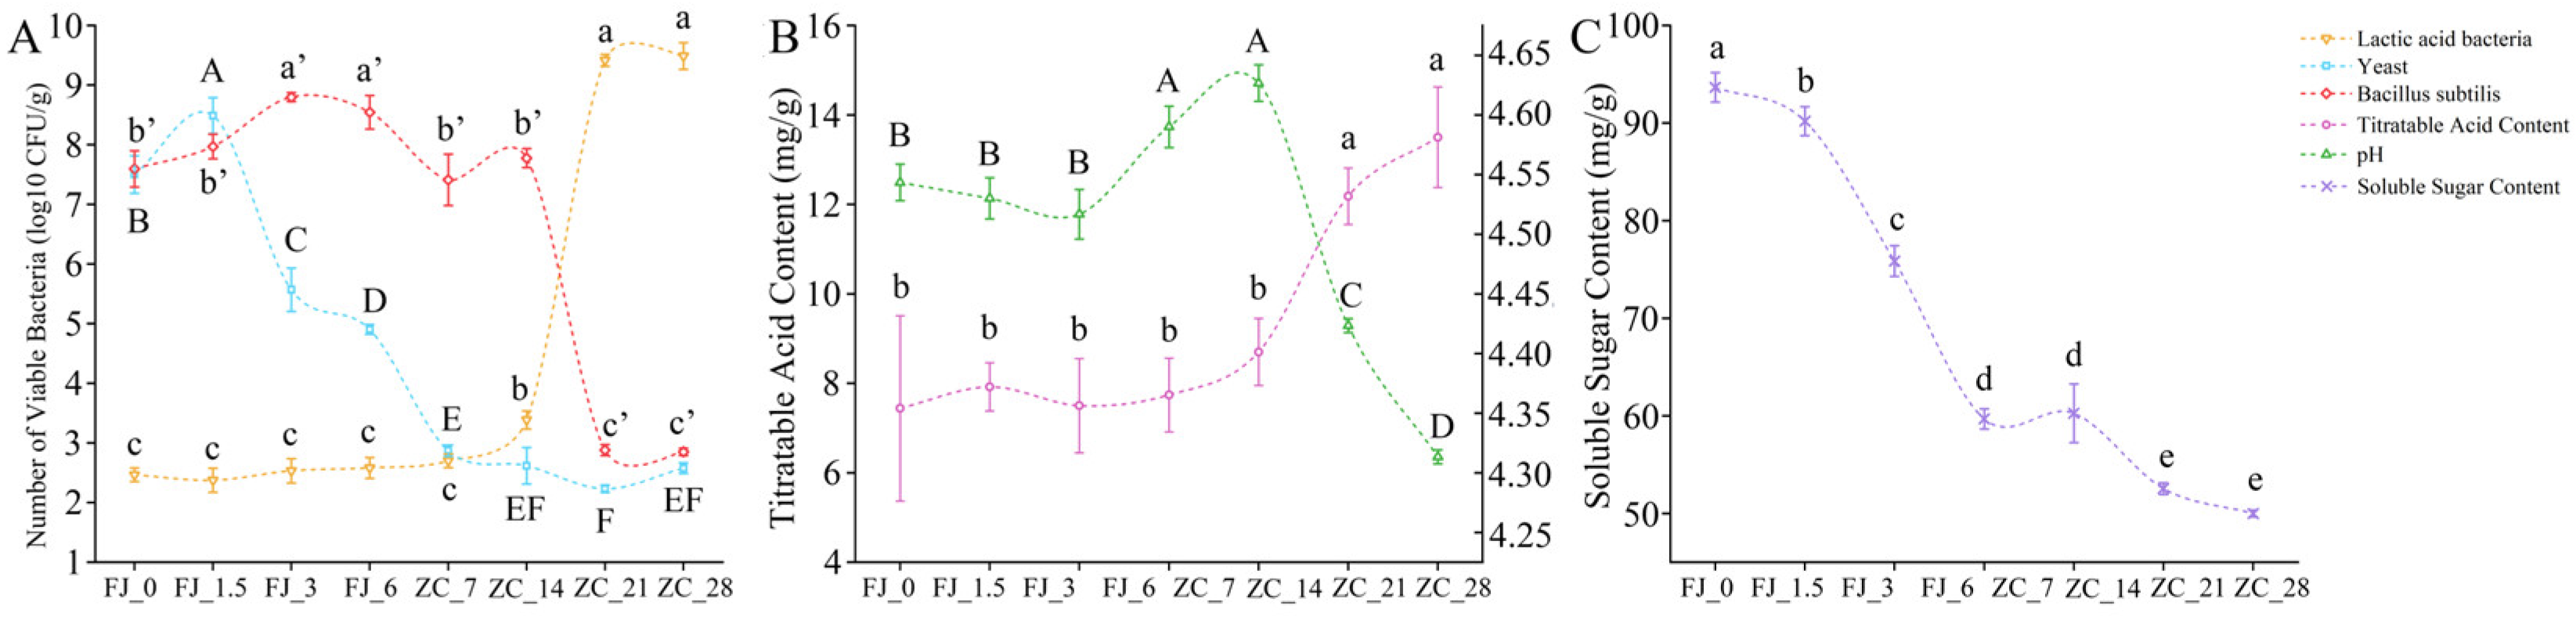
The evolution pattern of the main microorganisms during the fermentation and storage of CGMFF is shown in Figure 3A. During the fermentation, the viable count of B. subtilis first increased and then stabilized, with 8.67 ± 0.23 log CFU/g at the end of fermentation. The viable count of yeast reached 8.49 ± 0.30 log CFU/g on the 1.5 d of fermentation, then started to decline, and stabilized at 4.90 ± 0.08 log CFU/g at the end of fermentation. Yeast has strong environmental adaptability and can quickly grow and reproduce by utilizing environmental resources. As the fermentation environment changed (such as a decrease in oxygen content), the viable count of yeast decreased. Fang et al. [24] used yeast and lactic acid bacteria to ferment sourdough and found that the viable count of yeast reached the highest point at 12 h of fermentation and then decreased rapidly. A large amount of nutrients released after the death of yeast, which greatly promoted the growth of B. subtilis and lactic acid bacteria in the later stage [25]. During the storage, the viable count of B. subtilis remained at 7.59 ± 0.36 log CFU/g within 14 d, then decreased rapidly, and was 2.85 ± 0.06 log CFU/g after 21 d. The viable count of yeast remained at 2.57 log CFU/g. It was worth noting that the viable count of lactic acid bacteria rapidly increased to 9.41 ± 0.10 log CFU/g at 21 d of storage and remained to the end of storage. The massive and rapid proliferation of lactic acid bacteria generally occurs in the late stage of raw material fermentation or during the storage, which may be related to the autolysis of yeast in the early stage, acidic fermentation conditions, and oxygen content [16,25]. The massive reproduction of lactic acid bacteria leads to the rapid accumulation of metabolites (such as bacteriocins and lactic acid), which inhibits the growth and reproduction of fermentative strains and environmental microorganisms, resulting in a rapid decrease in the viable count of other bacterial. Nazar M et al. [26] used the epiphytic microbiota of Napier grass to ferment Napier grass and found that within 30 d of fermentation, the viable count of lactic acid bacteria increased by one order of magnitude, while the viable count of yeast decreased by two orders of magnitude and was below the detection line at 60 days of fermentation. It is similar to the results of this study.
The pH value showed no significant change during the fermentation (Figure 3B), indicating that no large amount of acid substances was produced during the fermentation. In the storage, it showed a trend of increasing first and then decreasing and reached the minimum value of 4.31 at 28 d of storage. The massive proliferation of lactic acid bacteria in the later stage of storage was the main reason for the decrease in pH value. The titratable acid content was negatively correlated with pH value, increasing by 4.74 mg/g at the end of storage. The soluble sugar content showed a downward trend during fermentation and storage (Figure 3C), with a consumption of 43.66 mg/g at the end of storage.

3.4. Changes in Crude Protein, Ammonia Nitrogen, and Soluble Protein During Fermentation and Storage

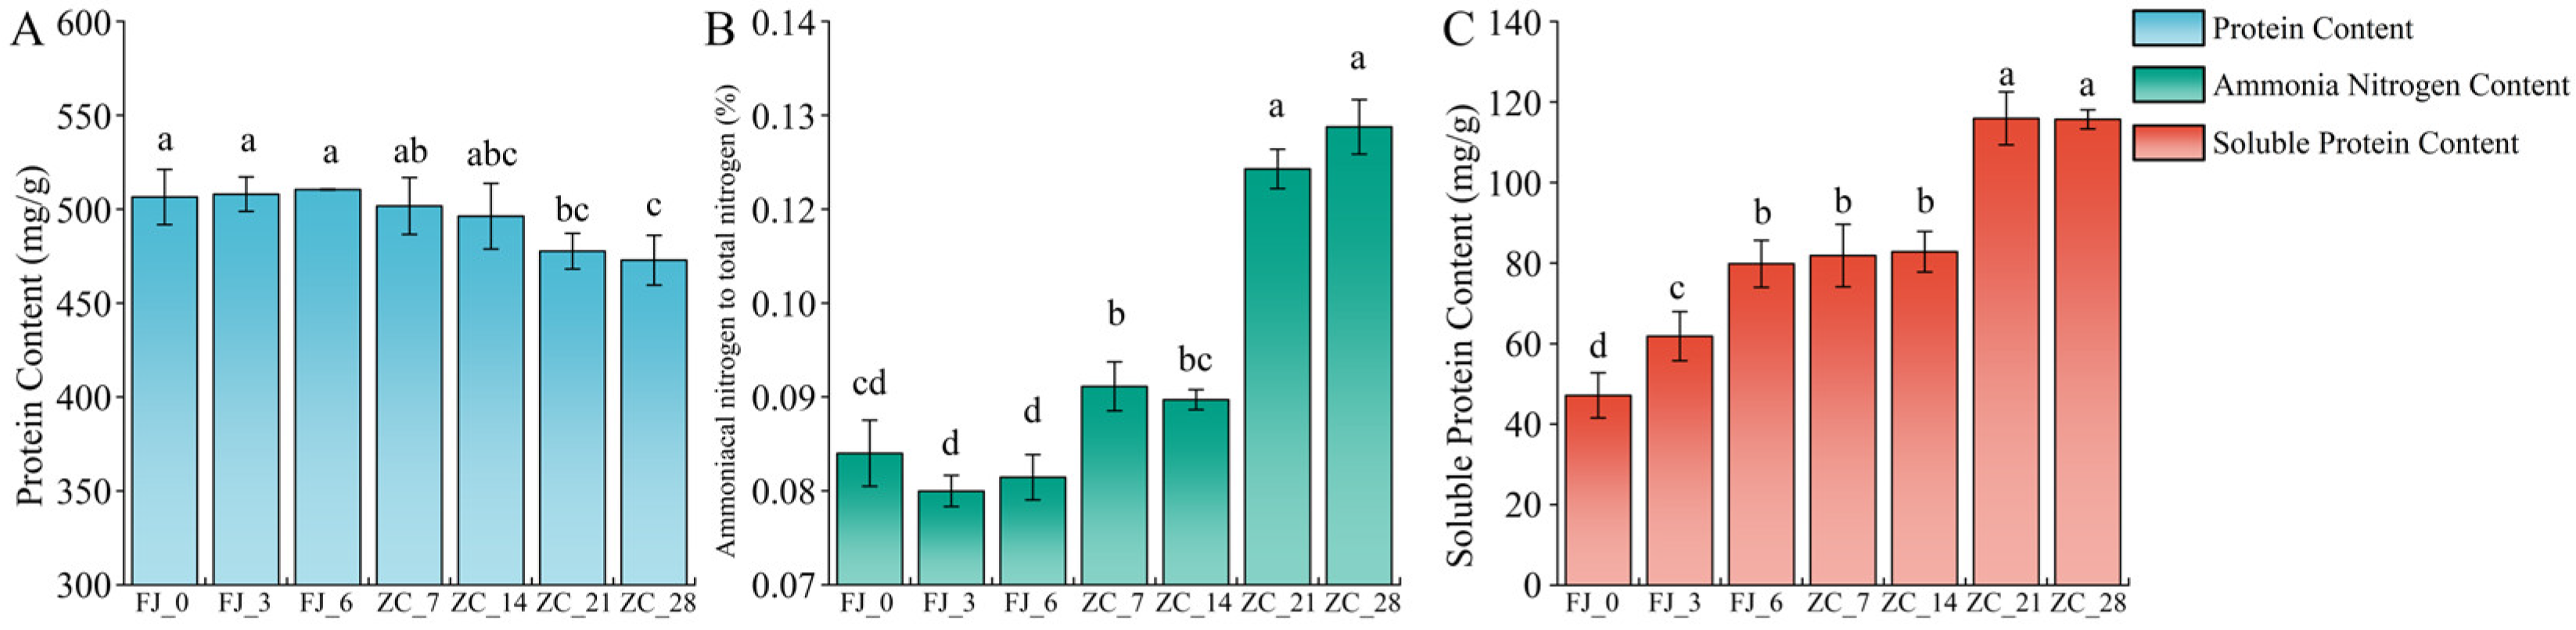
The crude protein content remained at 508.28 ± 8.84 mg/g (dry matter) with no significant change (p > 0.05) during the fermentation. It began to decrease significantly after 21 d of storage and reached the lowest point at 28 d (472.86 ± 13.24 mg/g dry matter) (Figure 4A). It indicated that the massive proliferation of lactic acid bacteria in the late stage of storage improved the hydrolysis rate and utilization efficiency of crude protein. The ammonia nitrogen content remained around 0.42 mg/g (dry matter) during fermentation with no significant change (p > 0.05) (Figure 4B). It continued to increase after entering the storage and reached the highest level (0.56 mg/g dry matter) at the end of storage, accounting for 0.12% of the total nitrogen content. The main reason for the increase in ammonia nitrogen content is that microorganisms (Lactobacillus and Xeromyces) in the storage secrete a large number of extracellular enzymes to hydrolyze proteins in feed raw materials [27]. High ammonia nitrogen concentration in animal feed (exceeding 15% of total nitrogen content) will affect animal feed intake and production performance [27]. The ammonia nitrogen content of CGMFF increased during fermentation and storage, but it could still be controlled within a reasonable range. During the fermentation and storage processes, the soluble protein content showed a significant increasing trend (p < 0.05). By the end of fermentation, the soluble protein content increased from 47.13 ± 5.59 mg/g (dry matter) to 79.82 ± 5.84 mg/g (dry matter). During storage, the soluble protein content continued to rise, reaching its highest value at 21 d (115.91 ± 6.59 mg/g dry matter) and then remained stable until the end of storage (p > 0.05) (Figure 4C). Li et al. [28] studied the microbial community composition of alfalfa silage in different saline–alkali soils and found that the viable count of lactic acid bacteria increased by one order of magnitude after 60 d of fermentation. The soluble protein content increased to 81 mg/g. Therefore, the viable count of lactic acid bacteria and soluble protein content were positively correlated. Ruan et al. [29] studied microbial community composition during jujube vinegar fermentation and found that the metabolic activity of Xeromyces promoted the accumulation of amino acids. It not only had high stress resistance but could also produce protease to promote the decomposition of macromolecular proteins. Therefore, proteolytic enzyme systems (such as serine protease, cysteine protease, and acid protease) produced by Lactobacillus and Xeromyces can not only efficiently hydrolyze macromolecular proteins [29] but also change their spatial structure, thereby enhancing their processing performance and nutritional quality [30].

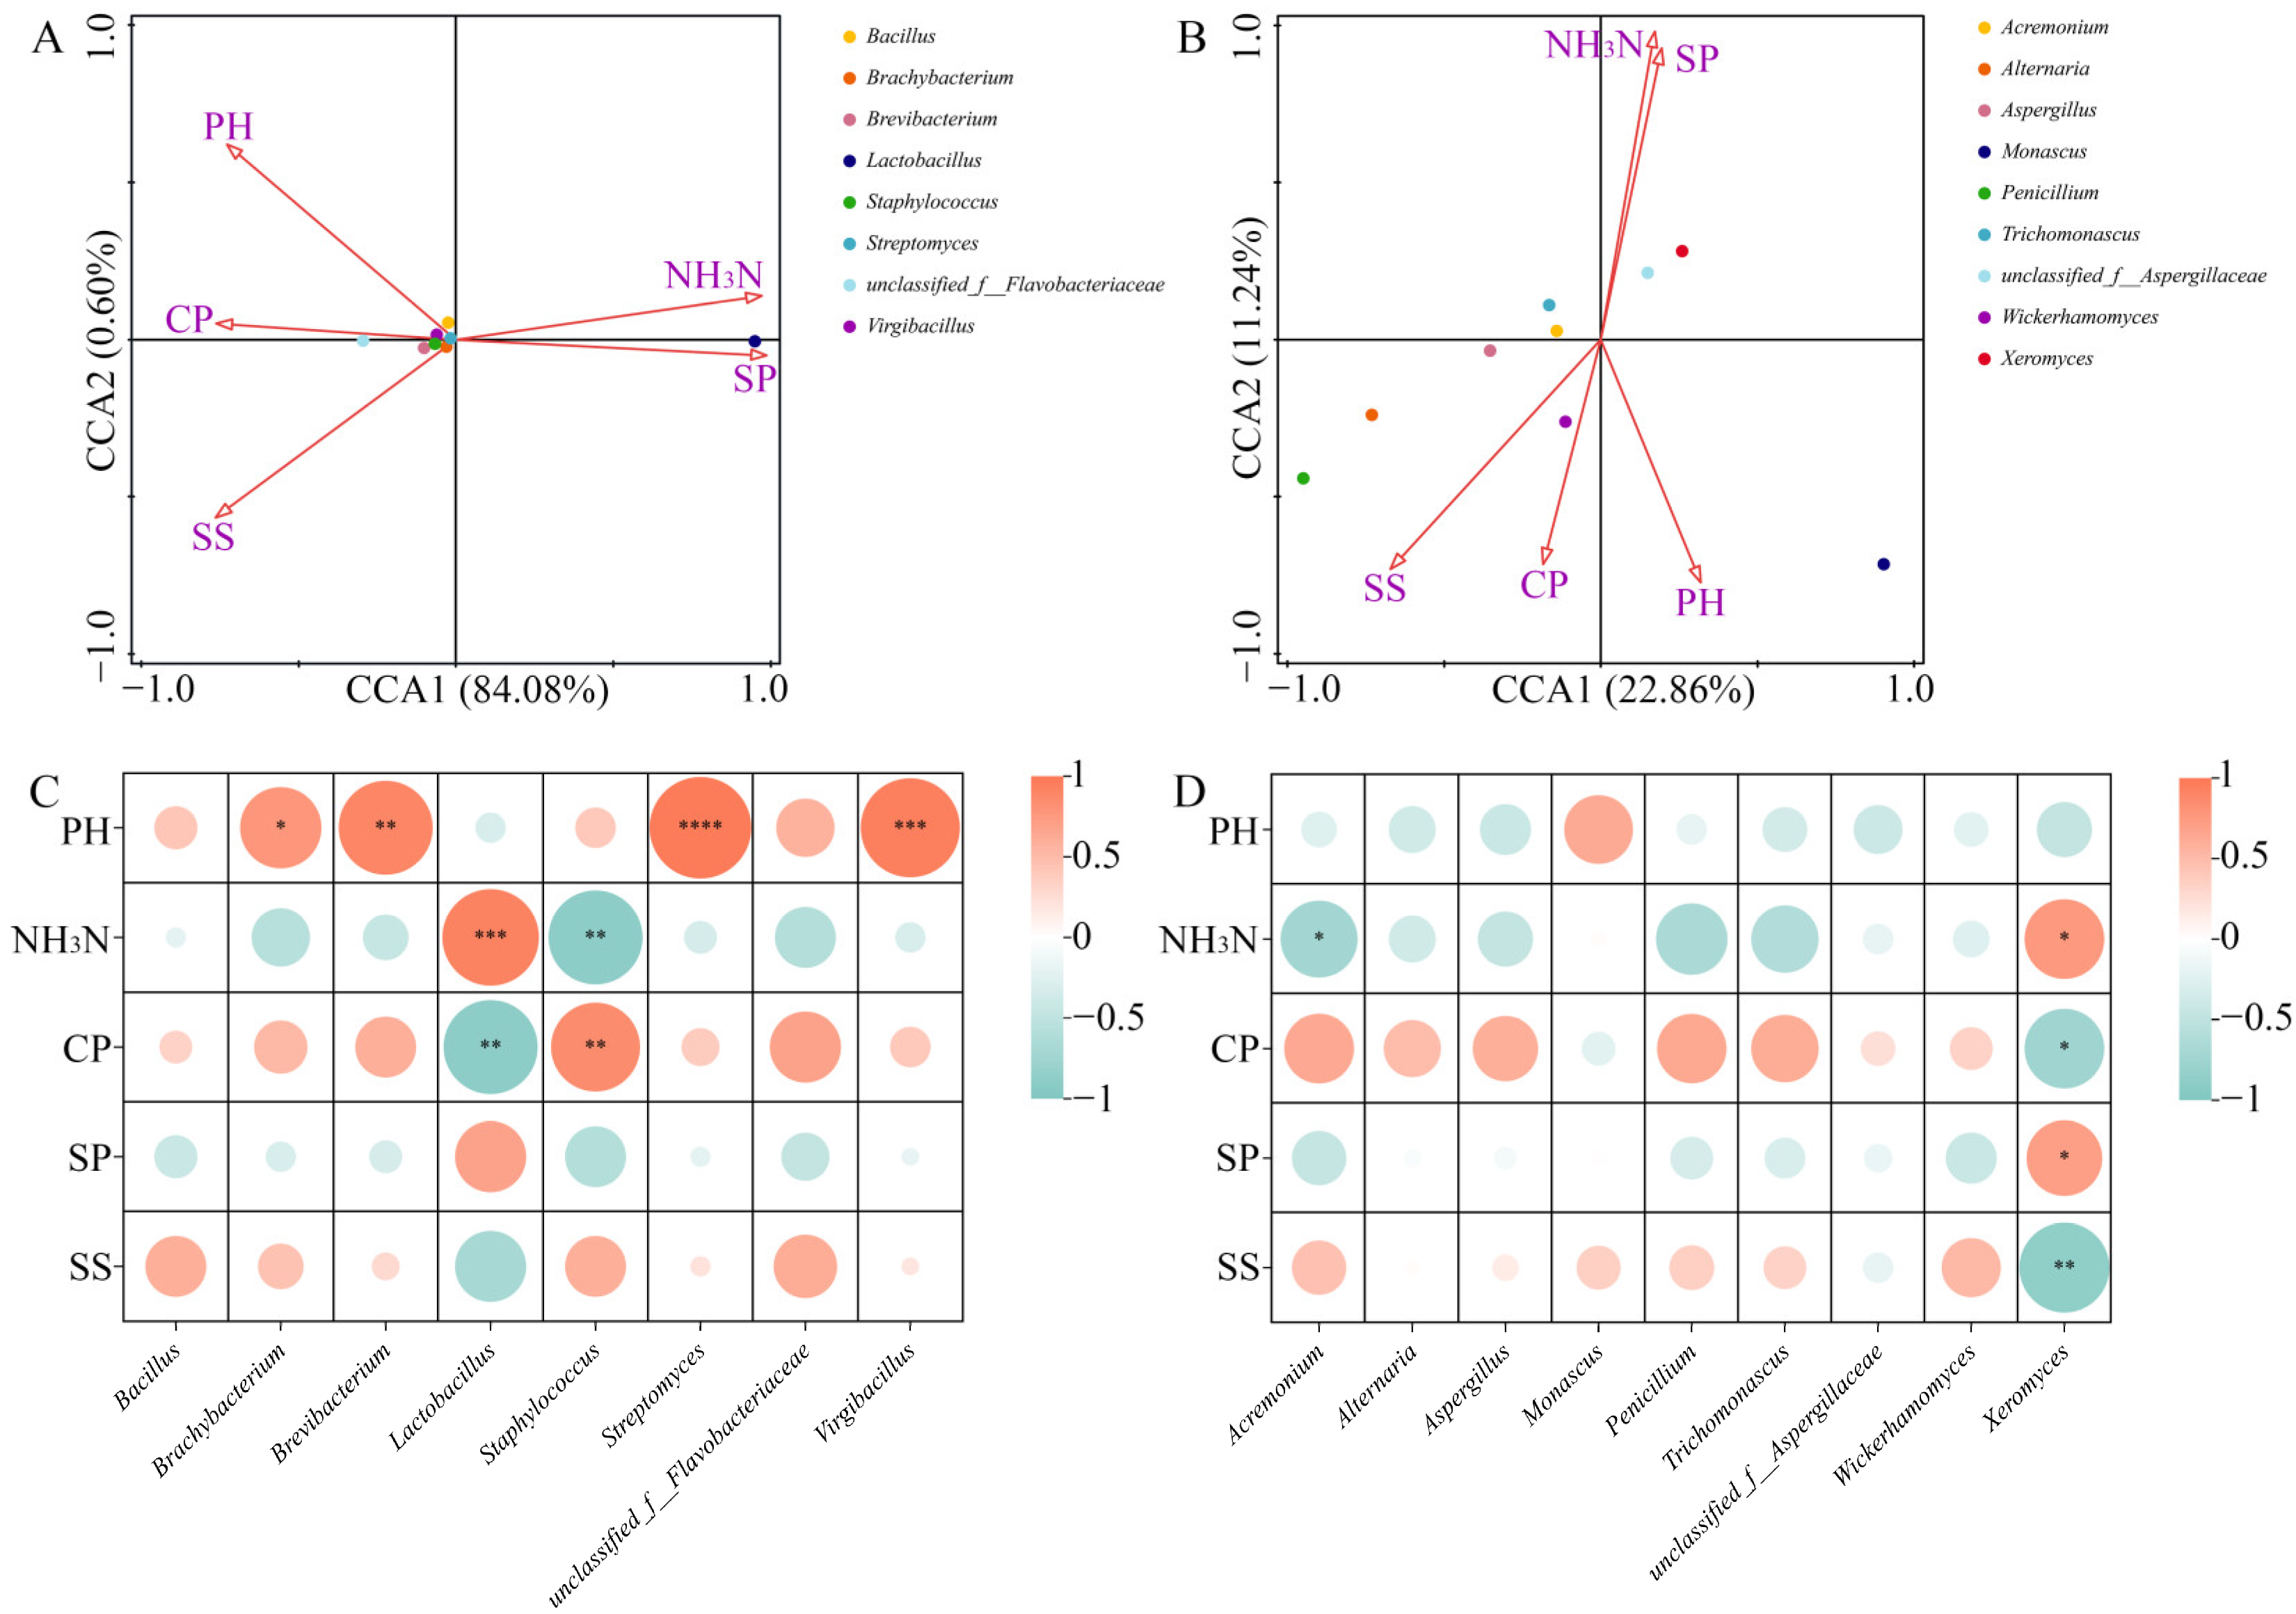
3.5. Main Fermentative Microorganisms and Environmental Factors

The relationships between main microorganisms and environmental factors during the fermentation and storage of CGMFF were analyzed through CCA and Spearman heatmap (Figure 5). The pH value was significantly positively correlated with Brevibacterium, Brachybacterium, Streptomyces and Virgibacillus (p < 0.01), while negatively correlated with Lactobacillus. The ammonia nitrogen content was significantly positively correlated with Lactobacillus and Xeromyces (p < 0.01), and significantly negatively correlated with Staphylococus and Acremonium (p < 0.01). The crude protein content showed significant positive correlation with Staphylococus (p < 0.01), and significant negative correlation with Lactobacillus and Xeromyces (p < 0.01). The soluble protein content was significantly positively correlated with Xeromyces (p < 0.01). Trichomonascus had no significant correlation with environmental factors.

3.6. Changes in Protein Molecular Weight Distribution During Fermentation and Storage

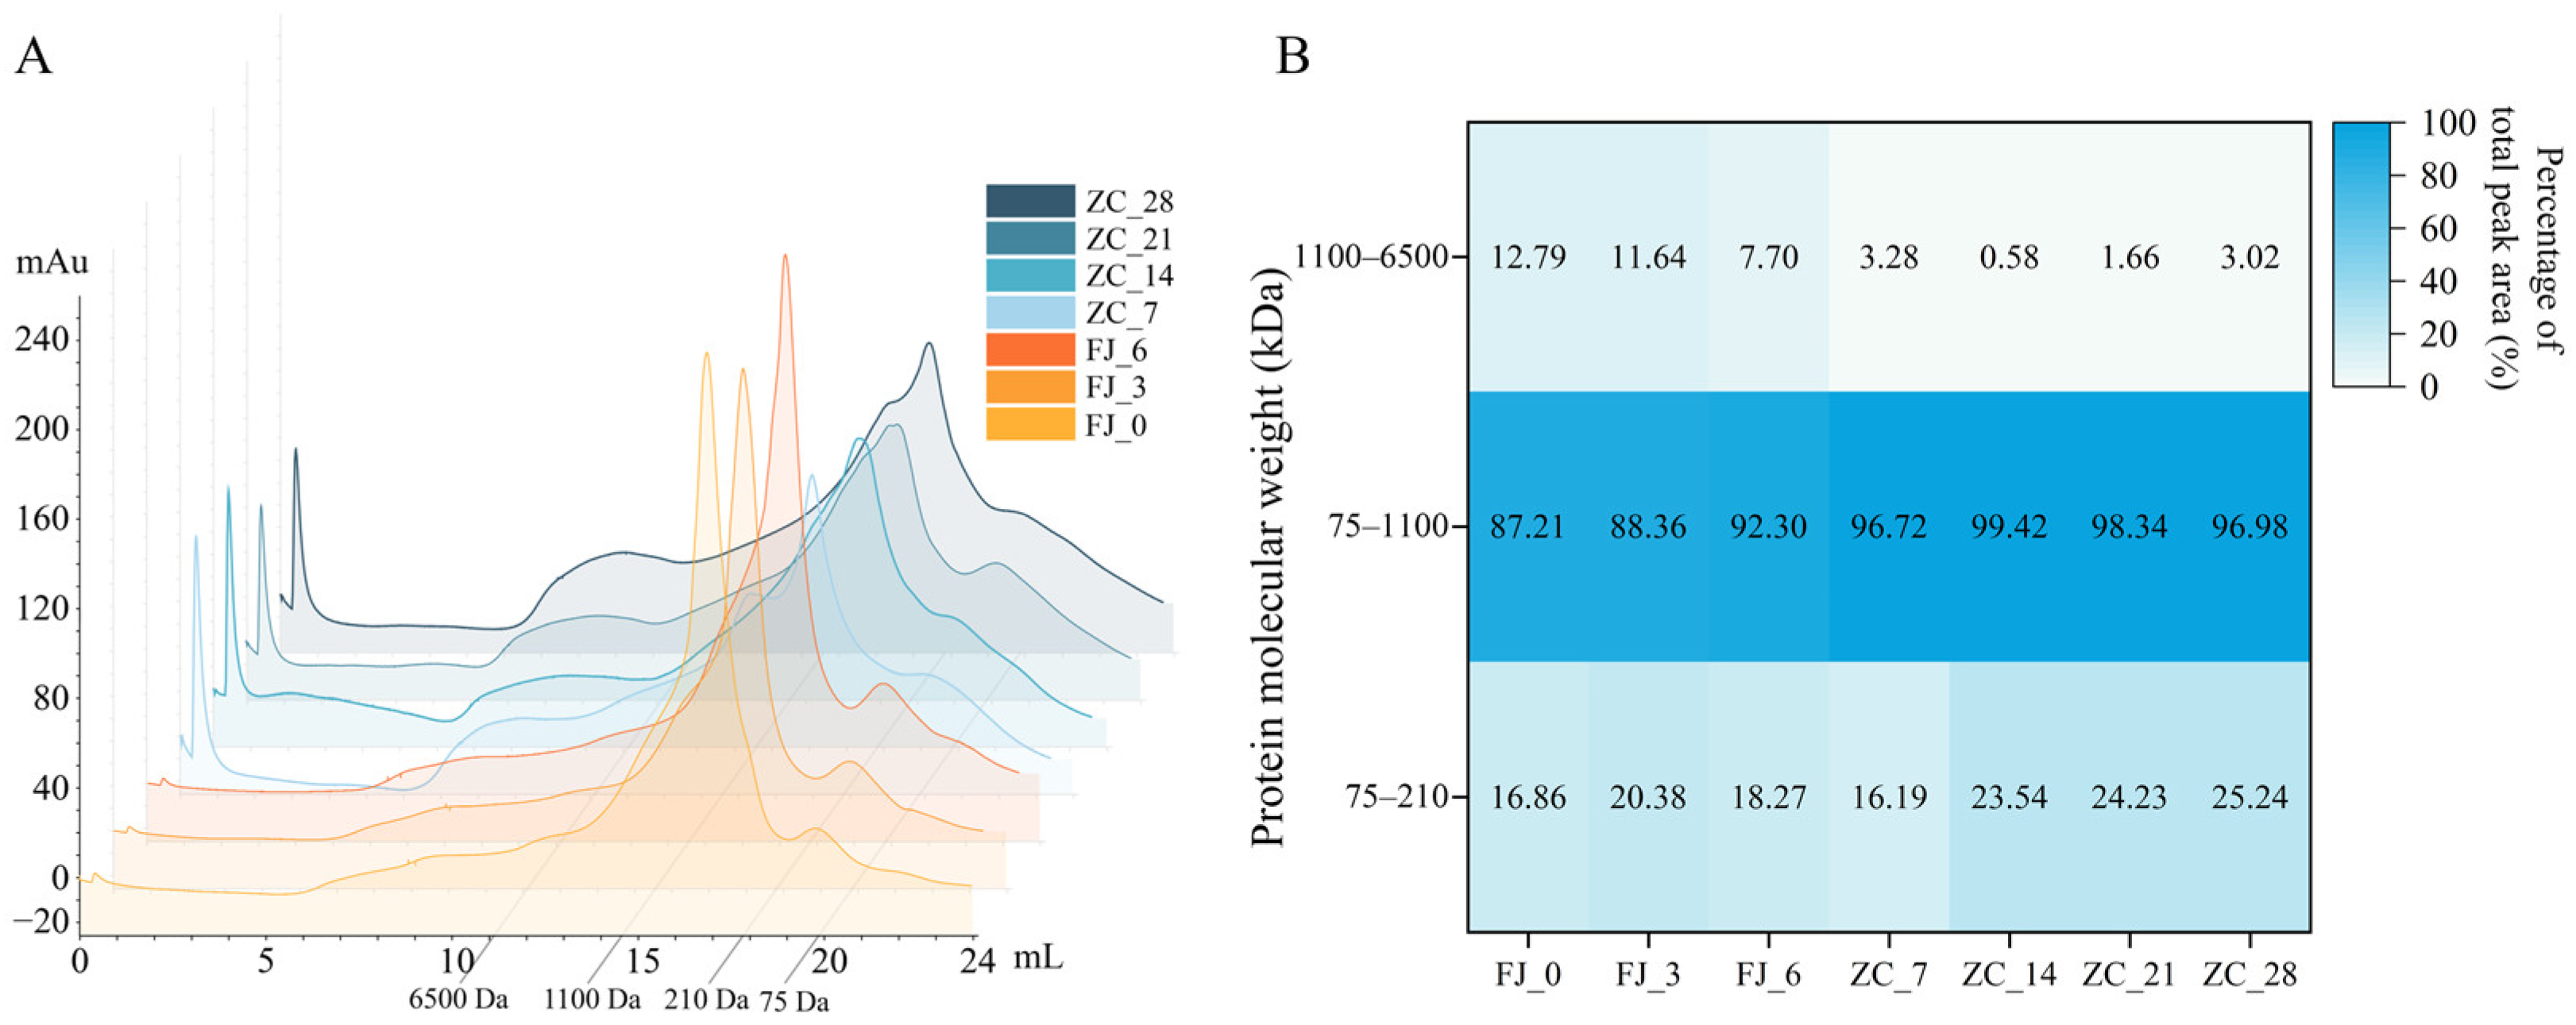
During the fermentation and storage of CGMFF, the protein molecular weight showed a trend of gradual decrease with a more uniform distribution (Figure 6). The 75~210 Da of proteins increased by 1.41% during the fermentation and continued to rise during storage. It reached a maximum value of 25.24% at the end of storage. This indicated that after fermentation and storage, the free amino acids and dipeptides content of CGMFF effectively increased. The 75~1100 Da of proteins continued to increase during fermentation, with the initial relative content being 87.21% and rising to 92.30% at the end of fermentation. It increased to the highest level of 99.42% at 14 d of storage, followed by a slight decrease. It has been reported that less than 1 kDa of oligopeptides have excellent antioxidant activity and various functional activities. They can be directly absorbed by the intestine without further hydrolysis, thus having high bioavailability. The active sites of amino acid residues (such as phenolic hydroxyl groups and amino groups, etc.) are more easily exposed, which can collide with free radicals more efficiently and improve scavenging efficiency [31]. Accordingly, fermentation can enhance or improve the functional properties of CGMFF. The 1100~6500 Da of proteins continued to decrease during fermentation, with a reduction of 5.09% at the end of fermentation. It dropped to the lowest point (0.58%) at 14 d of storage and then slightly increased at the end. This may be attributed to the continuous hydrolysis of macromolecular proteins by extracellular enzymes of microorganisms during fermentation and storage. Xeromyces proliferated rapidly at 14 d of storage and showed a significant negative correlation with the rapid decrease in the relative content of macromolecular proteins. Meanwhile, the rapid proliferation of lactic acid bacteria and Xeromyces improved the utilization rate of nitrogen sources and resulted in a decrease in the relative content of oligopeptides (75~1100 Da) in the later stage of storage, which indirectly led to an increase in the relative content of macromolecular proteins. In summary, during the fermentation and storage of CGMFF, the protein molecular weight is mainly concentrated in the range of 75~1100 Da (accounting for 87.21–99.42%). Microbial fermentation can effectively increase the contents of oligopeptides and free amino acids.

3.7. Changes in Amino Acid Composition During Fermentation and Storage Periods

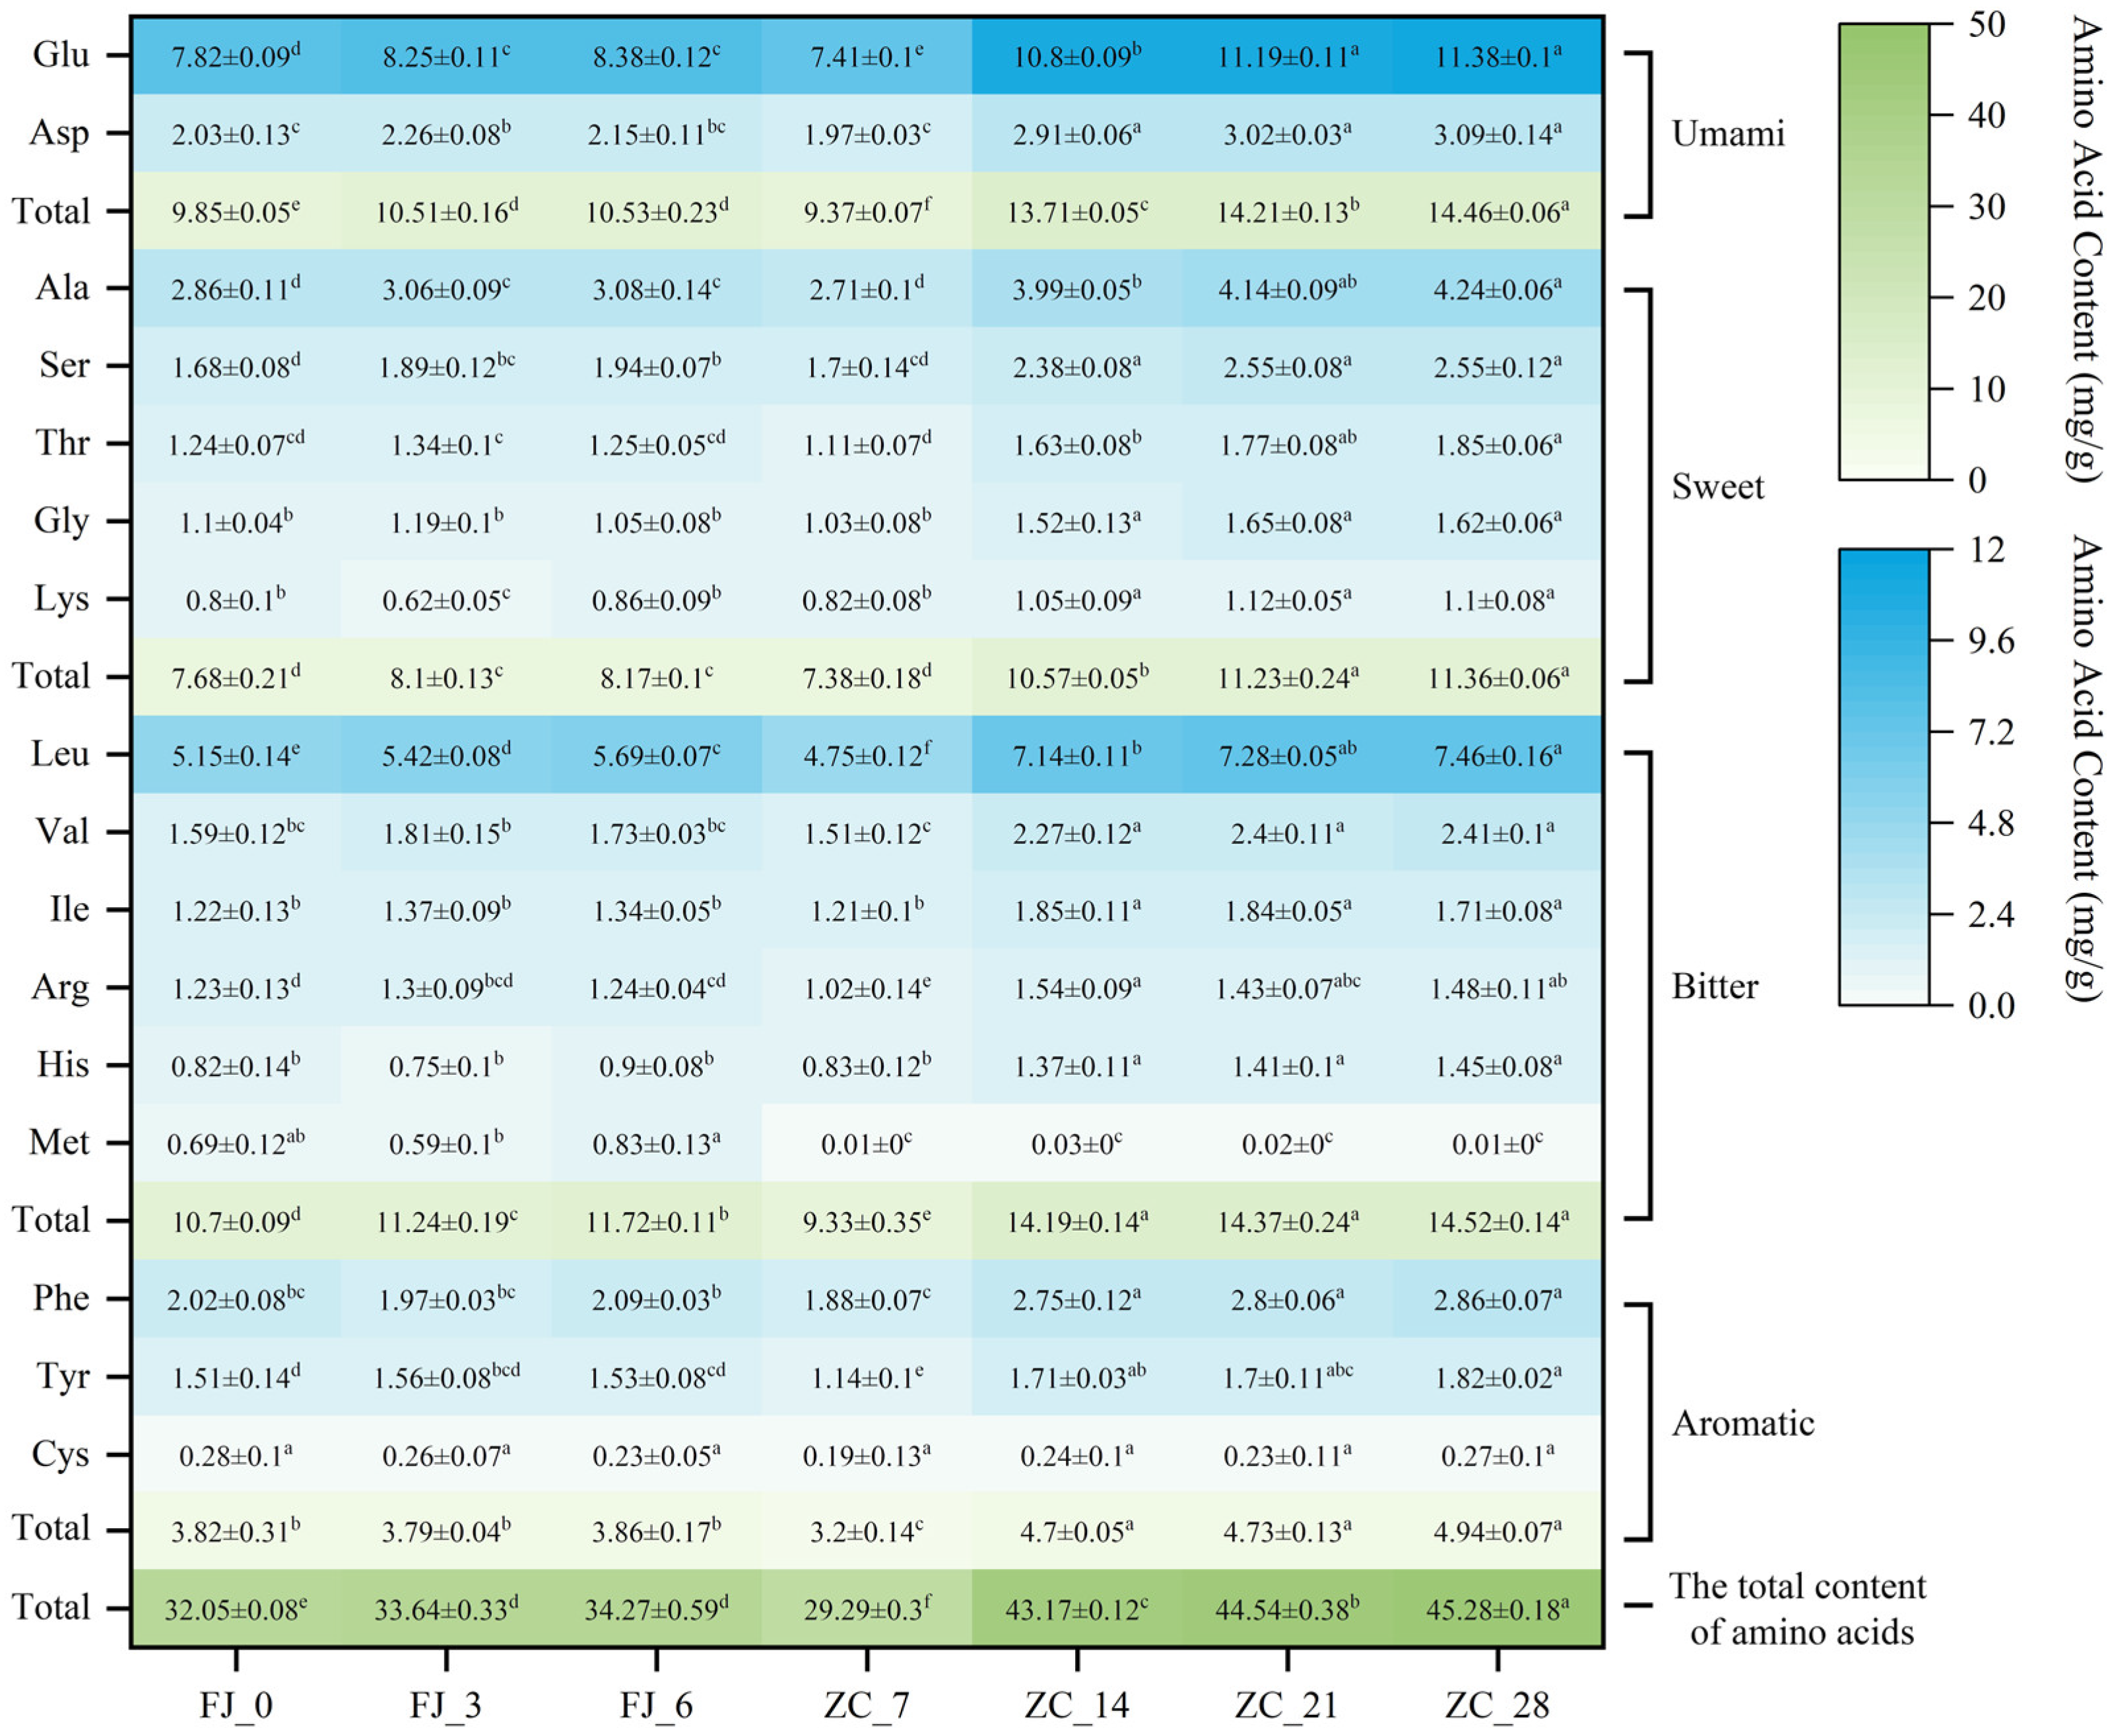
Sixteen amino acids were detected in CGMFF during fermentation and storage. The amino acid composition showed little change at different stages, while the total content of free amino acids presented an upward trend (Figure 7). At the end of storage, the total content of total amino acids in CGMFF increased by 1.42 times. During fermentation, the content of total amino acids increased slightly, with little change in their composition ratio. During storage, the content of free amino acids increased significantly and their composition ratio also changed remarkably. Finally, the proportions of bitter amino acids and aromatic amino acids decreased by 1.32% and 0.99%, respectively, and the proportions of umami amino acids and sweet amino acids increased by 1.21% and 1.1%, respectively. The rapid proliferation of Lactobacillus and Xeromyces during storage led to the production of protein hydrolyzing enzymes through metabolism, which enhanced the protein hydrolysis ability and was the reason for the increase in the total content of total amino acids [29]. Meanwhile, their rapid growth also consumed nitrogen sources. Their combined effect changed the composition ratio of total amino acids. Furthermore, they improved the structural ratio of flavor amino acids and affected the flavor of the fermented product [29]. Corn gluten meal has a strong bitter taste and poor palatability, which limits its application. Fermentation can improve its amino acid composition and enhance palatability.

3.8. Changes in Volatile Substances During Fermentation and Storage Periods

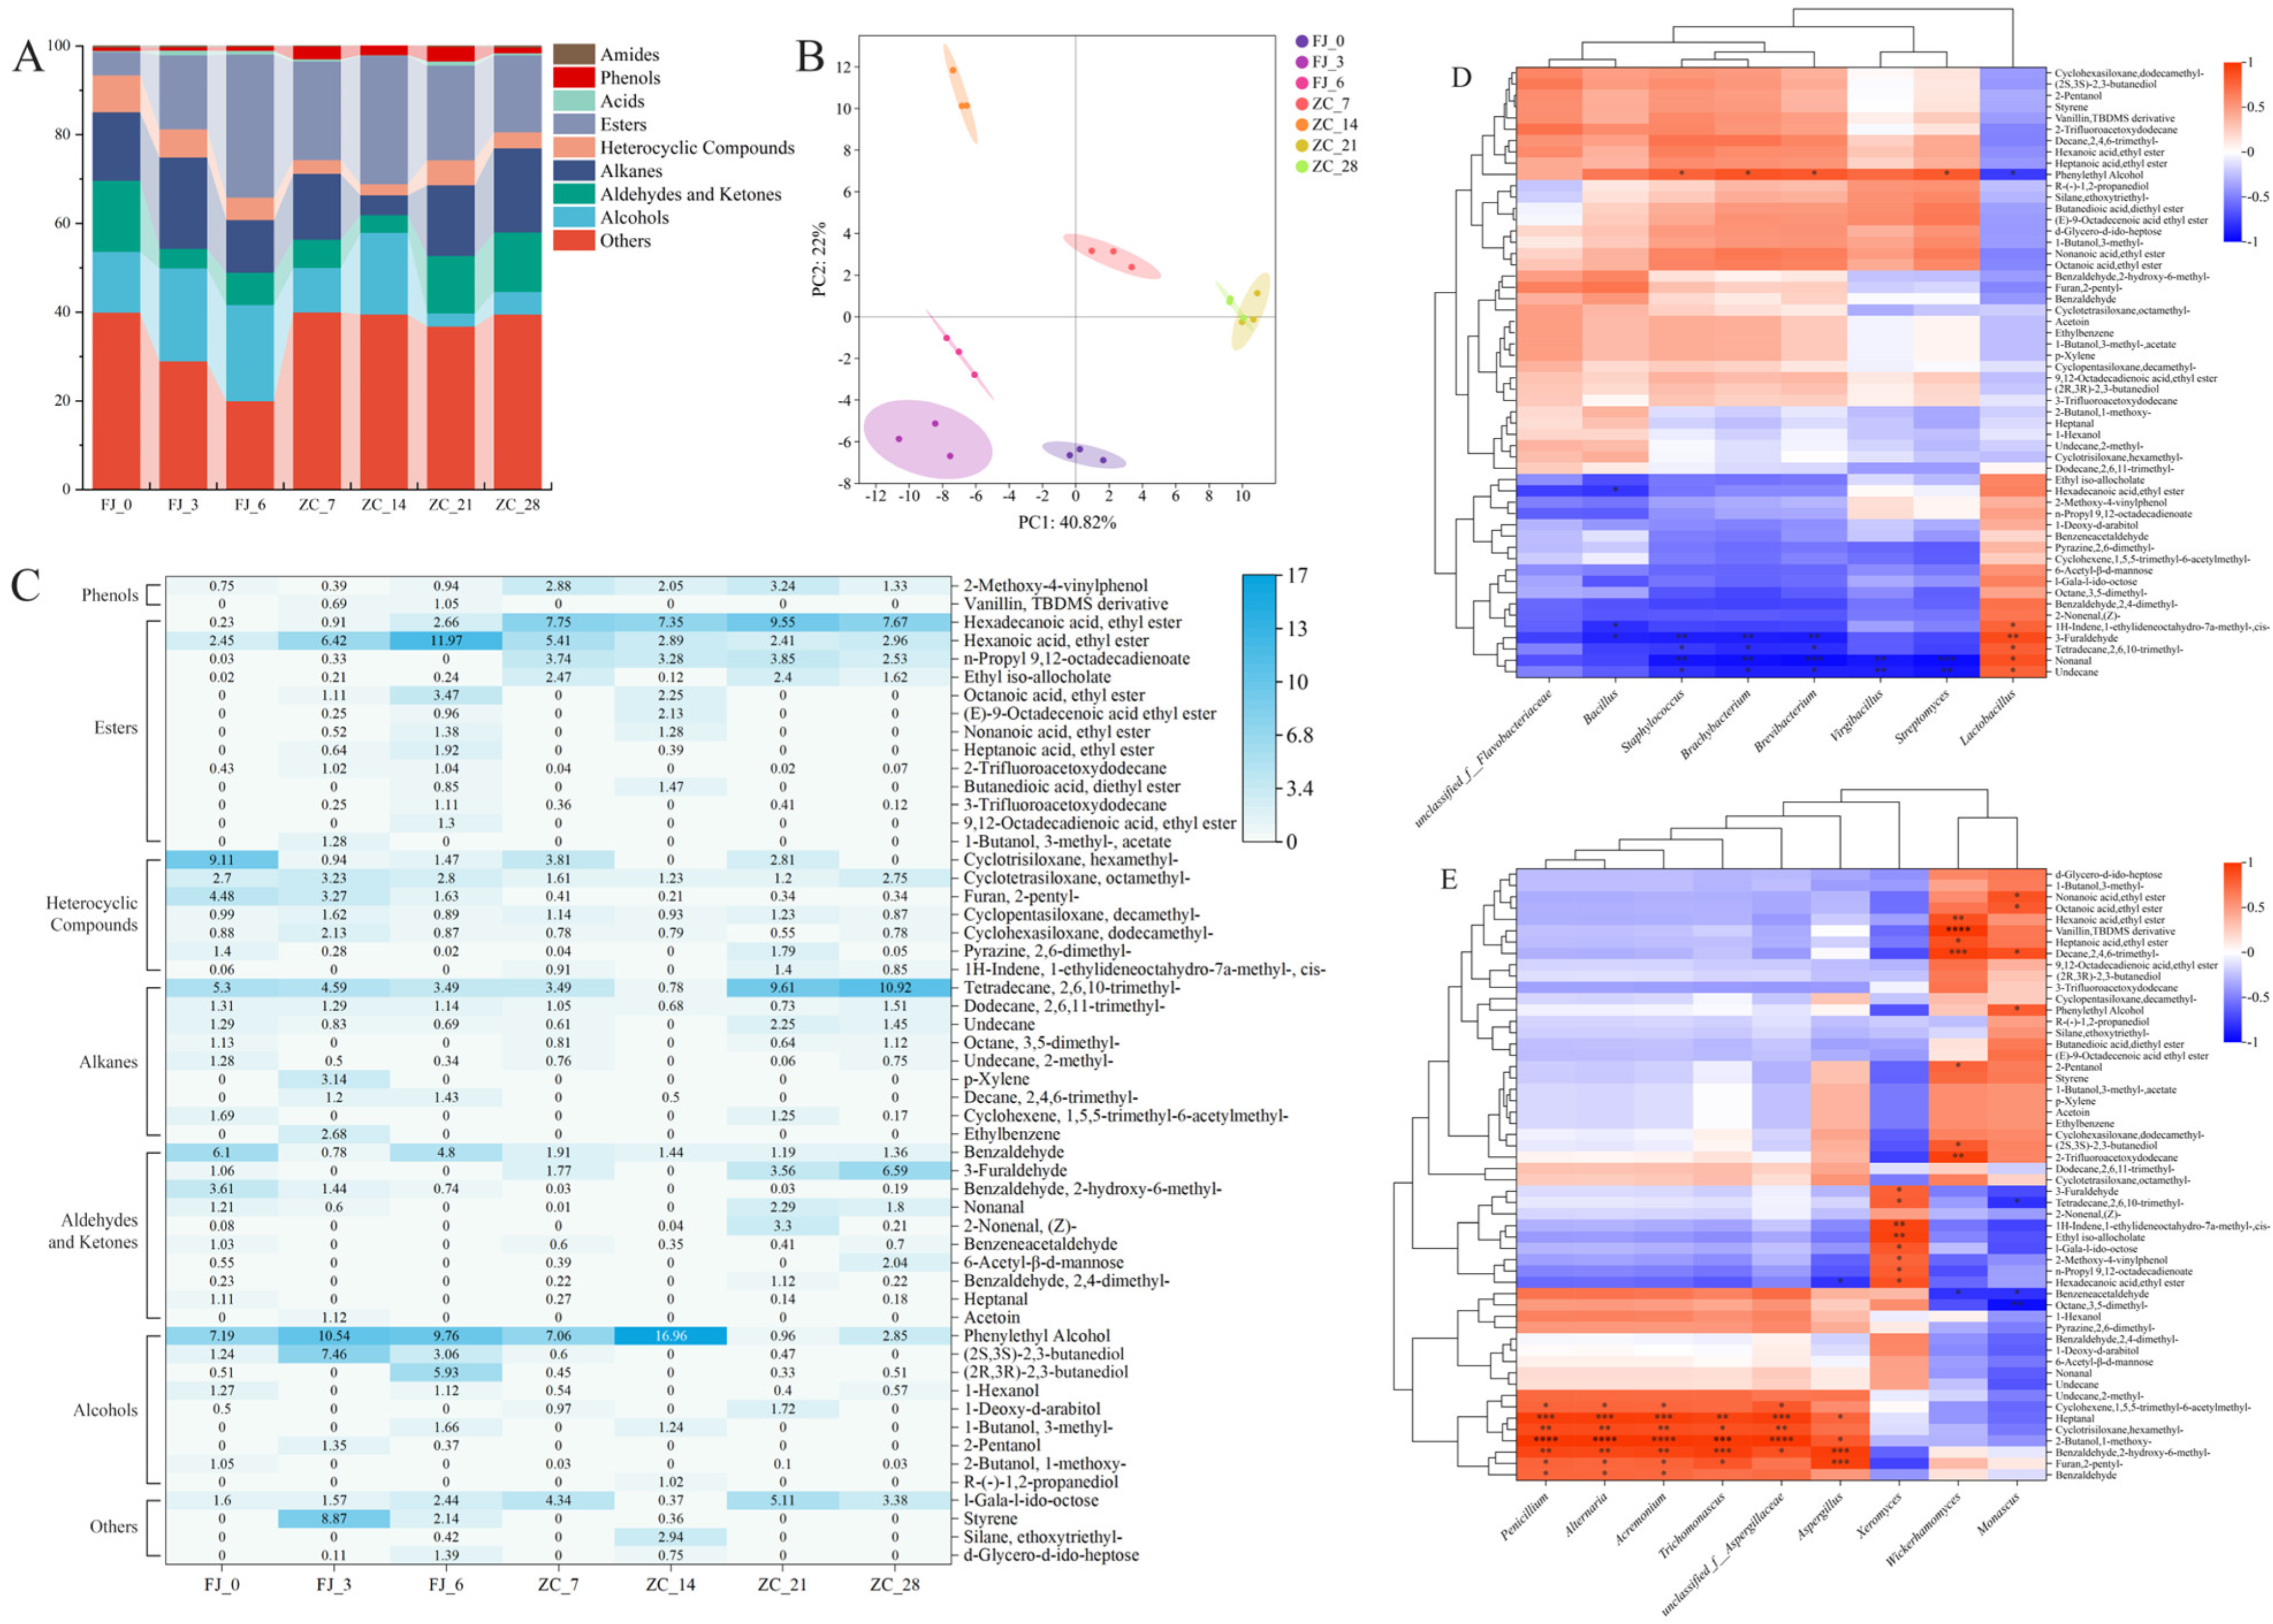
During fermentation and storage, 304 volatile compounds were detected in CGMFF (Figure 8). Among them, 128, 122, 136, 119, 108, 113, and 115 volatile compounds were detected in FJ_0, FJ_3, FJ_6, ZC_7, ZC_14, ZC_21, and ZC_28, respectively. The main volatile compounds during fermentation and storage were esters (72 types), alkanes (33 types), aldehydes and ketones (34 types), and alcohols (26 types), accounting for 20.57 ± 8.85%, 14.59 ± 5.28%, 9.19 ± 4.84%, and 13.28 ± 7.52%, respectively (Figure 8A,C). There were significant differences in volatile compounds of CGMFF during fermentation and storage (Figure 8B). From the positions of each fermentation group in the figure, it can be found that fermentation significantly changed the aroma composition of the raw materials and formed the aroma characteristics of each fermentation period. However, the distance between ZC_21 and ZC_28 groups was relatively close, indicating that after microorganisms occupied the dominant position in the flora, the aroma composition tended to be consistent.
During fermentation, the relative content of ester compounds increased from 5% to 32%, becoming the most abundant aroma compound (Figure 8A). Esters are usually produced by the esterification of free fatty acids and alcohols, and most esters have pleasant floral and fruity aromas [32]. Therefore, fermentation had a positive impact on the aroma of CGMFF. Hexadecanoic acid ethyl ester (balsam, creamy and fruity notes) was the ester compound with the highest relative content (7.67%) at the end of storage. It showed significant positive correlation with the change in the relative abundance of Xeromyces (p < 0.01) and significant negative correlation with Bacillus and Aspergillus (p < 0.01). It was a major aroma component in wine and showed an extremely significant positive correlation with Wickerhamomyces (p < 0.001) [33]. It has been reported that S. cerevisiae can convert glucose into pyruvate through the glycolytic pathway during fermentation and then generate ethanol through ethanol fermentation. The accumulation of ethanol provides the necessary precursor to produce ethyl hexanoate, promoting hexanoic acid ethyl ester formation [34].
The relative content of alcohols increased to 22% during fermentation, making them the second most abundant aroma compounds. Phenylethyl Alcohol (bitter, floral, and honey-like notes) was the dominant alcohol in the fermented feed, reaching the highest relative content (16.96%) on 14 d of storage and dropping to 2.89% at the end of storage. It showed significant positive correlation (p < 0.01) with Streptomyces, Brevibacterium, Brachybacterium, Staphylococcus, and Monascus and significant negative correlation (p < 0.01) with Lactobacillus (Figure 8D). Phenylethyl Alcohol is a key aroma component in fruit wines [33,35]. It is produced from aspartic acid and phenylalanine through transamination, decarboxylation, and deacidification under the action of microbial enzymes (such as transaminases). Alternatively, it can be synthesized by yeast through the Ehrlich pathway using phenylalanine as a precursor [32].
Alkane compounds were the most abundant aroma compounds during storage (19%). Among them, Tetradecane, 2,6,10-trimethyl- (10.92%) was the dominant alkane, which showed significant positive correlation with Lactobacillus and Xeromyces (p < 0.01). Tetradecane, 2,6,10-trimethyl- is a major aroma component in loquat wine from the late main fermentation to the post-fermentation stage [35]. Aldehyde and ketone compounds made a relatively high contribution to the overall aroma at the end of storage (13%). Among them, the relative content of 3-Furaldehyde reached 6.59% at the end of storage, which was significantly positively correlated with Lactobacillus and Xeromyces (p < 0.01), and significantly negatively correlated with Brevibacterium, Brachybacterium, Staphylococcus, and Bacillus (p < 0.01). The content of phenolic compounds was lower than 3.5% during fermentation and storage, while the contents of acids and amides were both lower than 2%, exerting little impact on the overall flavor.

4. Conclusions

In this study, mixed strains were used for solid-state fermentation of CGMFF. The microbial community structure, fermentation quality, and volatile flavor during the fermentation and storage processes were analyzed. It was found that Lactobacillus and Xeromyces became the dominant genera in the end, with their relative abundance exceeding 96%. Meanwhile, the flavor of the fermented feed was effectively improved. In addition, the protein properties in corn gluten meal were enhanced, and the contents of soluble protein, free amino acids, and oligopeptides were increased. This research provides a basis for the application of corn gluten meal in fermented feed and is expected to alleviate the shortage of high-protein feed raw materials in China.

Author Contributions

Conceptualization, S.C., Y.X. and N.H.; funding acquisition, S.C.; investigation, K.L., J.S. and S.L.; methodology, S.L., Y.X., S.C. and N.H.; software, K.L., J.S. and H.Z.; supervision, S.C.; visualization, N.H., J.S. and H.Z.; writing—original draft, N.H. and H.Z.; writing—review and editing, S.C. All authors have read and agreed to the published version of the manuscript.

Funding

This work was supported by grants from the major scientific and technological project of the “Hundreds, Thousands and Tens of Thousands” program in Heilongjiang Province (No. SC2020ZX06B0011).

Institutional Review Board Statement

Not applicable.

Informed Consent Statement

Not applicable.

Data Availability Statement

The original contributions presented in the study are included in the article; further inquiries can be directed to the corresponding author.

Conflicts of Interest

Author Nan Hu, Shuying Li, and Yongping Xu were employed by the company Dalian SEM Bio-Engineering Technology Co., Ltd. The remaining authors declare that the research was conducted in the absence of any commercial or financial relationships that could be construed as a potential conflict of interest.

Abbreviations

The following abbreviations are used in this manuscript:
CGMFFCorn Gluten Meal-based Fermented Feed
CFU/mLColony-Forming Unit per Milliliter
CFU/gColony-Forming Unit per Gram
YPDYeast Extract Peptone Dextrose (agar medium)
LBLuria–Bertani (agar medium)
MRSMan, Rogosa, and Sharpe (agar medium)
PCRPolymerase Chain Reaction
ITSInternal Transcribed Spacer
SDStandard Deviation
PCoAPrincipal Coordinates Analysis
CCACanonical Correspondence Analysis
FAAFree Amino Acids
NH3NAmmonia Nitrogen
SPSoluble Protein
CPCrude Protein
SSSoluble Sugar

References

  1. Yang, S.; Cui, X. Large-scale production: A possible way to the balance between feed grain security and meat security in China. J. Agric. Food Res. 2023, 14, 100745. [Google Scholar] [CrossRef]
  2. Kim, S.W.; Less, J.F.; Wang, L.; Yan, T.; Kiron, V.; Kaushik, S.J.; Lei, X.G. Meeting global feed protein demand: Challenge, opportunity, and strategy. Annu. Rev. Anim. Biosci. 2019, 7, 221–243. [Google Scholar] [CrossRef] [PubMed]
  3. Zhang, Y.; He, Z.; Xu, M.; Zhang, X.; Cao, S.; Hu, Y.; Luan, G. Physicochemical properties and protein structure of extruded corn gluten meal: Implication of temperature. Food Chem. 2023, 399, 133985. [Google Scholar] [CrossRef]
  4. Zhuang, H.; Tang, N.; Yuan, Y. Purification and identification of antioxidant peptides from corn gluten meal. J. Funct. Foods 2013, 5, 1810–1821. [Google Scholar] [CrossRef]
  5. Su, W.F.; Jiang, Z.P.; Hao, L.H.; Li, W.T.; Gong, T.; Zhang, Y.; Du, S.; Wang, C.; Lu, Z.Q.; Jin, M.L.; et al. variations of soybean meal and corn mixed substrates in physicochemical characteristics and microbiota during two-stage solid-state fermentation. Front. Microbiol. 2021, 12, 688839. [Google Scholar]
  6. Wang, Y.; Liu, J.; Wei, F.; Liu, X.; Yi, C.; Zhang, Y. Improvement of the nutritional value, sensory properties and bioavailability of rapeseed meal fermented with mixed microorganisms. LWT 2019, 112, 108238. [Google Scholar] [CrossRef]
  7. Fan, L.; Liu, X.L.; Deng, Y.P.; Zheng, X.Q. Preparation of glutamine-enriched fermented feed from corn gluten meal and its functionality evaluation. Foods 2023, 12, 4336. [Google Scholar] [CrossRef]
  8. Su, W.F.; Jiang, Z.P.; Wang, C.; Xu, B.C.; Lu, Z.Q.; Wang, F.Q.; Zong, X.; Jin, M.L.; Wang, Y.Z. Dynamics of defatted rice bran in physicochemical characteristics, microbiota and metabolic functions during two-stage co-fermentation. Int. J. Food Microbiol. 2022, 362, 109489. [Google Scholar] [CrossRef]
  9. Li, Z.; Zheng, M.; Zheng, J.; Gänzle, M.G. Bacillus species in food fermentations: An underappreciated group of organisms for safe use in food fermentations. Curr. Opin. Food Sci. 2023, 50, 101007. [Google Scholar] [CrossRef]
  10. Bai, J.; Franco, M.; Ding, Z.T.; Hao, L.; Ke, W.C.; Wang, M.S.; Xie, D.M.; Li, Z.Q.; Zhang, Y.X.; Ai, L.; et al. Effect of Bacillus amyloliquefaciens and Bacillus subtilis on fermentation, dynamics of bacterial community and their functional shifts of whole-plant corn silage. J. Anim. Sci. Biotechnol. 2022, 13, 7. [Google Scholar] [CrossRef]
  11. Zhao, P.H.; Hou, Y.C.; Wang, Z.; Liao, A.M.; Pan, L.; Zhang, J.; Dong, Y.Q.; Hu, Z.Y.; Huang, J.H.; Ou, X.Q. Effect of fermentation on structural properties and antioxidant activity of wheat gluten by Bacillus subtilis. Front. Nutr. 2023, 10, 1116982. [Google Scholar] [CrossRef]
  12. Schlabitz, C.; Lehn, D.N.; de Souza, C.F.V. A review of Saccharomyces cerevisiae and the applications of its byproducts in dairy cattle feed: Trends in the use of residual brewer’s yeast. J. Clean. Prod. 2022, 332, 130059. [Google Scholar] [CrossRef]
  13. Wani, A.K.; Rahayu, F.; Yustina, I.; Fatah, G.S.A.; Kariada, I.K.; Antarlina, S.S.; Akhmad, J.; Pamungkas, D. Contribution of yeast and its biomass for the preparation of industrially essential materials: A boon to circular economy. Bioresour. Technol. Rep. 2023, 23, 101508. [Google Scholar] [CrossRef]
  14. Bayat, E.; Moosavi-Nasab, M.; Fazaeli, M.; Majdinasab, M.; Mirzapour-Kouhdasht, A.; Garcia-Vaquero, M. Wheat germ fermentation with Saccharomyces cerevisiae and Lactobacillus plantarum: Process optimization for enhanced composition and antioxidant properties in vitro. Foods 2022, 11, 1125. [Google Scholar] [CrossRef]
  15. Sukhikh, S.; Kalashnikova, O.; Ivanova, S.; Prosekov, A.; Krol, O.; Kriger, O.; Fedovskikh, N.; Babich, O. Evaluating the influence of microbial fermentation on the nutritional value of soybean meal. Fermentation 2022, 8, 458. [Google Scholar] [CrossRef]
  16. Zhang, L.; Zhou, X.; Gu, Q.; Liang, M.; Mu, S.; Zhou, B.; Huang, F.; Lin, B.; Zou, C. Analysis of the correlation between bacteria and fungi in sugarcane tops silage prior to and after aerobic exposure. Bioresour. Technol. 2019, 291, 121835. [Google Scholar] [CrossRef]
  17. Wang, C.; He, L.; Xing, Y.; Zhou, W.; Yang, F.; Chen, X.; Zhang, Q. Fermentation quality and microbial community of alfalfa and stylo silage mixed with Moringa oleifera leaves. Bioresour. Technol. 2019, 284, 240–247. [Google Scholar] [CrossRef]
  18. Li, Y.F.; Jeong, E.C.; Wang, L.L.; Kim, H.J.; Ahmadi, F.; Kim, J.G. Effects of sodium diacetate and microbial inoculants on fermentation of forage rye. J. Anim. Sci. Technol. 2023, 65, 96. [Google Scholar] [CrossRef]
  19. Wang, Y.; He, L.; Xing, Y.; Zhou, W.; Pian, R.; Yang, F.; Chen, X.; Zhang, Q. Bacterial diversity and fermentation quality of Moringa oleifera leaves silage prepared with lactic acid bacteria inoculants and stored at different temperatures. Bioresour. Technol. 2019, 284, 349–358. [Google Scholar] [CrossRef]
  20. Cong, S.Z.; Sun, M.; Cao, Y.J.; Zhao, H.J.; Sun, J.Y.; Li, G.L.; Liu, X.L.; Hu, N. Effects of Lactic Acid Bacteria-Directed Screening on Flavor and Functional Properties of Fermented Corn Protein Hydrolysate. Foods 2025, 14, 3074. [Google Scholar] [CrossRef]
  21. Ni, K.K.; Zhao, J.Y.; Zhu, B.G.; Su, R.; Pan, Y.; Ma, J.K.; Zou, G.A.; Tao, Y.; Liu, X.R.; Zhong, J. Assessing the fermentation quality and microbial community of the mixed silage of forage soybean with crop corn or sorghum. Bioresour. Technol. 2018, 265, 563–567. [Google Scholar] [CrossRef]
  22. Liu, M.J.; Wang, Y.; Wang, Z.J.; Bao, J.; Zhao, M.Q.; Ge, G.T.; Jia, Y.S.; Du, S. Effects of isolated LAB on chemical composition, fermentation quality and bacterial community of stipa grandis silage. Microorganisms 2022, 10, 2463. [Google Scholar] [CrossRef]
  23. Ma, D.B.; Li, J.W.; Liu, J.K.; Wang, R.X.; Meng, Q.W.; Li, J.P.; Zhang, S.J.; Shan, A.S. The gain effect of microbial consortia induced by adaptive domestication for efficient conversion of Chinese cabbage waste by anaerobic fermentation. Sci. Total Environ. 2024, 922, 171313. [Google Scholar] [CrossRef]
  24. Fang, L.P.; Wang, W.J.; Dou, Z.X.; Chen, J.; Meng, Y.C.; Cai, L.Q.; Li, Y.H. Effects of mixed fermentation of different lactic acid bacteria and yeast on phytic acid degradation and flavor compounds in sourdough. LWT 2023, 174, 114438. [Google Scholar] [CrossRef]
  25. Dierings, L.R.; Braga, C.M.; Silva, K.M.D.; Wosiacki, G.; Nogueira, A. Population dynamics of mixed cultures of yeast and lactic acid bacteria in cider conditions. Braz. Arch. Biol. Technol. 2013, 56, 837–847. [Google Scholar] [CrossRef]
  26. Nazar, M.; Wang, S.; Zhao, J.; Dong, Z.; Li, J.; Ali Kaka, N.; Shao, T. Effects of various epiphytic microbiota inoculation on the fermentation quality and microbial community dynamics during the ensiling of sterile Napier grass. J. Appl. Microbiol. 2021, 130, 1466–1480. [Google Scholar] [CrossRef]
  27. Tharangani, R.M.H.; Yakun, C.; Zhao, L.S.; Ma, L.; Liu, H.L.; Su, S.L.; Shan, L.; Yang, Z.N.; Kononoff, P.J.; Weiss, W.P.; et al. Corn silage quality index: An index combining milk yield, silage nutritional and fermentation parameters. Anim. Feed Sci. Technol. 2021, 273, 114817. [Google Scholar]
  28. Li, S.; Bao, Y.; Lv, M.; Zhang, L.; Liu, L.; Liu, Y.; Lu, Q. Comparative Na+ and K+ profiling reveals microbial community assembly of alfalfa silage in different saline-alkali soils. Fermentation 2023, 9, 877. [Google Scholar] [CrossRef]
  29. Ruan, W.; Liu, J.L.; Li, P.L.; Zhao, W.; Zhang, A.X.; Liu, S.Y.; Wang, Z.X.; Liu, J.K. Flavor production driven by microbial community dynamics and their interactions during two-stage fermentation of Ziziphus jujuba vinegar. Food Biosci. 2024, 57, 103537. [Google Scholar]
  30. Grossmann, L.; McClements, D.J. Current insights into protein solubility: A review of its importance for alternative proteins. Food Hydrocoll. 2023, 137, 108416. [Google Scholar] [CrossRef]
  31. Yu, X.; Chen, Y.; Qi, Z.; Chen, Q.; Cao, Y.; Kong, Q. Preparation and identification of a novel peptide with high antioxidant activity from corn gluten meal. Food Chem. 2023, 424, 136389. [Google Scholar] [CrossRef]
  32. Zhang, X.; Gao, P.; Xia, W.; Jiang, Q.; Liu, S.; Xu, Y. Characterization of key aroma compounds in low-salt fermented sour fish by gas chromatography-mass spectrometry, odor activity values, aroma recombination and omission experiments. Food Chem. 2022, 397, 133773. [Google Scholar]
  33. Cheng, G.; Liu, Y.; Yue, T.X.; Zhang, Z.W. Comparison between aroma compounds in wines from four Vitis vinifera grape varieties grown in different shoot positions. Food Sci. Technol. 2015, 35, 237–246. [Google Scholar] [CrossRef]
  34. Bai, J.; He, L.Z.; Zhang, J.F.; Gu, X.Y.; Wu, B.Q.; Wang, A.L.; Zhu, Y.; Zhang, J.Y.; Zhao, Y.S.; Yuan, J.; et al. Influences of Lactiplantibacillus plantarum and Saccharomyces cerevisiae fermentation on the nutritional components, flavor property and lipid-lowering effect of highland barley. J. Future Foods 2024, 4, 258–266. [Google Scholar]
  35. Liu, X.F.; Li, N.Y.; Zhao, X.Y.; Zhang, Y.; Muhammad, H.; Zhong, H.; Feng, Z.W.; Guan, R.F. Sensory and chemical characterizations of aroma during the loquat wine fermentation. Food Biosci. 2024, 58, 103731. [Google Scholar] [CrossRef]
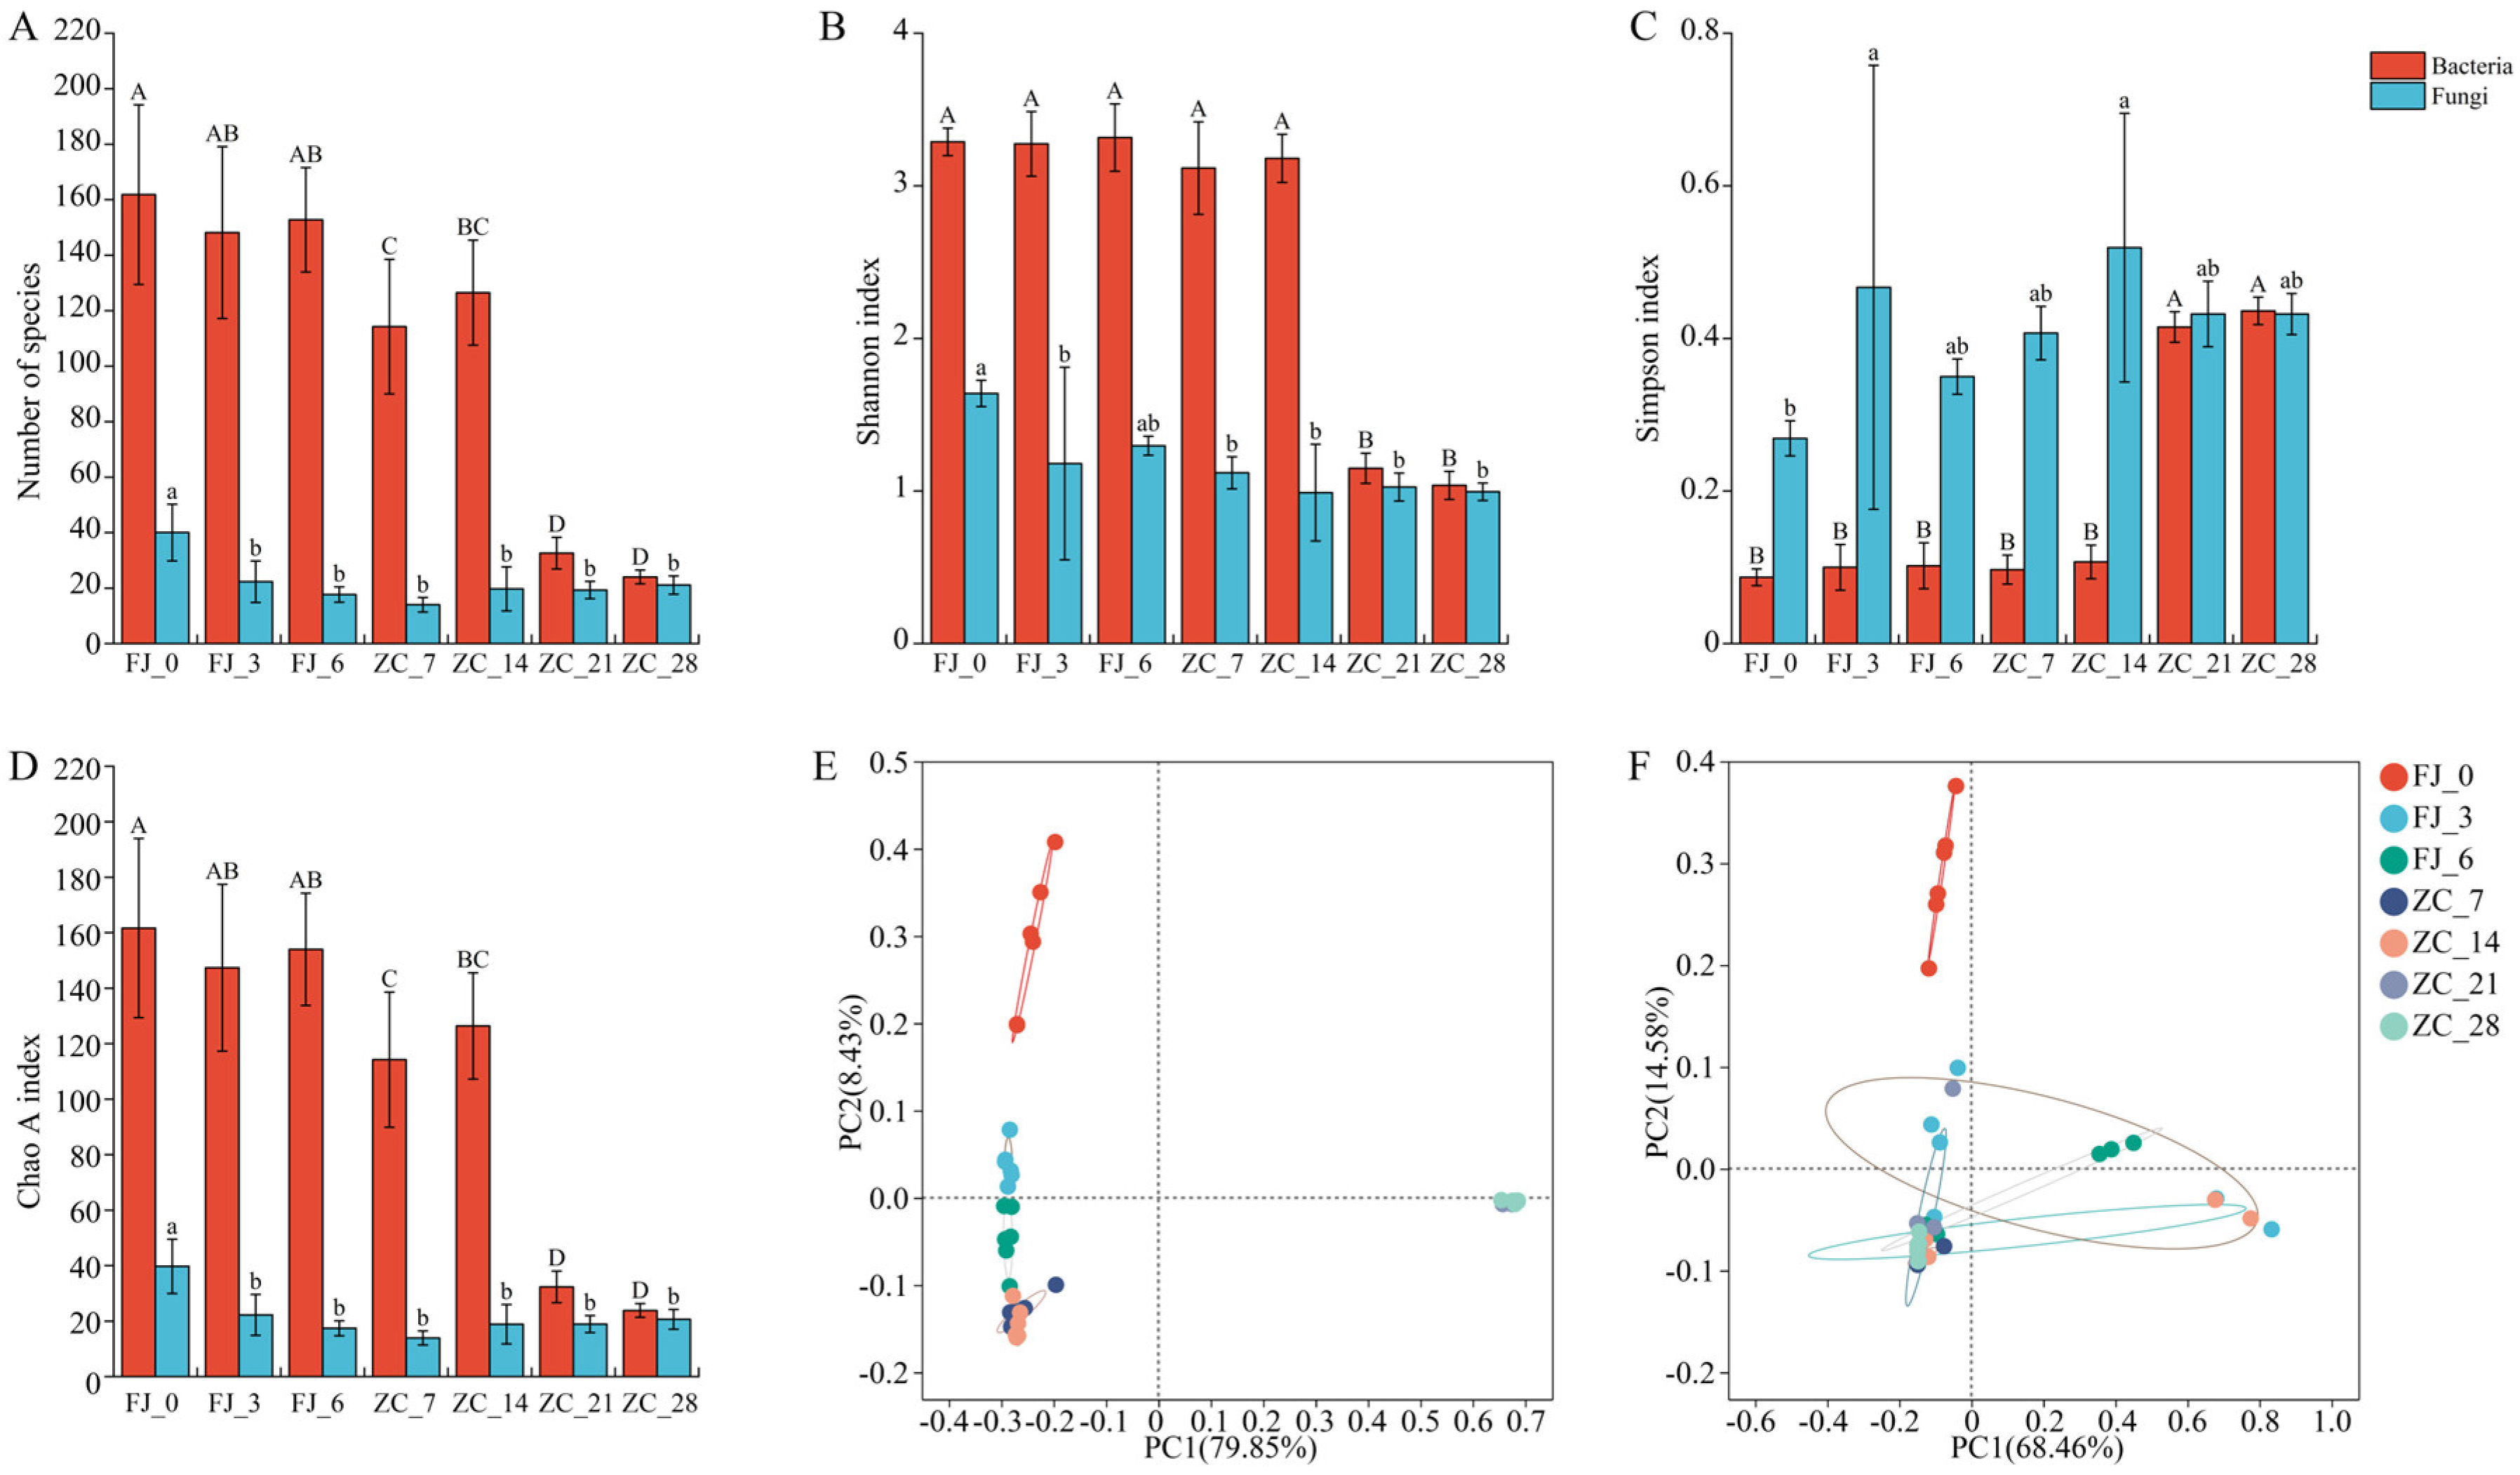
Figure 1. Microbial diversity of fermented feed with corn gluten meal as the main ingredient before and after fermentation and during storage. (A) Number of bacterial and fungal species; (B) Shannon index of bacteria and fungi; (C) Simpson index of bacteria and fungi; (D) Chao A index of bacteria and fungi; (E) two-dimensional PCoA analysis of bacteria; (F) two-dimensional PCoA analysis of fungi. FJ_0—after inoculation; FJ_3—3 days of fermentation; FJ_6—end of fermentation; ZC_7—7 days of storage; ZC_14—14 days of storage; ZC_21—21 days of storage; ZC_28—28 days of storage. Different uppercase and lowercase letters indicate significant differences between groups (p < 0.05).
Fermentation 12 00107 g001
Figure 2. Relative abundance diagram of microorganisms in CGMFF before and after fermentation and during storage. (A) Relative abundance of bacteria at the phylum level, (B) relative abundance of fungi at the phylum level, (C) relative abundance of bacteria at the genus level, (D) relative abundance of fungi at the genus level. FJ_0—after inoculation, FJ_3—3 days of fermentation, FJ_6—end of fermentation, ZC_7—7 days of storage, ZC_14—14 days of storage, ZC_21—21 days of storage, ZC_28—28 days of storage. Only the top 10 microorganisms in terms of relative abundance at the phylum and genus levels are shown in the figure.
Fermentation 12 00107 g002
Figure 3. Changes in the number of viable microorganisms, pH value, titratable acid content, and soluble sugar content in corn gluten meal-based fermented feed before and after fermentation and during storage period. Note: (A) changes in the number of viable lactic acid bacteria, yeast, and Bacillus subtilis; (B) changes in pH value and titratable acid content; (C) changes in soluble sugar content. FJ_0—after inoculation, FJ_1.5—1.5 days of fermentation, FJ_3—3 days of fermentation, FJ_6—end of fermentation, ZC_7—7 days of storage, ZC_14—14 days of storage, ZC_21—21 days of storage, ZC_28—28 days of storage. Different uppercase letters, lowercase letters and special symbols letters indicate significant differences between groups (p < 0.05).
Fermentation 12 00107 g003
Figure 4. Changes in crude protein, ammonia nitrogen, and soluble protein contents in corn gluten meal-based fermented feed during fermentation and storage periods. (A) Changes in crude protein content; (B) changes in the ratio of ammonia nitrogen to total nitrogen; (C) changes in soluble protein content. FJ_0—after inoculation, FJ_3—3 days of fermentation, FJ_6—end of fermentation, ZC_7—7 days of storage, ZC_14—14 days of storage, ZC_21—21 days of storage, ZC_28—28 days of storage. Different superscript letters indicate significant differences between groups (p < 0.05).
Fermentation 12 00107 g004
Figure 5. Correlation analysis between microorganisms and environmental factors at the genus level. Note: (A) CCA analysis of bacterial genera and environmental factors; (B) CCA analysis of fungal genera and environmental factors; (C) Spearman correlation analysis of bacterial genera and environmental factors; (D) Spearman correlation analysis of fungal genera and environmental factors. Environmental factors: NH3N—ammonia nitrogen, SP—soluble protein, CP—crude protein, SS—soluble sugar. Groups: FJ_0—after inoculation, FJ_3—3 days of fermentation, FJ_6—end of fermentation, ZC_7—7 days of storage, ZC_14—14 days of storage, ZC_21—21 days of storage, ZC_28—28 days of storage. * p < 0.05; ** p < 0.01, *** p < 0.001, **** p < 0.0001.
Fermentation 12 00107 g005
Figure 6. Protein molecular weight distribution and peak area percentage change charts. (A) Protein molecular weight distribution chart; (B) change chart of the ratio of protein peak area to total peak area. Gel filtration chromatography was used to analyze the protein molecular weight distribution at different fermentation times. The abscissa represents the elution volume in mL, and the ordinate represents the absorbance in mAU. FJ_0—after inoculation, FJ_3—3 days of fermentation, FJ_6—end of fermentation, ZC_7—7 days of storage, ZC_14—14 days of storage, ZC_21—21 days of storage, ZC_28—28 days of storage.
Fermentation 12 00107 g006
Figure 7. Amino acid composition and content of corn gluten meal-based fermented feed before and after fermentation and during storage. FJ_0—after inoculation, FJ_3—3 days of fermentation, FJ_6—end of fermentation, ZC_7—7 days of storage, ZC_14—14 days of storage, ZC_21—21 days of storage, ZC_28—28 days of storage. Different superscript letters in the same row indicate significant differences between groups (p < 0.05).
Fermentation 12 00107 g007
Figure 8. Contents of volatile compounds (>1%) and correlations between microorganisms and volatile compounds during fermentation and storage periods of CGMFF (Top 8 bacterial genera in relative abundance). (A) Changes in relative contents of different types of volatile compounds; (B) principal component analysis of volatile compounds in CGMFF during fermentation and storage; (C) changes in relative contents of volatile compounds (>1%); (D) Spearman correlation analysis between bacterial genera and volatile compounds; (E) Spearman correlation analysis between fungal genera and volatile compounds. FJ_0—after inoculation, FJ_3—3 days of fermentation, FJ_6—end of fermentation, ZC_7—7 days of storage, ZC_14—14 days of storage, ZC_21—21 days of storage, ZC_28—28 days of storage. * p < 0.05; ** p < 0.01, *** p < 0.001, **** p < 0.0001.
Fermentation 12 00107 g008
Disclaimer/Publisher’s Note: The statements, opinions and data contained in all publications are solely those of the individual author(s) and contributor(s) and not of MDPI and/or the editor(s). MDPI and/or the editor(s) disclaim responsibility for any injury to people or property resulting from any ideas, methods, instructions or products referred to in the content.