Article

Influence of Cryoextraction and Cold Pre-Fermentative Maceration on the Yeast Microbiota and the Volatile Compounds Profile of Sangiovese Wine

1
FoodMicroTeam s.r.l, Academic Spin-Off of University of Florence, Via Santo Spirito 14, 50125 Florence, Italy
2
Department of Agriculture, Food, Environment and Forestry (DAGRI), Via San Bonaventura, 13, 50145 Florence, Italy
*
Author to whom correspondence should be addressed.
Fermentation 2024, 10(3), 148; https://doi.org/10.3390/fermentation10030148
Submission received: 15 February 2024 / Revised: 1 March 2024 / Accepted: 4 March 2024 / Published: 6 March 2024
(This article belongs to the Special Issue Innovative Strategies for the Management of Wine Fermentations)

Abstract

:
Low-temperature treatments can be applied to grapes or must before alcoholic fermentation to enhance the wine’s sensory characteristics. Several studies have shown that such practices have a positive effect on the polyphenol profile of the wine, but only a few surveys have examined the effect of these treatments on the yeast microbiota of grapes and wine. Therefore, this study aimed to evaluate how cryoextraction (freezing the grape with liquid nitrogen) and cold pre-fermentative maceration (at 5 °C for 48 h) affect the Saccharomyces and non-Saccharomyces populations during the winemaking process of red grapes, cv Sangiovese, conducted at two temperatures (20 and 30 °C). This research analyzed the concentration of various yeast species, their fermentation abilities, and the resulting wine’s aromatic profile. The Principal Component Analysis performed on yeast concentrations during the fermentations of various wines did not group the experimental wines based on treatment. However, the same groupings were highlighted when the concentrations of the volatile compounds, quantified in the experimental wines, were processed using the same statistical approach. Therefore, cryoextraction and cold pre-fermentative maceration seem to contribute less to the aromatic profile than the yeasts involved in the fermentation process.

1. Introduction

Low-temperature treatments of grapes or must before alcoholic fermentation can be used in winemaking to improve the color and aroma of wines [1]. Among these techniques, the “cold pre-fermentative maceration” (CPM) is often used in red winemaking and consists of maintaining the grape juice at low temperatures for a few days (5–15 °C for 4–10 days) for improving the extraction of water-soluble compounds from the skins and seeds of the berries and avoiding, at the same time, the onset of the fermentation process [1,2,3]. This treatment damages the walls of the berry cells, and skin phenolic compounds, such as flavan-3-ols, anthocyanins, and flavonols can be released in grape juice [4]. Considering that phenolic compounds affect some of the most significant organoleptic attributes in red wines such as color, bitterness, and astringency, CPM can potentially improve the quality of the wine [5,6,7,8]. As concerns the impact of cold pre-fermentative maceration on the release of volatile compounds, fewer studies have been conducted and demonstrated that the impact of this treatment mainly depended on the grape varieties [1,9,10]. For instance, Santis and Frangipane [11] pointed out that cold pre-fermentative maceration increased the concentrations of some esters, terpenes, and 2-phenyl ethanol in Merlot wines, whereas Cai et al. [1] showed a decrease in some fusel alcohols (isobutanol and isopentanol) and an increase in acetate esters in Cabernet Sauvignon wines. As a modification of the classical cold pre-fermentative maceration, a method known as cryoextraction involving freezing the grapes before pressing [12] has been developed. When the grapes are frozen, the ice crystals tear the pectocellulose walls, disorganizing the grape skin and facilitating the extraction process of various compounds [13]. This procedure can be accomplished in two ways: by freezing the grapes before pressing (cryoextraction) or by freezing the grapes followed sequentially by defrosting and pressing (supraextraction). A recent study demonstrated that both freezing techniques produced wines with a more intense aroma and the best rating by the tasting panel compared with the same wines obtained by traditional methods [14].
Although it is commonly accepted that cold pre-fermentation maceration increases the content of aroma substances in wine, contradictory results have been reported [3]. In any case, the grape cultivar, the ripening status of the berries, and the parameters of the cold maceration (temperature, time, use of enzyme, or dry ice additions) have a central role in making this treatment effective in improving the organoleptic characteristics of wine [3].
The studies reported above demonstrated the usefulness of low-temperature treatments of grapes or must before alcoholic fermentation to improve organoleptic attributes in wine. However, very few studies are available on the impact of these treatments on the yeast microbiota of grapes or wine [15,16]. The growth of yeasts during wine fermentations is influenced by several factors such as the temperature of fermentation, pH, and nutrients of the must, and by winemaking practices such as maceration [17].
To expand our understanding in this field, the goals of this study were the evaluation of cryoextraction and cold pre-fermentative maceration on yeast populations during the winemaking process of Sangiovese grapes and the aromatic profile of the wine obtained. According to our knowledge, only a few authors [18,19,20,21] have examined the application of cryoextraction for the production of red wines from Sangiovese grapes. Therefore, this study aims to deepen the scientific knowledge of the cold pre-fermentative maceration and cryoextraction applied to the Sangiovese, one of the most renowned vines in Tuscany, by evaluating micro vinifications carried out at the winery level in 10 hL stainless steel tanks.

2. Materials and Methods
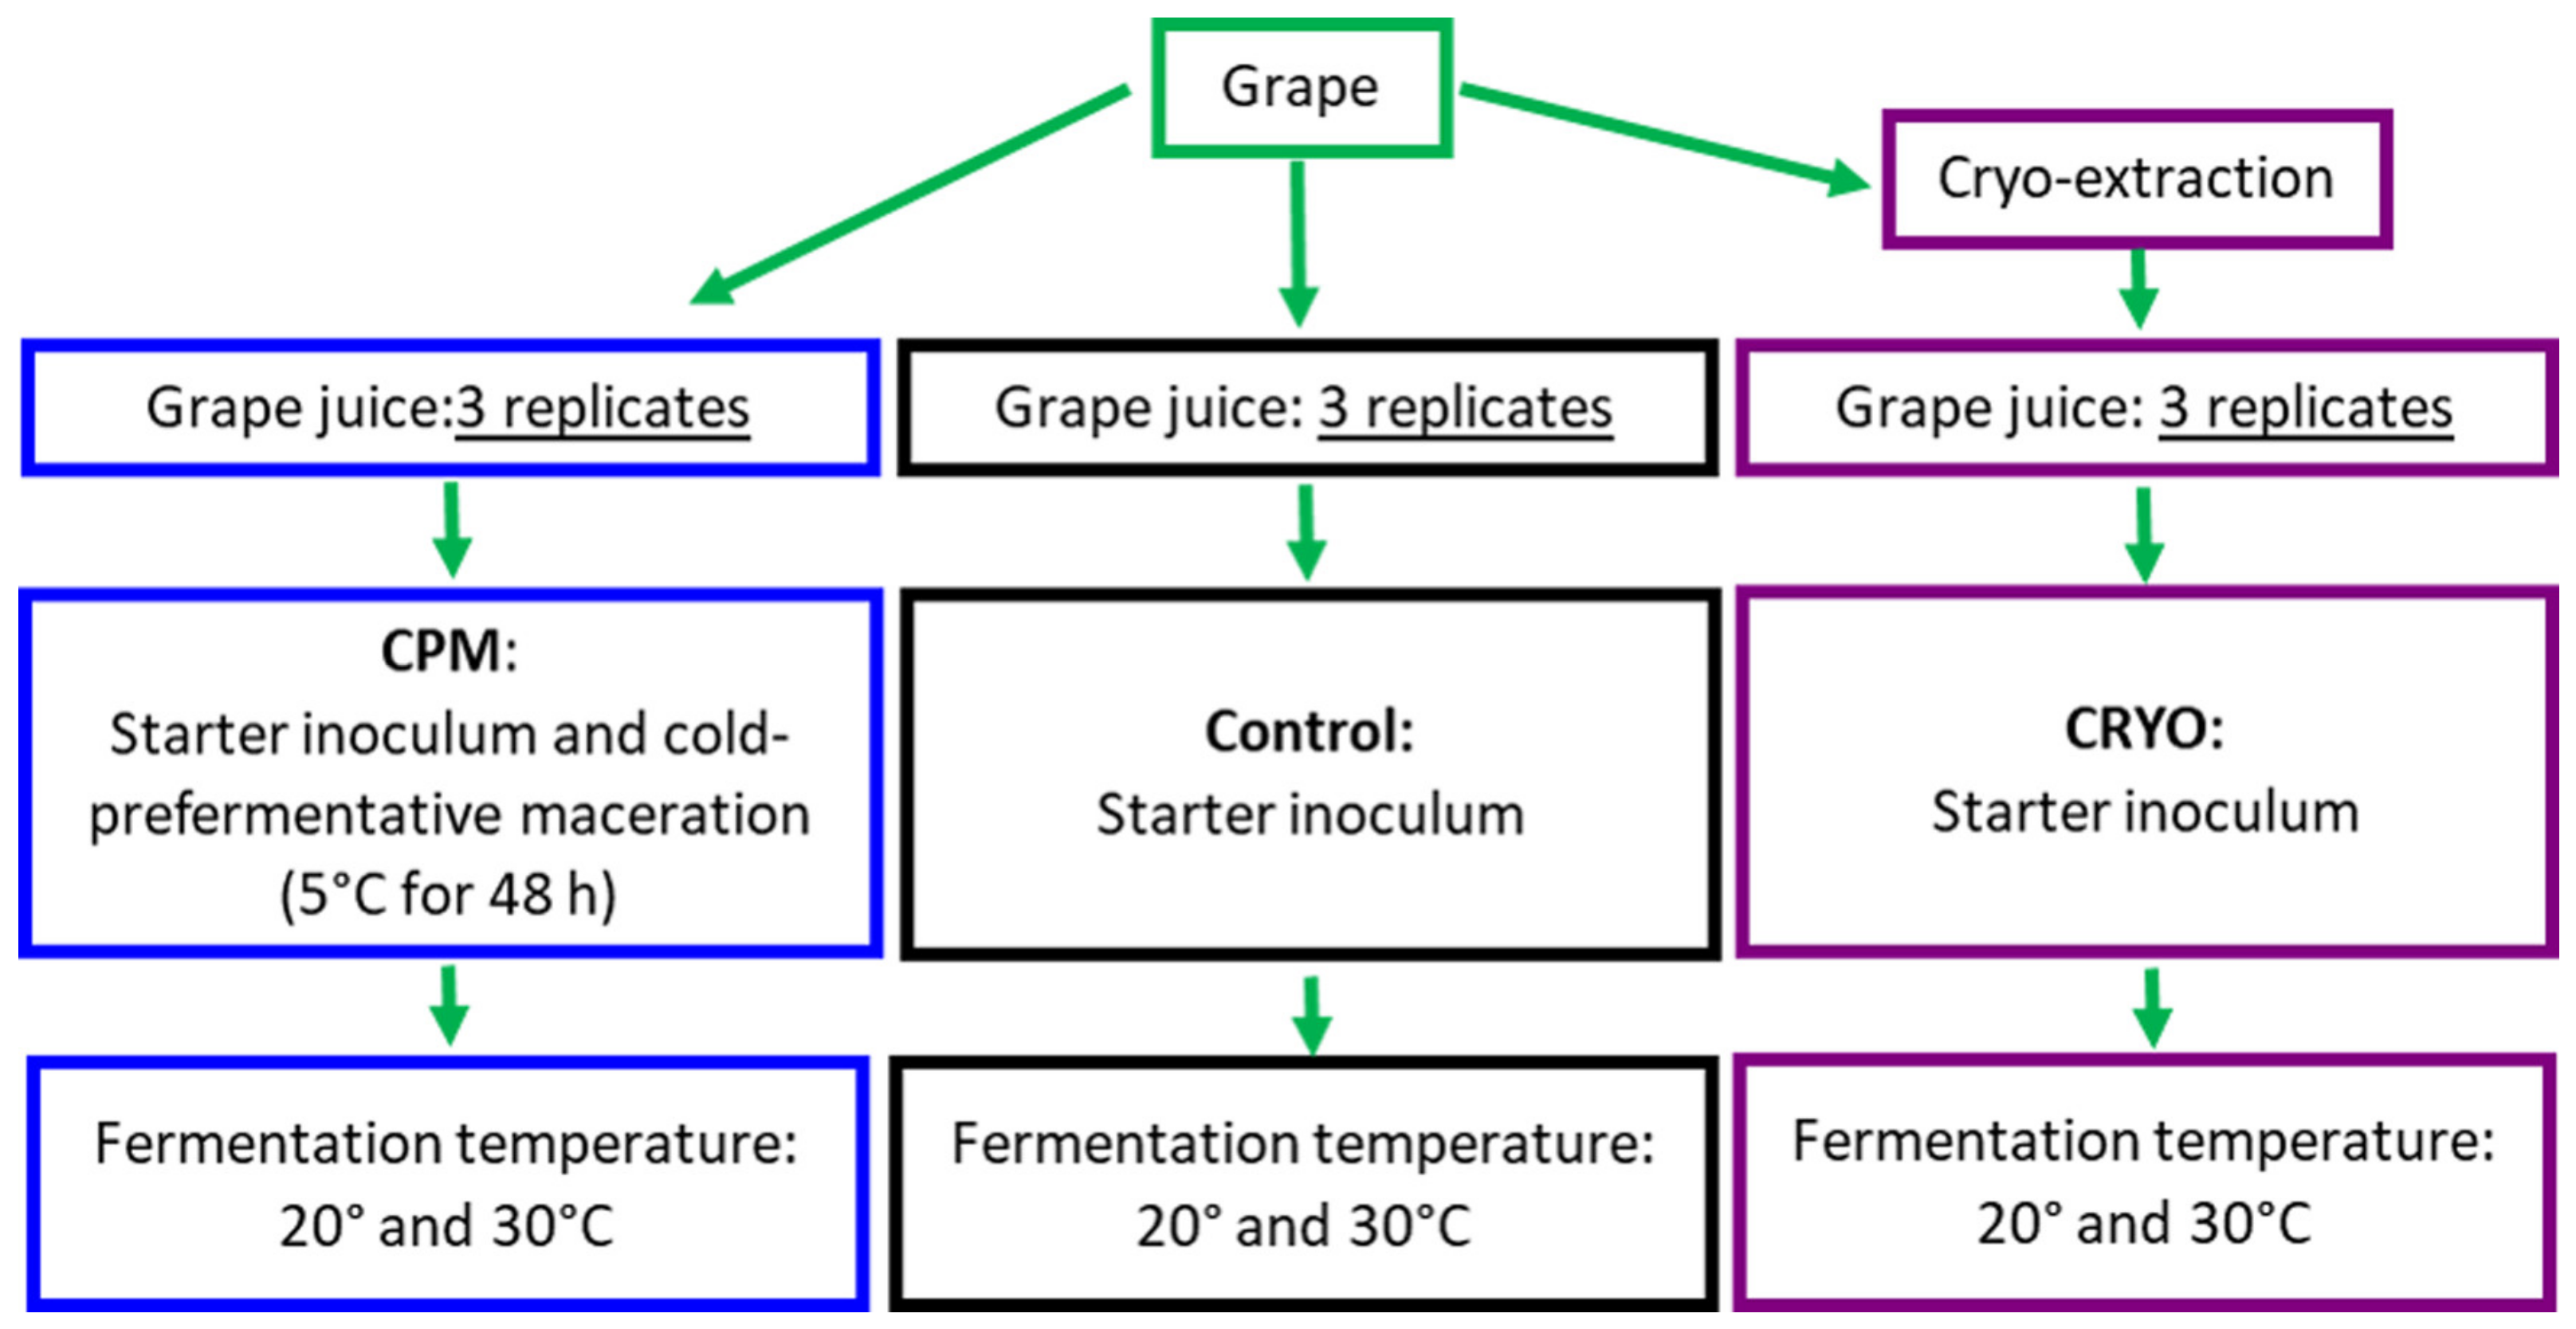
2.1. Winemaking

Sangiovese red grapes from Maremma, an oenological area of Tuscany, Italy, were manually harvested, transported to the Consorzio Tuscania experimental winery, and equally divided into three lots. A randomized procedure of grape collection was used to make these three lots homogeneous to be used for cold pre-fermentative maceration (CPM), cryoextraction (CRYO), and standard fermentation (Control) vinifications. The berries destined for the standard fermentation (Control) were destemmed, crushed, and sent to the tanks (1000 L each). The berries destined for CPM were destemmed, crushed, and cooled to 5 °C immediately after filling the 1000 L tanks and maintained for 48 h. The berries destined for CRYO were destemmed and treated using an experimental apparatus (Parsec s.r.l.) consisting of a freezing tunnel equipped with a stainless steel conveyor belt and some liquid nitrogen sprinklers. The contact time between liquid nitrogen was regulated by the speed of the conveyor belt in a way to keep the berries for 5–10 s at temperatures below 0 °C. The temperature of the flowing grape juice was between +7 °C and −5 °C. The berries were then crushed and soaked into the drained grape juice. The experiment was set up to obtain three replicates of each condition (CRYO, CPM, Control); the fermentations were conducted at two different temperatures (20° or 30 °C) for a total of 18 vinifications (Figure 1). The tanks were inoculated with 20 g/100 L of the Saccharomyces cerevisiae strain EC1118TM (Lalvin, Lallemand, Montreal, QC, Canada). In particular, the control trials were inoculated as soon as the tank was filled at 25 °C; in the CPM trials, the starter yeast was added at the filling of the tank when the temperature was at 25 °C (thus before lowering the temperature to 5 °C) and, finally, in the CRYO trials, the starter was added in the tank when the temperature was at 15 °C. In each tank, 70 mg/L of SO2 was added to the grape must, and a programmable control unit (Parsec s.r.l.) regulated the temperature and pump-overs. The vinification protocol involved twenty minutes of pumping over the first days of fermentation, that is, from 1100 to 1050 density (g/L).

2.2. Yeast Quantification and Identification

Yeasts present on the grapes before the starter inoculum in must and wine were quantified by spread plating on WL Nutrient Agar medium (Oxoid Ltd., Basingstoke, Hampshire, UK) integrated with sodium propionate (VWR International Srl, Milan, Italy) (2 g/L) and streptomycin (VWR International Srl, Milan, Italy) (30 mg/L) to inhibit mold and bacteria growth, respectively. The plates were incubated for 48 h at 30 °C in aerobic conditions. After purification of the colonies, the yeasts were grown on a YPD medium and maintained at −80 °C in a solution containing 50% (v/v) glycerol until the identification. The isolates were identified through amplification of the 5.8S rDNA and the two ribosomal internal transcribed spacers (ITS) by using the primers ITS1 and ITS4. The obtained amplicons were digested using HaeIII, CfoI, HinfI, and DdeI, as restriction enzymes (Life Technologies Italia, Monza, Italy) [22,23]. To investigate the dominance of the inoculated yeast strain during the alcoholic fermentation (EC1118), a total of 30 isolates from each fermentation were characterized at the strain level by inter-δ PCR typing with δ12/δ21 primer pair (Thermo Fisher Scientific Inc., Waltham, MA, USA) as reported by Legras and Karst [24]. The genomic profiles of the isolates were compared with the genomic profile of the inoculated strain EC 1118. PCR reactions included negative (DNA-free) and positive controls and were processed in an Applied Biosystems® 2720 Thermal Cycler (Life Technologies, Monza, Italy).

2.3. Chemical Analysis

Glucose, fructose, ethanol, glycerol, acetic, and lactic acid concentrations in the must and wine were quantified using High Performance Liquid Chromatography (HPLC) according to the method reported by Guerrini et al. [25], utilizing a Rezex ROA-Organic Acid H+ (8%) column (8 μm particle, 300 × 7.8 mm; Phenomenex, Torrance, CA, USA), a ProStar 210 chromatograph equipped with a DAD at 210 nm, and a Refractive Index Detector in series (Varian Inc., Palo Alto, CA, USA). Sulphur dioxide (SO2) and malic acid concentrations were determined enzymatically through an automatic multi-parametric analyzer (Hyperlab, Steroglass, San Martino, Italy). The intensity of color, the total flavonols, and non-anthocyanin flavonols content were determined as reported by Ribérau-Gayon et al. [26]. Total acidity was determined according to OIV-MA-AS313-01 method [27]. The VOCs profile was determined by gas chromatography with mass spectrometry detection (GC-MS) after solid-phase microextraction (SPME) sampling in the headspace of 20 mL sampling vials in equilibrium with the liquid (HS-SPME-GCMS) [25]. The instrumentation consisted of an Agilent 7890 gas chromatograph coupled to an Agilent 5975 Mass Selective Quadrupole Detector (Agilent Technologies, Inc, Santa Clara, CA, USA) operating in scan mode, using an HP-INNOWAX capillary column (50 m × 0.2 mm i.d., film thickness 0.4 μm). The compound identification was carried out by comparing the mass spectra of the individual compounds and their retention indices with those reported in the Nist08 spectral database following dynamic background compensation using Agilent MassHunter Quantitative Analysis 12.1 software. An equal amount of internal standard (ISTD) mixture (0.05 mL) was added to the samples and standards for constructing calibration curves, and compounds of samples were quantified as reported by Domizio et al. [28].

2.4. Statistical Analysis

Microbiological and chemical data were elaborated according to the t-test and one-way or two-way ANOVA followed by Tukey’s test. The differences were reported at a significance level of p < 0.05 or p < 0.01. Principal Component Analysis (PCA) was used to classify the wine samples. Correlation studies between yeast concentration and the volatile compounds content of the wine samples were carried out by calculating the Pearson correlation coefficient (significance level: α = 0.05). All these statistical analyses were performed by the Statistica 7.0 software package (StasoftGmbH, Hamburg, Germany). The degradation of sugar content (measured as the reduction of grape must density) was interpolated with the Gompertz function to calculate the specific fermentation rate μ (h1) using GraphPadPrism8 Software Inc package (San Diego, CA, USA)

3. Results

3.1. Microbiological Analysis of Grapes

The overall mean of yeast concentration on the grapes after harvest and transport to the cellar was 3.5 × 10⁶ CFU/mL. The most present species were Hanseniaspora uvarum and Pichia occidentalis, while Saccharomyces cerevisiae was detected at a ten times lower concentration (Table 1). After about an hour from arriving in the cellar, the grapes were directly crushed or subjected first to cryoextraction (CRYO), as shown in Figure 1. Only the non-Saccharomyces population decreased in cryo-treated grapes (Table 1): Starmerella bacillaris and Issatchenkia terricola decreased by 50 and 36%, respectively. The grapes not subjected to cryoextraction were crushed and destined directly to a standard fermentation (Control) or subjected to cold pre-fermentative maceration (CPM) before the fermentation phase. All the fermentations were inoculated with the S. cerevisiae strain EC1118 as reported in the Section 2, and were conducted at two different temperatures (20 and 30 °C).

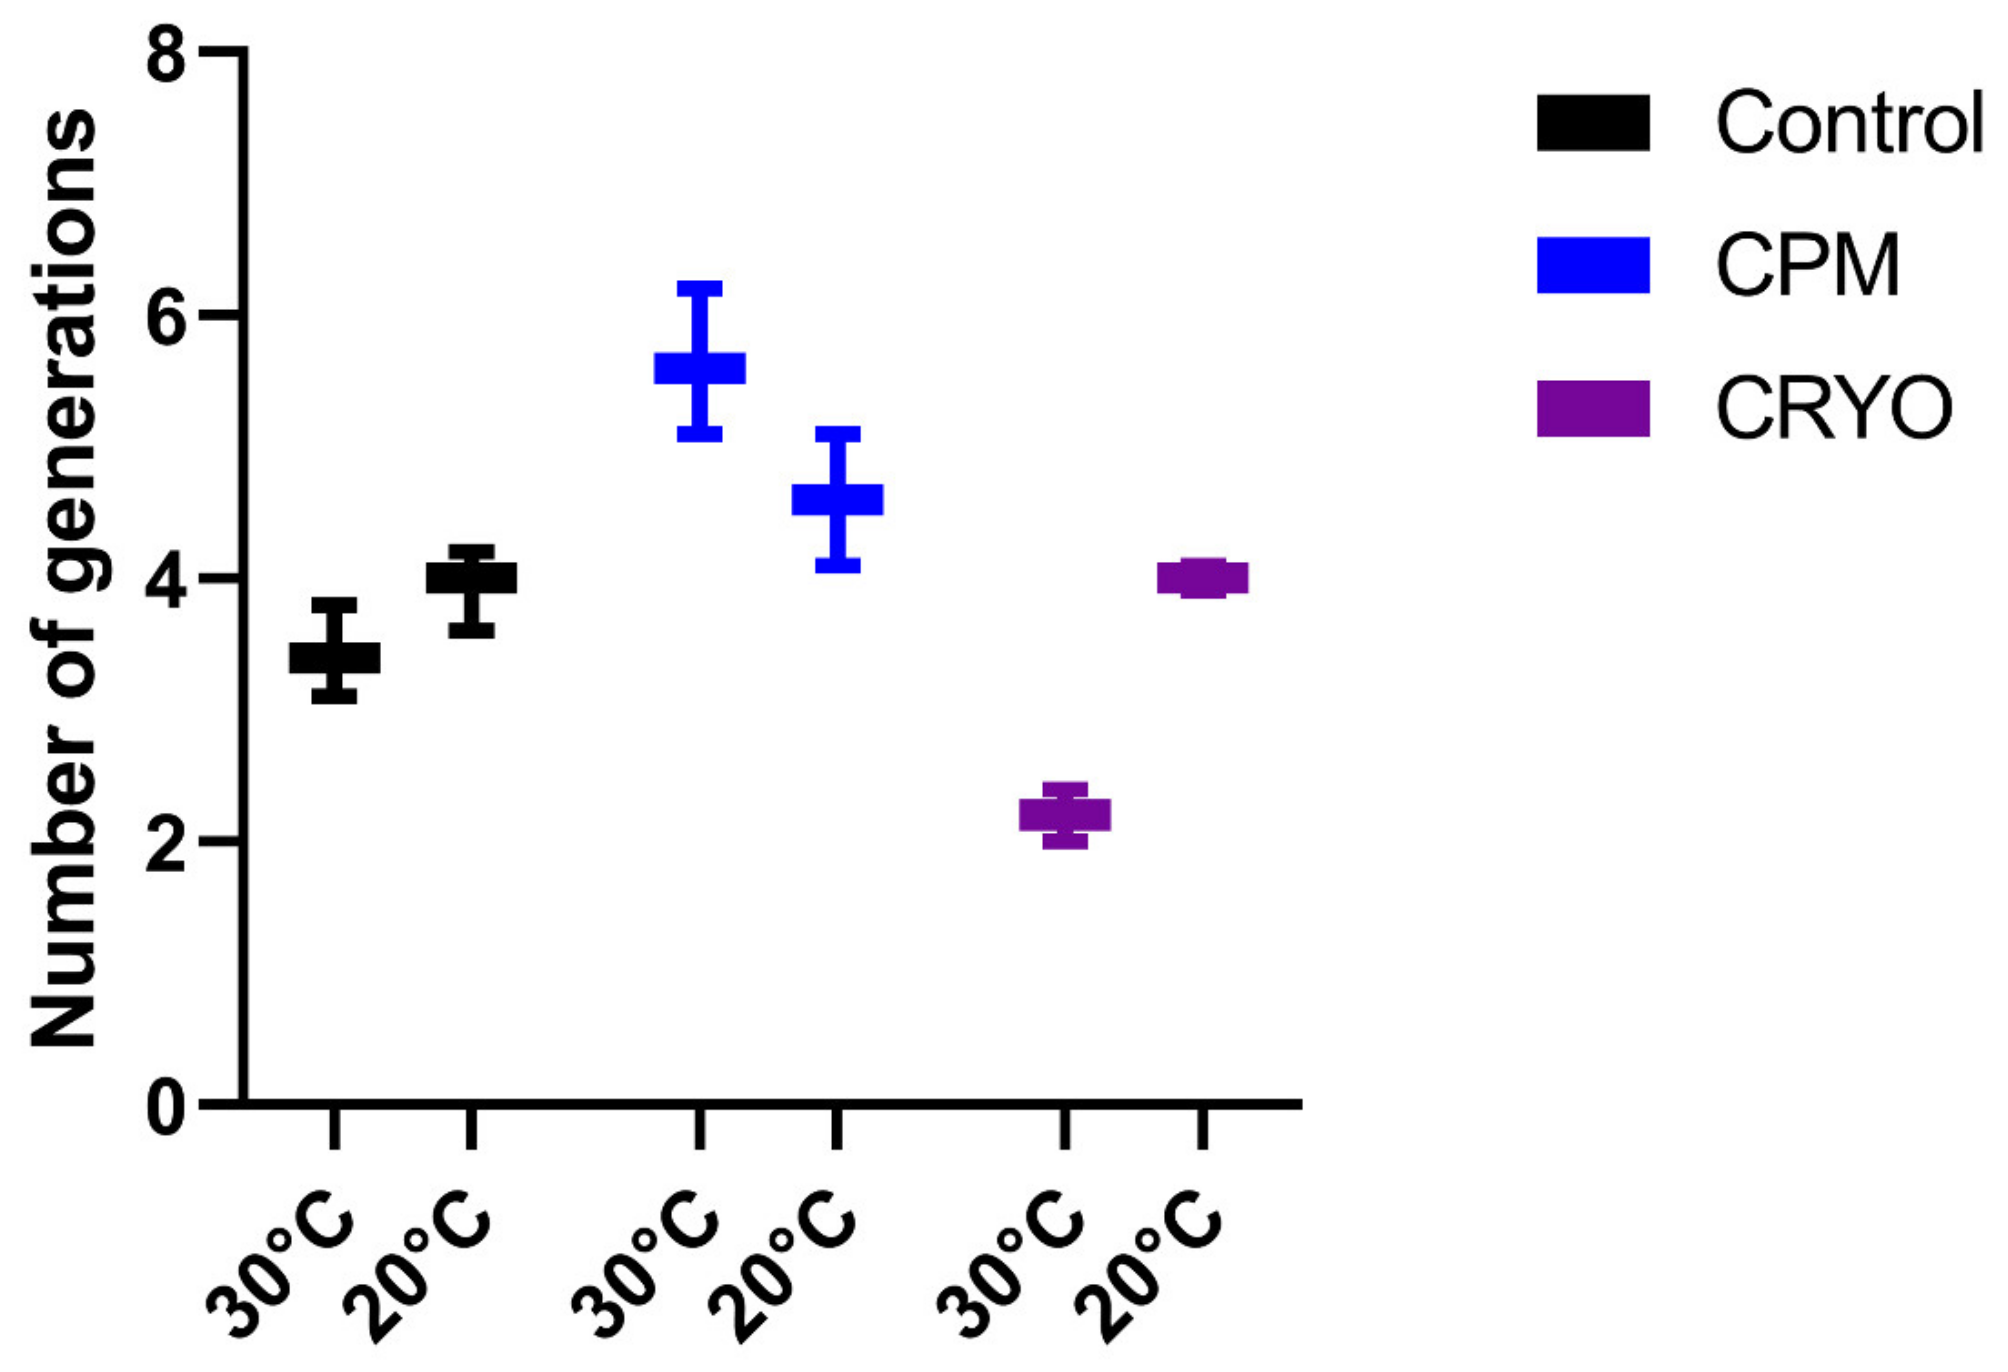
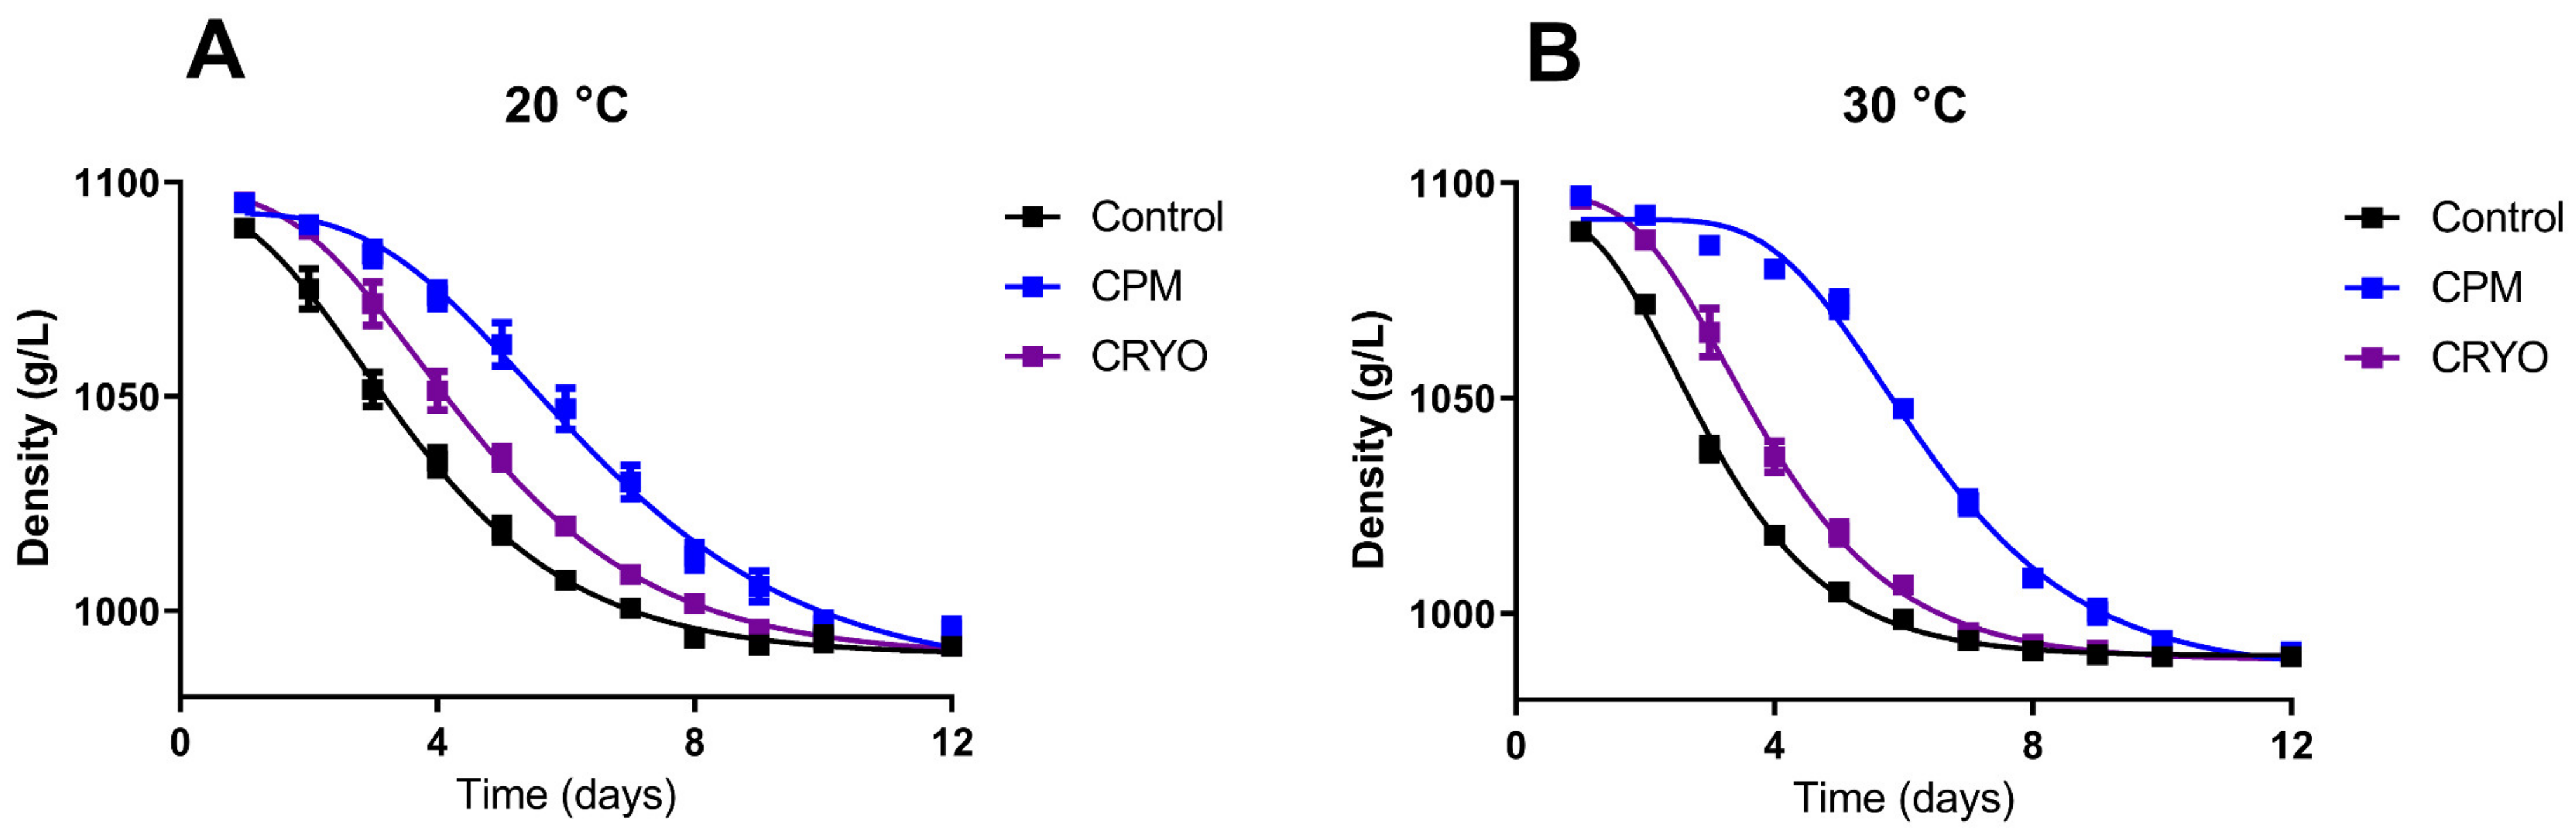
3.2. Fermentation Kinetics

The initial Sangiovese grape must composition was as follows: (237 ± 6) g/L sugar, (2.52 ± 0.15) g/L malic acid, (4.4 ± 0.4) total acidity expressed as g/L of tartaric acid, 3.6 pH, and (177 ± 39) mg/L of assimilable yeast nitrogen. Figure 2 illustrates the degradation kinetics of sugars measured as the reduction of grape must density at two different temperatures (20 °C and 30 °C) during the winemaking processes carried out using pre-fermentative low-temperature treatments (CRYO or CPM) or the traditional system (Control). Fermentation temperatures registered by the control unit (Parsec s.r.l.) showed the setted values: the Control trial from the onset of the fermentative process, whereas the CRYO trials after 24 h and CPM trials at the fifth after 48 h at 5 °C. The degradation kinetics were then modeled using the Gompertz equation to calculate the maximum rate (µ-max) and the length of the lag phase (Lag), and the values are shown in Table 2. The goodness of fit of the Gompertz model was appropriate for all the trials tested, with R2 values higher than 0.97. No difference was found between the Control and CRYO fermentation kinetic rate at both temperatures. By contrast, CPM trials at 30 °C showed a significantly slower degradation rate than the CRYO and Control fermentations, while, at 20 °C, CPM exhibited a comparable value to the CRYO trials. The CPM fermentation process had an extended lag phase than CRYO and Control due to the pre-fermentative protocol that involved keeping the grape must at a temperature of 5 °C for 48 h. This temperature value affected the fermentative activity of the yeasts despite the inoculum of the S. cerevisiae strain before lowering the temperature in CPM trials.
Chemical analyses were carried out to determine the principal oenological parameters of the experimental wines at the end of alcoholic fermentations. The results reveal that all fermentations achieved 14% v/v ethanol levels with sugar residues below 3 g/L (Table 3 and Table 4). It was also observed that CPM showed the lowest total acidity at both fermentation temperatures and the lowest SO2 content when the fermentations were conducted at 20 °C. Additionally, CPM demonstrated significantly lower glycerol content than CRYO at both fermentation temperatures. Moreover, CPM exhibited lower glycerol concentration than the Control when the fermentations were carried out at 30 °C. No significant difference was found among the other oenological parameters.
The intensity of color in CRYO (7.5) was found to be statistically higher compared to CPM (6.8) and Control (6.9), regardless of fermentation temperature. However, no significant difference was observed in the total flavonols and non-anthocyanin flavonols content among the treatments. In terms of total anthocyanins concentration, CPM (160 mg/L) had the highest concentration followed by CRYO (140 mg/L) and Control (130 mg/L), respectively, regardless of fermentation temperature used.

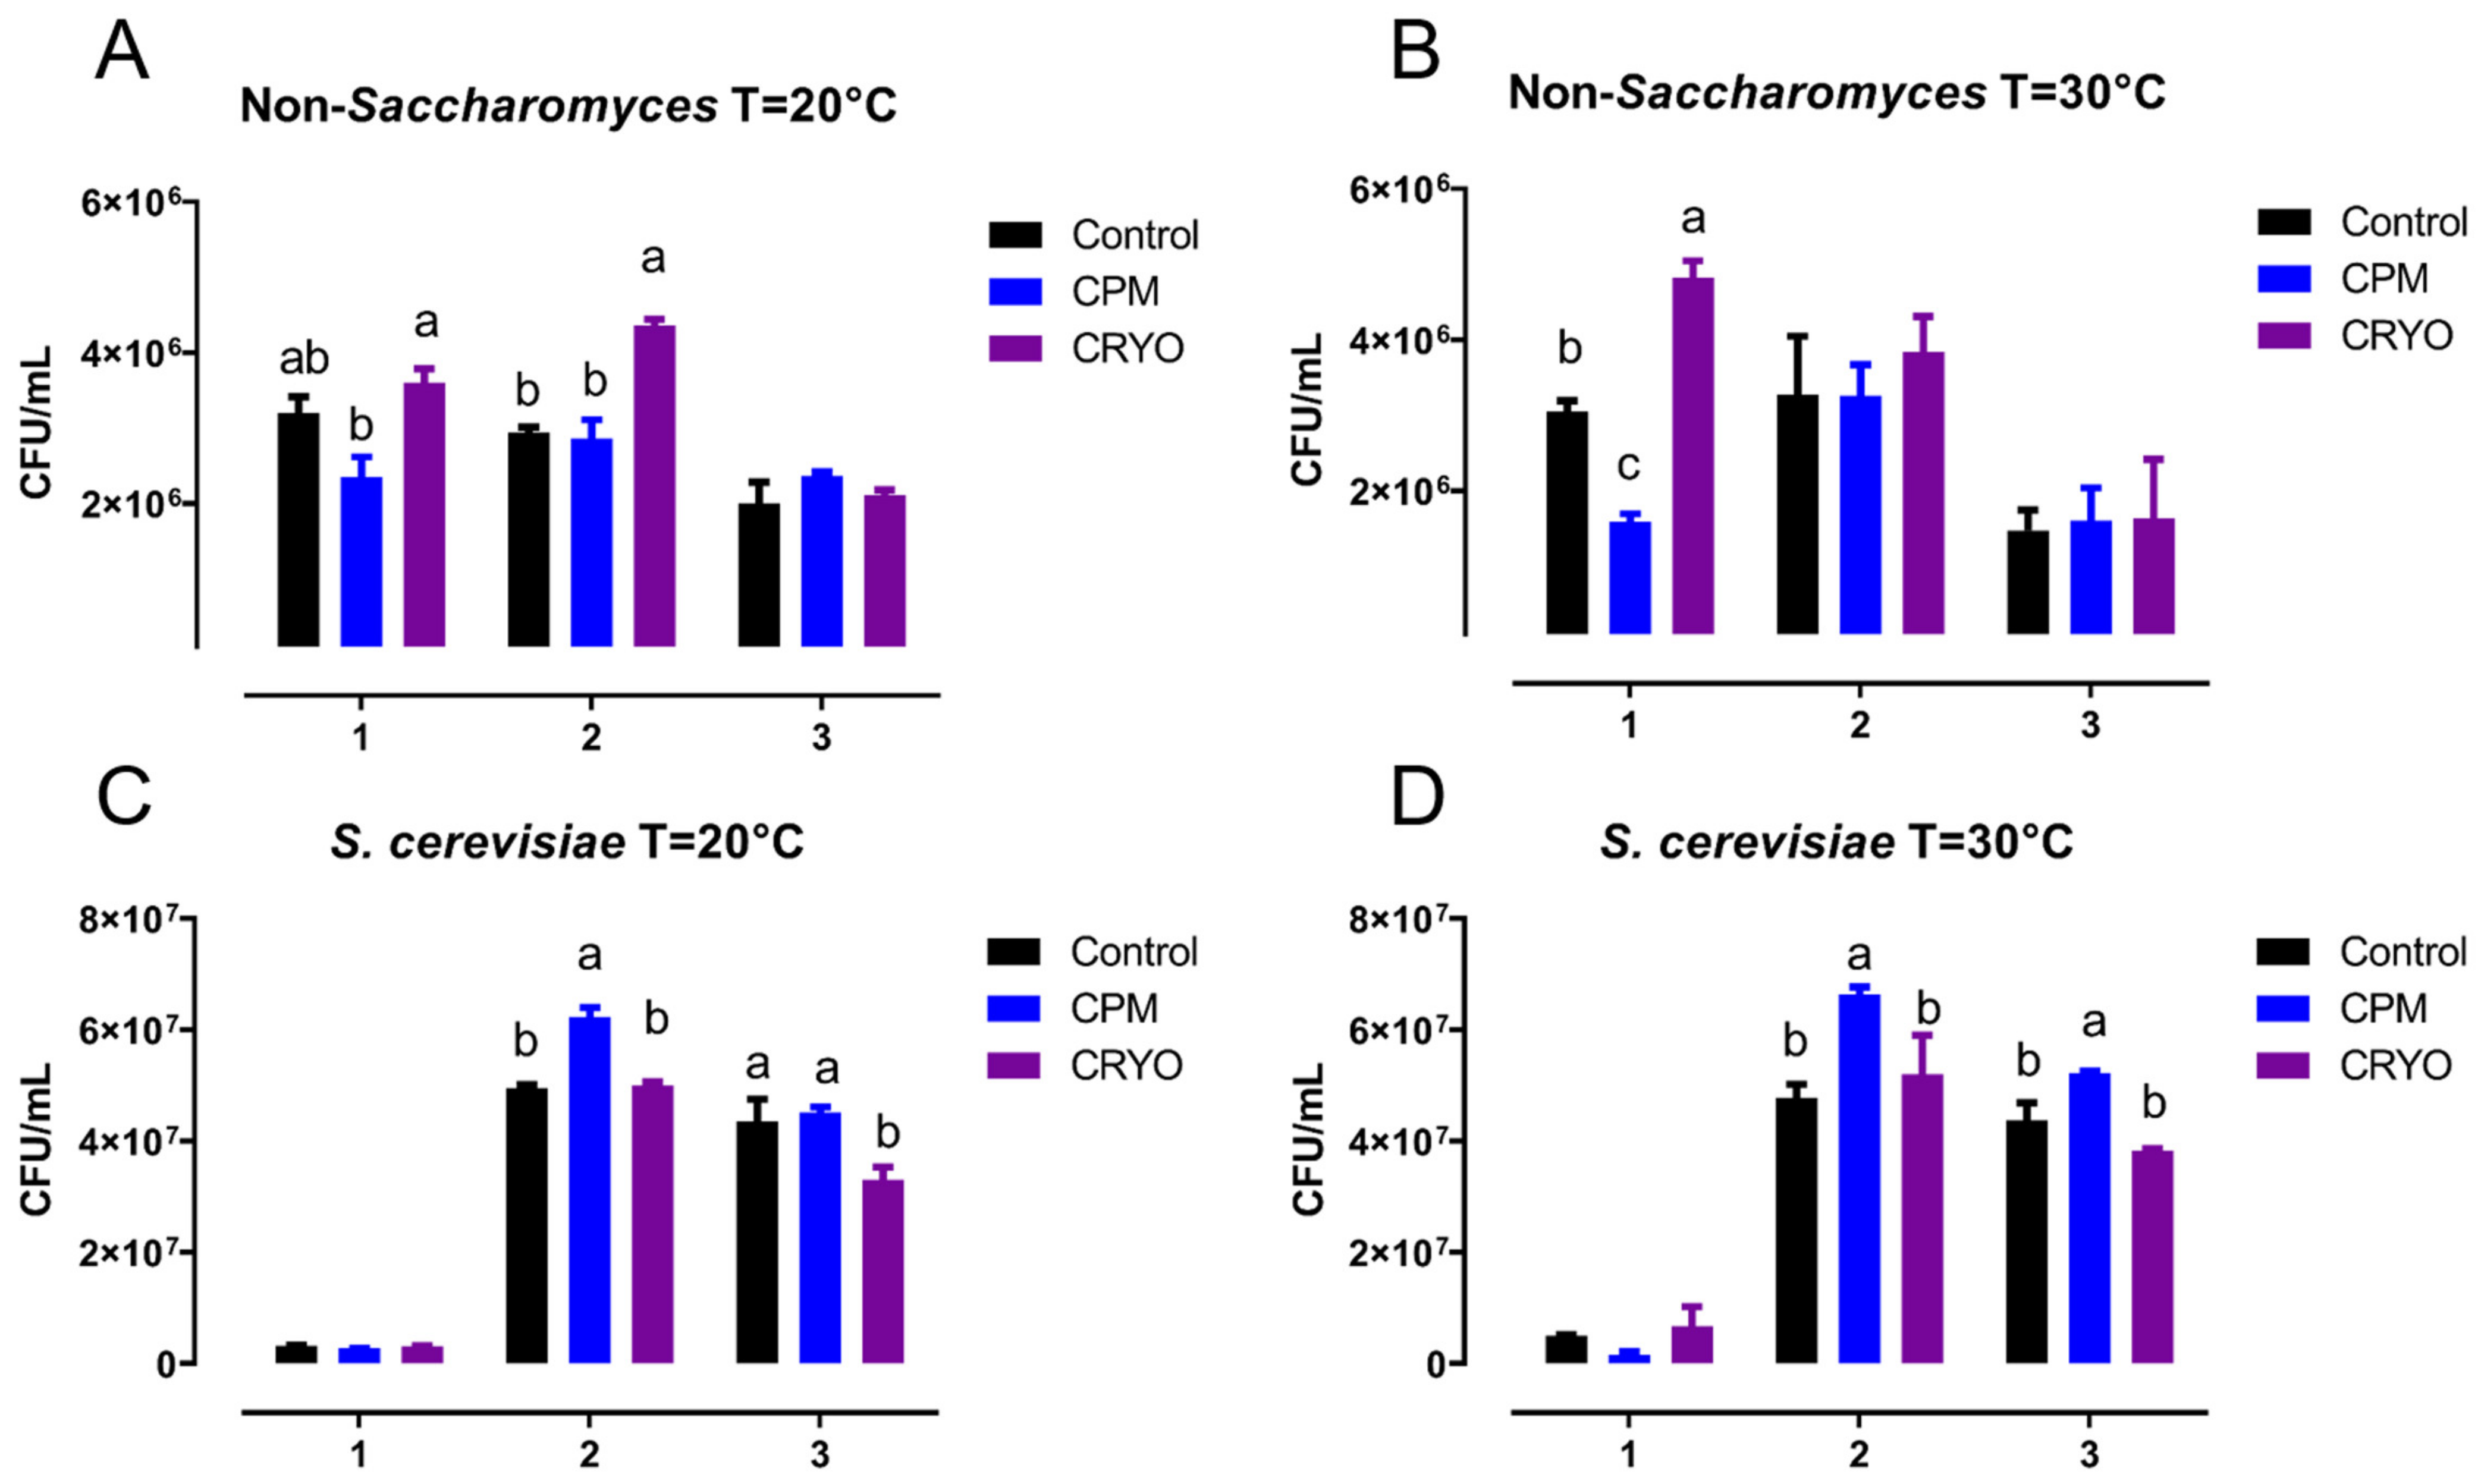
3.3. Yeast Population Dynamics

Yeast populations were quantified at three different stages of the alcoholic fermentation process, when the density values were 1100 g/L (point 1, ethanol < 0.1% v/v), 1050 g/L (point 2, ethanol about 6% v/v), and 1020 g/L (point 3, ethanol about 10–11% v/v), respectively. When the density was 1100 g/L (point 1), the non-Saccharomyces concentration was significantly lower in CPM than CRYO regardless of the fermentation temperature (Figure 3A,B). At the same density value (point 1), the non-Saccharomyces concentration of CPM was also lower than those found in the Control, but only at 30 °C. In other words, in CPM, a lower growth of non-Saccharomyces yeasts corresponded with a higher growth of S. cerevisiae. On the contrary, CRYO seemed to favor the presence of non-Saccharomyces yeasts compared to the other conditions (point 2 at 20 °C and point 1 at 30 °C). The concentrations of S. cerevisiae at the three different points are reported in Figure 3C,D. When the density was 1050 g/L (point 2), CPM trials showed the highest concentration of S. cerevisiae at both fermentation temperatures, while when the density was 1020 g/L (point 3), only at 30 °C. CRYO and Control fermentations showed S. cerevisiae concentrations were not significantly different, except when the density was 1020 g/L (point 3) and the fermentation temperature was 20 °C. In this condition, the Control showed a higher concentration of S. cerevisiae than CRYO.
To better understand the impact of the different treatments on the growth of S. cerevisiae, its generation numbers during fermentation were calculated (Figure 4). The results showed significant differences between the three conditions only at 30 °C (two-way ANOVA, p < 0.0001). In this case, the number of S. cerevisiae generations was greater in CPM than in the other two conditions, especially concerning CRYO. Finally, the genotypic profiles obtained by inter-δ analysis for S. cerevisiae isolates, collected during the three phases of each alcoholic fermentation, were compared to the inoculated microbial starter EC1118. The results confirmed the dominance of the inoculated strain on indigenous S. cerevisiae strains until the end of all the investigated alcoholic fermentations.
The non-Saccharomyces yeasts, isolated from each stage of alcoholic fermentation in the experimental wines, were identified. The results, expressed as isolation frequencies, are reported in Table 5. Hanseniaspora uvarum and Starmerella bacillaris were the dominant non-Saccharomyces yeast species found in all the experimental wines at both fermentation temperatures, although the isolation frequencies varied. Only the Control and CPM fermentations showed the same isolation frequencies of H. uvarum and S. bacillaris during the three stages of alcoholic fermentation when conducted at 20 °C. At both temperatures in the correspondence of point 3 of the fermentation process, when the ethanol concentration was about 10–11% v/v, Starmerella bacillaris occurred at 90% or higher percentages, demonstrating high ethanol tolerance and showing cell concentrations ranging from 3 to 2 × 10⁶ CFU/mL (Figure 5).
A multidimensional map of the yeast concentrations quantified in three stages of alcoholic fermentation (1: 1100 g/L, 2: 1050 g/L, 3: 1020 g/L of density) of each experimental wine was obtained by PCA. Figure 5A displays the distribution of the wines in the first two principal components for the considered variables, while Figure 5B reports the score plot indicating the influence of the variables in the factor plane. PC1 explains around 38% of the total variance, whereas PC2 explains 32%. Temperature appears to play a prominent role in the treatment. Wines made at 20 °C were positioned in the lower part of the plane, while those made at 30 °C were in the upper part. However, the highest similarities were found between CPM 20° and Control 20° and between CRYO 30° and Control 30°.

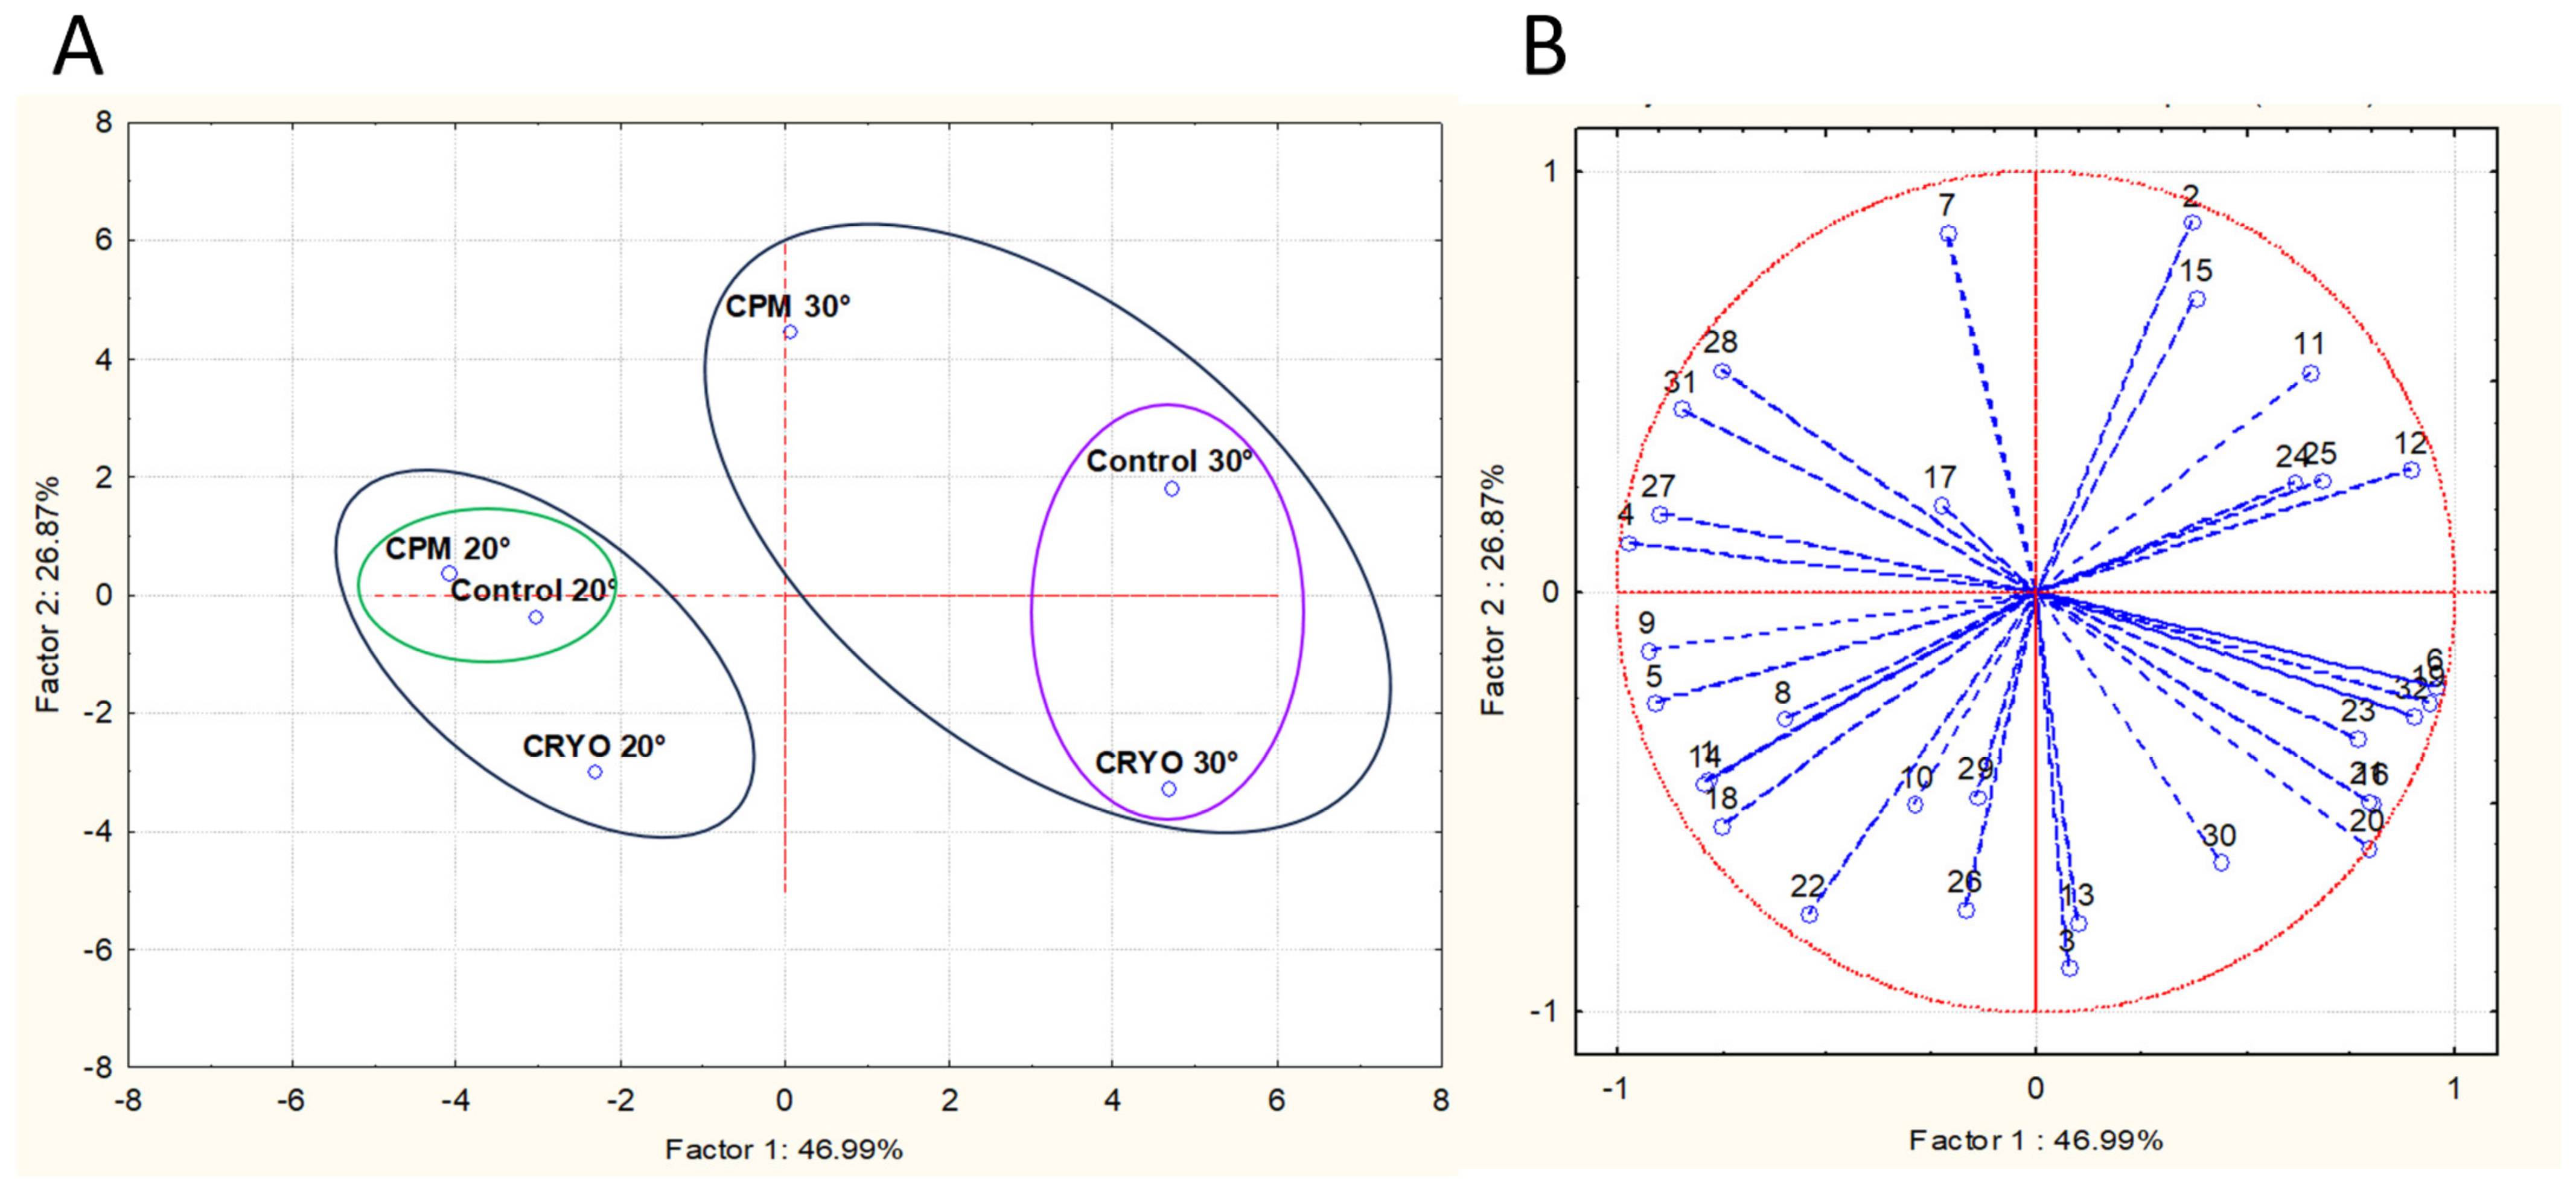
3.4. Volatile Compounds Analysis

Experimental wines fermented at 20 °C and 30 °C were analyzed to quantify the concentration of volatile compounds (Table 6 and Table 7, respectively). The results of statistical analysis showed significant differences among the concentration of some volatile compounds belonging to the following considered chemical classes: esters, fatty acids, higher alcohols, and carbonyl compounds. Considering CRYO wines (those fermented at 20 °C), they were characterized by the presence of detectable amounts of hexyl acetate (0.64 mg/L), an ester with a fruity, green apple, and banana aroma [25], that was below the detection limit in CPM and Control wines. CRYO wines were characterized also by the highest contents of 1-hexanol (one of the precursors of hexyl acetate) [29] and the lowest concentration of 1-butanol. These differences have been confirmed in CRYO wines obtained at 30 °C, which showed significantly higher concentrations of 1-hexanol and lower 1-butanol levels. The presence of hexyl acetate, on the contrary, was not confirmed; in fact, the concentration of this ester was below the detection limits similarly to all other experimental wines. CRYO wines fermented at 30 °C showed the highest ethyl decanoate and 4-ethyl phenol levels. The latter compound is a volatile phenol formed in wine by Dekkera/Brettanomyces yeasts that can negatively affect wine quality by conferring aromas described as barnyard, medicinal, band-aids, and mousy, if the concentration exceeds the perception threshold of 0.23 mg/L [30]. In all the wines analyzed in this study, the concentration of 4-ethyl phenol was well below the perception threshold, never exceeding 0.10 mg/L. Finally, all CPM wines, independently of the fermentation temperature, were characterized by the lowest concentrations of hexanoic acid, 2-methyl-1-propanol, and phenylethyl alcohol.
The data from the concentrations of 32 volatile compounds were used to obtain a multidimensional map through Principal Component Analysis (PCA). This resulted in two plots: the sample loading and the score plot (Figure 6A and Figure 6B, respectively). The model explained about 74% of the data variability across the first (PC1) and second (PC2) principal components. The PCA analysis of the aroma compounds resulted in a similar clustering of the experimental wines as the microbiological data. Firstly, the experimental wines did not cluster based on treatments. Secondly, temperature appeared to play a prominent role in the treatment, with wines made at 20 °C positioned on the left side of the plane and those made at 30 °C on the right side. Lastly, high similarity was found between CPM 20° and Control 20°, as well as between CRYO 30° and Control 30°.
To explore the potential link between yeast concentrations identified in the three stages of the alcoholic fermentation process and the concentrations of aroma compounds present in the final wines, correlation studies were conducted. The findings, presented in Table 8, reveal that more than 50% of the aroma compounds analyzed in this study were significantly correlated with yeast populations. The population of non-Saccharomyces showed positive correlations with eight aroma compounds, mainly esters. Only two negative correlations were found for 1-butanol and ethyl lactate. The population of S. cerevisiae showed positive correlations with five aroma compounds, but the Pearson coefficients tended to be lower than those observed for non-Saccharomyces. The compounds that demonstrated correlations with S. cerevisiae concentrations were predominantly alcohols, aldehydes, ketones, and acids.

4. Discussion

The Sangiovese grapes used in this experiment were characterized by a high concentration of Saccharomyces (mean value 1.6 × 10⁵ CFU/mL) and non-Saccharomyces yeasts (mean value 3.4 × 10⁶ CFU/mL) which was more than the cell density usually present on healthy and ripe grape berries [31]. Indeed, the vineyards were located about 130 km away from the experimental winery, so the grapes were transported at low temperatures and stored at 15 °C until use after about 18 h. This fact allowed us to effectively verify the impact of cryoextraction (CRYO) and cold pre-fermentative maceration (CPM) on these microbial populations. As regards to the non-Saccharomyces yeast population, the detected species were those commonly found on grapes such as Hanseniaspora uvarum, Pichia occidentalis, and Issatchenkia terricola [32] When cryoextraction was carried out directly on grapes, S. bacillaris and I. terricola concentrations decreased significantly. However, other yeast populations were not particularly affected by this treatment. In any case, the indigenous yeasts of the grapes showed a reduction of around 30%. After a few hours of grape mashing, when the must density reached 1100 g/L, the non-Saccharomyces population in the grape must that underwent pre-fermentation cryomaceration was more negatively affected. This was in contrast with the findings of other authors. Hierro et al. [15] suggested that cold maceration promotes the presence of Hanseniaspora osmophila, Candida tropicalis, and Zygosaccharomyces bisporus, while Zott et al. [16] demonstrated the occurrence of Metschnikowia pulcherrima, Hanseniaspora uvarum, and especially, Starmerella bacillaris (syn. Candida zemplinina) as the most relevant species during cold maceration at 15 °C. The non-Saccharomyces may have contributed to the growth of S. cerevisiae EC1118 inoculated as a starter. The concentration of S. cerevisiae during alcoholic fermentation (1050 g/L—ethanol 4% v/v and 1020 g/L—ethanol 11% v/v) was higher in CPM compared to CRYO and Control. The enhanced growth could be attributed to the lower presence of non-Saccharomyces and/or the higher release of nutrients such as phytosterols due to cryomaceration which can aid in the extraction of various compounds disorganizing the walls of the grape skin [13]. Regarding non-Saccharomyces yeasts, CRYO, CPM, and Control showed the presence of the same species but with different relative abundances. According to the literature, the growth of S. bacillaris is supported by lowering the temperature due to its cryotolerant nature [16,33]. However, the CPM and CRYO treatments conducted at the winery scale in this study did not point out this behavior. Indeed, the PCA performed with yeast species percentages did not group the experimental wines based on treatment but on the fermentation temperature. Similarities were also found between CPM and Control at 20 °C and between CRYO and Control at 30 °C. Increasing the fermentation temperature from 20 to 30 °C is usually associated with higher glycerol and acetic acid concentrations in wine [34]. Independently of the initial treatment, in all the experimental wines obtained at 30 °C, the acetic acid concentration was higher than in wines produced at 20 °C, confirming such a statement. Concerning glycerol content, at point 3 of fermentation, it was observed that its level in the fermentations conducted at 30 °C was significantly higher in CRYO (8.4 g/L) compared to the Control (7.8 g/L) and CPM (7 g/L) as reported in the literature. This result seems to be due to the higher activity of glycerol-3-phosphate dehydrogenase, which is the key enzyme of glycerol biosynthesis, at 30 °C than at 20 °C [34]. On the other hand, at 20 °C, the glycerol content of CRYO (7.8 g/L) was only higher than that of CPM (6.5 g/L). Effects of cryoextraction (CRYO) and cold pre-fermentative maceration (CPM) on Sangiovese wine aroma were also evaluated as the Sangiovese red grape is considered a variety with a neutral aroma and a low terpene content, generally less than 1 mg/L [35]. Therefore, the aroma of Sangiovese monovarietal wine is strongly dependent on the volatile compounds produced by yeasts during alcoholic fermentation. Yeast biosynthetic activity determines the wine content of higher alcohols, esters, fatty acids, aldehydes, and volatile phenols. Moreover, the influence of non-Saccharomyes yeasts on wine aroma cannot be neglected: the main non-Saccharomyces yeast species detected in the experimental wines, e.g., H. uvarum and Starmerella bacillaris, are known to influence volatile compounds as H. uvarum increases the concentration of acetate esters, and higher alcohol, whereas Starmerella bacillaris (former Candida zemplinina) increases the concentration of ethyl acetate and terpenes [36]. In the experimental wines of this study, the population of non-Saccharomyces yeasts showed positive correlations with the ester content of wines. On the other hand, yeast activity is influenced by the composition of the must which in turn is affected by the pre-fermentative treatments influencing the extraction efficiency of the nutrients essential for yeast growth and activity. Confronting the volatile compound content of the experimental wines according to the pre-fermentative treatment, only a few significant differences were evidenced and the PCA of the data showed that the experimental wines did not cluster based on pre-fermentative treatments but on the temperature of fermentation. The temperature of fermentation is an additional variable that affects the final concentration of yeast-derived aroma compounds in wine: while lower temperatures increase the concentration of ester compounds associated with fresh and fruity aromas, higher temperatures increase the concentration of compounds associated with flowery, banana, and pineapple attributes in wine [37]. In this study, the experimental wines fermented at a lower temperature (20 °C) showed a higher ester content than those fermented at 30 °C. In detail, the wines fermented at a temperature of 20 °C had the highest concentrations of ethyl octanoate (pear, pineapple, floral, apricot [38]), ethyl decanoate (grape, pear, oily, sweet, waxy, fruity, apple, soapy, winey [38]), isoamyl acetate (banana, pear [38]), and ethyl acetate (ethereal, aniseed, pineapple [38]). However, the highest concentrations of ethyl lactate (fruity and buttery aroma [39]), ethyl hexanoate (apple, banana, wine, pineapple [38]), and 4-ethyl-phenol (barnyard, medicinal, band-aids, and mousy [30]) were found only in CRYO and Control wines fermented at a temperature of 30 °C. On the other hand, CPM at 30 °C showed higher concentrations of acetaldehyde diethyl acetal, 2-methyl-1-propanol, and benzaldehyde compared to CRYO and Control wines fermented at the same temperature. CPM at 30 °C also showed the highest concentration of total volatile compounds. The differences in chemical composition observed between the three treatments at 30 °C can be attributed to the S. cerevisiae population that was significantly higher in CPM than in CRYO and Control. As reported in the literature, S. cerevisiae produces lower amounts of higher alcohols when compared to other non-Saccharomyces species, but higher quantities of esters or aldehydes [40]. This is not completely in agreement with our findings, but mixed fermentations including S. cerevisiae and non-Saccharomyces can modify the chemical profile of S. cerevisiae in axenic culture [41]. For example, the utilization of a mixed culture of C. stellata and S. cerevisiae seems to increase the amount of hexanoic and octanoic acids in wine [18]. In conclusion, the aroma component of the experimental wine owes a great deal to the metabolic characteristics of yeasts, their physiological state, and their interactions with each other and the medium. This contribution is more significant than the impact of cryomaceration and cryoextraction. It is widely acknowledged and supported by scientific literature that both Saccharomyces and non-Saccharomyces yeasts play a role in contributing to the aromatic properties of wine [41]. However, very few studies have been conducted to understand the impact of yeast ecology on the aromatic properties of wines that have undergone cryoextraction and cryomaceration. The present study demonstrates the importance of the microbiological aspects in evaluating the impact of pre-fermentative low-temperature treatments on the aromatic profile of the wine.

5. Conclusions

The findings of this study seem to indicate that cryoextraction and pre-fermentative maceration contribute to the definition of the aromatic profile of Sangiovese wine to a lesser extent than the yeasts involved in the fermentation process, which are in turn, influenced by temperature. Indeed, statistical analysis (PCA) of the concentrations of yeast populations and the volatile compounds of the experimental wines obtained at the winery scale highlighted the same similarity groupings based, especially, on the fermentation temperature rather than the grape must treatment. This study highlights the significance of investigating the yeast microbiota composition and its physiological state during the fermentation process to accurately evaluate the effect on the aroma composition of wines that undergo cryomaceration and cryoextraction. The lack of such an approach in most of the available literature might explain the contradictory results found. Ultimately, this study can contribute to comprehending the role of non-Saccharomyces yeasts in defining the aromatic profile of wines.

Author Contributions

Conceptualization, L.G. and S.G.; methodology, L.G.; validation, S.M., V.G. and S.G.; investigation, S.M., V.G. and S.G.; writing—original draft preparation, S.G.; writing—review and editing, L.G., V.G. and S.M.; supervision, L.G.; funding acquisition, L.G. All authors have read and agreed to the published version of the manuscript.

Funding

This study was part of a research project funded by the Italian Ministry of Economic Development Del. CIPE 35/2004.

Institutional Review Board Statement

Not applicable.

Informed Consent Statement

Not applicable.

Data Availability Statement

Data are contained within the article.

Acknowledgments

The authors would like to thank Luca Calamai (Department of Agriculture, Food, Environment and Forestry of Florence University) for his technical support in the analysis of volatile compounds and the helpful suggestions.

Conflicts of Interest

The authors declare no conflicts of interest.

References

  1. Cai, J.; Zhu, B.Q.; Wang, Y.H.; Lu, L.; Lan, Y.B.; Reeves, M.J.; Duan, C.Q. Influence of pre-fermentation cold maceration treatment on aroma compounds of Cabernet Sauvignon wines fermented in different industrial scale fermenters. Food Chem. 2014, 154, 217–229. [Google Scholar] [CrossRef]
  2. Lasanta, C.; Cejudo, C.; Gómez, J.; Caro, I. Influence of Prefermentative Cold Maceration on the Chemical and Sensory Properties of Red Wines Produced in Warm Climates. Processes 2023, 11, 374–390. [Google Scholar] [CrossRef]
  3. Aleixandre-Tudo, J.L.; du Toit, W. Cold maceration application in red wine production and its effects on phenolic compounds: A review. LWT Food Sci. Technol. 2018, 95, 200–208. [Google Scholar] [CrossRef]
  4. Gil-Muñoz, R.; Moreno-Pérez, A.; Vila-López, R.; Fernández-Fernández, J.I.; Martínez- Cutillas, A.; Gómez-Plaza, E. Influence of low temperature pre fermentative techniques on chromatic and phenolic characteristics of Syrah and Cabernet Sauvignon wines. Eur. Food Res. Technol. 2009, 228, 777–788. [Google Scholar] [CrossRef]
  5. Aleixandre-Tudo, J.L.; Buica, A.; Nieuwoudt, H.; Aleixandre, J.L.; du Toit, W. Spectrophotometric analysis of phenolic compounds in grapes and wines. J. Agric. Food Chem. 2017, 65, 4009–4026. [Google Scholar] [CrossRef]
  6. Casassa, L.F.; Harbertson, J.F. Extraction, evolution, and sensory impact of phenolic compounds during red wine maceration. Annu. Rev. Food Sci. Technol. 2014, 5, 83–109. [Google Scholar] [CrossRef]
  7. He, F.; Liang, N.N.; Mu, L.; Pan, Q.H.; Wang, J.; Reeves, M.J. Anthocyanins and their variation in red wines II. Anthocyanin-derived pigments and their colour evolution. Molecules 2012, 17, 1483–1519. [Google Scholar] [CrossRef]
  8. Smith, P.A.; Mcrae, J.M.; Bindon, K.A. Impact of winemaking practices on the concentration and composition of tannins in red wine. Aust. J. Grape Wine Res. 2015, 21, 601–614. [Google Scholar] [CrossRef]
  9. Lukić, I.; Budić-Leto, I.; Bubola, M.; Damijanić, K.; Staver, M. Pre-fermentative cold maceration, saignée, and various thermal treatments as options for modulating volatile aroma and phenol profiles of red wine. Food Chem. 2017, 224, 251–261. [Google Scholar] [CrossRef]
  10. Moreno-Pérez, A.; Fernández-Fernández, J.I.; Bautista-Ortín, A.B.; Gómez-Plaza, E.; Martínez-Cutillas, A.; Gil-Muñoz, R. Influence of winemaking techniques on proanthocyanidin extraction in Monastrell wines from four different areas. Eur. Food Res. Technol. 2013, 236, 473–481. [Google Scholar] [CrossRef]
  11. De Santis, D.; Frangipane, M.T. Effect of Prefermentative Cold Maceration on the Aroma and Phenolic Profiles of a Merlot Red Wine. Ital. J. Food Sci. 2010, 22, 47–53. [Google Scholar]
  12. Jackson, R. Wine Science; Academic Press: Cambridge, MA, USA, 2008; ISBN 9780123736468. [Google Scholar]
  13. Schmid, F.; Jiranek, V. Use of fresh versus frozen or blast-frozen grapes for small-scale fermentation. Int. J. Wine Res. 2011, 3, 25–30. [Google Scholar]
  14. Ruiz-Rodríguez, A.; Durán-Guerrero, E.; Natera, R.; Palma, M.; Barroso, C.G. Influence of Two Different Cryoextraction Procedures on the Quality of Wine Produced from Muscat Grapes. Foods 2020, 9, 1529. [Google Scholar] [CrossRef]
  15. Hierro, N.; González, Á.; Mas, A.; Guillamón, J.M. Diversity and evolution of non-Saccharomyces yeast populations during wine fermentation: Effect of grape ripeness and cold maceration. FEMS Yeast Res. 2006, 6, 102–111. [Google Scholar] [CrossRef]
  16. Zott, K.; Miot-Sertier, C.; Claisse, O.; Lonvaud-Funel, A.; Masneuf-Pomarede, I. Dynamics and diversity of non-Saccharomyces yeasts during the early stages in winemaking. Int. J. Food Microbiol. 2008, 125, 197–203. [Google Scholar] [CrossRef]
  17. Pretorius, I.S. Tailoring wine yeast for the new millennium: Novel approaches to the ancient art of winemaking. Yeast 2000, 16, 675–729. [Google Scholar] [CrossRef]
  18. Parenti, A.; Spugnoli, P.; Calamai, L.; Ferrari, S.; Gori, C. Effects of cold maceration on red wine quality from Tuscan Sangiovese grape. Eur. Food Res. Technol. 2004, 218, 360–366. [Google Scholar] [CrossRef]
  19. Magrini, A.; Pantani, O.; Bartolini, A.B.; Stefanini, F.M. On prefermentative maceration techniques: Statistical analysis of sensory descriptors in Sangiovese wine. Biom. Lett. 2016, 53, 1–20. [Google Scholar] [CrossRef]
  20. Pantani, O.L.; Stefanini, F.M.; Lozzi, I.; Calamai, L.; Biondi Bartolini, A.; Di Blasi, S. Pre-maceration, Saignée and Temperature affect Daily Evolution of Pigment Extraction During Vinification. COBRA Preprint Series, 2014, Working Paper 107. Available online: https://biostats.bepress.com/cobra/art107 (accessed on 10 September 2023).
  21. Stefanini, F.M.; Pantani, O.L. A Bayesian model to compare vinification procedures. Biom. Lett. 2013, 50, 61–80. [Google Scholar] [CrossRef]
  22. Granchi, L.; Bosco, M.; Messini, A.; Vincenzini, M. Rapid detection and quantification of yeast species during spontaneous wine fermentation by PCR–RFLP analysis of the rDNA ITS region. J. Appl. Microbiol. 1999, 87, 949–956. [Google Scholar] [CrossRef]
  23. Cadez, N.; Raspor, P.; de Cock, A.W.; Boekhout, T.; Smith, M.T. Molecular identification and genetic diversity within species of the genera Hanseniaspora and Kloeckera. FEMS Yeast Res. 2002, 1, 279–289. [Google Scholar] [CrossRef]
  24. Legras, J.L.; Karst, F. Optimisation of interdelta analysis for Saccharomyces cerevisiae strain characterization. FEMS Microbiol. Lett. 2003, 221, 249–255. [Google Scholar] [CrossRef]
  25. Guerrini, L.; Masella, P.; Angeloni, G.; Calamai, L.; Spinelli, S.; Di Blasi, S.; Parenti, A. Harvest of Sangiovese grapes: The influence of material other than grape and unripe berries on wine quality. Eur. Food Res. Technol. 2018, 244, 1487–1496. [Google Scholar] [CrossRef]
  26. Ribéreau-Gayon, P.; Dubourdieu, D.; Doneche, B.; Lonvaud, A. Trattato di Enologia II: Chimica Del Vino. Stabilizzazione. Trattamenti, 2nd ed.; Edagricole: Bologna, Italy, 2004. [Google Scholar]
  27. OIV-MA-AS313-01; Total Acidity (Oeno 551/2015). Compendium of International Methods of Wine and Must Analysis, Volume 1. International Organisation of Vine and Wine (OIV): Paris, France, 2021; pp. 433–435.
  28. Domizio, P.; Lencioni, L.; Calamai, L.; Portaro, L.; Bisson, L. Evaluation of the Yeast Schizosaccharomyces japonicus for Use in Wine Production. Am. J. Enol. Vitic. 2018, 69, 266–277. [Google Scholar] [CrossRef]
  29. Dennis, E.G.; Keyzers, R.; Kalua, C.; Maffei, S.M.; Nicholson, E.L.; Boss, P.K. Grape Contribution to Wine Aroma: Production of Hexyl Acetate, Octyl Acetate, and Benzyl Acetate during Yeast Fermentation Is Dependent upon Precursors in the Must. J. Agric. Food Chem. 2012, 60, 2638–2646. [Google Scholar] [CrossRef]
  30. Kheir, J.; Salameh, D.; Strehaiano, P.; Brandam, C.; Lteif, R. Impact of volatile phenols and their precursors on wine quality and control measures of Brettanomyces/Dekkera yeasts. Eur. Food Res. Technol. 2013, 237, 655–671. [Google Scholar] [CrossRef]
  31. Loureiro, V.; Ferreira, M.M.; Monteiro, S.; Ferreira, R. The Microbial Community of Grape Berry Chapter 12. In The Biochemistry of the Grape Berry; Hernâni Gerós, M., Chaves, M., Delrot, S., Eds.; Bentham Science Publishers: Sharjah, United Arab Emirates, 2012; pp. 241–268. [Google Scholar] [CrossRef]
  32. Zhang, J.; Shang, Y.; Chen, J.; Brunel, B.; Peng, S.; Li, S.; Wang, E. Diversity of non-Saccharomyces yeasts of grape berry surfaces from representative Cabernet Sauvignon vineyards in Henan Province, China. FEMS Microbiol. Lett. 2021, 368, fnab142. [Google Scholar] [CrossRef]
  33. Nadai, C.; da Silva Duarte, V.; Sica, J.; Vincenzi, S.; Carlot, M.; Giacomini, A.; Corich, V. Starmerella bacillaris Released in Vineyards at Different Concentrations Influences Wine Glycerol Content Depending on the Vinification Protocols. Foods. 2023, 12, 3. [Google Scholar] [CrossRef]
  34. Rankine, B.C.; Bridson, A.D. Glycerol in Australian wines and Factors influencing its formation. Am. J. Enol. Vitic. 1971, 22, 6–12. [Google Scholar] [CrossRef]
  35. Canuti, V.; Cantu, A.; Picchi, M.; Lerno, L.A.; Tanabe, C.K.; Zanoni, B.; Heymann, H.; Ebeler, S.E. Evaluation of the Intrinsic and Perceived Quality of Sangiovese Wines from California and Italy. Foods 2020, 9, 1088. [Google Scholar] [CrossRef]
  36. Borren, E.; Tian, B. The Important Contribution of Non-Saccharomyces Yeasts to the Aroma Complexity of Wine: A Review. Foods 2021, 10, 13. [Google Scholar] [CrossRef] [PubMed]
  37. Molina, A.M.; Swiegers, J.H.; Varela, C.; Pretorius, I.S.; Agosin, E. Influence of wine fermentation temperature on the synthesis of yeast-derived volatile aroma compounds. Appl. Microbiol. Biotechnol. 2007, 77, 675–687. [Google Scholar] [CrossRef] [PubMed]
  38. Baniţă, C.; Antoce, O.A.; Cojocaru, G.A. Evaluation by a GC Electronic Nose of the Differences in Volatile Profile Induced by Stopping Fermentation with Octanoic and Decanoic Acid to Produce Sweet Wines. Chemosensors 2023, 11, 98. [Google Scholar] [CrossRef]
  39. Jiang, J.; Zhang, W.; Wu, Y.; Shi, X.; Yang, X.; Song, Y.; Qin, Y.; Ye, D.; Liu, Y. Pilot-Scale Vinification of Cabernet Sauvignon Using Combined Lactiplantibacillus plantarum and Saccharomyces cerevisiae to Achieve Wine Acidification. Foods 2022, 11, 2511. [Google Scholar] [CrossRef]
  40. Capozzi, V.; Garofalo, C.; Chiriatti, M.A.; Grieco, F.; Spano, G. Microbial terroir and food innovation: The case of yeast biodiversity in wine. Microbiol. Res. 2015, 181, 75–83. [Google Scholar] [CrossRef]
  41. Carpena, M.; Fraga-Corral, M.; Otero, P.; Nogueira, R.A.; Garcia-Oliveira, P.; Prieto, M.A.; Simal-Gandara, J. Secondary Aroma: Influence of Wine Microorganisms in Their Aroma Profile. Foods 2021, 10, 51. [Google Scholar] [CrossRef]
Figure 1. Experimental design of the research: Sangiovese grape was used to perform 18 experimental trials (3 treatments × 3 replicates × 2 fermentation temperatures) in 10 hL stainless steel tanks. Legend of treatments: CRYO: cryoextraction; CPM: cold pre-fermentative maceration; Control: traditional system).
Fermentation 10 00148 g001
Figure 2. Time course of the grape must density during the winemaking processes carried out using low-temperature treatments (grape cryoextraction: CRYO and cold pre-fermentative maceration: CPM) or the traditional system (Control). The processes were conducted at two different temperatures, 20 °C (A) and 30 °C (B).
Fermentation 10 00148 g002
Figure 3. Concentration of non-Saccharomyces yeasts (A,B) and Saccharomyces cerevisiae (C,D) at three stages of the alcoholic fermentations (1: 1100 g/L, 2: 1050 g/L, 3: 1020 g/L of density) conducted at two different temperatures. Different letters indicate statistically significant differences (ANOVA and Tukey’s test, p < 0.05). Legend of treatments: CRYO: cryoextraction; CPM: cold pre-fermentative maceration; Control: traditional system.
Fermentation 10 00148 g003
Figure 4. Number of Saccharomyces cerevisiae generations calculated between 1100 g/L and 1050 g/L density values during the alcoholic fermentations conducted at two different temperatures (20 and 30 °C). Legend of treatments: CRYO: cryoextraction; CPM: cold pre-fermentative maceration; Control: traditional system.
Fermentation 10 00148 g004
Figure 5. Principal Component Analysis carried out on yeast concentrations of the experimental wines (CPM, CRYO, and Control) realized at two different temperatures (20 and 30 °C). Score plot (A): projection of the samples on the factor plane; loading plot (B): projection of the variables on the factor plane. Variables: S. cerevisiae, S. bacillaris, H. uvarum I. terricola, and P. occidentalis quantified in three stages of the alcoholic fermentations (1: 1100 g/L, 2: 1050 g/L, 3: 1020 g/L of density).
Fermentation 10 00148 g005
Figure 6. Principal Component Analysis carried out on volatile compounds content of the experimental wines: CPM, CRYO, and Control. The scores (A) and variable loadings (B) for the two first principal components. Variables: (1) ethyl acetate; (2) acetaldehyde diethyl acetal; (3) diacetyl; (4) ethyl butyrate; (5) isoamyl acetate; (6) ethyl hexanoate; (7) 2-methyl-1-propanol; (8) 1-butanol; (9) 3-methyl-1-butanol; (10) hexyl acetate; (11) acetoin; (12) ethyl lactate; (13) 1-Hexanol; (14) ethyl octanoate; (15) benzaldehyde; (16) linalool; (17) diethyl malonate; (18) ethyl decanoate; (19) diethyl succinate; (20) γ-butyrolactone; (21) α-terpineol; (22) 4-ethyl benzaldehyde; (23) 3,4-dimethyl-benzaldehyde; (24) geraniol; (25) β-damascenone; (26) ethyl dodecanoate; (27) hexanoic acid; (28) benzyl alcohol; (29) phenylethyl alcohol; (30) ethyl tetradecanoate; (31) Octanoic acid; (32) 4-ethyl-phenol.
Fermentation 10 00148 g006
Table 1. Quantification of the indigenous yeast species occurring on the grapes upon arrival in the cellar and after the cryoextraction treatment. Different letters indicate significant differences within the same column (t-test, p < 0.05).
CFU/mLSaccharomyces cerevisiaeNon-SaccharomycesStarmerella bacillarisHanseniaspora uvarumPichia occidentalisIssatchenkia terricola
Upon arrival in cellar(1.60 ± 0.57) × 105(3.37 ± 0.11) × 106 a(1.00 ± 0.14) × 104 a(1.49 ± 0.58) × 106(1.64 ± 0.26) × 106(2.35 ± 0.23) × 105 a
After cryoextraction(1.40 ± 0.85) × 105(2.42 ± 0.14) × 106 b(5.00 ± 0.71) × 103 b(1.30 ± 0.78) × 106(1.03 ± 0.52) × 106(8.50 ± 0.64) × 104 b
Table 2. Kinetic parameters of sugar degradation (measured as the reduction of grape must density) at two different temperatures (20 and 30 °C), modeled according to the Gompertz equation, of the winemaking processes carried out using low-temperature treatments (grape cryoextraction: CRYO and cold pre-fermentative maceration: CPM) or the traditional system (Control). Different letters indicate significant differences within the same column for each temperature fermentation (p < 0.05).
μ-Max (Density ∗ Days−1)Lag Phase (Days)
20 °Cmean ± SDmean ± SD
Control−21.39 ± 1.07 a0.99 ± 0.37 b
CPM−16.49 ± 1.17 b3.00 ± 0.30 a
CRYO−19.86 ± 1.07 ab1.71 ± 0.27 b
30 °C
Control−29.20 ± 0.93 a1.17 ± 0.13 b
CPM−22.24 ± 1.10 b3.94 ± 0.14 a
CRYO−27.14 ± 1.17 a1.80 ± 0.15 b
Table 3. Chemical analyses of the experimental wines (cryoextraction: CRYO; cold pre-fermentative maceration: CPM; traditional system: Control) at the end of alcoholic fermentations conducted at 20 °C. Different letters in the same row indicate statistically significant differences (ANOVA and Tukey’s test, p < 0.05).
T = 20 °CControlCPMCRYO
Mean ± SDMean ± SDMean ± SD
Ethanol (% v/v)14.40 ± 0.1414.35 ± 0.3514.20 ± 0.28
Sugars (g/L)2.00 ± 1.731.33 ± 0.582.67 ± 2.08
Glycerol (g/L)7.60 ± 0.44 ab6.50 ± 0.40 b7.83 ± 0.67 a
Malic acid (g/L)1.11 ± 0.121.05 ± 0.101.12 ± 0.09
Acetic acid (g/L)0.17 ± 0.020.19 ± 0.040.16 ± 0.02
Total acidity (g/L)5.97 ± 0.23 a5.53 ± 0.06 b6.13 ± 0.06 a
SO2 (mg/L)64.00 ± 2.83 a49.50 ± 0.71 b62.00 ± 0.01 a
pH3.41 ± 0.023.49 ± 0.033.42 ± 0.02
Table 4. Chemical analyses of the experimental wines (cryoextraction: CRYO; cold pre-fermentative maceration: CPM; traditional system: Control) at the end of alcoholic fermentations conducted at 30 °C. Different letters in the same row indicate statistically significant differences (ANOVA and Tukey’s test, p < 0.05).
T = 30 °CControlCPMCRYO
Mean ± SDMean ± SDMean ± SD
Ethanol (% v/v)14.30 ± 0.0014.40 ± 0.1414.25 ± 0.07
Sugars (g/L)1.00 ± 0.001.00 ± 0.001.00 ± 0.00
Glycerol (g/L)7.80 ± 0.17 a7.00 ± 0.17 b8.40 ± 0.28 c
Malic acid (g/L)0.95 ± 0.020.88 ± 0.080.93 ± 0.08
Acetic acid (g/L)0.32 ± 0.010.28 ± 0.040.28 ± 0.01
Total acidity (g/L)6.00 ± 0.10 a5.53 ± 0.12 b6.25 ± 0.07 a
SO2 (mg/L)50.50 ± 0.7149.00 ± 1.4148.33 ± 2.52
pH3.51 ± 0.023.54 ± 0.023.49 ± 0.02
Table 5. Isolation frequencies (%) of non-Saccharomyces yeast species in three stages of the alcoholic fermentations (1: 1100 g/L, 2: 1050 g/L, 3: 1020 g/L of density) conducted at two different temperatures (20 °C and 30 °C). Legend of treatments: CRYO: cryoextraction; CPM: cold pre-fermentative maceration; Control: traditional system.
Isolation Frequencies (%)20 °C30 °C
ControlCPMCRYOControlCPMCRYO
1Hanseniaspora uvarum323647331224
Starmerella bacillaris616149658374
Pichia occidentalis11--31
Issatchenkia terricola114221
Others5-----
2Hanseniaspora uvarum--1717714
Starmerella bacillaris939677779374
Others7457-12
3Hanseniaspora uvarum675353
Starmerella bacillaris878794979592
Others761--5
“-” indicates isolation frequency < 1%.
Table 6. Volatile compound concentrations expressed as the sum for each chemical class at the end of the alcoholic fermentations conducted at 20 °C of the three experimental wines (Control, CPM, and CRYO). Different letters in the same row indicate statistically significant differences (ANOVA and Tukey’s test, p < 0.05).
mg/LControlCPMCRYO
Mean ± SDMean ± SDMean ± SD
Esters and Lactones
Ethyl acetate30.54 ± 3.2630.45 ± 5.1628.66 ± 7.17
Ethyl butyrate0.08 ± 0.010.09 ± 0.040.07 ± 0.02
Ethyl hexanoate0.07 ± 0.030.10 ± 0.040.08 ± 0.03
Ethyl lactate0.62 ± 0.05 a0.53 ± 0.05 b0.60 ± 0.06 ab
Ethyl octanoate0.01 ± 0.010.01 ± <0.010.01 ± 0.01
Ethyl decanoate0.06 ± 0.060.10 ± 0.030.08 ± 0.06
Ethyl dodecanoate<0.01 ± <0.01<0.01 ± <0.01<0.01 ± <0.01
Ethyl tetradecanoate<0.01 ± <0.01<0.01 ± <0.01<0.01 ± <0.01
Isoamyl acetate 1.07 ± 0.121.03 ± 0.270.98 ± 0.11
Hexyl acetate<0.01 ± <0.01 b<0.01 ± <0.01 b0.64 ± 0.09 a
Diethyl malonate0.00 ± <0.01<0.01 ± <0.01<0.01 ± <0.01
Diethyl succinate0.15 ± 0.020.16 ± 0.020.16 ± 0.03
γ-Butyrolactone8.23 ± 2.048.10 ± 2.289.00 ± 2.95
Total esters and lactones40.84 ± 3.0840.57 ± 5.1840.28 ± 5.82
Fatty acids
Hexanoic acid0.73 ± 0.09 b0.98 ± 0.13 a0.76 ± 0.15 b
Octanoic acid0.35 ± 0.070.40 ± 0.090.30 ± 0.07
Total acids1.08 ± 0.111.38 ± 0.211.06 ± 0.21
Higher alcohols
2-Methyl-1-propanol43.00 ± 1.12 a36.83 ± 1.25 b42.76 ± 3.22 a
1-Butanol2.45 ± 0.12 ab2.60 ± 0.13 a2.19 ± 0.24 b
3-Methyl-1-butanol215.50 ± 7.38200.11 ± 5.21208.07 ± 16.27
1-Hexanol0.53 ± 0.05 b0.54 ± 0.08 b1.15 ± 0.13 a
Benzyl alcohol0.18 ± 0.010.20 ± 0.020.13 ± 0.11
Phenylethyl Alcohol44.20 ± 3.49 a34.52 ± 2.70 b41.74 ± 5.49 a
Total alcohols305.86 ± 9.81 a274.80 ± 20.20 b296.04 ± 32.60 ab
Terpenes
Linalool<0.01 ± <0.01<0.01 ± <0.01<0.01 ± <0.01
α-Terpineol0.38 ± <0.010.38 ± <0.010.38 ± <0.01
Geraniol0.02 ± 0.010.02 ± 0.010.02 ± 0.01
Total terpenes0.40 ± 0.010.40 ± 0.020.40 ± 0.01
Carbonyl compounds
Diacetyl2.86 ± 0.152.93 ± 0.132.97 ± 0.23
Acetoin0.33 ± 0.09 b0.46 ± 0.06 a0.33 ± 0.06 b
Benzaldehyde<0.01 ± <0.01<0.01 ± <0.01<0.01 ± <0.01
4-Ethyl benzaldehyde<0.01 ± <0.01<0.01 ± <0.01<0.01 ± <0.01
3,4-Dimethyl-benzaldehyde<0.01 ± <0.01<0.01 ± <0.01<0.01 ± <0.01
Total carbonyl compounds 3.19 ± 0.243.39 ± 0.173.30 ± 0.34
Other volatile compounds
Acetaldehyde diethyl acetal13.87 ± 5.0917.24 ± 4.6711.98 ± 3.63
β-Damascenone0.01 ± <0.010.01 ± <0.010.01 ± <0.01
4-Ethyl-phenol0.01 ± 0.010.01 ± 0.01<0.01 ± <0.01
Total other volatile compounds13.89 ± 5.0917.26 ± 4.6711.99 ± 3.63
Table 7. Volatile compound concentrations expressed as the total for each chemical class at the end of the alcoholic fermentations conducted at 30 °C of the three experimental wines Control, CPM, and CRYO. Different letters in the same row indicate statistically significant differences (ANOVA and Tukey’s test, p < 0.05).
mg/LControlCPMCRYO
Mean ± SDMean ± SDMean ± SD
Esters and Lactones
Ethyl acetate25.53 ± 2.9925.11 ± 1.8426.85 ± 3.14
Ethyl butyrate0.05 ± 0.01 ab0.07 ± 0.02 a0.04 ± 0.01 b
Ethyl hexanoate0.04 ± 0.020.07 ± 0.020.05 ± 0.04
Ethyl lactate0.75 ± 0.050.70 ± 0.050.70 ± 0.03
Ethyl octanoate<0.01 ± <0.01<0.01 ± <0.01<0.01 ± <0.01
Ethyl decanoate0.02 ± <0.01 b0.02 ± 0.01 b0.05 ± 0.02 a
Ethyl dodecanoate<0.01 ± <0.01<0.01 ± <0.01<0.01 ± <0.01
Ethyl tetradecanoate<0.01 ± <0.01<0.01 ± <0.01<0.01 ± <0.01
Isoamyl acetate 0.66 ± 0.070.68 ± 0.160.63 ± 0.16
Hexyl acetate<0.01 ± <0.01<0.01 ± <0.01<0.01 ± <0.01
Diethyl malonate<0.01 ± <0.01<0.01 ± <0.01<0.01 ± <0.01
Diethyl succinate0.18 ± 0.040.16 ± 0.030.18 ± 0.03
γ-Butyrolactone9.55 ± 2.677.86 ± 1.8510.56 ± 2.02
Total esters and lactones36.78 ± 2.5434.66 ± 0.8839.07 ± 4.54
Fatty acids
Hexanoic acid0.43 ± 0.07 b0.81 ± 0.13 a0.50 ± 0.11 b
Octanoic acid0.22 ± 0.05 b0.38 ± 0.09 a0.22 ± 0.08 b
Total acids0.65 ± 0.09 b1.19 ± 0.17 a0.72 ± 0.18 b
Higher alcohols
2-Methyl-1-propanol54.40 ± 2.79 a42.13 ± 1.91 b55.12 ± 7.13 a
1-Butanol2.53 ± 0.10 a2.56 ± 0.13 a2.21 ± 0.11 b
3-Methyl-1-butanol197.75 ± 10.75181.49 ± 7.33182.74 ± 12.85
1-Hexanol0.49 ± 0.06 b0.57 ± 0.06 b1.00 ± 0.08 a
Benzyl alcohol0.10 ± 0.100.21 ± 0.030.11 ± 0.10
Phenylethyl Alcohol40.02 ± 3.88 a31.14 ± 2.02 b35.94 ± 5.42 ab
Total alcohols295.29 ± 11.99 a258.10 ± 9.89 b277.12 ± 20.47 b
Terpenes
Linalool0.01 ± <0.01 a<0.01 ± <0.01 b0.01 ± <0.01 a
α-Terpineol0.38 ± <0.010.38 ± <0.010.38 ± <0.01
Geraniol0.29 ± 0.680.01 ± 0.010.03 ± 0.02
Total terpenes0.68 ± 0.680.39 ± 0.010.42 ± 0.02
Carbonyl compounds
Diacetyl2.86 ± 0.082.82 ± 0.073.00 ± 0.25
Acetoin0.58 ± 0.180.72 ± 0.080.63 ± 0.18
Benzaldehyde<0.01 ± <0.01<0.01 ± <0.01<0.01 ± <0.01
4-Ethyl benzaldehyde<0.01 ± <0.01<0.01 ± <0.01<0.01 ± <0.01
3,4-Dimethyl-benzaldehyde<0.01 ± <0.01<0.01 ± <0.01<0.01 ± <0.01
Total carbonyl compounds3.44 ± 0.283.54 ± 0.143.63 ± 0.41
Other volatile compounds
Acetaldehyde diethyl acetal19.72 ± 5.3921.04 ± 2.0715.23 ± 3.96
β-Damascenone0.01 ± <0.010.01 ± <0.010.01 ± <0.01
4-Ethyl-phenol0.05 ± 0.04 b0.01 ± 0.01 c0.09 ± <0.01 a
Total other volatile compounds19.78 ± 5.36 ab21.06 ± 2.0 a15.33 ± 3.97 b
Table 8. Statistically significant correlations (p < 0.05) calculated using the Pearson coefficient between non-Saccharomyces or S. cerevisiae concentrations occurring in three different stages of alcoholic fermentation (point 1: 1100 g/L, point 2: 1050 g/L, and point 3: 1020 g/L of density) and volatile compounds quantified at the end of the alcoholic fermentations of the experimental wines (ns = not significant).
Point 1Point 2Point 3
Non-Sacch.S. cerevisiaeNon-Sacch.S. cerevisiaeNon-Sacch.S. cerevisiae
Compounds
Esters and lactones
Ethyl acetatensnsnsns0.9062ns
Ethyl butyratensnsnsns0.8606ns
Ethyl hexanoatensnsnsns0.9525ns
Ethyl lactatensnsnsns−0.9932ns
Ethyl octanoatensnsnsns0.8706ns
Ethyl decanoatensnsnsns0.9682ns
Isoamyl acetatensnsnsns0.9080ns
γ-butyrolactone0.82550.9090nsnsnsns
Fatty acids
Octanoic acidns−0.8454nsnsnsns
Higher alcohols
1-butanolnsns−0.8819nsns0.8795
1-Hexanolnsns0.9310nsns−0.8552
Benzyl alcoholns−0.8649nsnsnsns
Phenylethyl alcoholnsnsns−0.8716nsns
Terpenes
Linaloolns0.9118nsnsnsns
Carbonyl compounds
3,4-dimethyl-benzaldehydens0.8507nsnsnsns
Other volatile compounds
Acetaldehyde diethyl acetalnsnsnsnsns0.8408
Disclaimer/Publisher’s Note: The statements, opinions and data contained in all publications are solely those of the individual author(s) and contributor(s) and not of MDPI and/or the editor(s). MDPI and/or the editor(s) disclaim responsibility for any injury to people or property resulting from any ideas, methods, instructions or products referred to in the content.

