
Effect of New Methods for Inhibiting Malolactic Fermentation on the Analytical and Sensory Parameters of Wines


Abstract
1. Introduction
2. Materials and Methods
2.1. Design of Experiment
2.2. Determination of Basic Analytical Parameters in Wines
2.3. Determination of Individual Volatile Compounds by GC
2.4. Determination of Individual Biogenic Amines by HPLC
2.5. Sensory Analysis
2.6. Statistical Analysis
3. Results and Discussion
3.1. Determination of Basic Analytical Parameters in Wines
3.2. Determination of Individual Volatile Compounds by GC-MS
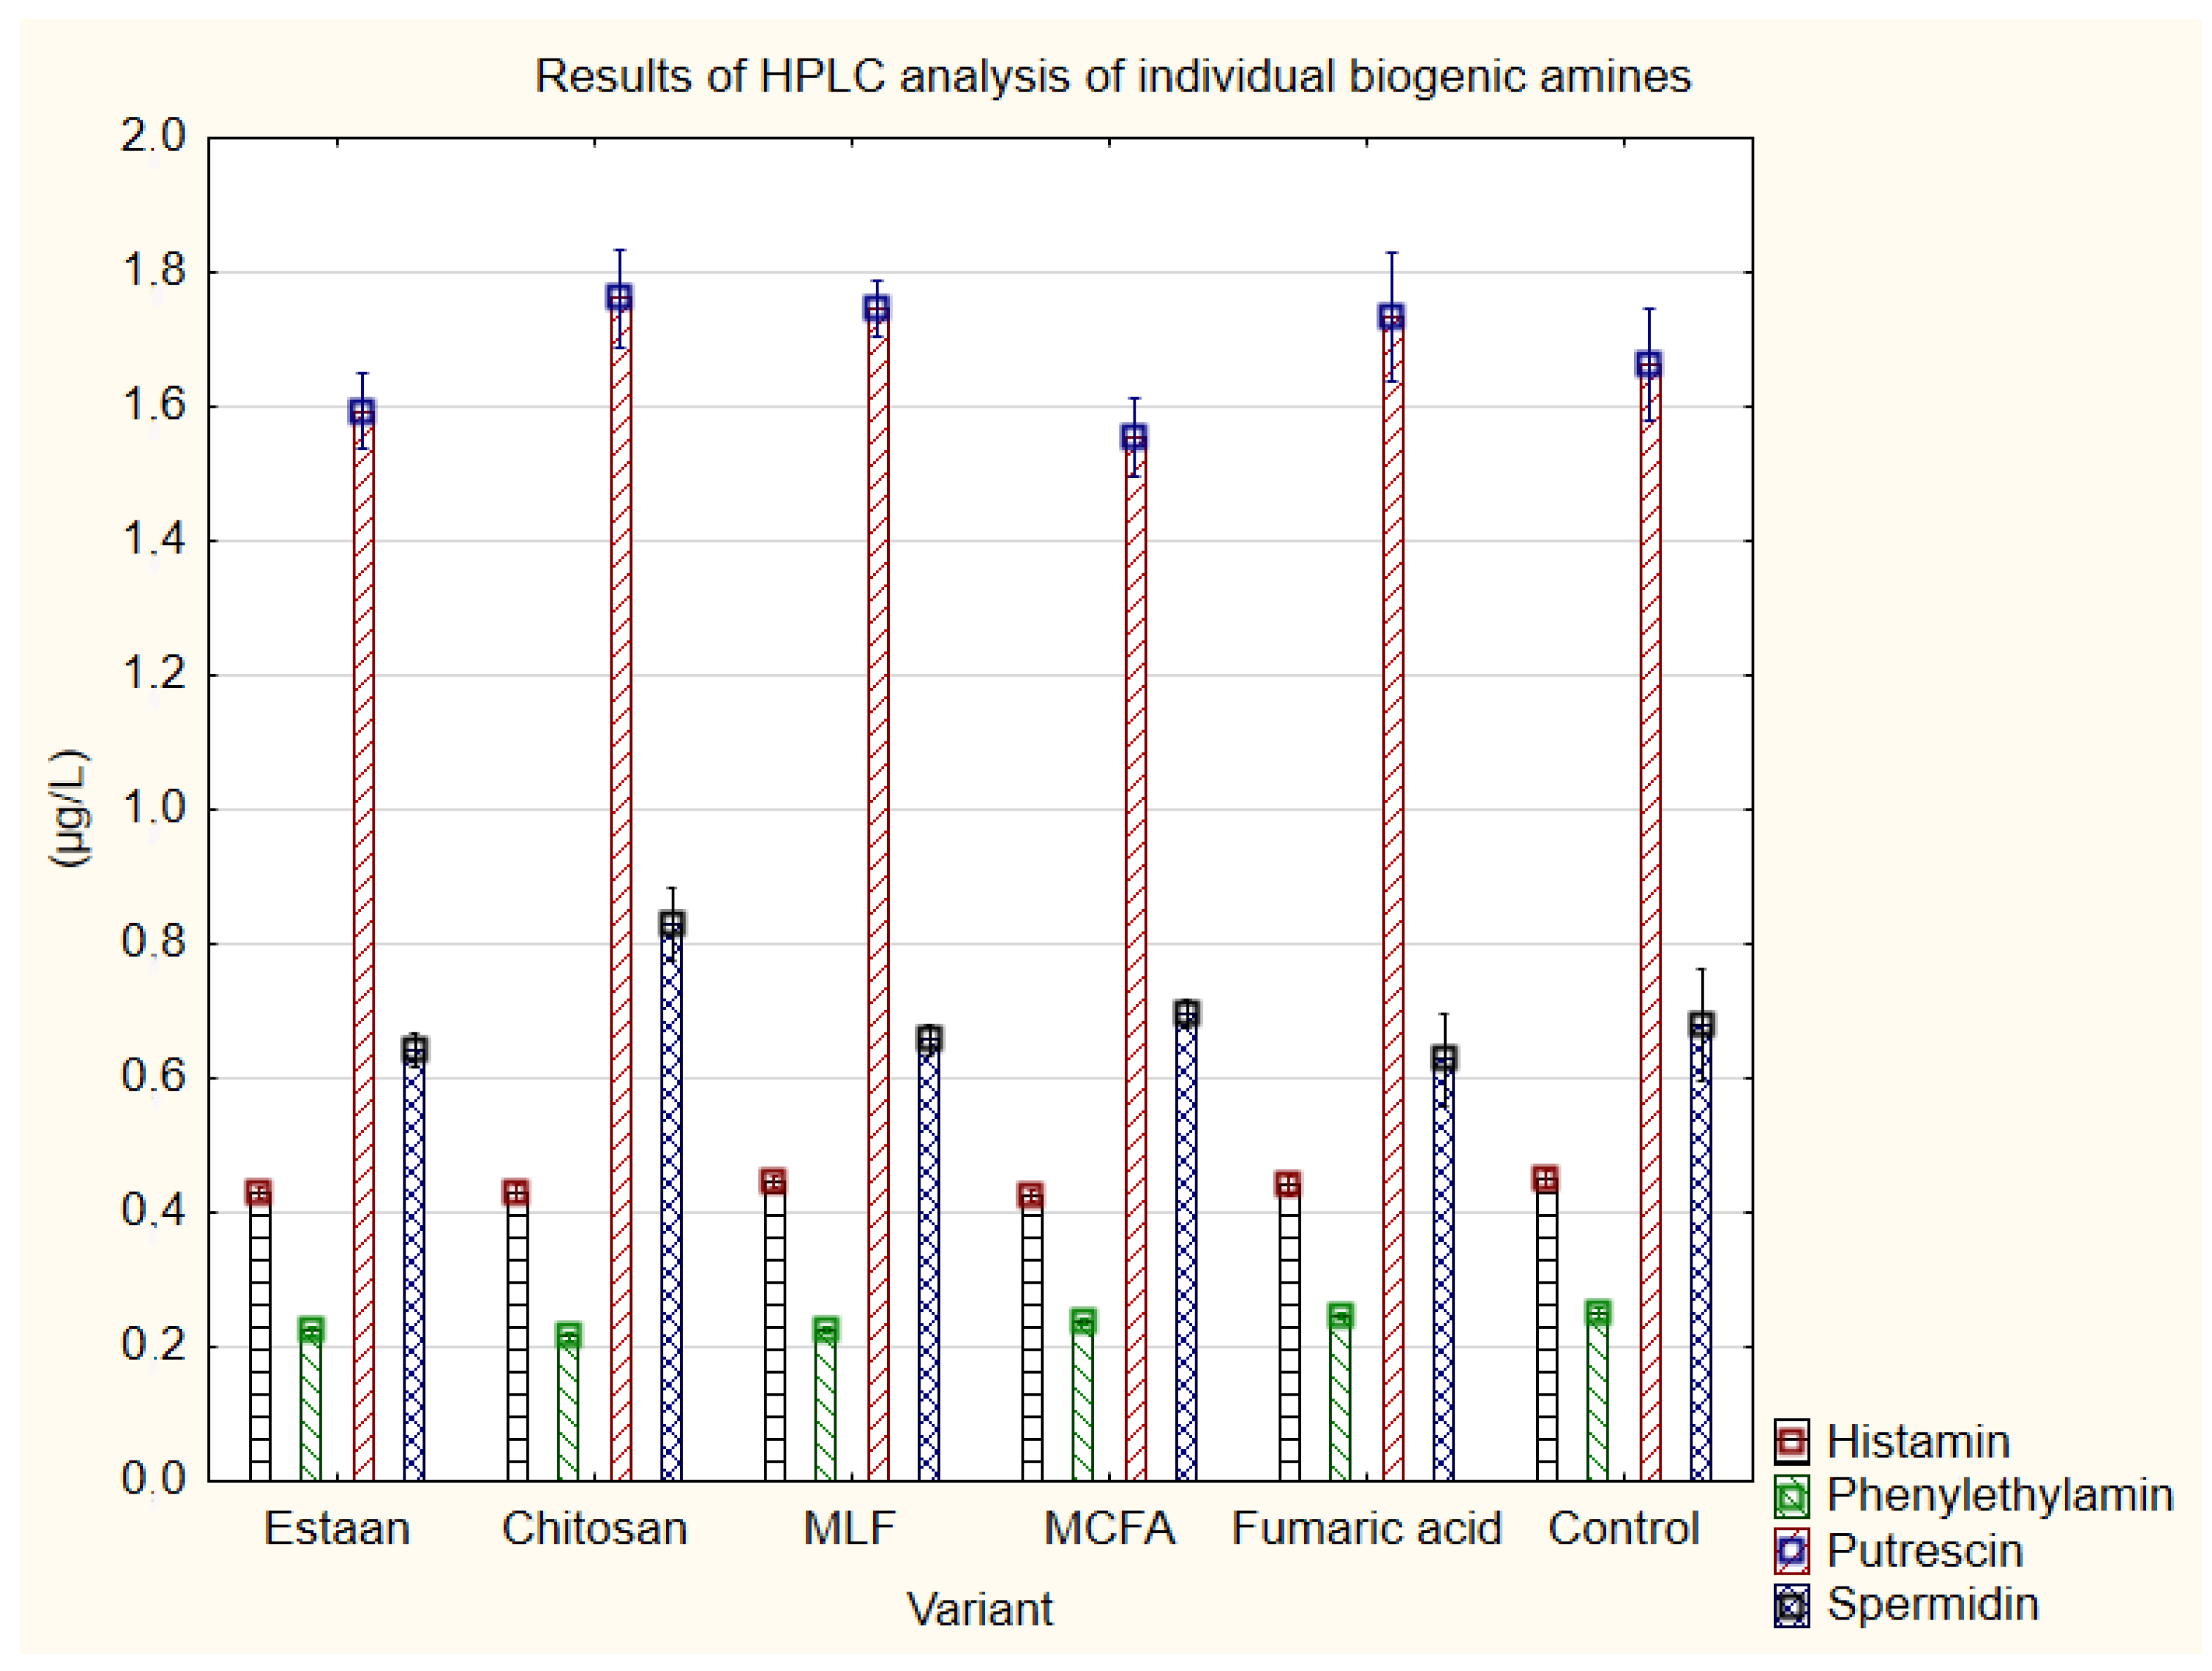
3.3. Determination of Individual Biogenic Amines by HPLC
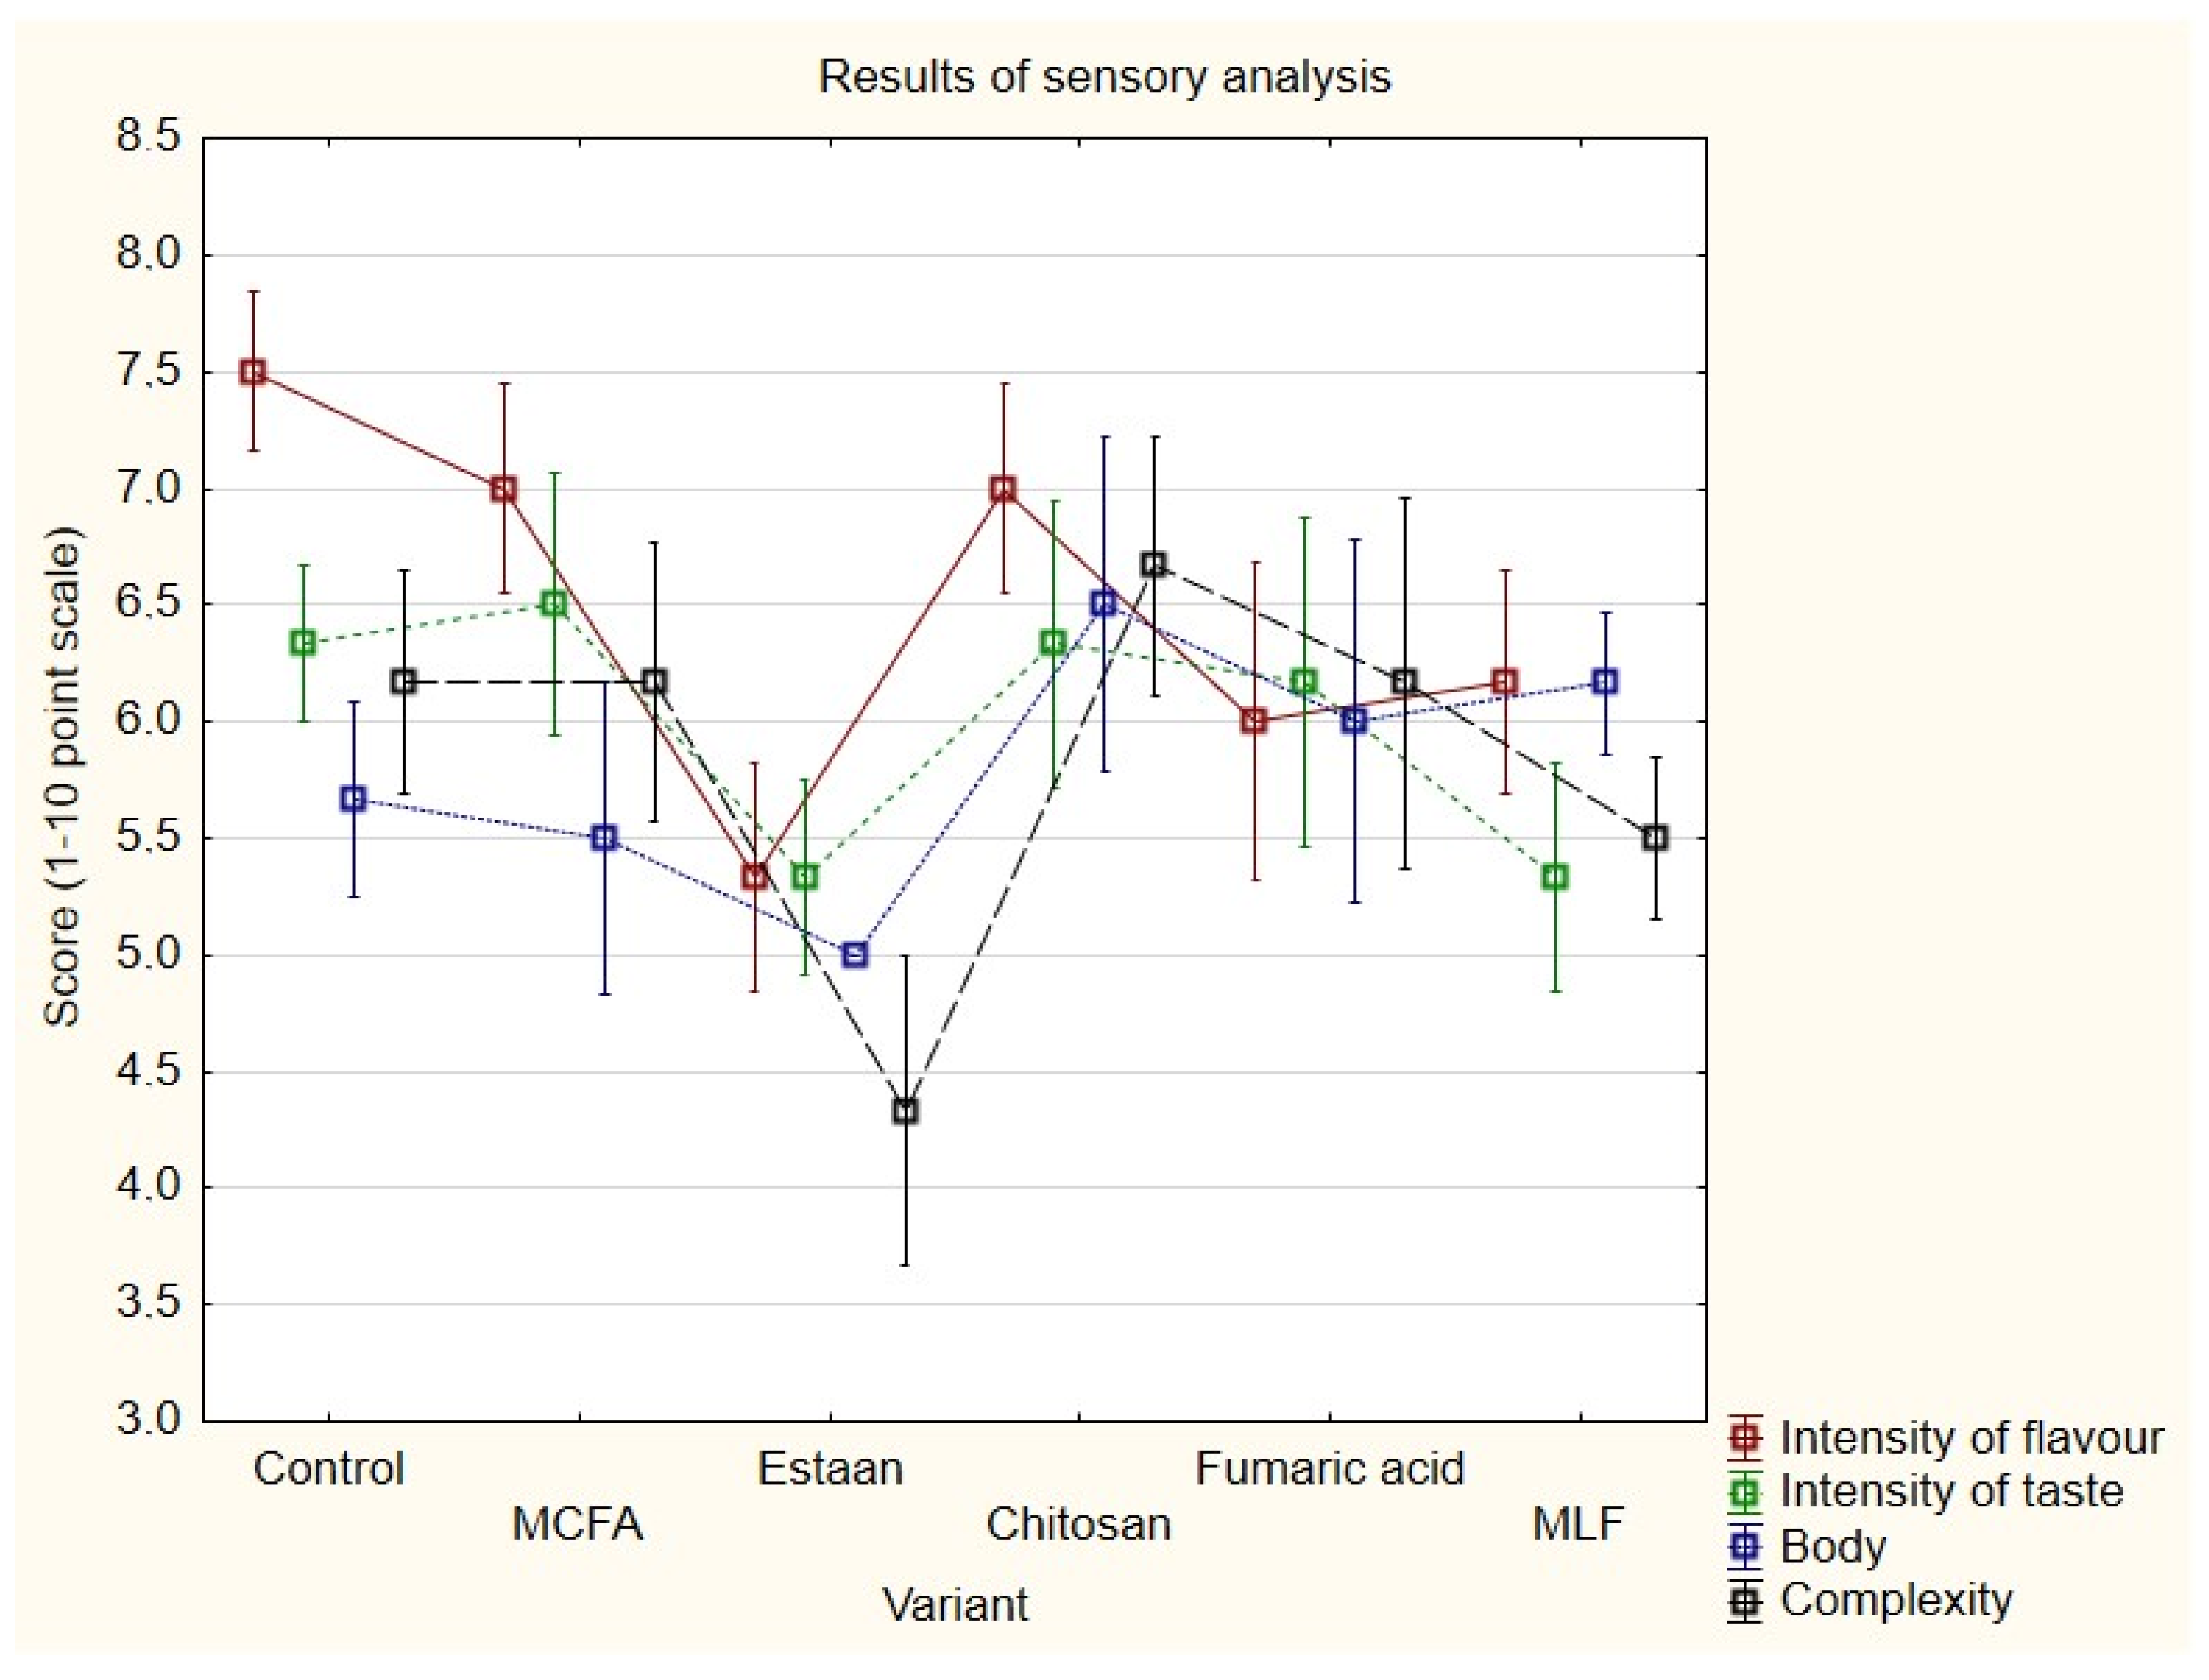
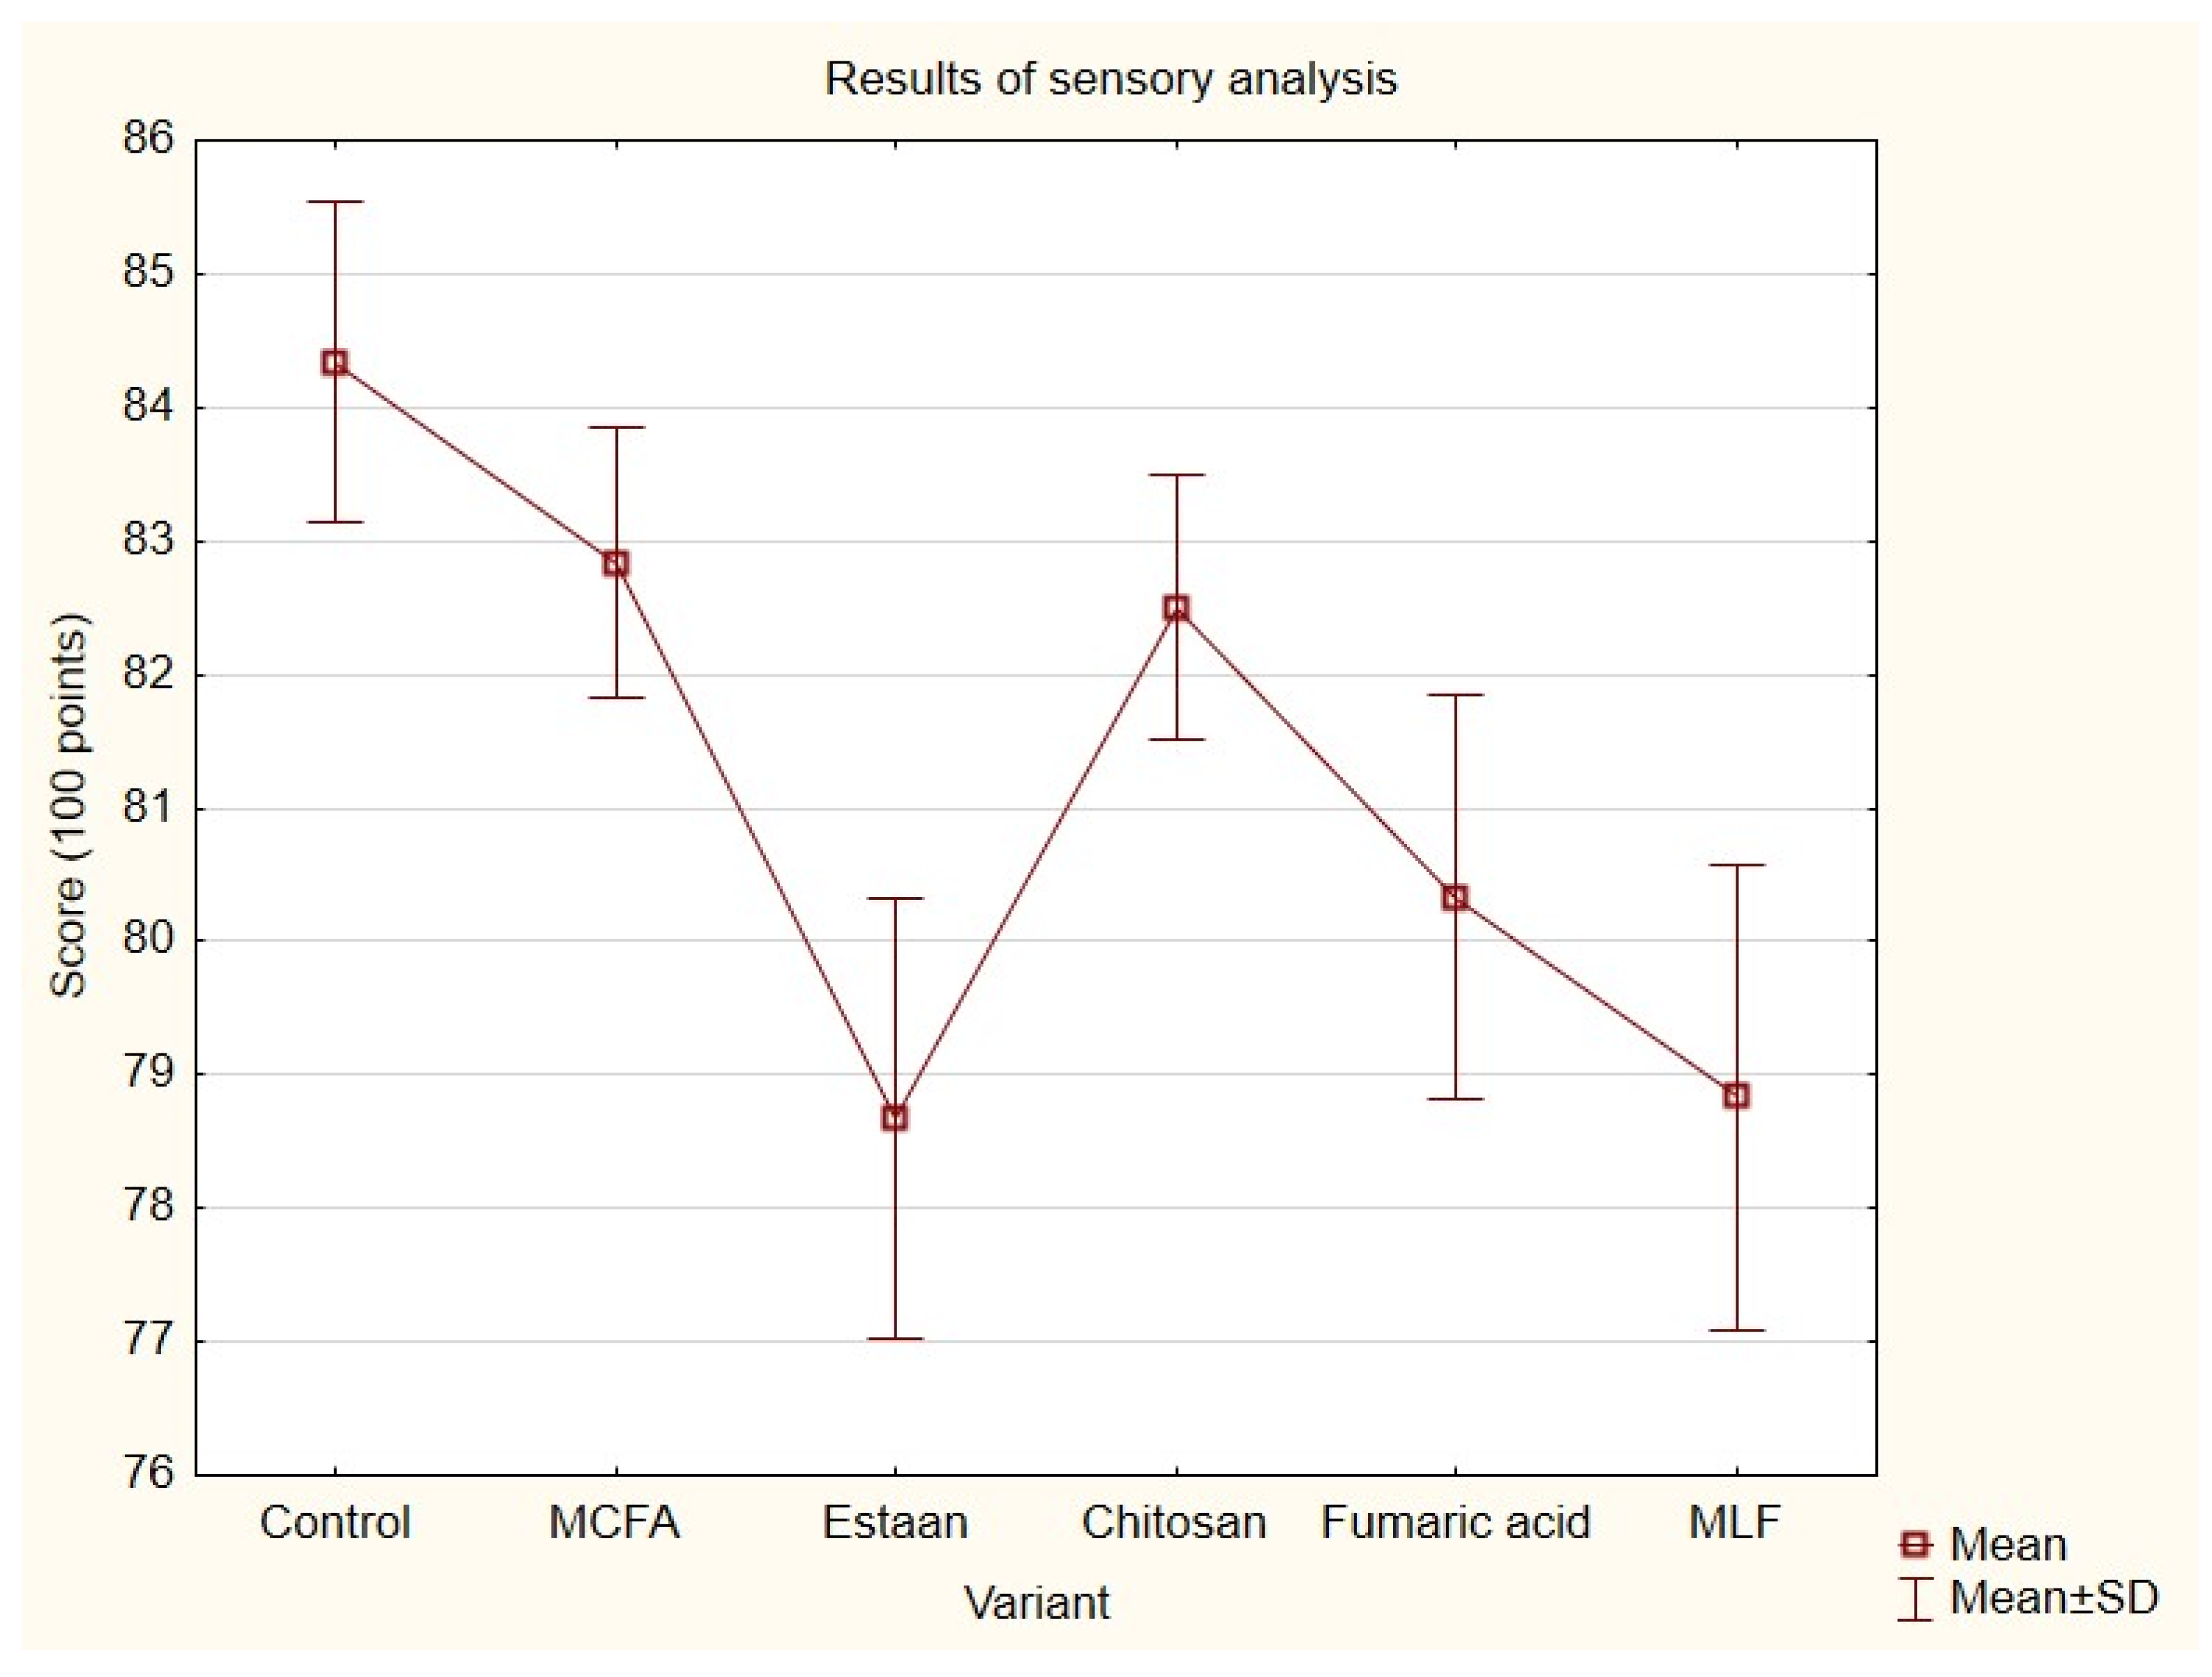
3.4. Sensory Analysis
4. Conclusions
Author Contributions
Funding
Institutional Review Board Statement
Informed Consent Statement
Data Availability Statement
Conflicts of Interest
Appendix A

| Compound (µg·L−1) | Chitosan (Mean ± SE) | MLF (Mean ± SE) | Estaan (Mean ± SE) | MCFA (Mean ± SE) | Control (Mean ± SE) | Fumaric a. (Mean ± SE) | p-Value |
|---|---|---|---|---|---|---|---|
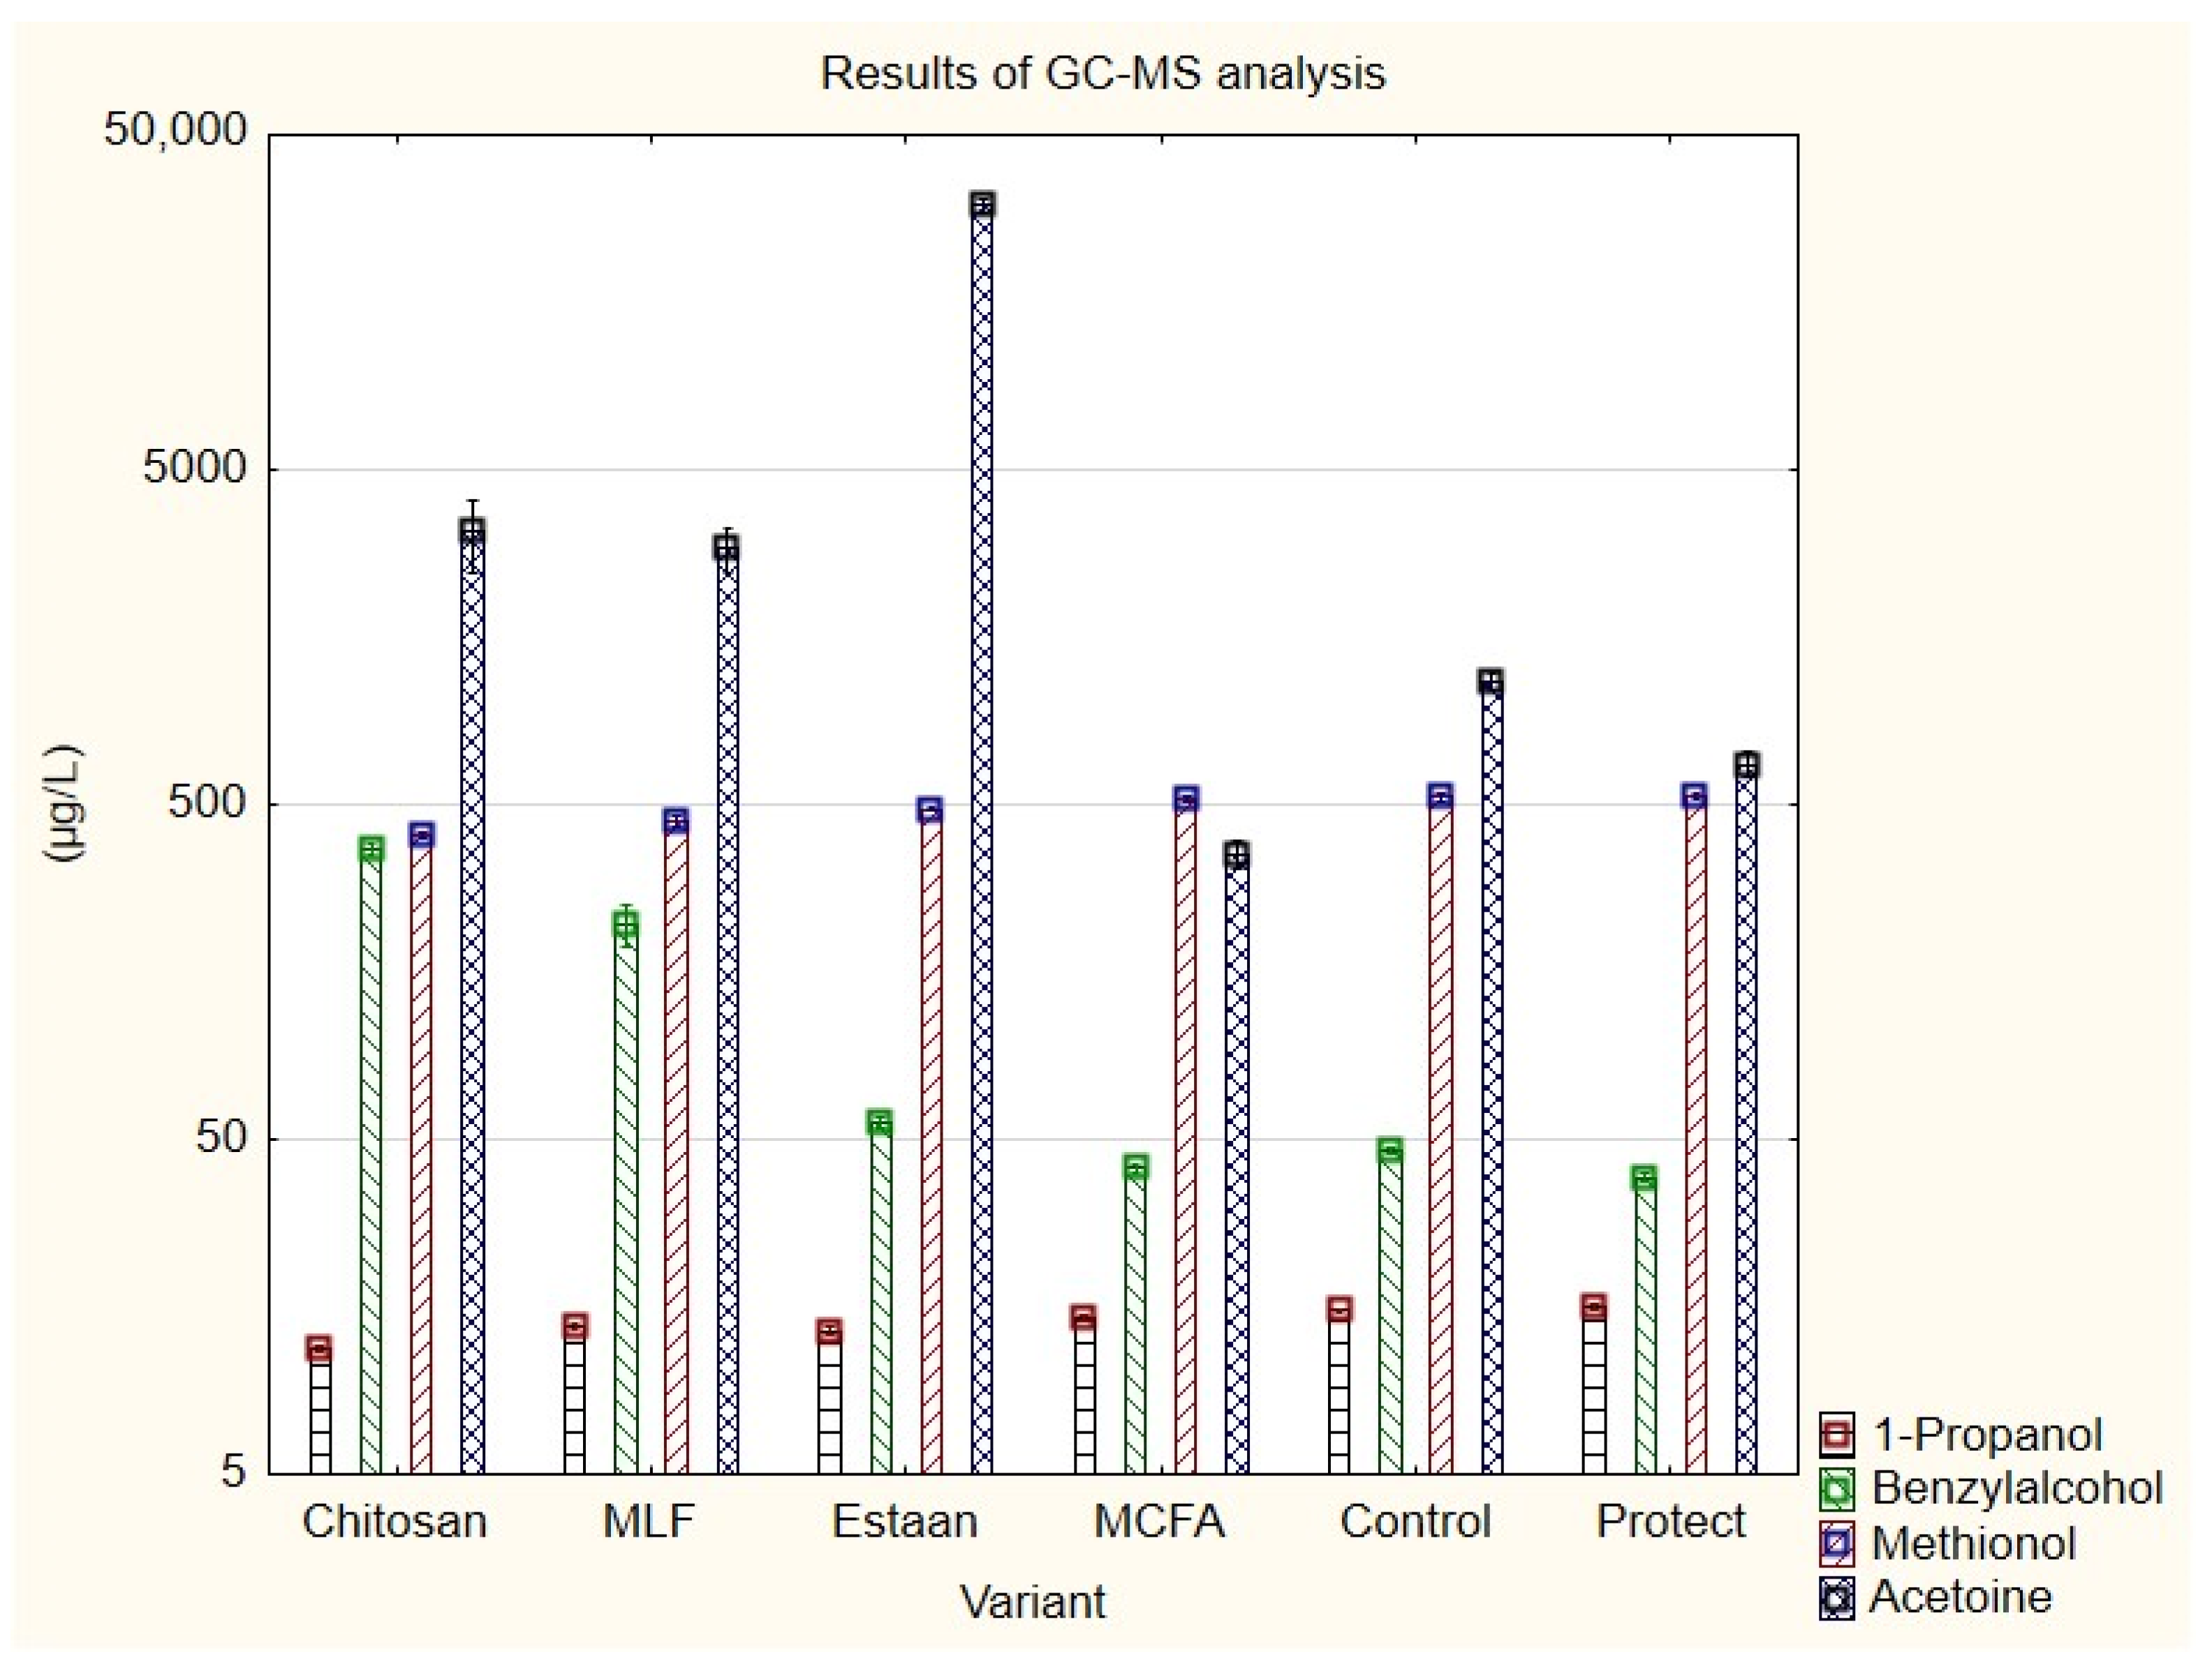
| 1-Propanol | 11.8 ± 0.2 a | 13.7 ± 0.4 b | 13.4 ± 0.3 b | 14.7 ± 0.2 c | 15.5 ± 0.1 c | 15.9 ± 0.3 d | p = 0.0000 |
| Benzylalcohol | 363 ± 15 c | 249 ± 11 b | 56 ± 2 a | 41.5 ± 1.1 a | 46.6 ± 1.1 a | 38.5 ± 1.2 a | p = 0.0000 |
| Methionol | 404 ± 11 a | 434 ± 10 a | 486 ± 8 b | 521 ± 11 c | 528 ± 16 c | 528 ± 12 c | p = 0.0000 |
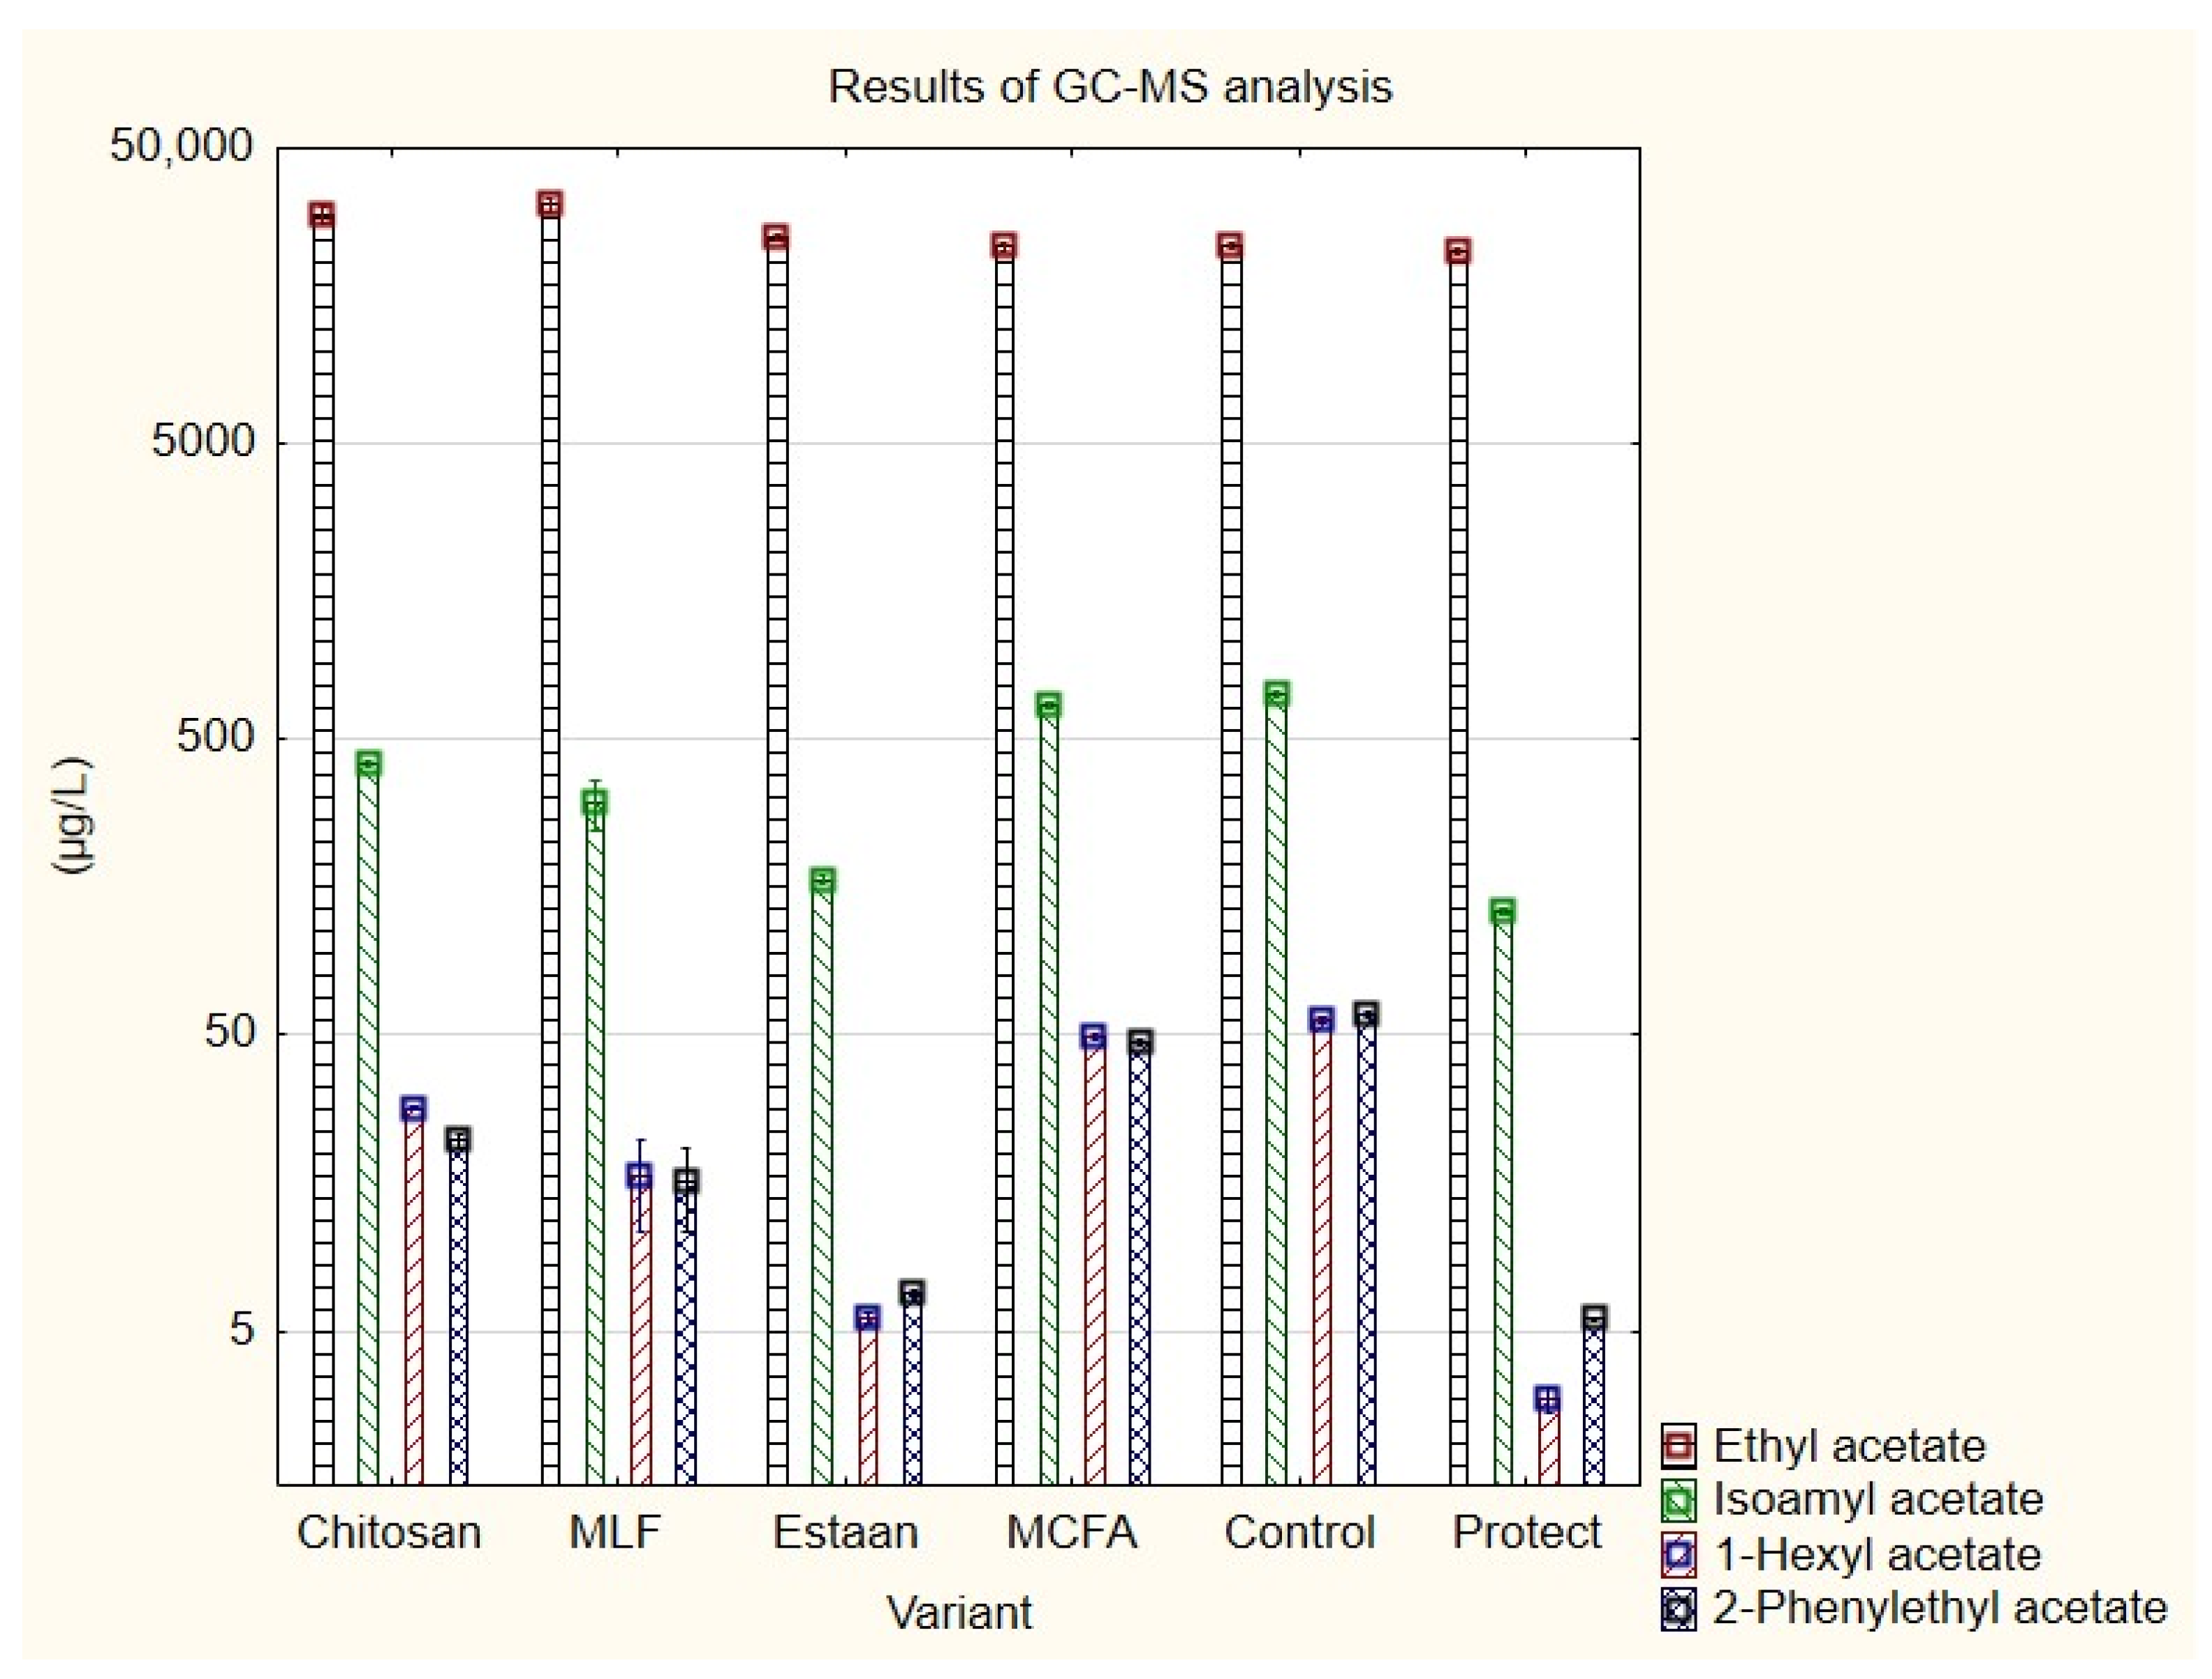
| Ethyl acetate | 28,974 ± 2273 b | 33,896 ± 671 c | 24,921 ± 521 a | 23,012 ± 581 a | 23 298 ± 439 a | 22,506 ± 441 a | p = 0.0000 |
| Isoamyl acetate | 415 ± 15 c | 249 ± 28 b | 168 ± 7 a | 646 ± 12 d | 710 ± 13 e | 130 ± 2 a | p = 0.0000 |
| 1-Hexyl acetate | 28.2 ± 0.4 c | 11.3 ± 2.2 b | 5.6 ± 0.2 a | 49.4 ± 0.7 d | 56.1 ± 0.8 e | 2.9 ± 0.3 a | p = 0.0000 |
| 2-Phenylethyl acetate | 21.5 ± 1.2 c | 10.9 ± 1.6 b | 6.7 ± 0.2 a | 47.2 ± 0.8 d | 59.3 ± 1.3 e | 5.5 ± 0.1 a | p = 0.0000 |
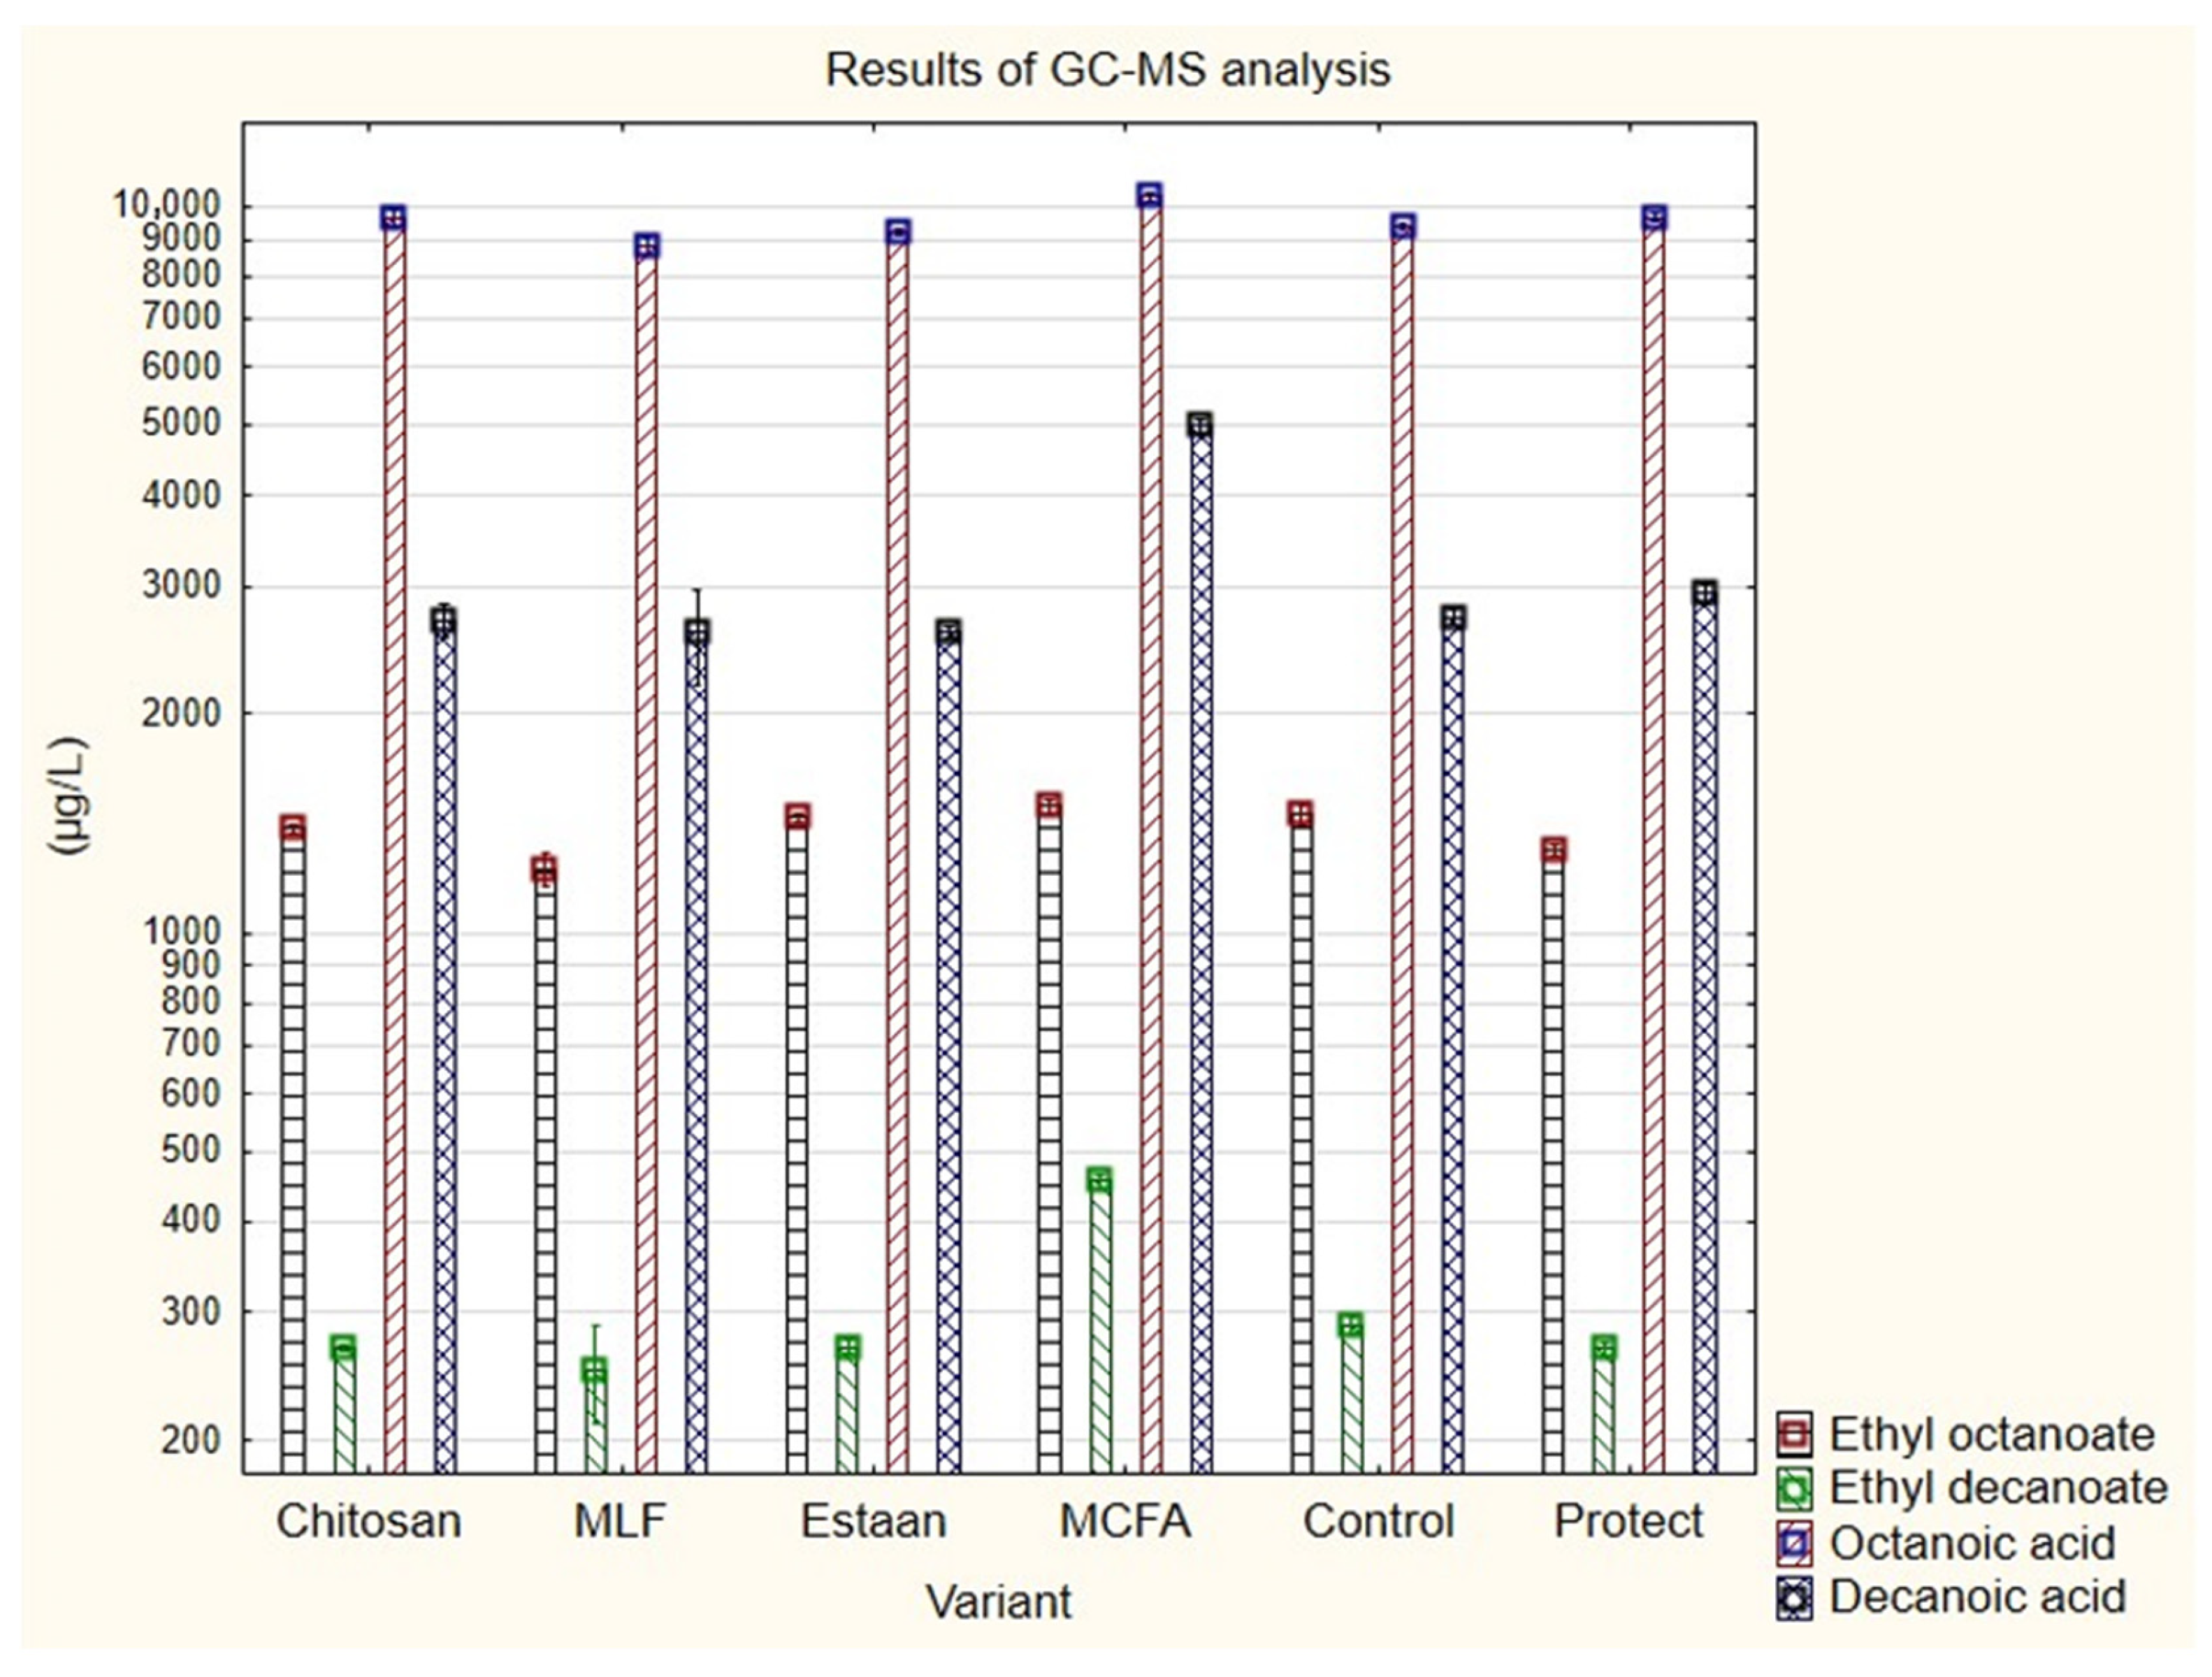
| Ethyl octanoate | 1390 ± 19 c | 1168 ± 32 a | 1441 ± 21 c,d | 1505 ± 27 d | 1458 ± 45 c,d | 1300 ± 22 b | p = 0.0000 |
| Ethyl decanoate | 268 ± 3 b | 212 ± 3 a | 269 ± 5 b | 459 ± 9 d | 288 ± 8 c | 268 ± 6 b | p = 0.0000 |
| Octanoic acid | 9522 ± 298 b,c | 8579 ± 110 a | 9215 ± 98 b | 10,277 ± 116 d | 9374 ± 101 b,c | 9659 ± 130 c | p = 0.0000 |
| Decanoic acid | 2637 ± 151 b | 2197 ± 38 a | 2588 ± 42 b | 4965 ± 97 d | 2716 ± 61 b,c | 2924 ± 88 c | p = 0.0000 |
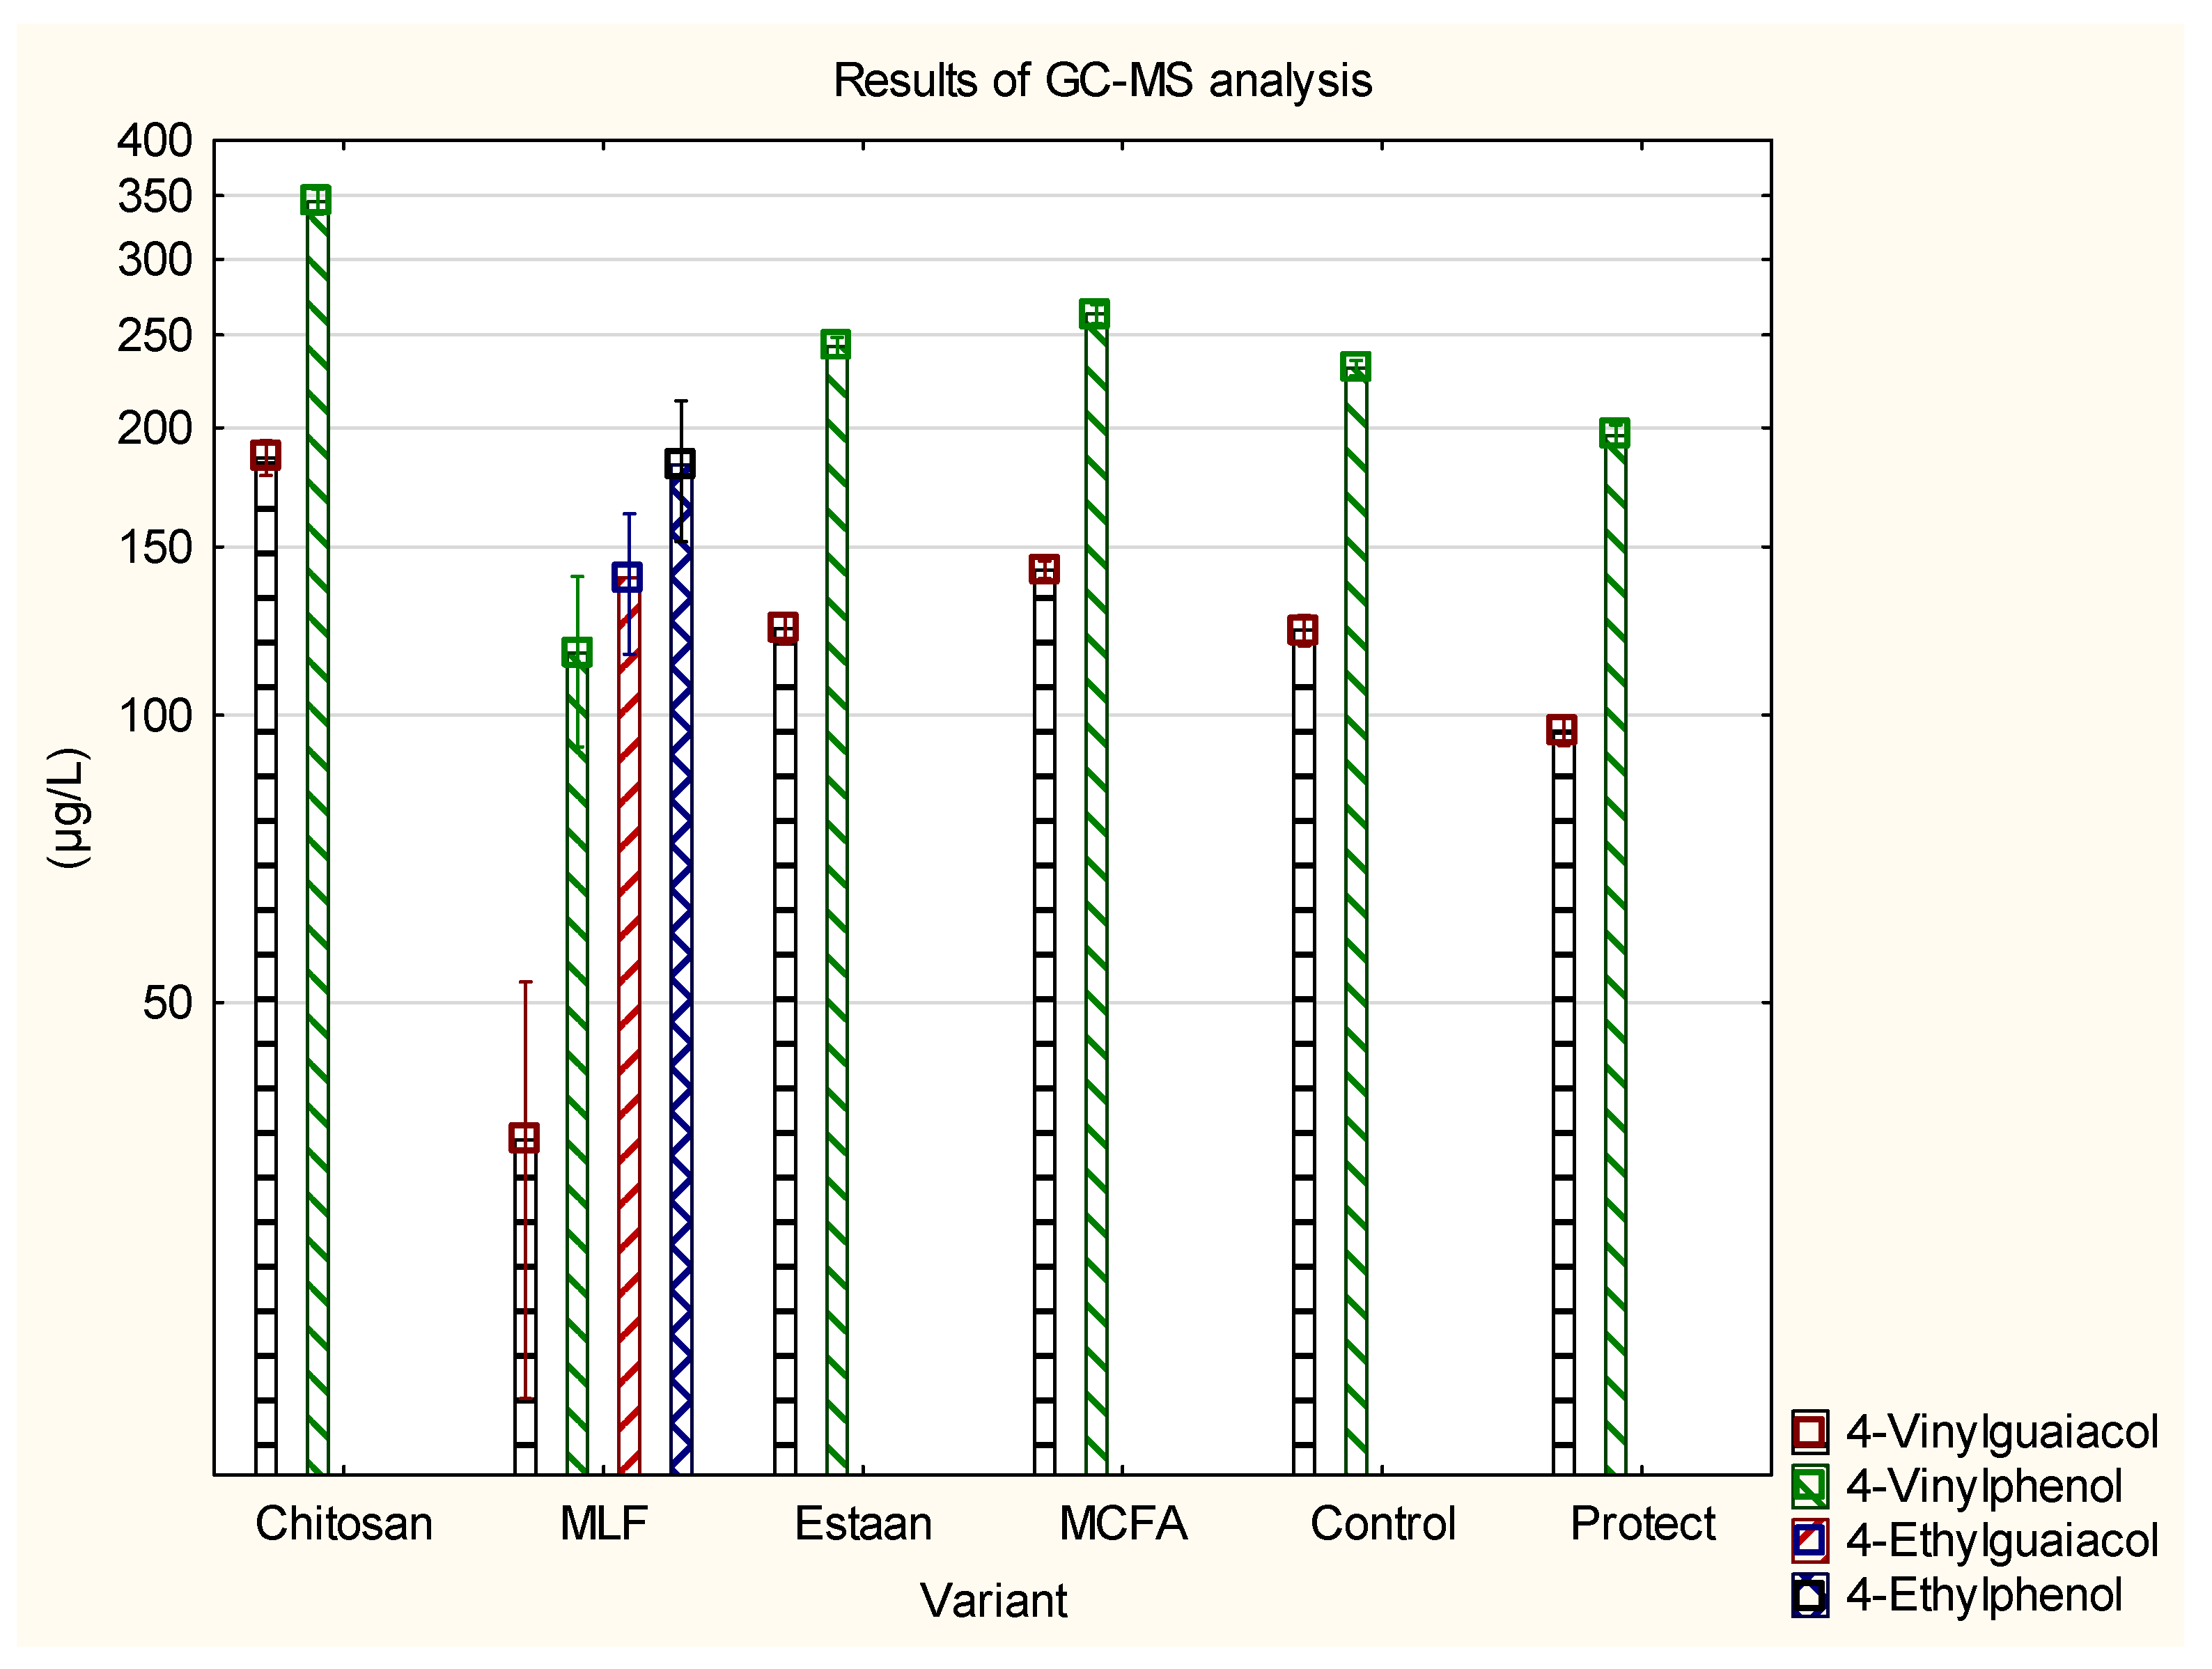
| 4-Vinylguaiacol | 183 ± 9 e | 19.2 ± 0.9 a | 123 ± 4 c | 141 ± 3 d | 123 ± 5 c | 96.3 ± 3.4 b | p = 0.0000 |
| 4-Vinylphenol | 340 ± 11 e | 93.7 ± 8.3 a | 243 ± 6 c,d | 261 ± 5 d | 231 ± 4 c | 196 ± 5 b | p = 0.0000 |
| 4-Ethylguaiacol | 0 ± 0 a | 162 ± 3 b | 0 ± 0 a | 0 ± 0 a | 0 ± 0 a | 0 ± 0 a | p = 0.0000 |
| 4-Ethylphenol | 0 ± 0 a | 213 ± 5 b | 0 ± 0 a | 0 ± 0 a | 0 ± 0 a | 0 ± 0 a | p = 0.0000 |
| Acetoine | 3680 ± 842 c | 3315 ± 211 b,c | 30,735 ± 1699 d | 366 ± 29 a | 1169 ± 74 a,b | 659 ± 57 a | p = 0.0000 |
| Compound (µg·L−1) | Estaan (Mean ± SE) | Chitosan (Mean ± SE) | MLF (Mean ± SE) | MCFA (Mean ± SE) | Control (Mean ± SE) | Fumaric a. (Mean ± SE) | p-Value |
|---|---|---|---|---|---|---|---|
| Histamin | 0.43 ± 0.01 a | 0.43 ± 0.01 a | 0.44 ± 0.01 a | 0.42 ± 0.01 a | 0.45 ± 0.01 a | 0.44 ± 0.01 a | p = 0.5263 |
| Phenylethylamin | 0.22 ± 0.01 a,b | 0.22 ± 0.01 a | 0.23 ± 0.00 a,b | 0.24 ± 0.01 b,c | 0.25 ± 0.01 c | 0.25 ± 0.00 c | p = 0.0002 |
| Putrescin | 1.59 ± 0.06 a,b | 1.76 ± 0.07 b | 1.75 ± 0.04 a,b | 1.56 ± 0.06 a | 1.66 ± 0.08 a,b | 1.73 ± 0.10 a,b | p = 0.2200 |
| Spermidin | 0.64 ± 0.03 a | 0.83 ± 0.05 b | 0.66 ± 0.02 a | 0.70 ± 0.02 a,b | 0.68 ± 0.08 a | 0.63 ± 0.07 a | p = 0.1061 |
| Category | Control (Mean ± SE) | MCFA (Mean ± SE) | Estaan (Mean ± SE) | Chitosan (Mean ± SE) | Fumaric a. (Mean ± SE) | MLF (Mean ± SE) | p-Value |
|---|---|---|---|---|---|---|---|
| Score (100 points) | 84.3 ± 1.2 c | 82.8 ± 1.0 b,c | 78.7 ± 1.6 a | 82.5 ± 1.0 a,b,c | 80.3 ± 1.5 a.b | 78.8 ± 1.7 a | 0.034 |
| Intensity of flavour | 7.5 ± 0.3 c | 7.0 ± 0.4 b,c | 5.3 ± 0.5 a | 7.0 ± 0.4 b,c | 6.0 ± 0.7 a,c | 6.2 ± 0.5 a,b,c | 0.042 |
| Intensity of taste | 6.3 ± 0.3 a | 6.5 ± 0.6 a | 5.3 ± 0.4 a | 6.3 ± 0.6 a | 6.2 ± 0.7 a | 5.3 ± 0.5 a | 0.453 |
| Body | 5.7 ± 0.4 a | 5.5 ± 0.7 a | 5.0 ± 0.0 a | 6.5 ± 0.7 a | 6.0 ± 0.8 a | 6.2 ± 0.3 a | 0.487 |
| Complexity | 6.2 ± 0.5 b | 6.2 ± 0.6 b | 4.3 ± 0.7 a | 6.7 ± 0.6 b | 6.2 ± 0.8 b | 5.5 ± 0.3 a,b | 0.116 |
References
- Davis, C.; Wibowo, D.; Eschenbruch, R.; Lee, T.; Fleet, G. Practical Implications of Malolactic Fermentation—A Review. Am. J. Enol. Vitic. 1985, 36, 290–301. [Google Scholar] [CrossRef]
- Bauer, R.; Dicks, L. Control of Malolactic Fermentation in Wine. A Review. S. Afr. J. Enol. Vitic. 2004, 25, 74–88. [Google Scholar] [CrossRef]
- Lonvaud-Funel, A. Lactic acid bacteria in the quality improvement and depreciation of wine. Antonie Van Leeuwenhoek Int. J. Gen. Mol. Microbiol. 1999, 76, 317–331. [Google Scholar] [CrossRef]
- Vanvuuren, H.; Dicks, L. Leuconostoc Oenos—A Review. Am. J. Enol. Vitic. 1993, 44, 99–112. [Google Scholar] [CrossRef]
- Morata, A.; Bañuelos, M.; López, C.; Song, C.; Vejarano, R.; Loira, I.; Palomero, F.; Lepe, J. Use of fumaric acid to control pH and inhibit malolactic fermentation in wines. Food Addit. Contam. Part A Chem. Anal. Control Expo. Risk Assess. 2020, 37, 228–238. [Google Scholar] [CrossRef] [PubMed]
- Osborne, J.; Edwards, C. Inhibition of malolactic fermentation by Saccharomyces during alcoholic fermentation under low- and high-nitrogen conditions: A study in synthetic media. Aust. J. Grape Wine Res. 2006, 12, 69–78. [Google Scholar] [CrossRef]
- Morata, A.; Loira, I.; Vejarano, R.; González, C.; Callejo, M.; Suárez-Lepe, J. Emerging preservation technologies in grapes for winemaking. Trends Food Sci. Technol. 2017, 67, 36–43. [Google Scholar] [CrossRef]
- Raúl, F.-G.; Miquel, P.; Laura, M.; Enric, N.; Claudio, H.; Imma, A. Microbiological, Physical, and Chemical Procedures to Elaborate High-Quality SO2-Free Wines. In Grapes and Wines; IntechOpen: Rijeka, Croatia, 2017. [Google Scholar] [CrossRef]
- Gao, Y.; Zhang, G.; Krentz, S.; Darius, S.; Power, J.; Lagarde, G. Inhibition of spoilage lactic acid bacteria by lysozyme during wine alcoholic fermentation. Aust. J. Grape Wine Res. 2002, 8, 76–83. [Google Scholar] [CrossRef]
- Lerm, E.; Engelbrecht, L.; du Toit, M. Malolactic Fermentation: The ABC’s of MLF. S. Afr. J. Enol. Vitic. 2010, 31, 186–212. [Google Scholar] [CrossRef]
- Ancín-Azpilicueta, C.; Jiménez-Moreno, N.; Moler, J.; Nieto-Rojo, R.; Urmeneta, H. Effects of reduced levels of sulfite in wine production using mixtures with lysozyme and dimethyl dicarbonate on levels of volatile and biogenic amines. Food Addit. Contam. Part A Chem. Anal. Control Expo. Risk Assess. 2016, 33, 1518–1526. [Google Scholar] [CrossRef]
- Chinnici, F.; Natali, N.; Riponi, C. Efficacy of Chitosan in Inhibiting the Oxidation of (+)-Catechin in White Wine Model Solutions. J. Agric. Food Chem. 2014, 62, 9868–9875. [Google Scholar] [CrossRef] [PubMed]
- Cheung, R.; Ng, T.; Wong, J.; Chan, W. Chitosan: An Update on Potential Biomedical and Pharmaceutical Applications. Mar. Drugs 2015, 13, 5156–5186. [Google Scholar] [CrossRef] [PubMed]
- Taillandier, P.; Joannis-Cassan, C.; Jentzer, J.; Gautier, S.; Sieczkowski, N.; Granes, D.; Brandam, C. Effect of a fungal chitosan preparation on Brettanomyces bruxellensis, a wine contaminant. J. Appl. Microbiol. 2015, 118, 123–131. [Google Scholar] [CrossRef] [PubMed]
- Gómez-Rivas, L.; Escudero-Abarca, B.; Aguilar-Uscanga, M.; Hayward-Jones, P.; Mendoza, P.; Ramírez, M. Selective antimicrobial action of chitosan against spoilage yeasts in mixed culture fermentations. J. Ind. Microbiol. Biotechnol. 2004, 31, 16–22. [Google Scholar] [CrossRef] [PubMed]
- Bautista-Baños, S.; Romanazzi, G.; Jiménez-Aparicio, A.; BautistaBanos, S.; JimenezAparicio, A. Chitosan in the Preservation of Agricultural Commodities; Academic Press: Cambridge, MA, USA, 2016; pp. XV–XVII. [Google Scholar]
- Mandon, P.; Prasad, E. Chitosan Market by Source (Shrimp, Squid, Crab, Krill, and Others) and Application (Water Treatment, Biomedical & Pharmaceutical, Cosmetics, Food & Beverage, and Others): Global Opportunity Analysis and Industry Forecast, 2020–2027. Available online: https://www.alliedmarketresearch.com/chitosan-market (accessed on 25 November 2023).
- Vaara, M. Agents That Increase the Permeability of the Outer-Membrane. Microbiol. Rev. 1992, 56, 395–411. [Google Scholar] [CrossRef] [PubMed]
- Shahnaz, G.; Vetter, A.; Barthelmes, J.; Rahmat, D.; Laffleur, F.; Iqbal, J.; Perera, G.; Schlocker, W.; Dünnhaput, S.; Augustijns, P.; et al. Thiolated chitosan nanoparticles for the nasal administration of leuprolide: Bioavailability and pharmacokinetic characterization. Int. J. Pharm. 2012, 428, 164–170. [Google Scholar] [CrossRef] [PubMed]
- Wang, J.; Tauchi, Y.; Deguchi, Y.; Morimoto, K.; Tabata, Y.; Ikada, Y. Positively charged gelatin microspheres as gastric mucoadhesive drug delivery system for eradication of H. pylori. Drug Deliv. 2000, 7, 237–243. [Google Scholar]
- Lonvaudfunel, A.; Desaad, A. Purification and Properties of A Malolactic Enzyme from A Strain of Leuconostoc-Mesenteroides Isolated from Grapes. Appl. Environ. Microbiol. 1982, 43, 357–361. [Google Scholar] [CrossRef]
- Cofran, D.R.; Meyer, B.J. The Effect of Fumaric Acid on Malo-Lactic Fermentation. Agric. Food Sci. 1970, 21, 189–192. [Google Scholar] [CrossRef]
- Tchelistcheff, A.; Peterson, R.; Vangelde, M. Control of Malo-Lactic Fermentation in Wine. Am. J. Enol. Vitic. 1971, 22, 1–5. [Google Scholar] [CrossRef]
- Pilone, G.; Rankine, B.; Pilone, D. Inhibiting Malo-Lactic Fermentation in Australian Dry Red Wines by Adding Fumaric Acid. Am. J. Enol. Vitic. 1974, 25, 99–107. [Google Scholar] [CrossRef]
- Galloway, D.; Williams, J.; Moore, C. Effects of fumarates on inflammatory human astrocyte responses and oligodendrocyte differentiation. Ann. Clin. Transl. Neurol. 2017, 4, 381–391. [Google Scholar] [CrossRef]
- Cortereal, M.; Leao, C. Transport of Malic-Acid and Other Dicarboxylic-Acids in the Yeast Hansenula-Anomala. Appl. Environ. Microbiol. 1990, 56, 1109–1113. [Google Scholar] [CrossRef] [PubMed]
- Saayman, M.; van Vuuren, H.; van Zyl, W.; Viljoen-Bloom, M. Differential uptake of fumarate by Candida utilis and Schizosaccharomyces pombe. Appl. Microbiol. Biotechnol. 2000, 54, 792–798. [Google Scholar] [CrossRef] [PubMed]
- Alexandre, H.; Costello, P.; Remize, F.; Guzzo, J.; Guilloux-Benatier, M. Saccharomyces cerevisiae: Oenococcus oeni interactions in wine:: Current knowledge and perspectives. Int. J. Food Microbiol. 2004, 93, 141–154. [Google Scholar] [CrossRef]
- Edwards, C.; Beelman, R.; Bartley, C.; Mcconnell, A. Production of Decanoic Acid and Other Volatile Compounds and the Growth of Yeast and Malolactic Bacteria during Vinification. Am. J. Enol. Vitic. 1990, 41, 48–56. [Google Scholar] [CrossRef]
- Carretã, R.; Vidal, M.; Bordons, A.; Constantã, M. Inhibitory effect of sulfur dioxide and other stress compounds in wine on the ATPase activity of Oenococcus oeni. Microbiol. Lett. 2002, 211, 155–159. [Google Scholar] [CrossRef]
- Bábíková, P.; Baroň, M.; Kumšta, M.; Sotolář, R. Increasing the efficiency of sulfur dioxide in wine by using of saturated higher fatty acids. Acta Univ. Agric. Silvic. Mendel. Brun. 2012, 60, 2. [Google Scholar] [CrossRef]
- Baron, M.; Kumsta, M.; Prokes, K.; Tomaskova, L.; Tomkova, M. The inhibition of Saccharomyces cerevisiae population during alcoholic fermentation of grape must by octanoic, decanoic and dodecanoic acid mixture. In Proceedings of the 40th World Congress of Vine and Wine, Sofia, Bulgaria, 29 May–2 June 2017. [Google Scholar]
- García-Ruiz, A.; Moreno-Arribas, M.; Martín-Alvarez, P.; Bartolomé, B. Comparative study of the inhibitory effects of wine polyphenols on the growth of enological lactic acid bacteria. Int. J. Food Microbiol. 2011, 145, 426–431. [Google Scholar] [CrossRef]
- Stivala, M.; Villecco, M.; Fanzone, M.; Jofre, V.; Rodríguez-Vaquero, M.; Aredes, P. Characterization, Antibacterial and Biological Activities of Phenolic Fraction of Argentinean Red Wines. Open Conf. Proc. J. 2014, 5, 29–37. [Google Scholar] [CrossRef][Green Version]
- Stivala, M.; Villecco, M.; Fanzone, M.; Jofré, V.; Aredes-Fernández, P. Characterization of the phenolic fraction from Argentine wine and its effect on viability and polysaccharide production of Pediococcus pentosaceus. Biotechnol. Lett. 2015, 37, 2435–2444. [Google Scholar] [CrossRef] [PubMed]
- Bloem, A.; Bertrand, A.; Lonvaud-Funel, A.; de Revel, G. Vanillin production from simple phenols by wine-associated lactic acid bacteria. Lett. Appl. Microbiol. 2007, 44, 62–67. [Google Scholar] [CrossRef] [PubMed]
- Campos, F.; Couto, J.; Hogg, T. Influence of phenolic acids on growth and inactivation of Oenococcus oeni and Lactobacillus hilgardii. J. Appl. Microbiol. 2003, 94, 167–174. [Google Scholar] [CrossRef] [PubMed]
- Figueiredo, A.; Campos, F.; de Freitas, V.; Hogg, T.; Couto, J. Effect of phenolic aldehydes and flavonoids on growth and inactivation of Oenococcus oeni and Lactobacillus hilgardii. Food Microbiol. 2008, 25, 105–112. [Google Scholar] [CrossRef] [PubMed]
- García-Ruiz, A.; Bartolomé, B.; Cueva, C.; Martín-Alvarez, P.; Moreno-Arribas, M. Inactivation of oenological lactic acid bacteria (Lactobacillus hilgardii and Pediococcus pentosaceus) by wine phenolic compounds. J. Appl. Microbiol. 2009, 107, 1042–1053. [Google Scholar] [CrossRef] [PubMed]
- Landete, J.; Rodríguez, H.; De Las Rivas, B.; Muñoz, R. High-added-value antioxidants obtained from the degradation of wine phenolics by Lactobacillus plantarum. J. Food Prot. 2007, 70, 2670–2675. [Google Scholar] [CrossRef] [PubMed]
- Reguant, C.; Bordons, A.; Arola, L.; Rozès, N. Influence of phenolic compounds on the physiology of OEnococcus oeni from wine. J. Appl. Microbiol. 2000, 88, 1065–1071. [Google Scholar] [CrossRef]
- Stead, D. The Effect of Hydroxycinnamic Acids on the Growth of Wine-Spoilage Lactic-Acid Bacteria. J. Appl. Bacteriol. 1993, 75, 135–141. [Google Scholar] [CrossRef]
- Theobald, S.; Pfeiffer, P.; Zuber, U.; König, H. Influence of epigallocatechin gallate and phenolic compounds from green tea on the growth of Oenococcus oeni. J. Appl. Microbiol. 2008, 104, 566–572. [Google Scholar] [CrossRef]
- Vivas, N.; LonvaudFunel, A.; Glories, Y. Effect of phenolic acids and anthocyanins on growth, viability and malolactic activity of a lactic acid bacterium. Food Microbiol. 1997, 14, 291–299. [Google Scholar] [CrossRef]
- Bartowsky, E. Bacterial spoilage of wine and approaches to minimize it. Lett. Appl. Microbiol. 2009, 48, 149–156. [Google Scholar] [CrossRef] [PubMed]
- García-Ruiz, A.; Bartolomé, B.; Martínez-Rodríguez, A.; Pueyo, E.; Martín-Alvarez, P.; Moreno-Arribas, M. Potential of phenolic compounds for controlling lactic acid bacteria growth in wine. Food Control 2008, 19, 835–841. [Google Scholar] [CrossRef]
- Johnston, M.; Hanlon, G.; Denyer, S.; Lambert, R. Membrane damage to bacteria caused by single and combined biocides. J. Appl. Microbiol. 2003, 94, 1015–1023. [Google Scholar] [CrossRef]
- Rodríguez, H.; Curiel, J.; Landete, J.; de las Rivas, B.; de Felipe, F.; Gómez-Cordovés, C.; Mancheño, J.; Muñoz, R. Food phenolics and lactic acid bacteria. Int. J. Food Microbiol. 2009, 132, 79–90. [Google Scholar] [CrossRef]
- Anli, R.E.; Bayram, M. Biogenic Amines in Wines. Food Rev. Int. 2009, 25, 86–102. [Google Scholar] [CrossRef]
- Jastrzebska, A.; Piasta, A.; Szlyk, E. Simultaneous determination of selected biogenic amines in alcoholic beverage samples by isotachophoretic and chromatographic methods. Food Addit. Contam. Part A Chem. Anal. Control Expo. Risk Assess. 2014, 31, 83–92. [Google Scholar] [CrossRef] [PubMed]
- Rihak, Z.; Prusova, B.; Kumsta, M.; Baron, M. Effect of Must Hyperoxygenation on Sensory Expression and Chemical Composition of the Resulting Wines. Molecules 2022, 27, 235. [Google Scholar] [CrossRef]
- Prusova, B.; Baron, M. Effect of Controlled Micro Oxygenation on White Wine. Ciênc. Téc. Vitiviníc. 2018, 33, 78–89. [Google Scholar] [CrossRef]
- Kumsta, M.; Helmová, T.; Stusková, K.; Baron, M.; Prusová, B.; Sochor, J. HPLC/HILIC determination of biogenic amines in wines produced by different winemaking technologies. Acta Aliment. 2023, 52, 209–219. [Google Scholar] [CrossRef]
- ISO 8589; Sensory Analysis—General Guidance for the Design of Test Rooms. International Organization of Standardization: Geneva, Switzerland, 2007. Available online: https://www.iso.org/obp/ui/#iso:std:iso:8589:ed-2:v1:en (accessed on 21 December 2023).
- ISO 8586; Sensory Analysis—Selection and Training of Sensory Assessors. International Organization of Standardization: Geneva, Switzerland, 2023. Available online: https://www.iso.org/obp/ui/#iso:std:iso:8586:ed-2:v1:en (accessed on 21 December 2023).
- Ugliano, M.; Moio, L. Changes in the concentration of yeast-derived volatile compounds of red wine during malolactic fermentation with four commercial starter cultures of Oenococcus oeni. J. Agric. Food Chem. 2005, 53, 10134–10139. [Google Scholar] [CrossRef]
- Sun, S.; Chen, Z.; Jin, C. Combined influence of lactic acid bacteria starter and final pH on the induction of malolactic fermentation and quality of cherry wines. LWT Food Sci. Technol. 2018, 89, 449–456. [Google Scholar] [CrossRef]
- Knoll, C.; Fritsch, S.; Schnell, S.; Grossmann, M.; Rauhut, D.; du Toit, M. Influence of pH and ethanol on malolactic fermentation and volatile aroma compound composition in white wines. LWT Food Sci. Technol. 2011, 44, 2077–2086. [Google Scholar] [CrossRef]
- Sun, S.; Gong, H.; Liu, W.; Jin, C. Application and validation of autochthonous Lactobacillus plantarum starter cultures for controlled malolactic fermentation and its influence on the aromatic profile of cherry wines. Food Microbiol. 2016, 55, 16–24. [Google Scholar] [CrossRef] [PubMed]
- Knoll, C.; Fritsch, S.; Schnell, S.; Grossmann, M.; Krieger-Weber, S.; du Toit, M.; Rauhut, D. Impact of different malolactic fermentation inoculation scenarios on Riesling wine aroma. World J. Microbiol. Biotechnol. 2012, 28, 1143–1153. [Google Scholar] [CrossRef] [PubMed]
- Pozo-Bayón, M.; Alegría, E.; Polo, M.; Tenorio, C.; Martín-Alvarez, P.; De La Banda, M.; Ruiz-Larrea, F.; Moreno-Arribas, M. Wine volatile and amino acid composition after malolactic fermentation:: Effect of Oenococcus oeni and Lactobacillus plantarum starter cultures. J. Agric. Food Chem. 2005, 53, 8729–8735. [Google Scholar] [CrossRef] [PubMed]
- Licek, J.; Baron, M.; Sochor, J.; Kumsta, M.; Mlcek, J. Observation of Residues Content after Application of a Medium-Chain Fatty Acids Mixture at the End of Alcoholic Fermentation. Fermentation 2022, 8, 105. [Google Scholar] [CrossRef]
- Ugliano, M.; Henschke, P.A. Yeasts and Wine Flavour. In Wine Chemistry and Biochemistry; Springer: New York, NY, USA, 2009; pp. 313–392. [Google Scholar] [CrossRef]
- Swiegers, J.H.; Pretorius, I.S. Yeast Modulation of Wine Flavor. Adv. Appl. Microbiol. 2005, 57, 131–175. [Google Scholar] [CrossRef] [PubMed]
- Maicas, S.; Gil, J.; Pardo, I.; Ferrer, S. Improvement of volatile composition of wines by controlled addition of malolactic bacteria. Food Res. Int. 1999, 32, 491–496. [Google Scholar] [CrossRef]
- Licek, J.; Baron, M.; Sochor, J. Comparison of MCFA and Other Methods of Terminating Alcohol Fermentation and Their Influence on the Content of Carbonyl Compounds in Wine. Molecules 2020, 25, 5737. [Google Scholar] [CrossRef]
- Romano, P.; Suzzi, G. Origin and production of acetoin during wine yeast fermentation. Appl. Environ. Microbiol. 1996, 62, 309–315. [Google Scholar] [CrossRef]
- Flamini, R.; De Luca, G.; Di Stefano, R. Changes in carbonyl compounds in Chardonnay and Cabernet Sauvignon wines as a consequence of malolactic fermentation. Vitis 2002, 41, 107–112. [Google Scholar]
- Martineau, B.; Acree, T.E.; Henickkling, T. Effect of Wine Type on the Detection Threshold for Diacetyl. Food Res. Int. 1995, 28, 139–143. [Google Scholar] [CrossRef]
- Wang, S.; Li, Y.; Li, T.; Yang, H.; Ren, J.; Zhang, B.; Zhu, B. Dibasic Ammonium Phosphate Application Enhances Aromatic Compound Concentration in Bog Bilberry Syrup Wine. Molecules 2017, 22, 52. [Google Scholar] [CrossRef] [PubMed]
- Wang, S.; Zhu, H.; Lan, Y.; Liu, R.; Liu, Y.; Zhang, B.; Zhu, B. Modifications of Phenolic Compounds, Biogenic Amines, and Volatile Compounds in Cabernet Gernishct Wine through Malolactic Fermentation by Lactobacillus plantarum and Oenococcus oeni. Fermentation 2020, 6, 15. [Google Scholar] [CrossRef]
- Chatonnet, P.; Dubourdieu, D.; Boidron, J.; Lavigne, V. Synthesis of Volatile Phenols by Saccharomyces-Cerevisiae in Wines. J. Sci. Food Agric. 1993, 62, 191–202. [Google Scholar] [CrossRef]
- Chatonnet, P.; Dubourdieu, D.; Boidron, J.; Pons, M. The Origin of Ethylphenols in Wines. J. Sci. Food Agric. 1992, 60, 165–178. [Google Scholar] [CrossRef]
- Guo, Y.; Yang, Y.; Peng, Q.; Han, Y. Biogenic amines in wine: A review. Int. J. Food Sci. Technol. 2015, 50, 1523–1532. [Google Scholar] [CrossRef]
- Arena, M.; de Nadra, M. Biogenic amine production by Lactobacillus. J. Appl. Microbiol. 2001, 90, 158–162. [Google Scholar] [CrossRef]
- Cañas, P.; Alonso, S.; Pérez, P.; Prieto, S.; Romero, E.; Herreros, M. Biogenic Amine Production by Oenococcus oeni Isolates from Malolactic Fermentation of Tempranillo Wine. J. Food Prot. 2009, 72, 907–910. [Google Scholar] [CrossRef]
- Guerrini, S.; Mangani, S.; Granchi, L.; Vincenzini, M. Biogenic amine production by Oenococcus oeni. Curr. Microbiol. 2002, 44, 374–378. [Google Scholar] [CrossRef]


| Variant | Term (Months) | Alcohol (% vol.) | Titr. Acids (g·L−1) | Res. Sugar (g·L−1) | pH | Malic Acid (g·L−1) | Lactic Acid (g·L−1) | Acetic Acid (g·L−1) |
|---|---|---|---|---|---|---|---|---|
| MLF | 4 | 11.76 ± 0.28 a | 6.13 ± 0.17 b | 0.26 ± 0.19 a | 3.34 ± 0.02 e | 0.35 ± 0.10 a,b | 1.18 ± 0.11 e | 0.31 ± 0.02 b,c |
| 10 | 12.16 ± 0.02 b | 6.18 ± 0.03 b | 0.32 ± 0.32 a | 2.98 ± 0.02 a | 0.79 ± 0.18 b | 1.32 ± 0.16 e,f | 0.25 ± 0.02 a,b | |
| Control | 4 | 12.01 ± 0.06 a,b | 6.89 ± 0.04 d,e | 0.00 ± 0.00 a | 3.26 ± 0.02 d | 1.97 ± 0.14 c | 0.43 ± 0.12 c | 0.25 ± 0.02 a |
| 10 | 12.12 ± 0.02 b | 6.61 ± 0.1 c,d | 1.29 ± 0.47 b | 3.14 ± 0.01 b | 2.16 ± 0.23 c | 0.09 ± 0.06 a,b | 0.30 ± 0.02 a,b,c | |
| Estaan | 4 | 12.20 ± 0.04 b | 7.18 ± 0.11 f | 0.00 ± 0.00 a | 3.24 ± 0.01 d | 2.18 ± 0.12 c | 0.26 ± 0.09 a,b,c | 0.26 ± 0.02 a,b |
| 10 | 12.19 ± 0.04 b | 5.76 ± 0.04 a | 1.69 ± 0.60 b,c | 3.12 ± 0.07 b | 0.61 ± 0.21 a,b | 0.90 ± 0.10 d | 0.34 ± 0.02 c | |
| MCFA | 4 | 12.08 ± 0.03 b | 7.10 ± 0.08 e,f | 0.00 ± 0.00 a | 3.24 ± 0.02 d | 2.23 ± 0.08 c | 0.19 ± 0.07 a,b,c | 0.29 ± 0.02 a,b,c |
| 10 | 12.15 ± 0.04 b | 6.60 ± 0.12 c | 1.66 ± 0.67 b,c | 3.16 ± 0.02 b,c | 1.93 ± 0.17 c | 0.06 ± 0.06 a | 0.30 ± 0.02 a,b,c | |
| Fumaric | 4 | 12.10 ± 0.04 b | 7.22 ± 0.12 f | 0.12 ± 0.11 a | 3.22 ± 0.02 c,d | 2.27 ± 0.22 c | 0.09 ± 0.05 a,b | 0.29 ± 0.03 a,b,c |
| 10 | 12.15 ± 0.02 b | 6.72 ± 0.11 c,d | 2.45 ± 0.39 c | 3.12 ± 0.02 b | 2.21 ± 0.22 c | 0.03 ± 0.03 a | 0.32 ± 0.02 c | |
| Chitosan | 4 | 12.08 ± 0.02 b | 7.12 ± 0.13 e,f | 0.12 ± 0.12 a | 3.23 ± 0.02 d | 2.01 ± 0.21 c | 0.33 ± 0.11 b,c | 0.31 ± 0.03 b,c |
| 10 | 12.13 ± 0.04 b | 6.21 ± 0.06 b | 0.00 ± 0.00 a | 3.00 ± 0.03 a | 0.17 ± 0.07 a | 1.53 ± 0.07 f | 0.31 ± 0.02 b,c |
Disclaimer/Publisher’s Note: The statements, opinions and data contained in all publications are solely those of the individual author(s) and contributor(s) and not of MDPI and/or the editor(s). MDPI and/or the editor(s) disclaim responsibility for any injury to people or property resulting from any ideas, methods, instructions or products referred to in the content. |
© 2024 by the authors. Licensee MDPI, Basel, Switzerland. This article is an open access article distributed under the terms and conditions of the Creative Commons Attribution (CC BY) license (https://creativecommons.org/licenses/by/4.0/).
Share and Cite
Prusova, B.; Licek, J.; Kumsta, M.; Baron, M.; Sochor, J. Effect of New Methods for Inhibiting Malolactic Fermentation on the Analytical and Sensory Parameters of Wines. Fermentation 2024, 10, 122. https://doi.org/10.3390/fermentation10030122
Prusova B, Licek J, Kumsta M, Baron M, Sochor J. Effect of New Methods for Inhibiting Malolactic Fermentation on the Analytical and Sensory Parameters of Wines. Fermentation. 2024; 10(3):122. https://doi.org/10.3390/fermentation10030122
Chicago/Turabian StylePrusova, Bozena, Josef Licek, Michal Kumsta, Mojmir Baron, and Jiri Sochor. 2024. "Effect of New Methods for Inhibiting Malolactic Fermentation on the Analytical and Sensory Parameters of Wines" Fermentation 10, no. 3: 122. https://doi.org/10.3390/fermentation10030122
APA StylePrusova, B., Licek, J., Kumsta, M., Baron, M., & Sochor, J. (2024). Effect of New Methods for Inhibiting Malolactic Fermentation on the Analytical and Sensory Parameters of Wines. Fermentation, 10(3), 122. https://doi.org/10.3390/fermentation10030122