Article

Lactic Acid Production by Enterococcus durans Is Improved by Cell Recycling and pH Control

by
Raissa Gabriela Martins Reis Barroso
1,2,
Mônica Caramez Triches Damaso
2,
Fabricio Machado
1,* and
Sílvia Belém Gonçalves
2,*
1
Institute of Chemistry, University of Brasília, Campus Universitário Darcy Ribeiro, Brasília 70910-900, DF, Brazil
2
Embrapa Agroenergy, Parque Estação Biológica, PqEB s/n, W3 Norte, Brasília 70770-901, DF, Brazil
*
Authors to whom correspondence should be addressed.
Fermentation 2024, 10(3), 149; https://doi.org/10.3390/fermentation10030149
Submission received: 23 January 2024 / Revised: 1 March 2024 / Accepted: 3 March 2024 / Published: 6 March 2024

Abstract

:
Lactic acid bacteria are widely used because they produce lactic acid naturally, are resistant to acidic pH and a wide temperature range, and frequently produce lactic acid as a primary metabolite. In this study, Enterococcus durans isolated from buffalo milk was employed in lactic acid fermentation with the primary goal of obtaining fermentation parameters for an effective process enabling the use of lactose as an alternative carbon source. Fermentative parameters such as initial concentration of carbon source, dissolved oxygen concentration, cell recycling, and batch with pulse operation mode were studied to find the best conditions for L-(+)-lactic acid production. The association of 20 g·L−1 of lactose with 10 g·L−1 of glucose enabled the best bioconversion to lactic acid. Anaerobiosis did not contribute to increasing lactic acid production. Batch fermentation with cell recycling was the strategy that enhanced lactic acid production and lactose consumption, reaching 26.07 g·L−1, 0.36 g·L−1·h−1 of productivity and yielding about 0.86 g·g−1. It is fundamental to evaluate the parameters of lactic acid fermentation and provide efficient and sustainable production methods.

1. Introduction

Lactic acid is a carboxylic acid with many applications in the food, chemical, pharmaceutical, and polymer industries. According to Markets and Markets, the global lactic acid market is expected to be worth USD 2.1 billion by 2025. The global PLA market is expected to be worth USD 1756 million by 2025 [1]. One of the most common methods of obtaining lactic acid is fermentation. Several carbon sources, microorganisms, and fermentation processes are being researched to optimize its production [2].
Lactic acid is widely used in the polymer industry as a building block because it can be chemically modified and used as a monomeric unit to produce poly(lactic acid) (PLA) and its derivatives [3]. Furthermore, plastics derived from petroleum have accumulated waste in the environment with long decay times. Another disadvantage of fossil-based plastic materials is their reliance on non-renewable raw materials [4,5]. It can be used to synthesize poly(lactic acid) (PLA), a polymer that can replace petrochemical-derived plastic products. Those polymers may have a shorter degradation rate than petrochemicals, and their monomer lactic acid can be obtained through the microbial fermentation of renewable resources. In addition, lactic acid can be used in acrylate production from dehydrating using zeolites and hydroxyapatite as catalysts, reducing the dependence on petrochemical sources to create acrylate-based monomers, which is another significant application of lactic acid [6,7,8].
Fermentative processes can produce D(−) or L(+) lactic acid isomers. The enantiomers are produced in bacterial cells by the enzymes L(+) or D(−) lactate dehydrogenase (nLDH). When only one product is produced throughout the fermentation process, the pathway is homofermentative; when more than one product is generated during bioconversion, the pathway is heterofermentative. The fermentation parameters are determinants of the production of compounds of interest; among the conditions that can be changed are substrate concentration, pH, and temperature [9]. LA with optical purity as the only product formed is desirable. The lactic acid purification procedure would be facilitated, and competition for the carbon source would be avoided by the production of just one of the isomers [10].
Lactic acid bacteria (LAB), which are commonly used in LA fermentation, are selective for carbon and nitrogen sources [11]. Homofermentative LAB includes Streptococcus, Lactococcus, Enterococcus, Pediococcus, and some Lactobacillus [12]. Enterococcus is a Gram-positive, non-spore-forming cocci that belongs to the lactic acid bacteria group. They are extremely important in terms of food fermentation or deterioration. [13,14]. Table 1 shows examples of microorganisms capable of producing lactic acid from different substrates.
The homofermentative LAB generally uses hexose and pentose sugars via the Embden–Meyerhof pathway (glycolysis and pentose phosphate pathway). For hetero-lactic acid metabolism, disaccharides, monosaccharide hexoses and monosaccharides pentoses are able to be metabolized by LAB via the Embden–Meyerhof–Parnas (EMP) pathway and the pentose phosphoketolase (PK) pathway, as shown in Figure 1 [12]. Table 1 shows some examples of microorganisms capable of producing lactic acid and the carbon source used in each fermentation.
Most strains of LAB enterococci isolated from milk are homofermentative [13,23]. E. faecium [17] and E. faecalis [20,21] have been investigated for lactic acid production from various substrates. Enterococcus durans can produce chemicals of technological relevance that have already been documented in the literature, such as probiotic and antioxidant capacity and antifungal and antimicrobial capacity [23,24,25,26,27,28].
Several agro-industrial wastes have previously been investigated as fermentative substrates [21,22]. Whey, which contains lactose, is one example of a residue used as a carbon source in lactic acid production. We evaluated the bioconversion of lactose to lactic acid to determine if it might be possible to employ agro-industrial wastes obtained from the milk industry as a substrate. The strategy of reusing dairy waste is important in the context of the circular economy and has the potential to valorize cheese industry waste. Several studies have indicated that the use of waste, such as cheese whey, is achievable since it contains carbohydrates, primarily lactose [29,30,31].
Despite having great potential to produce lactic acid as the only metabolite with optical purity and high yields, there are few studies that use E. durans to produce lactic acid via fermentation. In this situation, the purpose of the study was to evaluate bacterial strains isolated from buffalo milk in the conversion of lactose into L-(+)-lactic acid with 100% optical purity without the need for genetic modification. The main objective of this research is to investigate the potential of producing lactic acid from lactose efficiently, aiming to use agro-industrial waste as a substrate. Parameters such as initial concentration of carbon source, dissolved oxygen concentration, cell recycling, and pH control were studied to find the best conditions for L-(+)-lactic acid production and lactose consumption as an alternative carbon source, aiming at the possibility of fermentations with whey as a substrate.

2. Materials and Methods

2.1. Media and Culture Conditions

The strain used in this study was E. durans, isolated from buffalo milk. Potential bacteria were isolated from milk samples collected between September 2017 and February 2018 from a dairy located in Brasília—Distrito Federal (Brazil). The bacteria were characterized and stored in glycerol at 30% at −80 °C until carrying out the experiments. Fermentations were carried out with lactose and glucose as sources of carbon. The E. durans strains’ inoculum procedure was conducted at 30 °C in Man–Rogosa–Sharpe (MRS) broth: the commercial MRS broth (Merck KGaA, Darmstadt, Germany) containing 10 g·L−1 of peptone, 2 g·L−1 of dipotassium phosphate, 0.5 g·L−1 of manganese sulfate, 5 g·L−1 of sodium acetate, 4 g·L−1 of yeast extract, 0.2 g·L−1 of magnesium sulfate, 8 g·L−1 of beef extract, 1 g·L−1 of Tween 80, 2 g·L−1 of ammonium citrate dibasic, and 20 g·L−1 of glucose. The MRS was modified and supplemented with glucose and lactose at different concentrations.
Cultivations were carried out in a 125 mL Erlenmeyer flask containing 50 mL of medium incubated at 30 °C in an orbital shaker at 180 rpm for 24 h (commercial MRS) or 72 h (modified MRS with 20 g·L−1 of lactose and 10 g·L−1 of glucose). The seed culture was inoculated into bioreactors for L-lactic acid production.

2.2. Cell Growth Profile in Liquid Medium

To obtain the cell growth profile, fermentation was carried out in 50 mL tubes containing 30 mL of commercial MRS medium. The cell growth was followed for 72 h in a rotating shaker at 30 °C and 180 rpm. Aliquots were taken every 4 h to measure the optical density.

2.3. Lactic Acid Production at Two Different Substrate Concentrations

To study the effects of initial substrate concentration, batch fermentations were conducted at 30 °C in a 1 L bioreactor at 180 rpm (Eppendorf, Dasgip Bioblock, Hamburg, Germany) containing 600 mL of modified MRS with a pH corrected to 7.0 with potassium phosphate buffer. Two conditions were studied: (1) 40 g·L−1 of lactose and 10 g·L−1 of glucose; (2) 20 g·L−1 of lactose and 10 g·L−1 of glucose.

2.4. Lactic Acid Production under Anaerobic Conditions

The anaerobiosis purging with N2 for the removal of dissolved oxygen was also studied. Fermentations were carried out in a 1 L bioreactor with 600 mL of buffered modified MRS medium (potassium phosphate, pH 6.0) supplemented with 10 g·L−1 of lactose and 10 g·L−1 of glucose at 30 °C and 180 rpm and 0.8 mL·min−1 of nitrogen flow rate for 48 h.

2.5. Lactic Acid Production with Cell Recycling

To evaluate cell recycling, fermentations were performed at 30 °C and 180 rpm stirring for 96 h in modified MRS medium supplemented with 20 g·L−1 of lactose and 10 g·L−1 of glucose. At the end of each batch, the broth was centrifuged at 3360× g (3400 rpm) for 15 min at 4 °C. All recycled cells were used as the seed for the next batch. The fermentation of the two batches started with 0.4 g·L−1 of biomass.

2.6. Batch with Pulse Lactic Acid Production with pH Control

In order to test the effects of pH on lactic acid production, batch fermentations with pulse were conducted at 30 °C in the 1 L bioreactor at 180 rpm of agitation for 96 h. The pH was adjusted to 5.0 with KOH (2 mol·L−1). Fermentation was carried out in a modified MRS medium containing 20 g·L−1 of lactose and 10 g·L−1 of glucose. At 48 and 72 h of fermentation, lactose was supplied with 40 mL of a 150 g·L−1 lactose stock solution to reach 10 g·L−1 in the fermentation medium.

2.7. Analytical Methods

The optical density (OD) of the E. durans strain was measured with an appropriate dilution using a UV–visible spectroscopy system at 600 nm. Biomass concentration was determined in triplicate by centrifugation of 1 mL of culture at 14,000 rpm for 10 min, decanting the supernatant, rinsing once with distilled water, and placing samples at 70 °C to a constant weight on a Petri dish. The dry cell weight was calculated by the difference between the constant weight and the mass of the Petri dish previously dried for 24 h at 105 °C. After collecting a few data points and using linear regression, we were able to obtain the constant for biomass (g·L−1) by Equation (1).
Biomass = 0.082 ⋅ OD − 0.0061
The lactic acid, glucose, and lactose concentrations were measured by a high-performance liquid chromatography (HPLC) system (Agilent, 1260 infinity, Santa Clara, CA, USA). The cultures were centrifuged at 14,000 rpm for 15 min and the supernatants were diluted to the appropriate extent with Milli-Q water. Column 300 × 7.8 mm Aminex HPX-87H column; precolumn (Bio-Rad, Hercules, CA, USA) 30 × 4.6 mm; mobile phase 0.005 mol·L−1 H2SO4; flow rate 0.6 mL·min−1; RID detector 40 °C and column temperature 45 °C.
For the identification of the lactic acid enantiomer produced, the DAD diode array detector (254 nm) and the Chirex 3126 (D)-Penicillamine column were used. The mobile phase was 0.001 mol·L−1 CuSO4 with a flow rate of 1 mL·min−1 at 30 °C.
Every experiment was carried out in triplicate, and the data are expressed as the mean with standard deviation.

2.8. Fermentation Yield

The substrate’s bioconversion into the product (gproduct·gsubstrate−1) was calculated using Equation (2) to obtain the fermentation yield. The volumetric productivity (g·L−1·h−1) was calculated according to Equation (3).
Y P S = d P d S = P f P i S f S i
r P = d P d t = P f P i t f t i
where  Y P S  represents the conversion factor,  r P  is the productivity rate, and P is the product concentration (g·L−1) given as the difference between the final ( P f ) and initial ( P i ) product concentrations.  S  is the substrate concentration (g·L−1) given as the difference between the final ( S f ) and initial ( S i ) concentrations of the substrate, and t is time (h).
Using the Monod model (Equation (4)), biomass (X) is usually measured by the dry weight of cells per unit volume, and µ (h−1) is the specific growth rate for cell mass.  X  (g·L−1·h−1) is the rate of formation of dry cell mass, and the specific growth rate for cell mass (μmax) was calculated by plotting the graph Ln X·Xo−1 as a function of time (Equation (5)). The angular coefficient of the straight line adjusted to the experimental data during the exponential phase of growth corresponds to μmax (Equation (6)).
µ X = 1 X . d X d t
X = µ X 0
X = X 0 e μ m a x ( t t 0 )

3. Results and Discussion

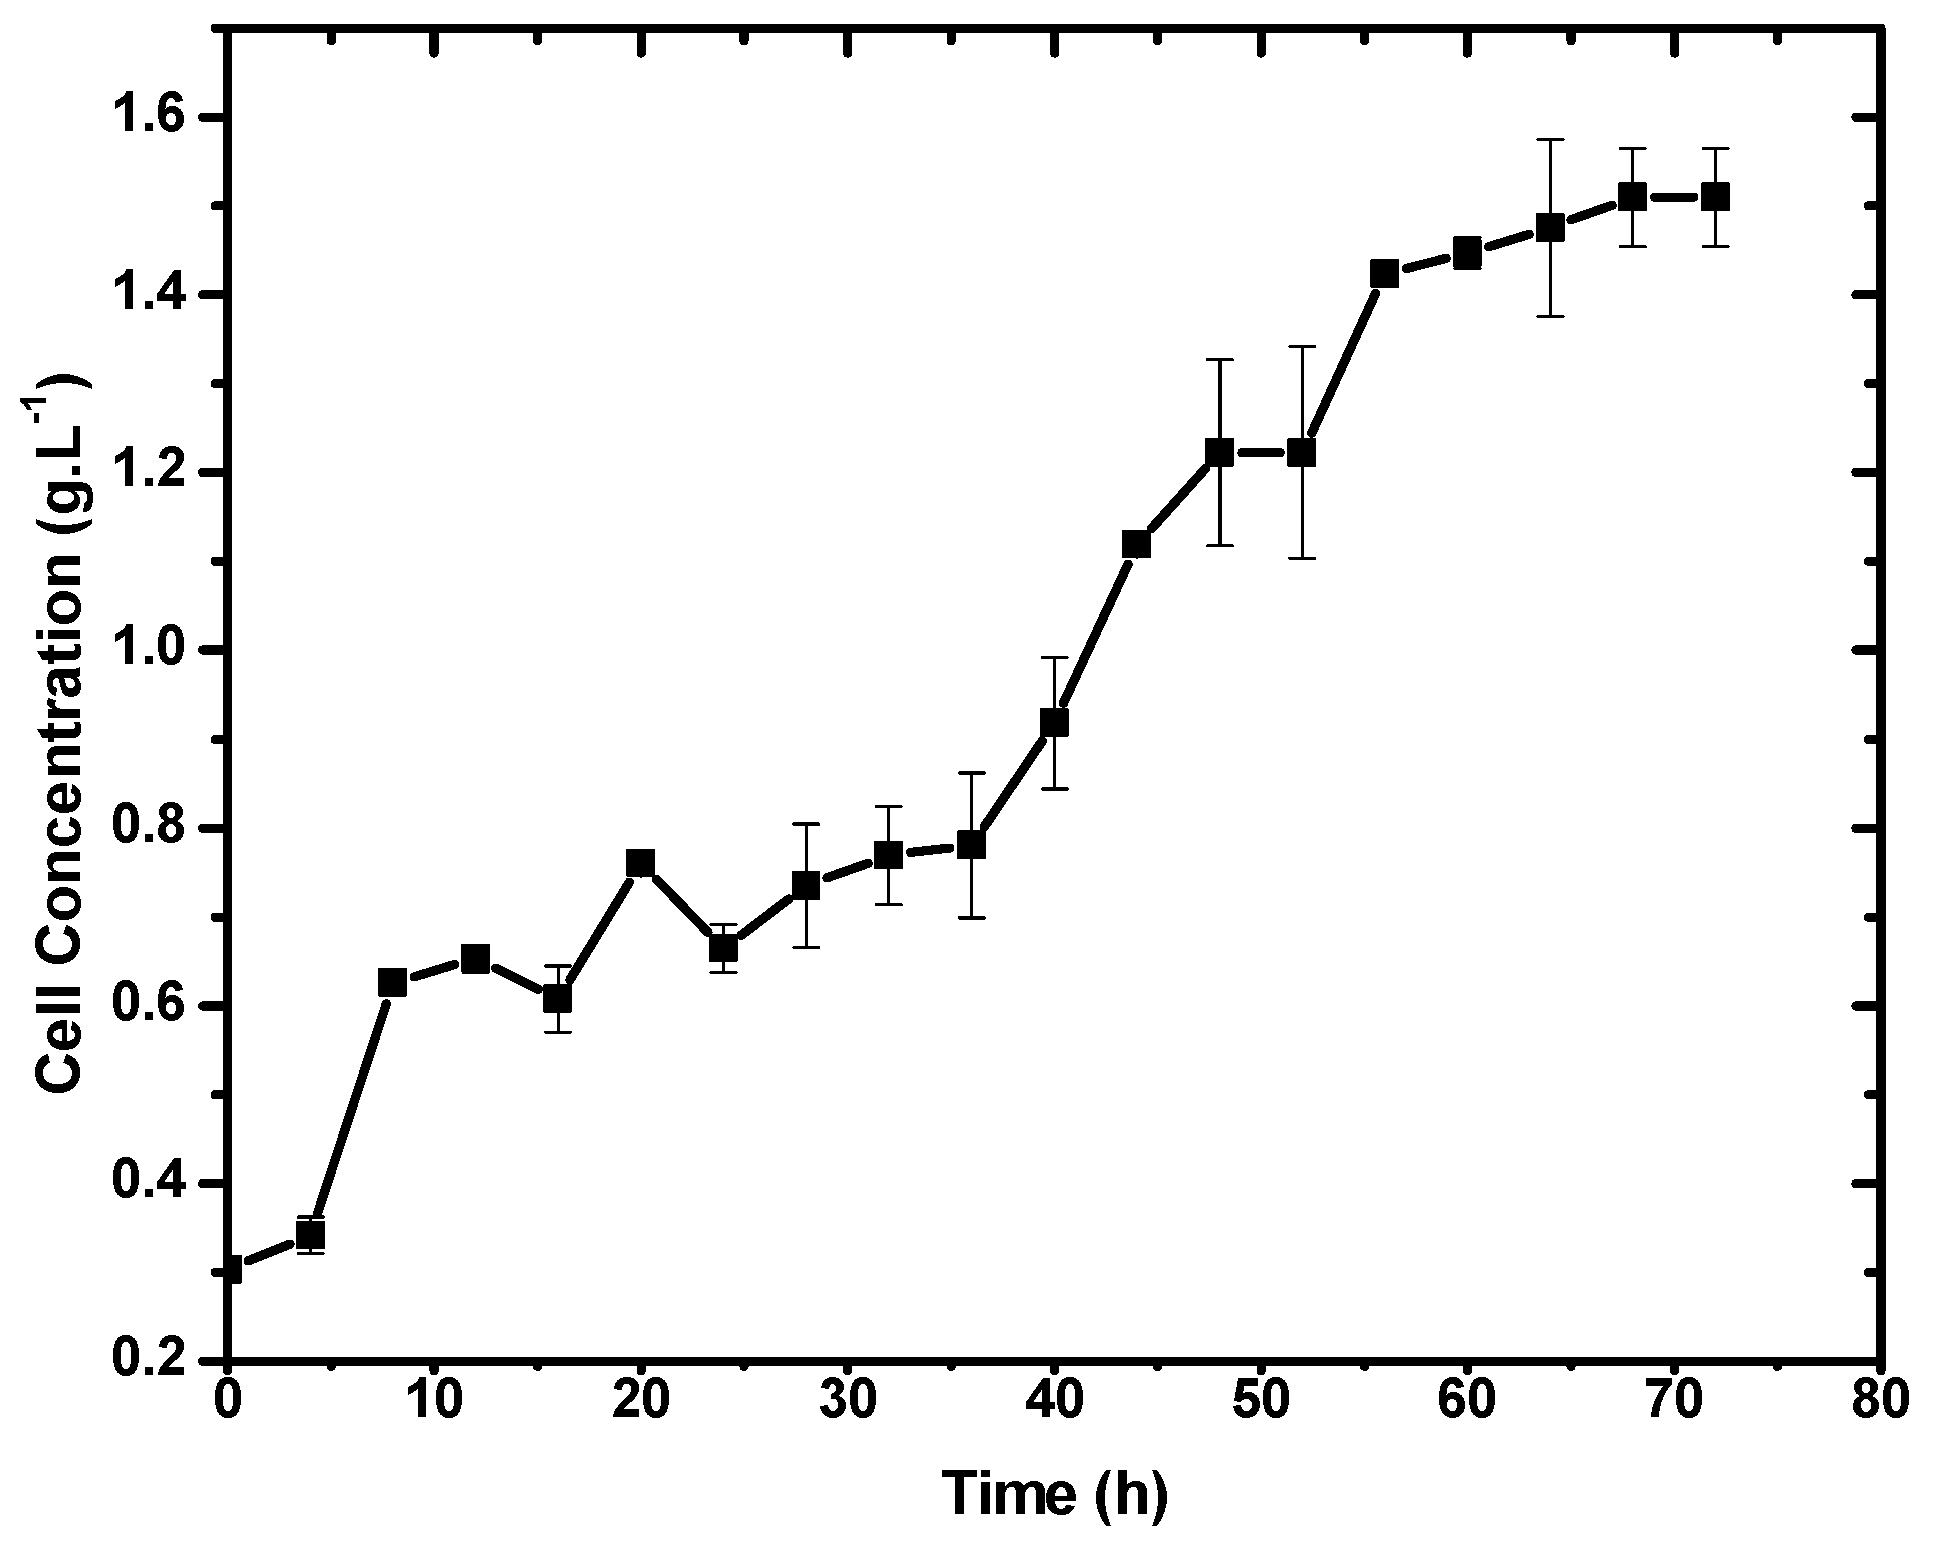
3.1. Cell Growth Profile in Liquid Medium

Figure 2 shows the cell growth curves obtained for E. durans. Based on the profile of the curves, it can be seen that E. durans has a lag phase of 4 h under the conditions tested, followed by the exponential growth phase. Cell growth is more expressive between 36 and 52 h of fermentation. The specific growth rate for cell mass was calculated between 4 and 56 h of fermentation (µ = 0.4 h−1), corresponding to the exponential phase of growth. After 60 h of fermentation, the cell concentration remained constant, indicating that it had reached the stationary phase.
In this experiment, it was verified by HPLC that the bacteria analyzed produced the enantiomer (L)-lactic acid with optical purity, a scenario that makes it possible to use it as a monomer for the production of polymers based on lactic acid [5]. It was also noticed that the only metabolite produced was lactic acid, another advantage considering the purification process. This fact was not necessarily expected, since Enterococcus durans is a homofermentative LAB and lactose is a disaccharide that could be used for hetero-lactic acid metabolism via the pentose phosphoketolase (PK) pathway. The bacteria probably produced lactic acid via the Embden–Meyerhof–Parnas (EMP) pathway in this experiment [12]. A similar conclusion was reported by Bustamante and collaborators, wherein they found that the metabolism can be considered homofermentative, as lactic acid was the major product of L. delbrueckii ssp. bulgaricus [32].

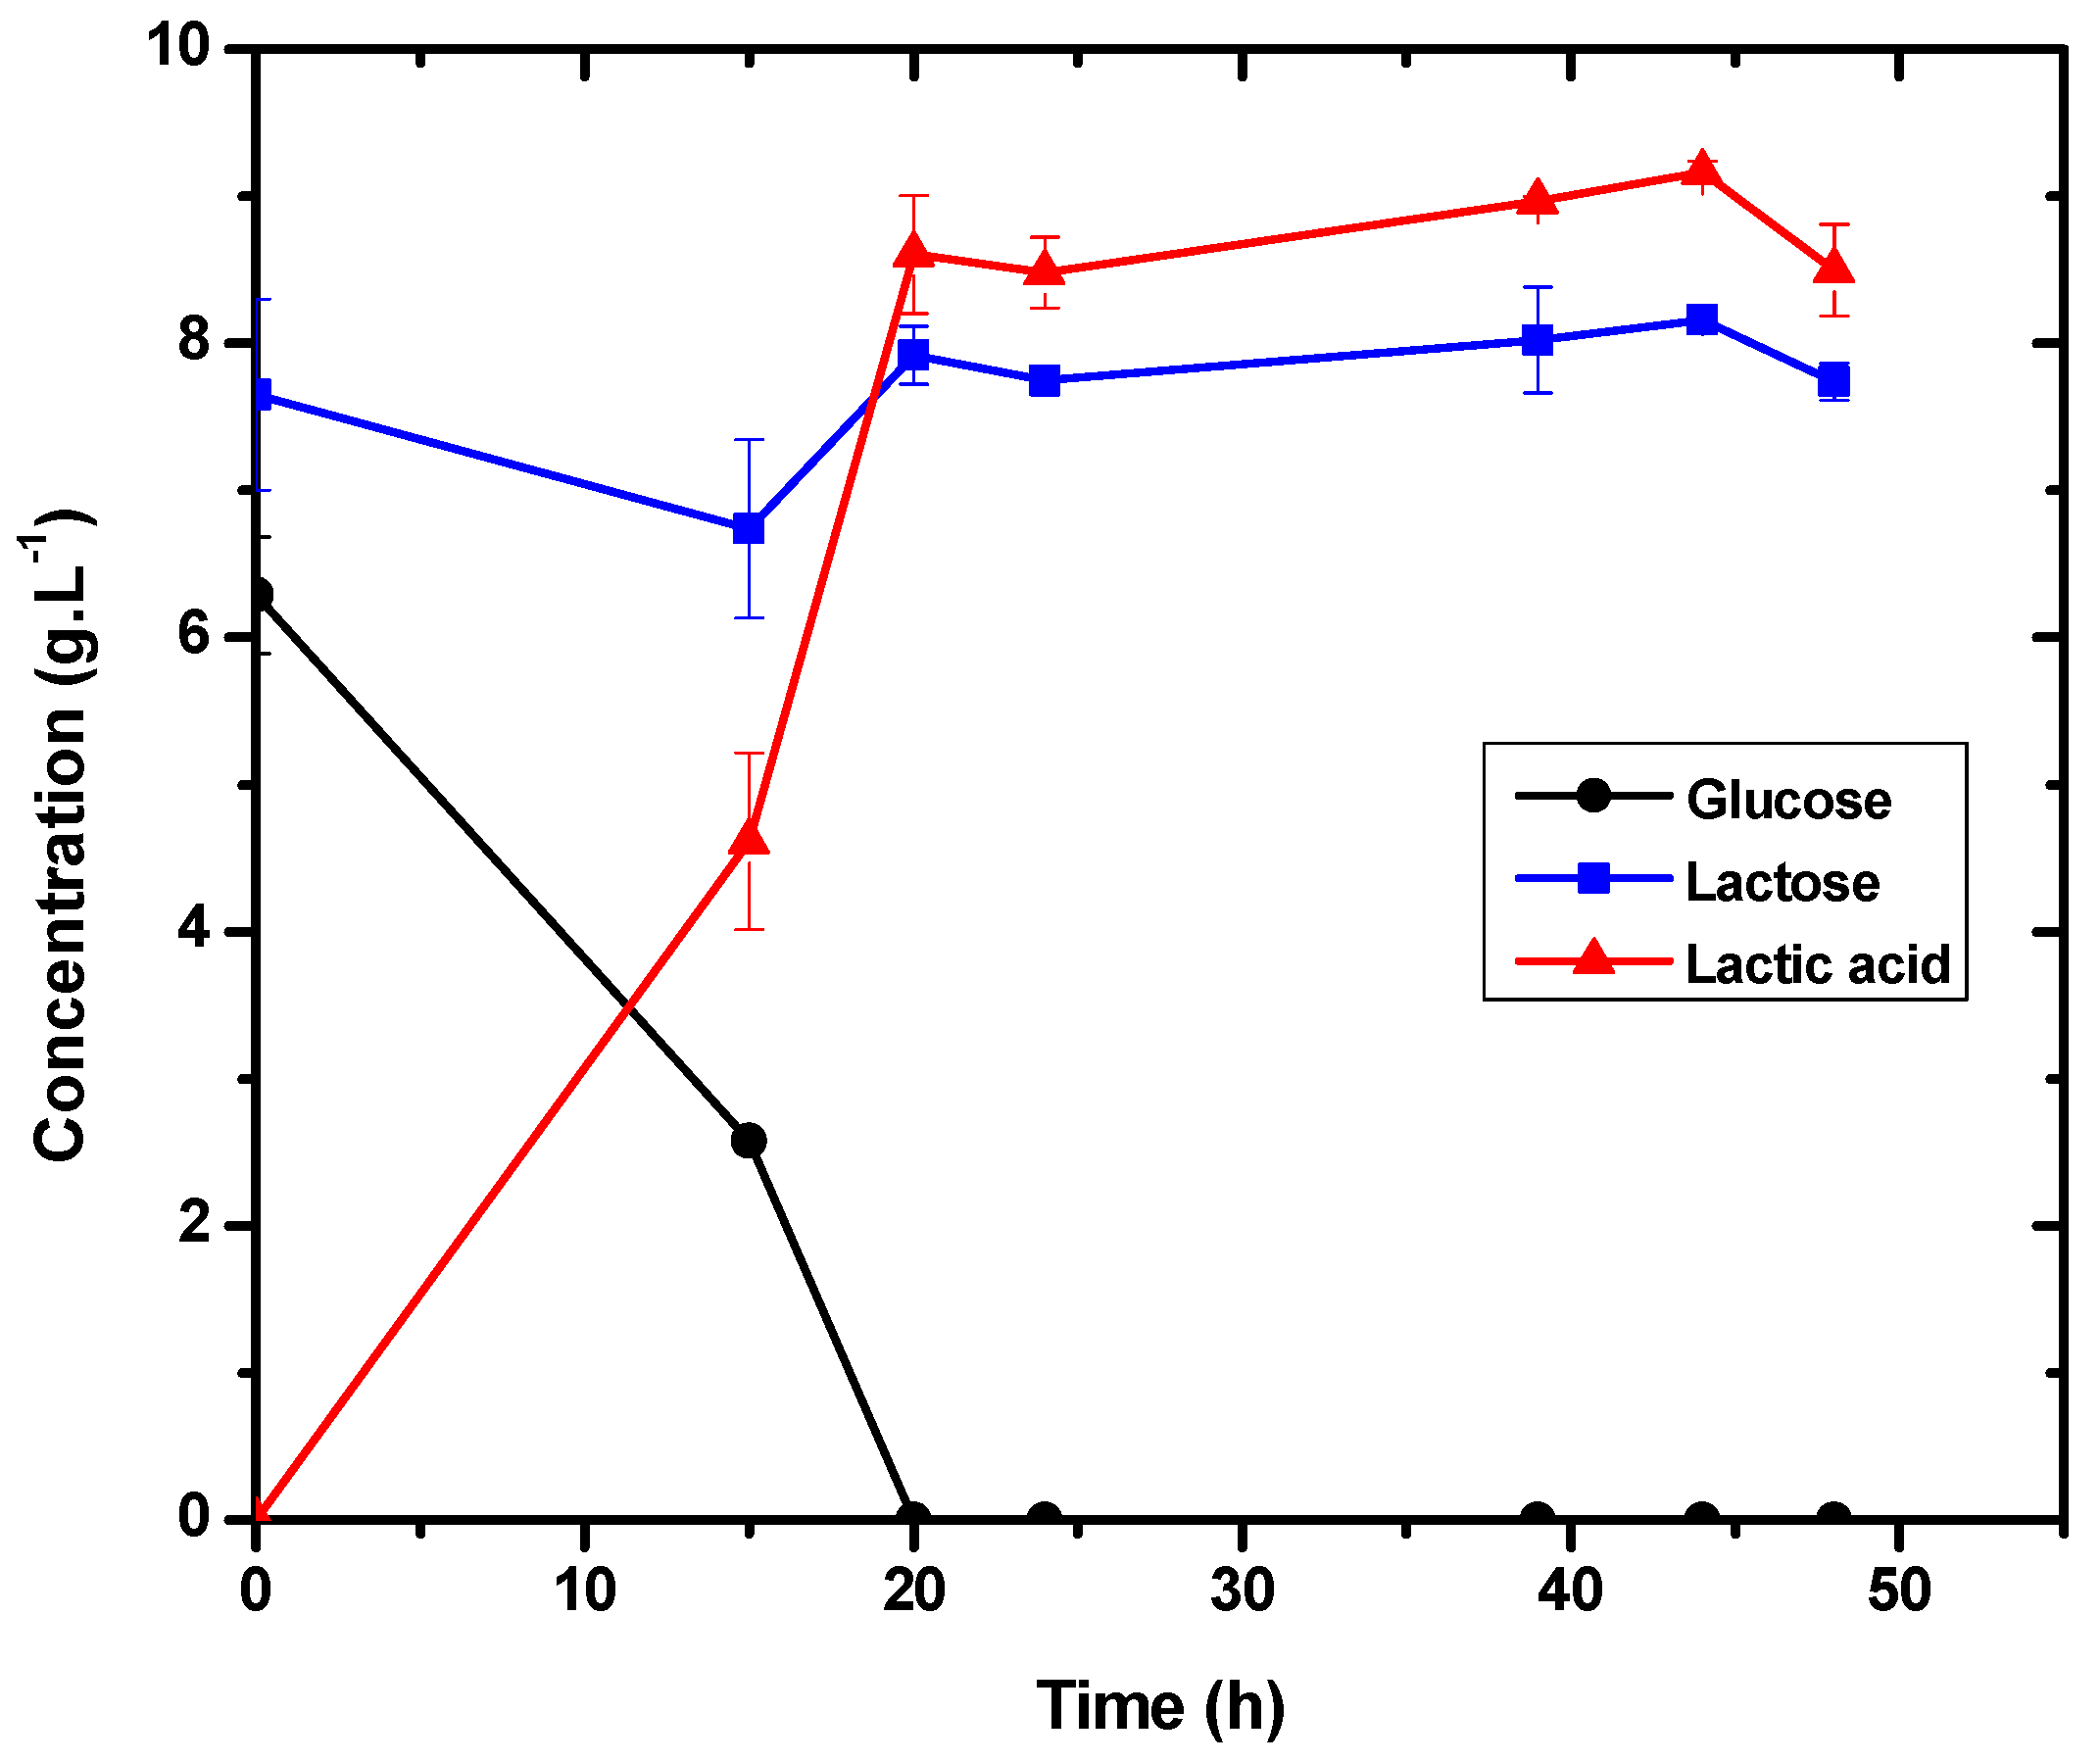
3.2. Evaluation of Lactic Acid Production at Two Different Substrate Concentrations

This experiment was carried out under two different conditions to evaluate the influence of the initial substrate concentration on lactic acid production and cell growth. The tested conditions were as follows: Condition 1—40 g·L−1 of lactose and 10 g·L−1 of glucose. Condition 2—20 g·L−1 of lactose and 10 g·L−1 of glucose.
In both conditions, glucose was practically all consumed in the first 6 h of fermentation, as shown in Figure 3. We chose to adjust the lactose concentration because, although glucose is the strain’s preferred substrate, its consumption would allow agro-industrial waste to be used as a carbon source for lactic acid production [29,30,31].
In the first 6 h of fermentation, there was a noticeable increase in the lactic acid concentration. For conditions 1 and 2, respectively, lactose consumption was 8.1 g·L−1 and 2.6 g·L−1. It can also be seen in Figure 3 that lactose consumption does not begin until glucose has been completely metabolized. The bacteria’s preference for glucose is supported by this behavior.
The pH dropped from approximately 6.0 to 5.0 in the first 24 h of fermentation in both conditions, as shown in Figure 3, proportionally to the production of lactic acid. The cell growth profile was also proportional to the amount of lactic acid produced and was more expressive, particularly during the first 48 h of fermentation. Just like the results presented in Figure 3, in the study carried out by Boonmee et al., the production of lactic acid was associated with cell growth using Lactococcus lactis and lactose concentrations of 20 and 40 g·L−1. However, the opposite was observed when this same research group used lactose concentrations of 60 to 100 g·L −1. According to the authors, at these concentrations there was a period of “associated non-growth” [33]. Therefore, we can also associate cell growth with lactic acid production in this experiment since the initial lactose concentrations were similar to those reported by Boonmee et al.
For Condition 1, average productivity was 0.6 g·L−1·h−1 and yield was 0.61 g·g−1, producing 10.11 g·L−1 of lactic acid at the end of fermentation. In Condition 2, 10.87 g·L−1 of lactic acid was produced, with a yield of 0.94 g·g−1 (greater than for Condition 1) and an average productivity of 0.54 g·L−1·h−1.
The specific growth rate for cell mass was 0.25 h−1 for Condition 1 and 0.24 h−1 for Condition 2. This suggests that glucose consumption influenced lactic acid production and cell biomass. Condition 2 produced higher yields due to lower lactose consumption, which was intended. Therefore, the lactose consumed in the first fermentation was converted to cell growth rather than lactic acid. Jangra et al. investigated the effect of carbon sources on µ with L. plantarum and found that experiments with glucose had higher specific growth rate values than with lactose. They found µ values of 0.42 for glucose and 0.23 for lactose. The results with glucose were similar to those achieved in the studies described in this article [34].
At the end of fermentation, approximately 20% of the initial lactose was consumed in Condition 1 and 10% in Condition 2. Lactose consumption was not as expected, since the objective was to maximize the conversion of lactose to lactic acid. However, higher yields were obtained with lower initial concentrations of lactose and glucose in this experiment. Cock and Stouvenel [15] observed similar behavior with L. lactis. In this case, the L. lactis strain produced the highest lactic acid concentration (13.7 g·L−1) and converted the most glucose at lower glucose concentrations (20 g·L−1) with a productivity of 0.29 g·L−1·h−1. The cell growth was also related to product generation, and the same profile was observed in our experiment. Although, when glucose and lactose were combined, productivity increased. Experiments combining lactose and glucose demonstrated better productivity than preliminary tests using only lactose as a carbon source. This demonstrates the importance of combining carbon sources for lactose consumption.

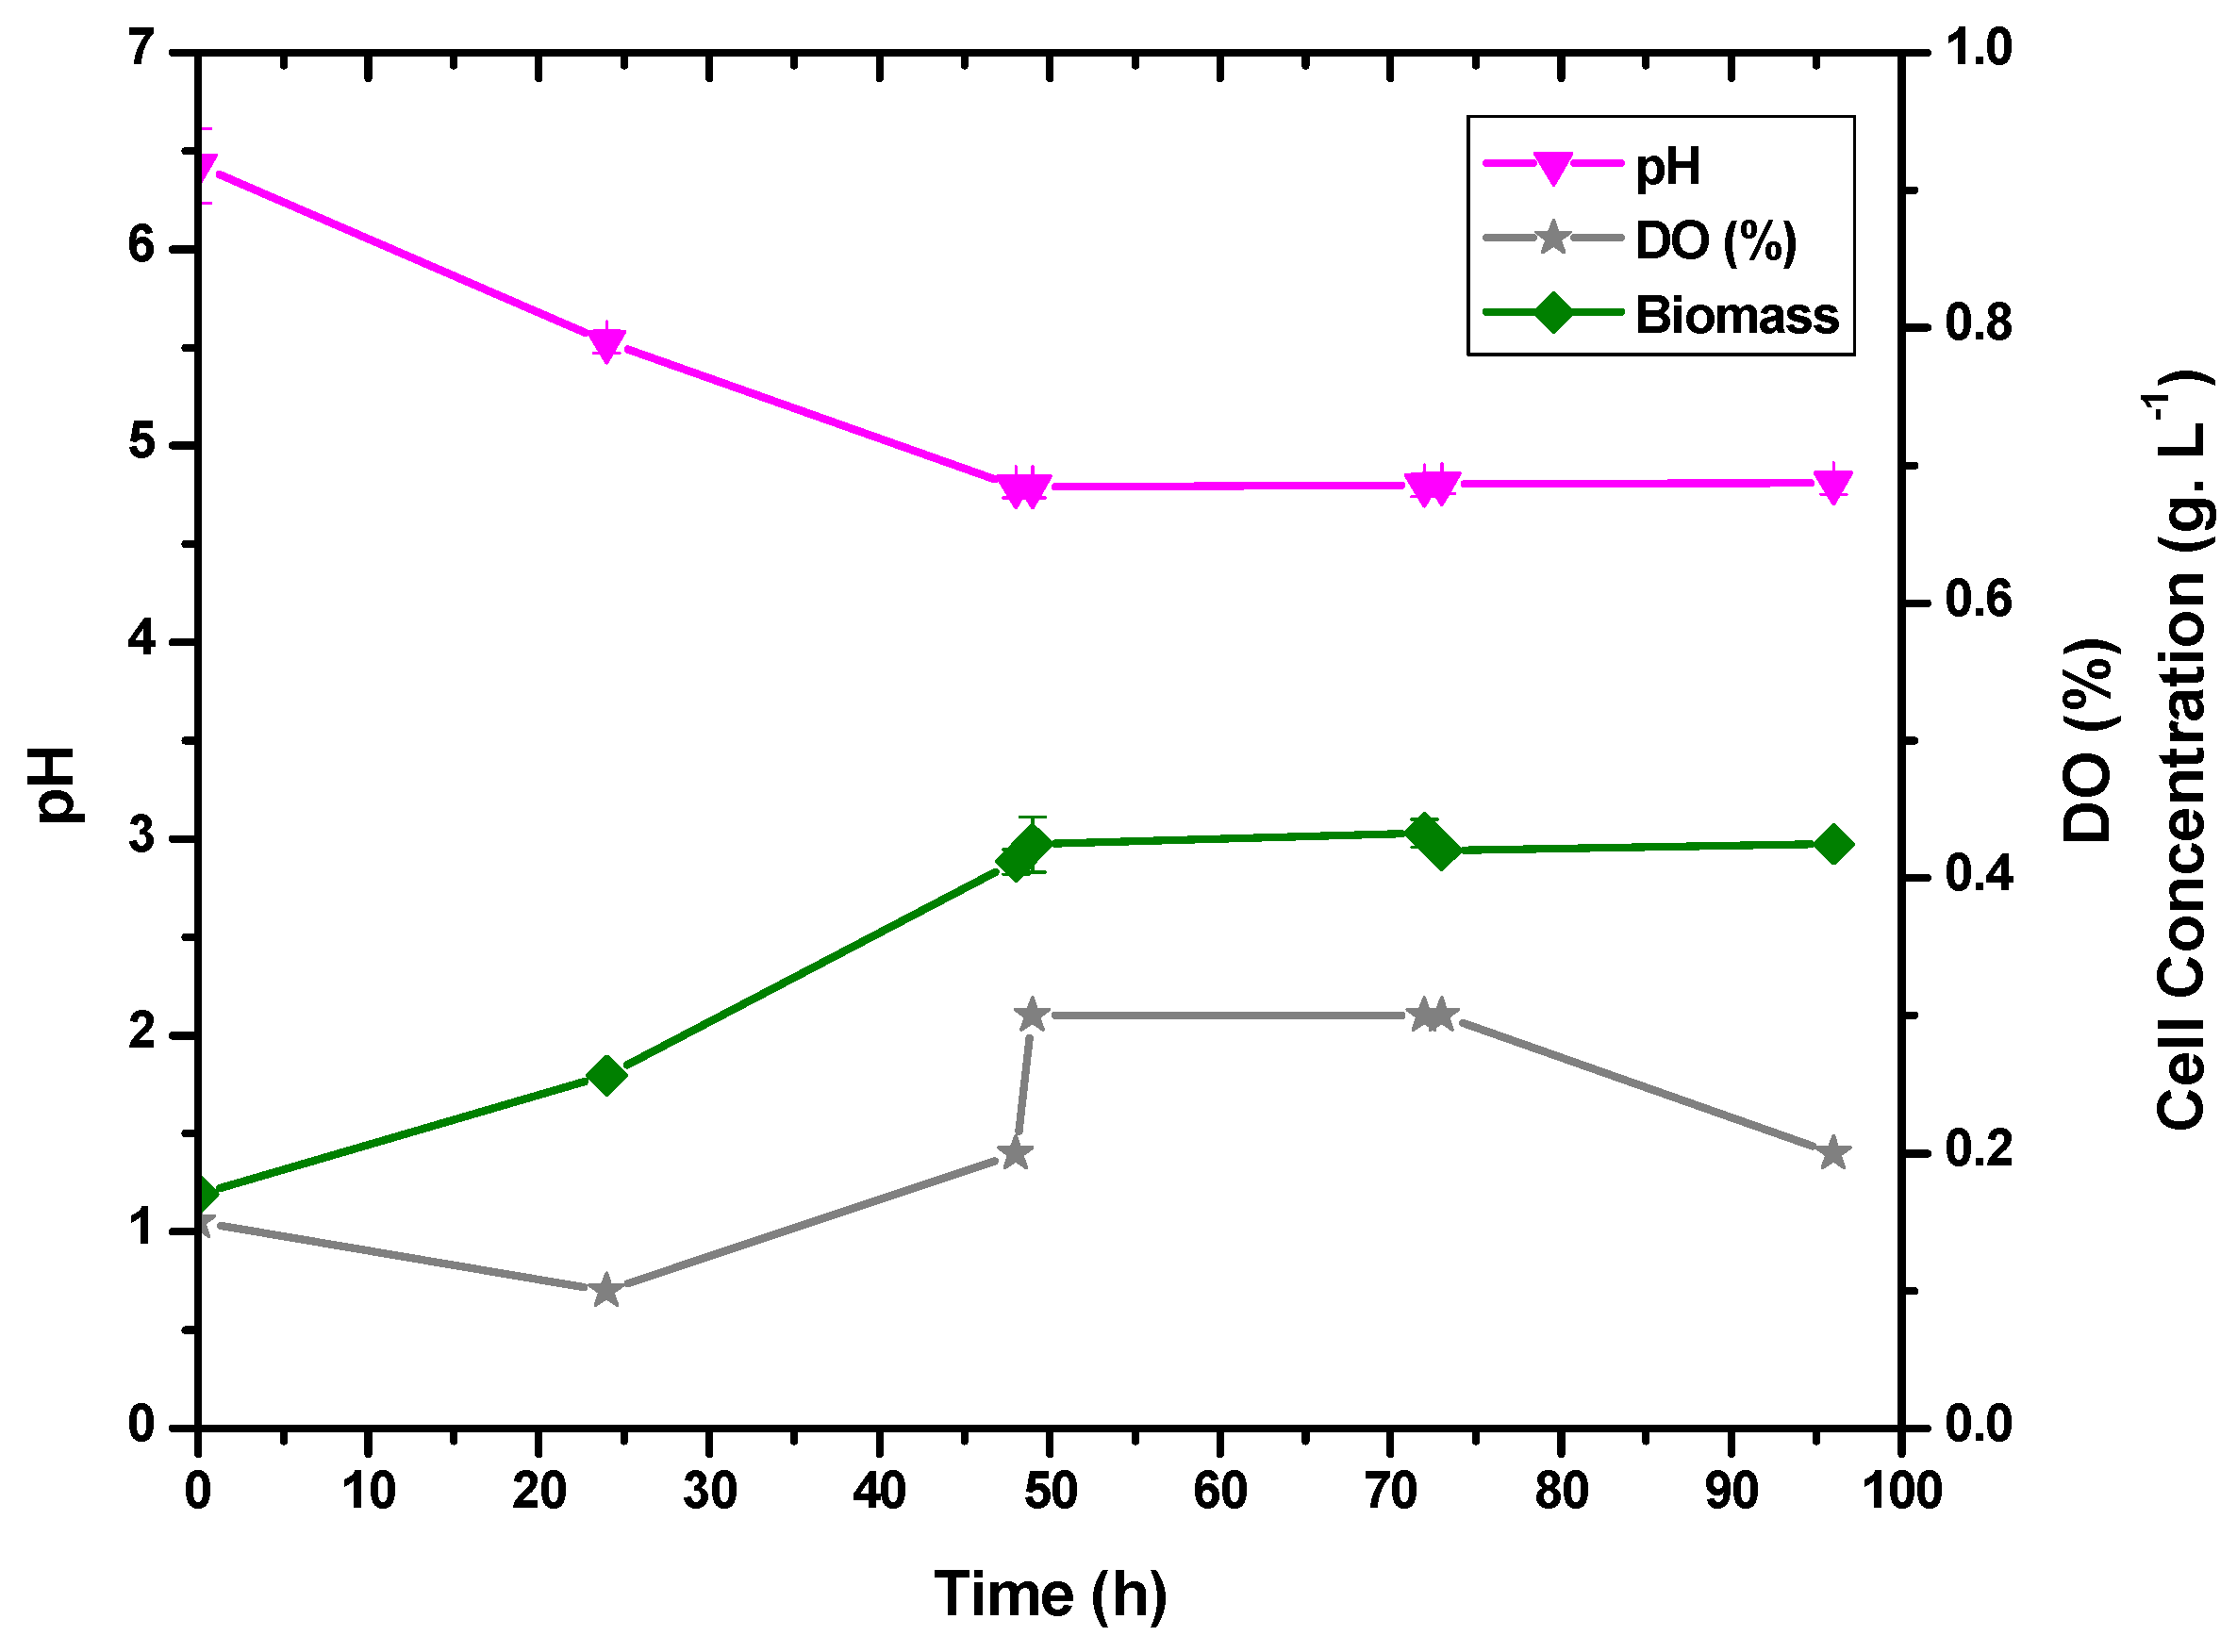
3.3. Evaluation of the Anaerobic Condition for Lactic Acid Production

Experiments were carried out to verify the influence of dissolved oxygen in the medium on the production of lactic acid. N2 was injected into the medium to decrease the oxygen concentration, and Figure 4 displays the outcomes. Consumption of glucose was not favored by the anaerobic environment since it took 14 h longer to exhaust itself without dissolved oxygen. It was found that dissolved oxygen encourages the consumption of the carbon source, cell expansion, and the generation of lactic acid. The same behavior pattern was noted by Zotta et al. [35], where the greatest biomass production by L. casei was in cultures with more dissolved oxygen.
In 50 h of fermentation, the cell concentration increased from 0.17 g·L−1 to 0.41 g·L−1, as shown in Figure 4. Since the agitation rate affects dissolved oxygen levels, gaseous nitrogen was injected throughout the process, and the amount of dissolved oxygen (%DO) was less than 0.3% throughout the whole fermentation. After 50 h of fermentation, the pH of the fermentation medium decreased from 6.43 to 4.80 and stabilized for the next 48 h. Based on the results obtained, it can be said that lactic acid production (Figure 5) is correlated with pH acidification and cell expansion (Figure 4). Furthermore, during the first 20 h of fermentation, lactic acid production caused a drop in pH and an increase in DO.
The specific growth rate for cell mass was 0.11 h−1. As a result of the low dissolved oxygen concentration, a minor cell growth rate was predicted. The specific growth rate for cell mass was 0.25 h−1 for the experiment without nitrogen addition. With some microorganisms, the anaerobic condition increases the µ, but this was not observed with E. durans. According to Jangra et al., providing a microaerophilic atmosphere with nitrogen improved the growth rate of strain L. delbrueckii ssp., reaching 0.4 h−1 [34]. There was also a direct correlation between cell growth, lactic acid production, and glucose consumption.
The productivity for this experiment was 0.21 g·L−1·h−1, and the yield was 0.69, producing 9.17 g·L−1 (Figure 5). Such values were a bit lower than those achieved in the experiment without the addition of nitrogen, demonstrating that the bacteria’s performance was affected by the low concentration of dissolved oxygen.
Some studies have already been carried out with the aim of investigating the aerobic metabolism of lactic acid bacteria. In one study, Zotta et al. [36] found that aerobic circumstances can boost the production of metabolites. In another study, Ge et al. [37] used recombinant L. casei strains in their research to maximize the production of lactic acid by varying the amount of oxygen supplied during fermentation. The authors also suggest that this strategy may increase the production of organic acids from other strains by regulating the metabolic flow with the oxygen supply.

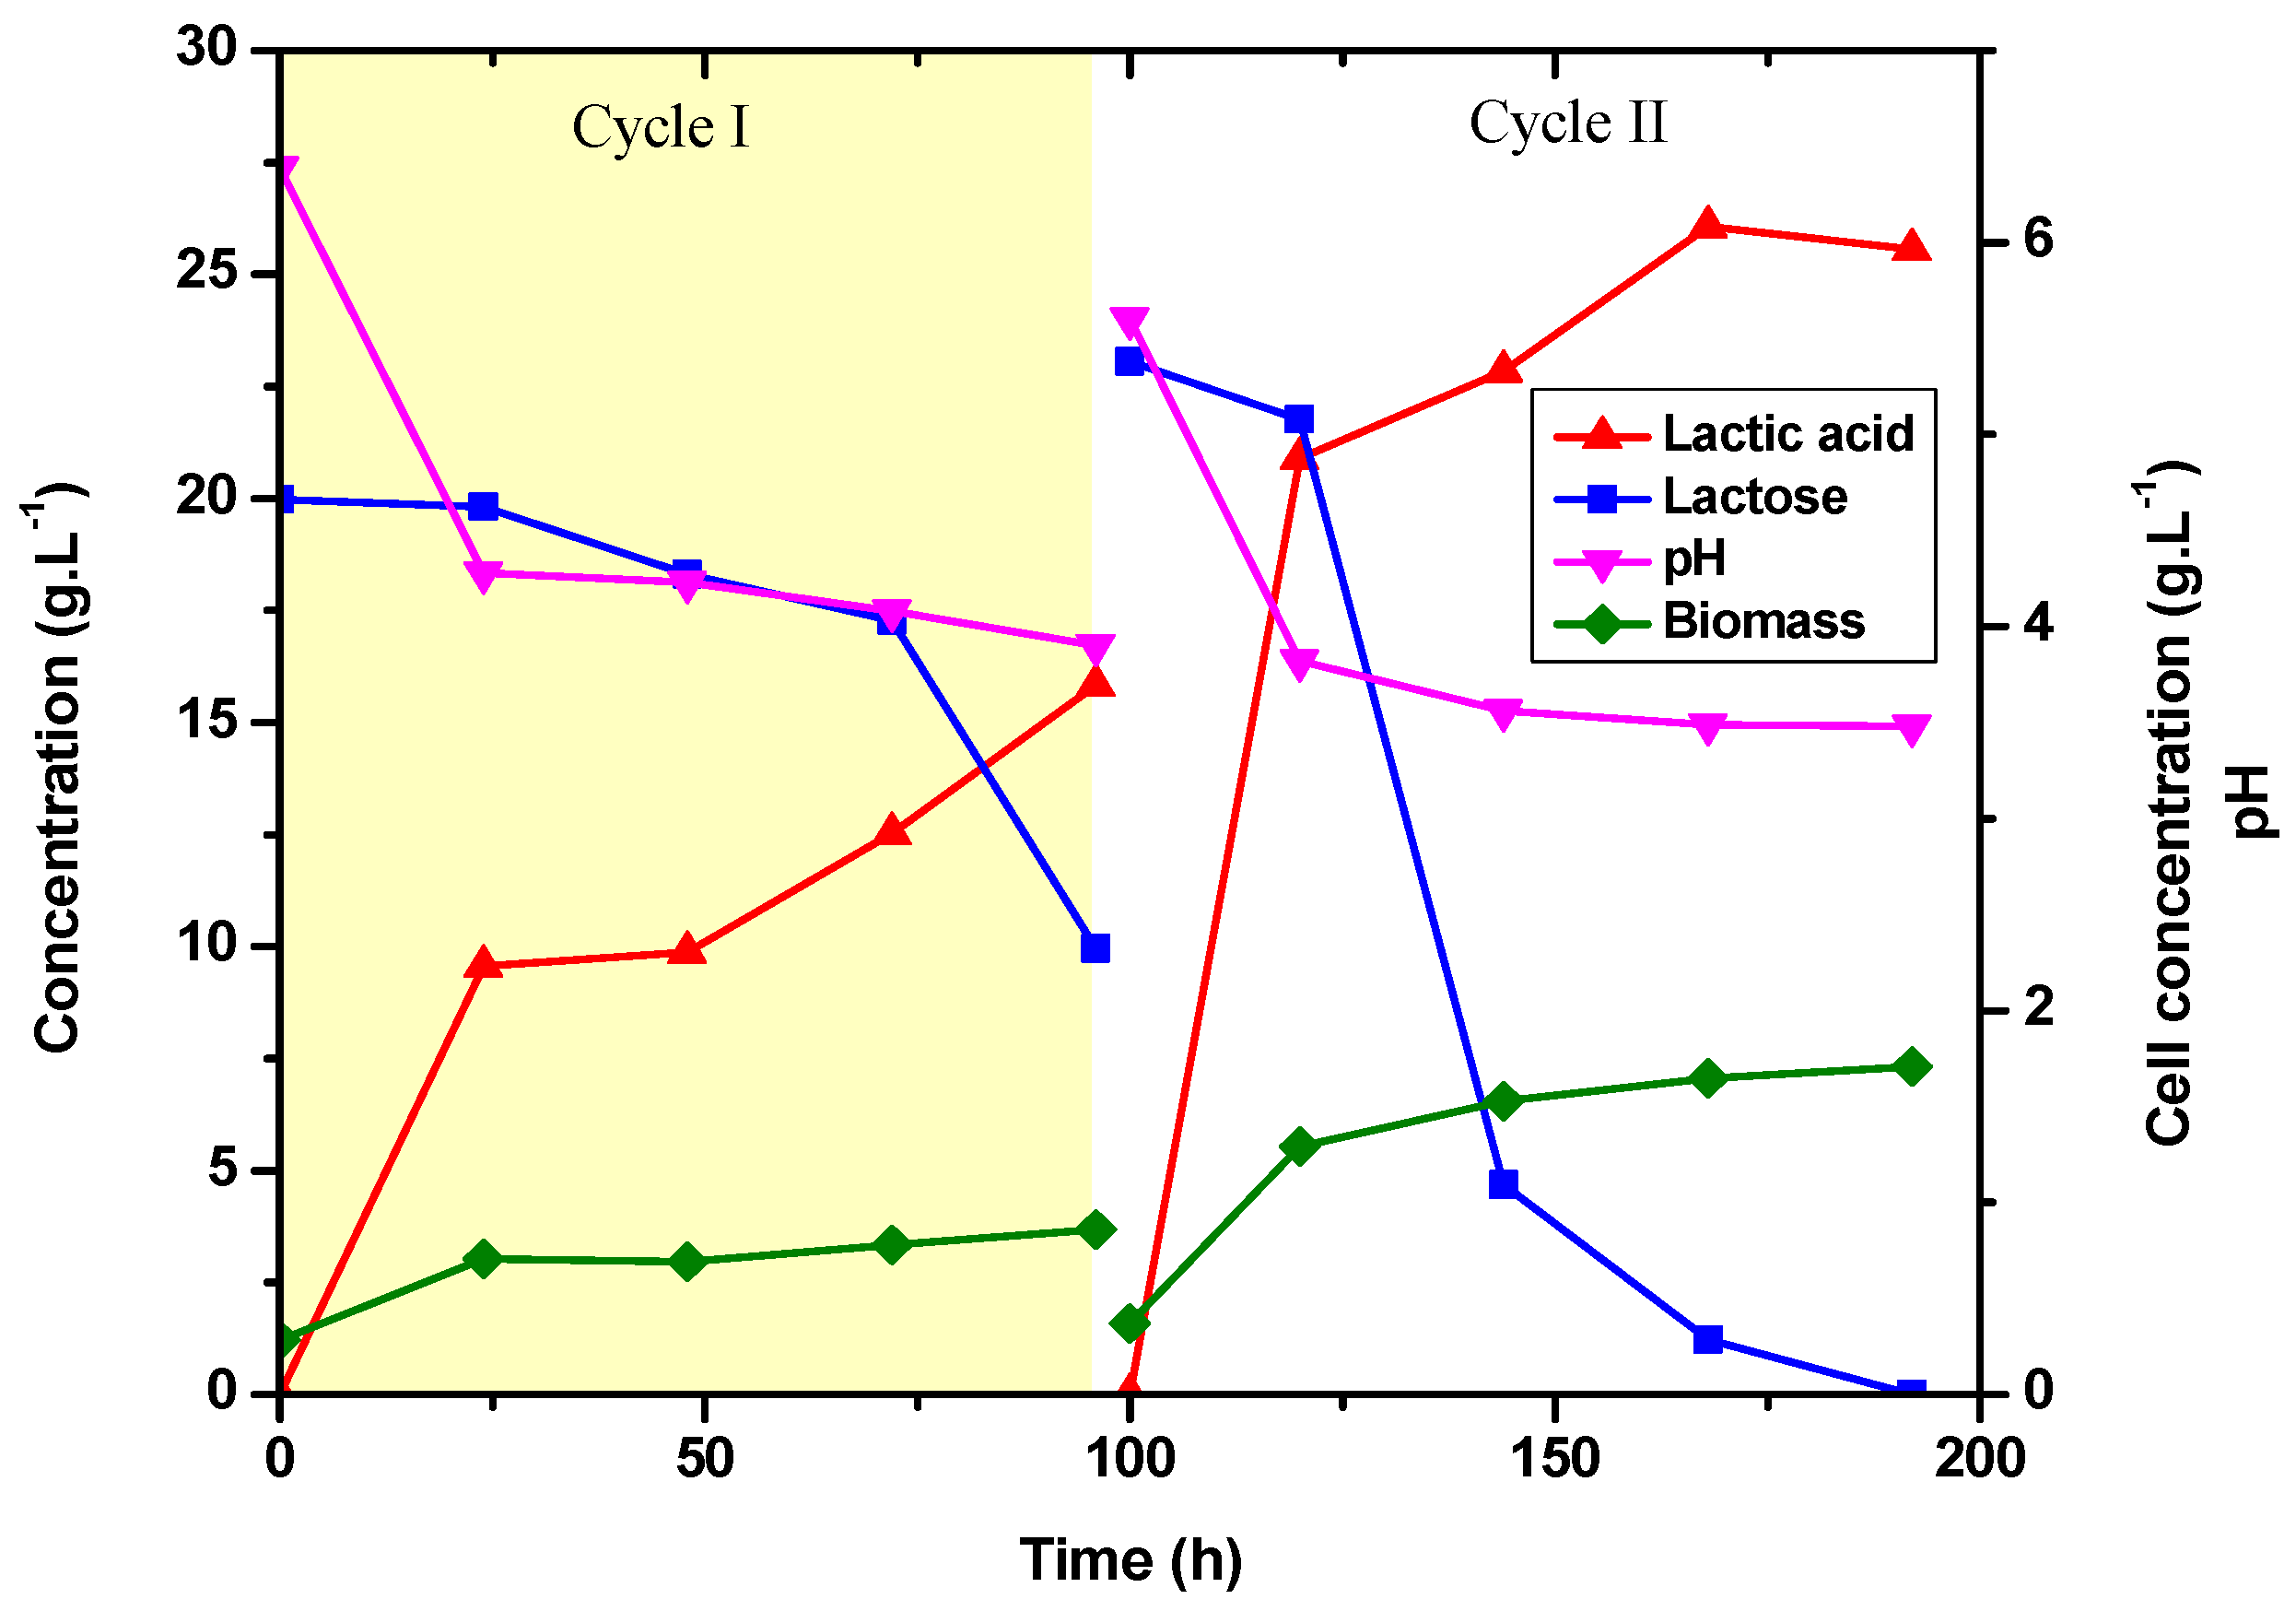
3.4. Evaluation of Cell Recycling for Lactic Acid Production with E. durans

In order to evaluate the performance of adapted cells, a batch was performed using cell recycling. In this experiment, it was noticed that experiments with adapted cells produced more lactic acid in successive batch cycles. The remaining cells from the first fermentation (cycle I) were used as inoculum for the second batch (cycle II) in this experiment. Fermentations were carried out with 10 g·L−1 of glucose and 20 g·L−1 of lactose, with a cell concentration of 0.28 g·L−1 for the first fermentation and 0.37 g·L−1 for the second. The bacteria cells grown in the first fermentation were used as the inoculum for the second fermentation, which was carried out in a medium containing 20 g·L−1 of lactose as the sole carbon source.
According to the results presented in Figure 6, the glucose has already been completely consumed in the first 24 h of fermentation. The cell concentration increased throughout the fermentation, and the bacteria were not inhibited by the produced lactic acid even at the end of the fermentation, with a pH of 3.5. There was a higher rate of lactose consumption after 72 h of fermentation. In the first batch, productivity was 0.17 g·L−1·h−1 and yielding 0.87 g·g−1. Figure 6 depicts the outcomes of the batches.
Figure 6 represents cycles I (yellow area) and II (white area) and shows the correlation between lactic acid production and cell growth. It is possible to confirm that lactic acid production increases proportionally with the number of cells in the fermentation medium, confirming the trend observed in previous experiments. For the first cycle, glucose was added to the medium to promote cell growth and lactose to initiate cell adaptation. After adaptation in the first cycle, only lactose was employed as a carbon source for the second cycle, and it was observed that cell growth was improved. Lactose consumption proceeded as expected in this experiment, particularly in the second cycle, maximizing the conversion of lactose to lactic acid while depleting the carbon source. The second cycle resulted in a higher inoculum density because the more resistant cells from the previous cycle continued the process. Once lactose assimilation has been achieved, it is expected that whey will be a promising alternative carbon source with E. durans for lactic acid production in the future. Joulak and collaborators already showed that Halomonas strains produced exopolysaccharides using agro-industrial wastes (cheese whey) as the sole carbon source [38].
Alfano et al. [39] demonstrated the potential of buffalo whey as a reusable effluent rich in lactose. They tested buffalo milk-derived whey as a substrate for fermentations with a L. fermentum strain. A dried powder was obtained from the residue, containing 44% lactose (w/v), which was then applied as a carbon source. After fermentation with the dried powder, 16.4 g/L of sugar provided 10 g/L of lactic acid.
The specific growth rate for cell mass was 0.12 h−1 for the first cycle and 0.93 h−1 for the second one. The use of adapted cells resulted in increased lactic acid production and a higher µ (specific growth rate). Although the µ value of the second cycle was lower than the value found in the literature of a study carried out with Lactococcus lactis NZ133 with lactose (1.10 h −1) [33], the significant increase between cycles highlights the bacteria’s potential. All lactic acid production and cell growth in the second cycle were dependent on lactose consumption due to the absence of glucose supplementation.
We noticed that the adapted microorganism favored lactose consumption as compared to the initial batch. In the second fermentation, 48 h were needed for 80% of the lactose to be metabolized. Only 8.4% of the lactose in the first batch was metabolized in 48 h. The carbon source ran out after 96 h of recycling. The second cycle had a yield of 82% and a productivity of 0.36 g·L−1·h−1. The amount of lactic acid produced with cell recycling was 26.07 g·L−1. This indicates that production increased by 10 g·L−1 in fermentations under the same circumstances, employing adapted cells and without glucose. It is important to emphasize that the second cycle began with the same cellular concentration as the first. However, because it started with adapted cells, it is observed that there is more significant cell growth and lactose consumption in the second cycle.
Thus, the study showed that cells that had already become adapted to the carbon source produced more lactic acid when they were recycled. This behavior had already been noticed in fermentations using modified E. coli. In the study carried out by Aso et al. [40], the bacteria were able to produce 0.6 g·L−1 of lactic acid in a single batch and 5 g·L−1 with cell recycling.

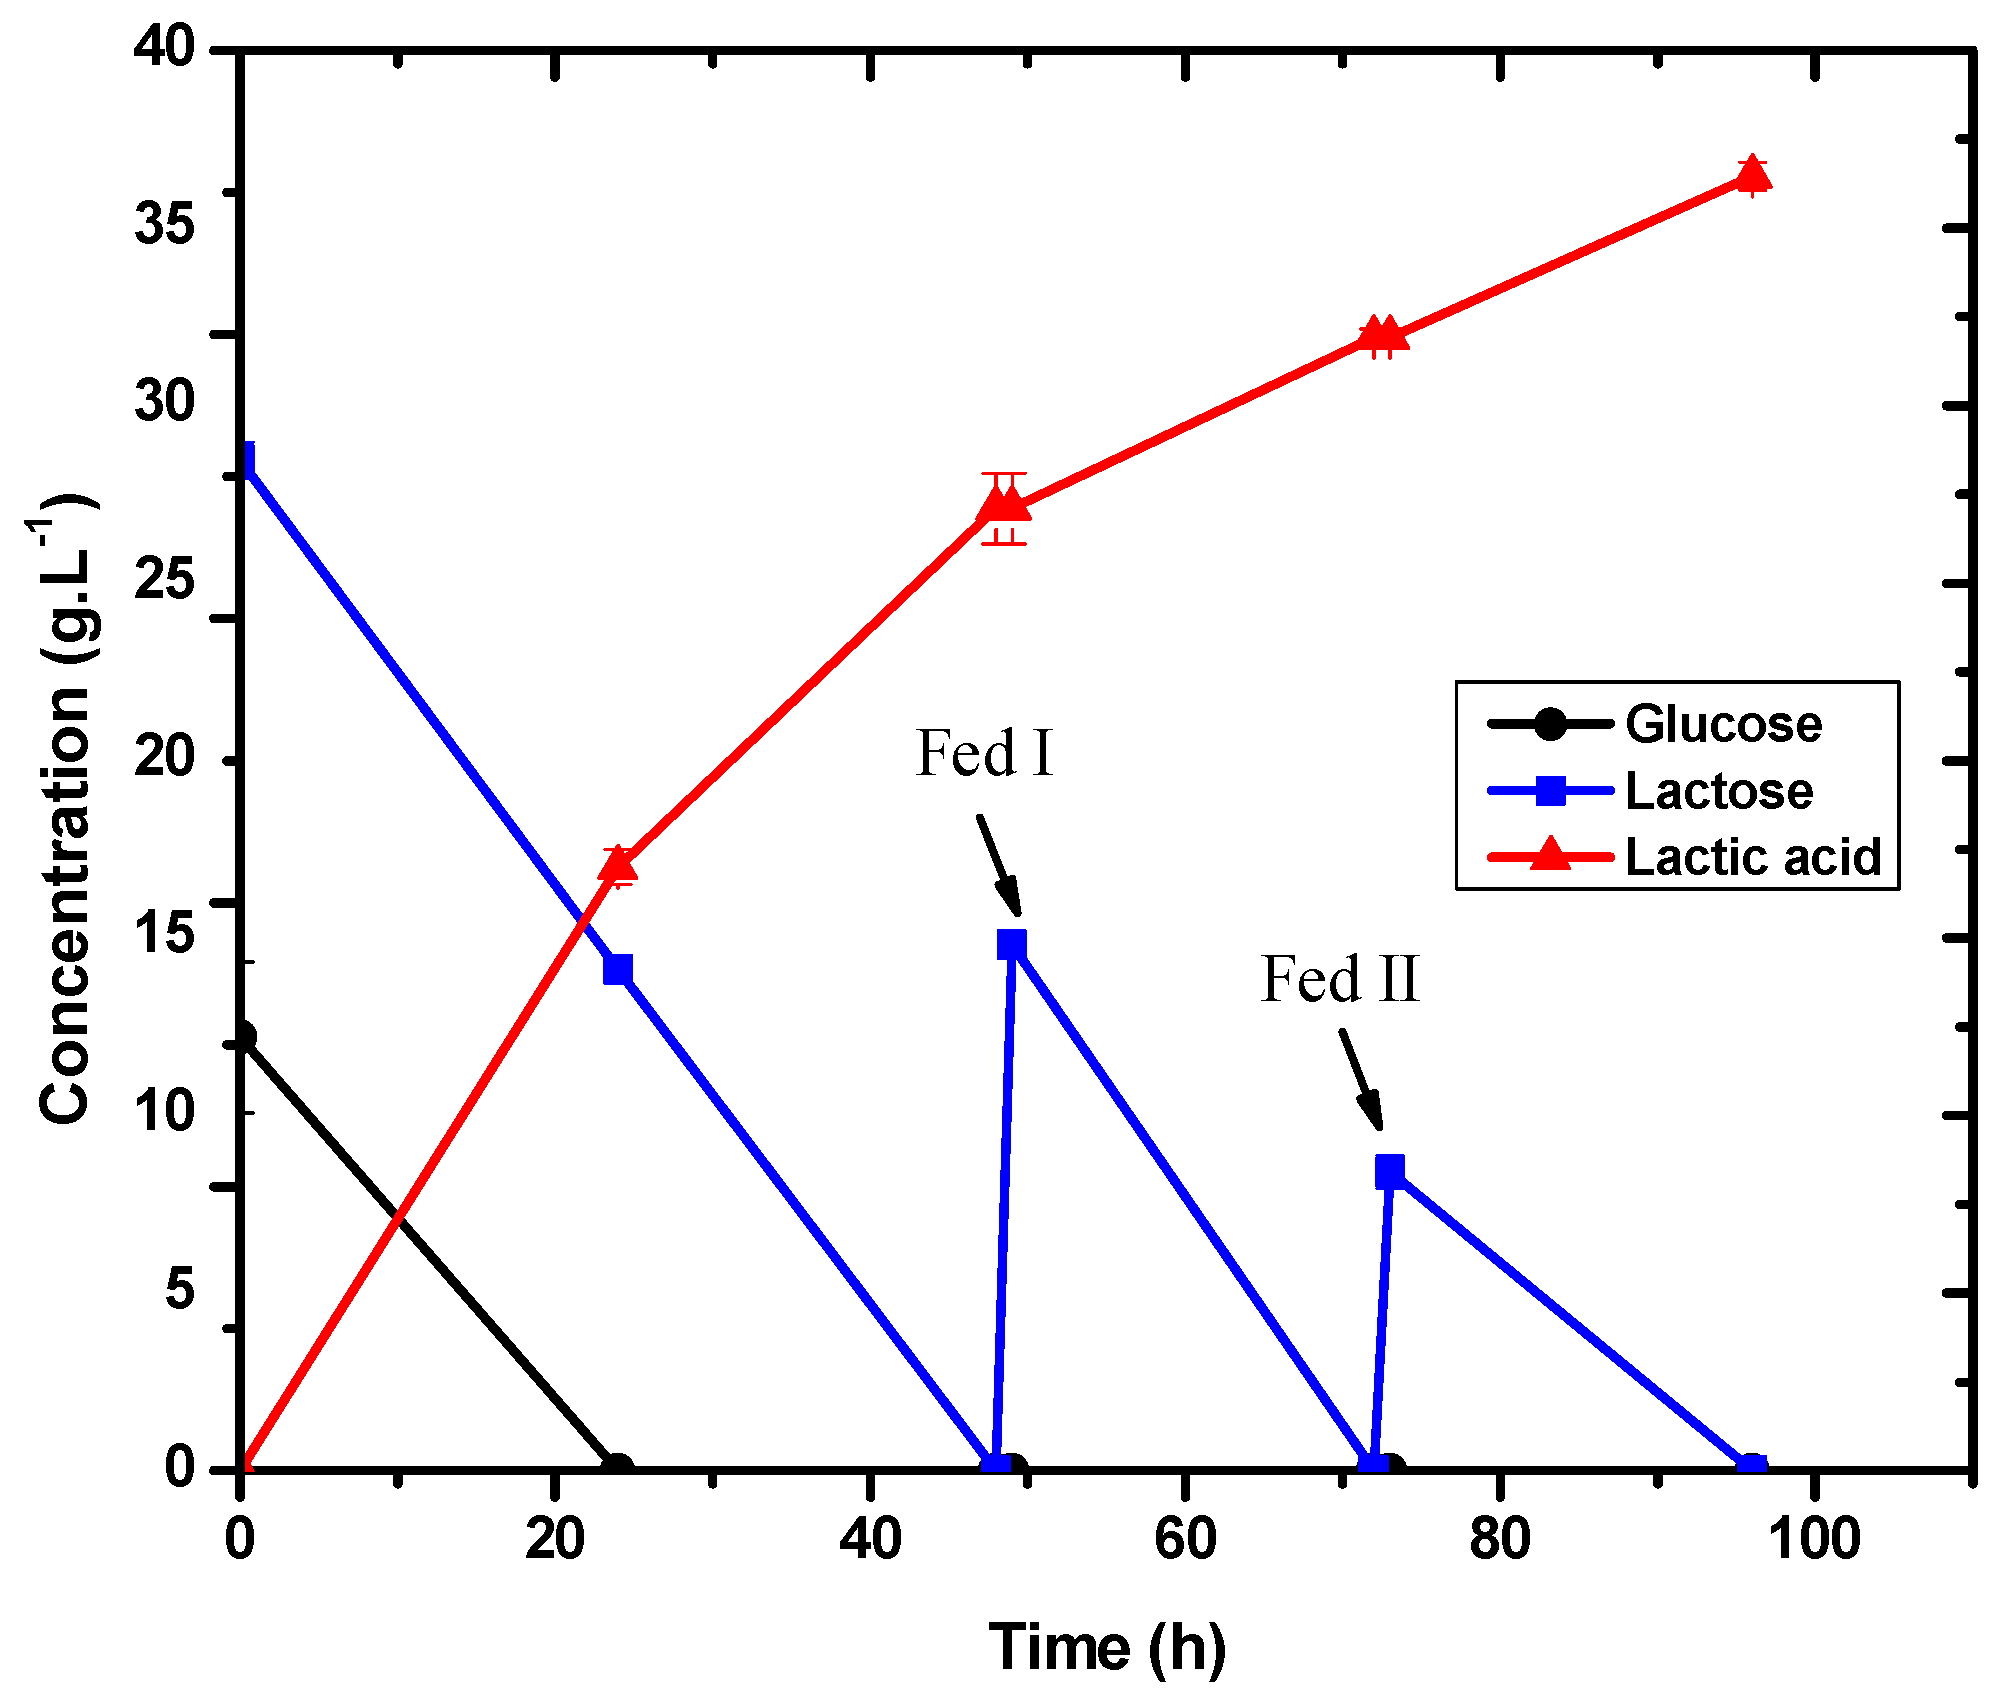
3.5. Evaluation of Batch with Pulse Lactic Acid Production with E. durans

Several studies have employed pH control as a tool to enhance the lactic acid generation in LAB-based fermentations. For E. durans in this experiment, the pH control at 5.0 improved cell growth. After 24 h of fermentation, the bacteria began to metabolize the lactose, and the glucose was totally consumed.
The lactose had already been used up after 48 and 72 h. Accordingly, it was observed that the bacterium was driven to consume more lactose at a regulated pH of 5.0 in the absence of glucose. The results are shown in Figure 7 and Figure 8.
E. durans was able to exhaust the carbon source in less time due to pH control. The yield was about 0.57 g·g−1 and the average productivity was 0.38 g·L−1·h−1, which was higher than in the experiments where the pH was not controlled. According to Cock and Stouvenel [15], adding basic solutions (2 mol·L−1 KOH) to keep the pH within the best operating range led to higher lactic acid concentrations than those obtained without this control. A similar result was obtained in this experiment, demonstrating that pH adjustment improved lactic acid production and substrate consumption.
In this experiment, the biomass production was similar to the experiment without pH control, indicating that the same cell concentration was able to produce more lactic acid with a pH of 5.
As a result of the longer gap between feedings, the bath fermentation achieved higher yields and productivity than the trial with pH control. However, adjusting the pH allowed higher levels of lactic acid to be reached in a shorter period of time.
When compared to the experiment with adapted cells, it was noticed that pH control was able to increase productivity. Nonetheless, this result demonstrates that cell recycling performed better overall in terms of lactose consumption and yields.
Hassan et al. [22] reported the highest lactic acid production from E. durans fermentation using banana peels as substrate, reaching 28.8 g·L−1. With a simpler fermentation medium and lactose and glucose as carbon sources, we were able to achieve 36.47 g·L−1 of lactic acid. As a result, the purification and recovery of lactic acid are facilitated.
Although pH control improved lactose consumption, cell recycling promoted higher yields and productivity, as shown in Table 2. At 24 h, there was no lactose supplementation, which we can consider a batch fermentation. It is important to note that the bacteria produce approximately 8.5 g·L−1 more lactic acid during a 24 h fermentation period with pH control than they do over the same period without control, as in the experiment mentioned at item 2.2.
Fed-batch operation is a technique frequently used to improve the output of fermentations, and this was observed in this experiment. The same effect was reported in the literature. Liu et al. [41] produced 70.70 g·L−1 of lactic acid in batch fermentation by L. bulgaricus CGMCC 1.6970. Using fed-batch fermentation, 113.18 g·L−1 was achieved. Abdel Rahman et al. [42] produced 67.2 g·L−1 of lactic acid in batch fermentation with E. mundtii QU 25. A lactic acid production of 129 g·L−1 was reached in fed-batch fermentation with glucose and xylose as carbon sources and ammonium hydroxide as a neutralizing agent. In spite of this, based on the results obtained, cell recycling is still a more effective strategy for the production of lactic acid and consumption of lactose with E durans, producing higher yields.

4. Conclusions

Fermentations with E. durans, which have barely been investigated in the literature, were conducted to evaluate the process parameters of lactic acid fermentation and establish efficient and sustainable production routes. The anaerobic medium proved ineffective in producing lactic acid with E. durans. Low levels of dissolved oxygen (about 0.3%) in the medium did not stimulate the formation of lactic acid.
In the studies carried out to evaluate the pH control performance, it was found that pH control with KOH 2 mol·L−1 enabled the production of 36.47 g·L−1 of lactic acid, representing a significant increase compared to fermentations performed without pH control (10.87 g·L−1). However, it is feasible to conclude that cell recycling proved to be the most efficient strategy for lactic acid production, reaching yields of 0.82 g·g−1 and lactic acid concentrations higher than those of a simple batch. Furthermore, cell recycling enhanced the assimilation of lactose as a carbon source. Thus, determining the fermentation parameters enables scale-up and a establishes a sustainable process. In addition, the assimilation of lactose indicates that agro-industrial residues rich in this carbohydrate can be used as a substrate to produce the molecule of interest, adding value to the process.

Author Contributions

The manuscript was written through the contributions of all authors. The manuscript was written with the contributions of all authors. S.B.G. and F.M. conceived and designed the experiments. R.G.M.R.B., S.B.G. and M.C.T.D. analyzed the data, and R.G.M.R.B., M.C.T.D., F.M. and S.B.G. wrote the paper. All authors have read and agreed to the published version of the manuscript.

Funding

This research received no external funding.

Institutional Review Board Statement

Not applicable.

Informed Consent Statement

Not applicable.

Data Availability Statement

The datasets used and/or analyzed during the current study are available within the article and from the corresponding author on reasonable request.

Acknowledgments

The authors thank Conselho Nacional de Desenvolvimento Científico e Tecnológico (CNPq), Coordenação de Aperfeiçoamento de Pessoal de Nível Superior (CAPES)—Finance Code 001, and Fundação de Apoio à Pesquisa do Distrito Federal (FAPDF) for providing scholarships and research support. Particularly, F.M. thanks CNPq for providing a research fellowship (grant number 310829/2021-6).

Conflicts of Interest

The authors declare no conflicts of interest.

References

  1. Lactic Acid Market by Application (Biodegradable Polymers, Food & Beverages, Pharmaceutical Products), Form, and Region, Polylactic Acid Market, by Application (Packaging, Fiber & Fabrics, Agriculture), Form, and Region—Global Forecast to 2025. Available online: https://www.marketsandmarkets.com/Market-Reports/ (accessed on 22 February 2022).
  2. Komesu, A.; Allan Rocha de Oliveira, J.; Helena da Silva Martins, L.; Regina Wolf Maciel, M.; Maciel Filho, R. Lactic acid production to purification: A review. BioResources 2017, 12, 4364–4383. [Google Scholar] [CrossRef]
  3. Barroso, R.G.M.R.; Gonçalves, S.B.; Machado, F. A Novel Approach for the Synthesis of Lactic Acid-Based Polymers in an Aqueous Dispersed Medium. Sustain. Chem. Pharm. 2020, 15, 100211. [Google Scholar] [CrossRef]
  4. Esmaeili, N.; Jahandideh, A.; Muthukumarappan, K.; Åkesson, D.; Skrifvars, M. Synthesis and Characterization of Methacrylated Star-Shaped Poly(Lactic Acid) Employing Core Molecules with Different Hydroxyl Groups. J. Appl. Polym. Sci. 2017, 134, 45341. [Google Scholar] [CrossRef]
  5. Gupta, B.; Revagade, N.; Hilborn, J. Poly(Lactic Acid) Fiber: An Overview. Prog. Polym. Sci. 2007, 32, 455–482. [Google Scholar] [CrossRef]
  6. Pang, Y.; Ardagh, M.A.; Shetty, M.; Chatzidimitriou, A.; Kumar, G.; Vlaisavljevich, B.; Dauenhauer, P.J. On the Spatial Design of Co-Fed Amines for Selective Dehydration of Methyl Lactate to Acrylates. ACS Catal. 2021, 11, 5718–5735. [Google Scholar] [CrossRef]
  7. Pang, Y.; Lee, C.; Vlaisavljevich, B.; Nicholas, C.P.; Dauenhauer, P.J. Multifunctional Amine Modifiers for Selective Dehydration of Methyl Lactate to Acrylates. JACS Au 2023, 3, 368–377. [Google Scholar] [CrossRef] [PubMed]
  8. Makshina, E.V.; Canadell, J.; van Krieken, J.; Sels, B.F. Potassium-Modified ZSM-5 Catalysts for Methyl Acrylate Formation from Methyl Lactate: The Impact of the Intrinsic Properties on Their Stability and Selectivity. ACS Sustain. Chem. Eng. 2021, 10, 6196–6204. [Google Scholar] [CrossRef]
  9. Hofvendahl, K.; Hahn-Hägerdal, B. Factors Affecting the Fermentative Lactic Acid Production from Renewable Resources. Enzym. Microb. Technol. 2000, 26, 87–107. [Google Scholar] [CrossRef] [PubMed]
  10. Barroso, R.G.M.R.; Lima, J.R.C.; Fávaro, L.C.L.; Machado, F.; Gonçalves, S.B. Bioconversion of Glycerol into Lactic Acid by a New Bacterial Strain from the Brazilian Cerrado Soil. Fermentation 2022, 8, 477. [Google Scholar] [CrossRef]
  11. Abdel-Rahman, M.A.; Tashiro, Y.; Sonomoto, K. Recent Advances in Lactic Acid Production by Microbial Fermentation Processes. Biotechnol. Adv. 2013, 31, 877–902. [Google Scholar] [CrossRef]
  12. Abedi, E.; Hashemi, S.M.B. Lactic Acid Production—Producing Microorganisms and Substrates Sources-State of Art. Heliyon 2020, 6, e04974. [Google Scholar] [CrossRef] [PubMed]
  13. Giraffa, G. Enterococci from Foods. FEMS Microbiol. Rev. 2002, 26, 163–171. [Google Scholar] [CrossRef] [PubMed]
  14. Gomes, B.C.; Esteves, C.T.; Palazzo, I.C.V.; Darini, A.L.C.; Felis, G.E.; Sechi, L.A.; Franco, B.D.G.M.; de Martinis, E.C.P. Prevalence and Characterization of Enterococcus Spp. Isolated from Brazilian Foods. Food Microbiol. 2008, 25, 668–675. [Google Scholar] [CrossRef] [PubMed]
  15. Cock, L.S.; De Stouvenel, A.R. Lactic Acid Production by a Strain of Lactococcus Lactis Subs Lactis Isolated from Sugar Cane Plants. Electron. J. Biotechnol. 2006, 9, 40–45. [Google Scholar] [CrossRef]
  16. Panesar, P.S.; Kennedy, J.F.; Knill, C.J.; Kosseva, M. Production of L(+) Lactic Acid Using Lactobacillus Casei from Whey. Braz. Arch. Biol. Technol. 2010, 53, 219–226. [Google Scholar] [CrossRef]
  17. Pessione, A.; Zapponi, M.; Mandili, G.; Fattori, P.; Mangiapane, E.; Mazzoli, R.; Pessione, E. Enantioselective Lactic Acid Production by an Enterococcus Faecium Strain Showing Potential in Agro-Industrial Waste Bioconversion: Physiological and Proteomic Studies. J. Biotechnol. 2014, 173, 31–40. [Google Scholar] [CrossRef] [PubMed]
  18. Verma, D.; Subudhi, S. ‘Lactobacillus sp. Strain TERI-D3’, as Microbial Cell Factory for Fermentative Production of Lactic Acid’. Curr. Res. Green Sustain. Chem. 2021, 4, 100059. [Google Scholar] [CrossRef]
  19. Nagarajan, D.; Oktarina, N.; Chen, P.-T.; Chen, C.-Y.; Lee, D.-J.; Chang, J.-S. Fermentative Lactic Acid Production from Seaweed Hydrolysate Using Lactobacillus sp. and Weissella sp. Bioresour. Technol. 2022, 344, 126166. [Google Scholar] [CrossRef]
  20. Murakami, N.; Oba, M.; Iwamoto, M.; Tashiro, Y.; Noguchi, T.; Bonkohara, K.; Abdel-Rahman, M.A.; Zendo, T.; Shimoda, M.; Sakai, K.; et al. L-Lactic Acid Production from Glycerol Coupled with Acetic Acid Metabolism by Enterococcus Faecalis without Carbon Loss. J. Biosci. Bioeng. 2016, 121, 89–95. [Google Scholar] [CrossRef]
  21. Yuan, S.F.; Hsu, T.C.; Wang, C.A.; Jang, M.F.; Kuo, Y.C.; Alper, H.S.; Guo, G.L.; Hwang, W.S. Production of Optically Pure l(+)-Lactic Acid from Waste Plywood Chips Using an Isolated Thermotolerant Enterococcus Faecalis SI at a Pilot Scale. J. Ind. Microbiol. Biotechnol. 2018, 45, 961–970. [Google Scholar] [CrossRef]
  22. Hassan, S.E.D.; Abdel-Rahman, M.A.; Roushdy, M.M.; Azab, M.S.; Gaber, M.A. Effective Biorefinery Approach for Lactic Acid Production Based on Co-Fermentation of Mixed Organic Wastes by Enterococcus Durans BP130. Biocatal. Agric. Biotechnol. 2019, 20, 101203. [Google Scholar] [CrossRef]
  23. Hayat, Z.; Mukhtar, I.; Shair, F.; Ullah, K.; Hafeez, A.; Hafeez, F.Y.; Ullah, A. Production of Antifungal Gelatinase by Enterococcus Durans S2C and Its Potential Role in the Biological Control. Int. J. Agric. Biol. 2021, 25, 1043–1050. [Google Scholar] [CrossRef]
  24. Estilarte, M.L.; Tymczyszyn, E.E.; de los Ángeles Serradell, M.; Carasi, P. Freeze-Drying of Enterococcus Durans: Effect on Their Probiotics and Biopreservative Properties. LWT 2021, 137, 110496. [Google Scholar] [CrossRef]
  25. Hussein, W.E.; Abdelhamid, A.G.; Rocha-Mendoza, D.; García-Cano, I.; Yousef, A.E. Assessment of Safety and Probiotic Traits of Enterococcus Durans OSY-EGY, Isolated from Egyptian Artisanal Cheese, Using Comparative Genomics and Phenotypic Analyses. Front. Microbiol. 2020, 11, 608314. [Google Scholar] [CrossRef] [PubMed]
  26. Yerlikaya, O.; Akbulut, N. In Vitro Characterisation of Probiotic Properties of Enterococcus Faecium and Enterococcus Durans Strains Isolated from Raw Milk and Traditional Dairy Products. Int. J. Dairy Echnol. 2020, 73, 98–107. [Google Scholar] [CrossRef]
  27. Simonová, M.P.; Lauková, A.; Chrastinová, L.; Kandričáková, A.; Ščerbová, J.; Formelová, Z.; Chrenková, M.; Zitňan, R.; Miltko, R.; Bełzecki, G. Effect of Diet Supplementation with Enterococcus Durans ED26E/7 and Its Durancin ED26E/7 on Growth Performance, Caecal Enzymatic Activity, Jejunal Morphology and Meat Properties of Broiler Rabbits. Ann. Anim. Sci. 2022, 22, 221–235. [Google Scholar] [CrossRef]
  28. Lauková, A.; Tomáška, M.; Kmet’, V.; Strompfová, V.; Simonová, M.P.; Dvorožňáková, E. Slovak Local Ewe’s Milk Lump Cheese, a Source of Beneficial Enterococcus Durans Strain. Foods 2021, 10, 3091. [Google Scholar] [CrossRef]
  29. Bosco, F.; Cirrincione, S.; Carletto, R.; Marmo, L.; Chiesa, F.; Mazzoli, R.; Pessione, E. Pha Production from Cheese Whey and “Scotta”: Comparison between a Consortium and a Pure Culture of Leuconostoc mesenteroides. Microorganisms 2021, 9, 2426. [Google Scholar] [CrossRef]
  30. García-Depraect, O.; León-Becerril, E. Use of a Highly Specialized Biocatalyst to Produce Lactate or Biohydrogen and Butyrate from Agro-Industrial Resources in a Dual-Phase Dark Fermentation. Fermentation 2023, 9, 787. [Google Scholar] [CrossRef]
  31. Dareioti, M.A.; Vavouraki, A.I.; Tsigkou, K.; Zafiri, C.; Kornaros, M. Dark Fermentation of Sweet Sorghum Stalks, Cheese Whey and Cow Manure Mixture: Effect of PH, Pretreatment and Organic Load. Processes 2021, 9, 1017. [Google Scholar] [CrossRef]
  32. Bustamante, D.; Tortajada, M.; Ramón, D.; Rojas, A. Production of D-lactic acid by the fermentation of orange peel waste hydrolysate by lactic acid bacteria. Fermentation 2020, 6, 1. [Google Scholar] [CrossRef]
  33. Boonmee, M.; Leksawasdi, N.; Bridge, W.; Rogers, P.L. Batch and Continuous Culture of Lactococcus Lactis NZ133: Experimental Data and Model Development. Biochem. Eng. J. 2003, 14, 127–135. [Google Scholar] [CrossRef]
  34. Jangra, M.; Belur, P.D.; Oriabinska, L.B.; Dugan, O.M. Multistrain Probiotic Production by Co-Culture Fermentation in a Lab-Scale Bioreactor. Eng. Life Sci. 2016, 16, 247–253. [Google Scholar] [CrossRef]
  35. Zotta, T.; Ricciardi, A.; Ianniello, R.G.; Parente, E.; Reale, A.; Rossi, F.; Iacumin, L.; Comi, G.; Coppola, R. Assessment of Aerobic and Respiratory Growth in the Lactobacillus Casei Group. PLoS ONE 2014, 9, e99189. [Google Scholar] [CrossRef]
  36. Zotta, T.; Parente, E.; Ricciardi, A. Aerobic Metabolism in the Genus Lactobacillus: Impact on Stress Response and Potential Applications in the Food Industry. J. Appl. Microbiol. 2017, 122, 857–869. [Google Scholar] [CrossRef] [PubMed]
  37. Ge, X.Y.; Xu, Y.; Chen, X.; Zhang, L.Y. Regulation of Metabolic Flux in Lactobacillus Casei for Lactic Acid Production by Overexpressed LdhL Gene with Two-Stage Oxygen Supply Strategy. J. Microbiol. Biotechnol. 2015, 25, 81–88. [Google Scholar] [CrossRef]
  38. Joulak, I.; Concórdio-Reis, P.; Torres, C.A.V.; Sevrin, C.; Grandfils, C.; Attia, H.; Freitas, F.; Reis, M.A.M.; Azabou, S. Sustainable use of agro-industrial wastes as potential feedstocks for exopolysaccharide production by selected Halomonas strains. Environ. Sci. Pollut. Res. 2022, 29, 22043–22055. [Google Scholar] [CrossRef] [PubMed]
  39. Alfano, A.; D’ambrosio, S.; D’agostino, A.; Finamore, R.; Schiraldi, C.; Cimini, D. Concentrated Buffalo Whey as Substrate for Probiotic Cultures and as Source of Bioactive Ingredients: A Local Circular Economy Approach towards Reuse of Wastewaters. Fermentation 2021, 7, 281. [Google Scholar] [CrossRef]
  40. Aso, Y.; Tsubaki, M.; Dang Long, B.H.; Murakami, R.; Nagata, K.; Okano, H.; Phuong Dung, N.T.; Ohara, H. Continuous Production of D-Lactic Acid from Cellobiose in Cell Recycle Fermentation Using β-Glucosidase-Displaying Escherichia coli. J. Biosci. Bioeng. 2019, 127, 441–446. [Google Scholar] [CrossRef] [PubMed]
  41. Liu, P.; Zheng, Z.; Xu, Q.; Qian, Z.; Liu, J.; Ouyang, J. Valorization of Dairy Waste for Enhanced D-Lactic Acid Production at Low Cost. Process. Biochem. 2018, 71, 18–22. [Google Scholar] [CrossRef]
  42. Abdel-Rahman, M.A.; Xiao, Y.; Tashiro, Y.; Wang, Y.; Zendo, T.; Sakai, K.; Sonomoto, K. Fed-Batch Fermentation for Enhanced Lactic Acid Production from Glucose/Xylose Mixture without Carbon Catabolite Repression. J. Biosci. Bioeng. 2015, 119, 153–158. [Google Scholar] [CrossRef] [PubMed]
Figure 1. Pathways of lactic acid production. A route: D-tagatose 6-phosphate pathway. B route: pentose phosphoketolase (PK) pathway for hetero-lactic acid metabolism. C route: Embden–Meyerhof–Parnas (EMP) pathway for homo-lactic acid metabolism. D route: glycolysis pathway [12].
Fermentation 10 00149 g001
Figure 2. Cell concentration of E. durans liquid MRS medium for 72 h.
Fermentation 10 00149 g002
Figure 3. Lactic acid production and consumption of lactose and glucose by E. durans in a 1 L bioreactor with MRS medium with 40 g·L−1 of lactose and 10 g·L−1 of glucose (Condition 1) and MRS medium with 20 g·L−1 of lactose and 10 g·L−1 of glucose (Condition 2).
Fermentation 10 00149 g003
Figure 4. Correlation between pH, cell concentration, and dissolved oxygen (DO%) for E. durans fermentations in anaerobic conditions.
Fermentation 10 00149 g004
Figure 5. Lactic acid production and consumption of lactose and glucose for E. durans in 1 L bioreactor anaerobic fermentations.
Fermentation 10 00149 g005
Figure 6. Production of lactic acid, consumption of lactose and glucose, pH, and cell concentration for successive batch cycles with E. durans in a 1 L bioreactor. Each cycle lasted for 96 h. Cycle I (yellow area); Cycle II (white area).
Fermentation 10 00149 g006
Figure 7. Lactic acid production and consumption of lactose and glucose for E. durans in fermentations with pH control at 5.0 in a 1 L bioreactor.
Fermentation 10 00149 g007
Figure 8. Correlation between pH, cell concentration, and dissolved oxygen for E. durans in fermentations in a 1 L bioreactor with pH control.
Fermentation 10 00149 g008
Table 1. Lactic acid production via fermentation from various sources.
OrganismSourceFermentation
Strategies
Lactic Acid (g·L−1)Yield
(g·g−1)
Reference
Lactococcus lactis subs lactisGlucoseBatch35.00.45Cock [15]
Lactobacillus caseiLactoseBatch33.730.88Panesar [16]
Enterococcus faeciumGlucoseBatch180.9Pessione [17]
Enterococcus faeciumFructoseBatch180.9Pessione [17]
Enterococcus faeciumCellobioseBatch13.50.71Pessione [17]
Enterococcus faeciumXyloseBatch4.50.27Pessione [17]
Lactobacillus sp. TERI-D3SucroseBatch19.40.86Verma [18]
Lactobacillus sp. TERI-D3GalactoseBatch15.80.8Verma [18]
Lactobacillus sp. TERI-D3LactoseBatch18.10.9Verma [18]
Lactobacillus sp. TERI-D3GlucoseBatch17.50.9Verma [18]
Weissella paramesenteroidesGlucoseBatch200.68Nagarajan [19]
Enterococcus faecalisGlycerolFed-batch55.30.99Murakami [20]
Enterococcus faecalisWaste plywood chipsBatch920.92Yuan [21]
Enterococcus durans BP130Food wasteBatch28.80.85Hassan [22]
Table 2. Comparison of lactic acid production, yield, and productivity in each experiment.
Operation ModeLactic Acid (g·L−1)Yield (g·g−1)Productivity (g·L−1·h−1)
Simple Batch10.870.940.54
Anaerobiosis9.170.690.21
Cell recycling26.070.820.36
Batch with pulse and pH control36.470.570.38
Disclaimer/Publisher’s Note: The statements, opinions and data contained in all publications are solely those of the individual author(s) and contributor(s) and not of MDPI and/or the editor(s). MDPI and/or the editor(s) disclaim responsibility for any injury to people or property resulting from any ideas, methods, instructions or products referred to in the content.

