Article

Synthesis and Characterization of Carbon/Nitrogen/Iron Based Nanoparticles by Laser Pyrolysis as Non-Noble Metal Electrocatalysts for Oxygen Reduction

1
CEA, IRAMIS, UMR NIMBE 3685, F-91191 Gif Sur Yvette, France
2
CEA-Saclay DRF/IRAMIS//SPEC/LNO, 91191 Gif sur Yvette, France
3
UVSQ, CNRS, UMR 8180, ILV, F-78035 Versailles, France
*
Author to whom correspondence should be addressed.
Submission received: 23 May 2018 / Revised: 11 July 2018 / Accepted: 16 July 2018 / Published: 30 July 2018
(This article belongs to the Special Issue Carbon-Based Catalyst)

Abstract

:
This paper reports original results on the synthesis of Carbon/Nitrogen/Iron-based Oxygen Reduction Reaction (ORR) electrocatalysts by CO2 laser pyrolysis. Precursors consisted of two different liquid mixtures containing FeOOH nanoparticles or iron III acetylacetonate as iron precursors, being fed to the reactor as an aerosol of liquid droplets. Carbon and nitrogen were brought by pyridine or a mixture of pyridine and ethanol depending on the iron precursor involved. The use of ammonia as laser energy transfer agent also provided a potential nitrogen source. For each liquid precursor mixture, several syntheses were conducted through the step-by-step modification of NH3 flow volume fraction, so-called R parameter. We found that various feature such as the synthesis production yield or the nanomaterial iron and carbon content, showed identical trends as a function of R for each liquid precursor mixture. The obtained nanomaterials consisted in composite nanostructures in which iron based nanoparticles are, to varying degrees, encapsulated by a presumably nitrogen doped carbon shell. Combining X-ray diffraction and Mossbauer spectroscopy with acid leaching treatment and extensive XPS surface analysis allowed the difficult question of the nature of the formed iron phases to be addressed. Besides metal and carbide iron phases, data suggest the formation of iron nitride phase at high R values. Interestingly, electrochemical measurements reveal that the higher R the higher the onset potential for the ORR, what suggests the need of iron-nitride phase existence for the formation of active sites towards the ORR.

Graphical Abstract

1. Introduction

The synthesis of nanoparticles or nanostructures with tailored properties is an important challenge for a wide range of applications such as electronics, photovoltaics, sensors, catalysis and electrocatalysis. The latter domain concerns in particular the sluggish Oxygen Reduction Reaction (ORR). Indeed, a considerable research effort is currently observed over the world, in order to replace the scarce and expensive platinum-based electrocatalysts. Within this frame, early studied materials based on carbon incorporating nitrogen atoms with a transition metal are of particular interest. The development of this kind of material has been inspired by Jasinky et al. [1], who reported more than fifty years ago on the ORR activity of cobalt phtalocyanine in basic media. About ten years later, Jahnk and co-workers showed that thermal treatments of N4-chelates significantly improved both the stability and the performance of the catalysts [2]. An important step was then achieved by demonstrating that ORR catalysts could be obtained by simply heat-treating a mixture of polyacrylonitrile, metal salt and carbon black [3]. Introduction of ammonia as a nitrogen precursor combined with the use of high specific area carbon and intimate mixing of precursors by ball milling later lead to performances close to those of platinum catalysts [4]. Research on non-noble Fe–N–C electrocatalysts for ORR is still currently very important aiming at the improvement of performances and durability. Recent reviews provide precious compilation of latest developments [5,6,7,8,9].
Among the various ways available to synthesize nanoparticles, laser pyrolysis is based on the thermal decomposition of gaseous or liquid precursors through the absorption of a CO2 laser wavelength by at least one component of the precursor mixture [10]. For example, laser pyrolysis has been used for the synthesis of various kinds of materials such as carbides [11,12], nitrides [13], oxides [14,15,16,17] or silicon [18], using ethylene, ammonia or silane as both absorbing and precursor compounds. Such materials covered numerous applications related to mechanical properties enhancement, photovoltaics, energy storage, labelling for bio-medical application and sensors. To our knowledge, the only report involving laser pyrolysis regarding non-noble metal ORR electrocatalysts concerns the synthesis of Tantalum based carbonitrides and oxycarbonitrides [19].
The present paper reports on the synthesis and characterization of nanomaterials containing carbon, nitrogen and iron by CO2 laser pyrolysis that could potentially show ORR capability in acidic medium. The carbon source consists in pyridine that also provides hydrocarbon-based nitrogen source, while ammonia is used as both laser energy absorbent and additional nitrogen precursor. With these carbon and nitrogen sources, we have chosen to investigate two different iron precursors. The first consists of an iron organometallic compound (iron III acetylacetonate), which is dissolved in pyridine, the second consists of iron oxide–hydroxide (FeOOH) nanoparticles, commercially available as a dispersion in ethanol, which is further mixed with pyridine. The paper focuses on the trends observed as a function of the ammonia volume ratio (R) involved in the synthesis and provides first electrochemical measurements of the ORR as a function of the latter.

2. Materials and Methods
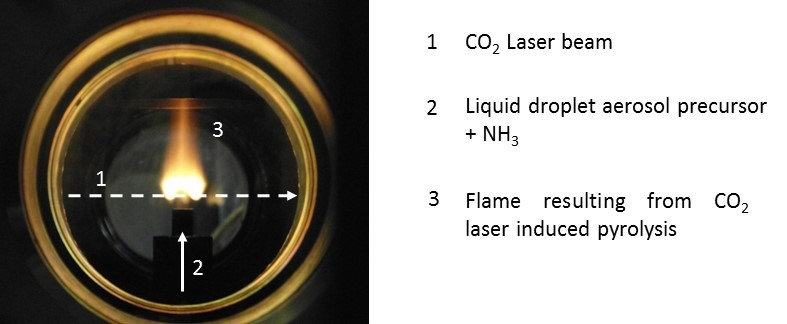
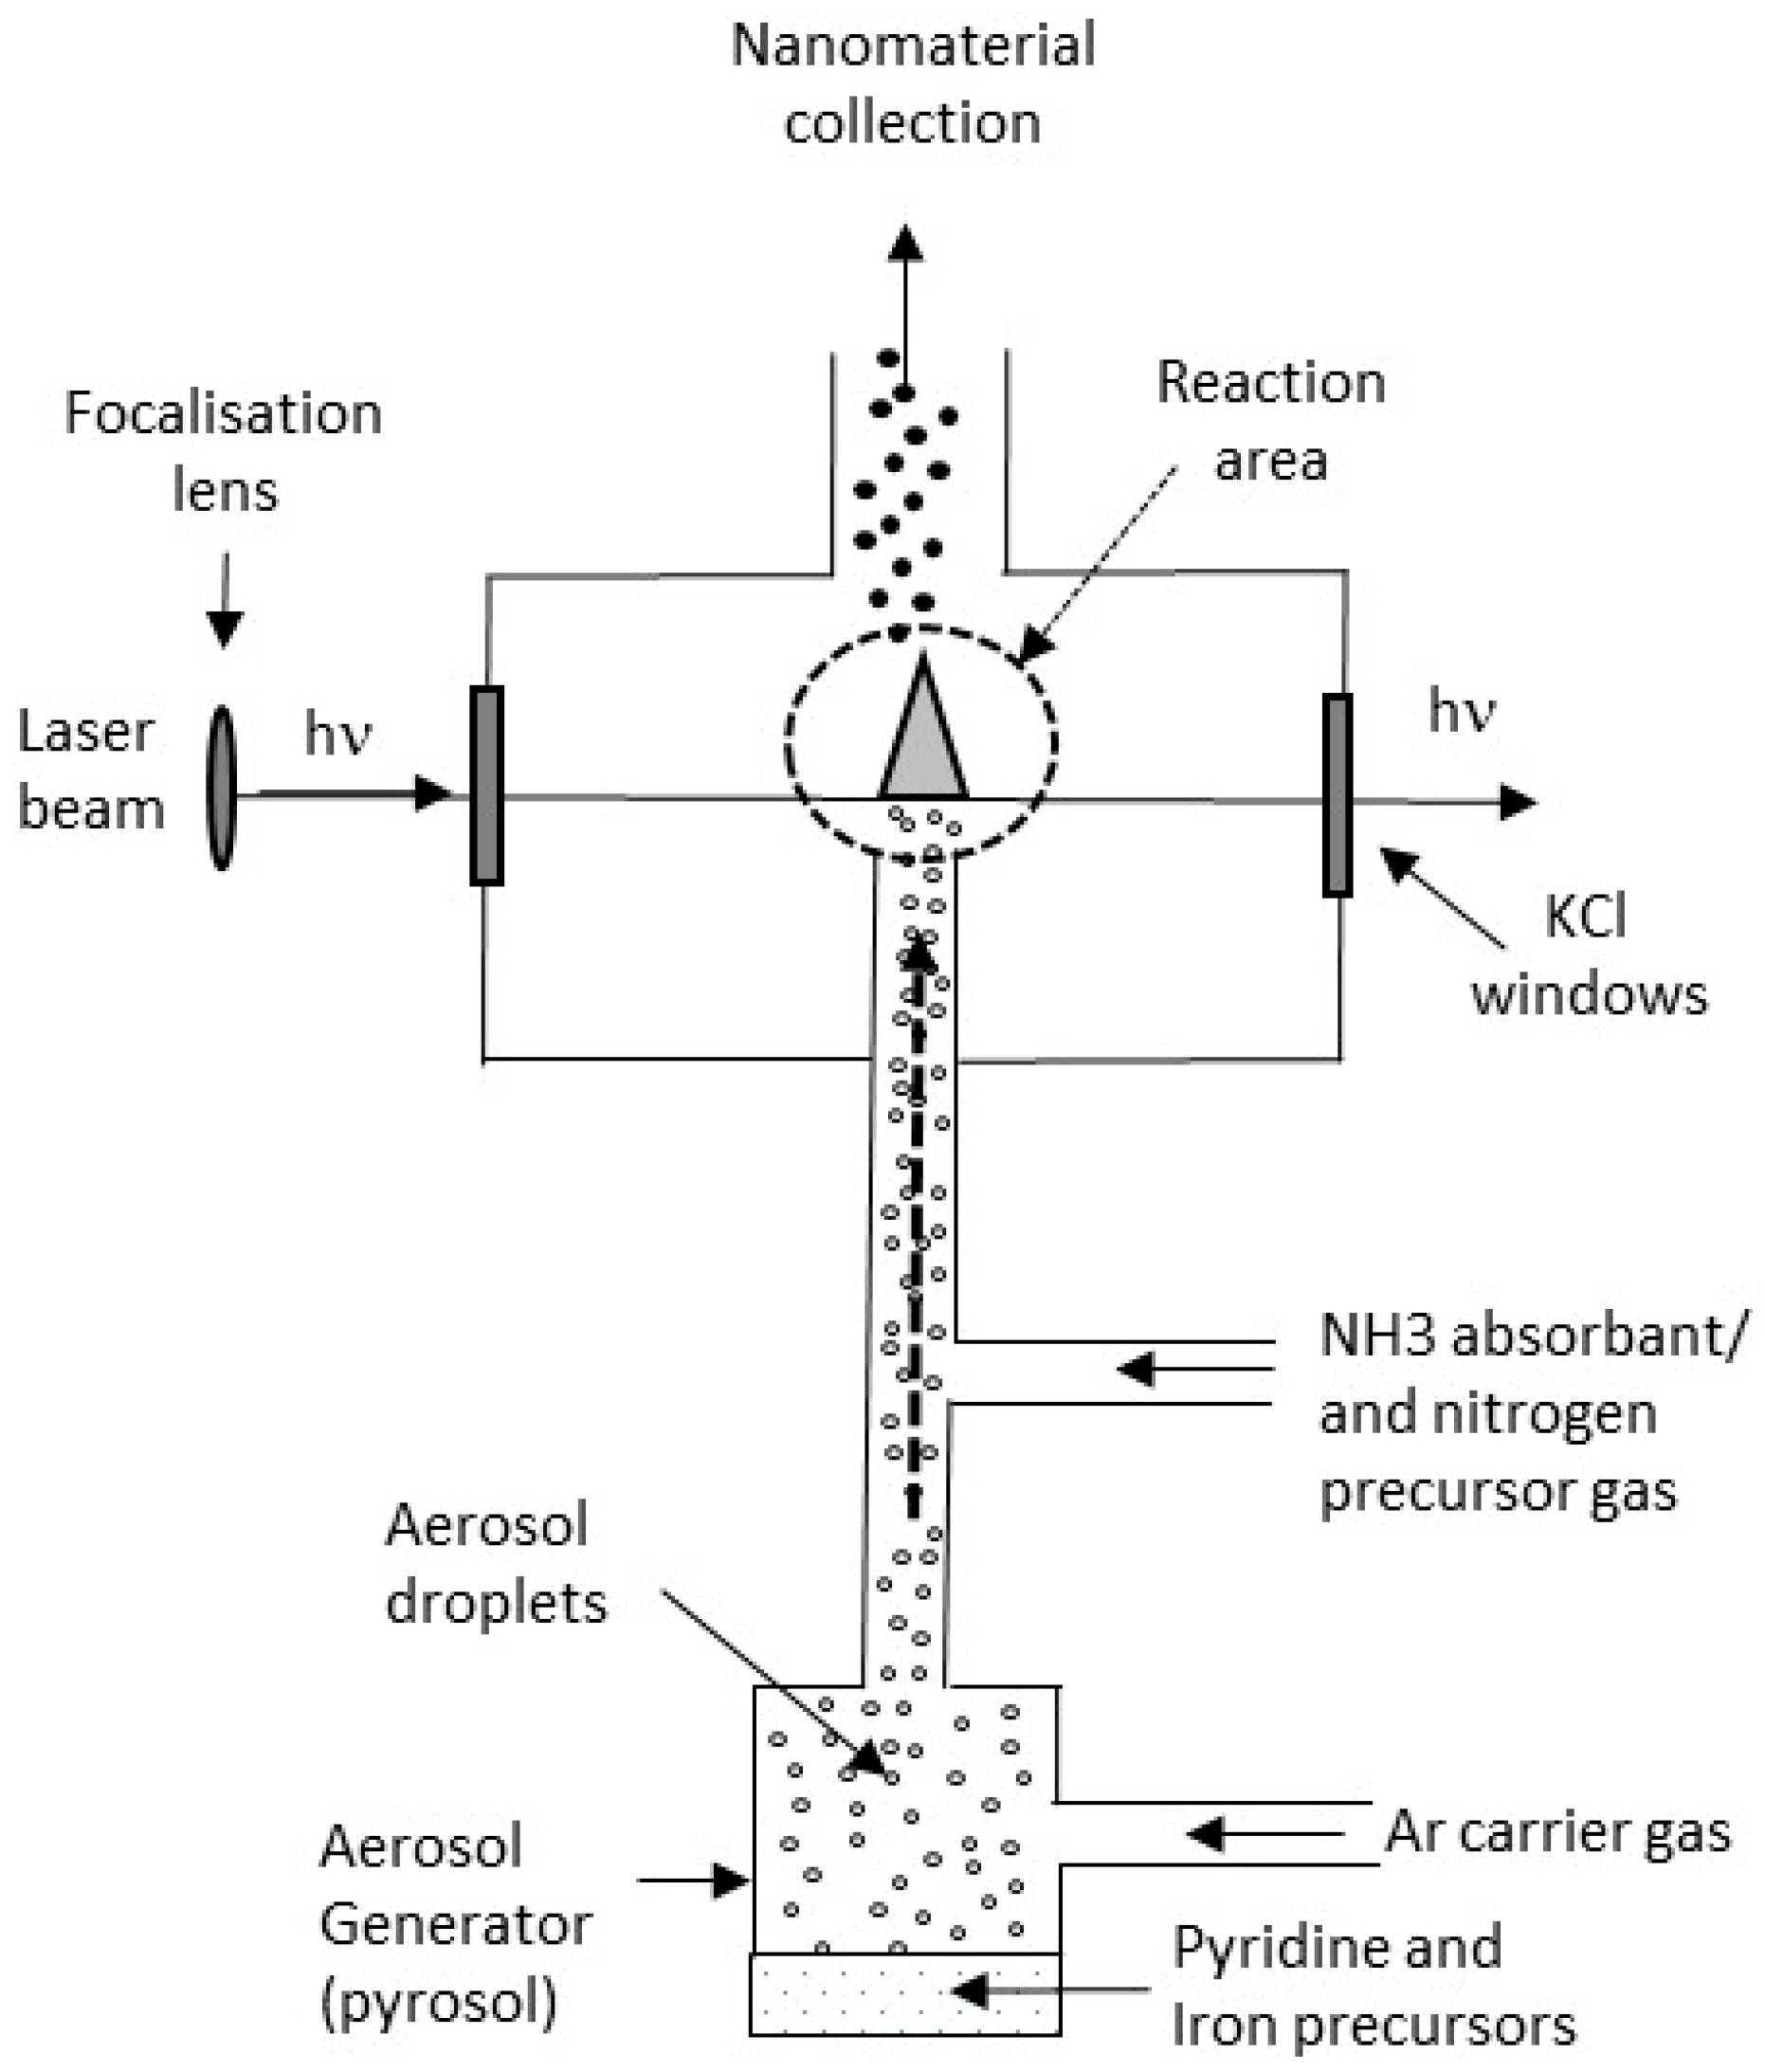
2.1. Synthesis

Iron III oxide–hydroxyde (FeOOH) elongated nanoparticles suspension in ethanol 20 wt %, iron III acetylacetonate (Fe(C5H7O2)3 referred as Fe(acac)3) and pyridine were purchased from Aldrich (St. Louis, MO, USA), and used as received. The CO2 laser (λ = 10.6324 µm) was a 2200 W PRC, SL 2200 from PRC (Landing, NJ, USA). It was used in continuous mode and the laser beam was focused on a horizontal plane by way of a hemispherical ZnSe lens. The first Liquid Precursor Mixture (referred as LPM-1) involved here is prepared by mixing the commercial FeOOH nanoparticles suspension in ethanol with pyridine. The volume ratio pyridine/ethanol is 50/50 giving a final FeOOH concentration of 25 g·L−1. The second Liquid Precursor Mixture (referred as LPM-2) is an iron III acetylacetonate solution at 14 g·L−1 in pyridine. The liquid precursor media were nebulized using a pyrosol® 7901 type piezoelectric aerosol generator from RBI (Meylan, France).

2.2. Characterization

X-ray diffraction was recorded using Cu Kα wavelength. Mössbauer absorption spectra were carried out at room temperature with an 57Fe isotope and using a commercial Co*:Rh γ-ray source and an electromagnetic drive with a linear velocity signal. The different components present in the spectra were characterized by their hyperfine field and their isomer shift, which were obtained from the experimental data using a least-squares fitting procedure. The iron content was measured by X-ray fluorescence using a previously described procedure [20] that requires tiny amount of materials: first, a collection of porous deposit of known loading was prepared on Freudenberg H2415 I2C3 carbon felts from Freudenberg (Weinheim, Germany), using carbon nanotubes (CNT’s) whose Iron content was previously determined by thermogravimetric analysis. Then a calibration curve reporting the iron Kα line [20] as a function of the iron content in the CNT’s electrodes was drawn. Second, porous deposits of known loading were prepared on carbon felts with powders synthesized by laser pyrolysis. The calibration curve was then used to convert the recorded iron Kα line intensity into an iron content. The carbon content was measured using a Horiba EMIA-320V carbon analyser from Horiba (Kyoto, Japan). Specific surface areas were determined by single point BET (Brunauer, Emmett and Teller) measurements using a Micromeritics FlowSorb II 2300 instrument from Micromeritics (Norcross, GA, USA), with a gas mixture of 30 vol % N2 in He. The sample was degassed at 250 °C for two hours before measurement.

2.3. Electrode Preparation and Electrochemical Measurement

Cyclic Voltammetry (CV) was recorded using a Bio-Logic VMP3 potentiostat (Bio-Logic, Seyssinet-Pariset, France). As described in detail in previous papers [20,21,22,23], CVs were recorded on porous electrodes prepared on Freudenberg carbon felts by filtration of liquid dispersion obtained by powder sonication in isopropanol. Before CV recording, the porous electrodes were submitted to a conditioning step aiming at electrolyte impregnation in the electrode porosity, as previously reported for porous electrodes based on platinum electrocatalysts [21,22,23] as well as for non-noble electrocatalysts consisting of nitrogen doped carbon nanotubes [20]. For the latter, cycling during the conditioning step resulted in a loss of iron in the electrolyte as revealed by redox peaks that vanished under prolonged cycling. CVs recorded in the present paper during the conditioning step were very similar to those observed with nitrogen doped carbon nanotubes [20]. In the present paper, when such iron loss was observed, it was verified that the oxygen reduction measurements were not affected by iron dissolution by changing the electrolyte after iron loss. Potentials were measured using a Sodium-Satured Calomel Electrode (SSCE electrode, from Radiometer Analytical, Villeurbanne, France). On the CVs shown in the paper, potentials are reported versus the Standard Hydrogen Electrode (SHE, −0.236 V vs. SSCE). The ORR onset potential is determined by the higher potential at which an ORR current is measured on the background corrected cyclic voltammetry.

2.4. XPS Analysis

Surface analysis was performed with a Thermo Electron K-Alpha spectrometer (Thermo Electron, Waltham, MA, USA). The X-ray excitation was the K-alpha aluminium line at 1486.7 eV. A constant analyser energy (CAE) mode was used for the electron detection (20 eV pass energy value was chosen). The detection of the photoelectrons was perpendicular to the sample surface. This latter consisted of porous electrodes formed by filtration on carbon felts on which a 30 nm gold layer was deposited by vacuum evaporation before the formation of the nanomaterial layer by filtration. This gold deposit prevents the potential collection of carbon and nitrogen photoelectrons from the carbon felt.

3. Results

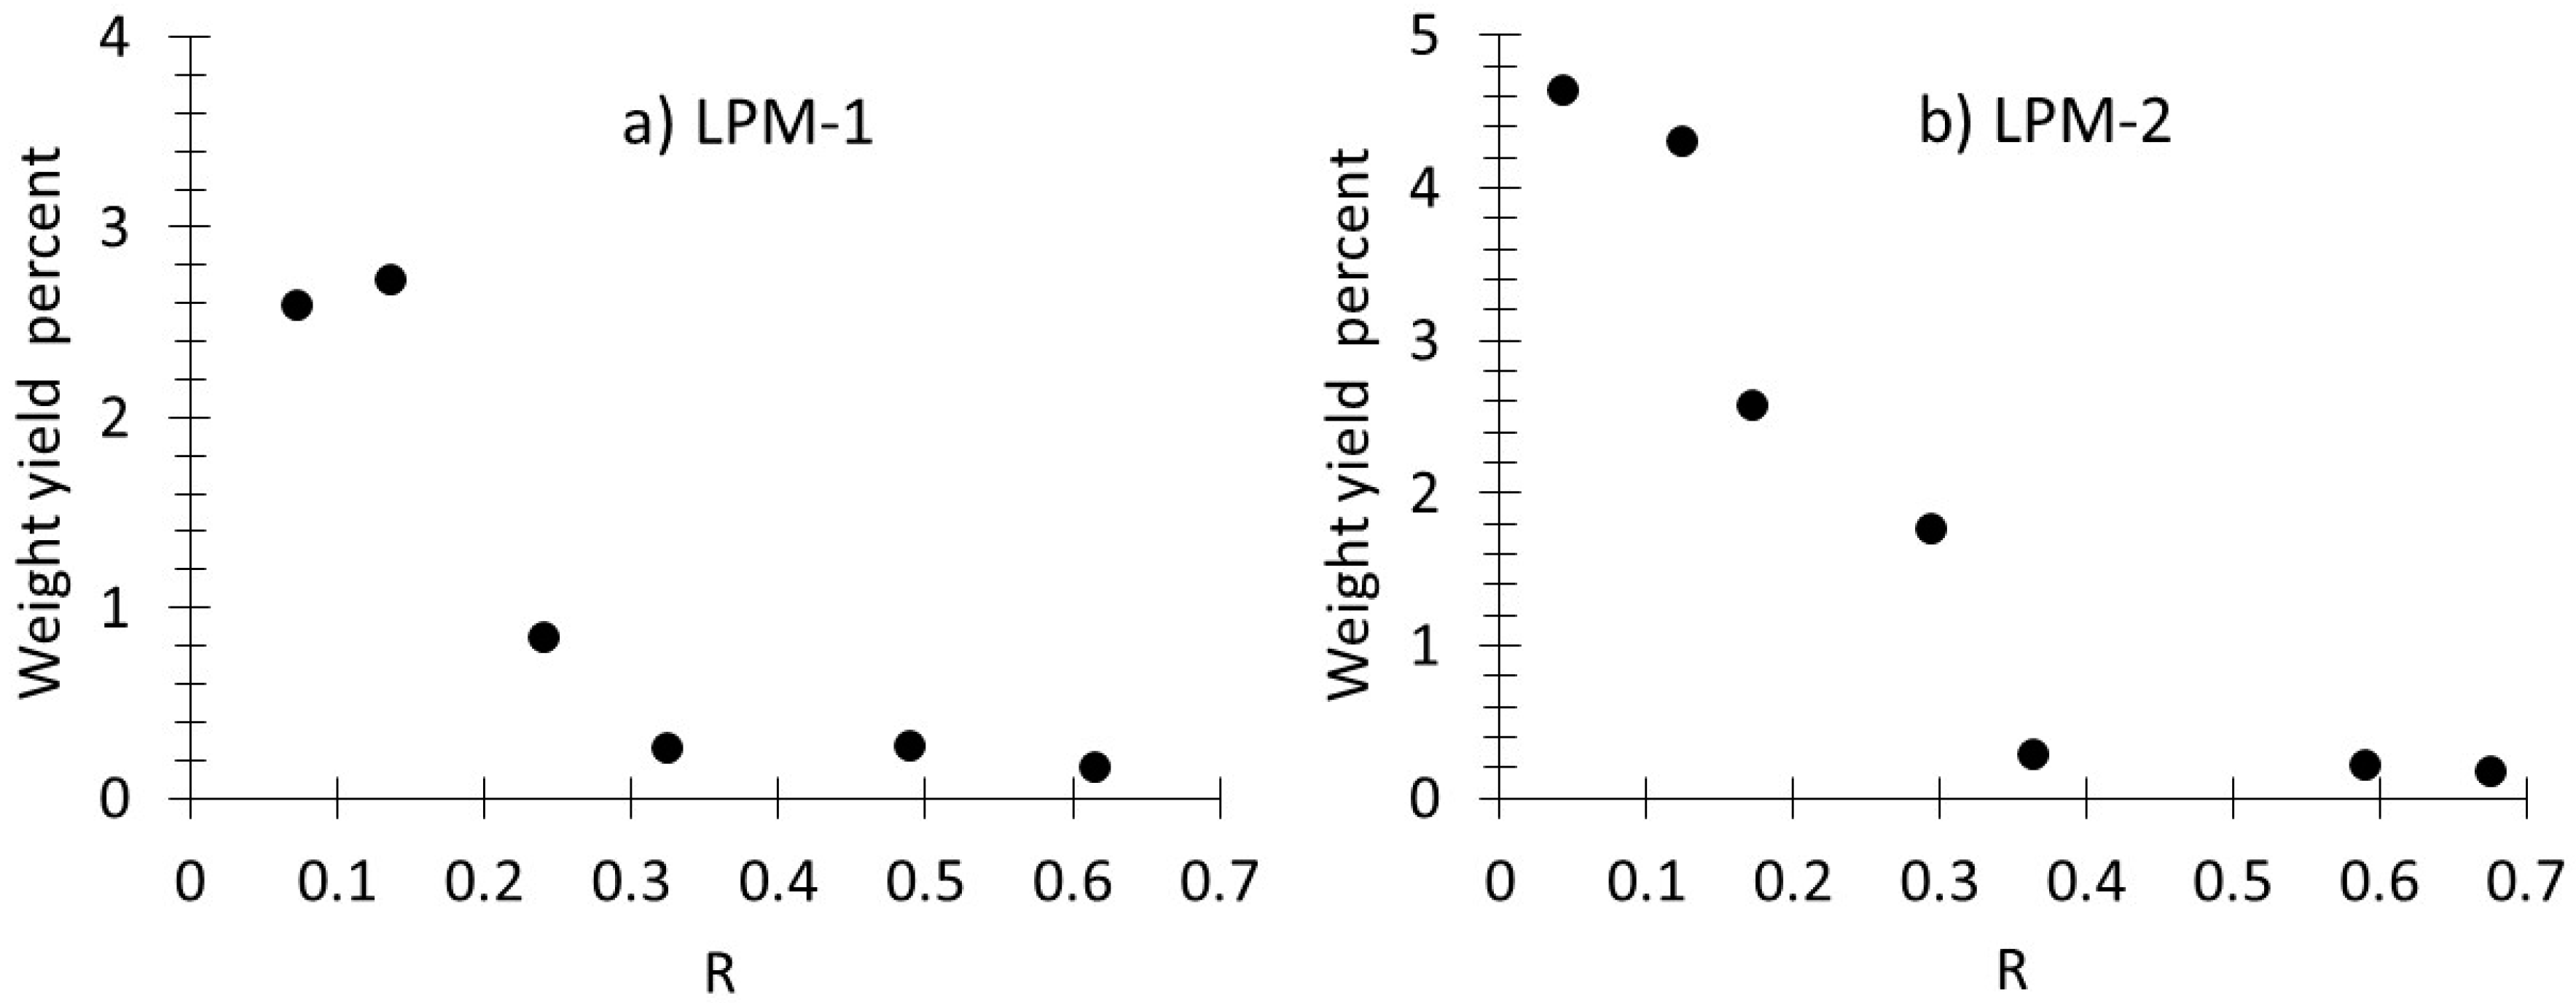
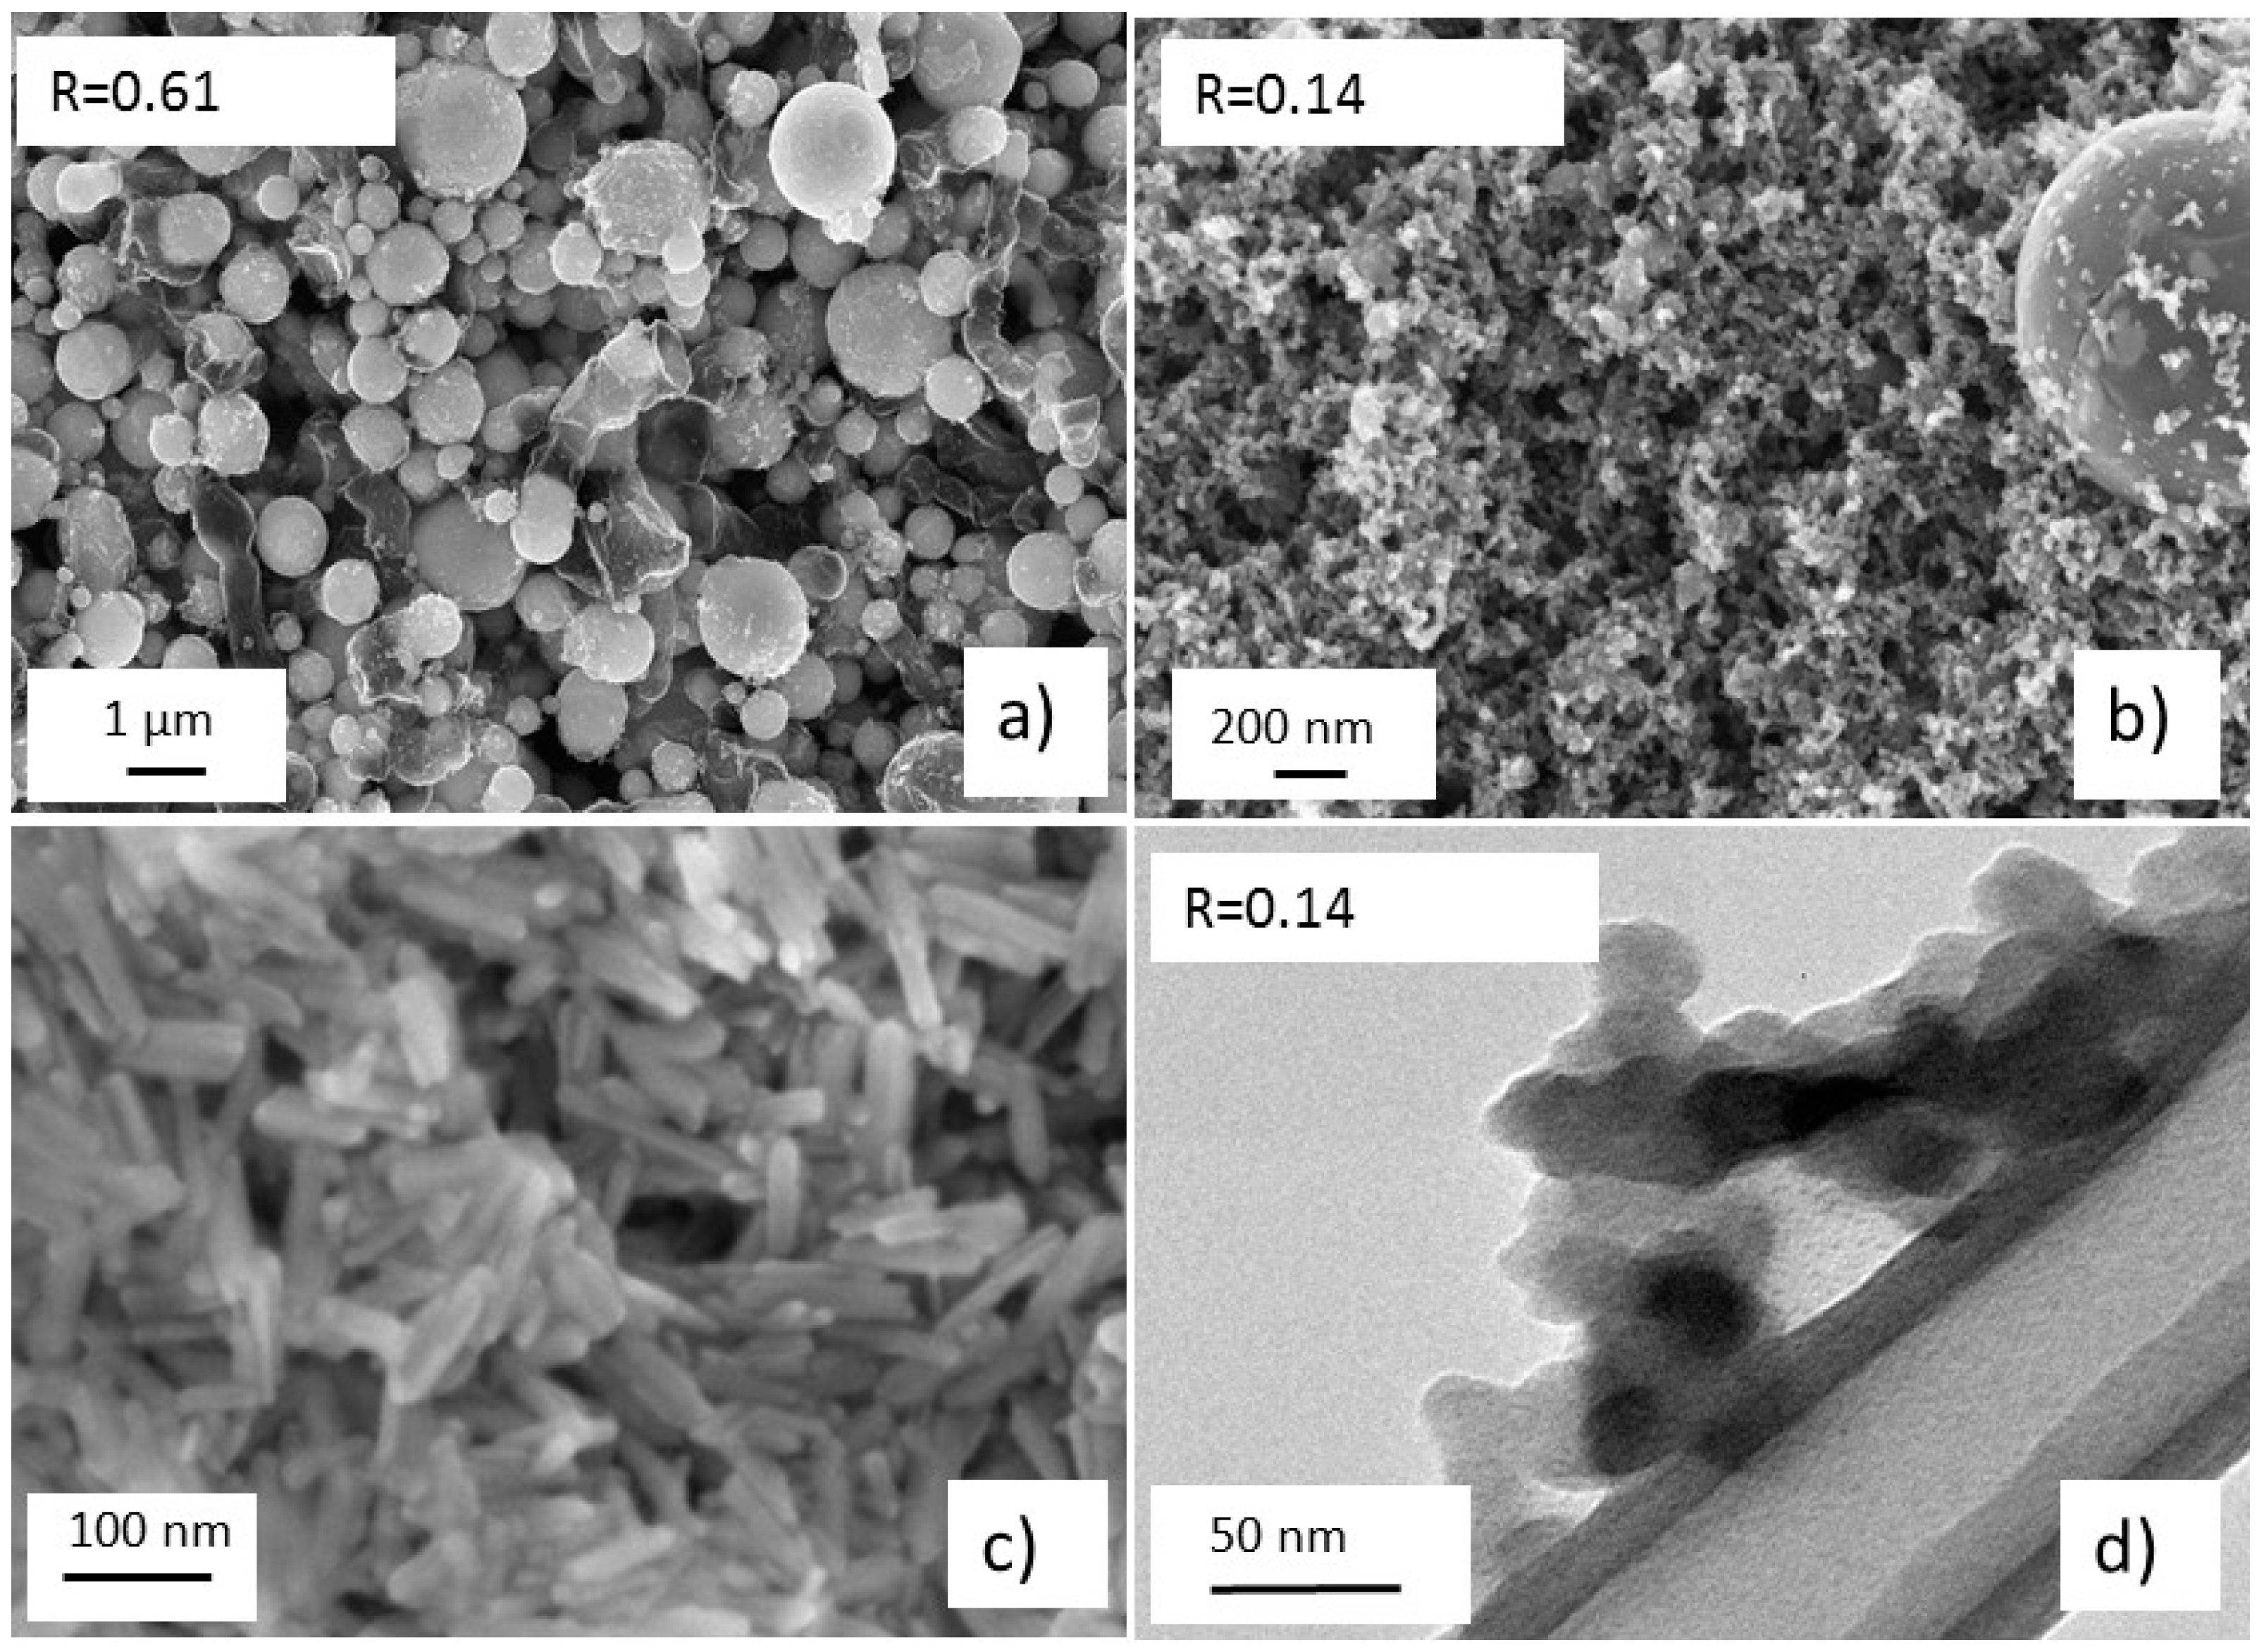
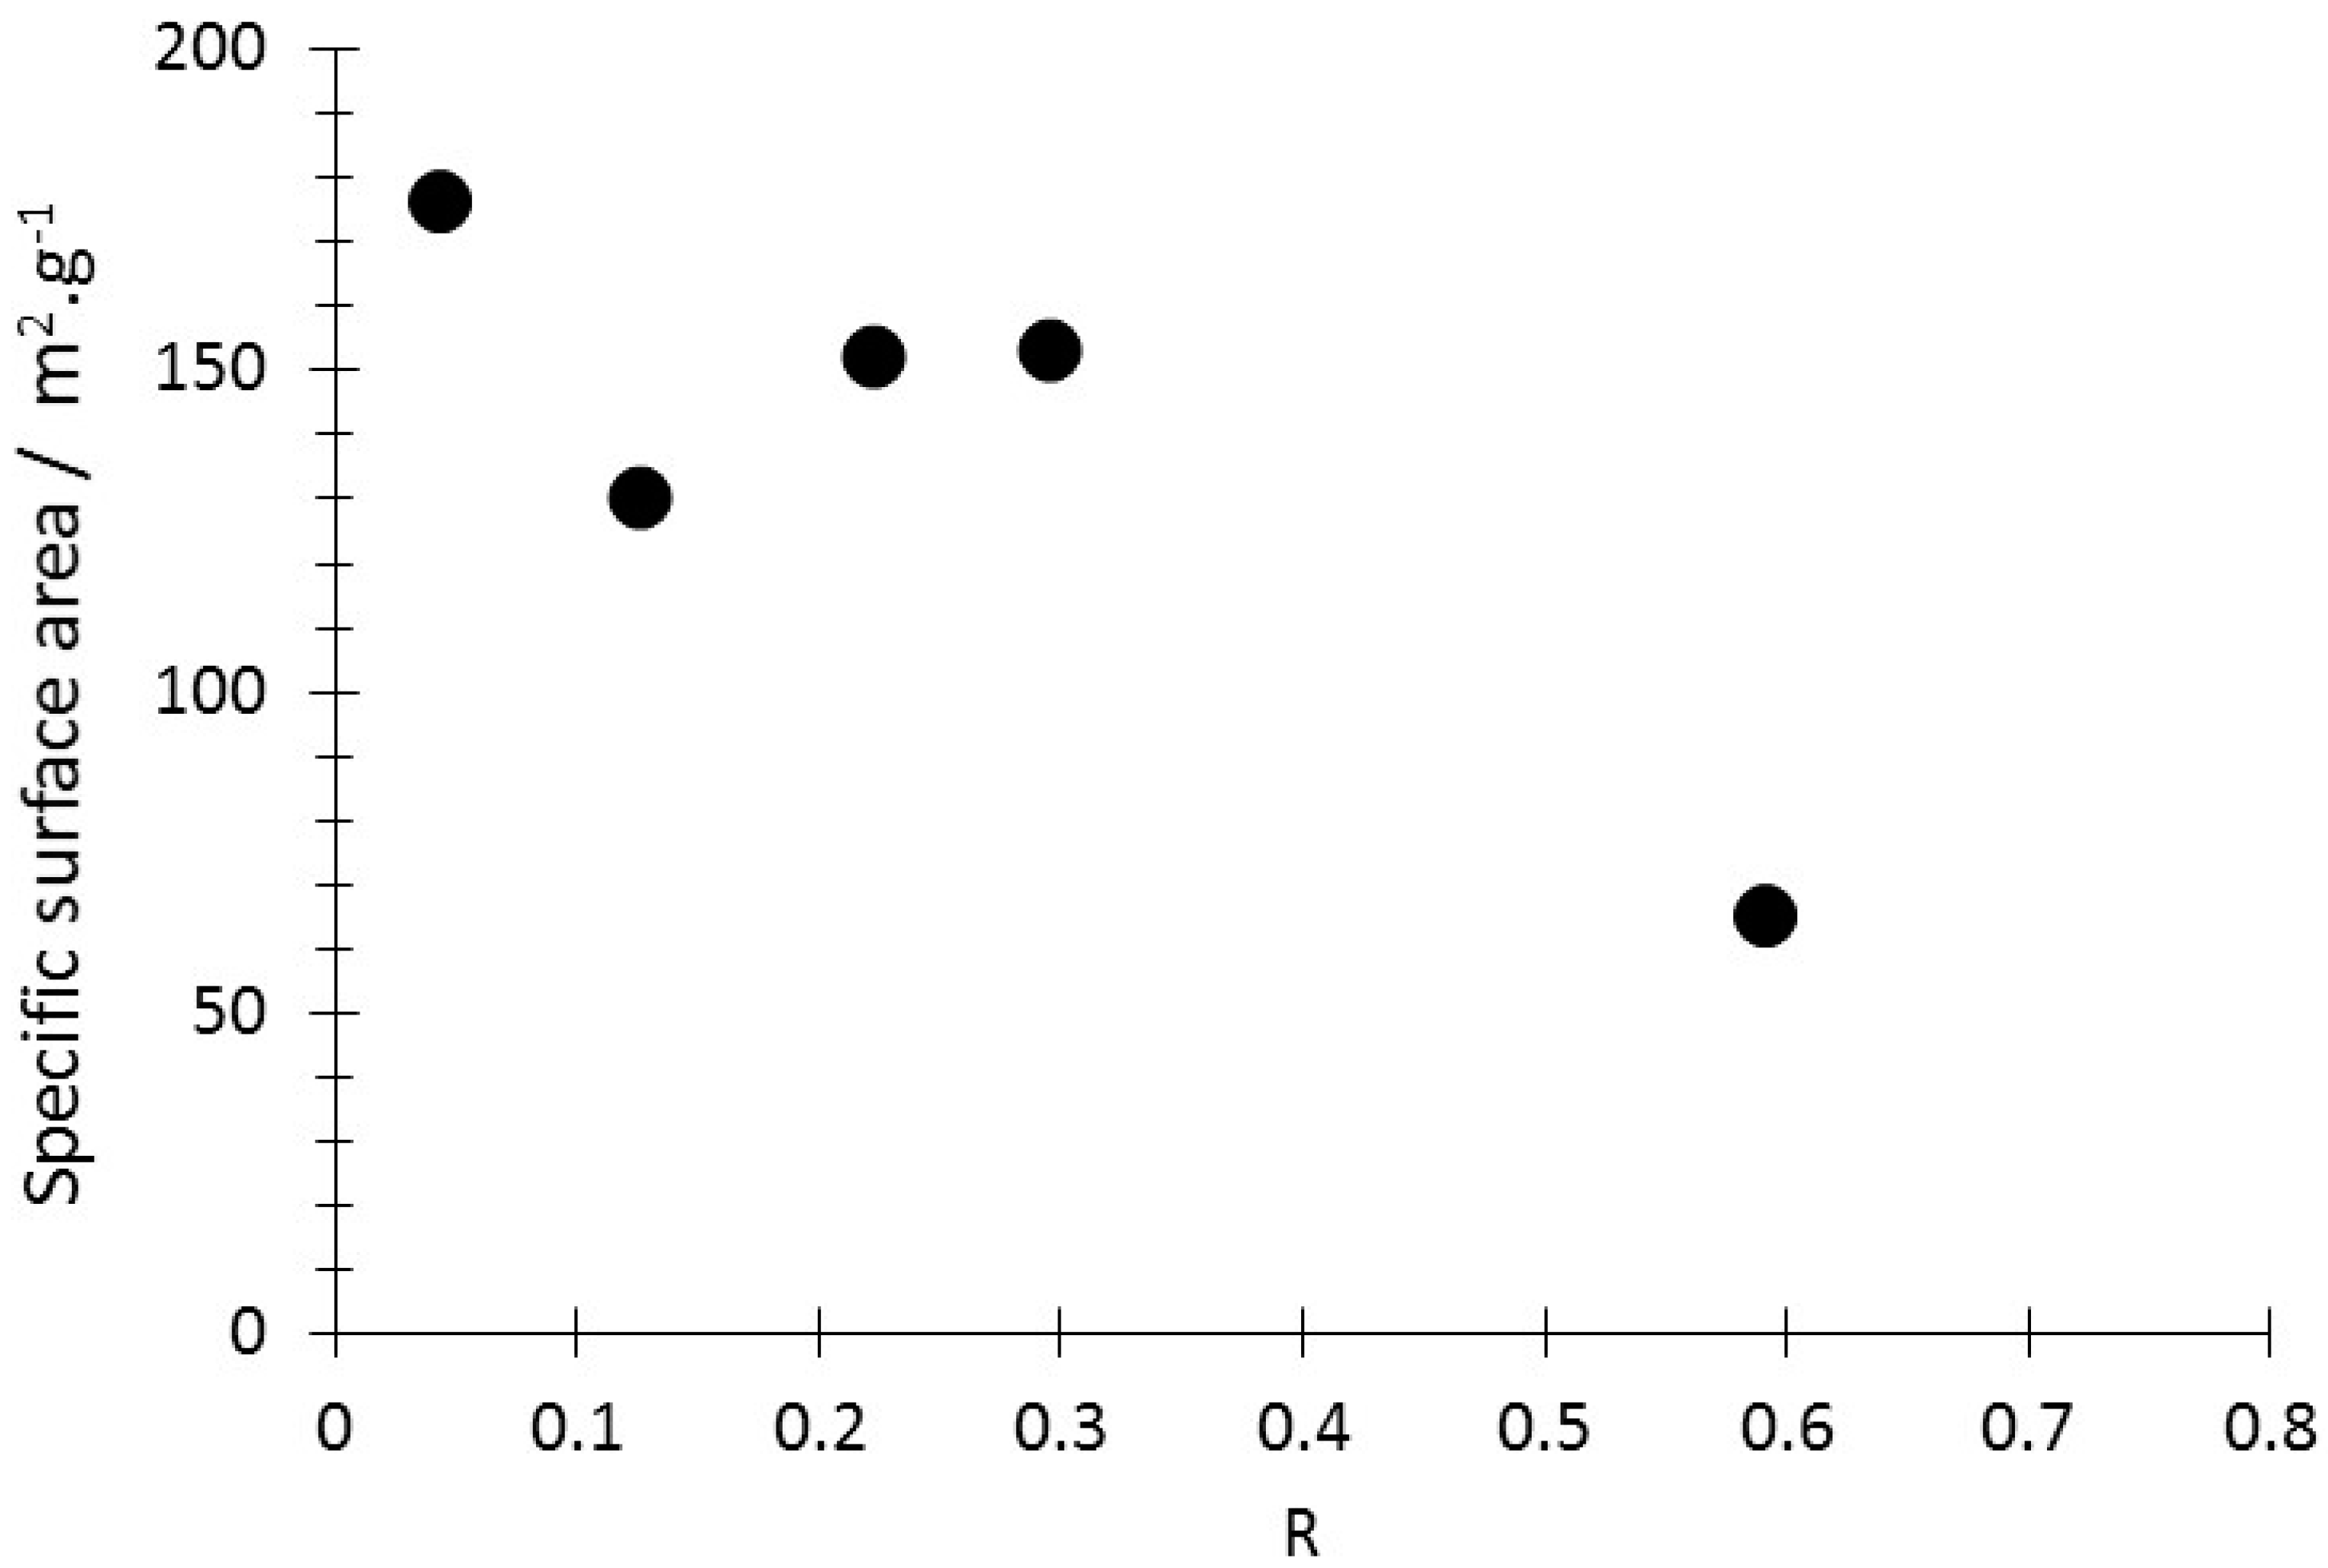
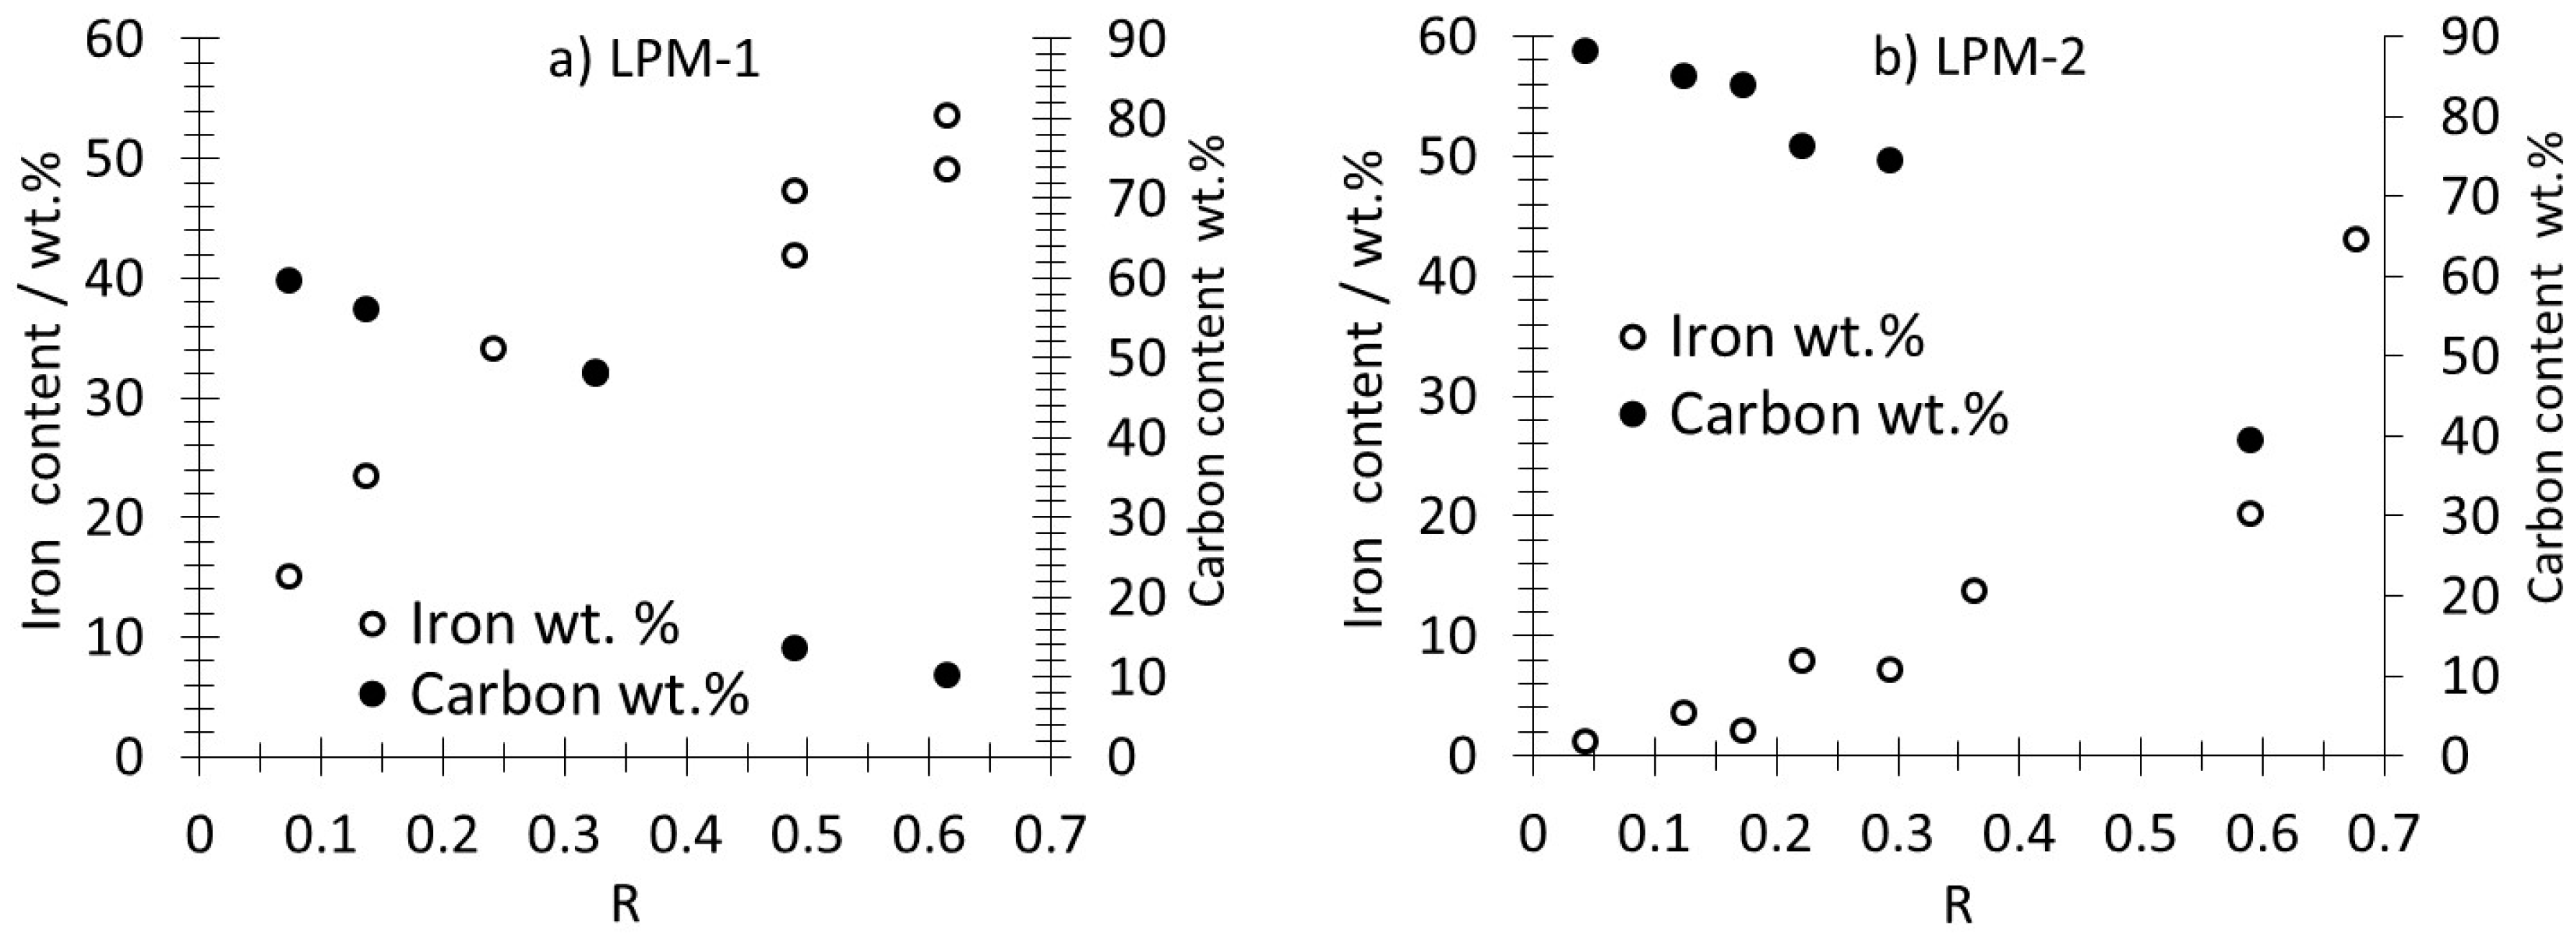
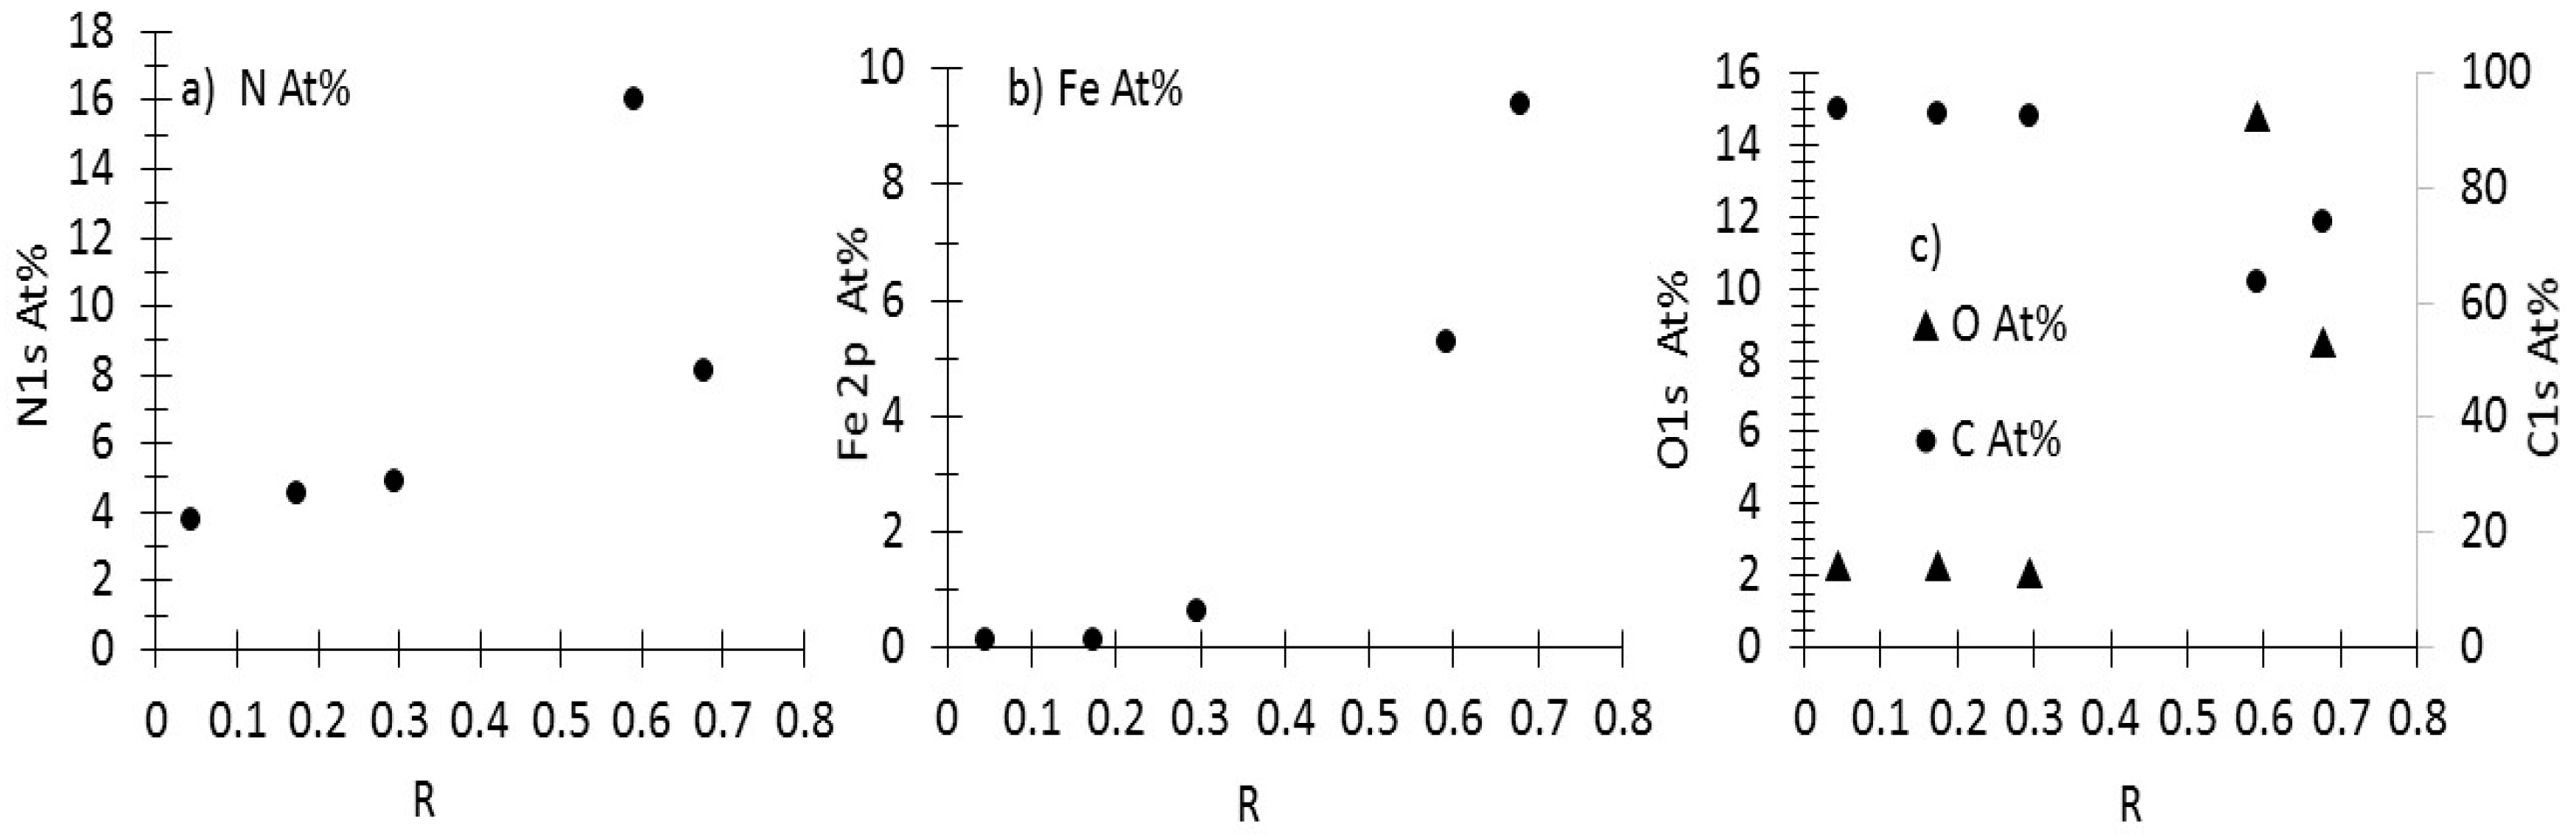
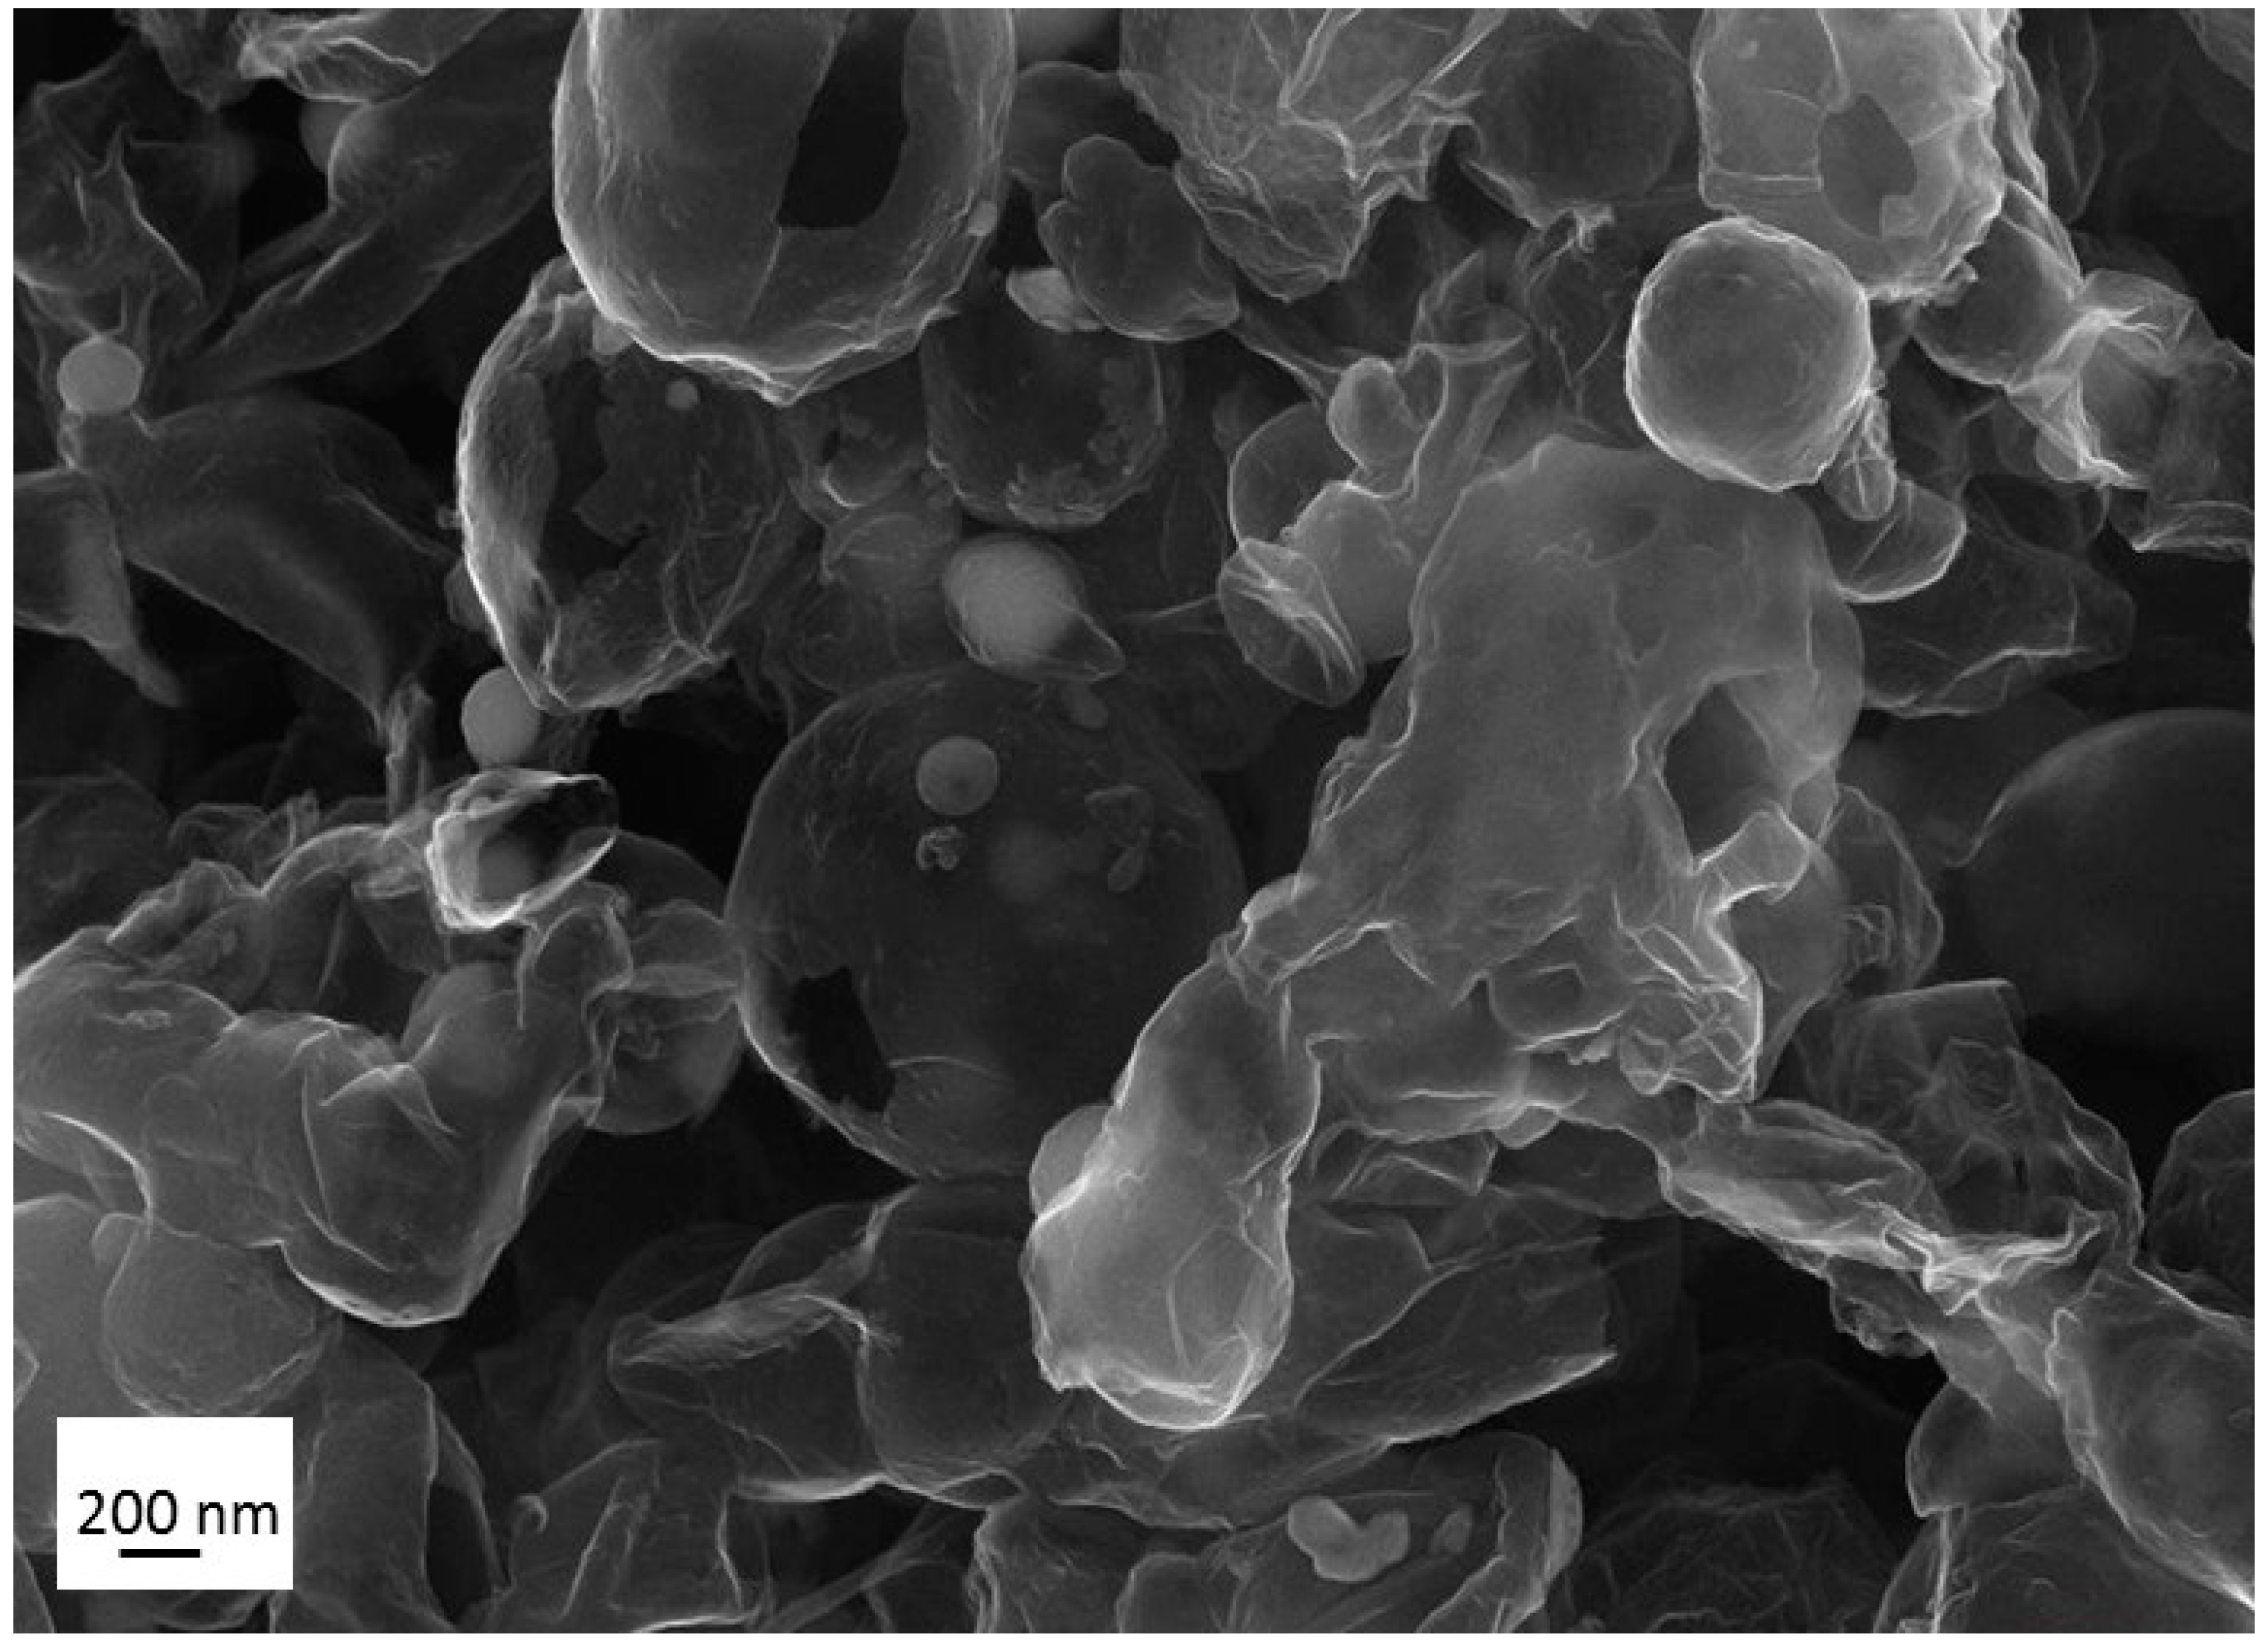
3.1. Production, Morphology and Composition Data of the Materials as a Function of R

A scheme of the experimental set up is shown in Figure 1. It consists in the aerosol generator device (pyrosol®) filled with liquid precursor medium connected to the CO2 laser pyrolysis reactor. Such generator usually produces droplets sizes in the 2–10 µm range.
The aerosol obtained from the liquid precursor mixture is driven by argon as carrier gas and is further mixed with ammoniac. It is important to note that in this configuration, even if the NH3 flow does not directly take part to the aerosol extraction from the generator, it contributes to the total gas flow once mixed into the mainstream in the nozzle. This means that increasing NH3 flow will accelerate the droplets velocity out of the nozzle and thus decrease their residence time in the laser irradiated zone. The reactor is kept to a pressure of 740 Torr by pumping through a pressure regulating valve and microporous filters (not shown on Figure 1) where the products are collected. All the gas flows are controlled by mass flowmeters. This allows parameter R defined by Equation (1) to be set and varied over a controlled range.
R = NH3 flow/(NH3 flow + Ar flow)
This R parameter is expected to have a strong influence on the synthesis, as NH3 flow modification will consequently affect three main parameters of the reaction. First, as previously mentioned, it will change the reaction duration through residence time modification. It will also affect the temperature by changing the amount of absorbed laser power (i.e., the amount of energy available for the thermal reaction). Last but not least, it will also modify the chemical composition of the precursor mixture in the reaction. For example, from R = 0.61 to 0.04 the residence time increases by a factor ≈2 and the laser power absorption decreases by a factor ≈5 while the NH3 concentration in reaction media strongly decreases.
Several syntheses were thus conducted using for each liquid precursor mixture different R values. The powders were black and more or less sticky for the different syntheses, because of the generation, upon pyrolysis, of side products consisting in low molecular weight organics. To get rid of these side products, the collected powders were washed with acetone using a Soxlhet extractor.
The amount of liquid precursor mixture was weighted before and after the end of the synthesis in order to determine the precursor consumed mass. Then, taking into account the weight of washed collected powders, chemical yield was estimated. Figure 2 reports the trends observed for this chemical yield as a function of R for both FeOOH (LPM-1) and Fe(acac)3 (LPM-2) precursor systems. It is seen that chemical yields are ranging from 0.15% to ≈ 5% and that the higher R the lower the yield.
The powders were systematically characterized by Scanning Electron Microscopy (SEM) and to a lesser extent by Transmission Electron Microscopy (TEM). The most important changes in the morphology of the nanomaterials were found for those produced from LPM-1. As shown in Figure 3, modification of the R parameter resulted in strong modification of the particle sizes.
For high values of R (0.61, Figure 3a) the nanomaterial contains large particles which appear bright on the micrograph, with diameters ranging from ≈1 µm to few hundreds of nanometres. The material also contains smaller particles but it was impossible to estimate the ratio between large and small particles populations. Energy Dispersive X-ray analysis (EDX) achieved on large particles showed that they consist of an iron rich phase. It has been known for a long time that iron acts as a catalyst for hydrocarbon decomposition and in graphitization processes [24]. Consistently, the micrograph (Figure 3a) shows that some of the iron based particles are surrounded by a thin layer presumably based on carbon that could be the result of such catalytic effect.
Elongated structures of these latter layers are also clearly seen in some part of the sample, with a particle sometimes located at the extremity. These observations suggest, at least partially, a growth phenomenon of carbon based films from the iron-based particles. Finally, it is worth pointing that the morphology of the iron-based particles is completely different from that of the initial FeOOH rod-shaped nanoparticle (Figure 3c). This illustrates the strong transformation of these latter during the process.
For low R values (Figure 3b, R = 0.14) the powder is mostly made of much smaller particles with a diameter of few tens of nm, what is confirmed by TEM (Figure 3c). It is worth noting that the TEM micrograph can be compared to Figure 3a assuming that dark spots seen in Figure 3c are iron based nanoparticles surrounded by a carbon component. Intermediate values of R lead to intermediate situations with the formation of a mixture of large and small nanoparticles.
When LPM-2 was used, the trends in the morphology of the materials as a function of R were not as marked as for FeOOH iron precursor. Indeed, in this case large particles are scarce. Specific area was recorded for some of the materials obtained from Fe(acac)3 precursor as a function of R. The decrease of the specific surface area with R value (Figure 4) suggests a similar trend as the one observed for materials obtained from FeOOH, that is, the lower R the smaller the particles.
Due to low chemical yield, an important part of the samples synthesized in this work was produced in very tiny amounts, limiting the variety of achievable characterization. Therefore, regarding bulk composition investigation, we chose to determine in priority iron and carbon contents. Figure 5 reports the data obtained with each liquid precursor mixture as a function of R.
It is seen that the higher the R parameter the higher the iron content, while the carbon content exhibits the reverse trend (the higher R the lower the carbon content). As expected, the sum of carbon and iron wt % content is not 100%, since both nitrogen and oxygen are possibly incorporated in the nanomaterials what will be confirmed by XPS analysis (Section 3.3). The next section addresses the difficult question of the nature of the iron phases formed during laser pyrolysis.

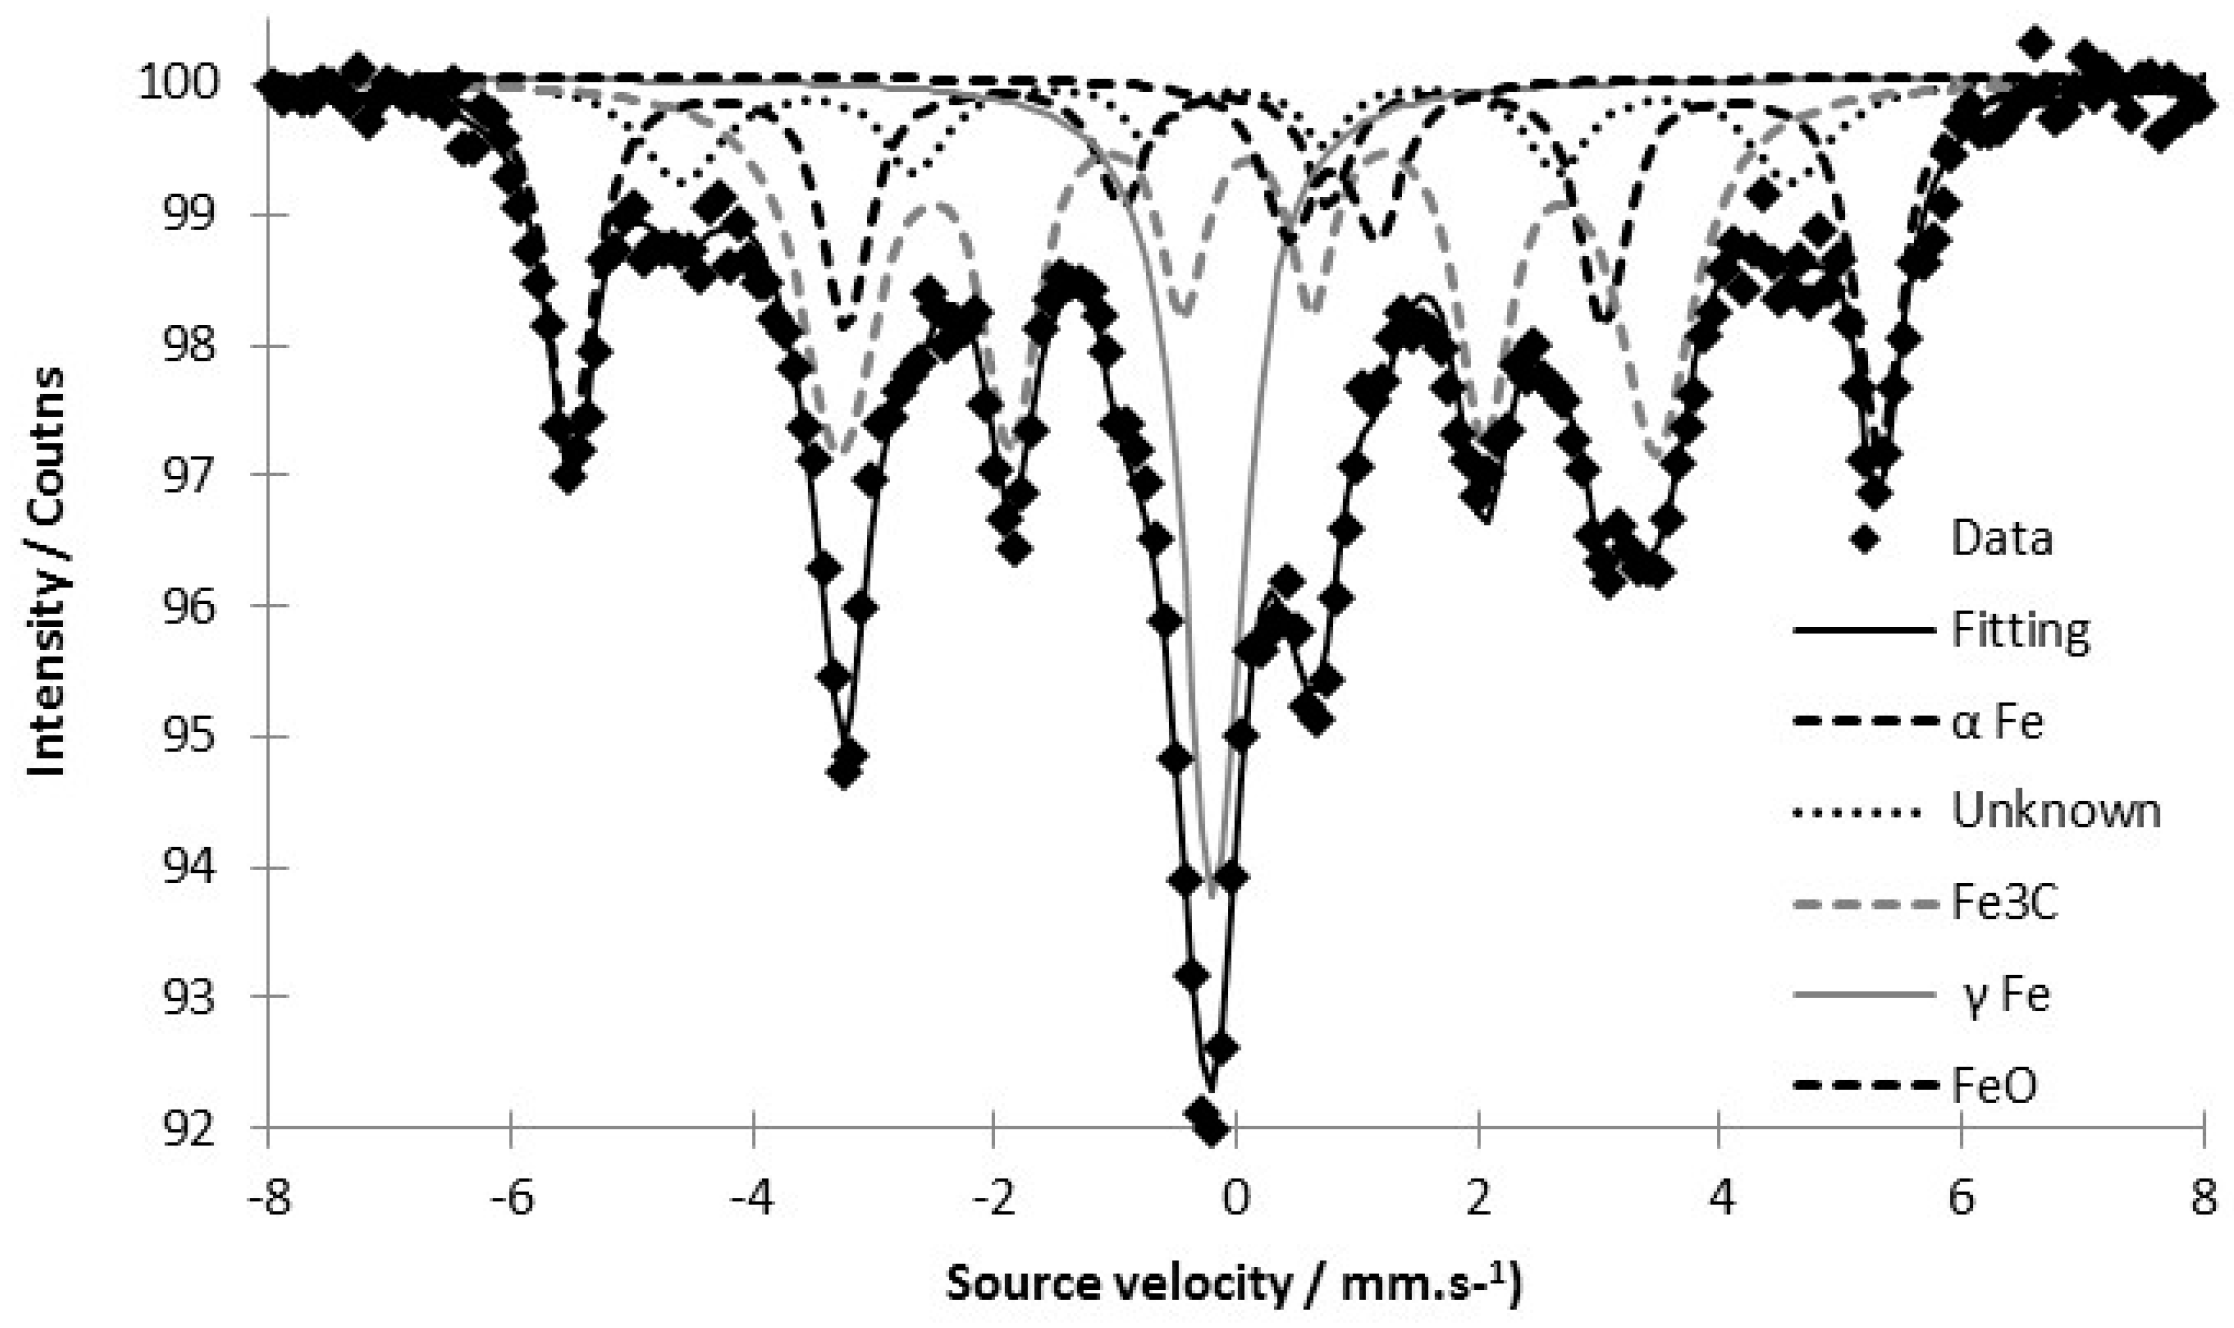
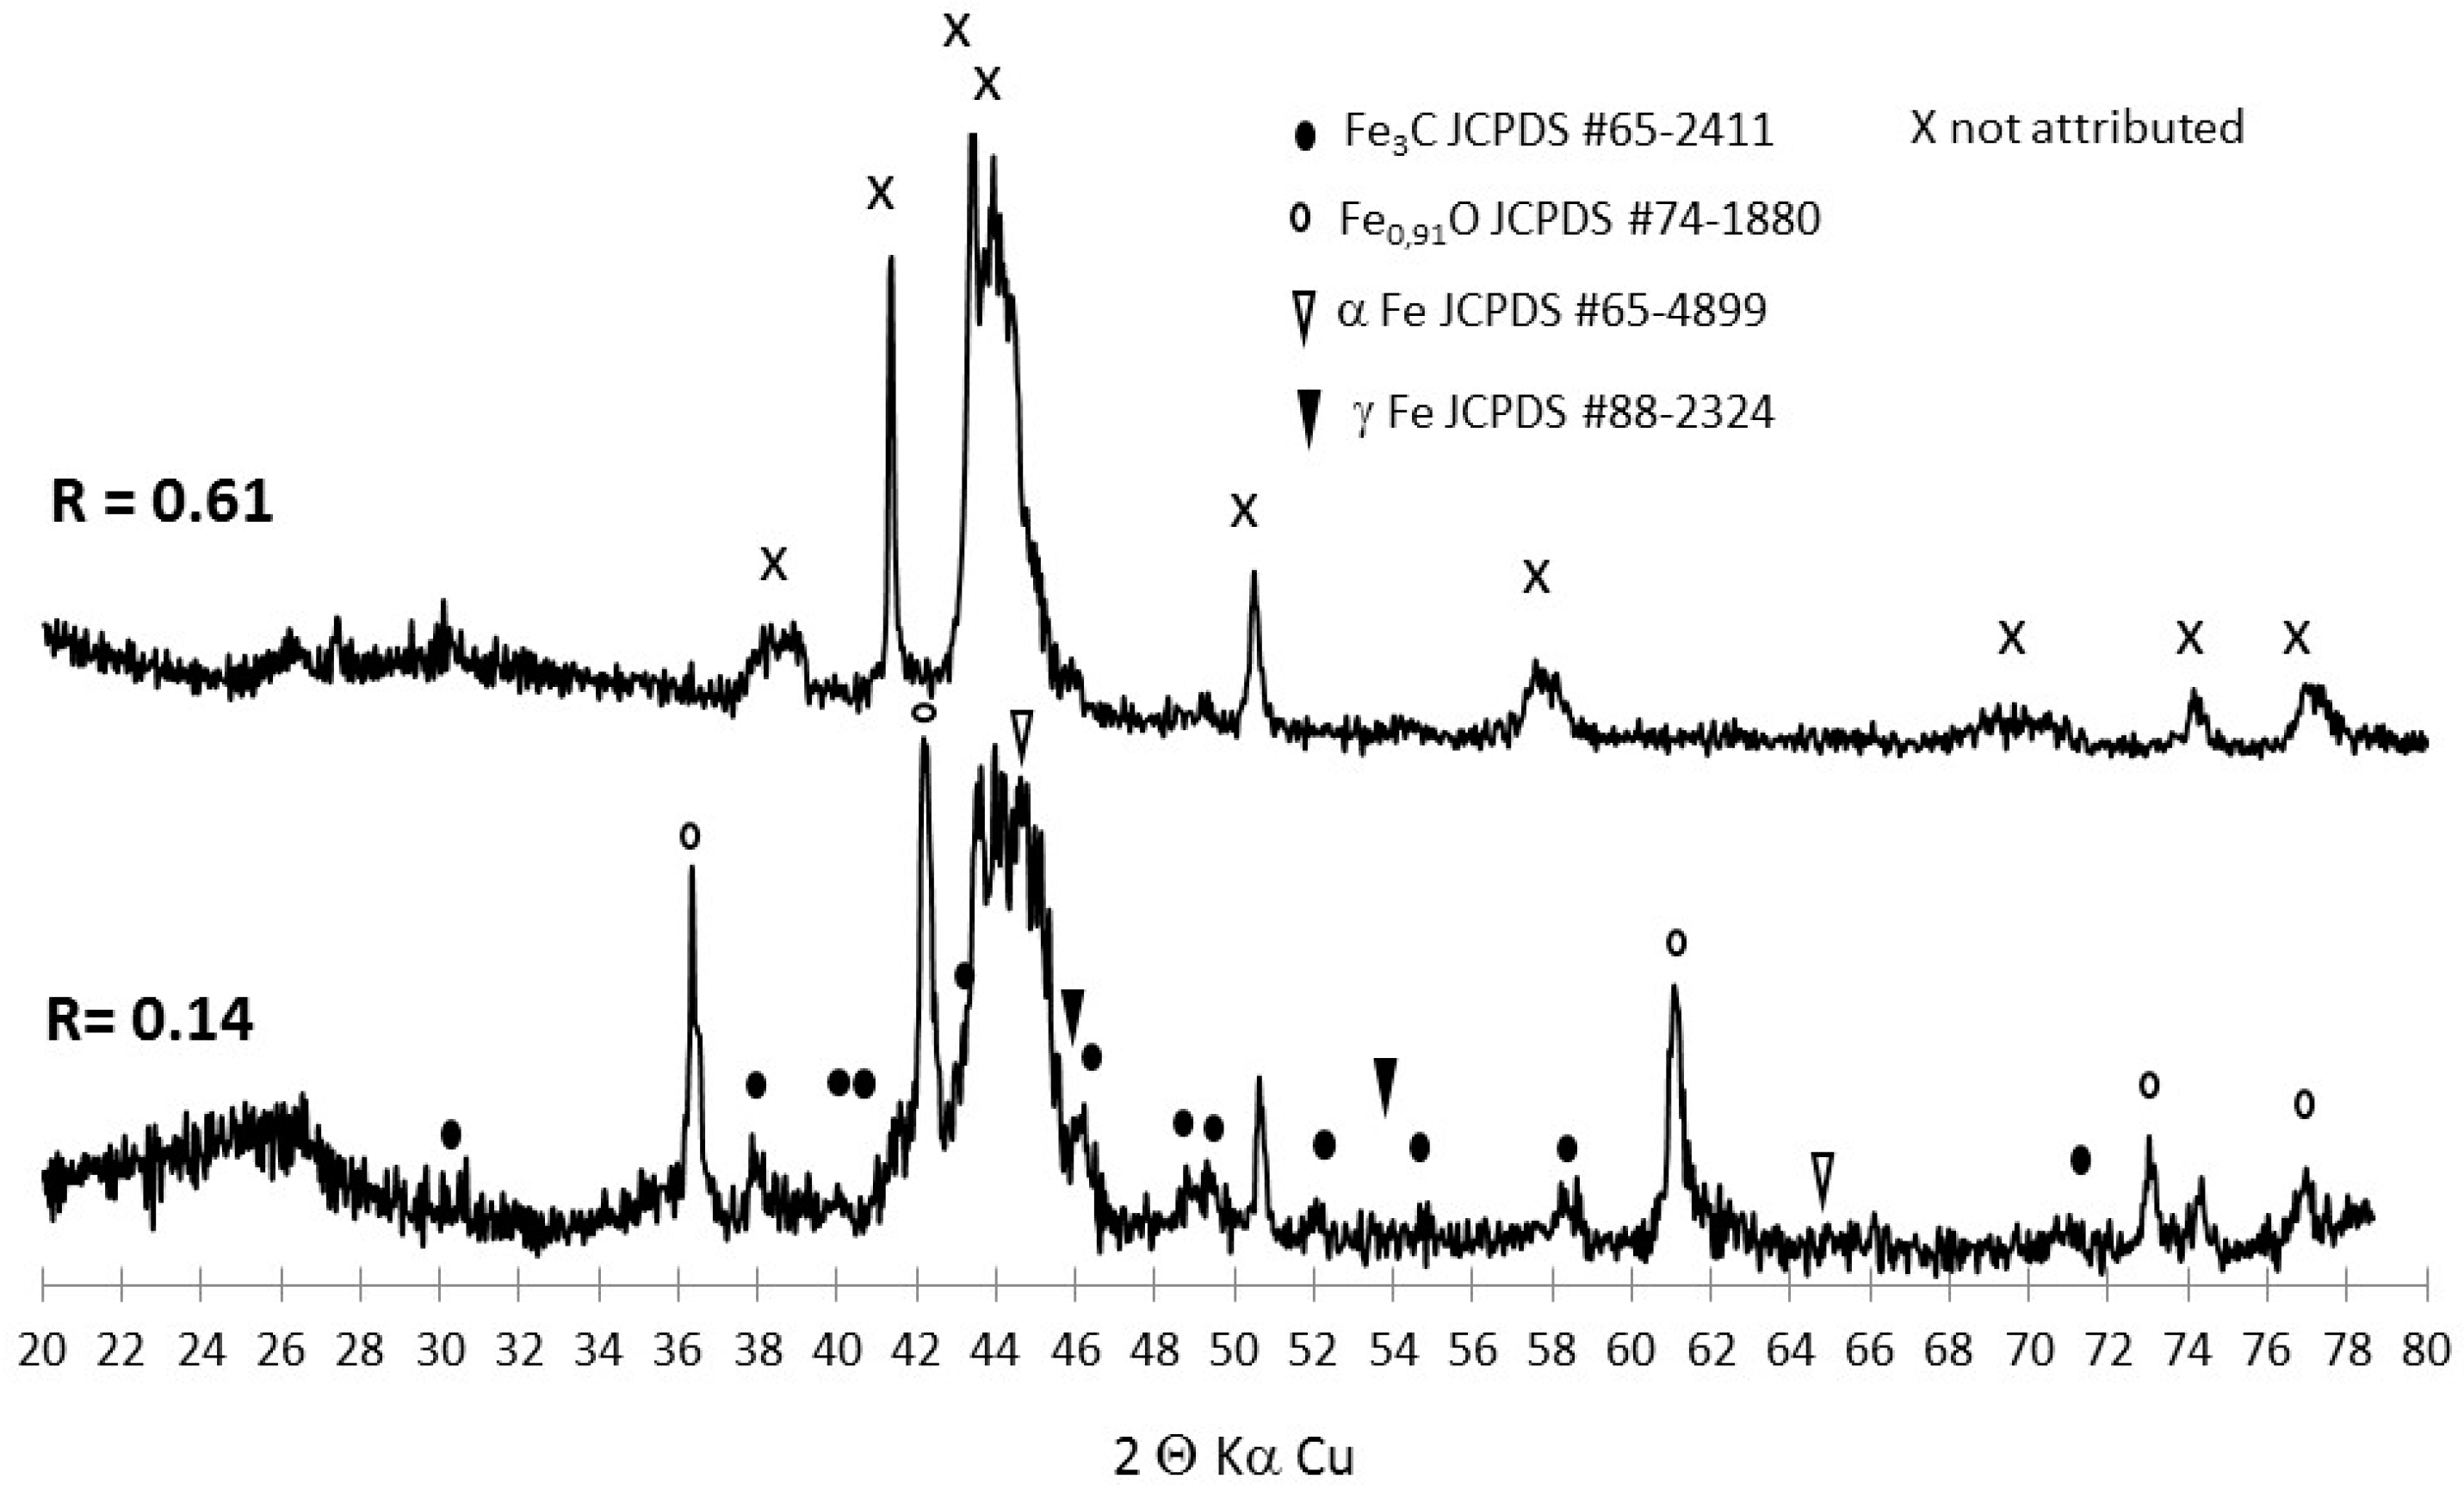
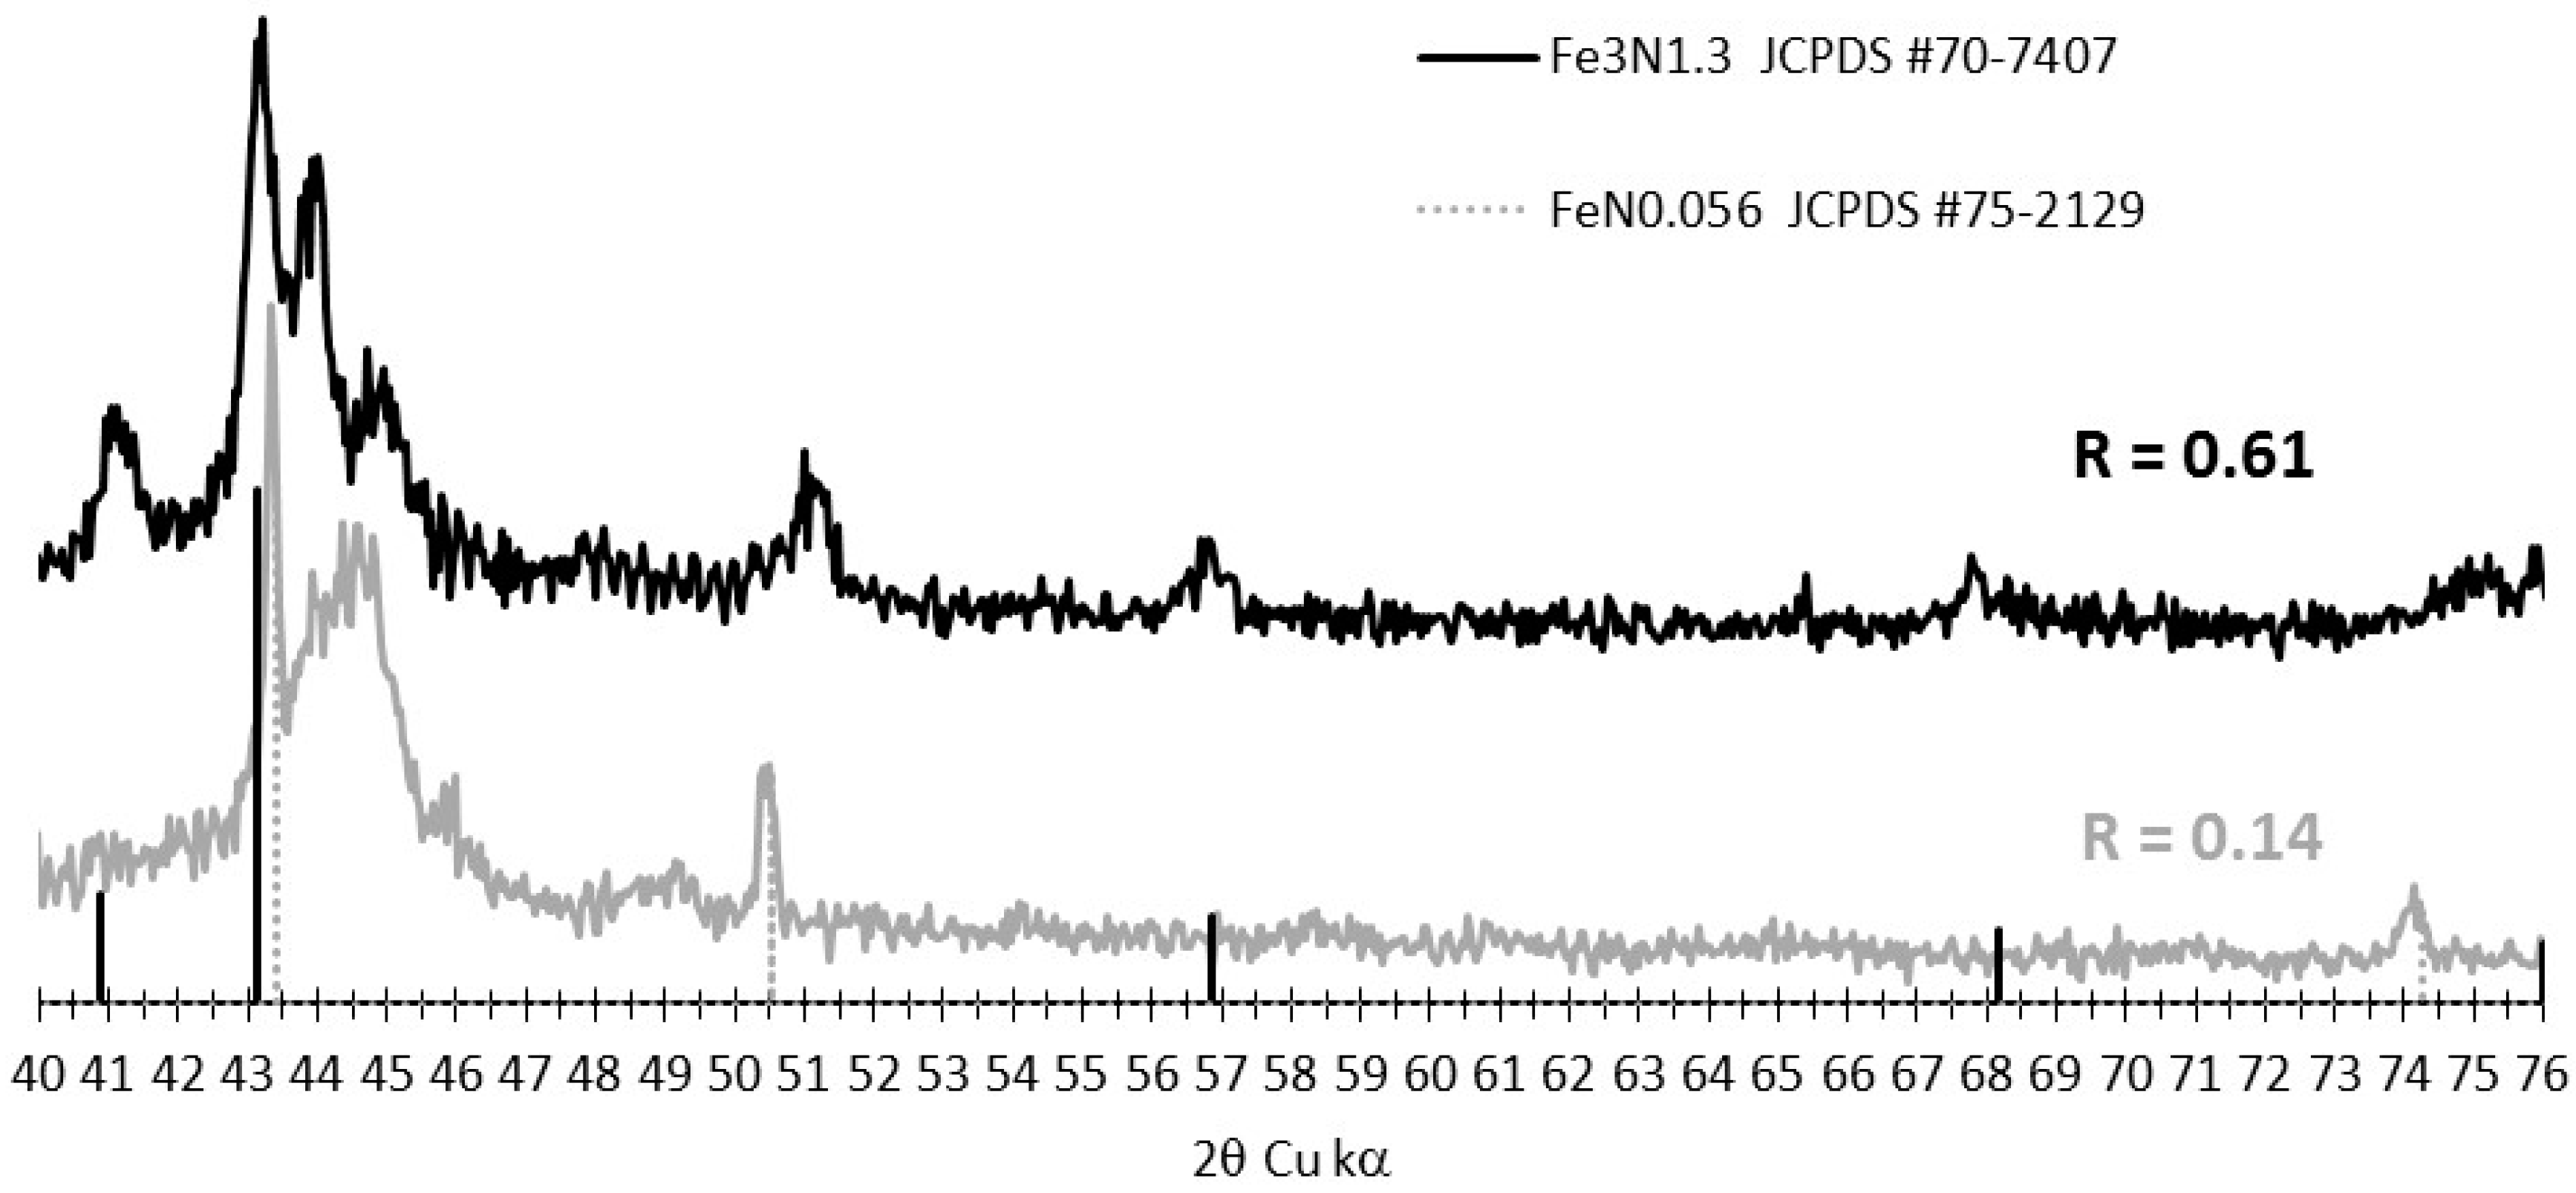
3.2. Tracking the Nature of the Iron Phases
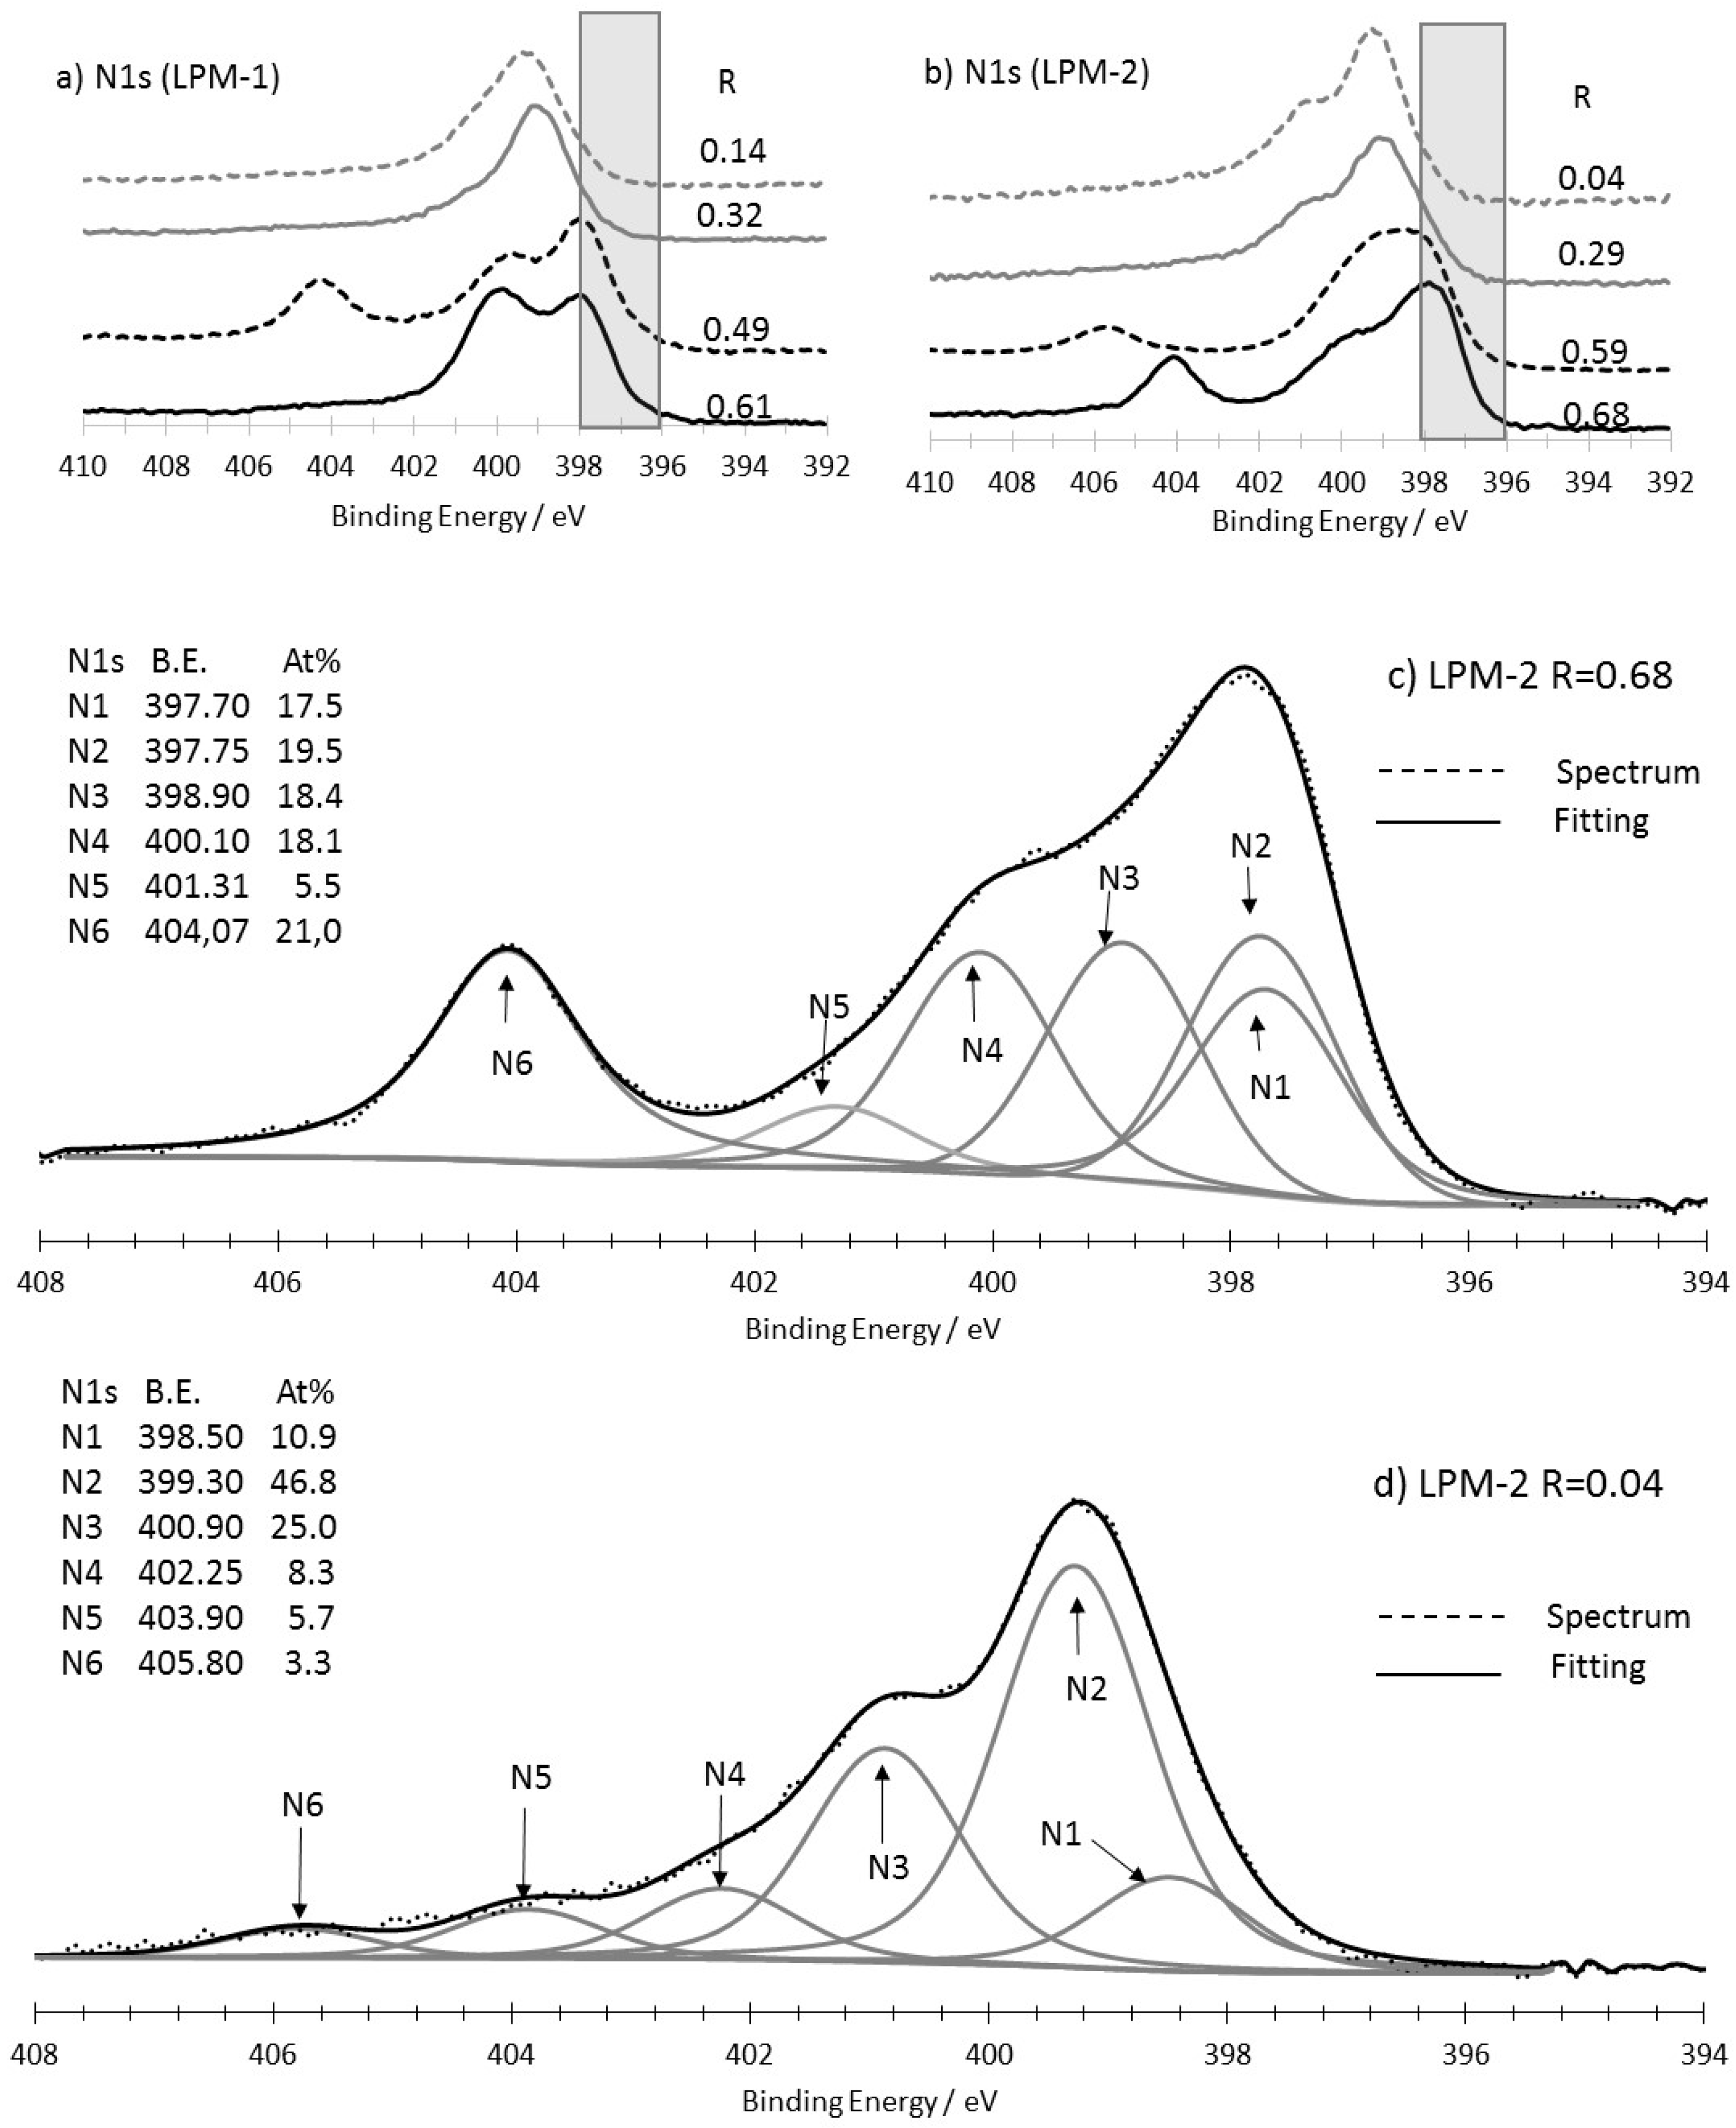
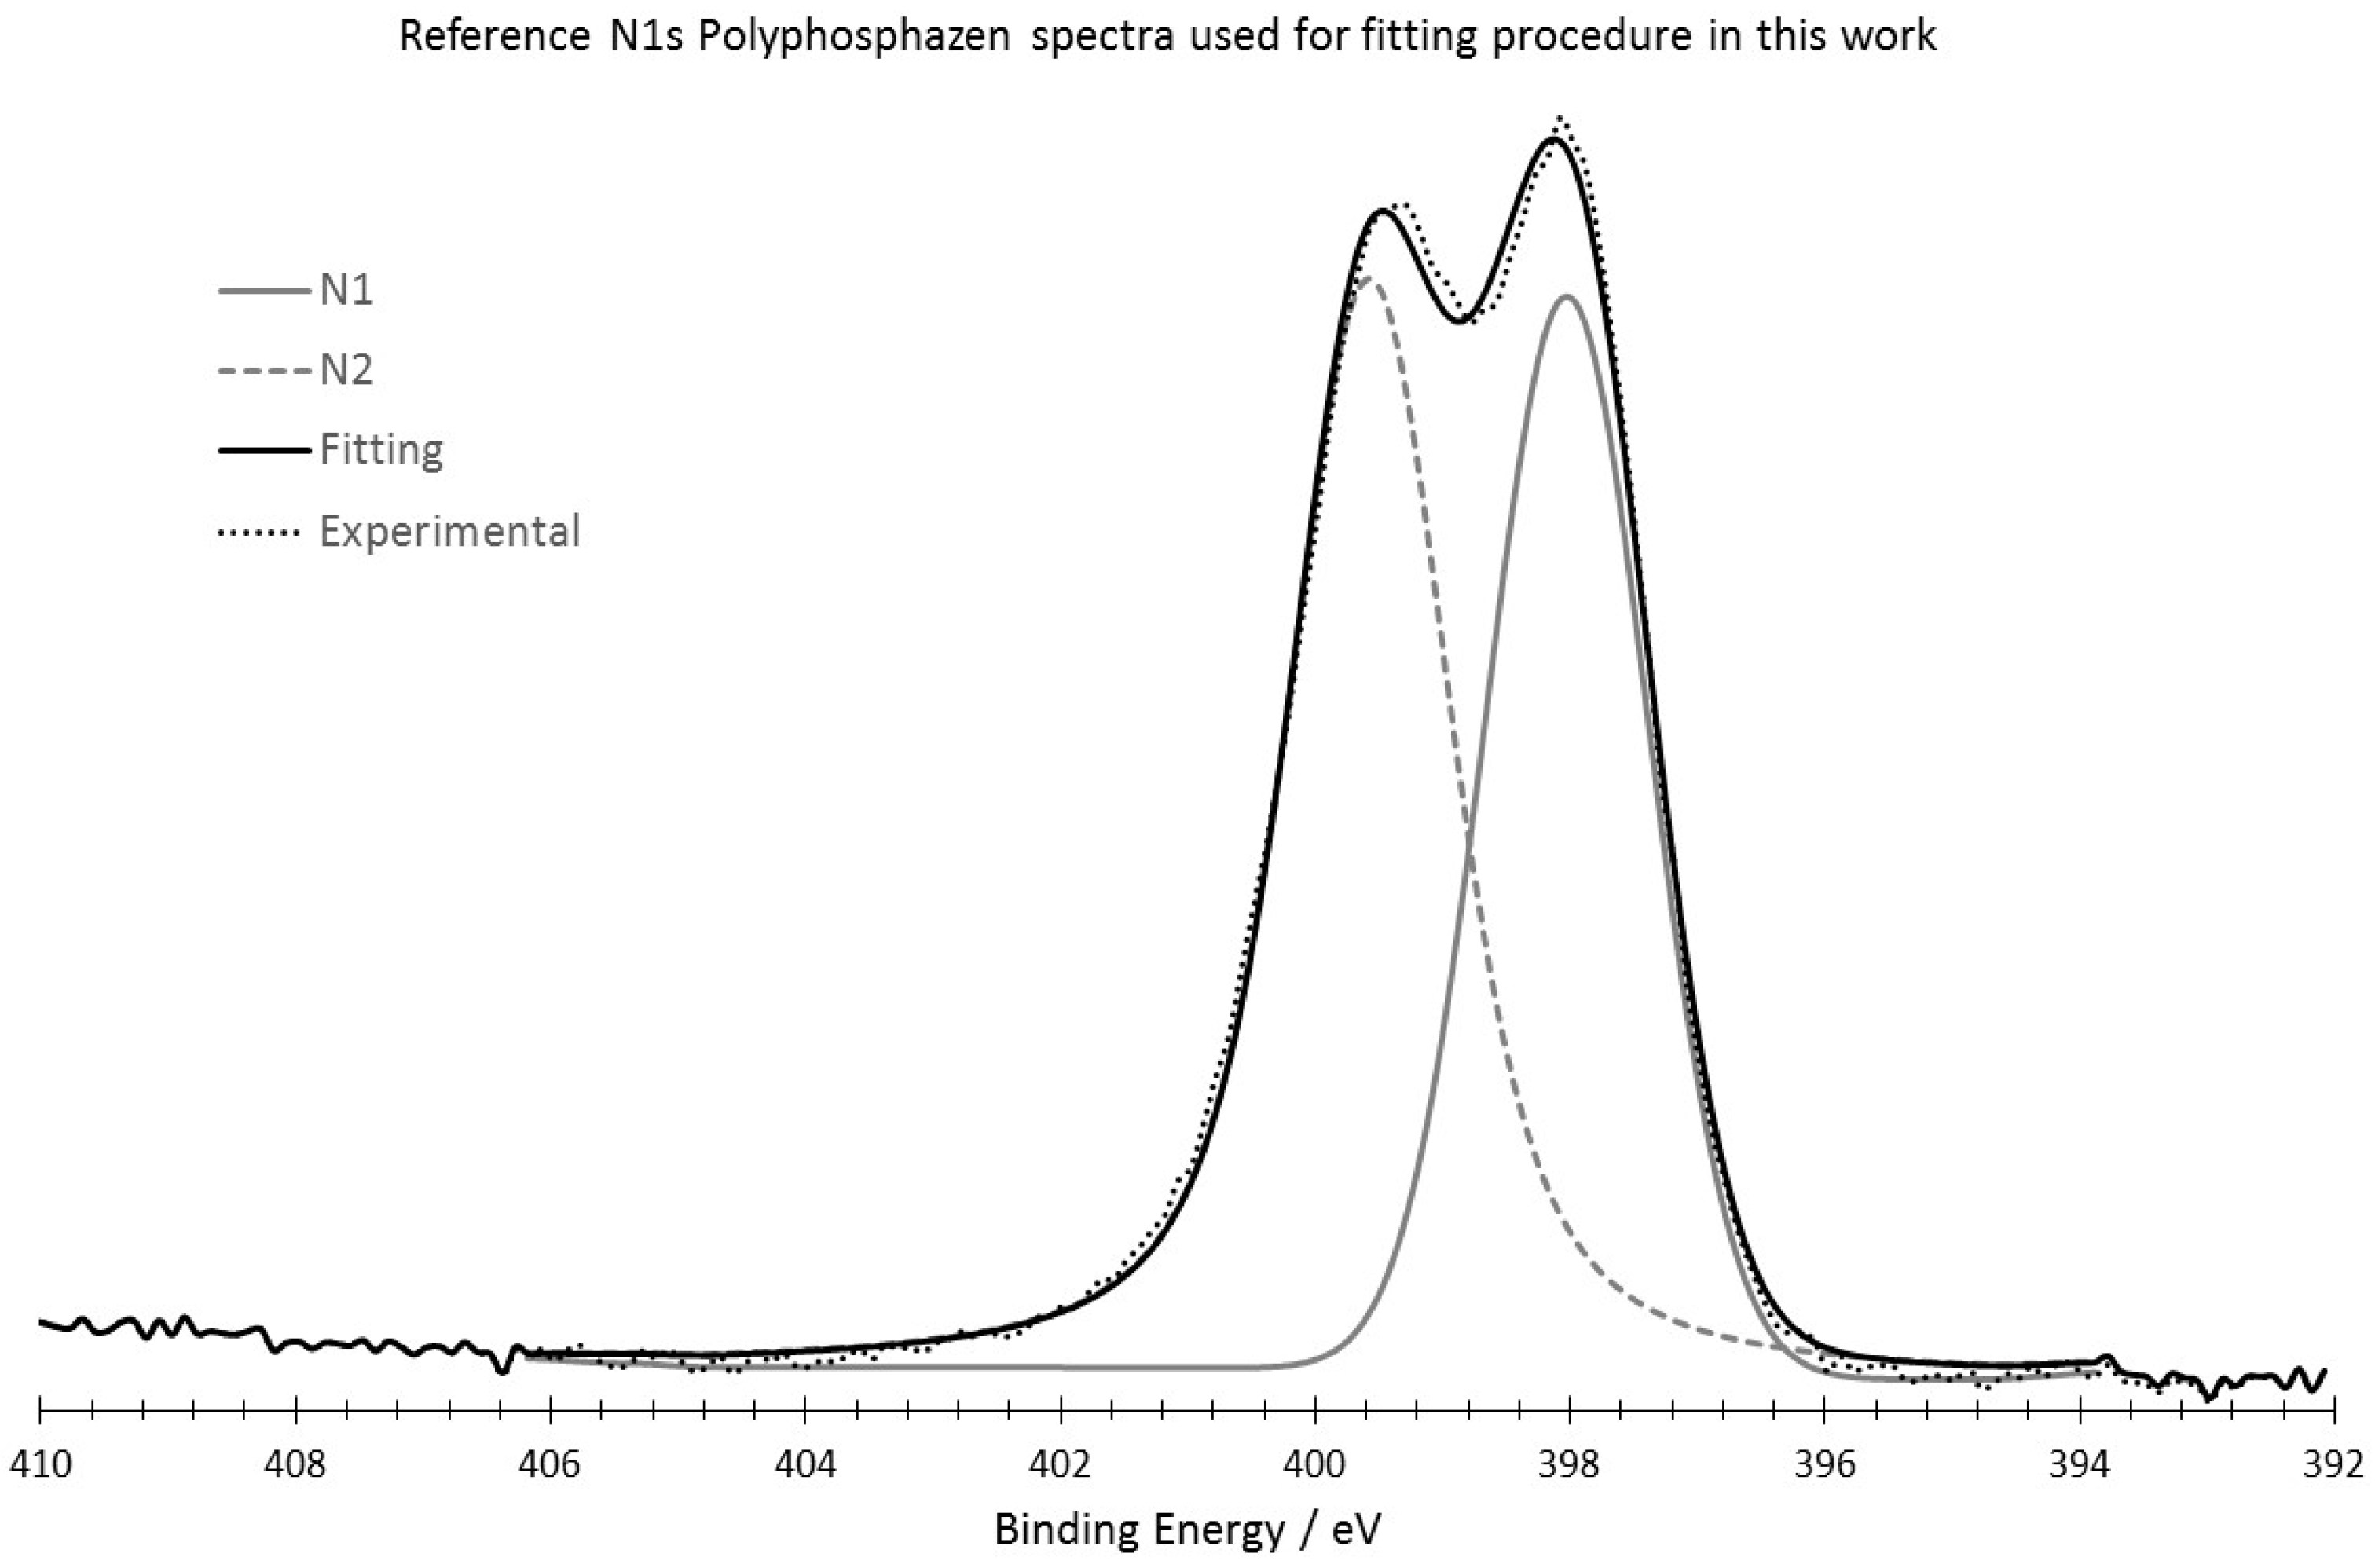
As explained above, all the nanomaterials contain iron and the question about the nature of the formed iron phases raised. Taking into account the elements involved in the synthesis (Fe, C, N, O), the number of possible iron phases is very high: pure metal iron, iron carbides, iron oxides, iron nitrides, carbo-oxynitrides. The task is even more complicated since several phases show different stoichiometry and non-stoichiometric ones are numerous, in particular for iron nitrides. Mossbauer spectroscopy and XRD measurements were performed in an attempt to get insights on these iron phases. This was achieved essentially on powders obtained from FeOOH since they have higher iron content, what favours Mossbauer analysis and contain larger particles what may favour XRD analysis by avoiding too broadly overlapped diffraction peaks. An example of Mossbauer spectra fitting is shown in Figure 6. It was performed with clearly identified phases, namely α Fe, γ Fe, Fe3C and possibly FeO. An additional component was added to refine fitting, which could not be ascribed at this time. Although incomplete, the results obtained here are precious since they allow three iron phases (α Fe, γ Fe, Fe3C) to be identified and suggest the presence of a fourth one (FeO). The relative phase content was estimated on the basis of fitting and showed a variable amount of unknown phase as a function of R parameter (see Appendix A for details on Mossbauer spectroscopy data).
XRD was then recorded on powders. It is well known that information provided by XRD analysis might be limited by poor crystallization and small crystallite size, which broaden diffraction peaks. It is worth noting that materials obtained from LPM-2 gave XRD patterns with no clearly defined peak, completely impeding phase identification. Therefore, the XRD data relate here to materials obtained from LPM-1. Figure 7 shows two XRD patterns recorded on powders synthesized with high and low R values. Iron phases identified by Mossbauer spectroscopy are reported on these diagrams for comparison sake. These data are not easy to exploit but comparison of both patterns shows that the regions centred at 2θ ≈ 44° are different from each other. Also, the high R pattern exhibits additional unattributed peaks. The modification observed in the XRD pattern at high R cannot be easily attributed to a given phase but such synthesis conditions clearly favours nitride formation. Indeed, among the diverse synthesis routes leading to nitrides, high temperature treatment of iron precursors under NH3 or under a N2/H2 mixture is widespread [25]. In our case, higher concentration of NH3 provides a more nitriding atmosphere and also increases the temperature through CO2 laser absorption.

3.3. XPS Analysis

3.3.1. As-Prepared Materials

The XPS analysis was performed on the materials prepared from both iron precursors (LPM-1 and LMP-2). N1s, Fe2p, C1s and O1s core levels were detected in all survey spectra and semi quantitative analysis was conducted. It is worth pointing that analysis performed in different regions of the same sample gave identical data thus ensuring that the XPS analysis reflects nanoparticle feature. The gold deposited on the supporting carbon felt was most often not detected on the survey spectra thus indicating that photoelectron collection originates from the material itself and not from the carbon felt. Later on, the analysis is focused on the N1s core level spectra and semi-quantitative analysis trends. Figure 8a,b show the N1s spectra recorded with different R values for materials synthesized using LPM-1 and LPM-2. Each of the latter shows a similar marked trend as a function of R, that is, a marked drop in the intensity in the low N1s energy region of the spectra (396 eV–398 eV) when R decreases. The literature indicates that this low energy region corresponds to iron nitrides or nitrided iron surfaces [26,27,28,29]. For each material collection, the spectra recorded for low R are quite similar. In a same way, the ones recorded for high R values appear similar as well, although less markedly for LPM-2. Spectra corresponding to LPM-2 with R = 0.68 and R = 0.04 were selected as representative of their series and thus considered for tentative peak fitting (Figure 8c,d). The N1s XPS spectrum in carbon based materials such as nitrogen doped nanostructures [30,31], or simply chars generated from model molecules containing nitrogen [32,33], is mainly described as N-graphitic, N-pyridinic, pyrrole-like and oxidized nitrogen species. In the present work fitting was conducted with a peak Full Width at Half Maximum (FWHM) imposed and set at 1.5 eV. This choice was made using the fitting of the spectra of a reference compound consisting in a polyphosphazen polymer network with two kind of well-separated nitrogen atoms. This reference spectra (Appendix B) was recorded in the same experimental conditions as those used in this work. The fitting provides 6 components which are labelled from N1 to N6 and ranked in the order of increasing energy. For R = 0.68 (Figure 8c) it reveals two components N1 and N2 at low energy 397.70 and 397.75 eV corresponding to 37.0 at % of the total nitrogen atoms which lies in the binding energy range reported for iron-nitride species. N3 is found at 398.9 eV with 18.4 at % and falls in the energy range of pyridinic nitrogen. N4 is found at 400.1 eV and weighted 18.1 at %, it falls in the range of pyrrole-like nitrogen. The N5 component at 401.3 eV with 5.5 at % can be attributed to graphitic nitrogen. The last component N6 (404.7 eV/21.0 at %) corresponds to oxidized nitrogen [30,31,32,34].
The same fitting procedure performed for R = 0.04 does not result in a contribution which could be attributed to iron nitride since the N1 component is now centred at 398.5 eV (10.9 at %), while N2 appears at 399.3 eV (46.8 at %), N3 at 400.9 eV (25.0 at %) and N4 at 402.25 eV (8.0 at %). N5 and N6 appear now at 403.9 eV (5.7 at %) and 405.8 eV (3.3%), respectively. Therefore, N1 is now attributed to N-pyridine, N6 and N5 are still attributed to oxidized nitrogen although such a high binding energy for N6 (405.8 eV) can also be attributed to entrapped gaseous nitrogen [35]. The attribution of N2 (399.3 eV) component is more difficult, since nitrogen types such as those found in pyridone, amine, nitroso or nitrile may be found in this region [30,31,32,33,34,35,36]. However, N2 is also lying in the range of binding energy recognized for FeNx sites that correspond to nitrogen as a ligand for iron [37]. N3 located at 400.9 eV and weighted at 25 at % falls in the range of pyrrole-like nitrogen. N4 is now located at 402.25 eV and falls in a binding energy region being attributed possibly to N–O type species [38], while graphitic nitrogen is also proposed as possible [32,37,38,39].
Finally the main points suggested by the tentative peak fitting is that at high R iron nitride could be present in significant amount (37.0 at %), as well as pyridinic nitrogen (18.4%). Graphitic nitrogen content is about 5.5 at %. In contrast at low R, no iron nitride can be found. The pyridinic nitrogen content is only 10.9 at %. The major contribution is clearly seen at 399.3 eV, in an energy range close to those reported for FeNx sites but which can also correspond to amines, nitriles or nitroso nitrogen atoms. The attribution of one of the components to graphitic nitrogen is unclear.
The N1s spectra shown in Figure 8 and tentative peak fitting suggest that nitrided iron is possibly formed when high R values are used. This point actually appears reinforced by semi-quantitative analysis results (Figure 9).
Indeed, elements contents for N1s, Fe2p, C1s and O1s were drawn as a function of R parameter and showed marked trends: N and iron contents increase with R (Figure 9a,b) while carbon and oxygen contents show reverse trend from each other (Figure 9c), that is, oxygen content increases and carbon content decreases with higher R. Data in Figure 9 relate to materials synthesized with Fe(acac)3 (LMP-2) but the observed trends for powders derived from LPM-1 are similar.
It is worth noting that for iron and carbon, surface analysis and bulk analysis show the same trends as a function of R. Finally, the assumption suggested in the previous section seems reinforced by the surface analysis results, that is, the formation to some extent of an iron phase containing nitrogen at high ammonia fraction. The oxygen content increases with R while carbon content decreases. The reason for this might be surface oxidation of iron-based particles not (or only partially) covered by carbon, especially in powders where nitrogen is assumed to be significantly combined with iron. In an attempt to get additional information on the nature of the iron phase formed during the process, acid leaching treatments were performed with sulfuric acid.

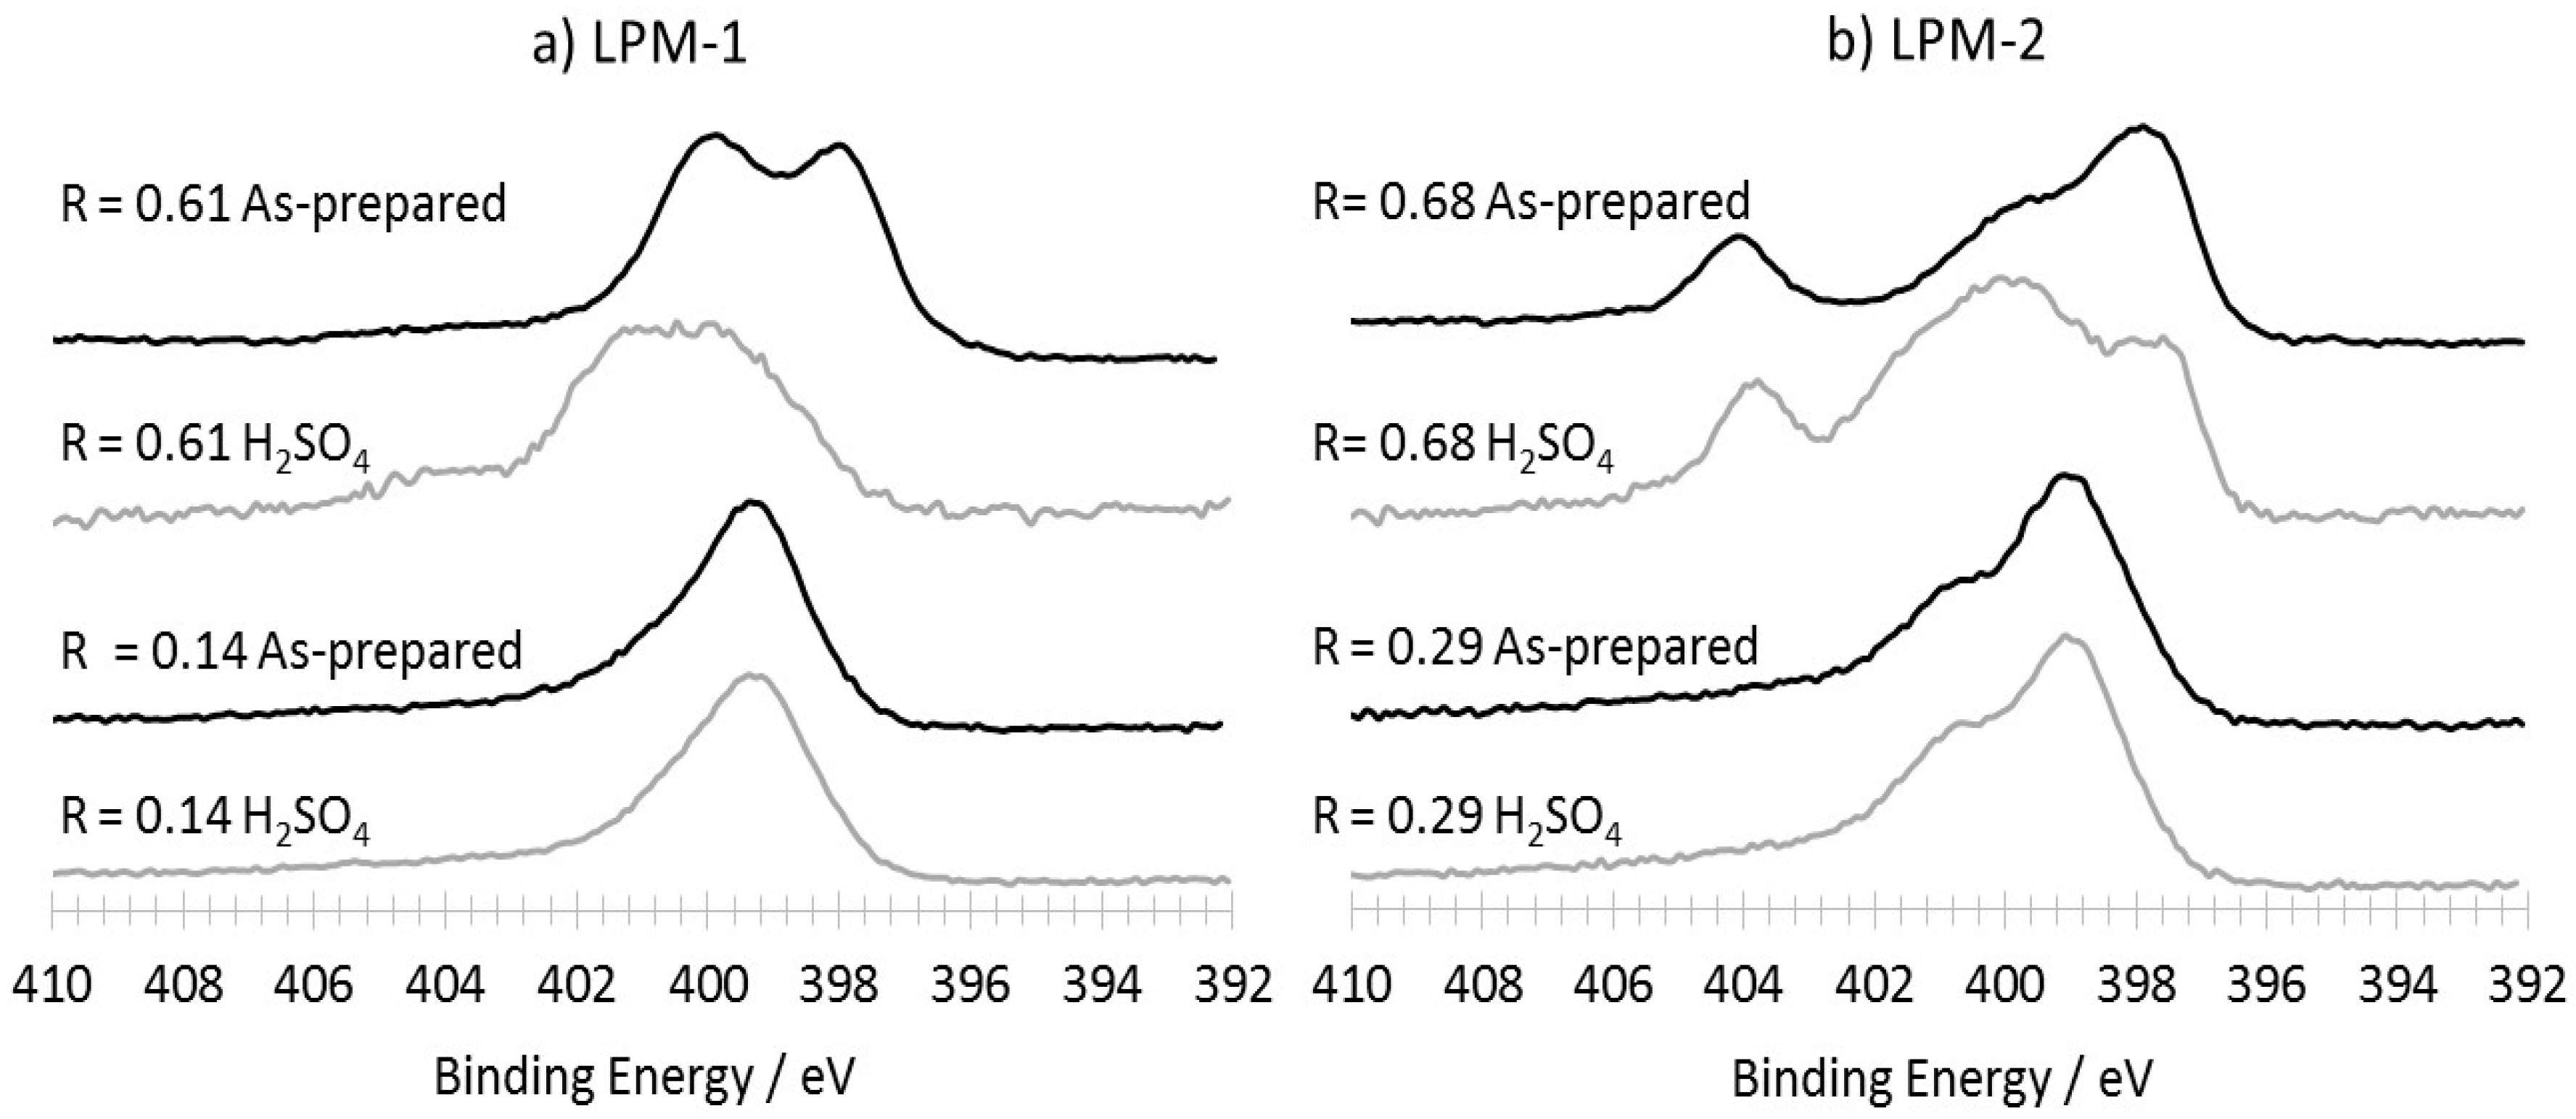
3.3.2. Characterization of the Materials Obtained from LPM-1 after Acidic Treatment

Acidic treatments (24 h in 1 M H2SO4) were performed on some of the powders obtained from LMP-1 and XRD pattern was subsequently recorded (Figure 10).
For the highest R value, the iron nitride Fe3N1.3 is present while for lowest R value the low nitrogen content phase FeN0.056 is identified. These observations are in good agreement with the above-mentioned suggestion of iron nitride phases formation at high R and with the trends recorded on the N1s XPS data for as-prepared materials as well.
Figure 11 shows the N1s spectra for FeOOH and Fe(acac)3 precursors derived powders before and after H2SO4 treatment for high and low values of R. In contrast with materials prepared with lower R value, strong modification of the spectra is induced by acidic treatment for both FeOOH and Fe(acac)3 precursors and for high R. Indeed a clear drop in the intensity is observed in the low N1s core level energy region of the spectra (397–398 eV) possibly related to iron-nitride or nitrided iron. As expected, acidic treatment resulted in a drop of the iron content in the materials as indicated by X-ray fluorescence measurements. Data provided by XPS semi-quantitative analysis are reported in Table 1 for FeOOH and Fe(acac)3 derived samples at high and low R.
It is seen that for high R acid leaching results in concomitant loss of nitrogen and iron. At low R the nitrogen loss is low, consistently with the small changes observed in the N1s core level spectra (Figure 11). The N1s spectra modifications in Figure 11 require additional comments. The loss of iron results from H2SO4 dissolution of iron based particles, what can indeed only append for particles that are accessible to acid solution. With that respect it is worth pointing that in spite of considerable spectral and composition changes the material obtained from LMP-2 at high R still shows a significant contribution in the low energy N1s region, which is thought to originate from iron nitride like contribution. The reasons for this might be an insufficient duration for H2SO4 treatment, or the fact that some iron nitride-like phases are covered by a very thin carbon based component that allows photoelectron collection from the inner particle surface but impedes acid attack.

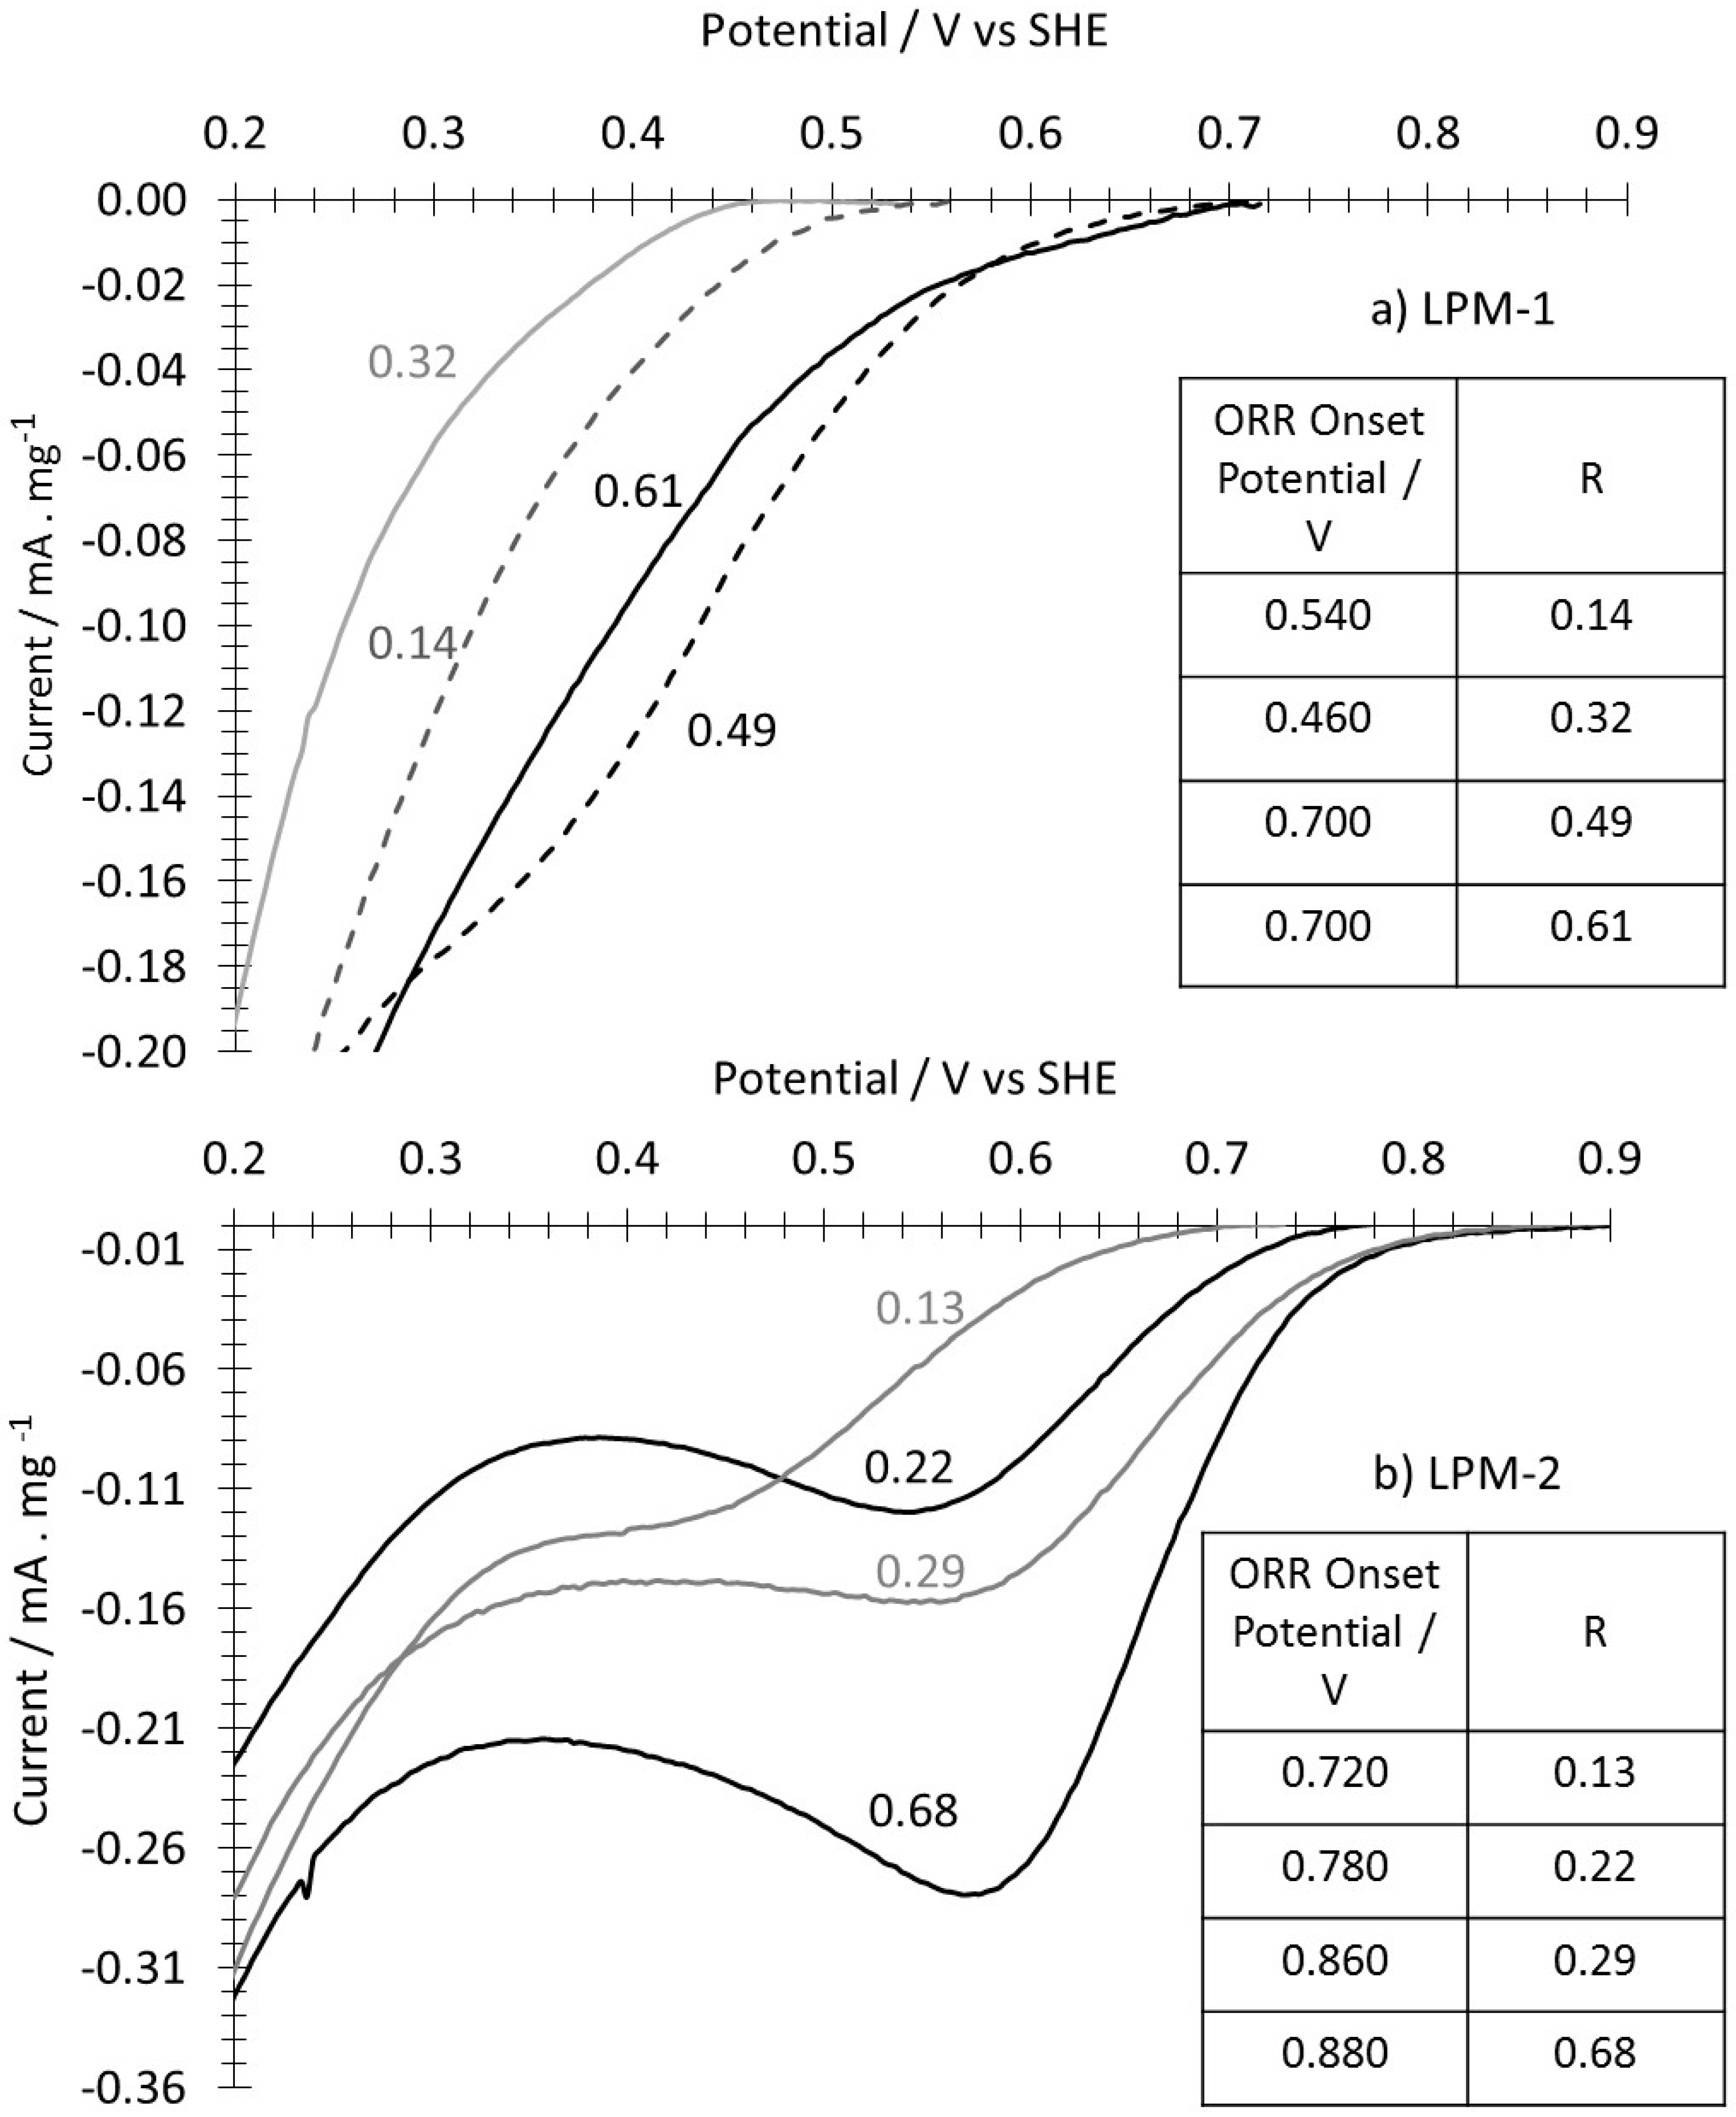
4. Preliminary Oxygen Reduction Study

Electrochemical measurements on porous electrodes prepared from LPM-1 derived materials were hard to achieve, presumably because of the high iron content and the presence of large iron based particles. Indeed, immersion in the acid electrolyte resulted in a significant gaseous production what led to a strong degradation of the layer homogeneity and detachment from the carbon felt. Such difficulties were quite rare for electrodes prepared with materials obtained from LPM-2. Nevertheless, cyclic voltammetry was recorded on porous electrodes at 5 mV·s−1 in HCLO4 1 M for materials synthesized with different R values from LPM-1 and LPM-2. Background current correction was performed by subtracting CVs recorded in argon saturated electrolyte from those recorded in oxygen saturated electrolyte. ORR catalyst efficiency was evaluated using the onset potential for the ORR shown by the CVs.
Figure 12a relates to LPM-1, for which it is seen that the onset potential for the ORR does not strictly rank the R value, although it can be seen that the two materials with the two lowest R values exhibit much poorer performances when compared to the ones with highest R values. Actually the response recorded for R = 0.14 and 0.32 are quite close to those recorded on the carbon felt support itself. Figure 12b shows the data related to LPM-2, for which a marked trend is observed that is, the higher the R parameter the higher the ORR onset potential. Finally, these data strongly suggest a direct influence of the R parameter on the performances of the ORR electrocatalysts synthesized by the CO2 laser pyrolysis method.

5. Discussion

This discussion session addresses the trends observed for the different feature of the materials, particle morphology, yield and composition and finally electrochemical performances, in particular as a function of R. It must be mentioned that we are sometimes reduced to making hypothesis since we have no direct indication that support a given explanation rather than another one.
Particle Size and Morphology:
The particle size and morphology obtained is this work can be discussed in the frame of well-documented literature related to the formation of nanoparticle materials in gas-fed flame synthesis and flame spray pyrolysis (FSP) methods [40,41,42,43,44]. Indeed both methods involve the thermal decomposition of a precursors flow (gas or atomized liquid) in a flame provided by the combustion of a fuel. These methods are characterized by particular synthesis conditions which can be summarized as follow: temperature as high as 3000 °C, short resident time of the precursors (<1 s), rapid cooling of the materials after formation. These features are to some extent similar to the ones encountered in laser pyrolysis and enable the comparison in terms of nanoparticles growth mechanisms. Discussion on the morphology and size of the particles reported in this paper necessitates the different scenarios of particle formation in flame synthesis to be briefly described. Thermophoretic sampling along the flame in gas-fed synthesis conditions for microscopy observation triggered the understanding of particle formation [45], what finally resulted in the following description for gas-fed flame synthesis processes [40,41,42,43,44].
-
Heating decomposes precursors to monomers which upon saturation grow by molecular coagulation or nucleation, to critical/primary particles.
-
Surface reaction of monomers on primary particles can contribute to their growth, while evaporation/sublimation contribute to particle size decrease and forming monomers again.
-
Further coagulation and/or coalescence process between primary particles may also contribute to nanoparticles growth.
Finally, depending on the temperature value and profile, the final morphology can consist of individual spherical particles, agglomerated particles, or aggregated particles when primary particles form necks between them.
When FSP is involved, additional phenomena related to the drying of aerosol liquid droplet influence the morphology [43]. One can briefly summarize the various pathways as follows:
(1) Complete evaporation of droplet and solute, leading to the gas-fed flame particle formation scenario.
(2) Solute precipitation in the droplet and reaction with surrounding reactants, ending in sintering of small grains to form particles in the range of µm size.
(3a) Surface precipitation of solute in the droplet, followed by reaction with surrounding species in gas phase and gentle drying, leading to the formation of large hollow particles.
Or, (3b) drying/melting allowing fragmentation/evaporation towards above mentioned gas-fed flame particle formation scenario.
To summarize the main parameters influencing particle size and morphology, it can be pointed that short resident time, high temperature and fast cooling rates reduce the particle size and the extent of the aggregation. Of course, this main trend can be significantly modulated by the feature of the solvent (here the liquid precursor) from which droplet are formed, as well as the size of the droplet (in the range of few µm to 10 µm for the Pyrosol aerosol generator), the feature of the solute (melting temperature), its concentration in the solution.
We can now comment on the size and morphology of the products we obtained in this work, although at this time only assumptions can be made, based on the above-mentioned pathways described for gas/liquid flame synthesis methods. It is also important to remind that for laser pyrolysis, the chemical composition of the effective precursor media through ammonia concentration is not disconnected from the temperature conditions. Indeed, as mentioned before, changing the ammonia flow modifies the CO2 laser absorption and therefore the energy (temperature) provided to the precursors.
First, it is seen that materials produced from LPM-1 (FeOOH particles as iron precursor) show marked changes as a function of R. At high R the population of individual large particles (few hundreds nm to few µm diameter) dominates. High R values correspond to higher temperature (high laser absorption) and short residence time as explained in Section 3.1. This result contrasts with the scenario of gas-fed flame situation which favours in such conditions small primary particles. Therefore one may assume that for high R values and LPM-1 the favoured pathway for particle formation is the one described in point 2, that is, solute precipitation in the droplet and reaction with surrounding reactants, then ending by sintering and producing particles in the range of µm size. These particles might be still hot enough for a given time to promote on their surface the formation of carbon/nitrogen doped shell (Figure 3a). Such a scenario is confirmed by scanning electron microscopy images (Appendix C) recorded on acid leached materials synthesis with LPM-1 at high R. The micrograph clearly shows films resulting from acid leached iron-based particles.
For LPM-2 the trends observed as a function of R for averaged particle size is suspected to be the same as for LPM-1 since specific surface decreases when R increases (Figure 4). Scanning electron microscopy at high R values shows the presence of large particles but not majority. The differences observed between LPM-1 and LPM-2 could reflect the footprint of aerosol droplet transformation during the process taking into account the following points: (i) the concentration of iron precursor in LPM-1 is higher (25 g·L−1 what correspond to a concentration of 15.7 g·L−1 of pure iron) than in LPM-2 (14 g·L−1, that is, 2.21 g·L−1 of pure iron) (ii) melting points for FeOOH is 350 °C while it is much lower for Fe(acac)3 (180 °C). Therefore, it is likely that for the same R value (i.e., similar flame temperature) larger iron-based particle should form in the case of LPM-1 due to higher Fe concentration. Compared to high R value, low R conditions result in lower temperature and longer resident time. Our results show that low R values favour the formation of small sized (few tens of nm in diameter, see Figure 3d) and aggregated particles for both, LPM-1 and LPM-2. Such a result could be tentatively explained in both cases as follows: the residence time being longer and the temperature being still high enough, pathway 3b involving drying/melting and fragmentation/evaporation leading to gas-fed flame synthesis conditions may occur. Finally, it is worth noting that the morphology of the materials as discussed here, focusses on the iron-base particle formation that promotes carbon based shell growth. However, this does not prevent possible homogeneous formation of carbon based nanoparticles independently of iron-based phases.
Chemical Yield and Composition:
The data recorded here show that the chemical yield of the synthesis decreases when R increases. Such a trend could be tentatively explained by the fact that chemical yield is essentially driven by the formation of the iron-based phase through the trends observed for the size of the particles. Indeed, if iron-based particles diameter decreases with R, the overall area they provide for catalytic growth of carbon phase strongly increases, thus favouring the increase in the overall chemical yield. The same argue holds at high R (bigger particles offer a lower area). At high R this surface area effect, that lowers the chemical yield in this case, could be accompanied by chemical effect related to iron nitride formation. Such a chemical effect looks consistent with literature dealing with nitrogen doped carbon nanotubes growth. Indeed, all things equal otherwise, it is reported [46] that the addition of NH3 at various concentrations drops the growth rate of N-doped carbon nanotubes by a factor 2 to 7 when compared to undoped ones.
Regarding composition of the materials, for both LPM-1 and LPM-2 a clear trend is also observed for bulk composition and surface composition (XPS) as a function of R. The higher R, the lower the carbon content and the higher the iron content for bulk composition. The same trends are observed for surface composition which also indicates that the nitrogen content in the material increases with R value. The trends observed for carbon and iron content could originate from size effect and/or chemical effect suggested above for chemical yield trends. For nitrogen content that increases with R, one may suggest the role of iron-nitride phase formation promoting the incorporation of nitrogen in the carbon phase of the material.
Oxygen Reduction Performances:
Preliminary results on the electrochemical activity of the materials synthesized in this work appear quite promising. In the literature dealing with the kind of electrocatalysts involved here, the pathway leading to the formation of the active sites for ORR appears not well understood. Furthermore, the nature of the active sites is still strongly debated. Different views conflict with each other and for example, some authors reported that iron species coordinated with nitrogen in various configuration referred as FeNx or FeNxCy are mainly responsible for the electrochemical activity [47,48,49], while others showed that iron-free electrocatalysts with CxNy sites have significant activity [50,51]. Furthermore, recently, the ORR activity of iron based (Fe3C) core-shell particles in which no nitrogen atoms are incorporated in the carbon shell was also reported [52]. Actually, the situation is even more complicated by the fact that a given electrocatalyst most probably contains different kind of actives sites towards the ORR. Such issues are indeed out of the scope of this paper. We showed that the most active materials are obtained for high R values. This is observed for both kind of materials (LPM-1 and LPM-2), although the trend for ORR activity as a function of R is less marked for LPM-1. It is worth reminding that the trends as a function of R for the whole set of characterization performed on both material are exactly the same. Besides, the most active materials towards the ORR have the highest initial iron content and they retain a significant iron content in spite of acid leaching. Therefore, we believe that the active sites responsible for the ORR activity are presumably related to the initial iron content in the materials. The iron nitride phases formed at high R are not directly involved in the ORR activity because they are not stable in acidic media. However, the X-ray diffraction recorded after acid leaching (Figure 10) suggests that iron nitride particles are surrounded by a carbon shell which protects the core from acid leaching. Finally, it can be tentatively assumed that the active site formation in our materials is related to iron nitride phases, as already reported for the same family of materials addressed here, [53]. In this work authors also show that acid leaching resulted in a moderate loss of activity.
The parameters that influence the activity are thus related to the nature and amount of the active sites but also to the specific surface area of the materials. Indeed, the higher the specific surface area the higher the volume density of active sites in the catalyst layer and thus the ORR activity. In the literature, materials that show the highest ORR performances have specific surface areas in the range of several hundred m2·g−1 [5]. Our data show that the most active materials obtained for high R values exhibit the lower specific surface area (Figure 4) and the higher surface nitrogen content. As a result one may suggest that key parameters affecting the catalyst activity in this work is not related to particle size but rather to the kind of nitrogen sites formed in the carbon phase and to the amount of nitrogen species present at the surface of the particles. In this work, the only data potentially giving indication on the type of nitrogen sites presents in the material are the N1s XPS spectra shown is Figure 8. The information given by the tentative peak fitting (Figure 8c,d) suggest that the most active material exhibits the highest nitrogen content and the highest content in pyridinic and graphitic sites which are responsible for ORR activity. Indeed, in the most active material (Figure 12b, R = 0.68) obtained here, the N1s peak fitting (Figure 8c) does not clearly suggest the presence of FeNx sites expected in the 399.3–399.9 eV region. For the lowest R value the most important component N2 at 399.3 eV (Figure 8d, R = 0.04) is most probably not related to FeNx sites since the material exhibit a poor ORR activity.
The onset ORR potential which has been used here to rank the activity of the different materials is explicitly mentioned and used in the literature as one of the significant criterion to evaluate ORR performances [9] and finally, the highest ORR onset potential recorded in this work is ≈0.880 V versus SHE. This is lower than the best performances reported in the literature for the kind of catalysts considered here, for which onset potentials in the range of 0.900 to 0.950 V are reported [5,9]. Such high performances have been obtained thanks to modification of synthesis processes, which include together or separately, the use of template components in the precursors, ball milling step and thermal treatments under inert gases or ammonia. With that respect, it looks clear to us that our results are quite encouraging since our elaboration process implies few synthesis steps and quite simple liquid precursor media. Current work is now aiming at improving the chemical yields through precursor modification, as well as improving the understanding and control of the synthesis key parameters in order to improve the performances of the non-noble electrocatalysts towards the ORR.

6. Conclusions

In this paper we have reported the synthesis and characterization of non-noble metal ORR electrocatalysts based on carbon, nitrogen and iron by laser pyrolysis, using two different iron precursors. The features of the materials show a monotonic behaviour when drawn as a function of the so-called R parameter, which is the ammonia flow volume fraction involved in the synthesis. The materials were characterized using different methods and surface analysis of the materials advantageously completed the information recorded on bulk materials. In particular, the N1s core level spectra as well as the semi quantitative analysis tend to confirm the higher R the higher the amount of iron nitride-like phase formed. This point appears comforted by the comparison of the XPS and XRD data recorded for as-prepared materials and acid leached ones. Preliminary evaluation of the ORR by cyclic voltammetry indicates that the performance is improved when the R parameter is increased. Based on these trends and those recorded regarding the whole set of characterization, it can be tentatively suggested that iron nitride formation during the CO2 laser pyrolysis favours the formation of active sites for the ORR in these non-noble electrocatalysts. Current work is dealing with the development of this new approach consisting of using CO2 laser pyrolysis for the synthesis of carbon/nitrogen/iron based non-noble electrocatalysts and will be the subject of coming reports.

Author Contributions

H.P. proposed and guided this research and wrote the paper. V.J. recorded XRD experiments and performed data analysis with H.P. P.B. recorded the Mossbauer experiments and aided with V.J. the data treatment and interpretation. J.V., M.F. and A.E. carried out the XPS experiments and aided interpretation and data treatment with H.P. A.Q., Y.L., H.P. and V.J. were involved in laser the pyrolysis syntheses. H.P. and V.J. processed the as-prepared materials, prepared porous electrode elaboration and performed electrochemical measurements. V.J. determined carbon content on powders and recorded X-ray fluorescence measurements. A.H. recorded scanning electron microscopy and contributed to BET measurements with V.J.

Funding

This work has been supported by the Region Ile-de-France in the framework of DIM Nano-K.

Conflicts of Interest

The authors declare no conflict of interest.

Appendix A

Supporting information related to Mossbauer spectroscopy:
The table below reports the parameters involved in the fitting of the spectra shown in Figure 6, for the identified phases, consistently with data reported in the literature [54,55,56].
Table A1. Parameters deduced from fitting procedure of Mossbauer spectrum.
Iron-Based PhaseHyperfine Field—H(T)Isomer Shift mm·s−1Area %
α Fe33.590.0224.3
γ Fe-−0.05616.5
Fe3C20.900.19642.8
FeO-0.8975.0
Unknown phase28.330.1111.4

Appendix B

Reference spectra of polyphosphazen used to set the peak Full Width at Half Maximum (FWHM) at 1.5 eV.
Figure A1. Reference polyphosphazen N1s XPS spectra and fitting.
Carbon 04 00043 g0a1

Appendix C

Scanning electron microscopy image of a sample obtained from LPM-1 at R = 0.61 after acid leaching. It shows collapsed carbon films resulting from the elimination of iron-based particles. White spots in some part of the image are iron-based particles protected from acid leaching by carbon shell.
Figure A2. Scanning electron microscopy image of a sample obtained from LPM-1 at R = 0.61 after acid leaching.
Carbon 04 00043 g0a2

References

  1. Jasinski, R. A New Fuel Cell Cathode Catalyst. Nature 1964, 201, 1212–1213. [Google Scholar] [CrossRef]
  2. Jahnke, H.; Schönborn, M.; Zimmermann, G. Organic dyestuffs as catalysts for fuel cells. Top. Curr. Chem. 1976, 61, 133–181. [Google Scholar] [PubMed]
  3. Gupta, S.; Tryk, D.; Bae, I.; Aldred, W.; Yeager, E. Heat-treated polyacrylonitrile-based catalysts for oxygen electroreduction. J. Appl. Electrochem. 1989, 19, 19–27. [Google Scholar] [CrossRef]
  4. Lefèvre, M.; Proietti, E.; Jaouen, F.; Dodelet, J.-P. Iron-Based Catalysts with Improved Oxygen Reduction Activity in Polymer Electrolyte Fuel Cells. Science 2009, 324, 71–74. [Google Scholar] [CrossRef] [PubMed]
  5. Shao, M.; Chang, Q.; Dodelet, J.-P.; Chenitz, R. Recent advances in electrocatalysts for oxygen reduction. Chem. Rev. 2016, 116, 3594–3657. [Google Scholar] [CrossRef] [PubMed]
  6. Masa, J.; Xia, W.; Mulher, M.; Schuhmann, W. On the role of Metals in the Nitrogen-doped carbon electrocatalyst for oxygen reduction. Angew. Chem. Int. Ed. 2015, 54, 10102–10120. [Google Scholar] [CrossRef] [PubMed]
  7. Wu, G.; Zelenay, P. Nanostructured Nonprecious Metal Catalysts for Oxygen Reduction Reaction. Acc. Chem. Res. 2013, 46, 1878–1889. [Google Scholar] [CrossRef] [PubMed]
  8. Dombrovskis, J.K.; Palmqvist, A.E.C. Recent Progress in Synthesis, Characterization and Evaluation of Non-Precious Metal Catalysts for the Oxygen Reduction Reaction. Fuel Cells 2016, 16, 4–22. [Google Scholar] [CrossRef]
  9. Liu, J.; Li, E.; Ruan, M.; Song, P.; Xu, W. Recent Progress on Fe/N/C Electrocatalysts for the Oxygen Reduction Reaction in Fuel Cells. Catalysts 2015, 5, 1167–1192. [Google Scholar] [CrossRef] [Green Version]
  10. Russel, D.K. Infrared laser powered homogeneous pyrolysis. Chem. Soc. Rev. 1990, 19, 407–437. [Google Scholar] [CrossRef]
  11. David, B.; Scheneeweiss, O.; Pizurova, N.; Klementova, M.; Bezdicka, P.; Alexandrescu, R.; Dimitrache, F.; Morjan, I. Fe3C nanopowder synthesized by laser pyrolysis and its annealing behaviour. Surf. Interface Anal. 2006, 38, 482–485. [Google Scholar] [CrossRef]
  12. Leconte, Y.; Maskrot, H.; Combemale, L.; Herlin-Boime, N.; Reynaud, C. Application of the laser pyrolysis to the synthesis of SiC, TiC and ZrC pre-ceramics nanopowders. J. Anal. Appl. Pyrolysis 2007, 79, 465–470. [Google Scholar] [CrossRef]
  13. Grimes, C.A.; Qian, D.; Dickey, E.C.; Allen, J.L.; Eklund, P.C. Laser Pyrolysis fabrication of ferromagnetic γ’-Fe4N and Fe3C nanoparticles. J. Appl. Phys. 2000, 87, 5642–5644. [Google Scholar] [CrossRef] [PubMed]
  14. Leconte, Y.; Veintemillas-Verdaguer, S.; Morales, M.P.; Costo, R.; Rodríguez, I.; Bonville, P.; Bouchet-Fabre, B.; Herlin-Boime, N. Continuous production of water dispersible carbon–iron nanocomposites by laser pyrolysis: Application as MRI contrasts. J. Colloid Interface Sci. 2007, 313, 511–518. [Google Scholar] [CrossRef] [PubMed]
  15. Simon, P.; Pignon, B.; Miao, B.; Coste-Leconte, S.; Leconte, Y.; Marguet, S.; Jegou, P.; Bouchet-Fabre, B.; Reynaud, C.; Herlin-Boime, N. N-Doped Titanium Monoxide Nanoparticles with TiO Rock-Salt Structure, Low Energy Band Gap and Visible Light Activity. Chem. Mater. 2010, 22, 3704–3711. [Google Scholar] [CrossRef]
  16. Bomati-Miguel, O.; Tartaj, P.; Morales, M.P.; Bonville, P.; Golla-Schindler, U.; Zhao, X.Q.; Veintemillas-Verdaguer, S. Core–Shell Iron–Iron Oxide Nanoparticles Synthesized by Laser-Induced Pyrolysis. Small 2006, 2, 1476–1483. [Google Scholar] [CrossRef] [PubMed] [Green Version]
  17. Alexandrescu, R.; Morjan, I.; Tomescu, A.; Simion, C.; Scarisoreanu, M.; Birjega, R.; Fleaca, C.; Gavrila, L.; Soare, I.; Dumitrache, F. Direct production of a novel iron-based nanocomposite from the laser pyrolysis of Fe(CO)5/MMA mixtures: Structural and sensing properties. J. Nanomater. 2010, 2010, 1–12. [Google Scholar] [CrossRef]
  18. Sourice, J.; Bordes, A.; Boulineau, A.; Alper, J.P.; Franger, S.; Quinsac, A.; Habert, A.; De Vito, Y.E.; Porcher, W.; Reynaud, C.; et al. Core–shell amorphous silicon–carbon nanoparticles for high performance anodes in lithium ion batteries. J. Power Sources 2016, 328, 527–535. [Google Scholar] [CrossRef]
  19. Wakizaka, Y.; Shishikura, T. Process for Production and Use of Carbonitride Mixture Particles or Oxycarbonitride Mixture Particles. U.S. Patent 2011/0183234, 28 July 2011. [Google Scholar]
  20. Cheng, X.; Than, X.-T.; Pinault, M.; Mayne, M.; Reynaud, C.; Vigneron, J.; Etcheberry, A.; Perez, H. Determination of selectivity and specific area related to oxygen reduction reaction as a function of catalyst loading on non-noble metal based electrocatalyst porous electrodes: An example on nitrogen doped carbon nanotube. Electrochim. Acta 2014, 135, 293–300. [Google Scholar] [CrossRef]
  21. Baret, B.; Aubert, P.-H.; Mayne-L’Hermite, M.; Pinault, M.; Reynaud, C.; Etcheberry, A.; Perez, H. Nanocomposite electrodes based on pre-synthesized organically capped platinum nanoparticles and carbon nanotubes part I: Tuneable low platinum loadings, specific H upd feature and evidence for oxygen reduction. Electrochim. Acta 2009, 54, 5421–5430. [Google Scholar] [CrossRef]
  22. March, G.; Volatron, F.; Lachaud, F.; Cheng, X.; Baret, B.; Pinault, M.; Etcheberry, A.; Perez, H. Nanocomposite electrodes based on pre-synthesized organically capped platinum nanoparticles and carbon nanotubes. Part II: Determination of diffusion area for oxygen reduction reflects platinum accessibility. Electrochim. Acta 2011, 56, 5151–5157. [Google Scholar] [CrossRef]
  23. Cheng, X.; Volatron, F.; Pardieu, E.; Borta, A.; Carrot, G.; Reynaud, C.; Mayne, M.; Pinault, M.; Etcheberry, A.; Perez, H. Nanocomposite electrodes based on pre-synthesized organically grafted platinum nanoparticles and carbon nanotubes III. Determination of oxygen reduction reaction selectivity and specific area of porous electrode related to the oxygen reduction reaction ranging from 2 m2·gPt−1 to 310 m2·gPt−1. Electrochim. Acta 2013, 89, 1–12. [Google Scholar] [CrossRef]
  24. Oya, A.; Marsh, H. Phenomena of catalytic graphitization. J. Mater. Sci. 1982, 17, 309–322. [Google Scholar] [CrossRef]
  25. Hargreaives, J.S.J. Heterogeneous catalysis with metal nitrides. Coord. Chem. Rev. 2013, 257, 2015–2031. [Google Scholar] [CrossRef]
  26. Han, Y.; Wang, H.; Zang, M.; Su, M.; Li, W.; Tao, K. Low-temperature approach to synthesize iron nitride from amorphous Iron. Inorg. Chem. 2008, 47, 1261–1263. [Google Scholar] [CrossRef] [PubMed]
  27. Dieckmann, W.; Panzner, G.; Grabke, H.J. The bonding state of nitrogen segregated on Fe (100) and on iron nitrides Fe4N and Fe2N. Surf. Sci. 1989, 218, 507–518. [Google Scholar] [CrossRef]
  28. Lin, Y.C.; Hong, J.-Y.; Yen, C.-H.; Tong, S.-Y.; Tung, M.-J.; Shiu, H.-W.; Lin, M.-T. X-ray photelectron spectroscopic investigation on Fe geometrical sites of iron nitride thin films. Jpn. J. Appl. Phys. 2015, 54, 033002. [Google Scholar] [CrossRef]
  29. Torres, J.; Perry, C.C.; Bransfield, S.J.; Fairbrother, D.H. Low temperature oxidation of nitride iron surfaces. J. Phys. Chem. B 2003, 107, 5558–5567. [Google Scholar] [CrossRef]
  30. Susi, T.; Pichler, T.; Ayala, P. X-ray photoelectron spectroscopy of graphitic carbon nanomaterials doped with heteroatoms. Beilstein J. Nanotechnol. 2015, 6, 177–191. [Google Scholar] [CrossRef] [PubMed]
  31. Kondo, T.; Casolo, S.; Suzuki, T.; Shikano, T.; Sakurai, M.; Harada, Y.; Saito, M.; Oshima, M.; Trioni, M.I.; Tantardini, G.F.; et al. Atomic-scale characterization of nitrogen-doped graphite: Effects of dopant nitrogen on the local electronic structure of the surrounding carbon atoms. Phys. Rev. B 2012, 86, 035436. [Google Scholar] [CrossRef]
  32. Pels, J.R.; Kapteijn, F.; Moulijn, J.A.; Zhu, Q.; Thomas, K.M. Evolution of nitrogen functionalities in carbonaceous materials during pyrolysis. Carbon 1995, 33, 1641–1653. [Google Scholar] [CrossRef]
  33. Kapteijn, F.; Moulijn, J.A.; Matzner, S.; Boehm, H.-P. The development of nitrogen functionality in model chars during gasification in CO2 and O2. Carbon 1999, 37, 1143–1150. [Google Scholar] [CrossRef]
  34. Marton, D.; Boyd, K.J.; Al-Bayati, A.H.; Todorov, S.S.; Rabalais, J.W. Carbon Nitride Deposited Using Energetic Species: A Two-Phase System. Phys. Rev. Lett. 1994, 73, 118–121. [Google Scholar] [CrossRef] [PubMed]
  35. Choi, H.C.; Park, J. Distribution and Structure of N Atoms in Multiwalled Carbon Nanotubes Using Variable-Energy X-ray Photoelectron Spectroscopy. J. Phys. Chem. B 2005, 109, 4333–4340. [Google Scholar] [CrossRef] [PubMed]
  36. Gammon, W.J.; Kraft, O.; Reilly, A.C.; Holloway, B.C. Experimental comparison of N(1s) X-ray photoelectron spectroscopy binding energies of hard and elastic amorphous carbon nitride films with reference organic compounds. Carbon 2003, 41, 1917–1923. [Google Scholar] [CrossRef]
  37. Artyushkova, K.; Serov, A.; Rojas-Carbonell, S.; Atanassov, P. Chemistry of Multitudinous Active Sites for Oxygen Reduction Reaction in Transition Metal−Nitrogen−Carbon. J. Phys. Chem. C 2015, 119, 25917–25928. [Google Scholar] [CrossRef]
  38. Casanovas, J.; Ricart, J.M.; Rubio, J.; Illas, F.; Jimenez-Mateos, J.M. Origin of the Large N1s Binding Energy in X-ray Photoelectron Spectra of Calcined Carbonaceous Materials. J. Am. Chem. Soc. 1996, 118, 8071–8076. [Google Scholar] [CrossRef]
  39. Jimenez Mateos, J.M.; Fierro, J.L.G. X-ray Photoelectron Spectroscopic Study of Petroleum Fuel Cokes. Surf. Int. Anal. 1996, 2, 223–236. [Google Scholar] [CrossRef]
  40. Buesser, B.; Pratsinis, S.E. Design of Nanomaterial Synthesis by Aerosol Processes. Annu. Rev. Chem. Biomol. Eng. 2012, 3, 103–127. [Google Scholar] [CrossRef] [PubMed] [Green Version]
  41. Buesser, B.; Gröhn, A.J. Multiscale aspect of modeling gas phase nanoparticle synthesis. Chem. Eng. Technol. 2012, 35, 1133–1143. [Google Scholar] [CrossRef] [PubMed]
  42. Kelesidis, G.A.; Goudeli, E.; Pratsinis, S.E. Flame synthesis of functional nanostructured materials and devices: Surface growth and aggregation. Proc. Energy Combust. Sci. 2017, 36, 29–50. [Google Scholar] [CrossRef]
  43. Strobel, R.; Pratsinis, S.E. Flame aerosol synthesis of smart nanostructured materials. J. Mater. Chem. 2007, 17, 4743–4756. [Google Scholar] [CrossRef]
  44. Teoh, W.Y.; Amal, R.; Mädler, L. Flame spray pyrolysis: An enabling technology for nanoparticles design and fabrication. Nanoscale 2010, 2, 1324–1347. [Google Scholar] [CrossRef] [PubMed]
  45. Dobbins, A.; Megaridis, C.M. Morphology of Flame-Generated Soot As Determined by Thermophoretic Sampling. Langmuir 1987, 3, 254–259. [Google Scholar] [CrossRef]
  46. Castro, C. Mécanismes de Croissance de Nanotubes de Carbone Alignés: Relation Catalyseur—Nanotube. Ph.D. Thesis, Paris XI Orsay University, Orsay, France, 2009. [Google Scholar]
  47. Jaouen, F.; Proietti, E.; Lefèvre, M.; Chentiz, R.; Dodelet, J.-P.; Wu, G.; Chung, H.T.; Johnston, P.; Zelenay, C.M. Recent advances in non-precious metal catalysis for oxygen-reduction reaction in polymer electrolyte fuel cells. Energy Environ. Sci. 2011, 4, 114–130. [Google Scholar] [CrossRef]
  48. Jia, Q.; Ramaswamy, N.; Tylus, U.; Strickland, K.; Li, J.; Serov, A.; Artyushkova, K.; Atanassov, P.; Anibal, J.; Gumeci, C.; et al. Spectroscopic insights into the nature of active sites in iron–nitrogen–carbon electrocatalysts for oxygen reduction in acid. Nano Energy 2016, 29, 65–82. [Google Scholar] [CrossRef]
  49. Jia, Q.; Ramaswamy, N.; Hafiz, H.; Tylus, U.; Strickland, K.; Wu, G.; Barbiellini, B.; Bansil, A.; Holby, E.F.; Zelenay, P.; et al. Experimental Observation of Redox-Induced Fe–N Switching Behavior as a Determinant Role for Oxygen Reduction Activity. ACS Nano 2015, 9, 12496–12505. [Google Scholar] [CrossRef] [PubMed]
  50. Daems, N.; Sheng, X.; Vankelecom, I.F.J.; Pescarmona, P. Metal-free doped carbon materials as electrocatalysts for the oxygen reduction reaction. J. Mater. Chem. A 2014, 2, 4085–4110. [Google Scholar] [CrossRef]
  51. Guo, D.; Shibuya, R.; Akiba, C.; Saji, S.; Kondo, T.; Nakamura, J. Active sites of nitrogen-doped carbon materials for oxygen reduction reaction clarified using model catalysts. Science 2016, 351, 361–365. [Google Scholar] [CrossRef] [PubMed]
  52. Hu, Y.; Jensen, J.O.; Zhang, W.; Cleemann, L.N.; Xing, W.; Bjerrum, N.J.; Li, Q. Hollow Spheres of Iron Carbide Nanoparticles Encased in Graphitic Layers as Oxygen Reduction Catalysts. Angew. Chem. Int. Ed. 2014, 53, 3675–3679. [Google Scholar] [CrossRef] [PubMed]
  53. Kramm, U.I.; Herrman-Geppert, I.; Bogdanoff, P.; Fiechter, S. Effect of an ammonia treatment on structure, composition and oxygen reduction reaction activity of Fe–N–C catalysts. J. Phys. Chem. C 2011, 115, 23417. [Google Scholar] [CrossRef]
  54. Ron, M.; Mathalone, Z. Hyperfine Interactions of 57Fe in Fe3C. Phys. Rev. B 1971, 4, 774–777. [Google Scholar] [CrossRef]
  55. Pasternak, M.P.; Taylor, R.D.; Jeanloz, R.; Li, X.; Nguyen, J.H.; McCammon, C.A. High Pressure Collapse of Magnetism in Fe0.94O: Mössbauer Spectroscopy Beyond 100 GPa. Phys. Rev. Lett. 1997, 79, 5046–5049. [Google Scholar] [CrossRef]
  56. Serov, A.; Artyushkova, K.; Niangar, E.; Wang, C.; Dale, N.; Jaouen, F.; Sougrati, M.-T.; Jia, Q.; Mukerjee, S.; Atanassov, P. Nano-Structured Non-Platinum Catalysts for Automotive Fuel Cell Application. Nano Energy 2015, 16, 293–300. [Google Scholar] [CrossRef]
Figure 1. Scheme of the experimental set up used in this work.
Carbon 04 00043 g001
Figure 2. Production yield for different syntheses as a function of the R parameter for (a) LPM-1 and (b) LPM-2.
Carbon 04 00043 g002
Figure 3. Scanning electron microscopy images of nanomaterials obtained from LPM-1: (a) R = 0.61; (b) R = 0.14; (c) is the pristine FeOOH nanoparticles used in LPM-1; (d) is a TEM image recorded for R = 0.14.
Carbon 04 00043 g003
Figure 4. Trend for the specific surface area of the powders as a function of R parameter for materials obtained from LPM-2.
Carbon 04 00043 g004
Figure 5. Carbon and iron contents as a function of R for nanomaterials prepared using (a) FeOOH (LPM-1) and (b) iron III acetylacetonate (LPM-2). Empty and filled symbols correspond to iron and carbon contents, respectively.
Carbon 04 00043 g005
Figure 6. Example of Mossbauer spectra recorded on sample prepared using FeOOH (LPM-1) for R = 0.49 and corresponding fitting.
Carbon 04 00043 g006
Figure 7. XRD diffraction patterns recorded on powders synthesized using LMP-1 for high and low R values. Phases identified by Mossbauer spectroscopy are indicated on the patterns, together with unattributed peaks.
Carbon 04 00043 g007
Figure 8. (a,b) N1s core level features as a function of R for (a) LPM-1 and (b) LPM-2. Grey area shows the binding energy region in which nitride iron can be found. Intensities are normalized; (c,d) are tentative peak fitting for LPM-2 at (c) R = 0.68 and (d) R = 0.04. Fitting components are labelled N1 to N6 and relative weights and binding energies are listed in the figures.
Carbon 04 00043 g008
Figure 9. Trends for the XPS semi-quantitative analysis for powders obtained from LMP-2 as a function of R parameter. (a) N1s; (b) Fe2p; (c) O1s and C1s.
Carbon 04 00043 g009
Figure 10. XRD pattern of sample obtained from LPM-1 after acid leaching for R = 0.14 and 0.61.
Carbon 04 00043 g010
Figure 11. XPS N1s core level spectra for powders obtained from (a) LPM-1 and (b) LPM-2 before and after H2SO4 treatment, for low and high R values. Intensities are normalized.
Carbon 04 00043 g011
Figure 12. Cyclic voltammetry recorded on porous electrodes prepared from materials synthesized with LMP-1 (a) and LPM-2 (b) in HClO4 1 M at 5 mV·s−1. The inserted tables report the R values and the corresponding onset potentials for the ORR.
Carbon 04 00043 g012
Table 1. XPS nitrogen and iron content for materials prepared from FeOOH (LMP-1) and Fe(acac)3 (LMP-2) for high (white areas) and low (grey areas) R parameter.
LPM-1LPM-1LPM-2LPM-2
R = 0.61R = 0.14R = 0.68R = 0.29
N at %Fe at %N at %Fe at %N at %Fe at %N at %Fe at %
As-prepared materials6.73.74.60.058.19.44.90.6
H2SO4 treated2.00.34.206.03.04.20.3

