Article

Synthesis of Graphene Nanosheets through Spontaneous Sodiation Process

Department of Mechanical Engineering, Iowa State University, Ames, IA 50011, USA
*
Author to whom correspondence should be addressed.
These authors contributed equally to this work.
Submission received: 11 June 2018 / Revised: 2 July 2018 / Accepted: 6 July 2018 / Published: 23 July 2018

Abstract

:
Graphene is one of the emerging materials in the nanotechnology industry due to its potential applications in diverse areas. We report the fabrication of graphene nanosheets by spontaneous electrochemical reaction using solvated ion intercalation into graphite. The current literature focuses on the fabrication of graphene using lithium metal. Our procedure uses sodium metal, which results in a reduction of costs. Using various characterization techniques, we confirmed the fabrication of graphene nanosheets. We obtained an intensity ratio (ID/IG) of 0.32 using Raman spectroscopy, interlayer spacing of 0.39 nm and our XPS results indicate that our fabricated compound is relatively oxidation free.

Graphical Abstract

1. Introduction

Graphene nanosheets (GNS) consist of single-, bi- or, a few, but fewer than ten, sp2-hybridized layers of carbon atoms that are in the form of six-membered rings [1,2,3,4]. Graphitic forms such as 0D fullerene, 1D CNT (Carbon Nano Tubes) and 3D graphite originate from graphene nanosheets [4].
Graphene is made up of hexagonal networks composed of sp2 carbon atoms and the adjoining carbon atoms are bonded using strong covalent bonds [5]. Graphene nanosheets have applications in diverse areas due to their electrical, thermal and mechanical properties [6]. Graphene-based flexible and stretchable electronics, wearable sensors, and solar cells are among various applications of graphene. Nuvoli et al. produced stable graphene dispersions by sonicating graphite and 1-hexyl-3-methyl-imidazolium hexafluorophosphate (HMIH). The usage of an ionic liquid complements the properties of graphene for its implementation in energy storage and generation [7].
Recently, Zhao et al. developed graphene in powder form by ball milling it for 30 h after dispersing graphite within N,N-dimethylformamide solvent. Although the method developed was low in cost, the time taken to produce the graphene was not competitive from a manufacturing perspective [8]. Addition of compounds between layers of graphite and ion intercalation have been studied since 1980 [9]. The progress in the micromechanical cleavage of HOPG (Highly Ordered Pyrolytic Graphite) has reinstated interest in the exfoliation of graphite to isolate graphene [10]. Lately, Bharat et al. developed graphene by preparing an intercalation compound using potassium. They acquired KC8 after intercalation and heating their compound at 400 °C for 4 h. Graphene nanosheets were developed after KC8 was mixed with certain solvents at high temperatures. However, this process requires high temperatures, and the duration of the procedure to develop the final product is more than 24 h [11].
The electrochemical method revolves around reduction and oxidation potentials being applied to an electrode that is graphite-based along with auxiliary and reference electrodes. Negative charge-carrying ions intercalate between the graphite layers due to the application of a positive potential, leading to the oxidation of the graphite electrode. Subsequently, a negative potential is applied that enables exfoliation [9].
Electrochemical processes have potential leads over conventional methods [12]. Bulk production costs for graphene are lower for this method as compared to chemical vapor deposition, mechanical exfoliation and molecular assembly [12,13]. Additionally, the electrochemical activation that is used by this process eliminates the need for strong chemicals [12]. Lu et al. advanced a method to electrochemically exfoliate graphite in ionic liquid solution [14]. The process consisted of anodic oxidation of water, graphite edge planes being subject to hydroxylation or oxidation, the formation of graphite intercalation compounds (GICs) due to the ionic liquid anions undergoing intercalation between graphite layers, and the GICs being subjected to oxidative cleavage and precipitation [14]. Similarly, Wang et al. fabricated few-layer graphene through electrochemical exfoliation with propylene carbonate as the electrolyte [15].
Generally, the electrolyte for this process can be categorized under ionic liquids [14,16] and aqueous acids such as H2SO4 [17,18,19]. A relatively lower amount of graphene is produced when exfoliation occurs via ionic liquids, the lateral size of the product is small, and the electronic properties of graphene are distorted due to functionalization with ionic liquids [16,20]. While acidic electrolytes for exfoliation lead to graphene having a higher quality and a greater lateral size, however, over-oxidation of graphite by acid occurs, leading to the presence of oxygen-containing functional groups [17,18,21].
Methods to electrochemically exfoliate graphene generally require external sources of energy [22,23,24]. However, recently, a method to exfoliate graphene using spontaneous electrochemical reaction with no requirement of an external energy source was established [25]. Lithium was used as the intercalation source in order to exfoliate graphene. The authors suggested that elements from group 1 and 2 could potentially replace Li, provided they release hydrogen gas after reacting with water [25].
As per the current literature, Li has been used to electrochemically fabricate graphene [25], but the use of Na can lead to significant reductions in costs, as Na metal is generally cheaper as compared to Li metal. The cost of pure Na metal is $25/100 g [26], while the cost of pure Li metal is $27/100 g [26]. The quantity of sodium within the earth is greater as compared to lithium. Seawater contains 10,320 ppm, while the earth’s crust possesses 28,300 ppm [27]. Also, there has been some contention that terrestrial Li may be reduced, provided the growth in the hybrid electric vehicle industry proceeds as expected. Large-scale Li-ion storage cells consume 100–500 times the lithium that is generally used. This might lead to a change in economic efficacy when using lithium for the fabrication of graphene [28]. Additionally, unexploited lithium is present in difficult-to-access locations. The increase in demand for lithium could lead to the requirement of higher financial resources for mining. In contrast, sodium stock is almost limitless and its recovery is simple [29]. Furthermore, our production process does not require expensive equipment such as that required in the CVD process, and it is relatively easy as compared to other methods of graphene fabrication.
Graphene sheets in our proposed mechanism are exfoliated directly from graphite. This eliminates the poor electrical conductivity issue that occur in graphene films that have been reduced chemically from graphene oxide derivatives [14]. There is also a high defect density in graphene oxide-derived materials, harming their carrier mobility [30].
In this paper, we present a procedure describing the development of high-quality GNS due to direct contact between graphite powder and Na foil placed within an electrolyte. The solvated Na intercalation into graphite is spontaneous, since the electrochemical potential difference between graphite and Na is very high. The production process is relatively quick, taking 300 min for sodiation and 30 min for exfoliation. The basis for this procedure is spontaneous electrochemical reaction, where the primary step involves a setup of graphite powder and Na foil, leading to sodiation, which causes the intermediate formation of Na-intercalated GIC. The secondary step gives rise to the formation of GNS due to the intercalation of solvated sodium ions into graphite and the reaction of this product with water. Hence, no external energy source is required for the formation of GNS.

2. Experimental

2.1. Materials and Methods

Graphite was purchased from Sigma Aldrich (USA, product number 282863, powder, <20 um, synthetic). Sodium ingot was acquired from VWR (USA, 99.8% metal basis). The materials to create the electrolyte were Sodium hexafluorophosphate, NaPF6 (Oakwood chemicals—002866, USA), Ethylene carbonate, EC (Alfa Aesar, Ward Hill, MA, USA, A15735, 99%) and Propylene Carbonate, PC (Sigma Aldrich, USA, 310328-2L anhydrous 99.7%).

2.2. Electrolyte Preparation

Sodium hexafluorophosphate was mixed with equal quantities of EC and PC. Before the preparation of the electrolyte, NaPF6 was dried in the oven (overnight) to remove moisture. While replicating our experiments, we learnt that NaPF6 had 2% impurity in it. In order to take the impurity present in the compound into account, we added an additional mass of 0.35 mg. However, certain characterizations had already been performed without accounting for this impurity. The characterizations were not reperformed as there would be negligible change in the results even after accounting for the impurity. EC and PC were taken directly from the container without adjusting for the impurity level as it was again negligible.

2.3. Fabrication of GIC

The experimental procedure to fabricate GIC was inspired by the work done by Kim et al. [31] and Park et al. [32]. Sodium ingot was flattened using a roller in order to use it as a foil. This foil was then cut into an area of approximately 4 cm × 4 cm. The oil present on the Na foil (due to the ingots being stored within kerosene) was thoroughly removed. Graphite powder was placed on the sodium foil and evenly scattered. In order to increase the surface area, the Na foil was firmly folded; however, the edges were left open to allow the electrolyte to come in contact with graphite and sodium. The foil was then placed in a vial, and subsequently 1 M NaPF6 solution in EC/PC was poured into it. The vial was left undisturbed for the next 5 h so that spontaneous intercalation through direct contact could occur. The foil was then carefully opened using multiple forceps and spatula. The GIC formed had a greyish black color. The formed product, still attached to Na foil, was transferred into another vial by mixing it with 1 M NaPF6 solution. Once the transfer was complete, the vial was securely fastened.

2.4. GNS Production

The next step was the production of graphene nanosheets. This procedure followed the lines of the work done by Lee et al. and Kim et al. [25,33]. The vial containing GIC was subjected to small amounts of deionized water, leading to the exfoliation of GIC, and then shaken vigorously for a minute, causing black colored graphene nanosheets to float upward. The GNS was scooped up using pipettes and filtered using filter paper (VWR Cat. No: 28306-175) while ethanol and deionized water was added to aid the filtration process. The filtered product was placed inside an oven under vacuum at 80 °C in order to dry it overnight. Figure 1 shows a schematic of intercalation of solvated Na ions between graphite layers inducing the formation of individual graphene sheets.

2.5. Characterization of Graphene Nanosheets

XPS analysis using an X-ray Photoelectron Spectroscope (XPS, PHI ESCA 5500) was performed to discern the constitution of oxygen and carbon within the graphene sample. Raman spectroscopy was performed to determine the number of layers and defect density. The equipment used was an Olympus BX51 Universal Research Microscope (Olympus, Tokyo, Japan) with a laser wavelength of 530 nm. Attenuated Total Reflectance-Fourier Transform Infrared (ATR-FTIR) spectroscopy by Frontier Perkin Elmer Spectrometer (Perkin Elmer, USA) assisted in determining the molecular composition of our product. In order to determine the morphology and diffraction pattern of graphene, images using scanning electron microscope (SEM; JCM-6000 NeoScope Benchtop, JEOL, USA) and transmission electron microscopy (TEM; JEOL 2100, 200 kV, JEOL, USA) were taken. X-ray diffraction, using a Siemens D500 diffractometer (Germany), was conducted in order to study the crystal structure of the material. The X-ray beam wavelength used for characterization was 0.1540 nm and the diffraction angle was 11.38°. All measurements were taken through a zero background holder (ZBH). Medium resolution slits were used (0.15 DS).

3. Results and Discussion

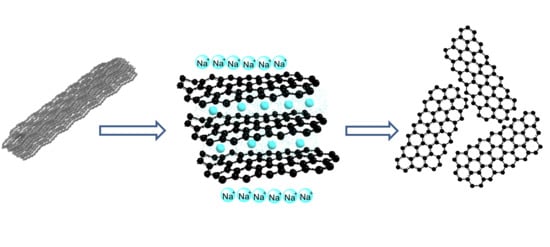
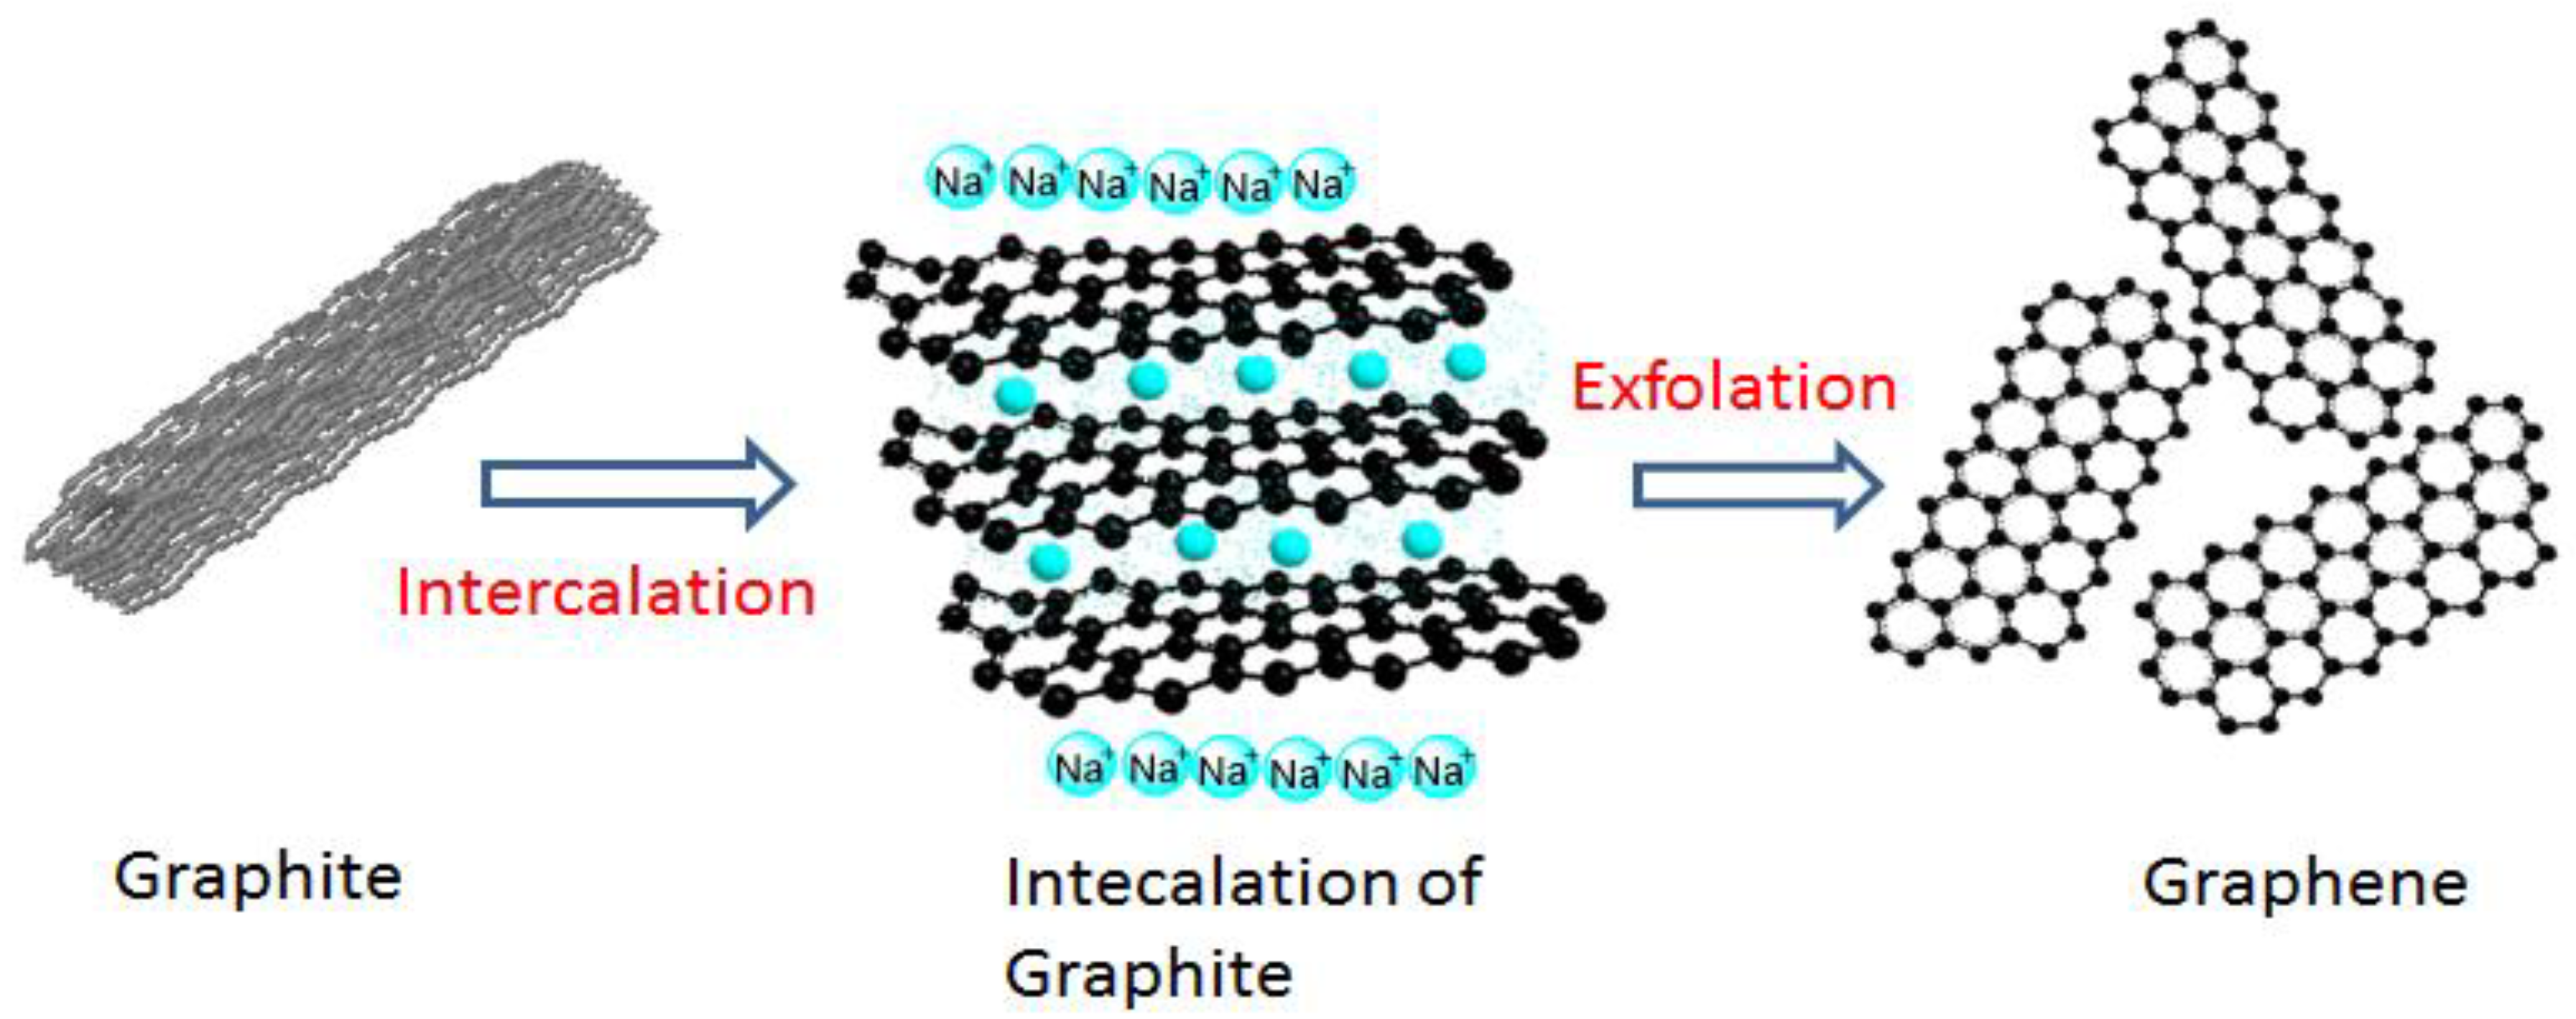
3.1. Intercalation of Sodium Ions into Graphite

Intercalation, because of inclusion of Na ions into graphite, is against the thermodynamic laws; however, lately it has been found that it is possible for solvated Na ions to intercalate within graphite [34]. We infer that this process leads to the intercalation of sodium ions between graphite sheets. The exfoliation energy of graphite has been stated to be 20 meV/C atom [35]. In order to exfoliate GIC using water, an exothermic energy of −184 kJ/mol is sufficient for Na metal [25,26]. Moreover, the reactivity of Na with water is relatively high as compared to elements in the periodic table which will greatly assist in exfoliating intercalated GICs [25,36].

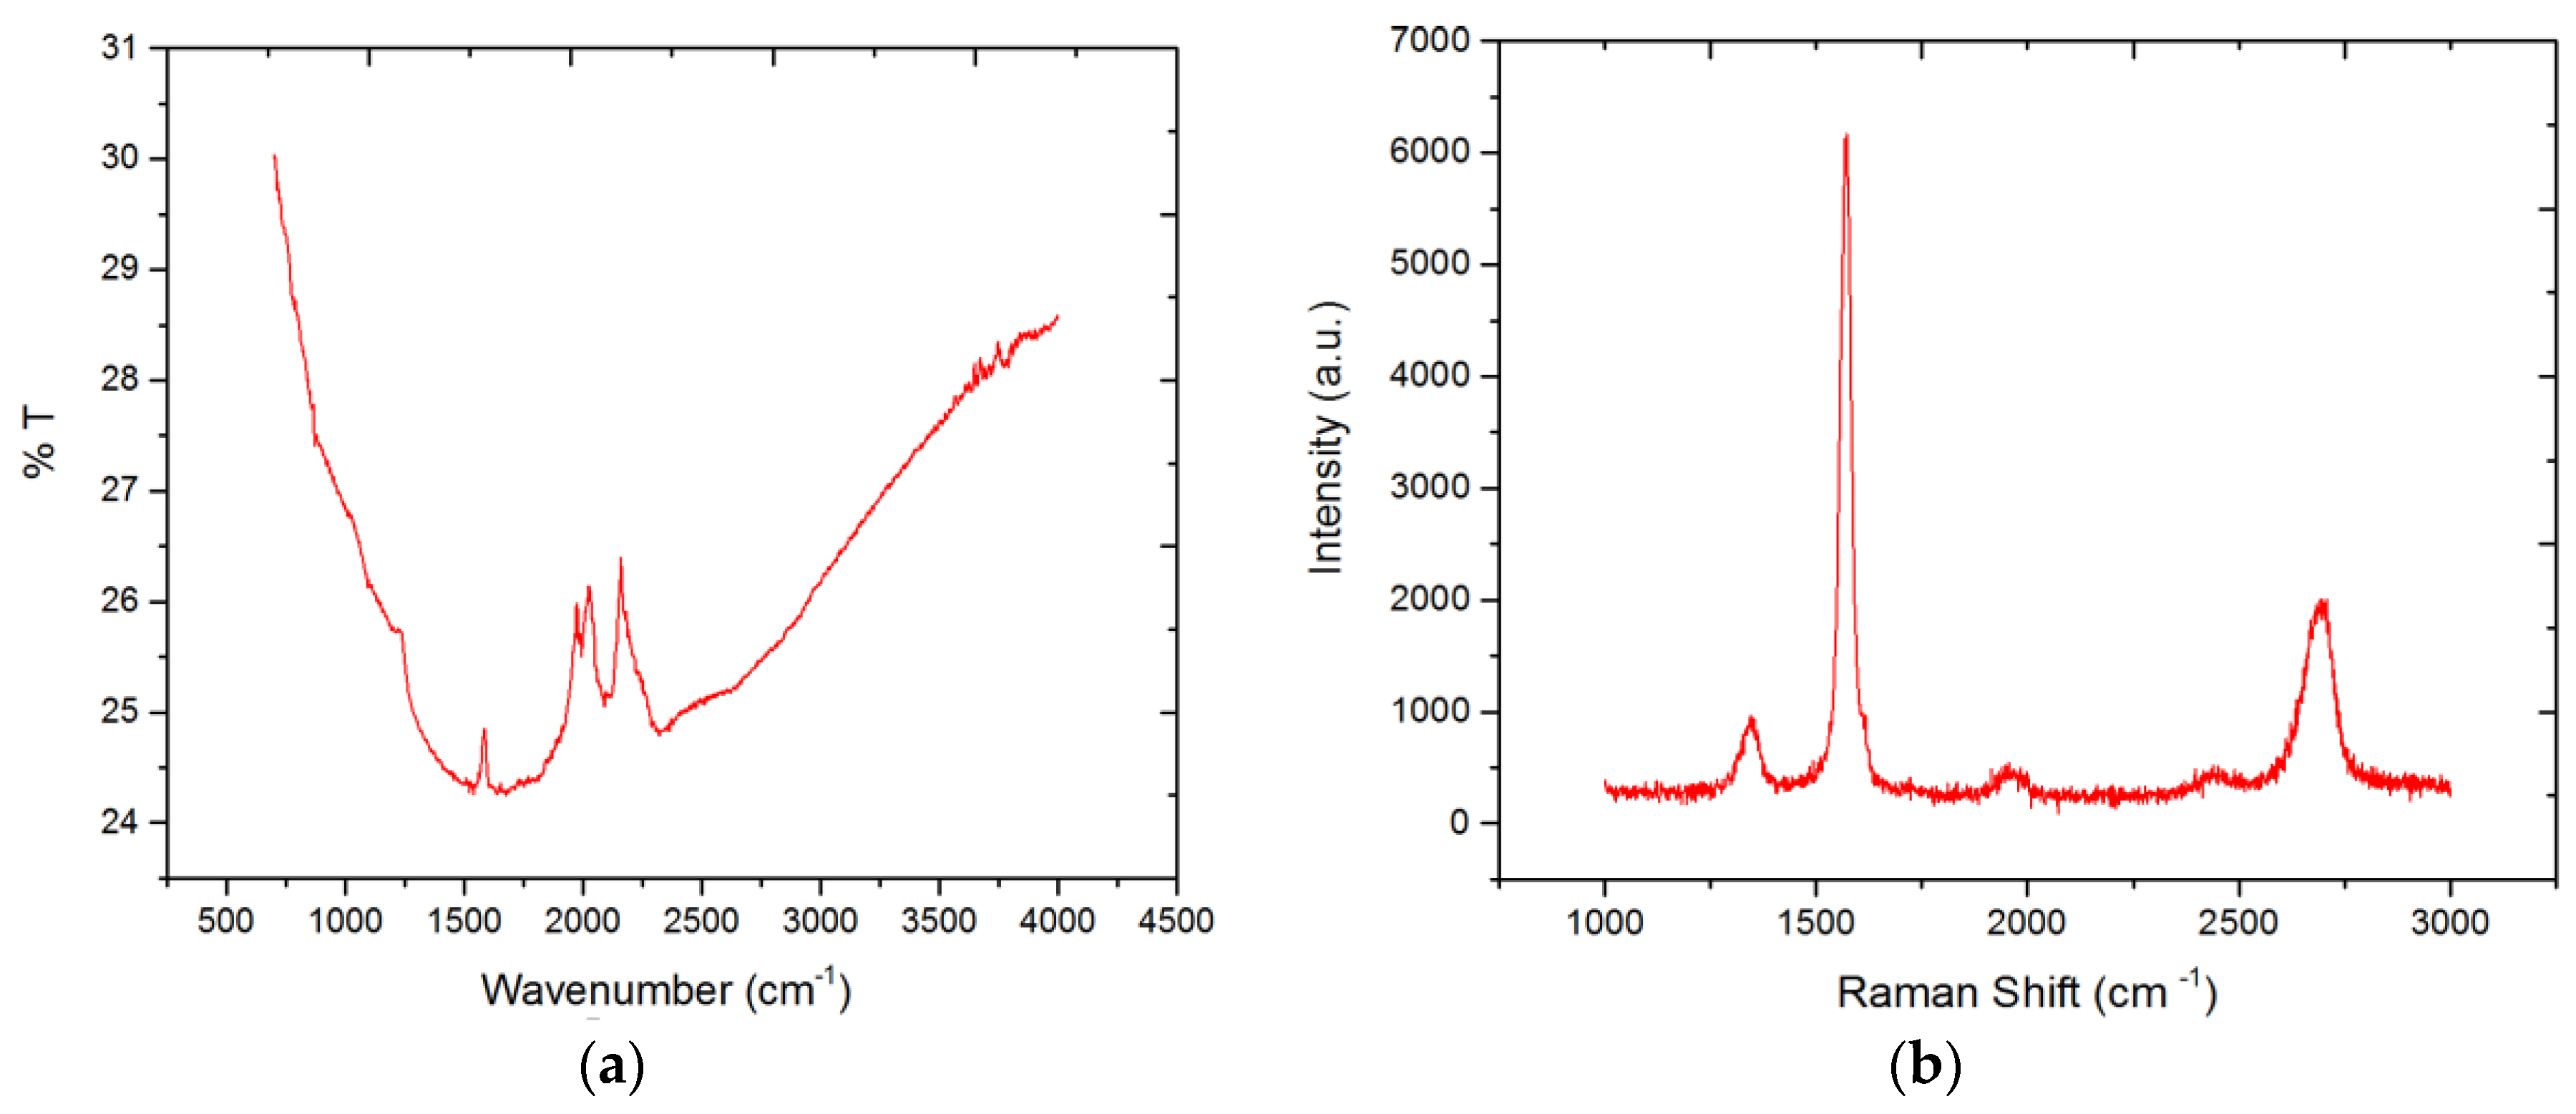
3.2. Raman Spectroscopy

The configuration, intensity and locations of the bands produced during Raman spectroscopy assist in the differentiation of various carbon materials on the basis of their properties. The π electrons in graphene are unusually dispersed, making Raman spectroscopy an effective tool to study the electronic properties of graphene [37]. The G band and G’ peak present at 1580 cm−1 and 2700 cm−1 are responsible for exhibiting features with the most intensity [38]. The G’ band is also referred to as the 2D peak since it is the ‘second order of the D peak’ [38].
The G peak relates to the E2g phonons present at the Brillouin zone center. The out-of-plane breathing mode of sp2 atoms gives rise to the D peak. This peak gets activated due to the presence of defects within the compound [39,40,41]. Therefore, this peak enables the estimation of impurities and defect level of graphene [41].
The presence of disorder leads to modification in band intensity as well as broadening of bands. The addition of disorder causes the D band to grow whereas amorphous carbon leads to the band reduction [42]. These phenomena can be represented by the following relations: (1) Tuinstra and Koenig, when La > 2 nm; I D I G = c / L a [43]; and (2) Ferrari, when La < 2 nm; I D I G = c L 2 [37,39]. Here, La is coherence length, c and c′ are quantities related to the laser wavelength’s fourth power [39,44,45]. These parameters are a function of the sample being tested [45,46].
Raman spectra of the fabricated GNS in powder form is represented in Figure 2a. From Figure 2b we infer the locations of the D peak, G peak and 2D peak for the fabricated compound to be 1341.58 cm−1, 1573.55 cm−1 and 2688.76 cm−1 respectively. The intensity ratio obtained is ID/IG = 0.32. This ID/IG value is similar to the one obtained by Huang et al. [33], equaling 0.29, while exfoliating graphite into graphene using Li metal. The ID/IG obtained signifies high-quality GNS because a low value of ID/IG implies that we have relatively lower defects. Additionally, Lee et al. synthesized graphene using a similar method where there was direct contact between graphite powder and Li foil and got a much higher intensity ratio of 0.55 [25]. This justifies the efficacy of our method over conventional electrochemical methods using Li as an intercalation source.

3.3. Fourier Transform Infrared Spectroscopy

Figure 2b shows Attenuated total reflectance-Fourier transform infrared (ATR-FTIR) spectroscopy obtained from a Frontier Perkin Elmer device equipped with single refection ATR attachment along with a diamond crystal. The material to be investigated was directly laid upon the ATR crystal. ATR-FTIR of graphene shows diamond peaks at 2000 cm−1, carbon double bonds at 1580 cm−1 and approximately 3% weak oxygen-carbon bonds at 1200 cm−1.

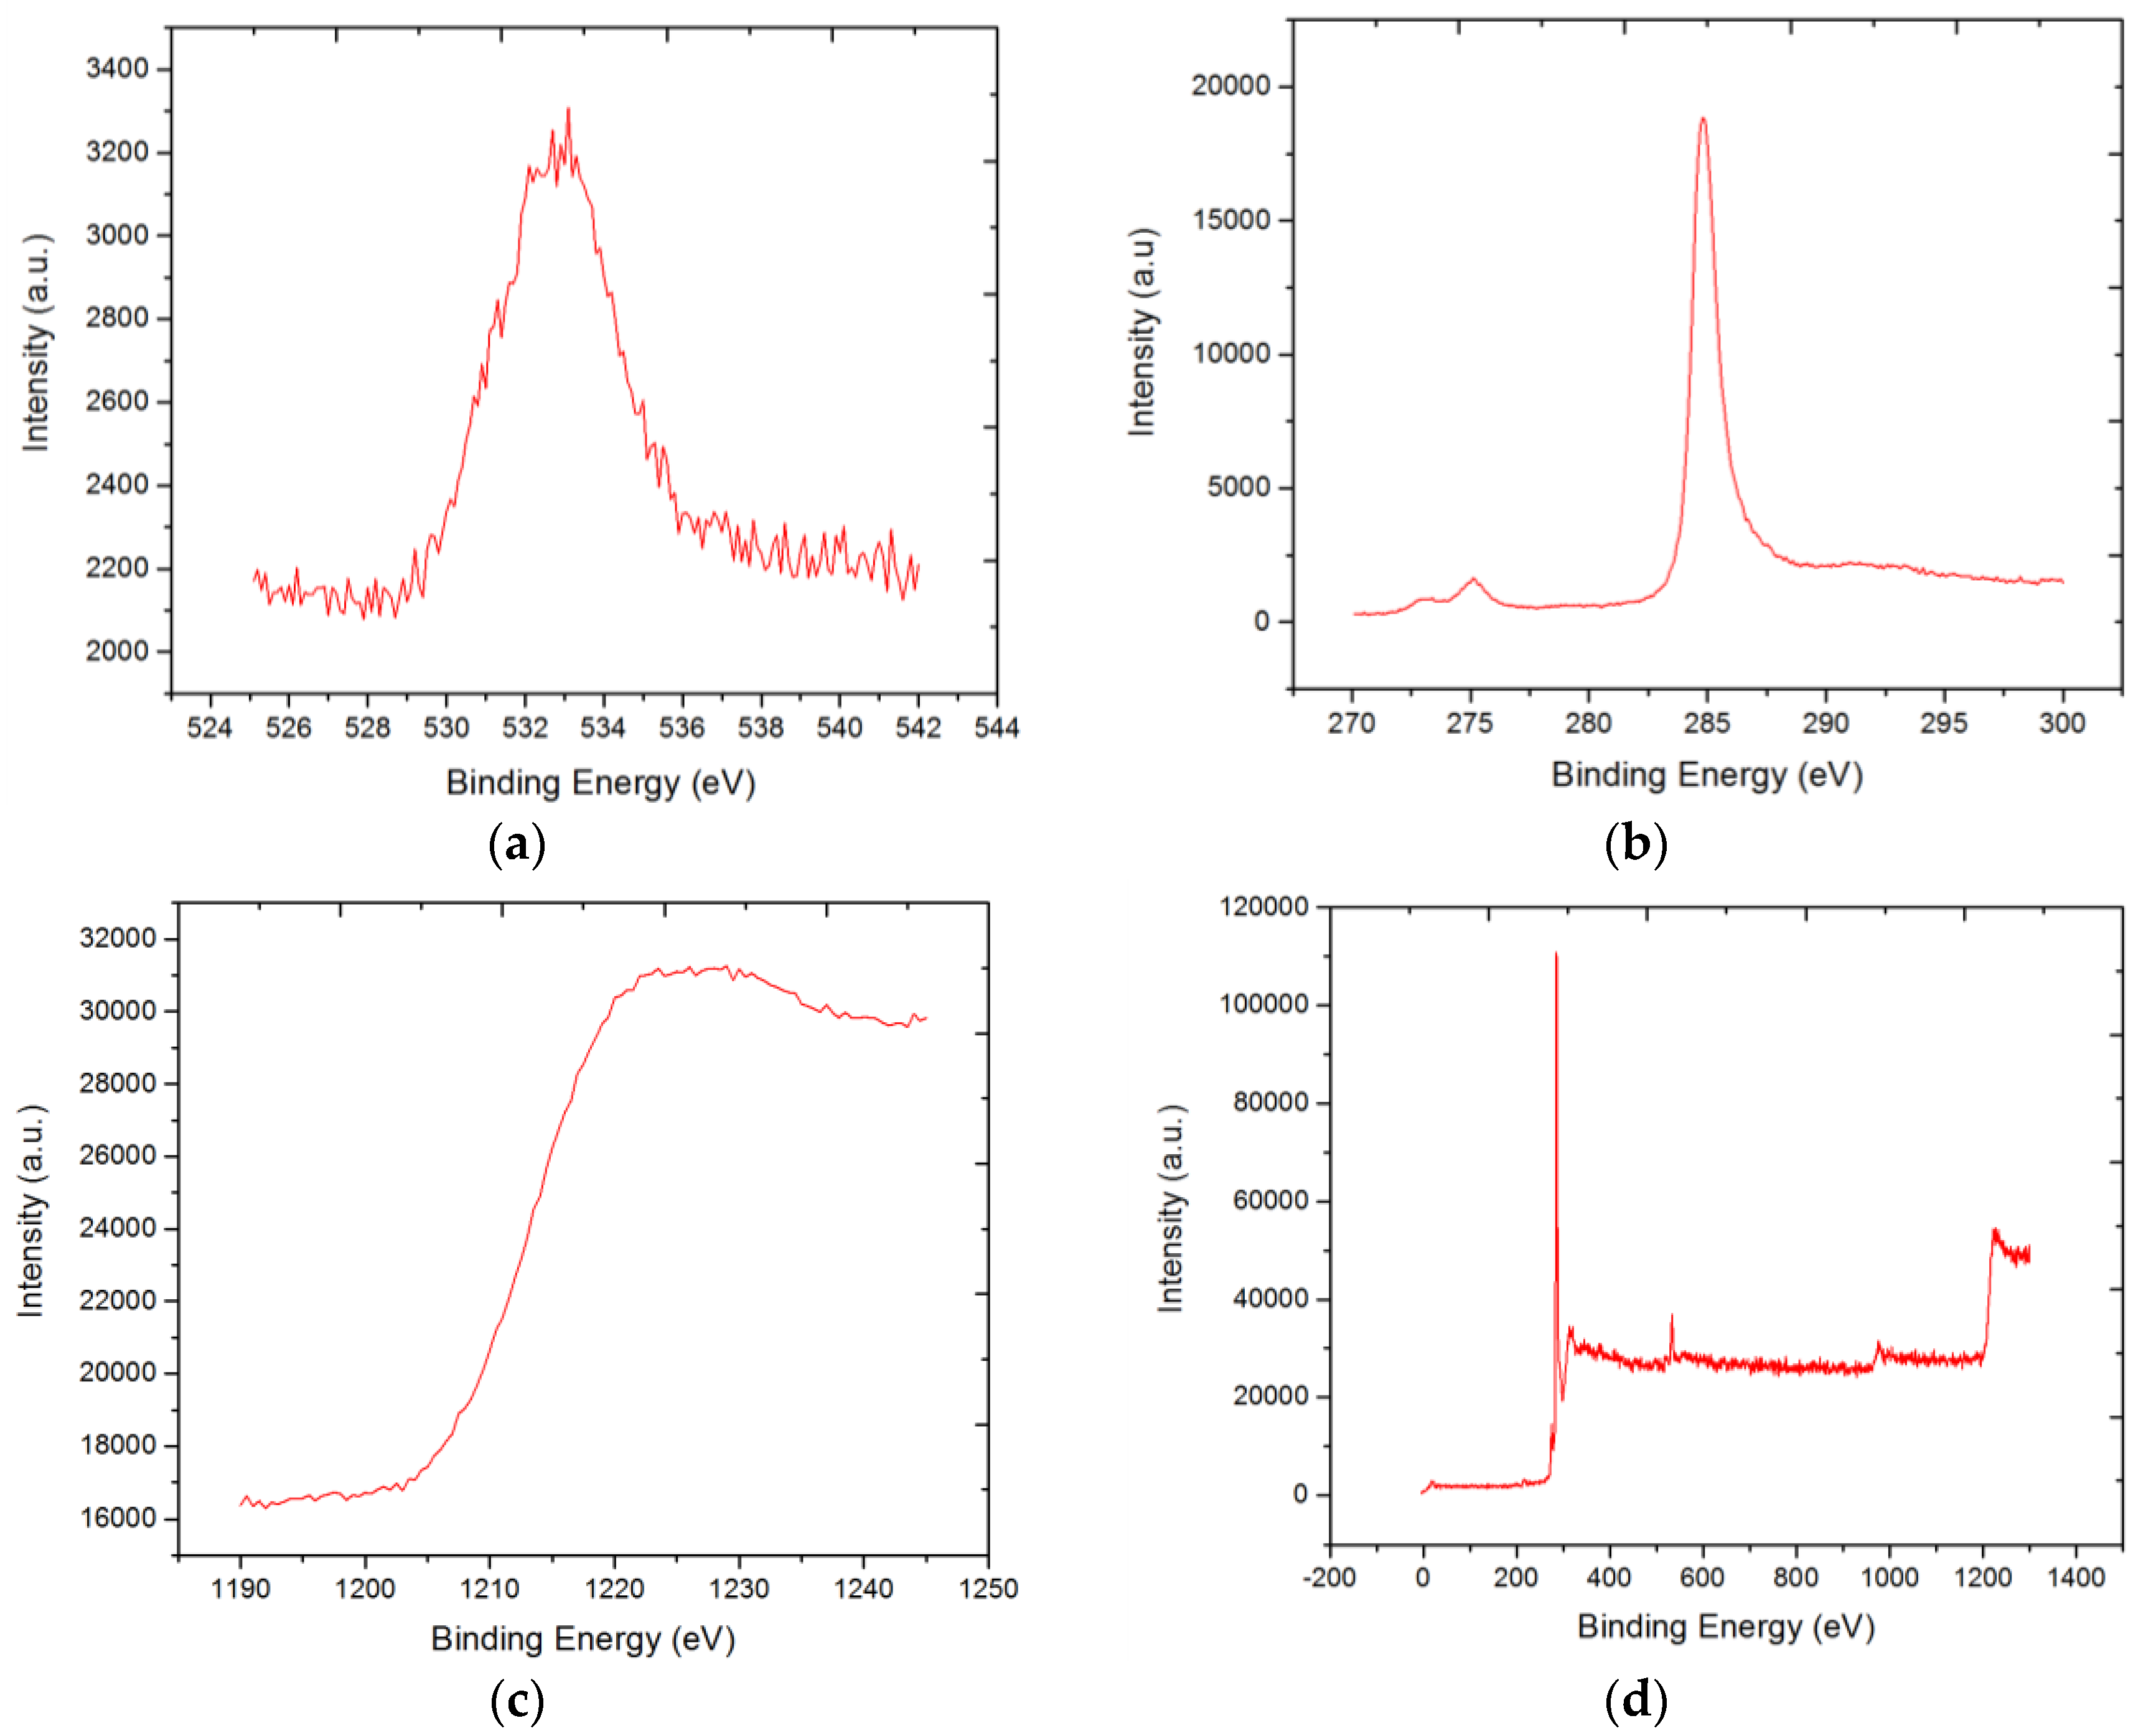
3.4. X-ray Photoelectron Spectroscopy

X-ray Photoelectron Spectroscopy (XPS) analysis of produced graphene nanosheets shows that they have sp2 hybridization. While performing XPS measurements, the sample was irradiated with 200 W unmonochromated Al Kα X-rays. The C 1s region of the graphene nanosheets 284.8 eV establishes that our compound consists of sp2 hybridized carbon (Figure 3b). The peak height of the O 1s spectrum is relatively low (Figure 3a), implying that the fabricated sample has around 3% oxygen and 97% carbon. Additionally, since the shake-up feature is almost at 292 eV, we can infer that the compound is devoid of sp3 bonding. The D parameter in the XPS spectra provides the energy difference between the highest and lowest peaks of the derivative [46]. These parameters provide the information regarding the quantity of carbon that is in the form of sp2 and sp3 [47].
The D parameter is found to be 21 eV, which is in line with properties displayed by pure sp2 carbon. XPS analysis shows that our compound consists of about 97% carbon and 3% oxygen, and this implies that it is mostly made up of pure carbon (Figure 3b,d).

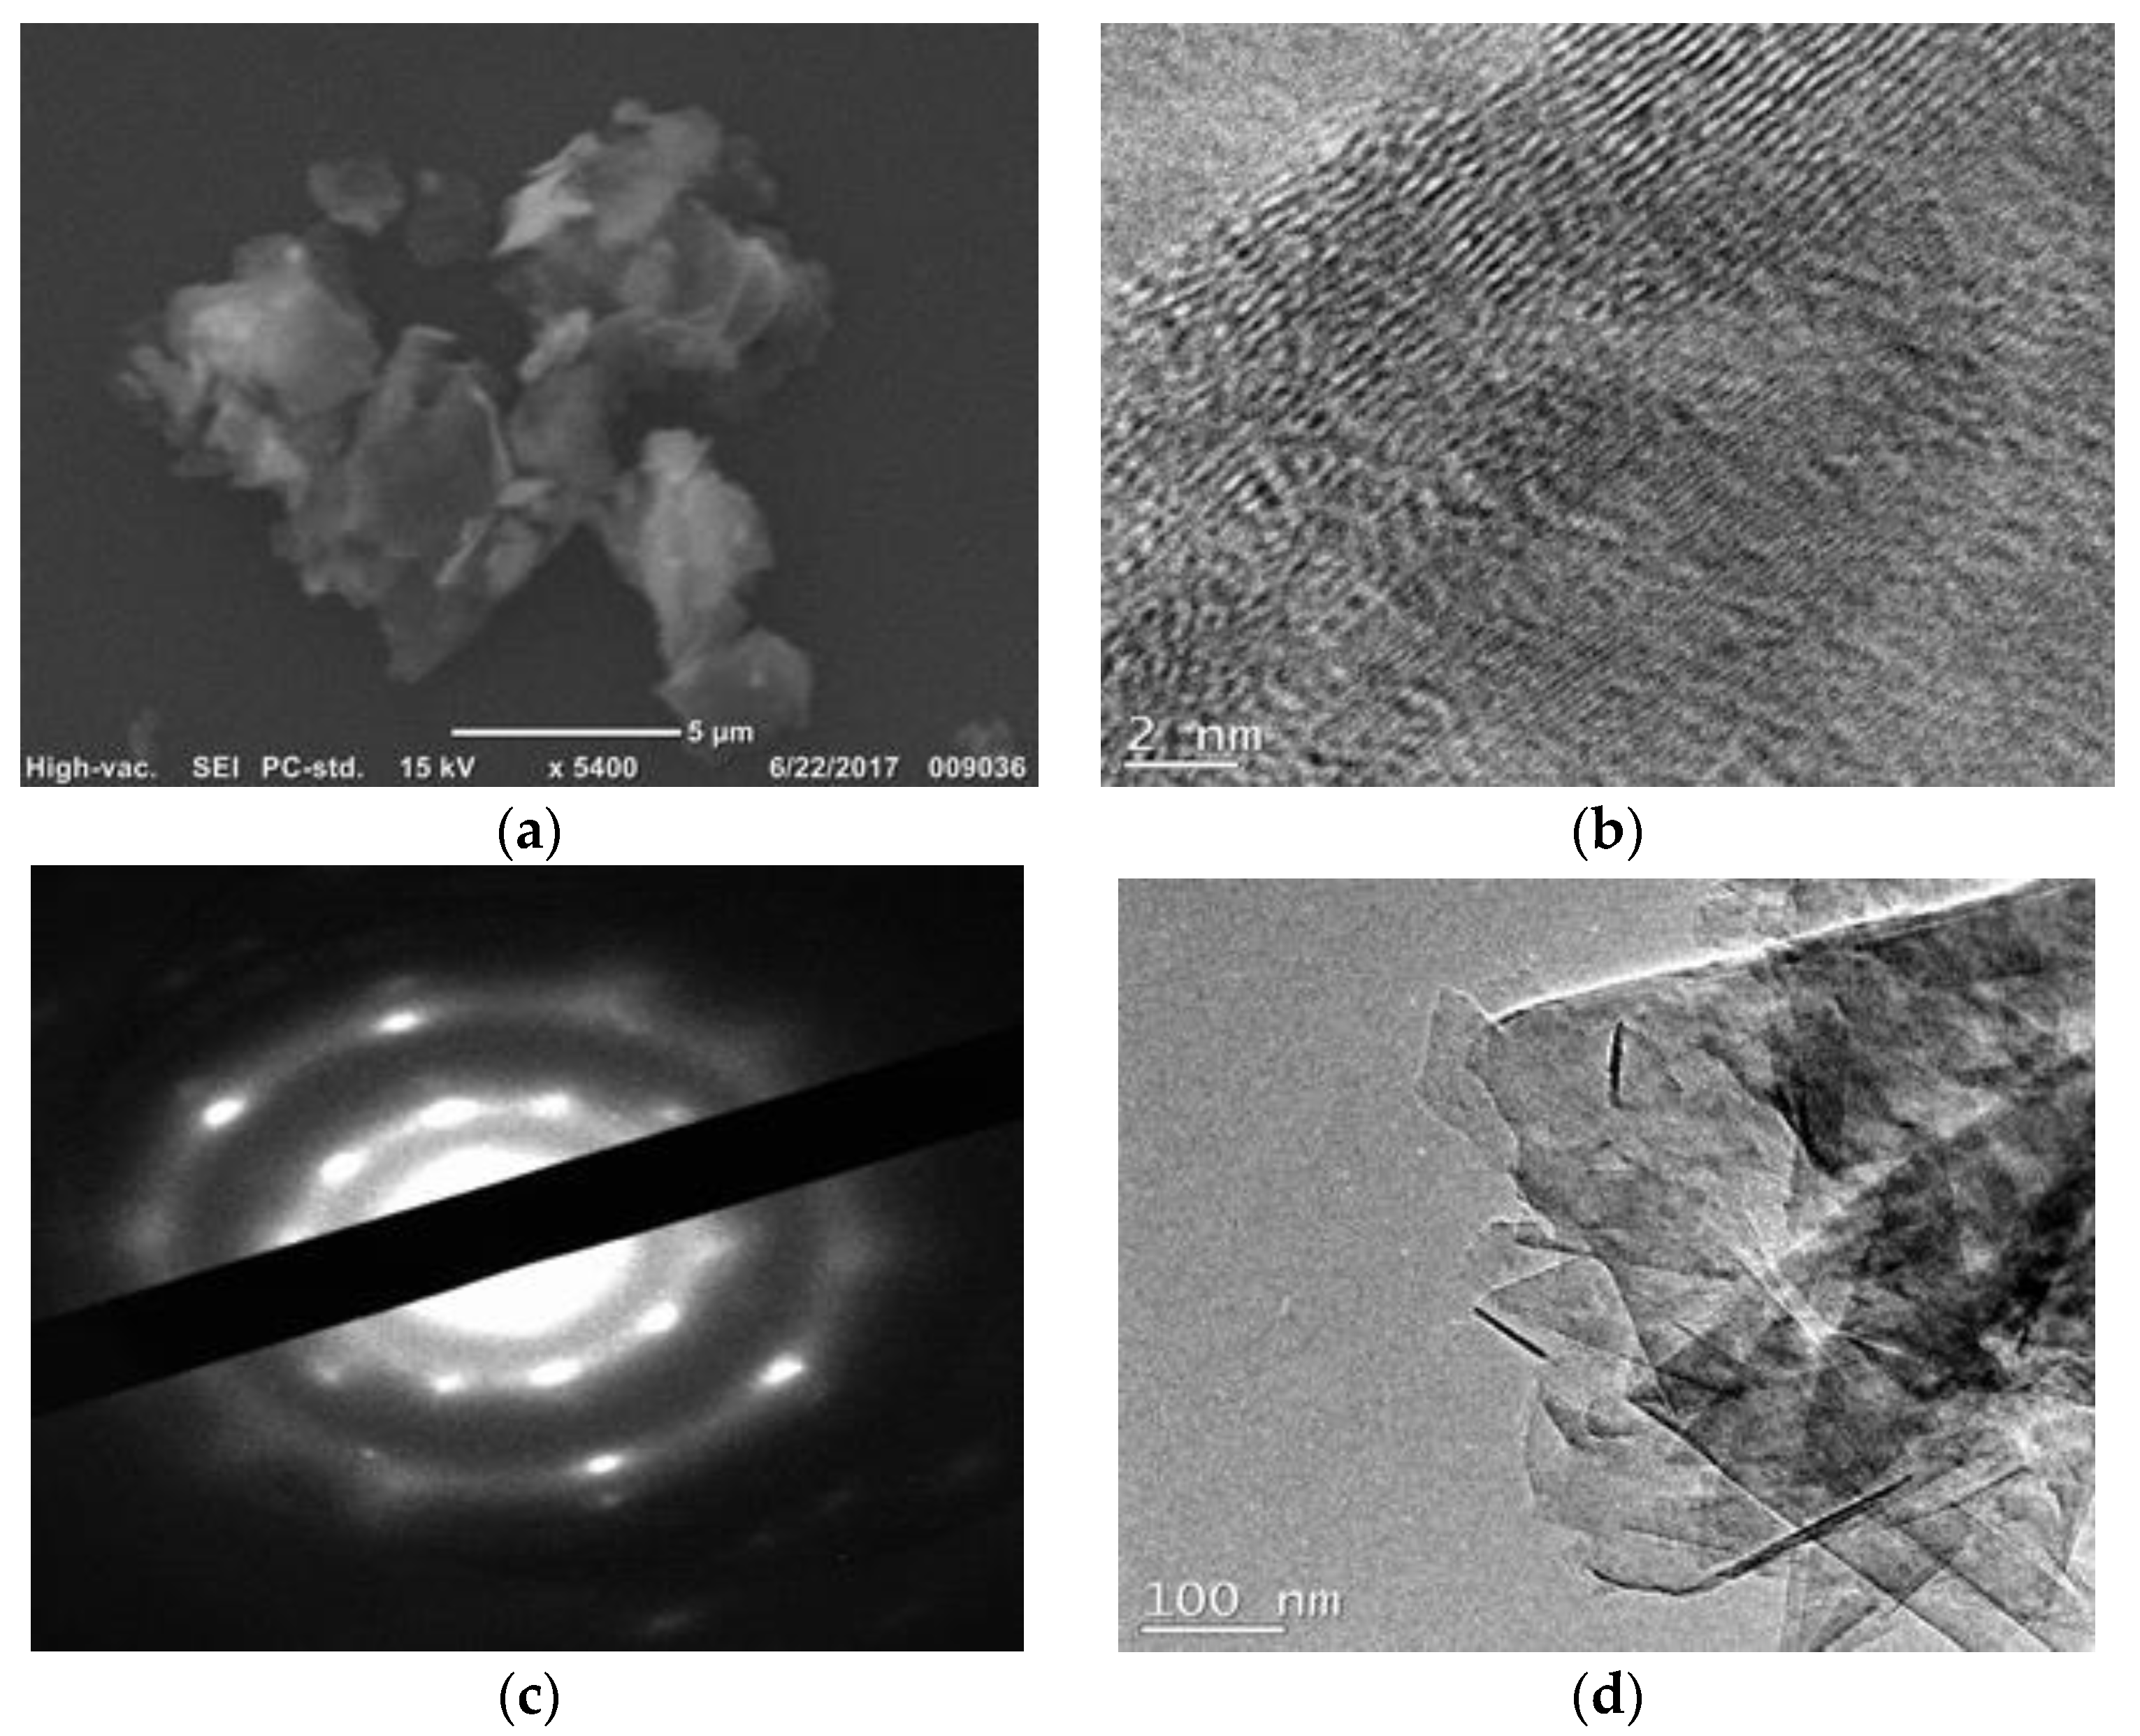
3.5. Scannning and Transmission Electron Microscopy Imaging

The morphology of demonstrations of SEM agglomeration and palette appearance has been presented in Figure 4a. A high-resolution image captured by a TEM microscope is displayed in Figure 4b. The image in Figure 4c shows a hexagonal diffraction pattern. Graphene presents a diffraction pattern in the form of a hexagonal lattice [48]. Figure 4d shows few-layer graphene nanosheets, obtained layer by layer using TEM. However, there is evidence of sheet aggregation, too. Graphene layers tend to restack due to strong interlayer van der Waal interactions between the layers. Wang et al. developed a method to prevent this occurrence by using carbon nano-tubes to prevent graphene sheets from coming together to form bulk graphite [49]. Additionally, graphene restacking is a common problem [49,50]. Sonication should help break bonds that were made during restacking. Furthermore, graphene nanosheets were found to be stable under the electron beam.

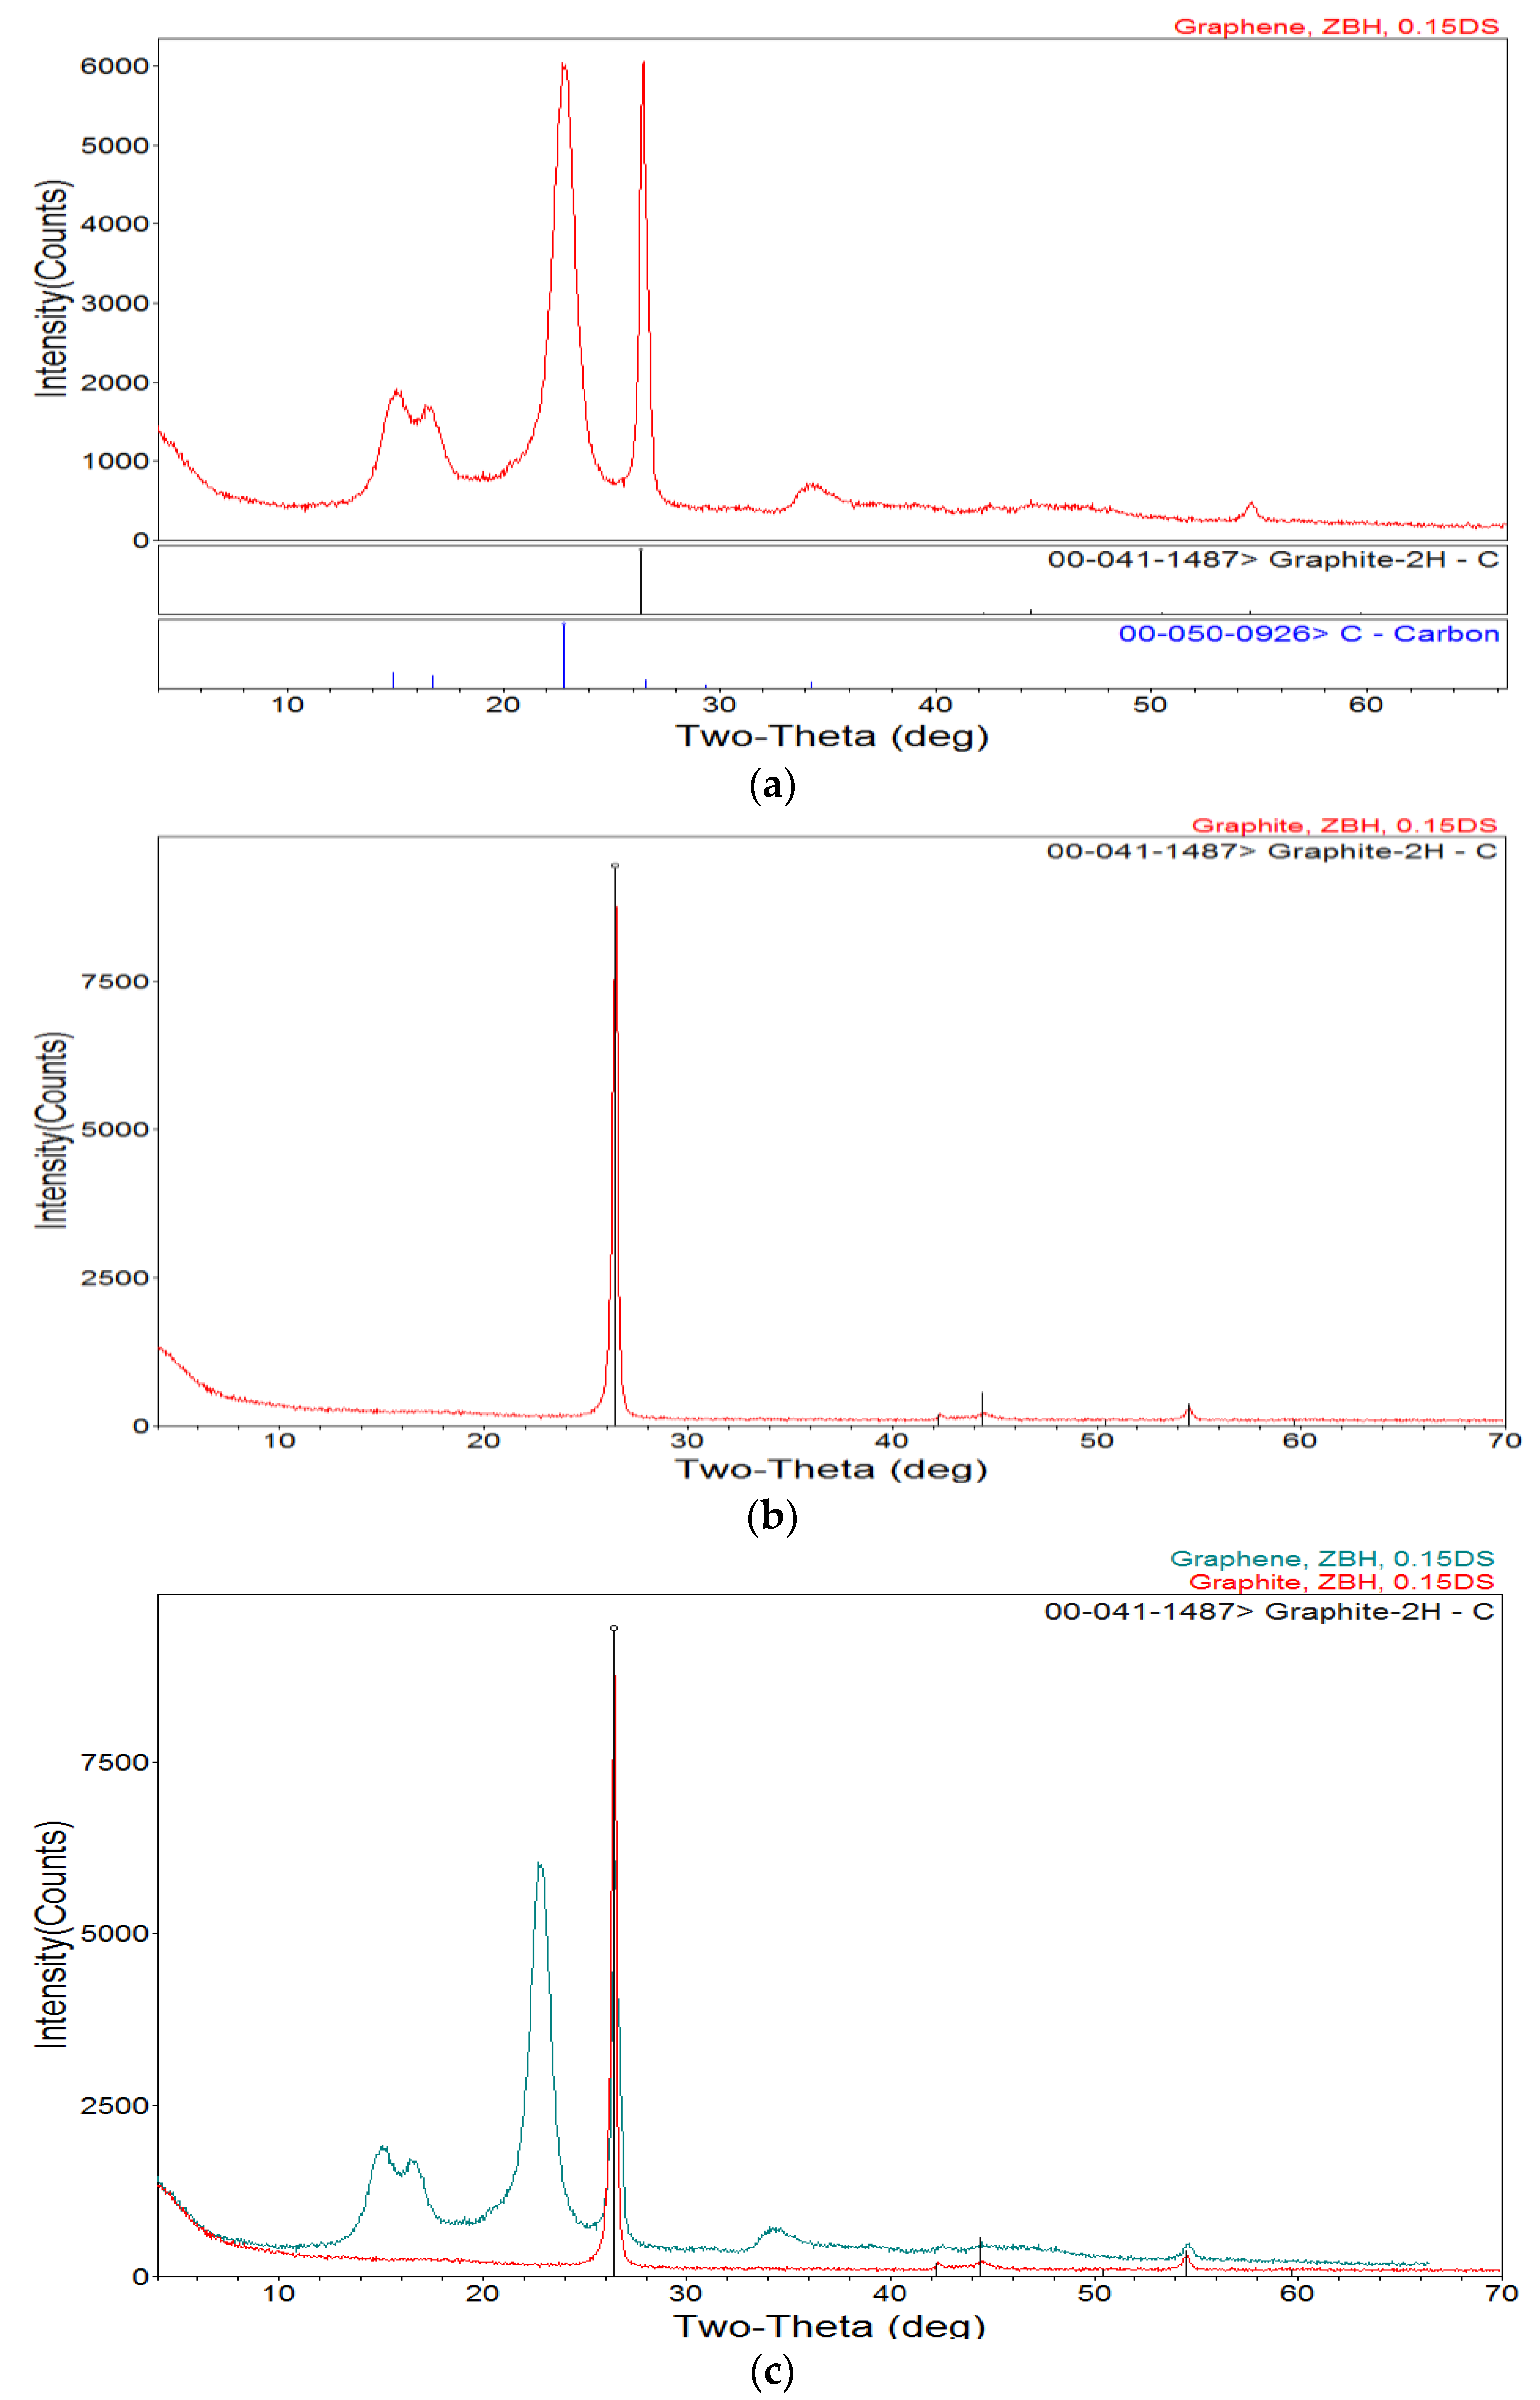
3.6. X-ray Diffraction

Figure 5 shows X-ray diffraction results. We observe a peak (120) that can be attributed to graphene at 2θ = 22.75°. The characteristic peak of graphite (002) is also apparent at 2θ = 26.45° (Figure 5b). The extent of graphene peak is much wider and gives a Scherrer crystallite size corresponding to 0.7 nm. The interlayer spacing between graphene sheets can be obtained using Bragg’s law,
λ = 2 · sin ( θ ) · d n
where, λ is the X-ray beam wavelength, θ is the diffraction angle, d is the interlayer distance between graphene layers and n gives the order of reflection. Here, λ = 0.1540 nm, θ = 11.38° and n is taken to be equal to 1. Herein, we obtain the interlayer spacing equaling 0.39 nm [51,52].
Furthermore, it can be observed that the phase concentration of graphene is much lower than that of graphite as observed in Figure 5c. However, this figure also shows that the graphene sample contains graphite in it.

4. Conclusions

A novel, efficient and cost-effective route to electrochemically produce few-layer GNS without the use of an external energy source was investigated. This process proceeds via two consecutive steps beginning with sodiation due to graphite powder and Na foil being placed in direct contact within EC:PC. This occurs due to solvated Na ions being intercalated into graphene. Subsequently, this leads to the formation of GIC, and its reaction with water produces GNS. The low ID/IG ratio and O/C ratios lends credibility to our claims of producing a low-defect and oxidation-free product. Our future work can include investigating solvents that lead to better intercalation of Na into graphite. Our research findings can be used in lowering the cost of manufacturing graphene while improving the production rate due to the availability of Na and its low cost. Also, a study may be conducted to determine the quantity of graphene produced using this method (relative to the amount of graphite used) as a comparison to other graphene-producing methods including lithium.

Author Contributions

D.-G.T. and E.K. designed and performed the experiments, analyzed the data and wrote the paper; N.H. assisted with analyzing the data; R.M. and N.N.H. conceived the research questions and objectives, and oversaw the project.

Funding

This research was partially supported by the Office of Naval Research (ONR) Grant N000141612246, ONR Grant N000141712620, and Department of Mechanical Enginering at Iowa State University.

Conflicts of Interest

The authors declare no conflict of interest.

References

  1. Novoselov, K.S.; Geim, A.K.; Morozov, S.V.; Jiang, D.A.; Zhang, Y.; Dubonos, S.V.; Grigorieva, I.V.; Firsov, A.A. Electric field effect in atomically thin carbon films. Science 2004, 306, 666–669. [Google Scholar] [CrossRef] [PubMed]
  2. Lei, H.; Yan, T.; Wang, H.; Shi, L.; Zhang, J.; Zhang, D. Graphene-like carbon nanosheets prepared by a Fe-catalyzed glucose-blowing method for capacitive deionization. J. Mater. Chem. A 2015, 3, 5934–5941. [Google Scholar] [CrossRef]
  3. Tan, R.K.; Reeves, S.P.; Hashemi, N.; Thomas, D.G.; Kavak, E.; Montazami, R.; Hashemi, N.N. Graphene as a flexible electrode: Review of fabrication approaches. J. Mater. Chem. A 2017, 5, 17777–17803. [Google Scholar] [CrossRef]
  4. Rao, C.E.; Sood, A.E.; Subrahmanyam, K.E.; Govindaraj, A. Graphene: The new two-dimensional nanomaterial. Angew. Chem. Int. Ed. 2009, 48, 7752–7777. [Google Scholar] [CrossRef] [PubMed]
  5. Malard, L.M.; Pimenta, M.A.; Dresselhaus, G.; Dresselhaus, M.S. Raman spectroscopy in graphene. Phys. Rep. 2009, 473, 51–87. [Google Scholar] [CrossRef]
  6. Li, D.; Müller, M.B.; Gilje, S.; Kaner, R.B.; Wallace, G.G. Processable aqueous dispersions of graphene nanosheets. Nat. Nanotechnol. 2008, 3, 101–105. [Google Scholar] [CrossRef] [PubMed]
  7. Nuvoli, D.; Valentini, L.; Alzari, V.; Scognamillo, S.; Bon, S.B.; Piccinini, M.; Illescas, J.; Mariani, A. High concentration few-layer graphene sheets obtained by liquid phase exfoliation of graphite in ionic liquid. J. Mater. Chem. 2011, 21, 3428–3431. [Google Scholar] [CrossRef]
  8. Zhao, W.; Fang, M.; Wu, F.; Wu, H.; Wang, L.; Chen, G. Preparation of graphene by exfoliation of graphite using wet ball milling. J. Mater. Chem. 2010, 20, 5817–5819. [Google Scholar] [CrossRef]
  9. Ambrosi, A.; Chua, C.K.; Bonanni, A.; Pumera, M. Electrochemistry of graphene and related materials. Chem. Rev. 2014, 114, 7150–7188. [Google Scholar] [CrossRef] [PubMed]
  10. Low, C.T.; Walsh, F.C.; Chakrabarti, M.H.; Hashim, M.A.; Hussain, M.A. Electrochemical approaches to the production of graphene flakes and their potential applications. Carbon 2013, 54, 1–21. [Google Scholar] [CrossRef]
  11. Bharath, G.; Alhseinat, E.; Ponpandian, N.; Khan, M.A.; Siddiqui, M.R.; Ahmed, F.; Alsharaeh, E.H. Development of adsorption and electrosorption techniques for removal of organic and inorganic pollutants from wastewater using novel magnetite/porous graphene-based nanocomposites. Sep. Purif. Technol. 2017, 188, 206–218. [Google Scholar] [CrossRef]
  12. Zhong, Y.L.; Tian, Z.; Simon, G.P.; Li, D. Scalable production of graphene via wet chemistry: progress and challenges. Mater. Today 2015, 18, 73–78. [Google Scholar] [CrossRef]
  13. Novoselov, K.S.; Fal, V.I.; Colombo, L.; Gellert, P.R.; Schwab, M.G.; Kim, K. A roadmap for graphene. Nature 2012, 490, 192. [Google Scholar] [CrossRef] [PubMed]
  14. Lu, J.; Yang, J.X.; Wang, J.Z.; Lim, A.L.; Wang, S.; Loh, K.P. One-pot synthesis of fluorescent carbon nanoribbons, nanoparticles, and graphene by the exfoliation of graphite in ionic liquids. ACS Nano 2009, 3, 2367–2375. [Google Scholar] [CrossRef] [PubMed]
  15. Wang, J.; Manga, K.K.; Bao, Q.; Loh, K.P. High-yield synthesis of few-layer graphene flakes through electrochemical expansion of graphite in propylene carbonate electrolyte. J. Am. Chem. Soc. 2011, 133, 8888–8891. [Google Scholar] [CrossRef] [PubMed]
  16. Liu, N.; Luo, F.; Wu, H.; Liu, Y.; Zhang, C.; Chen, J. One-step ionic-liquid-assisted electrochemical synthesis of ionic-liquid-functionalized graphene sheets directly from graphite. Adv. Funct. Mater. 2008, 18, 1518–1525. [Google Scholar] [CrossRef]
  17. Parvez, K.; Li, R.; Puniredd, S.R.; Hernandez, Y.; Hinkel, F.; Wang, S.; Feng, X.; Müllen, K. Electrochemically exfoliated graphene as solution-processable, highly conductive electrodes for organic electronics. ACS Nano 2013, 7, 3598–3606. [Google Scholar] [CrossRef] [PubMed]
  18. Su, C.Y.; Lu, A.Y.; Xu, Y.; Chen, F.R.; Khlobystov, A.N.; Li, L.J. High-quality thin graphene films from fast electrochemical exfoliation. ACS Nano 2011, 5, 2332–2339. [Google Scholar] [CrossRef] [PubMed]
  19. Parvez, K.; Wu, Z.S.; Li, R.; Liu, X.; Graf, R.; Feng, X.; Mullen, K. Exfoliation of graphite into graphene in aqueous solutions of inorganic salts. J. Am. Chem. Soc. 2014, 136, 6083–6091. [Google Scholar] [CrossRef] [PubMed]
  20. Shang, N.G.; Papakonstantinou, P.; Sharma, S.; Lubarsky, G.; Li, M.; McNeill, D.W.; Quinn, A.J.; Zhou, W.; Blackley, R. Controllable selective exfoliation of high-quality graphene nanosheets and nanodots by ionic liquid assisted grinding. Chem. Commun. 2012, 48, 1877–1879. [Google Scholar] [CrossRef] [PubMed]
  21. Liu, J.; Yang, H.; Zhen, S.G.; Poh, C.K.; Chaurasia, A.; Luo, J.; Wu, X.; Yeow, E.K.; Sahoo, N.G.; Lin, J.; Shen, Z. A green approach to the synthesis of high-quality graphene oxide flakes via electrochemical exfoliation of pencil core. RSC Adv. 2013, 3, 11745–11750. [Google Scholar] [CrossRef]
  22. Zheng, Y.; Ni, G.X.; Bae, S.; Cong, C.X.; Kahya, O.; Toh, C.T.; Kim, H.R.; Im, D.; Yu, T.; Ahn, J.H.; Hong, B.H. Wafer-scale graphene/ferroelectric hybrid devices for low-voltage electronics. EPL (Europhys. Lett.) 2011, 93, 17002. [Google Scholar] [CrossRef] [Green Version]
  23. Wang, G.; Shen, X.; Yao, J.; Park, J. Graphene nanosheets for enhanced lithium storage in lithium ion batteries. Carbon 2009, 47, 2049–2053. [Google Scholar] [CrossRef]
  24. Wang, H.; Zhang, D.; Yan, T.; Wen, X.; Shi, L.; Zhang, J. Graphene prepared via a novel pyridine–thermal strategy for capacitive deionization. J. Mater. Chem. 2012, 22, 23745–23748. [Google Scholar] [CrossRef]
  25. Lee, J.W.; Kim, M.; Na, W.; Hong, S.M.; Koo, C.M. Fabrication of high quality graphene nanosheets via a spontaneous electrochemical reaction process. Carbon 2015, 91, 527–534. [Google Scholar] [CrossRef]
  26. Lithium Element Facts. Available online: https://www.chemicool.com/elements/lithium.html (accessed on 4 July 2018).
  27. Seyfried, W.E., Jr.; Janecky, D.R.; Mottl, M.J. Alteration of the oceanic crust: Implications for geochemical cycles of lithium and boron. Geochim. Cosmochim. Acta 1984, 48, 557–569. [Google Scholar] [CrossRef]
  28. Ellis, B.L.; Makahnouk, W.R.; Makimura, Y.; Toghill, K.; Nazar, L.F. A multifunctional 3.5 V iron-based phosphate cathode for rechargeable batteries. Nat. Mater. 2007, 6, 749. [Google Scholar] [CrossRef] [PubMed]
  29. Palomares, V.; Serras, P.; Villaluenga, I.; Hueso, K.B.; Carretero-González, J.; Rojo, T. Na-ion batteries, recent advances and present challenges to become low cost energy storage systems. Energy Environ. Sci. 2012, 5, 5884–5901. [Google Scholar] [CrossRef]
  30. Lotya, M.; Hernandez, Y.; King, P.J.; Smith, R.J.; Nicolosi, V.; Karlsson, L.S.; Blighe, F.M.; De, S.; Wang, Z.; McGovern, I.T.; Duesberg, G.S. Liquid phase production of graphene by exfoliation of graphite in surfactant/water solutions. J. Am. Chem. Soc. 2009, 131, 3611–3620. [Google Scholar] [CrossRef] [PubMed]
  31. Kim, M.; Xu, F.; Lee, J.H.; Jung, C.; Hong, S.M.; Zhang, Q.M.; Koo, C.M. A fast and efficient pre-doping approach to high energy density lithium-ion hybrid capacitors. J. Mater. Chem. A 2014, 2, 10029–10033. [Google Scholar] [CrossRef]
  32. Park, H.; Kim, M.; Xu, F.; Jung, C.; Hong, S.M.; Koo, C.M. In situ synchrotron wide-angle X-ray scattering study on rapid lithiation of graphite anode via direct contact method for Li-ion capacitors. J. Power Sources 2015, 283, 68–73. [Google Scholar] [CrossRef]
  33. Huang, H.; Xia, Y.; Tao, X.; Du, J.; Fang, J.; Gan, Y.; Zhang, W. Highly efficient electrolytic exfoliation of graphite into graphene sheets based on Li ions intercalation-expansion-microexplosion mechanism. J. Mater. Chem. 2012, 22, 10452–10456. [Google Scholar] [CrossRef]
  34. Kim, H.; Hong, J.; Yoon, G.; Kim, H.; Park, K.Y.; Park, M.S.; Yoon, W.S.; Kang, K. Sodium intercalation chemistry in graphite. Energy Environ. Sci. 2015, 8, 2963–2969. [Google Scholar] [CrossRef]
  35. Charlier, J.C.; Gonze, X.; Michenaud, J.P. Graphite interplanar bonding: Electronic delocalization and van der Waals interaction. EPL (Europhys. Lett.) 1994, 28, 403. [Google Scholar] [CrossRef]
  36. Briggs, J. Science in Focus Chemistry for Secondary 5 Normal (Academic): Theory Workbook; Pearson Education South Asia: Singapore, 2005. [Google Scholar]
  37. Ferrari, A.C.; Robertson, J. Raman spectroscopy of amorphous, nanostructured, diamond-like carbon, and nanodiamond. Philos. Trans. A Math. Phys. Eng. Sci. 2004, 362, 2477–2512. [Google Scholar] [CrossRef] [PubMed]
  38. Vidano, R.P.; Fischbach, D.B.; Willis, L.J.; Loehr, T.M. Observation of Raman band shifting with excitation wavelength for carbons and graphites. Solid State Commun. 1981, 39, 341–344. [Google Scholar] [CrossRef]
  39. Ferrari, A.C.; Robertson, J. Resonant Raman spectroscopy of disordered, amorphous, and diamondlike carbon. Phys. Rev. B 2001, 64, 075414. [Google Scholar] [CrossRef]
  40. Thomsen, C.; Reich, S. Double resonant Raman scattering in graphite. Phys. Rev. Lett. 2000, 85, 5214. [Google Scholar] [CrossRef] [PubMed]
  41. Soldano, C.; Mahmood, A.; Dujardin, E. Production, properties and potential of graphene. Carbon 2010, 48, 2127–2150. [Google Scholar] [CrossRef]
  42. Merlen, A.; Buijnsters, J.G.; Pardanaud, C. A guide to and review of the use of multiwavelength Raman spectroscopy for characterizing defective aromatic carbon solids: From graphene to amorphous carbons. Coatings 2017, 7, 153. [Google Scholar] [CrossRef]
  43. Krishnan, R.S.; Shankar, R.K. Raman effect: History of the discovery. J. Raman Spectrosc. 1981, 10, 1–8. [Google Scholar] [CrossRef]
  44. Cançado, L.G.; Jorio, A.; Pimenta, M.A. Measuring the absolute Raman cross section of nanographites as a function of laser energy and crystallite size. Phys. Rev. B 2007, 76, 064304. [Google Scholar] [CrossRef]
  45. Pardanaud, C.; Martin, C.; Roubin, P. Multiwavelength Raman spectroscopy analysis of a large sampling of disordered carbons extracted from the Tore Supra tokamak. Vib. Spectrosc. 2014, 70, 187–192. [Google Scholar] [CrossRef] [Green Version]
  46. Li, Z.; Han, J.; Fan, L.; Guo, R. In-situ controllable growth of α-Ni(OH)2 with different morphologies on reduced graphene oxide sheets and capacitive performance for supercapacitors. Colloid Polym. Sci. 2016, 294, 681–689. [Google Scholar] [CrossRef]
  47. Carbon Non-Metals. Available online: https://xpssimplified.com/elements/carbon.php (accessed on 4 July 2018).
  48. Shevitski, B. Structural Properties of Graphene and Carbon Nanotubes. Procedia IUTAM 2010, 28, 1–8. [Google Scholar]
  49. Wang, Y.; Wu, Y.; Huang, Y.; Zhang, F.; Yang, X.; Ma, Y.; Chen, Y. Preventing graphene sheets from restacking for high-capacitance performance. J. Phys. Chem. C 2011, 115, 23192–23197. [Google Scholar] [CrossRef]
  50. Pumera, M. Electrochemistry of graphene, graphene oxide and other graphenoids. Electrochem. Commun. 2013, 36, 14–18. [Google Scholar] [CrossRef]
  51. Tanuma, S.I.; Palnichenko, A. Synthesis of low density carbon crystal “carbolite” by quenching of carbon gas. J. Mater. Res. 1995, 10, 1120–1125. [Google Scholar] [CrossRef]
  52. Bai, Z.; Lin, H.; Johnson, J.; Gui, S.C.; Imakita, K.; Montazami, R.; Fujii, M.; Hashemi, N. The single-band red upconversion luminescence from morphology and size controllable Er3+/Yb3+ doped MnF2 nanostructures. J. Mater. Chem. C 2014, 2, 1736–1741. [Google Scholar] [CrossRef]
Figure 1. Schematic showing intercalation of solvated Na ions between graphite layers leading to the formation of individual graphene sheets.
Carbon 04 00042 g001
Figure 2. (a) Attenuated total reflectance-Fourier transform infrared (ATR-FTIR) spectroscopy (Frontier Perkin Elmer) equipped with single reflection ATR attachment. (b) Raman spectra of fabricated graphene nanosheets. The locations of the D peak, G peak and 2D peak are 1341.58 cm−1, 1573.55 cm−1 and 2688.76 cm−1, respectively. The obtained intensity ratio ID/IG of 0.32 represents manufacturing of high quality GNS.
Carbon 04 00042 g002
Figure 3. X-ray photoelectron spectroscopy (XPS) analysis of graphene nanosheets. (a) O 1s spectrum peak position: 532.8 eV. The sample consists of about 3% oxygen. There is approximately 3% oxygen within the sample; (b) C 1s spectrum peak position: 284.8 eV. (c) High binding energy featured at about 290 eV. This data confirms the C Auger region. The D parameter is found to be 21 eV, verifying the presence of pure sp2 carbon. (d) XPS characterization of GNS raw data 284.8 eV shows C 1s spectrum, the O 1s spectrum peaks position is at 532.8 eV, the ~1000 eV peaks come from oxygen.
Carbon 04 00042 g003
Figure 4. High-resolution Scanning Electron Microscope (SEM) and Transmission Electron Microscopy (TEM) images of our fabricated product: (a) high-resolution SEM image of GNS, (b) high-resolution TEM image of GNS, (c) electron diffraction pattern of GNS, and (d) low-resolution TEM image of GNS.
Carbon 04 00042 g004
Figure 5. X-ray diffraction patterns of (a) graphene and (b) graphite; and (c) overlay of graphite and graphene. ‘ZBH’ describes the background holder, ‘DS’ describes the slit resolution and 00-14-1487 is a reference code to compare graphite with a standard value.
Carbon 04 00042 g005

