Article

Thermal Efficiency Analysis of a 1 kW ORC System with a Solar Collection Stage and R-245fa Working Fluid: A Case Study

by
Raúl Alejandro Martínez-Sánchez
1,
José M. Álvarez-Alvarado
1,
Gerardo I. Pérez-Soto
1,*,
Idalberto Macías-Socarrás
2,
Karla A. Camarillo-Gómez
3 and
Juvenal Rodríguez-Reséndiz
1,*
1
Facultad de Ingeniería, Universidad Autónoma de Querétaro, Santiago de Querétaro 76010, QRO, Mexico
2
Facultad de Ciencias Agrarias, Universidad Estatal Península de Santa Elena, Santa Elena 240204, Ecuador
3
Departament of Mechanical Engineering, Tecnológico Nacional de México en Celaya, Celaya 38010, GTO, Mexico
*
Authors to whom correspondence should be addressed.
Fluids 2024, 9(9), 217; https://doi.org/10.3390/fluids9090217
Submission received: 1 June 2024 / Revised: 6 July 2024 / Accepted: 12 September 2024 / Published: 15 September 2024
(This article belongs to the Special Issue Evaporation, Condensation and Heat Transfer)

Abstract

A thermal efficiency analysis of an organic Rankine cycle (ORC) system enables its performance to be evaluated; for this purpose, critical system components, including the turbine and the boiler, must be scrutinized. ORC plants can operate under various regimes, such as simple, regeneration, and reheat work modes. Organic fluids such as R-245fa integrate low-temperature sources such as solar radiation. However, a literature review revealed limited research on the impact of a solar collection system on the overall thermal efficiency of an ORC system during the regeneration stage. In this study, we examined the thermal efficiency behavior of an ORC plant with a 1 kW generator operating in simple and regeneration modes with a solar collection stage. The results show that the thermal efficiency in simple mode was 35.27%, while in regeneration mode with solar collection it reached 51.30%. Improving the thermal efficiency of a thermodynamic cycle system can reduce CO2 emissions. The operating temperature ranges facilitate the development of a methodology for industries to implement ORC systems in their manufacturing processes, thereby utilizing waste heat from industrial operations.

1. Introduction

The organic Rankine cycle (ORC) is a thermodynamic system that generates power or work. It operates similarly to a conventional water vapor Rankine cycle, with the primary differences being the working fluid and the operating temperature of the cycle [1].
The ORC is a process involving an organic working fluid that alternates between phases of evaporation and condensation. In the boiler, the combustion of a flammable substance produces steam at a specific pressure; the steam then flows to a turbine where it expands, performing mechanical work on the turbine shaft. The expanded steam loses pressure and temperature as it moves on to a condenser (or cooling tower), condensing and precipitating. A high-pressure pump then compresses the liquid, sending it back to the boiler and completing the thermodynamic cycle [2].
Due to its design characteristics, the Rankine cycle has inherent inefficiencies which mainly occur when using energy sources that do not provide high temperatures. This limitation restricts residual or renewable energy sources, such as solar energy, which typically operate at lower temperatures [3].
Solar energy, derived from solar radiation, can heat fluids through solar collectors or generate electrical power via photovoltaic panels in thermodynamic cycle systems [4]. Solar energy is advantageous because it is free, inexhaustible, and captured by using durable technology that lasts over 15 years, resulting in significant energy savings and relatively short payback periods. Additionally, these systems are straightforward to install, reliable, and do not produce noise pollution or greenhouse gas emissions [5].
Increasing the average temperature at which the working fluid enters the boiler (heat addition) and decreasing the temperature at which heat is rejected in the condenser (heat rejection) are crucial steps to enhancing thermal efficiency. Another method to improve thermal efficiency is regeneration [6]. In this process, a portion of the steam entering the turbine is diverted to a heat exchanger to preheat the feedwater. However, this diverted steam could produce more work if it were directed to the turbine. The stage where this diversion occurs is known as the regeneration zone.
ORC technology is effective for power generation at temperatures up to 400 °C and capacities ranging from less than 1 kW to 10 MW. In this research study, we focused on a small-scale ORC plant, defined as having a power output between 1 kW and 10 kW. Utilizing solar radiation to drive an ORC system is feasible due to the compatibility between the operating temperatures of solar thermal collector technologies and the electrical power provided by photovoltaic panels, which match the cycle’s temperature requirements [7]. According to the literature, the thermal efficiency of an ORC system can range from less than 5% to 76.8%, depending on the operation mode.
In this study, we aimed to implement a solar collection system in the regeneration stage of a 1 kW ORC plant to enhance thermal efficiency. The performance of the ORC plant improved compared with the simple operation regime; using an organic working fluid ensured the necessary operating range to harness solar radiation as an energy source. Similar studies have shown that an improvement in thermal efficiency of at least 5% is to be anticipated under such conditions. For instance, in a previous study [8], an ORC system with a solar collection system and residual heat recovery achieved a thermal efficiency increase between 11.6% and 19.7%. In another study [9], the optimal design of an ORC system with a solar collection and thermal energy storage system presented efficiency gains ranging from 17.9% to 24.8%. A comparison between subcritical and supercritical ORC systems under similar conditions showed that the latter improved efficiency by 11.3%. In the context of these findings, we performed this research study, whose contributions are summarized as follows:
  • Analyzing mass and energy balance equations is crucial to optimizing a thermodynamic cycle.
  • Implementing a regeneration stage with a solar collection system in an ORC plant enhances the thermal efficiency of the cycle system.
  • The entry temperature of the organic working fluid in the primary exchanger from the regeneration stage is a critical factor.
This paper is structured as follows: In Section 1, we introduce the topic, its significance, and our intended contributions. In Section 2, we outline the theoretical considerations and scientific foundations of this study. In Section 3, we describe the methodology used to obtain the results. In Section 4, we present the measurement data and trend graphs, discuss the results, and compare them with similar research findings. In Section 5, we present the conclusions of this study and suggest future work.

2. Theoretical Considerations
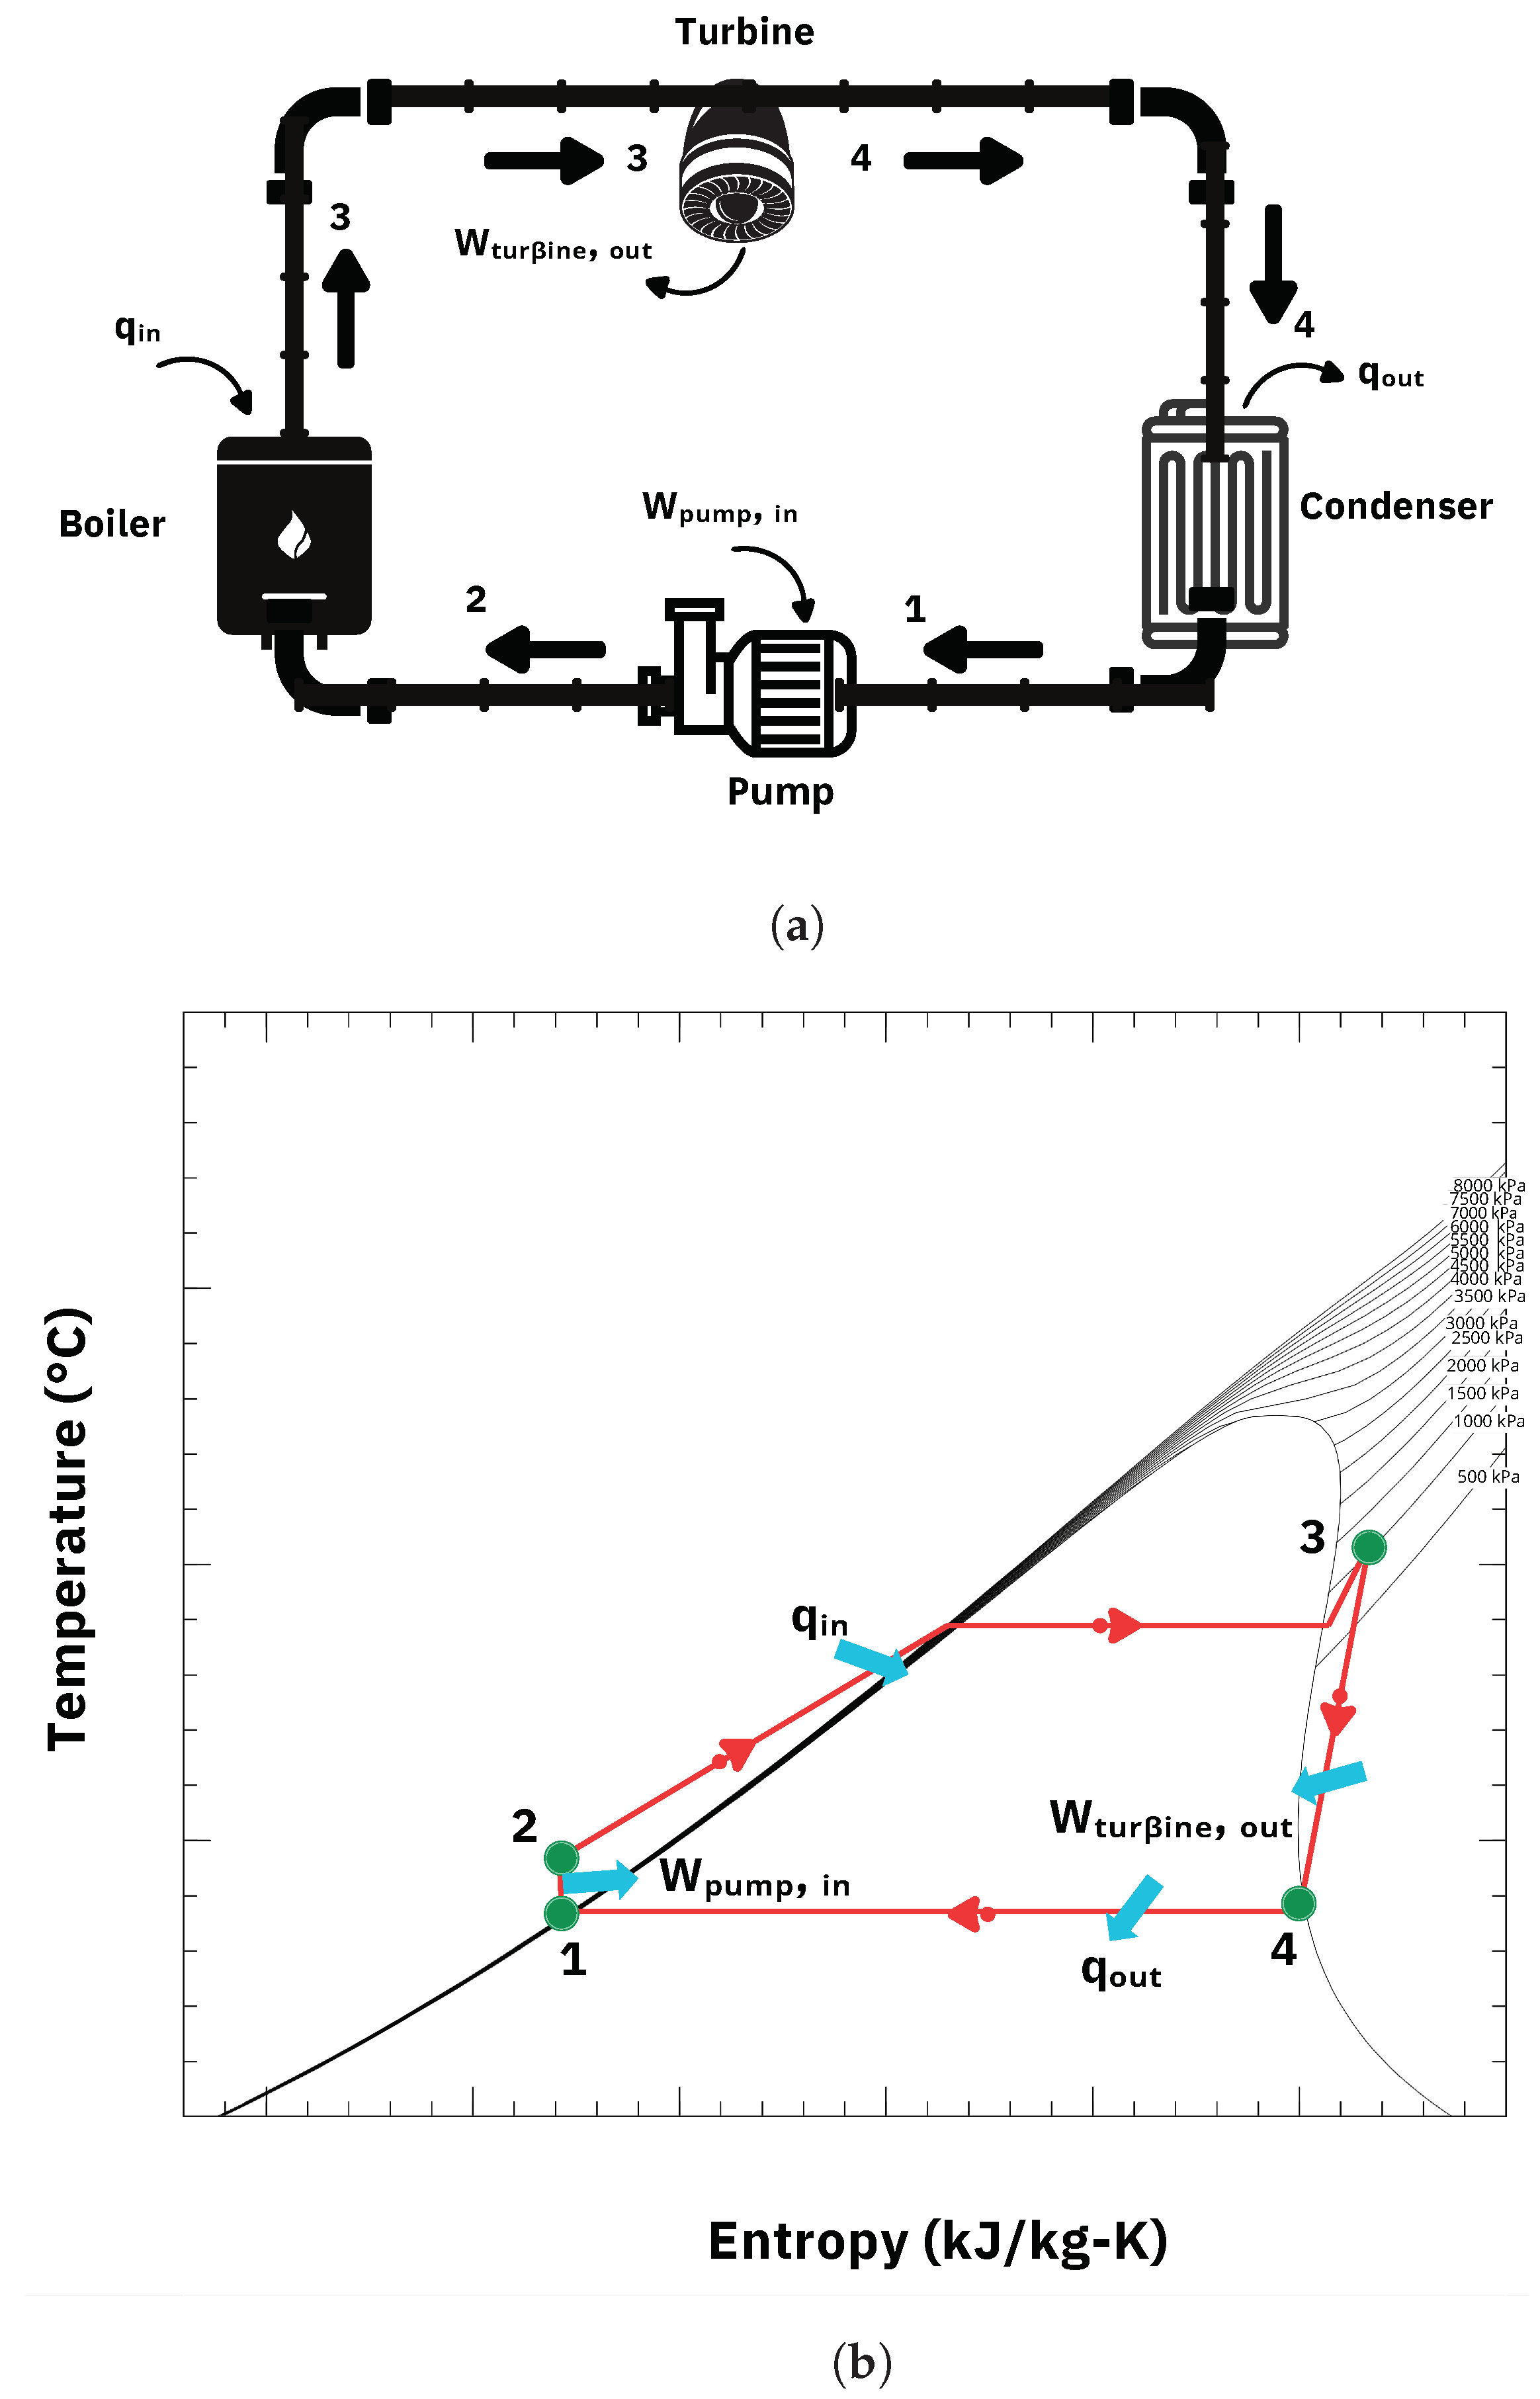
Thermoelectric plants operate based on steam cycles, with the Rankine cycle being the industry standard. The linkage between current electricity generation and the subject of this research study underscores the importance and relevance of investigating this topic.

2.1. Rankine Cycle

The conventional Rankine cycle, in its ideal operation, does not account for internal irreversibilities and comprises four processes [10]:
  • (1–2) Isentropic compression in the pump;
  • (2–3) Isobaric evaporation in the boiler;
  • (3–4) Isentropic expansion in the turbine;
  • (4–1) Isobaric condensation in the condenser.
Figure 1 illustrates a simple ideal Rankine cycle, with the four states represented. The vertical distance between states 1 and 2 is exaggerated to enhance the depiction of compression and clarity on the T–s diagram [11].
In the T–s diagram, the area under the process curve represents the heat transfer for internally reversible processes. Specifically, the area under the curve of process 2–3 depicts the heat added to the water in the boiler, while the area under the curve of process 4–1 represents the heat rejected in the condenser. The network produced by the cycle is the difference between these two areas.

2.2. Rankine Cycle with a Regeneration Stage

The typical Rankine cycle system with regeneration, as shown in Figure 2, involves the steam entering the turbine at boiler pressure (state 5), and then, expanding isentropically to intermediate pressure (state 6). At this point, a fraction of the steam is extracted and directed to a heat exchanger through which feedwater flows [12]. The remaining steam moves on to the condenser, undergoing further isentropic expansion to the condenser pressure (state 7).
Upon exiting the condenser, the steam is in a saturated liquid state at the condenser pressure (state 1). This liquid is then compressed in an isentropic pump, raising its pressure to the level of the feedwater heater (state 2). It mixes with the steam extracted from the turbine, completing the regeneration process. The volume of the vapor fraction is such that when mixed with the vapor at the heater outlet, it results in a saturated liquid at the heater pressure (state 3).
In the final stages of the cycle, a second pump increases the water pressure to the boiler operating pressure (state 4). The cycle is completed when the water is heated in the boiler and flows back to the turbine inlet (state 5) [13].

2.3. Mass and Energy Balance

To theoretically understand the functioning of the Rankine cycle, it is essential to establish the laws and equations that govern its behavior. In engineering, systems are often idealized to simulate steady-state conditions, meaning their properties remain unchanged over time. For control volumes, the identity of the matter within them constantly changes, yet the total amount present at any instant remains constant [14]. Under this precept, the following equations are applied:
i n m ˙ i n = o u t m ˙ o u t
Above, the following definitions apply:
i n m ˙ i n represents the total sum of incoming matter.
o u t m ˙ o u t represents the total sum of outgoing matter.
Equation (1) states that the total flows of incoming and outgoing matter are equal. However, Ref. [15] noted that although the total mass flows of both input and output are equal, this does not necessarily mean the control volume is steady. While the amount of mass inside the control volume remains constant, other properties, such as pressure or temperature, may vary over time.
Generally, the sum of the mass flows at the entrance equals the mass flows at the exit [16]. Because the components of the Rankine cycle (the pump, boiler, turbine, and condenser) are steady-flow devices, the process operates under steady-flow conditions [17] and is explained by the first law of thermodynamics, according to which energy cannot be created or destroyed; it only changes form [18].
( Q ˙ i n + Q ˙ o u t ) + ( W ˙ i n W ˙ o u t ) + ( E ˙ m a s s , i n E ˙ m a s s , o u t ) = d E s y s d t
Equation (2) in the steady state, d E s y s d t = 0 , can be expressed as follows:
( Q ˙ i n + Q ˙ o u t ) + ( W ˙ i n W ˙ o u t ) + ( E ˙ m a s s , i n E ˙ m a s s , o u t ) = 0
By developing the terms of Equation (3), the energy balance becomes
( Q ˙ i n + Q ˙ o u t ) + ( W ˙ i n W ˙ o u t ) + e m ˙ e ( h e + C e 2 2 + g z e ) s m ˙ s ( h s + C s 2 2 + g z s ) = 0
Above, the following definitions apply:
Q ˙ i n and Q ˙ o u t represent the input and output heat, respectively, of the thermodynamic system.
W ˙ i n and W ˙ o u t represent the input and output work, respectively, of the thermodynamic system.
h e and h s represent the entry and exit enthalpy, respectively, of the thermodynamic system.
C e 2 2 and C s 2 2 represent the input and output kinetic energy, respectively, of the thermodynamic system.
g z e and g z s represent the input and output potential energy, respectively, of the thermodynamic system.
The mathematical foundation is obtained from the solution of Equation (4) to thermodynamically analyze the devices installed in the ORC system (boiler, turbine, pump, cooling tower, and heat exchanger).
To calculate the thermal efficiency of a Rankine cycle system, the following equation is used:
n t e r = w n e t q i n = 1 q o u t q i n
In the equation above, the following applies:
w n e t = q i n q o u t = w t u r b i n e , o u t w p u m p , i n
Above, the following definitions apply:
n t e r = The thermal efficiency of a Rankine cycle, expressed in %.
w n e t = The net work of the Rankine cycle, expressed in kJ/kg.
q i n = The heat input into the boiler, expressed in kJ/kg.
q o u t = The heat output in the condenser, expressed in kJ/kg.
w t u r b i n e , o u t = The turbine output work, expressed in kJ/kg.
w p u m p , i n = The pump entry work, expressed in kJ/kg.

2.4. Solar Radiation Collection

Measuring energy potential, specifically in solar radiation, is a crucial aspect of solar energy research. It is expressed in kilowatt-hours per square meter (kWh/m2), with the global average being 3.9 kWh/m2 [19]. Solar radiation is typically described as the total radiation on a horizontal surface or the total radiation on a surface that follows the sun, highlighting its importance in our understanding of solar energy [20].
According to [21], the total solar energy available for a solar collection system, which includes solar collectors and photovoltaic panels, is determined by the amount of beam radiation ( G b ) at the collector aperture ( A c ). This relationship is governed by the following equation:
Q s o l a r = A c G b
Above, the following definitions apply:
Q s o l a r = Available solar energy, expressed in watts.
A c = The solar collection area, expressed in m2.
G b = The amount of solar beam irradiation, expressed in W/m2.
According to Cesca [22], the useful energy absorbed by solar collectors can be calculated as follows:
Q u = m c C p , o i l ( T o u t T i n )
Above, the following definitions apply:
Q u = The useful energy absorbed, expressed in watts.
m c = The mass flow, expressed in kg/s.
C p , o i l = The specific heat capacity of thermal oil, expressed in J/(kgK).
T i n and T o u t = The temperatures of the thermal oil at the inlet and outlet of the solar collector, respectively, expressed in °C.
The efficiency of a collector ( n c ) is defined as the relationship between the valuable energy captured and the solar radiation received at a given instant. It is the straight line that relates the thermal behavior of the collector with the temperature difference between the heat transfer fluid entering the collector and the ambient temperature, as well as the thermal radiation. This is known as the Bliss equation. Q u is a parameter established by the solar collector manufacturer. It is obtained from the element that intercepts solar radiation inside the collector and is responsible for transforming solar energy into thermal energy. The absorber is usually made of a metal sheet, typically copper (an excellent thermal conductor), darkened with a thin film of black heat paint, which resists working temperatures above 100 degrees Celsius. Another way to darken it is to apply a selective treatment based on electrochemical deposition or paints with metallic oxides that have a high absorption of solar radiation (short wave) and a low heat emissivity (long wave).
The solarimetric station database at the Meteorological Observatory of the Autonomous University of Querétaro (20.626098 north latitudes, −100.359066 west longitude) analyzes meteorological variables and solar resources. This station, manufactured by Kipp & Zonen, Delft, Netherlands, has a Solys2 solar tracker; Vaisala PTB110 barometer; C215 thermometer; anemometer; Davis Instruments rain gauge; two pyranometers, model CMP11; and a pyrheliometer. These devices measure diffuse radiation, direct solar radiation, and global solar radiation. They have a sensitivity of 7 to 14 µV/W/m2 and a response time of less than 5 s. The station collects 100 data per second and stores the average every minute; the database contains values recorded since 2 December 2017.
With the data obtained, a comprehensive analysis of meteorological variables is generated, including Q s o l a r , precipitation, speed, intensity of solar radiation, and wind direction. These data are further supported by the study of the temporal variation of meteorological characteristics, consulting the databases of the National Water Commission (CONAGUA) and the National Meteorological Service (SMN). This thorough analysis provides a deep understanding of the climatic behavior in the region, allowing for a precise assessment of the potential for generation and use for the sizing and installation of the solar collection system.
The experimental method for determining the thermal efficiency of a solar collector consists of exposing the collector to solar radiation, measuring the amount of energy that falls on it, measuring the amount of energy that is removed by the working fluid Q u , and obtaining the relationship between both values. The thermal efficiency of the solar collector ( n c ) is calculated with Equation (9) [1]:
n c = Q u Q s o l a r
Above, the following definitions apply:
n c = The thermal efficiency of the solar collector, expressed in %.
Q u = The useful energy absorbed, expressed in watts.
Q s o l a r = The available solar energy, expressed in watts.

2.5. R-245fa Working Fluid Properties

Table 1 presents the main characteristics of the working fluid used in this study.

3. Methodology

Figure 3 shows the prototype ORC plant under study, which is located at the Technological Liaison Center for Sustainability (CETESU), Autonomous University of Querétaro. The ORC plant consists of three main modules: a steam generator, an ORC module with a solar collector and photovoltaic panel system, and a cooling tower. Modules 1 and 3 are original components of the ORC system, while module 2, the solar collection system, was added as part of this research study. The sections within the ORC plant in which to integrate the hose system connected to the solar collector were structurally and mechanically identified.
Figure 4 illustrates the instrumentation and hydraulic system installed in the ORC plant. The boiler (CAL-800), manufactured by Indunort in Tlaxcala, Mexico, includes a control system and protection mechanisms to ensure proper operation. LP gas from the stationary tank (TG-900), manufactured by Gas Nieto in Queretaro, Mexico, flows through the nozzles at a rate of 5 L per hour (L/h), heating the thermal oil, which is circulated with a pump heat source (BC-310), manufactured by Indunort in Tlaxcala, Mexico, at a rate of 25 gallons per minute (gpm). The temperature set points are 85 °C (to turn the boiler on) and 95 °C (to turn it off).
Figure 5 outlines the overall process flow of the ORC plant. The heat exchangers EVAP-300, TLR-600, ESOL-1000, REG-200 and COND-500 were manufactured by Alfa laval in Switzerland. According to the design specifications, the thermal oil is directed to the heat exchanger (EVAP-300). It handles hot thermal oil through its circuit within an operating range of 90 °C to 150 °C, with a flow rate of 25 gallons per minute (gpm). The R-245fa refrigerant flows through the cold circuit of the EVAP-300, entering the heat exchanger at an average temperature of 39.1 °C and exiting at 78.6 °C.
The working fluid, R-245fa, is moved by a high-pressure pump (BAP-100), manufactured by Procon, Merida, Mexico, at a rate of 0.1 L per second (L/s) and a discharge pressure of 10.8 bar. Structurally, the BAP-100 is positioned below the liquid-receiving tank (TLR-600) at a height of 1 m to prevent air bubbles in the pump suction. Evaporation within the ORC system is reached at a temperature of 110 °C and evaporation at a pressure of 11.8 bar, so these parameters must be constantly monitored.
The displacement expander operates at a pressure of 13.5 bar. For this investigation, tests did not include the ESOL-1000 heat exchanger belonging to the preheating system. To prevent overpressure, a safety system consisting of a relief valve set to 12.6 bar was installed at the outlet of the EVAP-300, and another relief valve set to 12.8 bar was installed on the TLR-600.
After passing through the scroll expander, the steam enters the cooling tower, where freshwater flows through the cold circuit of the heat exchanger (COND-500) at a rate of 56.7 L/min. The steam, having expanded in the scroll expander, flows through the hot circuit. The objective is to cool the vapor until it condenses to a liquid state, allowing it to enter the BAP-100 again for compression, thus completing the operating cycle.
This cycle is executed when the ORC system operates in simple mode. When the regeneration mode is activated, the heat exchanger (REG-200) operates with the solar collection stage. The rest of the cycle remains unchanged, but the working fluid is preheated in the REG-200 by using heated water from the solar collector. Water from the solar heating stage flows at 12 L/min through a 0.25 HP pump.
Table 2 show the technical design data of the ORC system, establishing the nominal operating ranges for which the installed devices were designed. Maintaining operation within these intervals ensures the safety and validity of results. Operating within nominal values ensures that overload conditions do not compromise performance. These tables were obtained from an energy audit as part of the ISO 50001:2018 standard [23]. The information is valuable as it provides manufacturer data and equipment specifications, optimizing preventive and corrective maintenance tasks.
To guarantee the operating conditions of the displacement expander, proportional–integral–derivative (PID) control is applied to a globe valve located at its inlet. The objective is to maintain the rotation speed above 3600 rpm so that the electric generator coupled to the shaft generates a voltage of 115 volts and a frequency of 60 Hz. Figure 6 shows the control strategy for the PID loop.
The valve control operates on a PID system, creating interaction between the mass flow meter, globe-type flow-regulating valve, pressure transducer, and angular velocity meter (rpm) of the electric generator in the working fluid circuit. Electrical power is measured at the entrance of the ORC plant, specifically from the high-pressure pump, while power generation in the turbine is also considered.

3.1. Solar Collection Stage

Figure 7 presents the solar collection system integrated with the ORC plant. The system features a concave mirror composed of 236 triangle-shaped pieces of glass, which focus sunlight onto a 1/2″ thick copper pipe.
Water flows through the pipe at 12 L per minute (lpm), facilitated by a 0.25 HP pump. The solar collector provides the necessary caloric power to heat the water, which is then sent through the heat exchanger in the regeneration stage. Consequently, the energy required to preheat the R-245fa working fluid in this stage comes from renewable solar energy. This preheating makes the working fluid more effective when it enters the EVAP-300, as long as the ORC system operates in regeneration mode. Thus, the steam generator’s heating power is reduced, bringing the refrigerant to the operating temperature point, decreasing LP gas consumption, and generating savings in fossil fuel energy carriers. The integration of the solar collector with the ORC system is achieved through a hose system that circulates water through the heating circuit in the regeneration-stage heat exchanger and towards the coil system in the solar collector. When the focal point of the concave mirror is directed onto the copper pipe, the pipe’s temperature can reach up to 180 °C, ensuring the effective heating of the water flowing through it.

3.2. Data Acquisition System

Figure 8 shows a diagram of the instrumentation installed in the ORC plant. Four central modules are shown within the plant: the heating stage, where the steam generator is located; the ORC module, where the turbine, the high-pressure pump, and the instrumentation system are installed; and the cooling stage, where the working fluid is condensed after expanding in the turbine. Finally, the regeneration stage is made up of a group of photovoltaic panels connected in series, which, through the inverter, provide electrical energy by synchronizing with the ORC plant supply voltage. In this same stage, a solar collector is installed to preheat the working fluid in the regeneration stage. Data acquisition systems allow real-time temperature, pressure, and other variables to be measured. The general uncertainty of the measurement system instruments is in the order of ±0.5% of the reading and ±0.2% of the maximum scale. However, for the specific magnitudes of temperature and pressure, the instruments have a precision of ±0.1 °C and ±0.04% of the read variable, respectively. For the measurement of power values, the Extech PQ3350 power quality analyzer, manufactured by Extech in New Hampshire, USA, is used to monitor the general consumption of the ORC plant and, specifically, the consumption of the equipment. The resolution of this equipment is achieved with a synchronous sampling of 24 bits. The AC watt accuracy of the readings is ±1% ±0.8 W with a resolution of 0.1 W and considering a measurement range from 5.0 to 999.9 W [24]. These data are monitored by using reading instruments on site and the display system located at the ORC plant. The uncertainties indicated by the equipment manufacturer in their technical data sheet are taken to obtain the values of the measured parameters. At the time the measurements were taken, each device within the measurement and instrumentation system had valid operating accreditation. The measurement points are detailed below:
  • TT-01: Temperature transmitter for the working fluid at the outlet of the high-pressure pump.
  • TT-02: Temperature transmitter for the working fluid at the outlet of the primary heat exchanger.
  • TT-03: Temperature transmitter for the working fluid at the inlet of the high-pressure pump.
  • TT-04: Temperature transmitter for the working fluid at the turbine outlet.
  • TT-05: Temperature transmitter for the working fluid at the outlet of the condensation heat exchanger.
  • TT-06: Temperature transmitter for the working fluid at the outlet of the regeneration exchanger.
  • TT-08: Temperature transmitter for the hot water circuit at the entrance of the regeneration exchanger.
  • TT-09: Temperature transmitter for thermal oil at the steam generator outlet.
  • TT-10: Temperature transmitter for thermal oil at the inlet of the steam generator.
  • TT-11: Temperature transmitter for cold water at the entrance of the cooling tower.
  • TT-12: Temperature transmitter for cold water at the cooling tower outlet.
  • PIT-02: Pressure transmitter for the working fluid at the outlet of the primary heat exchanger.
  • PIT-03: Pressure transmitter for the working fluid at the turbine inlet.
  • PIT-01: Pressure transmitter for the working fluid at the inlet of the high-pressure pump.
The operation cycle lasts 1 h, during which the behavior of the variables is evaluated depending on the operation mode. To compare the results, the same conditions were established for different operation modes (simple and regeneration). Enthalpy values were obtained by entering the temperature and pressure measurements into the academic software REFPROP (version 9.0) along with the working fluid found in the ORC plant which, in this case, was R-245fa. Sheet metal data provided by the turbine (1 kW) and the high-pressure pump (0.375 kW) manufacturers were used to carry out the efficiency calculations. The thermal efficiency was finally calculated using Equation (5).

3.3. Analysis of Data Obtained

The temperature, pressure, mass flow, turbine rotation speed, and energy consumption were measured to determine the performance of the prototype by varying the heat supply produced by using the working fluid, R-245fa. Data were collected with the instrumentation system and saved in .csv extension files for later analysis. The general uncertainty of the measurement system instruments is in the order of ±0.5% of the reading and ±0.2% of the maximum scale.
Table 2 presents the technical design data of the ORC system, establishing the nominal operating ranges for the installed devices. Maintaining operation within these intervals ensures the security and the validity of results since the start-up is within nominal values, as performance is not achieved when the ORC plant operates under overload conditions. These tables are derived from an energy audit, providing valuable manufacturer data and equipment specifications, which aid in optimizing preventive and corrective maintenance tasks.
Figure 9 shows the average solar irradiation during the investigation period. The measurement data were obtained with field instrumentation installed at the solarimetric station of the Autonomous University of Querétaro. The geographical location of the area guarantees stable solar irradiation throughout the year. Specifically, the study region is located at the coordinates 20.703965° N 100.441789° W.
Figure 10 shows the efficiency values obtained for the solar collector when applying Equation (1). As can be seen, the most significant increase in temperature occurred between 15:00 and 17:00 h.

Test Matrix

The tests were conducted with the specific objective of thoroughly investigating the thermal behavior of the system using R-245fa under varying heat supply conditions. This comprehensive analysis, spanning a temperature range of 80 °C to 95 °C, is crucial to understanding the system’s performance and its potential applications. Test runs were executed as follows: One of the experiments involved maintaining the evaporator temperature at 80 °C, and the heat rejection was fixed at 21 °C or the wet bulb temperature of the place and/or environmental conditions on the test day. The system’s behavior was investigated by varying the mass flow while keeping the evaporation saturation pressure constant and determining the electric generator’s rotation speed and the generator’s electrical energy output.
Additional tests were conducted at 90 °C and 95 °C, keeping the heat rejection fixed at 21 °C or the wet bulb temperature of the location and environmental conditions on the day of the test. The behavior of the system was investigated by varying the mass flow, keeping the evaporation saturation pressure fixed, and determining the rotation speed of the electric generator.
The degrees of superheating and subcooling were analyzed against the system’s performance under the best-performance conditions, which were identified from the three tests mentioned above. The performance of the system was studied by measuring the electrical energy consumption of both supply (high-pressure pump) and energy output to an electrical load (electric generator and electrical load) and the thermal power input to the evaporator.

4. Results and Discussion

This section presents the results obtained in the current investigation. It includes the outcomes of the energy audit, the primary energy indicators, an analysis of variables influencing the ORC system’s thermal performance, and a table demonstrating the validation of the obtained results.

4.1. Analysis of Data Obtained with Instrumentation System

Figure 11 shows the temperature measurements obtained for both the simple and regeneration work modes from TT-01 (a) and TT-02 (b). In TT-01, the temperature difference between the simple and regeneration modes is noticeable, where the temperature in the latter is higher than in the former.
This difference can be attributed to the system’s operation in these two modes. In simple mode, the working fluid is compressed in the high-pressure pump, maintaining its temperature after condensation in the cooling tower. In regeneration mode, the working fluid absorbs additional heat from the solar collection stage after being compressed, which increases its temperature.
In contrast, Figure 11 shows that the measurements from TT-02 remain nearly the same in both modes. This consistency is because TT-02 is located in a segment of the ORC where no additional heat source or device affects the working fluid differently in either mode.
Figure 12 displays the measurements from TT-03 (a) and TT-04 (b). There are no significant variations in the measurements from TT-03 and TT-04 in the two work regimes. TT-03 is located at the inlet of the high-pressure pump after the refrigerant leaves the cooling tower, resulting in similar measurements since the fluid does not pass through different ORC segments. The TT-04 measurements are taken at the turbine outlet where the working fluid is directed to the condensation zone after expanding, thus losing pressure and temperature. Still, it generally runs through the same pipe circuit in both modes of operation; thus, the measurements tend to be similar.
Figure 13 presents the TT-05 measurements (a) and the entry and exit enthalpy values (b). The temperature measurements at the outlet of the condensation circuit exchanger show no significant variations, similar to the other temperature sensors, except for TT-01.
This consistency is due to the absence of regeneration system segments at these points. Hence, since the operating point of the boiler remains the same for both operating conditions, temperature and pressure values remain stable, confirming that significant changes occur mainly in the regeneration stage and in the measured values associated with it.

4.2. Result Validation

The boiler supplies heat power to the ORC plant. The heat exchanger (EVAP-300) is studied using a thermal efficiency analysis as it transfers heat from the steam generator to the working fluid. The heat delivered by the heat exchanger to the working fluid is calculated by using the following equation, derived from Equation (2):
Q ˙ i n = m ˙ ( h o u t h i n )
where the following assumptions apply:
Q ˙ o u t 0 , because it is an adiabatic process.
W ˙ i n , W ˙ o u t = 0, because no electrical power is required to operate the device and it does not produce electrical energy either.
K E = P E = 0, because the kinetic and potential energy changes are negligible.
d E s y s d t = 0 , because the system is in a stable state.
Table 3 shows the parameters used to calculate the thermal efficiency of the ORC plant, with the values of Q i n obtained from the primary exchanger (EVAP-300). The thermal analysis of the heat exchanger results in an average thermal efficiency of 35.21%.
Table 4 presents the thermal efficiency results in regeneration mode with a solar collector. When comparing Table 3 and Table 4, it is evident that the ORC system with the regeneration stage is more efficient.
The thermal efficiency of the ORC plant increases in regeneration mode, validating the obtained results. Establishing two conditions to test the hypothesis secures a positive precedent to validate the results. In simple mode, the thermal efficiency is lower. The equations used to quantify the heat exchanger’s performance yield thermal efficiency values consistent with other investigations.
In the context of thermal performance analysis, the value differs when analyzed based on the Q i n provided by the steam generator and appears lower than the values reported in some articles we reviewed. However, the scenario changes when the analysis is based on the conditions of scenario 2. Our results are validated when compared with other studies. The ORC plant with a regeneration stage shows a thermal efficiency of 51.30% which, although lower than the values found in some other investigations, is a significant achievement. It is important to note that performance can vary depending on factors such as the cycle structure, working fluid, installed power, geographical conditions, and application.
The reported thermal efficiency values are the average of the data shown in Table 3 and Table 4. For the prototype ORC plant operating in regeneration mode with the solar collector system, the average thermal efficiency value is 51.30%. Once the Carnot efficiency for the prototype ORC plant has been calculated, 66.7% is obtained. The average temperature of the high-temperature storage is 78.12 °C and that of the low-temperature storage is 26.2 °C. The thermal efficiency reported in the study achieved in regeneration mode with the solar collector system is 51.30%, which does not exceed the theoretical maximum achievable. The high thermal efficiency value is explainable because the mass flow of the system in regeneration mode passes completely through the solar collector system.
This means that when the prototype ORC plant operates under these conditions, the working fluid at the boiler inlet arrives at a higher temperature, which allows the inlet heat applied to the working fluid to be lower to reach the temperature set point. In this way, the boiler delivers less input heat and performs shorter work cycles. Another factor is that the input power supplied by the solar collector is sufficient to provide power to the regeneration pump that operates when the ORC is in regeneration mode. All these factors explain the efficiency value obtained.
Table 5 compares the thermal efficiency values from other investigations, which are similar to the present study’s results. These studies involved combined cycles, reheating, and regeneration, which explains why their efficiency values are lower than those obtained in this study. The case in which an ORC system operates in simple mode in an area in which people work permanently is uncommon in industrial applications.
The results of this study demonstrate that an ORC plant with a regeneration stage fed by a solar collection system demonstrates greater thermal performance than an ORC plant operating under a simple regime.

5. Conclusions

In this investigation, a solar collection stage was implemented in an ORC plant, enabling the cycle to operate in simple and regeneration modes. The ORC plant, equipped with a steam turbine, utilizes organic fluids, facilitating the use of low- and medium-temperature heat sources. Using organic fluids allows for employing residual heat from manufacturing processes, contributing to environmental sustainability.
Applying the concept in an ORC plant makes it possible to reduce CO2 emissions by integrating a solar collection system powered by renewable energy. This system supplies energy to the regeneration stage, thereby reducing the consumption of fossil fuels for steam generation. The coupling of a regeneration system enhances the ORC system’s thermal efficiency by approximately 30%, justifying the installation and operation of the regeneration stage coupled with a solar collection system.
The improvements in the ORC plant’s thermal efficiency demonstrate the potential benefits of implementing successive regeneration stages. However, a cost–benefit analysis of such a system must be conducted.
The mass and energy balance equations provided the necessary mathematical tools to improve thermal efficiency. Although thermodynamic cycles cannot match the performance of gas cycles, they can significantly reduce CO2 emissions, potentially preventing 1226.4 tons of CO2 from entering the atmosphere [33].
According to the methodology established for this research study, the conclusions can be summarized as below:
  • The analysis of the mass and energy balance equations constitutes an essential tool to perform optimal analyses of a thermodynamic cycle.
  • Implementing a regeneration stage with an energy supply from a solar collection system in an ORC plant allows the thermal efficiency of the cycle to be increased.
  • To improve thermal efficiency, it is essential to implement a regeneration stage.
  • The entry temperature of the organic working fluid flowing from the regeneration stage to the primary exchanger is a critical factor.
  • The results support an economic analysis of the design and selection of ORC plant components when integrating a solar collection stage.

Future Work

Future research should consider the impact of other refrigerants, such as R134a, on the thermal performance of ORC plants. However, it is important to highlight that the R-245fa and R134a refrigerants have a high global warming potential (GWP) index, so this aspect should be considered for future studies. Maximizing the compatibility of the turbine used in an ORC with other refrigerants with a lower GWP, such as R600a and R290, allows the potential of the ORC to be developed.

Author Contributions

Conceptualization, R.A.M.-S.; methodology, R.A.M.-S.; writing—original draft preparation, R.A.M.-S.; writing—review and editing, R.A.M.-S., J.M.Á.-A., I.M.-S., G.I.P.-S., K.A.C.-G. and J.R.-R.; supervision, J.R.-R. and J.M.Á.-A. All authors have read and agreed to the published version of the manuscript.

Funding

This research received no external funding.

Institutional Review Board Statement

Not applicable.

Informed Consent Statement

Not applicable.

Data Availability Statement

The data presented in this study are available upon request from the corresponding author.

Acknowledgments

We sincerely thank the Consejo Nacional de Humanidades Ciencias y Tecnología (CONAHCYT) for the invaluable support provided through the doctoral scholarship. This research was done by Universidad Autónoma de Querétaro (UAQ) and Universidad Estatal Península de Santa Elena (UPSE).

Conflicts of Interest

The authors declare no conflicts of interest. The funders had no role in the design of the study; in data collection, analysis, and interpretation; in manuscript writing; or in the decision to publish the results.

References

  1. Zhu, S.; Zhang, K.; Deng, K. A review of waste heat recovery from the marine engine with highly efficient bottoming power cycles. Renew. Sustain. Energy Rev. 2020, 120, 109611. [Google Scholar] [CrossRef]
  2. Park, B.S.; Usman, M.; Imran, M.; Pesyridis, A. Review of Organic Rankine Cycle experimental data trends. Energy Convers. Manag. 2018, 173, 679–691. [Google Scholar] [CrossRef]
  3. Núñez Fernández, C. Diseño preliminar de un ciclo orgánico de Rankine solar para el suministro eléctrico a una PYME. Master’s Thesis, Mining Engineering-Universidad de Oviedo, Oviedo, Spain, 2017. [Google Scholar]
  4. Real Academia Española. Diccionario de la Lengua españOla, 23rd ed. 2021. Available online: https://dle.rae.es/energ%C3%ADa#FiynjK3 (accessed on 28 May 2024).
  5. Comisión Nacional para el Uso Eficiente de la EnergíaBeneficios por el uso de la Energía Solar. 2014. Available online: http://www.gob.mx/conuee/acciones-y-programas/beneficios-por-el-uso-de-la-energia-solar?state=published (accessed on 24 May 2024).
  6. Yilmaz, F. Thermodynamic performance evaluation of a novel solar energy based multigeneration system. Appl. Therm. Eng. 2018, 143, 429–437. [Google Scholar] [CrossRef]
  7. Loni, R.; Mahian, O.; Markides, C.; Bellos, E.; le Roux, W.; Kasaeian, A.; Najafi, G.; Rajaee, F. A review of solar-driven organic Rankine cycles: Recent challenges and future outlook. Renew. Sustain. Energy Rev. 2021, 150, 111410. [Google Scholar] [CrossRef]
  8. Bellos, E.; Tzivanidis, C. Investigation of a hybrid ORC driven by waste heat and solar energy. Energy Convers. Manag. 2018, 156, 427–439. [Google Scholar] [CrossRef]
  9. Yu, H.; Helland, H.; Yu, X.; Gundersen, T.; Sin, G. Optimal design and operation of an Organic Rankine Cycle (ORC) system driven by solar energy with sensible thermal energy storage. Energy Convers. Manag. 2021, 244, 114494. [Google Scholar] [CrossRef]
  10. Cengel, Y.A.; Boles, M.A. Termodinámica, 7th ed.; Mc. Graw Hill: New York, NY, USA, 2003. [Google Scholar]
  11. Moran, M.J.; Shapiro, H.N. Fundamentos de termodinámica técnica, 2nd ed.; Reverté: Barcelona, Spain, 2018. [Google Scholar]
  12. Feng, Y.q.; Wang, X.; Niaz, H.; Hung, T.C.; He, Z.x.; Zeb, A.J.; Xi, H. Experimental comparison of the performance of basic and regenerative organic Rankine cycles. Energy Convers. Manag. 2020, 223, 113459. [Google Scholar] [CrossRef]
  13. Singh, J. Heat Transfer Fluids and Systems for Process and Energy Applications; CRC Press: Boca Raton, FL, USA, 1985. [Google Scholar]
  14. Cerrada Galán, A. Análisis de Ciclos de Rankine Orgánicos. Bachelor’s Thesis, Chemistry Engineering-Universidad de Sevilla, Sevilla, Spain, 2020. [Google Scholar]
  15. Carpio, R.S.B. Balance de Materia y Energía; UNSA: Arequipa, Peru, 2021. [Google Scholar]
  16. Severns, W.H.; Degler, H.E.; Miles, H. La Producción de Energía Mediante Vapor, Aire o Gas; Reverté: Ciudad de Mexico, Mexico, 2021. [Google Scholar]
  17. Cengel, Y.A.; Ghajar, A.J. Transferencia de Calor y Masa; McGraw-Hill Interamericana: New York, NY, USA, 2007; Volume 53. [Google Scholar]
  18. Godin, B. Models of Innovation: The History of an Idea; MIT Press: Cambridge, MA, USA, 2017. [Google Scholar]
  19. Ike, G.N.; Usman, O.; Alola, A.A.; Sarkodie, S.A. Environmental quality effects of income, energy prices and trade: The role of renewable energy consumption in G-7 countries. Sci. Total Environ. 2020, 721, 137813. [Google Scholar] [CrossRef] [PubMed]
  20. Office of Energy Efficiency & Renewable Energy. Solar Radiation Basics. 2019. Available online: https://www.energy.gov/eere/solar/solar-radiation-basics (accessed on 24 May 2024).
  21. Yang, J.; Li, J.; Yang, Z.; Duan, Y. Thermodynamic analysis and optimization of a solar organic Rankine cycle operating with stable output. Energy Convers. Manag. 2019, 187, 459–471. [Google Scholar] [CrossRef]
  22. Cesca, T.; Scian, C.; Petronijevic, E.; Leahu, G.; Voti, R.L.; Cesarini, G.; Macaluso, R.; Mosca, M.; Sibilia, C.; Mattei, G. Correlation between in situ structural and optical characterization of the semiconductor-to-metal phase transition of VO2 thin films on sapphire. Nanoscale 2020, 12, 851–863. [Google Scholar] [CrossRef] [PubMed]
  23. ISO 50001:2018; Energy Management Systems—Requirements with Guidance for Use. ISO/IEC: Geneva, Switzerland, 2018.
  24. Extech Instruments. User Manual—Power and Harmonics Analyzer. Available online: https://www.instrumart.com/assets/Extech-PQ3350-3-Manual.pdf (accessed on 9 September 2024).
  25. Vásquez, S.A.; Barturén, A.P.; Carbajal, F.M. Application of the Aspen HYSYS simulator in solving problems of the regenerative Rankine cycle with intermediate superheat. Inf. Tecnológica 2020, 31, 199–208. [Google Scholar] [CrossRef]
  26. Liang, Y.; Chen, J.; Luo, X.; Chen, J.; Yang, Z.; Chen, Y. Simultaneous optimization of combined supercritical CO2 Brayton cycle and organic Rankine cycle integrated with concentrated solar power system. J. Clean. Prod. 2020, 266, 121927. [Google Scholar] [CrossRef]
  27. Fernández Bermúdez, E.P. Análisis de factibilidad termotécnica de la incrementación del rendimiento de una planta termoeléctrica, empleando energía del proceso de condensación del ciclo Rankine como fuente térmica para la operación de motores Stirling. Bachelor’s Thesis, Civil Mechanical Engineer-Universidad de Talca, Talca, Chile, 2021. [Google Scholar]
  28. Scagnolatto, G.; Cabezas-Gómez, L.; Tibiriçá, C.B. Analytical model for thermal efficiency of organic Rankine cycles, considering superheating, heat recovery, pump and expander efficiencies. Energy Convers. Manag. 2021, 246, 114628. [Google Scholar] [CrossRef]
  29. Herrera, U.C.; García, J.; Sierra-Espinosa, F.; Rodríguez, J.; Jaramillo, O.; De Santiago, O.; Tilvaldiev, S. Enhanced thermal efficiency organic Rankine cycle for renewable power generation. Appl. Therm. Eng. 2021, 189, 116706. [Google Scholar] [CrossRef]
  30. Ma, X.; Zhao, X.; Zhang, Y.; Liu, K.; Yang, H.; Li, J.; Akhlaghi, Y.G.; Liu, H.; Han, Z.; Liu, Z. Combined Rankine Cycle and dew point cooler for energy efficient power generation of the power plants-A review and perspective study. Energy 2022, 238, 121688. [Google Scholar] [CrossRef]
  31. Feng, H.; Chen, W.; Chen, L.; Tang, W. Power and efficiency optimizations of an irreversible regenerative organic Rankine cycle. Energy Convers. Manag. 2020, 220, 113079. [Google Scholar] [CrossRef]
  32. Qu, J.; Feng, Y.; Zhu, Y.; Zhou, S.; Zhang, W. Design and thermodynamic analysis of a combined system including steam Rankine cycle, organic Rankine cycle, and power turbine for marine low-speed diesel engine waste heat recovery. Energy Convers. Manag. 2021, 245, 114580. [Google Scholar] [CrossRef]
  33. Jiménez, A.G. La energía nuclear, esencial en la transición energética. Available online: https://www.industriaquimica.es/articulos/20220909/energia-nuclear-esencial-transicion-energetica (accessed on 14 April 2024).
Figure 1. (a) The stages and equipment of an ideal Rankine cycle. (b) A T–s diagram of an ideal Rankine cycle.
Fluids 09 00217 g001
Figure 2. (a) The stages and equipment of an ideal Rankine cycle with a regeneration stage. (b) A T–s diagram of an ideal regenerative Rankine cycle.
Fluids 09 00217 g002
Figure 3. ORC prototype plant.
Fluids 09 00217 g003
Figure 4. Diagram of equipment, field instrumentation, and piping.
Fluids 09 00217 g004
Figure 5. Process flow diagram.
Fluids 09 00217 g005
Figure 6. Pressure control strategy.
Fluids 09 00217 g006
Figure 7. Solar collector coupled to regeneration stage in ORC plant.
Fluids 09 00217 g007
Figure 8. ORC plant instrumentation diagram.
Fluids 09 00217 g008
Figure 9. Solar irradiation measured at solarimetric station.
Fluids 09 00217 g009
Figure 10. Thermal efficiency obtained from solar collector.
Fluids 09 00217 g010
Figure 11. (a) Values measured with temperature sensor TT-01. (b) Values measured with temperature sensor TT-02.
Fluids 09 00217 g011
Figure 12. (a) Values measured with temperature sensor TT-03. (b) Values measured with temperature sensor TT-04.
Fluids 09 00217 g012
Figure 13. (a) Values measured with temperature sensor TT-05. (b) Enthalpy values obtained from analysis of thermodynamic states.
Fluids 09 00217 g013
Table 1. Physical and chemical properties of R-245fa refrigerant.
VariableValueVariableValue
Physical state, colorLiquefied gas, colorlessEvaporation rate>1 method: comparison with ether
SmellFaint ethereal smellFlammability (solid/gas)-
Odor threshold-Upper/lower flammability or explosive limit-
Hydrogen potential (pH)NeutralVapor pressure11,227 hPa at 20 °C
Melting point/freezing point−103 °CVapor density4.6 kg/m3 (air = 1.0)
Initial point and boiling range15.3 °CRelative density1.32 g/cm3 at 20 °C
Flash point-SolubilityIn methanol, partially soluble
Viscosity-N-Octanol/water partition coefficientlog POW: 1.35
Molecular weight134.03 g/molAutoignition temperature412 °C
Chemical formula: 1,1,1,3,3-pentafluoropropane, CF3CH2CHF2; chemical family: hydrofluorocarbons (HFCs); other identifications: Enovate, hydrofluorocarbon 245fa, refrigerant 245fa, HFC-245fa, and R-245fa.
Table 2. Technical parameters of the ORC plant.
TagTechnical
Equipment
ParameterWorking
Fluid
ESG-400Scroll expander
(turbine)
Efficiency0.6
Working fluidR-245fa
Working fluid mass flow0.08 kg/s
Displacement14.5 cm3/rev
Speed. The maximum
speed is 3600 rpm
3500 rpm
Inlet pressure. The maximum
operating pressure is 13.8
bar abs.
11.8 bar man
Inlet temperature of 110 °C
Overheating of 10 °C
110 °C
Outlet pressure5.1 bar
Outlet temperature60 °C
EVA-300Heat exchangerEvaporation temperature100 °C
Evaporation pressure11.66 bar man
Evaporator inlet temperature30 °C
Evaporator thermal power14 kW
Heat transfer area2.04 m2
Evaporator side heat
transfer fluid
MobilTherm 603
Thermal oil flow1.27 kg/s
Thermal oil evaporator
inlet temperature
120 °C
Thermal oil evaporator
outlet temperature
100 °C
Electric power of
circulation pump
1.1 kW
COND-500Heat exchangerCondensation temperature30 °C
Condensation pressure1.8 bar
Temperature of organic fluid
at condenser inlet
45 °C
Condenser thermal power17.5 kW
Heat transfer area3.06 m2
Condenser side heat
transfer fluid
Water
Cooling water flow0.94 kg/s
Cooling water condenser
inlet temperature
28 °C
Cooling water condenser
outlet temperature
23 °C
Electrical power of
circulation pump
0.745 kW
REG-200Heat exchangerRegenerator thermal power1812 kW
Heat transfer area1.1 m2
Hot fluid inlet temperature61 °C
Hot fluid outlet temperature45 °C
Cold fluid inlet temperature30 °C
Cold fluid outlet temperature60 °C
TLR-600Liquid-receiving tankAmount of refrigerant in
system
8 kg
Volume80 lts
BAP-100High-pressure pumpPallets12
Discharge pressure11.56 bar
Pump flow0.1 L/s
Motor electrical power260 W
Suction pressure1.36 barg
RefrigerantR-245fa 45 kg cylinderR-245fa
Table 3. ORC plant thermal efficiency in simple mode.
Temp.
TT-01
(°C)
Temp.
TT-02
(°C)
Pit-01
(kPa)
Pit-02
(kPa)
h in
(kJ/kg)
h out
(kJ/kg)
m ˙
(kg/s)
Q in
(kW)
W tur
(kW)
W bap
(kW)
n ter
(%)
29.277.352.375.6429.57474.360.0341.521.0000.37541.04
28.578.952.976.4429.51475.90.0361.671.0000.37537.42
29.779.554.573.9430.53476.520.0331.521.0000.37541.18
30.977.154.674.6431.6474.180.0411.751.0000.37535.80
27.478.255.974.5428.43475.250.0391.831.0000.37534.23
28.380.256.275.1429.22477.180.0381.821.0000.37534.29
29.581.657.473.9430.26478.560.0432.081.0000.37530.09
30.277.653.974.8431474.660.0451.961.0000.37531.81
26.475.352.475.9427.66472.420.0411.841.0000.37534.06
27.875.651.576.1428.93472.710.0391.711.0000.37536.60
28.479.656.374.2429.31476.610.0381.801.0000.37534.77
28.177.454.375.6429.11474.450.0371.681.0000.37537.26
2977.656.375.3429.84474.650.0462.061.0000.37530.32
27.678.454.976.4428.64475.410.0452.101.0000.37529.70
26.779.458.776.3427.7476.380.0442.141.0000.37529.18
29.776.956.374.8430.47473.990.0331.441.0000.37543.52
29.478.652.375.9430.34475.610.0351.581.0000.37539.45
28.678.154.876.2429.54475.120.0381.731.0000.37536.08
27.975.655.675.4428.88472.720.0421.841.0000.37533.94
29.579.557.474.7430.26476.510.041.851.0000.37533.78
28.6478.1254.92575.28429.57475.160.039351.791.0000.37534.84
Table 4. ORC plant thermal efficiency in regeneration mode with a solar collector stage.
Temp.
TT-06
(°C)
Temp.
TT-02
(°C)
Pit-01
(kPa)
Pit-02
(kPa)
h in
(kJ/kg)
h out
(kJ/kg)
m ˙
(kg/s)
Q ln
(kW)
W tur
(kW)
W bap
(kW)
W brgn
(kW)
W ss
(kW)
n ter
(%)
36.678.851.575.8436.83475.810.0351.360.8960.590.520.7841.49
37.878.952.576.4437.88475.90.0361.300.9970.560.570.851.20
38.579.554.573.9438.46476.520.0331.180.8850.520.560.7849.76
38.379.553.975.6438.3476.490.0391.421.0900.490.530.6953.54
39.478.255.974.5439.24475.250.0391.391.0810.480.580.6548.30
37.680.252.475.1437.71477.180.0381.431.0280.560.560.6236.77
38.680.457.474.6438.47477.380.0411.561.1620.590.630.7645.03
39.577.653.974.8439.39474.660.0451.571.2220.510.480.6757.40
37.975.352.975.9437.96472.420.0411.331.1310.480.690.7855.51
36.575.654.975.4436.64472.720.0331.120.9600.490.560.7558.98
40.179.256.374.2439.86476.220.0381.461.1340.490.640.8155.68
39.477.454.375.6439.28474.450.0371.271.0630.480.570.7761.64
38.677.655.776.5438.52474.630.0421.441.0630.520.480.6851.47
37.877.954.976.4437.81474.930.0391.391.0260.560.470.6949.43
38.679.458.776.3438.43476.380.0441.631.2920.550.490.6857.04
37.576.954.674.6437.55473.990.0331.170.9140.520.630.8451.79
39.376.552.375.9439.25473.580.0331.180.8170.470.570.8956.33
37.678.154.878.5437.64475.080.0321.150.9210.460.620.7248.56
38.975.653.675.4438.85472.720.0391.321.0890.490.640.6344.61
37.478.955.472.6437.44475.960.041.451.1060.460.590.7857.68
38.478.0854.5275.4438.37475.110.03791.351.0440.510.670.7545.16
Table 5. Thermal efficiency obtained in other studies.
ReferenceResearch
Date
Thermal
Efficiency
Research Study Title
[25]202237.12Application of the Aspen HYSYS
simulator in solving problems of the
regenerative Rankine cycle with
intermediate superheat
[26]20207.24Simultaneous optimization of combined
supercritical CO2 Brayton cycle and ORC
integrated with concentrated solar
power system
[27]202176.8Analysis of thermotechnical feasibility
of increasing the performance of a
thermoelectric plant, using energy
from the production process condensation
of the Rankine cycle as a thermal source for
the operation of Stirling engines
[28]202313.9Analytical model for thermal efficiency of
ORC, considering superheating, heat
recovery, pump and expander efficiencies
[29]202110.54Enhanced thermal efficiency organic Rankine
cycle for renewable power generation
[30]202249.4Combined Rankine Cycle and dew point
cooler for energy efficient power generation
of the power plants—A review and
perspective study
[31]202025.22Power and efficiency optimizations of an
irreversible regenerative ORC
[32]202128.48Design and thermodynamic analysis of a
combined system including steam Rankine
cycle, ORC, and power turbine for marine
low-speed diesel engine waste heat recovery
This investigation202451.30Thermal efficiency analysis of 1 kW
ORC system with solar collection stage
and R-245fa working fluid: A Case Study
Disclaimer/Publisher’s Note: The statements, opinions and data contained in all publications are solely those of the individual author(s) and contributor(s) and not of MDPI and/or the editor(s). MDPI and/or the editor(s) disclaim responsibility for any injury to people or property resulting from any ideas, methods, instructions or products referred to in the content.

