Abstract
High-speed gas/vapour jets injected into a cross-moving sonic liquid signifies a vital phenomenon which bears useful applications in environmental and energy processes. In the present experimental study, a pulsating jet of supersonic steam was injected into cross-flowing water. Circulation zones of opposite vorticity owing to the interaction between the steam jet and cross-water flow were found. However, a large circulation appeared in front of the nozzle exit. Also, most small circulation regions were observed at higher water-flow rates (>2 m3/s). Among the prime mixing variables (i.e., turbulence kinetic energy (TKE) and Reynolds shear stress (RSS)), the RSS estimations backed a small diffusive phenomenon within a region far from the nozzle exit. Further information extracted from the PIV images indicated the existence of Kelvin–Helmholtz (KH) instabilities. The counter-rotating vortex pairs (CVPs) appeared to be significant in the region close to the nozzle exit, and they exhibited leeward side folds. Moreover, the effects of the operating conditions on the pressure recovery and mixing efficiency as well as the penetration and the separation height were evaluated to determine the optimisation of the phenomenon. By applying extreme difference analysis, the mixing efficiency was found as the most influential parameter.
1. Introduction
The injection of a high-speed gas/vapour into a low-speed cross-flowing gas/liquid presented an interesting phenomenon which has been exploited by the scientific community for multiple purposes. It includes the injection of steam into polluted air, which causes these solid particles to wet. Afterwards, these solid particles are removed from the air supply using cyclone separators [1]. Depending on the application, these two streams of fluids can be mixed at any speed, including subsonic, sonic, supersonic or even hypersonic [2,3,4,5,6,7]. So far, the mixing studies related to this phenomenon have been mainly directed towards noise control inside cavities [7,8,9,10,11,12], the thrust vector control of moving bodies [13,14], and in combustion chambers [15,16,17,18]. In another study, three different types of injections were investigated that included the circular transverse, circular oblique and elliptical transverse configurations into a stream flowing at a speed of Mach 2 [3]. It was observed that, in comparison to the oblique injection, the rest of the two configurations presented maximum penetrations into the flowing stream due to the reduced number of the transverse momentum components in the transverse direction than the rest of the two cases. Other studies have included the injection of different gases like argon, helium and nitrogen into a free stream of air inside a wind tunnel, where the air was flown at supersonic speed [19]. Here, a model was applied to determine the forces against the walls, and with the help of analytical treatment, corrections were made based on the data that provided the pressure distribution, shock wave shapes, injected mass fraction, total pressure and velocity profiles in the downstream direction.
In the current study, the hydrodynamics of flow were investigated when a supersonic steam jet was injected into a cross-flowing water stream. Before presenting the experimental measurements involving the flow hydrodynamics, some of the necessary mathematical formulations are illustrated to understand the criteria applicable for characterising the flow regimes. A vital ratio in such studies is the ratio of the steam’s jet to the cross-flowing fluid’s momentum fluxes [20,21], which can be useful to determine the extent of the penetration of the steam jet into the cross-flowing water.
where represents density, V is the mean velocity, is the ratio of specific heat (cp/cv), is the dynamic pressure and represents the Mach number. Another important ratio is the height (Hmid) of the point where the higher velocity profiles terminate, which can be seen visually via a characterisation setup like particle induced velocimetry (PIV) systems. This height can suitably be non-dimensionalised by using the diameter of the steam’s nozzle exit, as given in the following relation [22]:
Using the above two relations, as well as the data acquired through use of an appropriate experimental setup and the measurement devices, the flow fields were characterized. All studies related to the hydrodynamics of those flows where the cross-flowing stream travels at sonic and supersonic speed or above are almost similar, so most of these studies included subsonic flows which were then extended to include supersonic or hypersonic flows. To date, there is an ample number of studies that have been conducted to investigate the hydrodynamics of jets which have been injected into a cross-flowing stream of fluid(s), but to date, there is no study that is known to the authors of the present manuscript that has been cited in the literature in which the effect of a supersonic steam jet injection on cross-flowing water at sonic speed has been discussed. Second, the hydrodynamics of the resultant flow regimes were presented with regard to the influence on the shear layer, as well as the quantification of the most effective operating condition for the efficient mixing of steam and water. Therefore, the present manuscript is an effort in this regard. The details of the experimental setup and the experiments being performed, as well as the derived results, are presented in the proceeding sections.
2. Experimental Setup
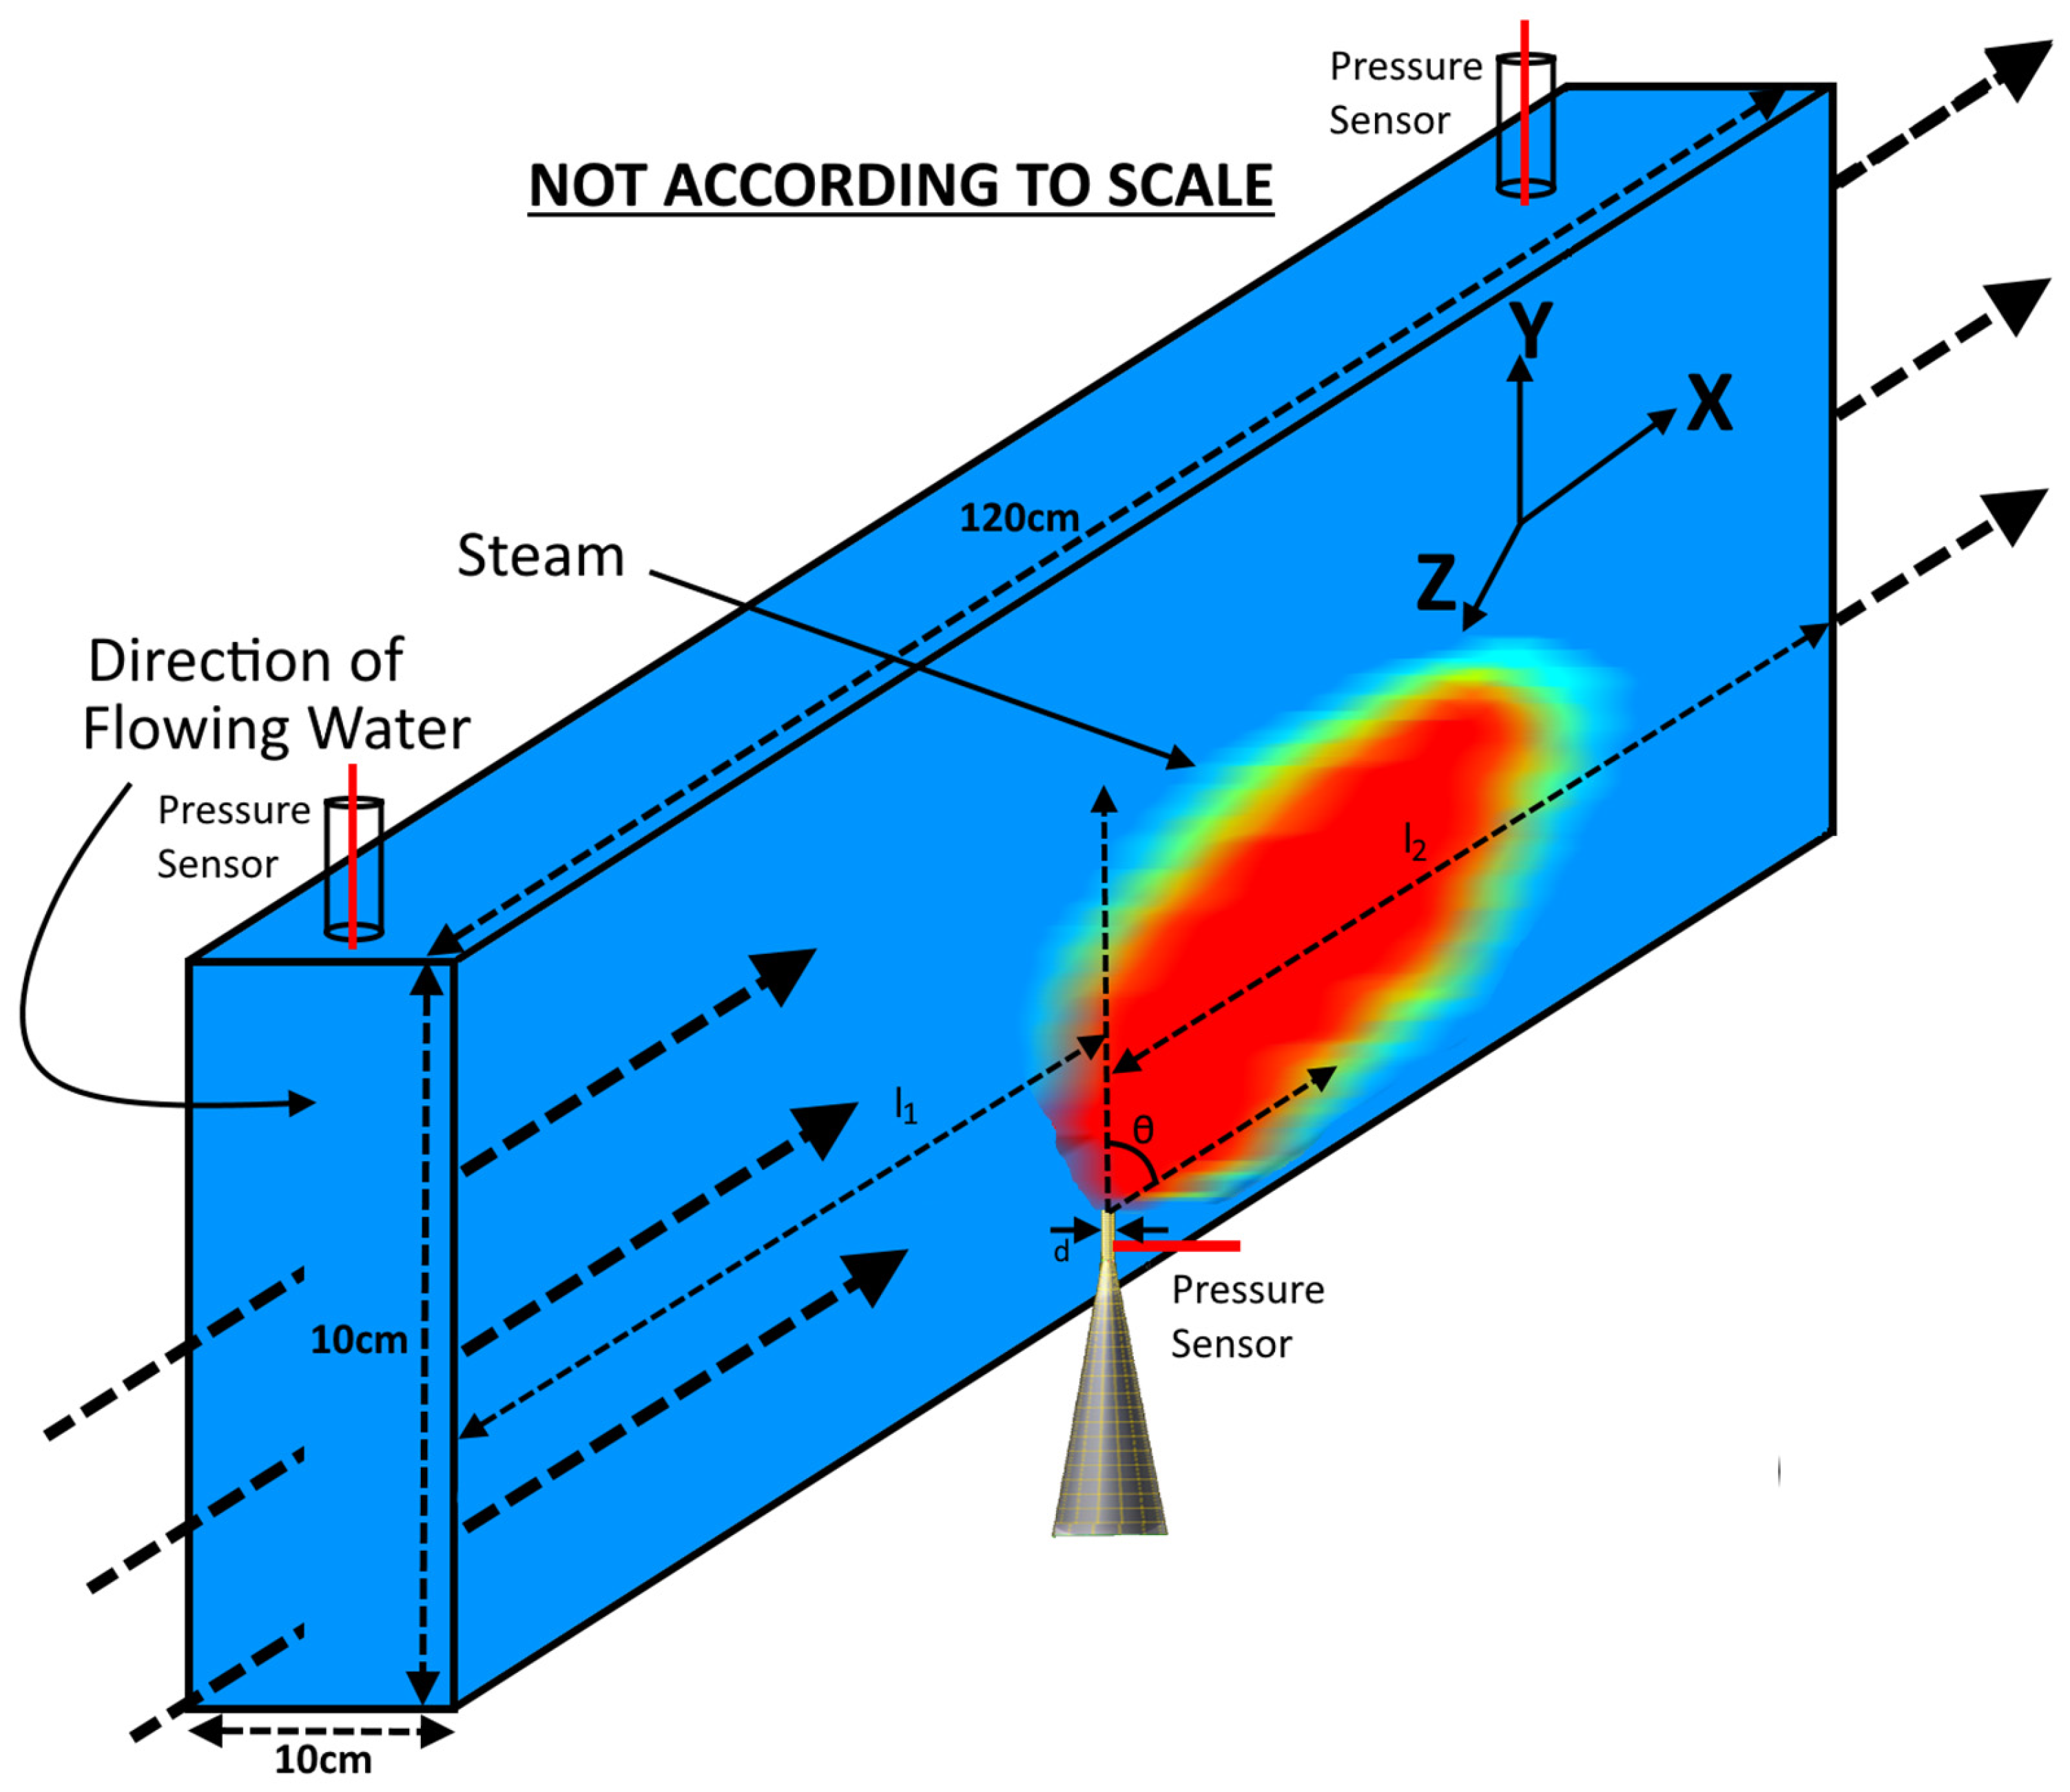
The experimental setup (Figure 1) consisted of a square flow channel with a height of 10 cm, a length of 120 cm and a width of 10 cm. Steam was injected into the flow channel through a supersonic nozzle which had the following dimensions: full length, 10 cm; throat, 0.5 cm; length of converging section, 8.5 cm; length of diverging section, 1.5 cm; nozzle inlet diameter, 2 cm; and nozzle exit diameter, 1.5 cm. Steam was injected at the inlet pressure of 3 bars and the water was run through the duct at a varying volumetric flowrate, from 1 to 3 m3/s, at increments of 0.5 m3/s with each step. The water’s superficial velocity rate was measured with the help of hot film anemometers (HFAs) in the upstream area, where the water was the only medium. The square duct was filled with water, and then water was circulated through the flow channel at varying flow rates by means of the externally regulated pump. The PIV system was used initially with fluorescent 1.0 g/cc microspheres as tracer particles to characterize the steam’s velocity and direction. The tracer particles were mixed with the water stream. The tracer particles had nearly the same density as the water so as to enable them to move with the water streams.

Figure 1.
A schematic of the square duct with water and steam injections.
A double pulsed Nd:YAG laser was utilized, of a wavelength of 532 nm, pulsing at a frequency of 15 Hz and a maximum energy of 500 mJ/s to generate a sheet of a thickness of 2 mm, with the help of the appropriate lenses to capture the whole fluid domain for the PIV scans, as seen in Figure 1.
The scattered light was guided by the reflecting mirror through the column onto the charged-couple device (CCD). The adoptive cross-correlation (ACC) algorithm was applied to process the initial scans and the method proved useful in providing the velocity fields for the regions of larger velocity gradients, as was the case in the present study, particularly with the interfacial region between the steam’s bubbles and the surrounding water. For this reason, two steps of the ACC were adopted in this work. The initial interrogation window was 64 × 64 pixels, and the refinement process was conducted at 32 × 32 pixels over the two steps. The measuring field-of-view for the region (H × W) including the steam jet and the surrounding area was 200 mm × 100 mm, which was covered using a CCD camera, covering a region of 100 mm × 100 mm. It was found that the steam jet’s profile velocity could generate a periodic oscillation at the entrance into the duct, with a velocity varying across a range of values against time. Data were acquired for 10 min at a rate of 10 Hz in a synchronized manner, with the same shutter speed used for both cameras. Thus, using this configuration, 6000 frames were acquired in 10 min against a single operating condition from a single camera. A national instruments data acquisition and data processing software module were used to record the pictures. Yet, in the case of the steam injection, the micro-bubbles could have been used as tracer particles. However, as it was a steam injection inside a pool of water, these small bubbles could not keep their existence due to the sudden condensation, so the original tracer particles were used instead [23]. The mass flow rates were measured with the help of the mass flow rate meters for the liquids at the inlet pipe of the steam, as well as that of water channel’s inlet and outlet. The experimental scheme can be seen in Table 1 at various operating conditions. The results drawn based on the mentioned phases of the experiments are discussed in detail in the following section.

Table 1.
Experimental phases and operating conditions.
3. Results and Discussion
In the current study, a supersonic steam jet was injected into cross-flowing water in a square duct, resulting into a complex hydrodynamic picture of the flow regimes thus observed. The results are described in detail in the proceeding sections.
3.1. Hydrodynamics of the Supersonic Steam Jet into the Cross-Flowing Water
From the PIV images, the structure of the flow regimes within the fluid domain can be seen in Figure 2. It should be noted that, throughout the manuscript, just the PIV image with the highest mass flow rate of water is referred to. The errors in the current PIV measurements are within 0.12–0.34%. The first image of each result reported here represents the case when the steam was injected at the inlet pressure of three bars, and the water travelled at a volumetric flow rate of 2.0 m3/s. The flow domain was divided into multiple sections, which are represented by the circles in Figure 2. A total of 6000 images were acquired for a duration of 10 min to support Figure 2. On average, the overlapped images under the influence of a single set of operating conditions show that the steam initially penetrated vertically into the flowing water before it bent towards the direction of the water. It should be noted that all results were plotted with the steam–water velocity profiles that were normalised using the velocity of the steam at the nozzle exit. From Figure 2, it can be clearly seen that the region of maximum velocity occurred above the nozzle exit, towards to the right side, due to the deflection of the steam jet under the influence of the momentum acquired by the flowing water. In contrast, the region above the steam’s jet shows a gradual decrease in velocity in the downstream direction—the jet showed an expansion profile in the region downstream of the nozzle’s exit.
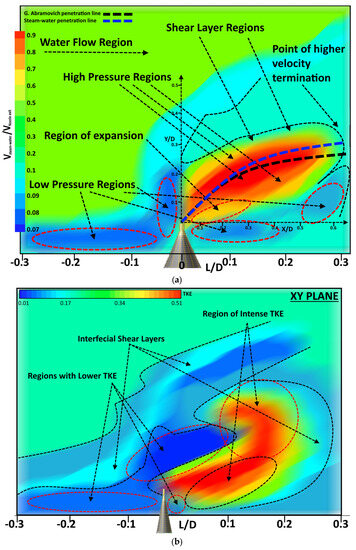
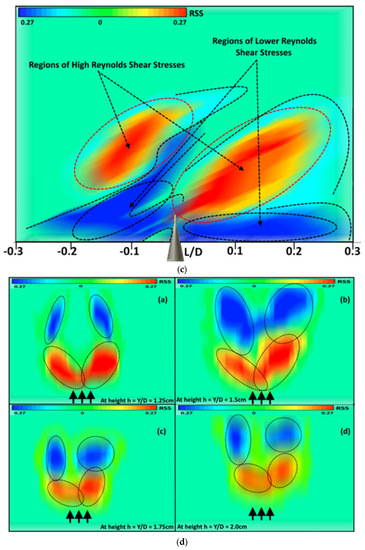

Figure 2.
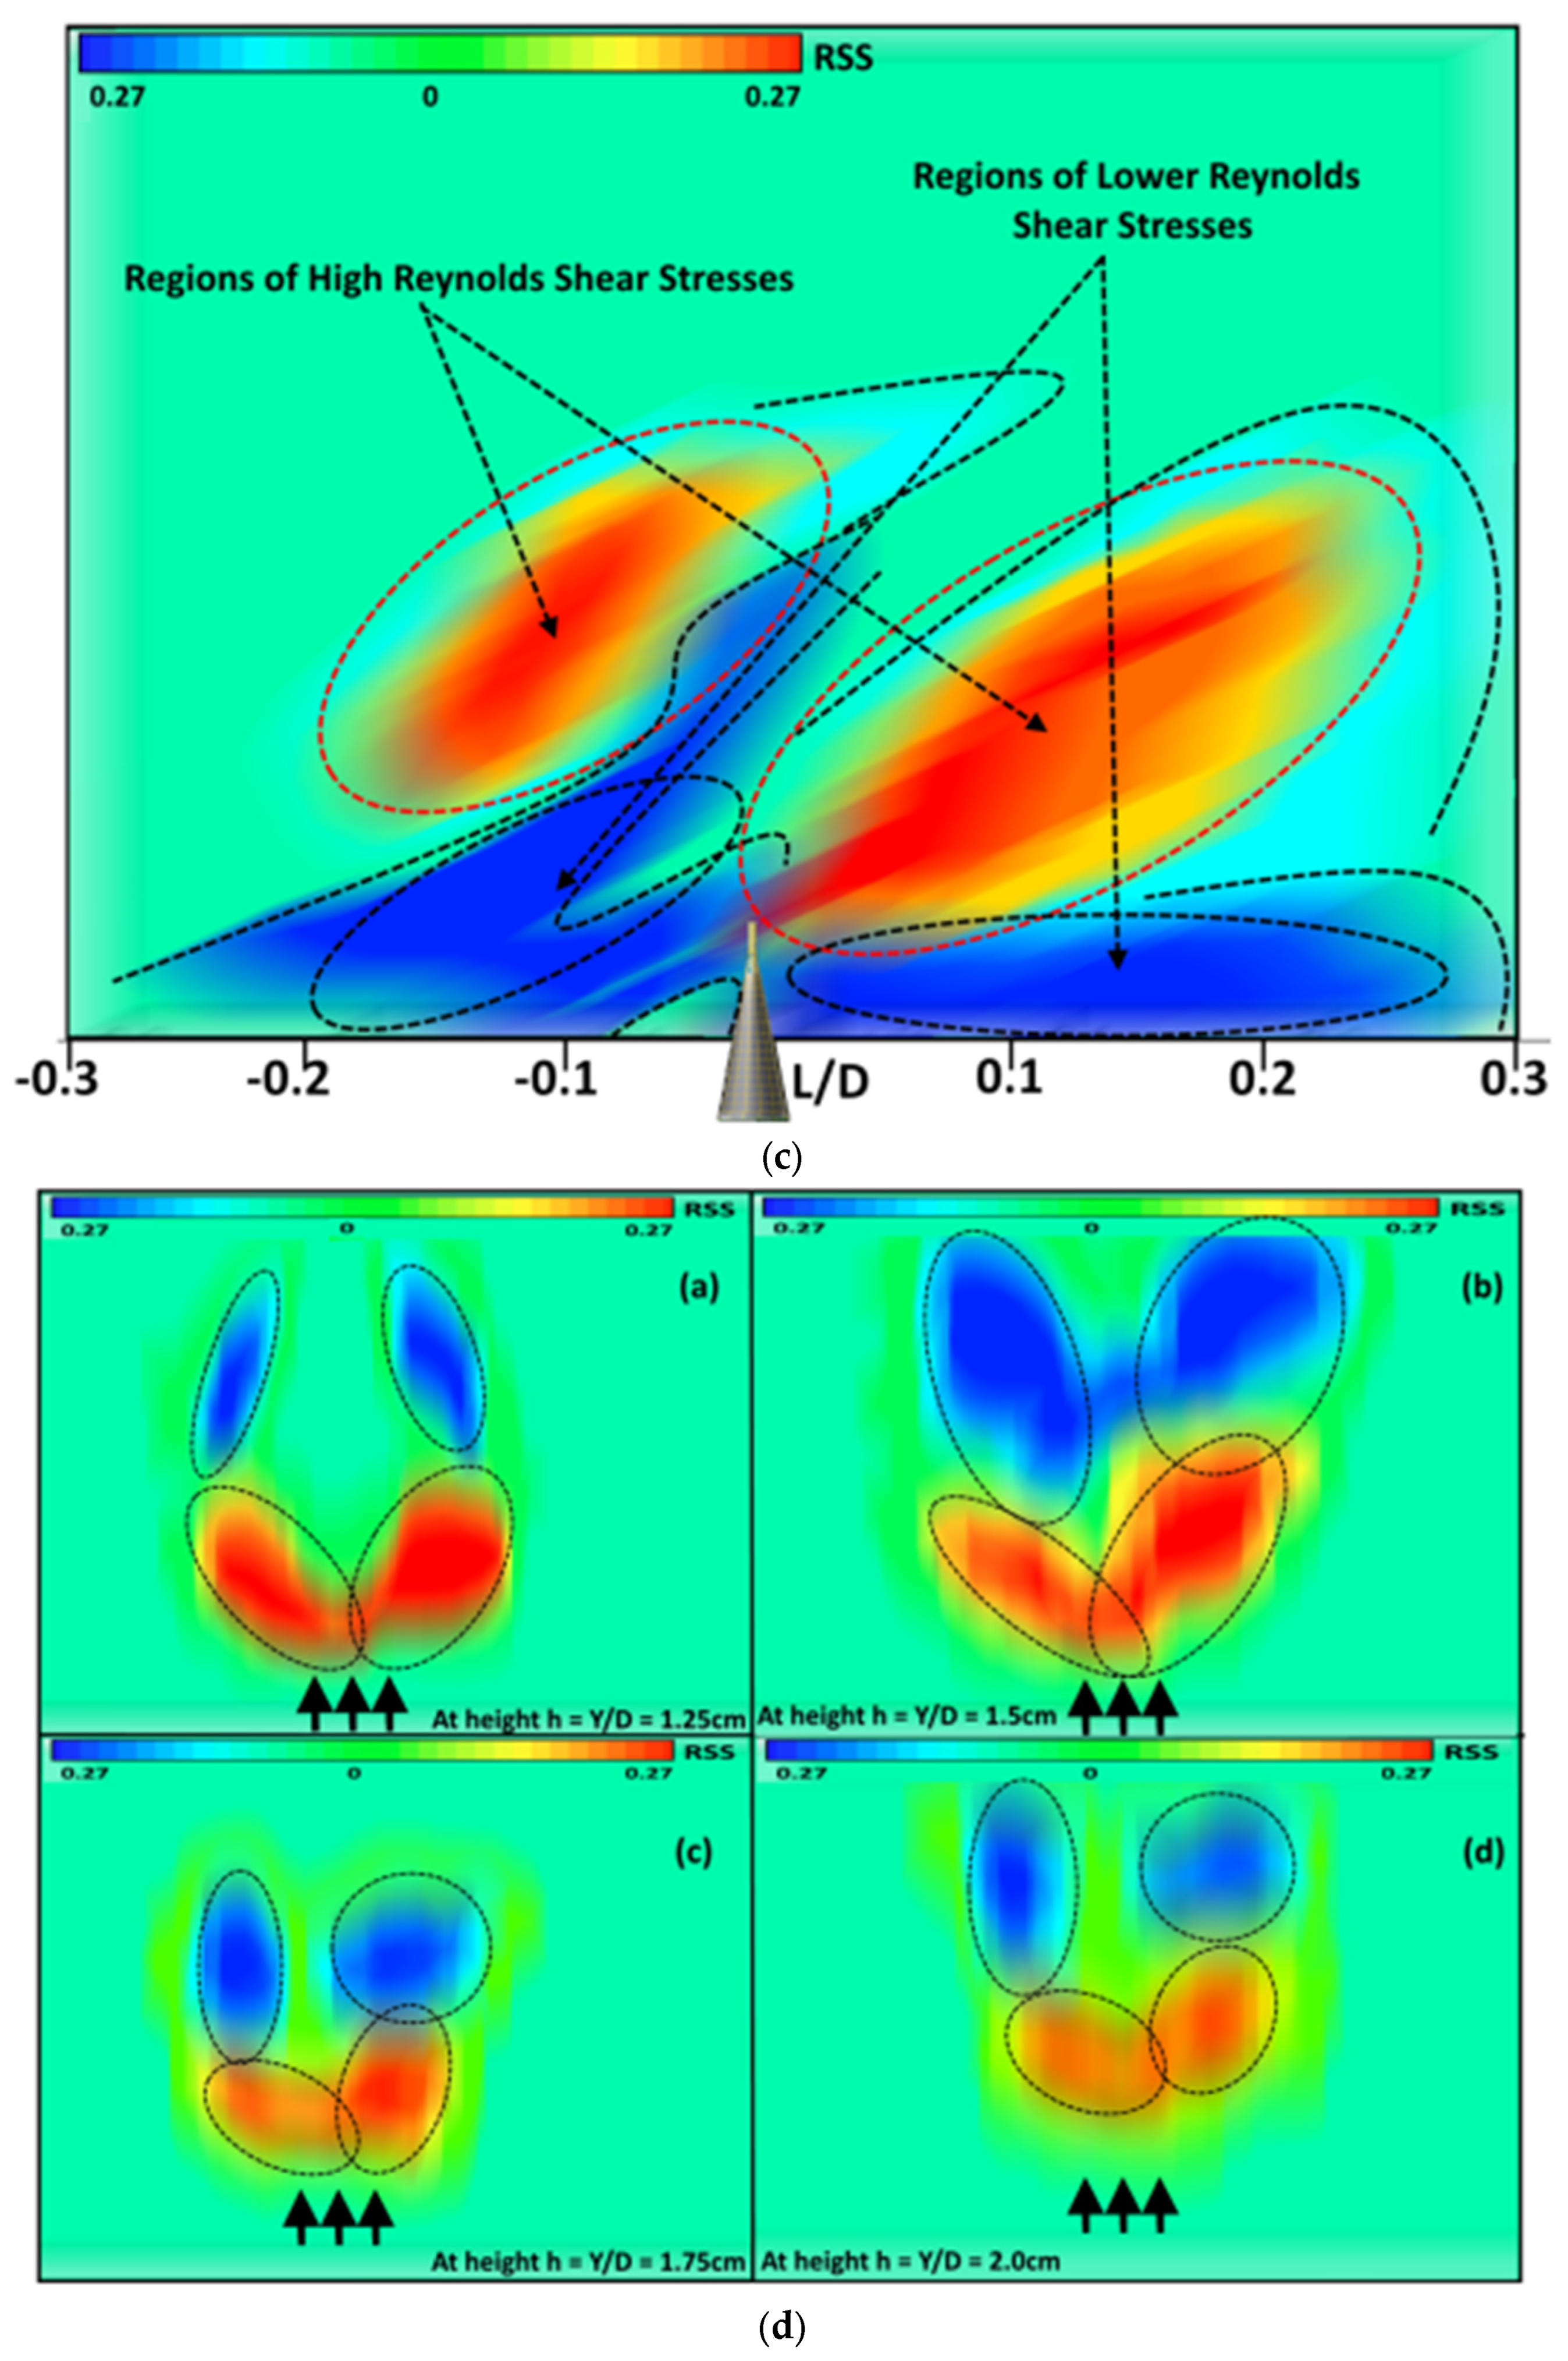
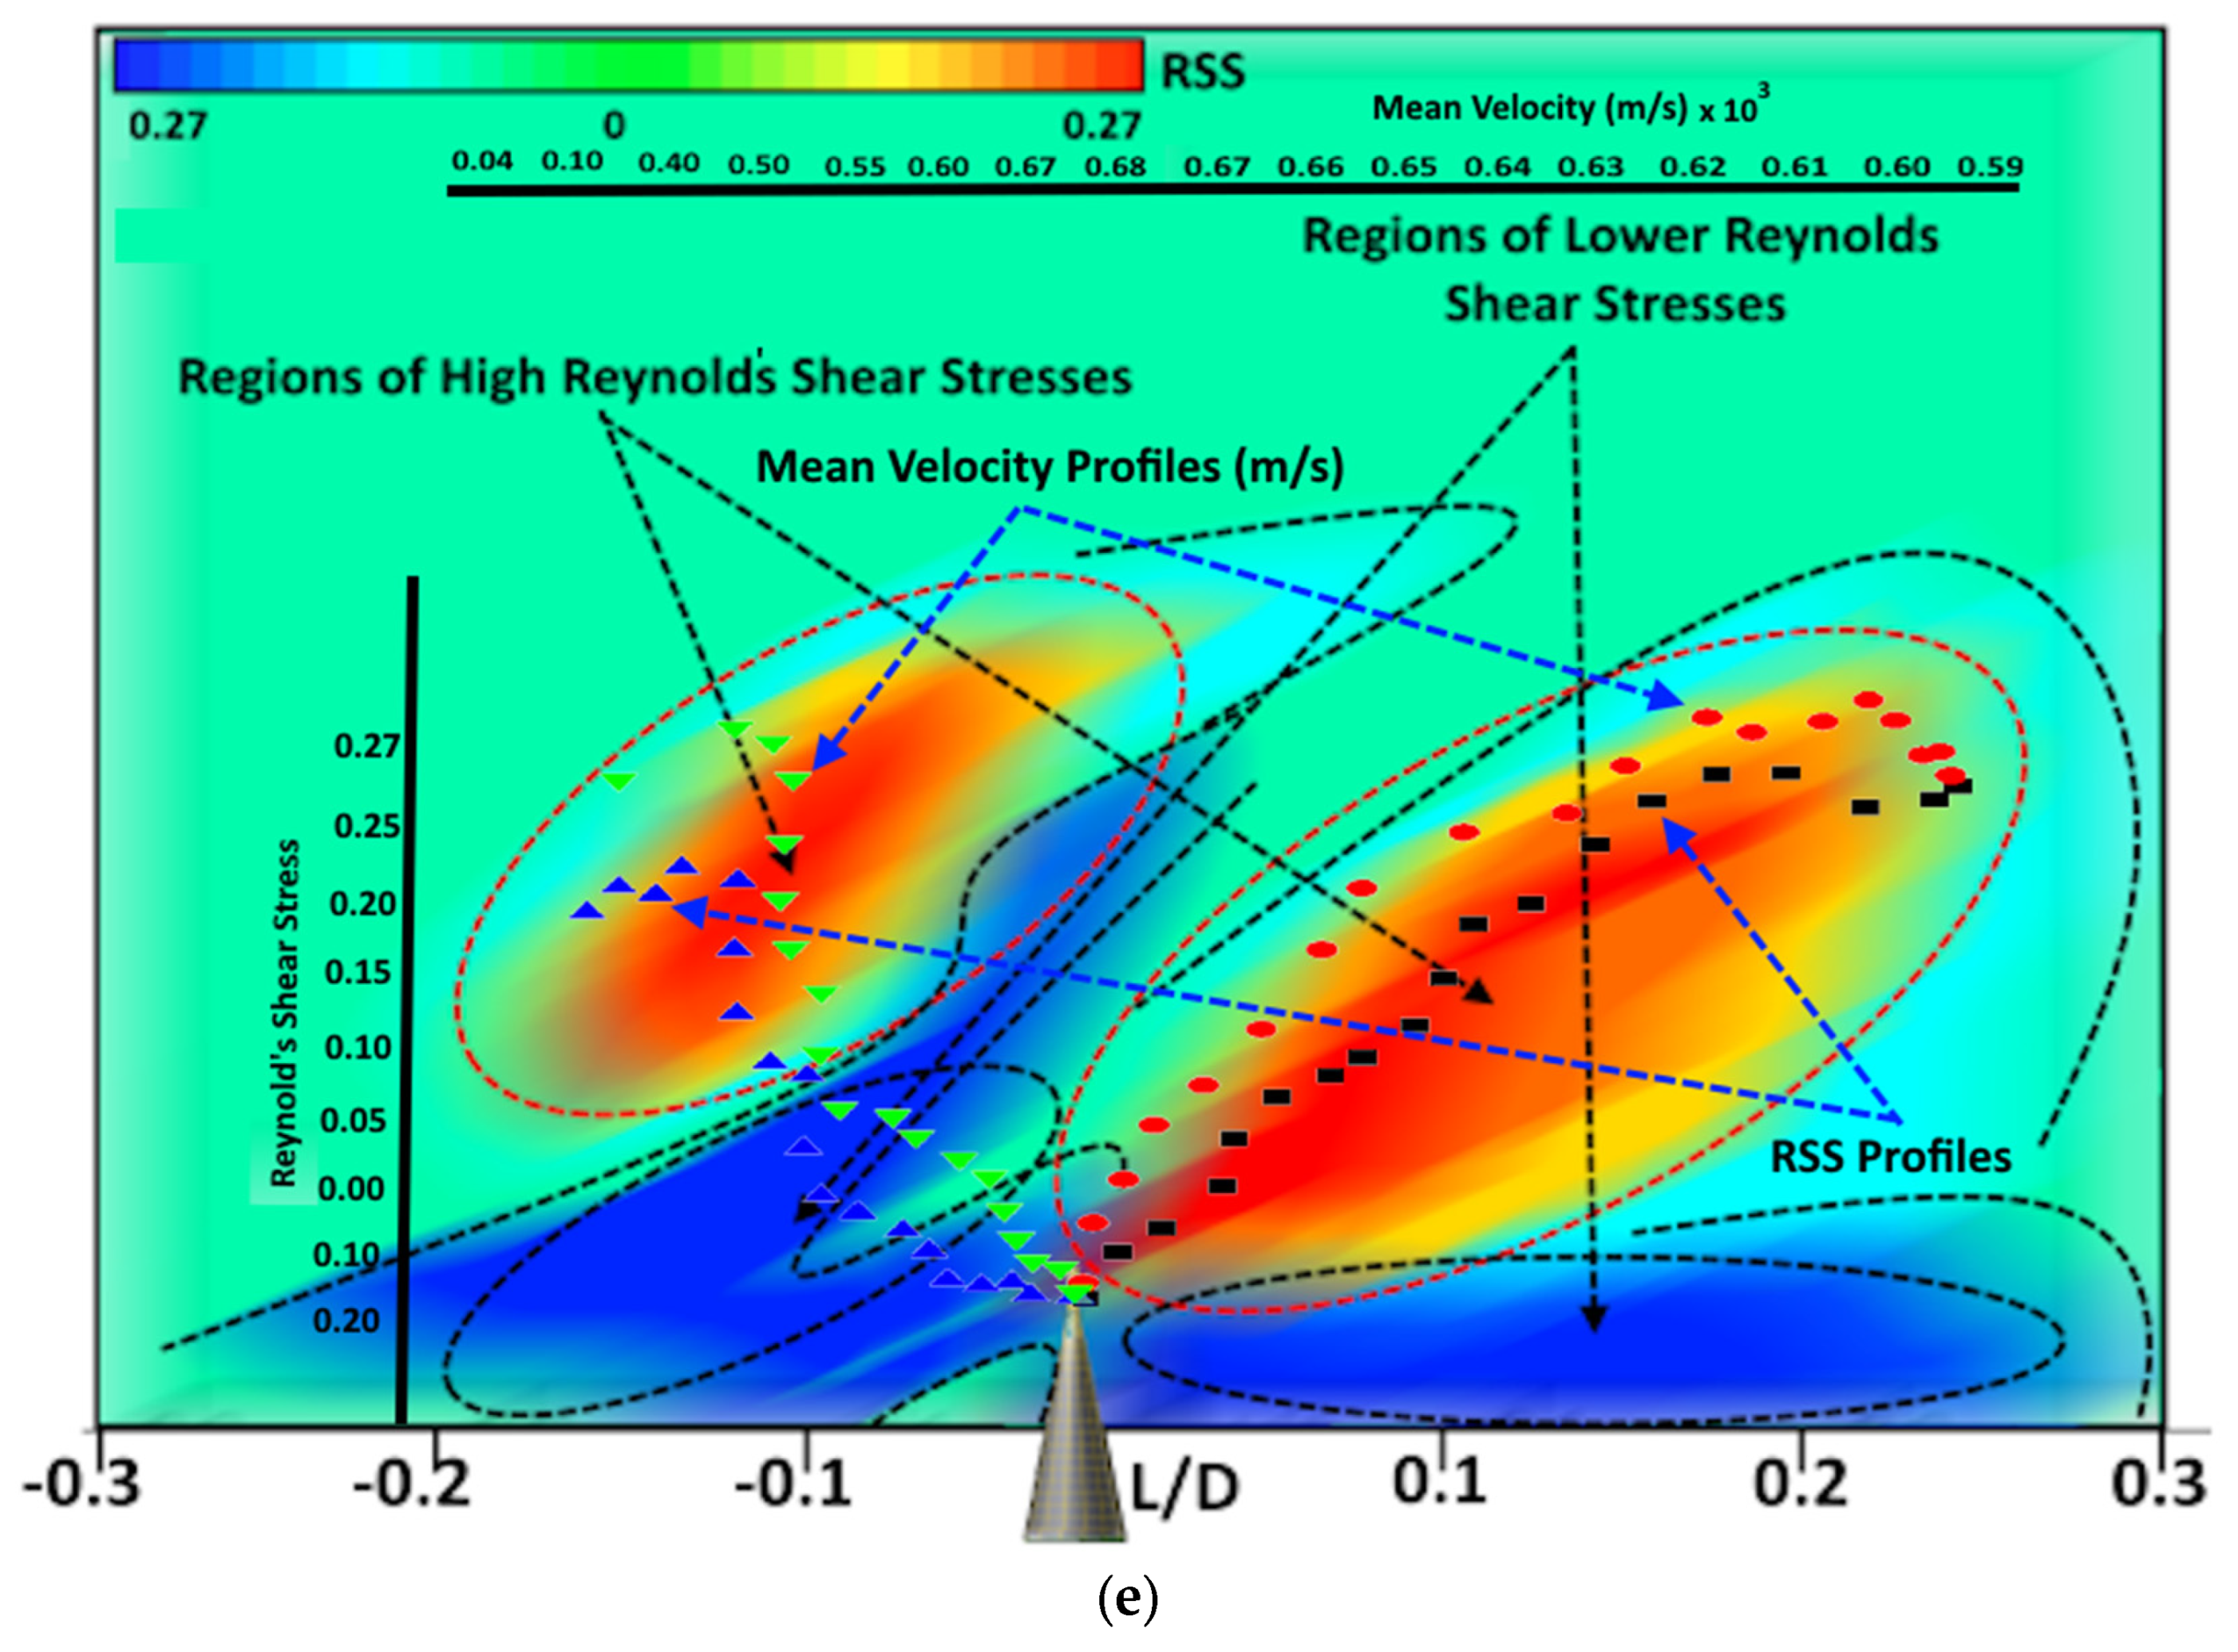
(a) Non-dimensionalised velocity profiles/penetration line/region across the fluid medium. (b) TKE profiles observed in experimental phase 5. (c) Reynold shear stress profiles as observed in experimental phase 5; (d) Reynold’s shear stress profiles as observed with the variation in the height of the observation PIV plane; (e) mean velocity vs. Reynold’s shear stress profiles at steam inlet pressure of 3 bars through the high-stress regions.
As seen in Figure 2, the height of the point where either the jet achieved the highest horizontal velocity, or the highest velocity profile was terminated, has been measured as 27 Dnozzle. The height above the nozzle exit was non-dimensionalised by the diameter of the nozzle exit. The vertical (Y) penetration of the steam’s jet was estimated with the help of the equation [24], expressed as
where X is the horizontal distance from the location of the steam’s nozzle exit and d is the diameter of the steam’s jet at the nozzle exit. As seen in Figure 2a, the PIV-based measurement of the jet’s penetration showed little discrepancy with the jet’s penetration values estimated from this equation. It can be observed that, in the present case, the supersonic steam being injected into the cross-flowing water showed a penetration length a little above the line, which was obtained from estimations using Equation (3). A possible reason for this may be the contribution of the buoyant steam compared to the water, which is absent in Equation (3). The deviation from the line drawn based on this equation has also been quoted in earlier experiments conducted [25]. As can be seen in Figure 2, with regard to the downstream of the steam’s nozzle, the formation of large vortical structures ensured mixing, which was further amplified by the cross-flowing water. Also seen in Figure 2, regions of low pressure were formed at the bottom of the deflected steam’s jet, which may have been due to the low-pressure suction of the steam jet just near the exit of the nozzle, as also illustrated in earlier studies [26,27]. These circulation zones had an opposite vorticity in comparison to the vorticity of the large circulation zones at the front. It was further observed that, among the experimental phases, most of the small circulation zones were observed at higher flow rates of water, contrary to the number of circulation zones at lower flow rates. This shows the dependence of the low-pressure circulation zones on the volumetric flow rate of the water, which may be proportional in terms of mixing, as observed in the earlier studies [28,29,30]. The non-dimensionalised turbulence kinetic energy (TKE) relation was given as in Equation (3), where X is the horizontal distance from the location of the steam’s nozzle exit and d is the diameter of the steam’s jet at the nozzle exit. As seen in Figure 2a, the PIV-based measurement of the jet’s penetration showed little discrepancy with the jet’s penetration values estimated from this equation. It can be observed that, in the present case, the supersonic steam being injected into the cross-flowing water showed a penetration length a little above the line, which was obtained from estimations using Equation (3). A possible reason for this may be the contribution of the buoyant steam compared to the water, which is absent in Equation (3). The deviation from the line drawn based on this equation has been quoted in earlier studies [25], too. As can be seen in Figure 2, with regard to the downstream of the steam’s nozzle, the formation of the large vortical structures ensured mixing, which was further amplified by the cross-flowing water. Also seen in Figure 2, regions of low pressure were formed at the bottom of the deflected steam’s jet, which may have been due to the low-pressure suction of the steam jet just near the exit of the nozzle, as also illustrated in earlier studies [26,27]. These circulation zones have an opposite vorticity in comparison to the vorticity of the large circulation zones at the front. It was further observed that, among the experimental phases, most of the small circulation zones were observed at higher flow rates of water, contrary to the number of circulation zones at lower flow rates. This shows the dependence of the low-pressure circulation zones on the volumetric flow rate of the water, which may be proportional in terms of mixing, as observed in earlier studies [28,29,30]. The non-dimensionalised turbulence kinetic energy (TKE) relation was given as
where are the fluctuating velocity components along the x, y and z-axis, respectively, and is the mean velocity of the flow at any location in the flow domain.
For the values of the turbulence kinetic energy (TKE), we used the relation given in Equation (3). However, as our interest is mainly focused on the jet penetration and on the flow characteristics in the vertical plane, the values of the velocity component along the z-axis have been used as unity. This, on the one hand, keeps the stability and correctness of the equation intact and, on the other hand, it helps us to focus our observation window only along the x–y plane. The 2D PIV image here captures the upward propagation of the steam jet (y-axis), whereas the cross-flowing water forces the steam jet to be bent along the length of the duct (x-axis). Parameters such as the TKE are associated with the velocity profile of the steam jet along the length of the duct against the height of the duct. The orientation of the laser sheet and the camera were at right angles to each other, with the laser sheet aligned along the x–y plane. As from Figure 2b, two distinct regions of TKE could be identified with the initial flow conditions, and this increased to three at the highest flow rate. In the upstream region, the TKE resulted from the shear layer interaction involving the steam’s interface with the water, and the interaction between the shock and the boundary layer. With the rise in the flow rate of the water and an increased deflection in the steam’s jet along the direction of flow of the water with the sudden expansion of the steam, small secondary circulations involving the TKE profiles were observed.
For the calculation of the Reynolds shear stress, the values of the mean time and average velocities were subtracted from the instantaneous values of the velocities along the x and y-axis. Furthermore, we joined the k-type thermocouples with the anemometer’s knobs to measure the density of the fluid. The temperature values thus obtained were utilized to determine the corresponding steam density from the steam data tables. Thus, the Reynolds shear stress values were estimated. The Reynolds shear stress measurements can be seen in Figure 2c, which shows two spots having high Reynolds shear stress values. The non-dimensionalised Reynolds shear stress (RSS) () reflected a behaviour in the regions where the mean velocity gradients were higher between the injected steam and the cross-flowing water. Across the y–z plane at three distances, i.e., h = Y/D = 1.25, 1 5, 1.75 and 2.0 cm, the Reynolds shear stress showed a slight diffusive behaviour at a higher non-dimensionalised height, h = Y/D, along the y-axis (normal) to the flow. In the present study, our main purpose is to present a macroscopic view of the turbulence kinetic energy (TKE) and Reynolds shear stress (RSS) and find out their impacts on the flow characteristics. It was found that the vortical structures affected the TKE as well as the associated decays of the flow. Regions of high TKE were found to initially increase due to the jet’s interaction with the surrounding flow field, and thus, due to the significant contribution of the buoyancy, the jet’s inlet pressure and the surrounding water lateral velocity were affected. All these factors aided the generation of the vortical structures that enhanced mixing in said regions. The role of these vortical structures having different scales and strengths can be seen in Figure 2a,b, which affected the increasing strain rate of the flow. Thus, these structures directly affected the production of the turbulence KE. The interaction of these structures and the resulting distribution of the TKE across the vertical planes is critical to understand the mixing between the distinctive flow domains (i.e., the jet and the cross-flowing water). The contours of the TKE showed how the flow structures shifted the turbulence from the region above the steam jet’s exit nozzle to the region to the right of the flowing water. Further, the main reason of the generation of RSS is the interaction between the region dominated by the fluctuating velocity due to the violent steam jet, and the region covering the mean water flow velocity. The stress gradient in these flows depends on the time history of the turbulence. The RSS vanished in the regions where the velocity gradients were temporally zero, as can be seen from Figure 2c,d. By the time the RSS values in the regions that were devoid of RSS contours became zero, the values of the TKE were derived from the relation given in Equation (3); however, since our interest is mainly focused on the jet penetration and on the flow characteristics in the vertical plane, it is therefore the values of the velocity component along the z-direction that have been approximated as unity. This results in us favouring the equation’s usefulness and stability and, on the other hand, it assists our focus on the observation window along the x–y plane only. The 2D PIV image here captures the upward propagation of the steam jet (y-axis), whereas the cross-flowing water forces the steam jet to be along the length of the duct (x-axis). Parameters such as the TKE are associated with the velocity profile of the steam jet along the length of the duct against the height of the duct. The orientation of the laser sheet and the camera are at right angles to each other, with the laser sheet aligned along the x–y plane. The comparative profiles for the Reynold’s shear stress and the mean velocity through the high-stress regions are shown in Figure 2e.
3.2. Shear Layer-Driven Instabilities
The shear layer generated at the interface among the steam–water two-phase flows contains instabilities which were observed in the case of the vertical jet injection long ago. These instabilities were formed due to various flow-induced mechanisms that depended upon the Reynolds number, the velocity gradients and the density gradients between the two interacting fluids. The PIV images used to address the topic in this section were converted into black and white images by applying the decolourisation technique, taking measures to maintain the contrast [31] with the Matlab-based edge detection technique [32].
Since the greyscale conversion includes the loss of the data, decolourisation was applied with the contrast preservation method. This relaxed the contrast of the colour constraints and enabled us to construct a non-local colour pair (i.e., white and black) using a non-linear bounding hierarchy in which the duplication of the local colour was removed. The initial profile thus obtained showed the formation of a hovering vortex, which encapsulated the jet from the windward side, thus contributing to the vortex pairs that were generated in a counter-direction to each other, without affecting the horseshoe-like structures that were formed parallel to the surface of the flow vessel. Such structures were found dominant up to a height of 2.0 cm in the current experiment, as seen in Figure 2d.
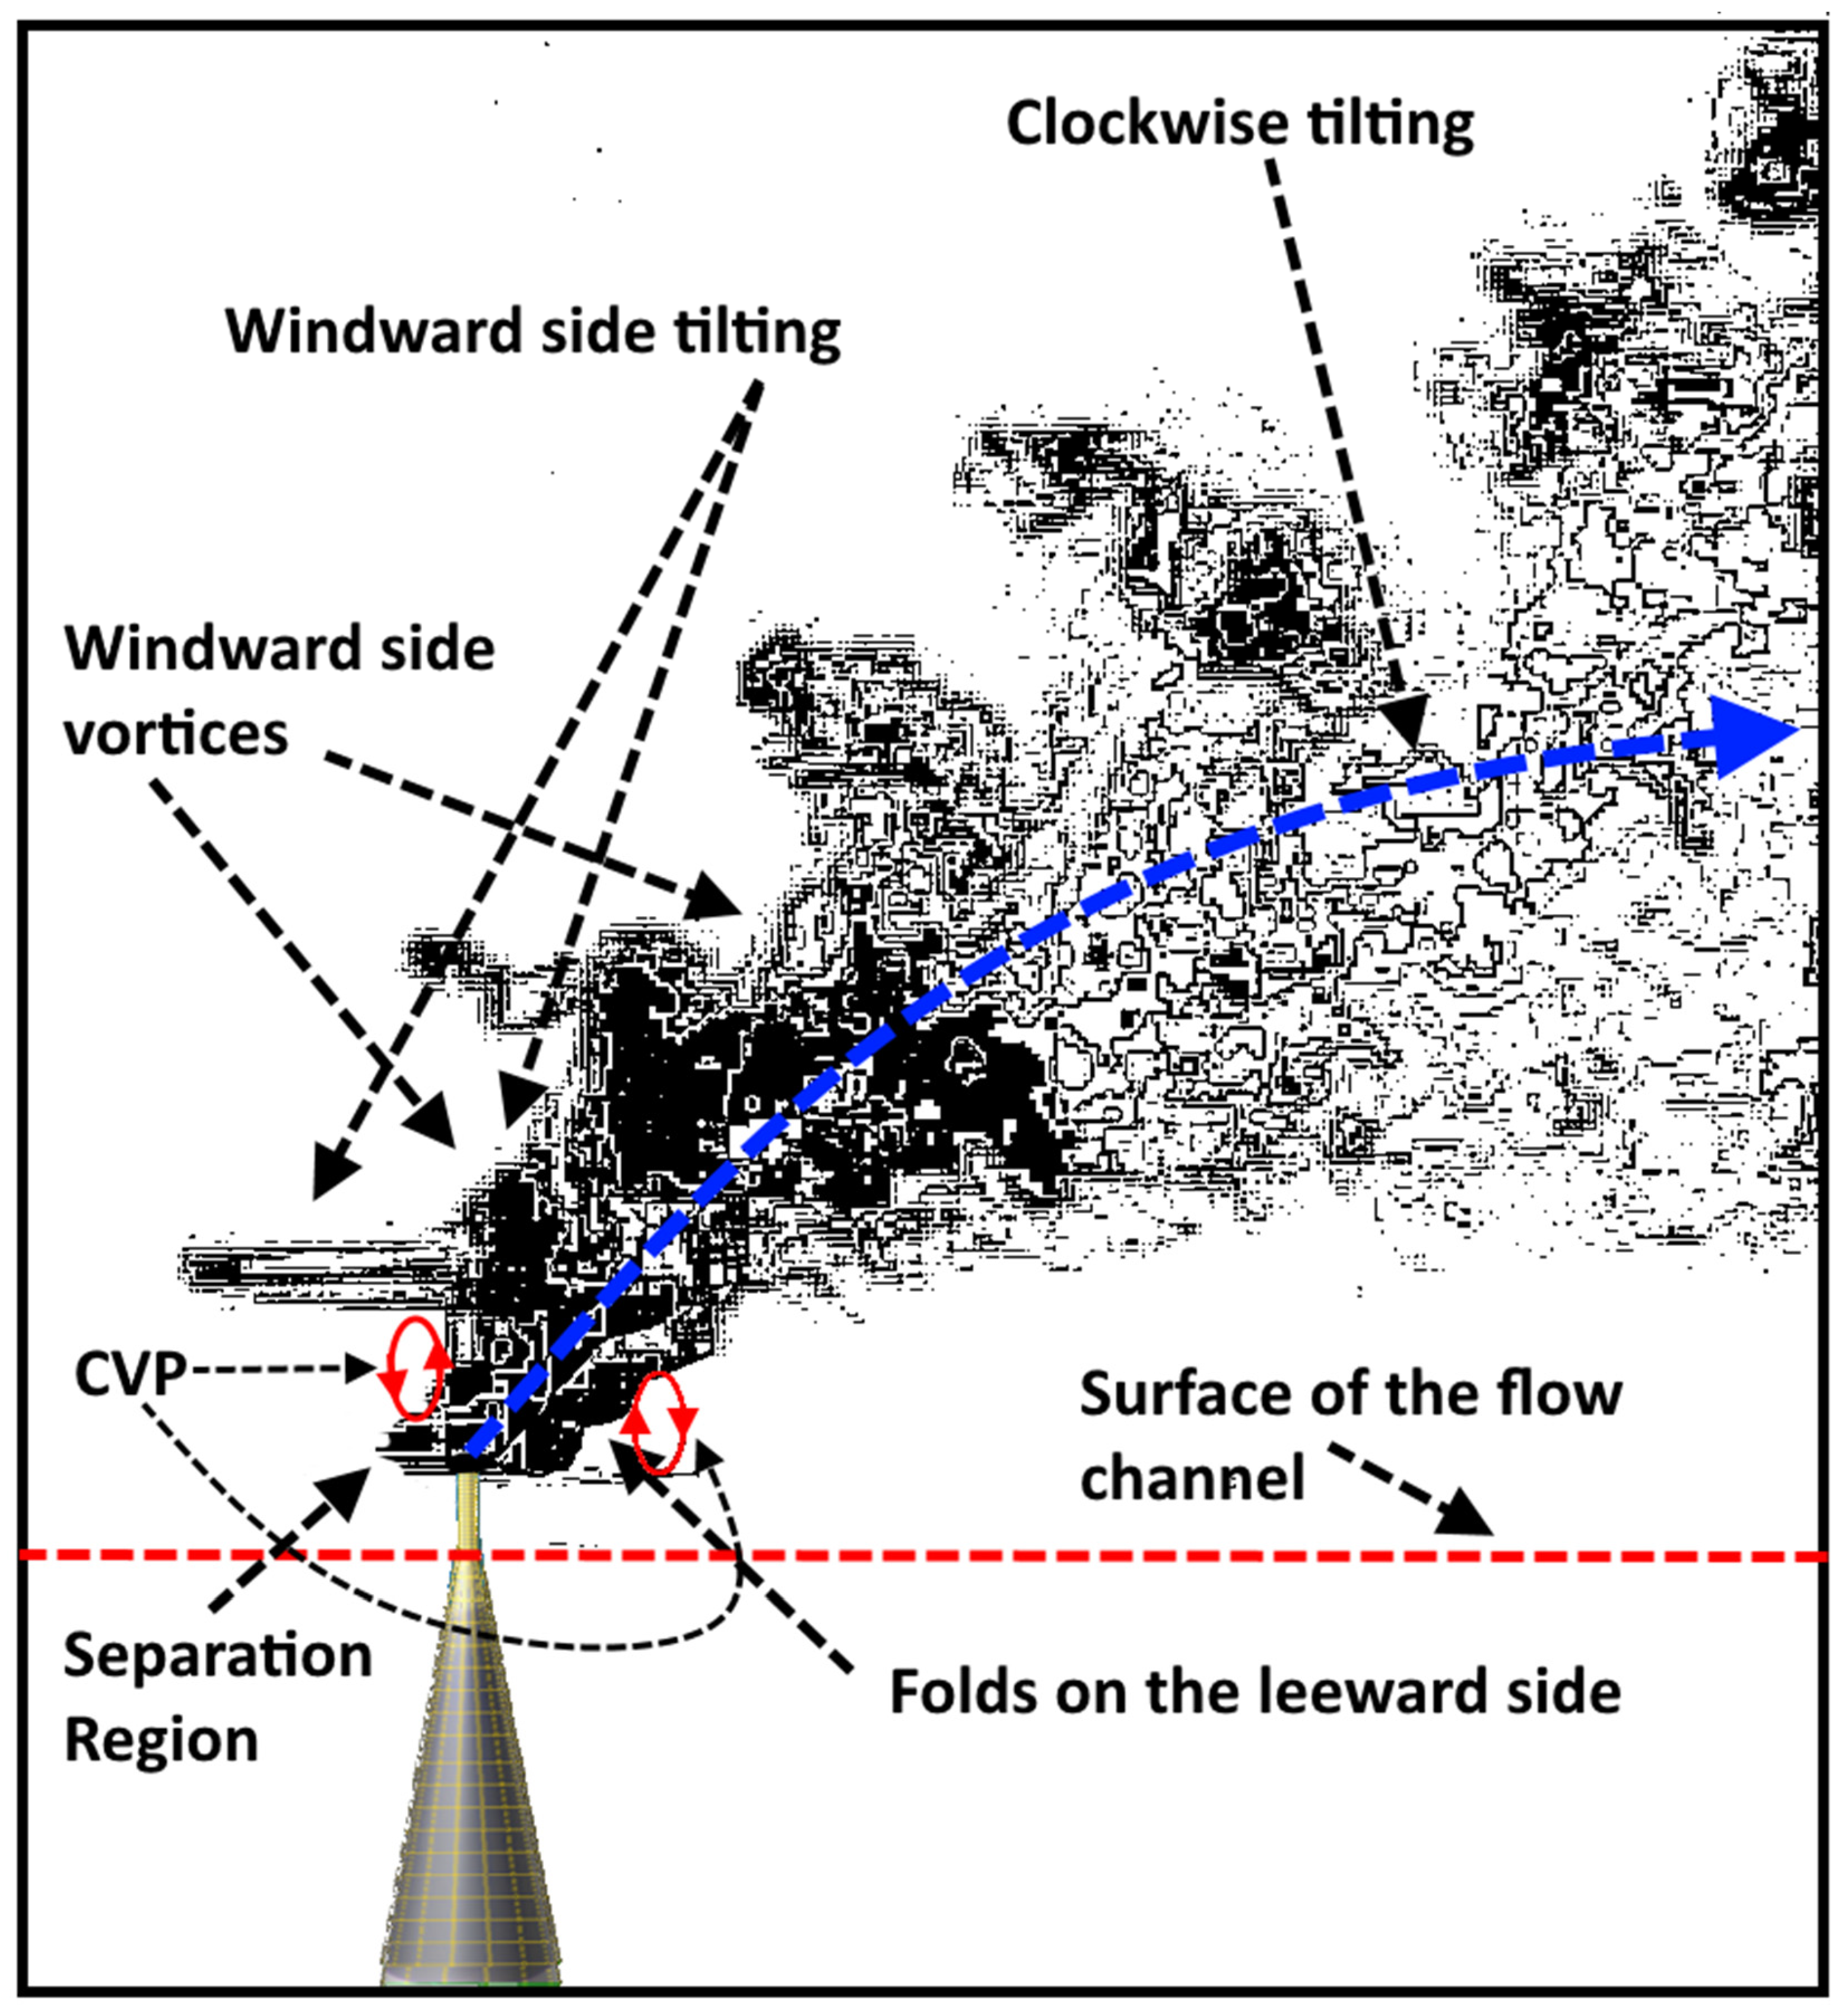
Due to the gradient of the velocities of the steam jet and the surrounding cross-flowing water stream, the shear layer contained vortical structures which overturned to cause the KH instabilities. With sufficient water flow to surround the steam’s jet, the KH instabilities were transformed into the periodic ring vortices around the jet body, mainly at the interface between the steam and water, which can be observed from Figure 3. A careful examination of all the PIV images reveals that the behaviour involving the KH instabilities was not continuous, and the main reason for the discontinuity of such behaviour may have been the inception and collapse of the steam bubbles after emerging from the exit of the nozzle. Thus, we can attribute this behaviour as a mean or time-averaged behaviour [33]. From Figure 3, the small separation region can be seen just on the windward side near the exit of the nozzle, whereas the shear layer-induced overturning circulations were influenced to a greater extent by the rise in the flow rate of the water. The vortex rings were found to be tilted initially and expanded more towards the windward side of the flow; however, after rising to a certain height, they tilted in a clockwise direction and diverted towards the right-hand side along the clockwise direction [34]. Counter-rotating vortex pairs (CVPs) were observed in this study, along with leeward side folds, which can be noticed in Figure 3. The region near the nozzle exit appeared to be the dominant reason for the generation of the CVPs. Thus, based on these observations, the upstream part of the jet, which was tilted towards the right-hand side in a clockwise direction, as well as the downward side, where the planes aligned with the direction of the jet, thus contributed to the creation of the counter-rotating vortex pairs on the windward and leeward sides of the jet [35,36,37].
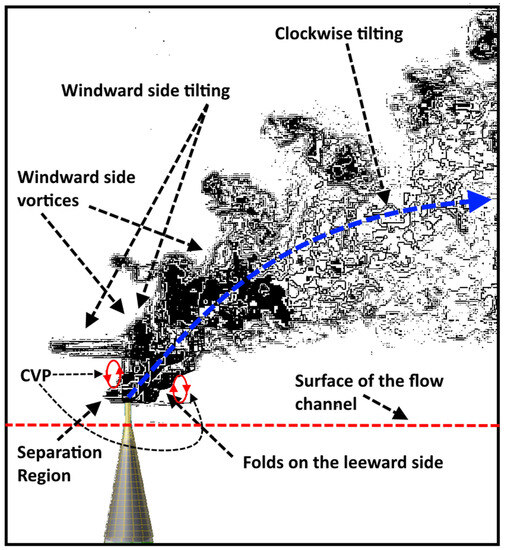
Figure 3.
Hydrodynamics of the shear layer and the jet profiles.
3.3. Effects of Operating Conditions on the Mixing
In this section, the flow process optimization of the supersonic steam jet cross-water flow injection was conducted in reference to the effect of the flow properties as well as the dimensions of the mixing of the steam with the water. The prominent parameters that were used in the study of the steam–water flow process optimization included the flow rate ratio of the steam and water, the angle of the steam’s injection, and the ratio of the distance between the vessel inlet and the centre of the nozzle exit (l1) to the distance between the flow channel outlet and the central point of the nozzle exit (l2), (i.e., l1/l2). The most effective parameter was determined based on the extreme difference analysis method. The details of the variations in the vital process parameters are summarized in Table 2. Four criteria for the optimization of the flow process are set here. These include the extent of the pressure recovery, the extent of the mixing, the penetration height and the separation length. The relation for the pressure recovery [38] is expressed as
Table 2.
Experimental phases and operating conditions for design optimization.
The mixing efficiency is defined as the ratio of the mass flow rate of the steam to the mass flow rate of the water expressed as
where is the void fraction (i.e., the fraction of steam from the total of steam + water), the subscript s represents the steam and w represents the water. The penetration height was the height from the nozzle exit to the point at which the maximum velocity profile terminated in the cross-flowing water, and the separation length was the distance between the location of the separation of the shock wave and the centre point of the steam-injecting nozzle’s exit [37]. The values of these four parameters that have been set here as the major criteria for the purpose of the optimization of the flow conditions to achieve the maximum mixing between the two phases are given in Table 3. It was found that the non-dimensionalised penetration height had almost a proportional effect on the non-dimensionalised separation length of the jet, whereas the non-dimensionalised penetration height itself was influenced by the ratio of the mass flow rates corresponding to the steam and the cross-flowing water. The most crucial parameter, i.e., the mixing efficiency, was found to show an increasing trend with the rise in the ratio of the mass flow rates, penetration height and separation lengths. The mixing efficiency was evaluated using the expression given in Equation (5). To our observation, the more prominent factor that affected the mixing efficiency was the ratio of the mass flow rates and, subsequently, the velocity of the steam jet that affected the mixing efficiency itself. However, in comparison to the other factors, the optimizing of the mixing phenomena was influenced more by the mixing efficiency.
Table 3.
Optimization of the design based on the mixing efficiency and related variables.
The effect of the angle of injection was found to have an inverse impact on all four variables, followed by the ratio of the distances. From the discussion given above, it can be inferred that the ratio of the steam jet mass flow rate to the mass flow rate of the cross-flowing water had a significant impact on all these parameters, affecting not only the mixing efficiency but also the penetration height, as well as the ratio of the separation distance.
Based on the measured values for all four parameters, extreme difference analysis was opted for here in order to determine the parameter that had the greatest effect on the mixing performance of the supersonic steam jet injected into the cross-flowing water [38], which we believe to be the most important aspect for the performance of the two-phase mixing, expressed as
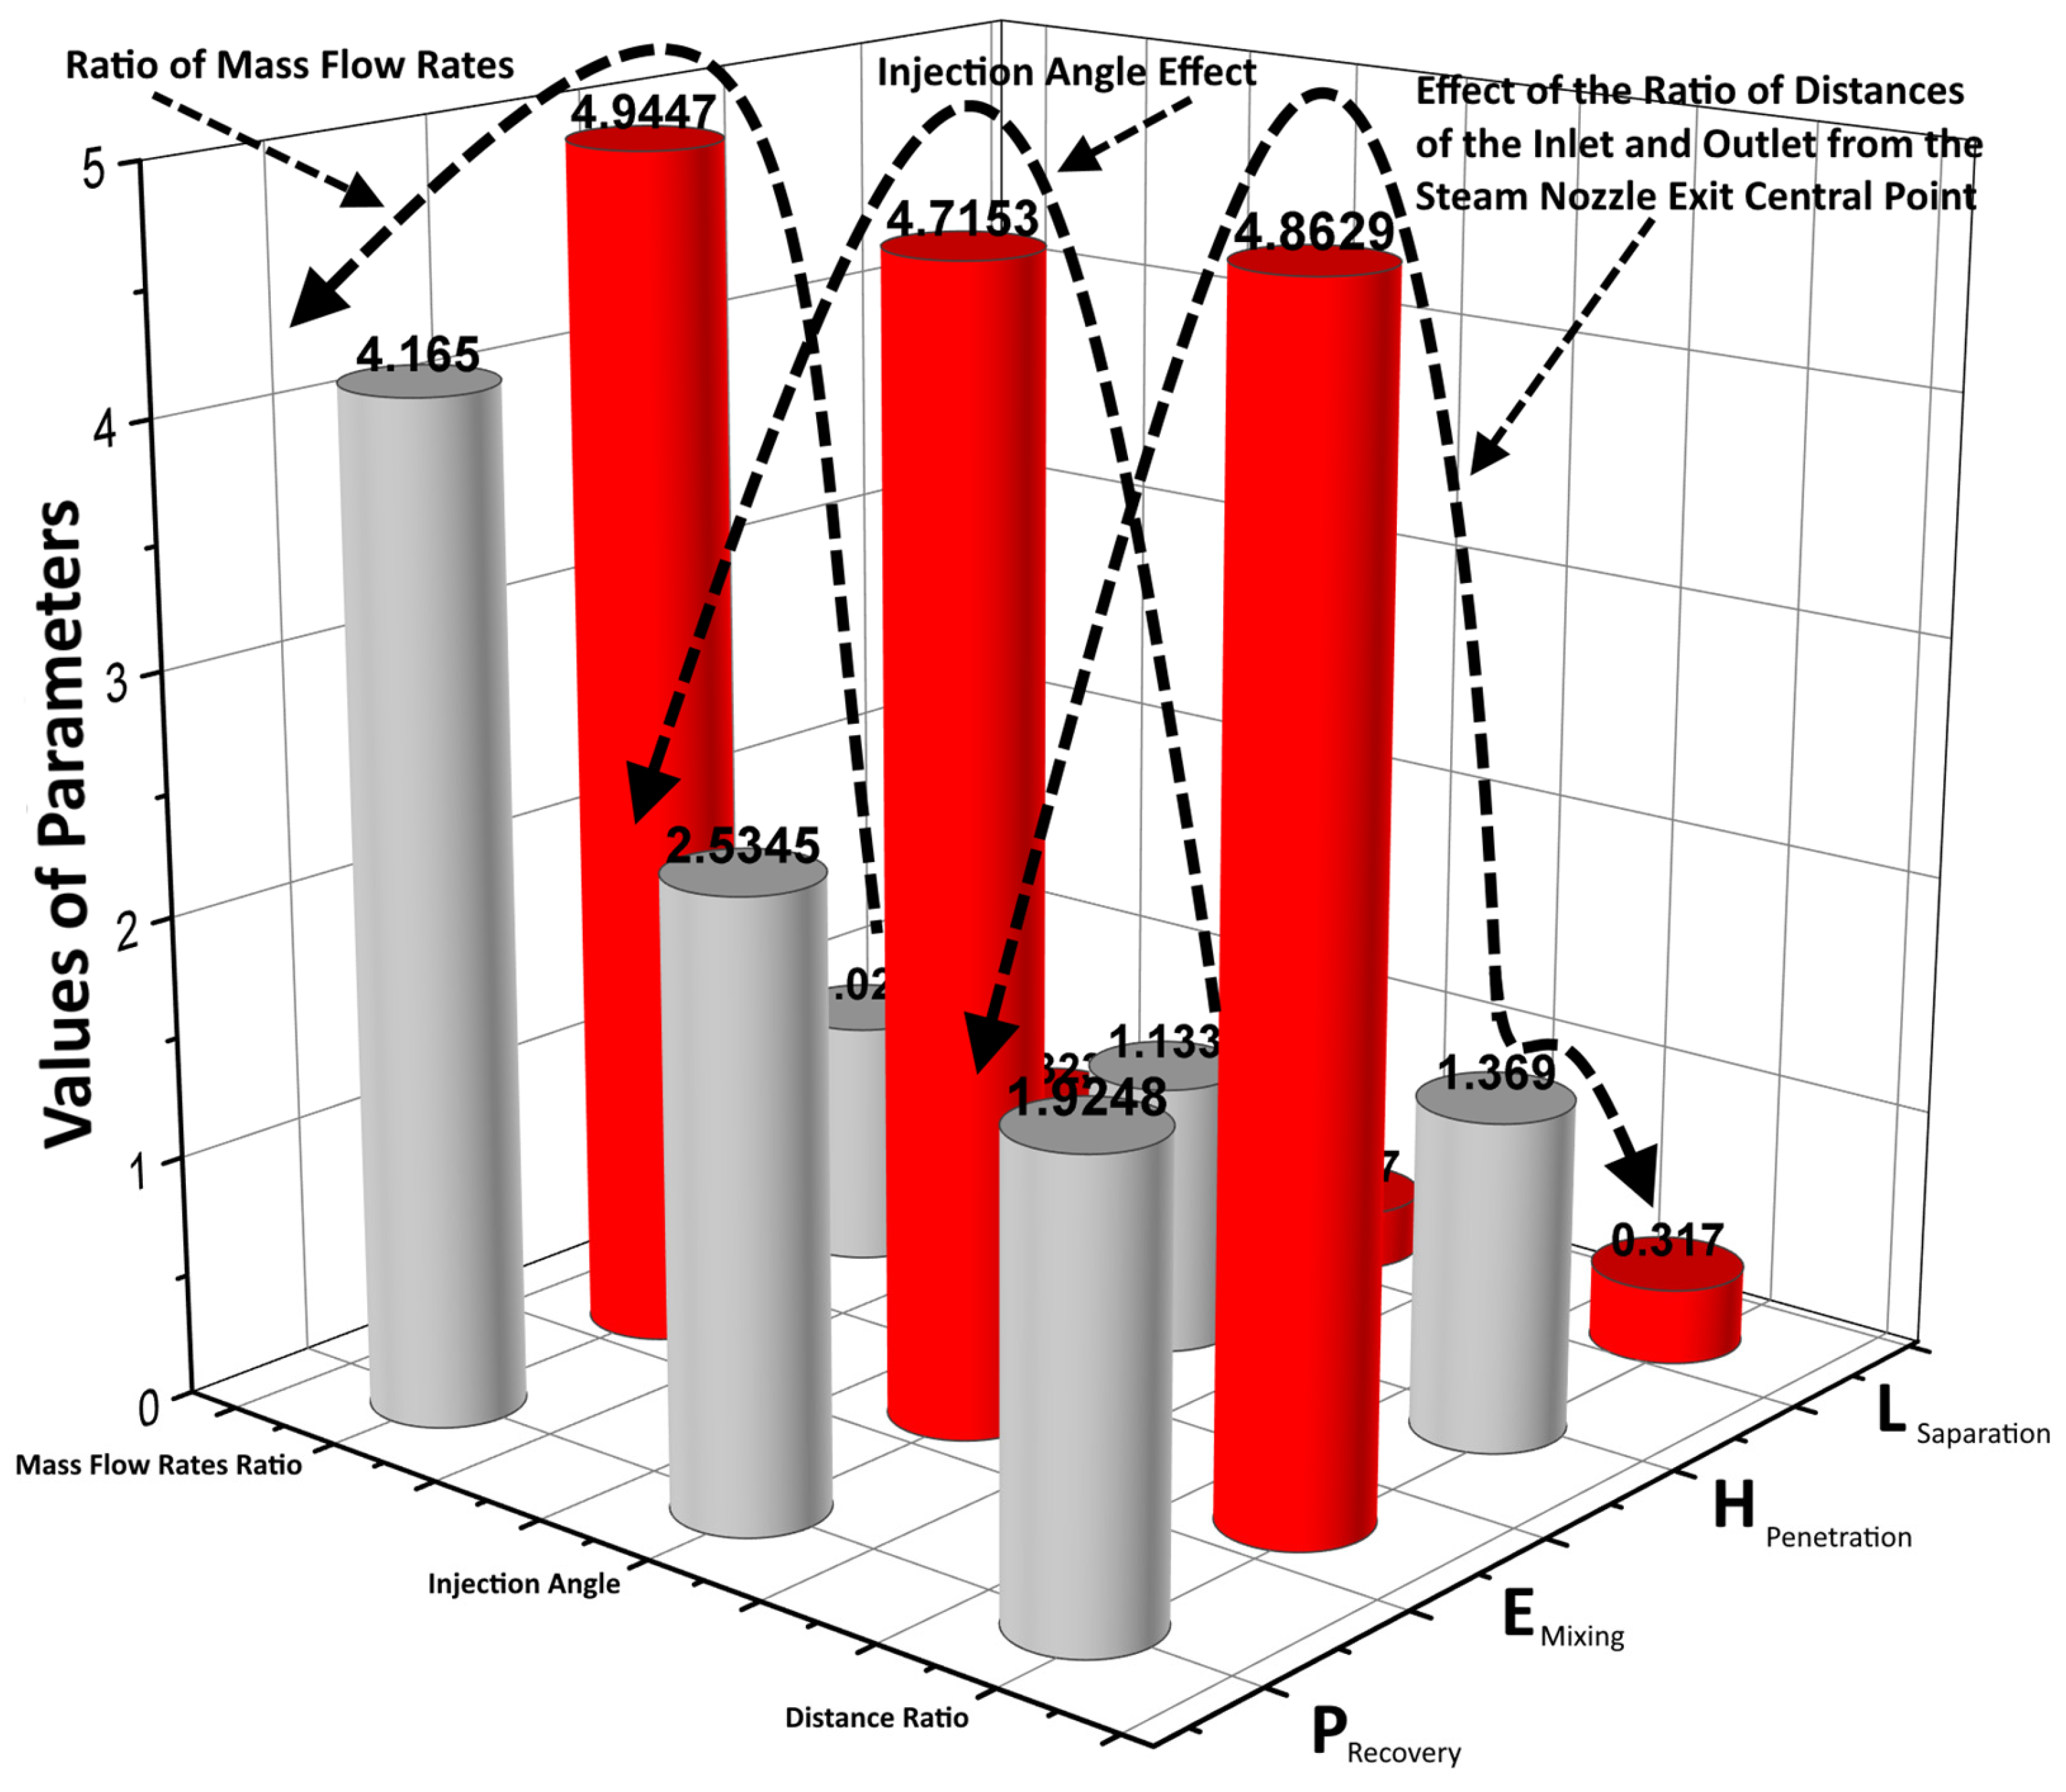
where R is the extreme difference, and and are the minimum and maximum values of the specific parameter for all its values as an influencing parameter. By using this relation, the extreme difference analysis provides the greatest effect that was imparted by the flow rate ratio of the steam and water, as shown in Figure 4.

Figure 4.
Quantification of the operating parameters on the mixing efficiency, pressure recovery, penetration height and the separation distance.
4. Conclusions
In the present experimental study, the physical picture of the phenomena associated with the injection of a supersonic steam jet into cross-flowing water in a square duct was investigated. A 1.2 m long square flow channel with a 10 cm width and height as the experimental setup, as well as the PIV technique and HFA sensors as diagnostic techniques, were used to determine mainly the extent of the penetration of the steam jet into the cross-flowing water, which was analogous to the ratio of the momentum fluxes of the steam’s jet to the cross-flowing water. The flow domains, based on the normalised velocity as well as planar normalized duct dimensions, derived from the PIV images, showed the penetration of the steam’s jet and its subsequent bending towards the water’s flow. The PIV-based jet penetration was compared with the model equation, and there was little difference between the two, which was due to the absence of a buoyant steam contribution, which was absent in the model equation.
Also, using the PIV images to observe the steam jet flow domain, the circulation zones were of opposite vorticity to the vorticity of the large circulation zone in front of the nozzle exit. However, most of the small circulation zones occurred at higher water flow rates than at lower flow rates of the water. Other significant mixing parameters such as the TKE, RSS and shear-driven instabilities were also estimated to determine the significance of the mixing between the two phases. With the rise in the flow rate of the water, the jet was deflected more towards the water’s flow, leading to the sudden expansion of the steam, and secondary small circulations involving the TKE profiles were observed, whereas the RSS supported a bit of a diffusive trend at higher y/D values across the normal to the flow. Further from the PIV measurements, based on the gradient of the velocities between the steam jet and the surrounding water, the shear layer that contained the vortical structures was highlighted. They overturned to cause KH instabilities, which were characterized by the formation of periodic ring vortices at the steam–water interface. CVPs were also observed along with leeward side folds; the flow near the nozzle exits appeared to be the dominant reason for the generation of the CVPs. The influences of the operating conditions on the optimization of the supersonic steam jet cross-water flow were also studied by evaluating the pressure recovery, mixing efficiency, penetration height and separation height. Utilizing extreme difference analysis, the most influential aspect of the performance of the phenomenon was the mixing efficiency. The distribution of the TKE varied between 0.01 and 0.51, along with the values of the RSS, which varied between 0.25 and 0.27 (both sides). Regarding the mixing efficiency, our observation indicated that the more prominent factor that affected the mixing efficiency itself was the ratio of the mass flow rates and, subsequently, the velocity of the steam jet. However, in comparison to the other factors (i.e., pressure recovery, which varied from 32.21 to 89.33, penetration height, which varied from 11.7 to 28.2, and separation length, which varied from 4.1 to 7.8), the mixing phenomenon was influenced more by the mixing efficiency, which varied from 93.89 to 99.31%.
Author Contributions
Conceptualization, H.A.G. and A.K.; methodology, K.S.; validation, A.K. and K.S.; formal analysis, A.K. and H.A.G.; investigation, K.S. and H.A.G.; resources, K.S. and H.A.G.; data curation, A.K.; writing—original draft preparation, A.K. and K.S.; writing—review and editing, K.S.; visualization, A.K. and K.S.; supervision, K.S. and H.A.G.; project administration, H.A.G.; funding acquisition, H.A.G., K.S. and A.K. All authors have read and agreed to the published version of the manuscript.
Funding
The authors extend their appreciation to the Deputyship for Research & Innovation, Ministry of Education in Saudi Arabia for funding this research work through the project number ISP23-66.
Data Availability Statement
Data will be available upon request.
Acknowledgments
The authors extend their appreciation to the Deputyship for Research & Innovation, Ministry of Education in Saudi Arabia for funding this research work through the project number ISP23-66.
Conflicts of Interest
The authors declare no conflict of interest.
References
- Cooper, H.B.H.; Tang, R.E.; Degling, D.E.; Ewan, T.K.; Ewan, S.M. Process and Apparatus for Carbon Capture and Elimination of Multi-Pollutants in Flue Gas from Hydrocarbon Fuel Sources and Recovery of Multiple by-Products. US7842264B2, 2 April 2008. Available online: https://patents.google.com/patent/US7842264B2/en (accessed on 1 July 2020).
- Ben-Yakar, A.; Mungal, M.G.; Hanson, R.K. Time evolution and mixing characteristics of hydrogen and ethylene transverse jets in supersonic crossflows. Phys. Fluids 2006, 18, 026101. [Google Scholar] [CrossRef]
- Gruber, M.R.; Nejad, A.S.; Chen, T.H.; Dutton, J.C. Mixing and Penetration Studies of Sonic Jets in a Mach 2 Freestream. J. Propuls. Power 1995, 11, 315–323. [Google Scholar] [CrossRef]
- Zukoski, E.E.; Spaid, F.W. Secondary injection of gases into a supersonic flow. AIAA J. 1964, 2, 1689–1696. [Google Scholar] [CrossRef]
- Zakkay, V.; Calarese, W.; Sakell, L. An experimental investigation of the interaction between a transverse sonic jet and a hypersonic stream. AIAA J. 1971, 9, 674–682. [Google Scholar] [CrossRef]
- Kaufman, L.G. Hypersonic flows past transverse jets. J. Spacecr. Rocket. 1967, 4, 1230–1235. [Google Scholar] [CrossRef]
- Vanierschot, M.; Persoons, T.; Bulck, E.V.D. A new method for annular jet control based on cross-flow injection. Phys. Fluids 2009, 21, 025103. [Google Scholar] [CrossRef]
- Sarno, R.L.; Franke, M.E. Suppression of flow-induced pressure oscillations in cavities. J. Aircr. 1994, 31, 90–96. [Google Scholar] [CrossRef]
- Ukeiley, L.S.; Ponton, M.K.; Seiner, J.M.; Jansen, B. Suppression of Pressure Loads in Cavity Flows. AIAA J. 2004, 42, 70–79. [Google Scholar] [CrossRef]
- Vakili, A.D.; Gauthier, C. Control of cavity flow by upstream mass-injection. J. Aircr. 1994, 31, 169–174. [Google Scholar] [CrossRef]
- Rowley, C.W.; Williams, D.R. Dynamics and control of high-reynolds-number flow over open cavities. Annu. Rev. Fluid Mech. 2006, 38, 251–276. [Google Scholar] [CrossRef]
- Cattafesta, L.; Alvi, F.; Williams, D.; Rowley, C. Review of Active Control of Flow-Induced Cavity Oscillations (Invited). In Proceedings of the 33rd AIAA Fluid Dynamics Conference and Exhibit, Orlando, FL, USA, 23–26 June 2003. [Google Scholar] [CrossRef]
- Larson, W.J.; Henry, G.N.; Humble, R.W. Space Propulsion Analysis and Design; McGraw-Hill: New York, NY, USA, 1995. [Google Scholar]
- Ko, H.; Yoon, W.-S. Performance Analysis of Secondary Gas Injection into a Conical Rocket Nozzle. J. Propuls. Power 2002, 18, 585–591. [Google Scholar] [CrossRef]
- Schramm, J.M.; Karl, S.; Hannemann, K.; Steelant, J. Steelant, Ground testing of the HyShot II scramjet configuration in HEG. In Proceedings of the 15th AIAA International Space Planes and Hypersonic Systems and Technologies Conference, Dayton, OH, USA, 28 April–1 May 2008. [Google Scholar] [CrossRef]
- Davidenko, D.; Gökalp, I.; Dufour, E.; Magre, P. Numerical simulation of hydrogen supersonic combustion and validation of computational approach. In Proceedings of the 12th AIAA International Space Planes and Hypersonic Systems and Technologies, Norfolk, VA, USA, 15–19 December 2003. [Google Scholar] [CrossRef]
- Gardner, A.D.; Hannemann, K.; Paull, A.; Steelant, J. Ground testing of the HyShot supersonic combustion flight experiment in HEG. In Shock Waves; Springer: Berlin/Heidelberg, Germany, 2005; pp. 329–334. [Google Scholar] [CrossRef]
- Furudate, M.; Lee, B.-J.; Jeung, I.-S. Computation of HyShot scramjet flows in the T4 experiments. In Proceedings of the 13th AIAA/CIRA International Space Planes and Hypersonic Systems and Technologies Conference, Capua, Italy, 16–20 May 2005; pp. 1419–1428. [Google Scholar] [CrossRef]
- Spaid, F.W. A Study of Secondary Injection of Gases into a Supersonic Flow—CaltechTHESIS, (n.d.). Available online: https://thesis.library.caltech.edu/4336/ (accessed on 1 July 2020).
- Cohen, L.S.; Coulter, L.J.; Egan, W.J. Penetration and mixing of multiple gas jets subjected to a cross flow. AIAA J. 1971, 9, 718–724. [Google Scholar] [CrossRef]
- Choo, Y.J.; Song, C.-H. PIV measurements of turbulent jet and pool mixing produced by a steam jet discharge in a subcooled water pool. Nucl. Eng. Des. 2010, 240, 2215–2224. [Google Scholar] [CrossRef]
- Abramovich, G.N.; Girshovich, T.A.; Krasheninnikov, S.I.; Sekundov, A.N.; Smirnova, I.P. The theory of turbulent jets. Mosc. Izd. Nauka 1984. [Google Scholar]
- Orth, R.C.; Funk, J.A. An experimental and comparative study of jet penetration in supersonic flow. J. Spacecr. Rocket. 1967, 4, 1236–1242. [Google Scholar] [CrossRef]
- Khan, A.; Sanaullah, K.; Takriff, M.S.; Hussain, A.; Shah, A.; Chughtai, I.R. Void fraction of supersonic steam jet in subcooled water. Flow Meas. Instrum. 2016, 47, 35–44. [Google Scholar] [CrossRef]
- Khan, A.; Sanaullah, K.; Takriff, M.S.; Zen, H.; Rigit, A.R.H.; Shah, A.; Chughtai, I.R. Numerical and experimental investigations on the physical characteristics of supersonic steam jet induced hydrodynamic instabilities. Asia-Pac. J. Chem. Eng. 2016, 11, 271–283. [Google Scholar] [CrossRef]
- Santiago, J.G.; Dutton, J.C. Velocity Measurements of a Jet Injected into a Supersonic Crossflow. J. Propuls. Power 1997, 13, 264–273. [Google Scholar] [CrossRef]
- Kawai, S.; Lele, S. Large-eddy simulation of jet mixing in a supersonic turbulent crossflow. In Proceedings of the 19th AIAA Computational Fluid Dynamics Conference, San Antonio, TX, USA, 22–25 June 2009. [Google Scholar] [CrossRef]
- Viti, V.; Neel, R.; Schetz, J.A. Detailed flow physics of the supersonic jet interaction flow field. Phys. Fluids 2009, 21, 046101. [Google Scholar] [CrossRef]
- Zhao, H.; Zhang, H.; Jin, X. Efficient image decolorization with a multimodal contrast-preserving measure. Comput. Graph. 2018, 70, 251–260. [Google Scholar] [CrossRef]
- Matlab, Find Edges in Intensity Image—MATLAB Edge, (n.d.). Available online: https://www.mathworks.com/help/images/ref/edge.html (accessed on 8 July 2020).
- Kelso, R.M.; Lim, T.T.; Perry, A.E. An experimental study of round jets in cross-flow. J. Fluid Mech. 1996, 306, 111–144. [Google Scholar] [CrossRef]
- Perry, A.E.; Lim, T.T. Coherent structures in coflowing jets and wakes. J. Fluid Mech. 1978, 88, 451–463. [Google Scholar] [CrossRef]
- Moussa, Z.M.; Trischka, J.W.; Eskinazi, S. The near field in the mixing of a round jet with a cross-stream. J. Fluid Mech. 1977, 80, 49–80. [Google Scholar] [CrossRef]
- Andreopoulos, J. On the structure of jets in a crossflow. J. Fluid Mech. 1985, 157, 163–197. [Google Scholar] [CrossRef]
- Sykes, R.I.; Lewellen, W.S.; Parker, S.F. On the vorticity dynamics of a turbulent jet in a crossflow. J. Fluid Mech. 1986, 168, 393–413. [Google Scholar] [CrossRef]
- Huang, W.; Yang, J.; Yan, L. Multi-objective design optimization of the transverse gaseous jet in supersonic flows. Acta Astronaut. 2014, 93, 13–22. [Google Scholar] [CrossRef]
- Huang, W.; Liu, W.-D.; Li, S.-B.; Xia, Z.-X.; Liu, J.; Wang, Z.-G. Influences of the turbulence model and the slot width on the transverse slot injection flow field in supersonic flows. Acta Astronaut. 2012, 73, 1–9. [Google Scholar] [CrossRef]
- Huang, W.; Li, X.S.; Wu, X.Y.; Wang, Z.G. Configuration Effect Analysis of Scramjet Combustor Based on the Integral Balanceable Method. J. Astronaut. 2009, 30, 282–286. Available online: http://en.cnki.com.cn/Article_en/CJFDTotal-YHXB200901049.htm (accessed on 1 July 2020).

Disclaimer/Publisher’s Note: The statements, opinions and data contained in all publications are solely those of the individual author(s) and contributor(s) and not of MDPI and/or the editor(s). MDPI and/or the editor(s) disclaim responsibility for any injury to people or property resulting from any ideas, methods, instructions or products referred to in the content. |
© 2023 by the authors. Licensee MDPI, Basel, Switzerland. This article is an open access article distributed under the terms and conditions of the Creative Commons Attribution (CC BY) license (https://creativecommons.org/licenses/by/4.0/).