Article

Experimental Study of Collateral Patency following Overlapped Multilayer Flow Modulators Deployment

1
Biomedical Flow Dynamics Laboratory, Institute of Fluid Science, Tohoku University, Sendai 980-8577, Japan
2
Department of Diagnostic Radiology, Tohoku University School of Medicine, Sendai 980-8575, Japan
*
Author to whom correspondence should be addressed.
Fluids 2022, 7(7), 220; https://doi.org/10.3390/fluids7070220
Submission received: 15 April 2022 / Revised: 21 June 2022 / Accepted: 22 June 2022 / Published: 30 June 2022
(This article belongs to the Special Issue Cardiovascular Hemodynamics)

Abstract

:
Decades after its introduction, endovascular aneurysm repair remains a challenging procedure with risks of collateral patency failure. Here, we investigate the ability of a porous stent, the Multilayer Flow Modulator (MFM), to maintain renal perfusion after a single or overlapping case. Silicone models representing an ideal infrarenal AAA geometry were used to analyze and compare three cases (control, single MFM and two overlapped MFMs). Micro-computed tomography was used to image the deployed MFM devices geometry and evaluate pore size and density along with porosity in both two (planimetric) and three dimensions (gravimetric). Laser particle image velocimetry (PIV) experiments were performed to image velocity and vorticity fields at the aorta-renal bifurcation. Flow experiments revealed renal arteries perfusion preservation in both single and overlapped cases. Microstructure analysis revealed an uneven distribution of wires in the MFM devices leading to local change in planimetric porosity and pore size. Overlap of a second MFM device led to a significant decrease in those 2D metrics but did not affect the gravimetric porosity and the branch perfusion. This first microstructure evaluation of MFM device combined with flow experiments revealed the ability of the device to preserve collateral flow thanks to a highly porous microstructure.

1. Introduction

Over the past two decades, endovascular aneurysm repair (EVAR) has become the first choice of treatment for patients with infrarenal abdominal aortic aneurysm (AAA) [1]. Less invasive than open repair, this technique involves the insertion of endovascular graft components that exclude the aneurysm from the blood flow. In complex surgical situations, branched and fenestrated grafts are necessary to preserve the blood flow to side branches. However, such a procedure is technically more difficult to perform, and the stent graft does not always fit the patient arteries geometry [2], requiring custom-made endograft that results in a delay of manufacture and planning. Moreover, safety concerns were raised with regards to endoleaks [3,4], renal function deteriorations [5,6,7] and geometric alterations of renal arteries [8].
The Multilayer Flow Modulator (MFM) is a tubular, self-expanding stent consisting of multilayer braided wires made of a cobalt alloy. This disruptive technology includes the aneurysm by allowing blood to flow through the stent to maintain branch patency, while laminating the flow in the aneurysm sac at a lower velocity [9]. The operation sometimes requires deployment of several overlapped MFMs [10] to cover long segments of the aorta. As MFM devices cover aortic branches, it is necessary to study the preservation of branch perfusion. Although successful perfusion was previously reported in animal model [11], in vivo trials and case reports [12,13], quantitative flow analysis is yet to be performed.
Such studies were previously conducted on EVAR devices using computational fluid dynamics (CFD) simulations [14,15] or particle image velocimetry (PIV) experiments [16]. CFD simulations can be challenging due to scale differences in the model (hundreds of µm for the device wires, a few centimeters for the aneurysm). PIV was found to be ideal to locally analyze flow pattern and velocity modifications occurred after endovascular treatment. Our previous study focused on intra-aneurysmal flow modification after MFM deployment [17].
The purpose of this study is to evaluate the impact of a single or two overlapped MFMs deployment on the flow to the renal arteries. Silicone models representing an ideal infrarenal AAA geometry were used to analyze and compare control, single MFM and two overlapped MFMs cases. Deployed MFM geometries were imaged using micro-computed tomography (micro-CT) to evaluate local porosity, pore size and pore density. Flow patterns, velocity and vorticity were assessed using PIV experiments under pressure and flow rate monitoring.

2. Materials and Methods

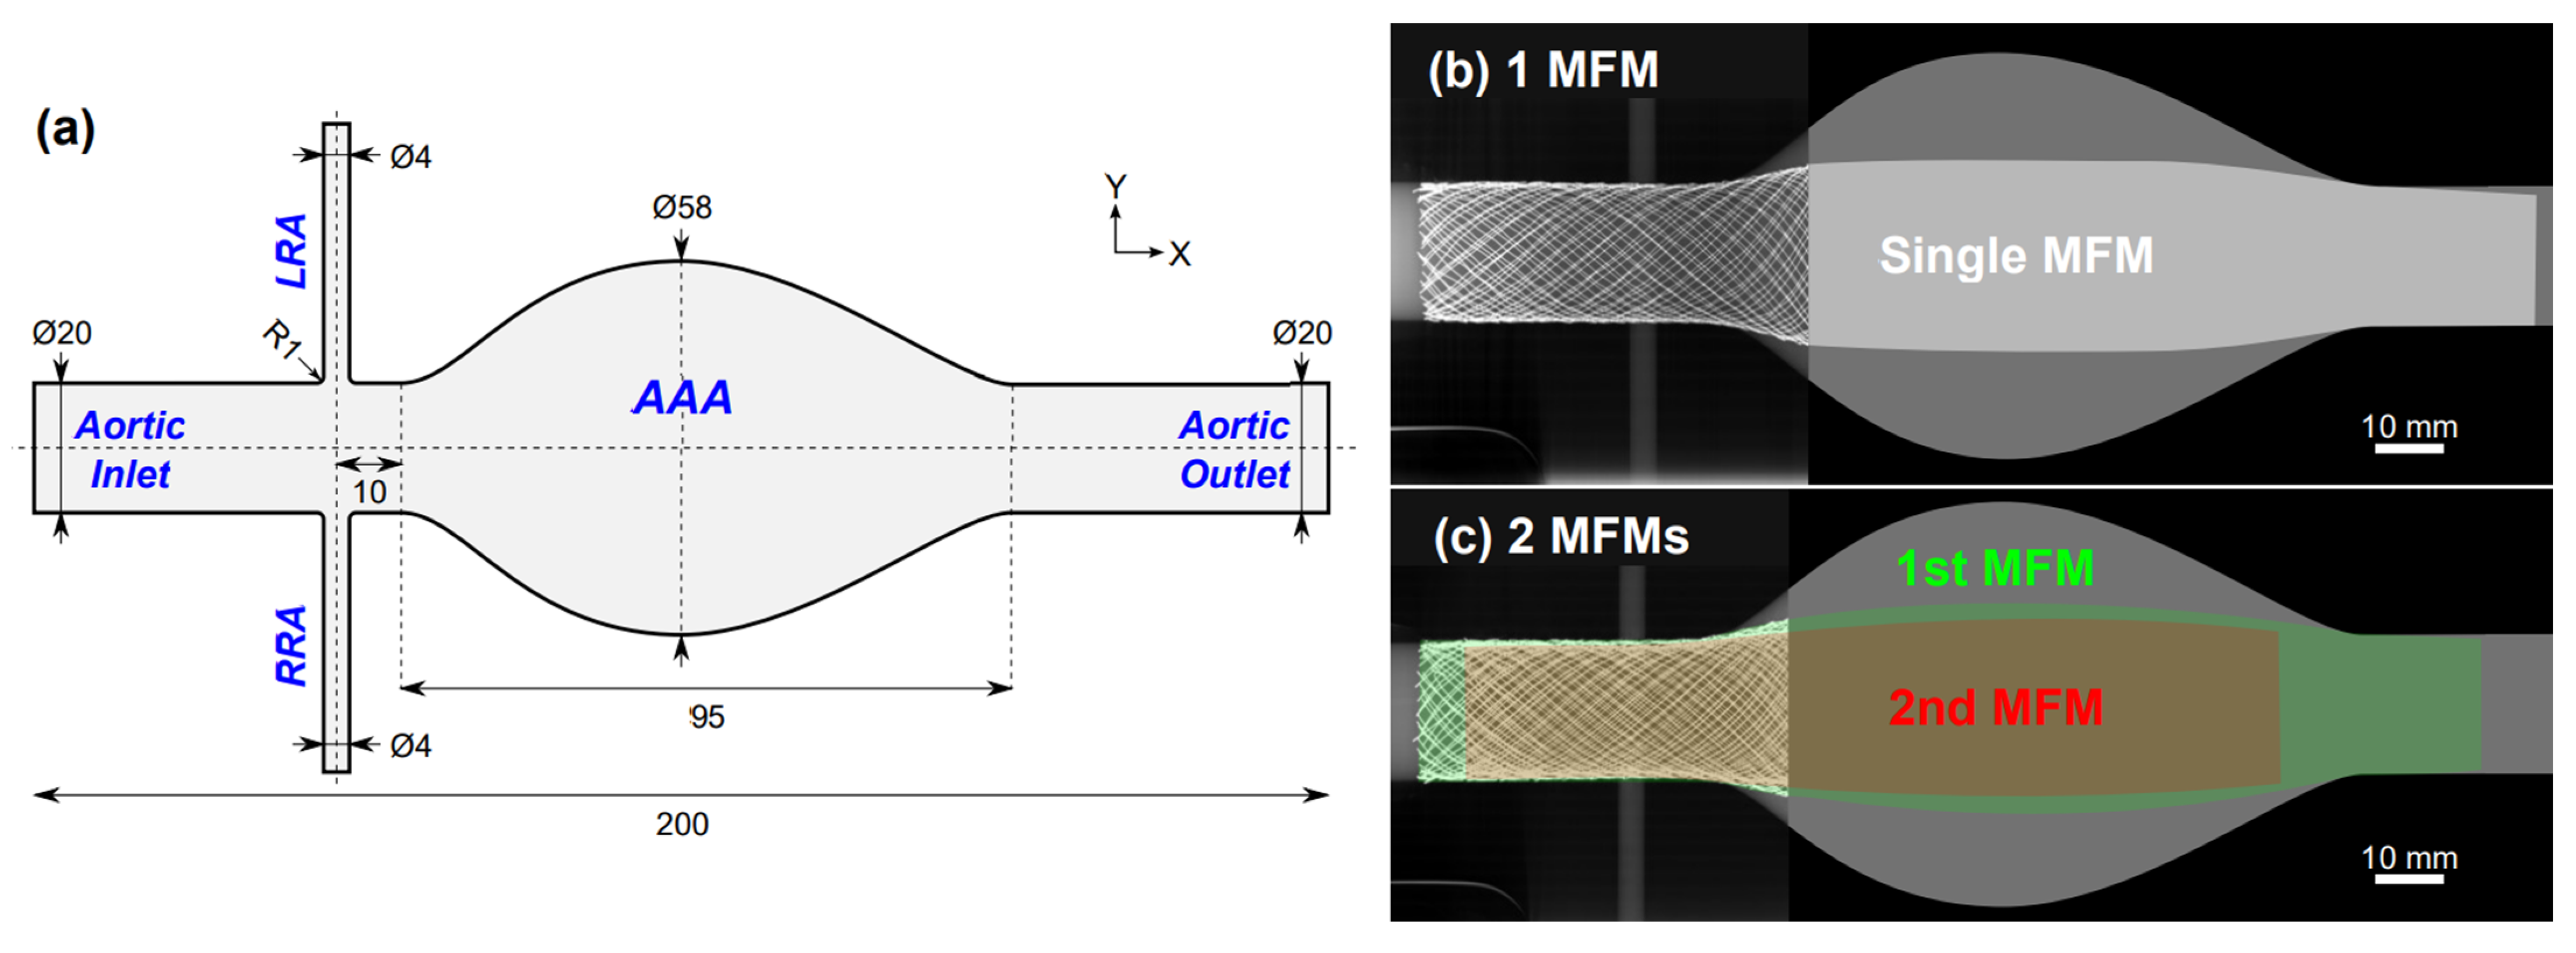
2.1. Phantom Geometry

An ideal symmetrical geometry representing an infrarenal AAA was designed (Figure 1a). Diameters of arteries and aneurysm were based on a medical doctor’s recommendations to intentionally build an average model (age group 60~80). This geometry was manufactured in three identical silicone box models (R’tech, Japan) to compare three cases: control (untreated), single MFM and two overlapped MFMs. Micro-CT imaging confirmed a smooth surface and identical lumen geometry on three models. In the manuscript, LRA and RRA refer to the left and right arteries, respectively.

2.2. MFM Devices

The sizing and deployment of MFM devices was performed by a qualified clinician (K.T.) following manufacturer instruction for use (IFU). A minimal landing zone of 2 cm is recommended to avoid the migration of the device after stenting, which results in a covering of renal arteries (Figure 1b,c).
For the single device case, a Ø25 × L150 mm MFM device (CTMS25150, Cardiatis, Isnes, Belgium) was used. For the overlapped devices case, a same MFM device was firstly deployed, followed by a Ø25 × L100 mm MFM device (CTMS25100, Cardiatis, Isnes, Belgium) inside the first. All of the devices were composed of 96 wires of 180 µm diameter, braided in a 3 layers configuration.

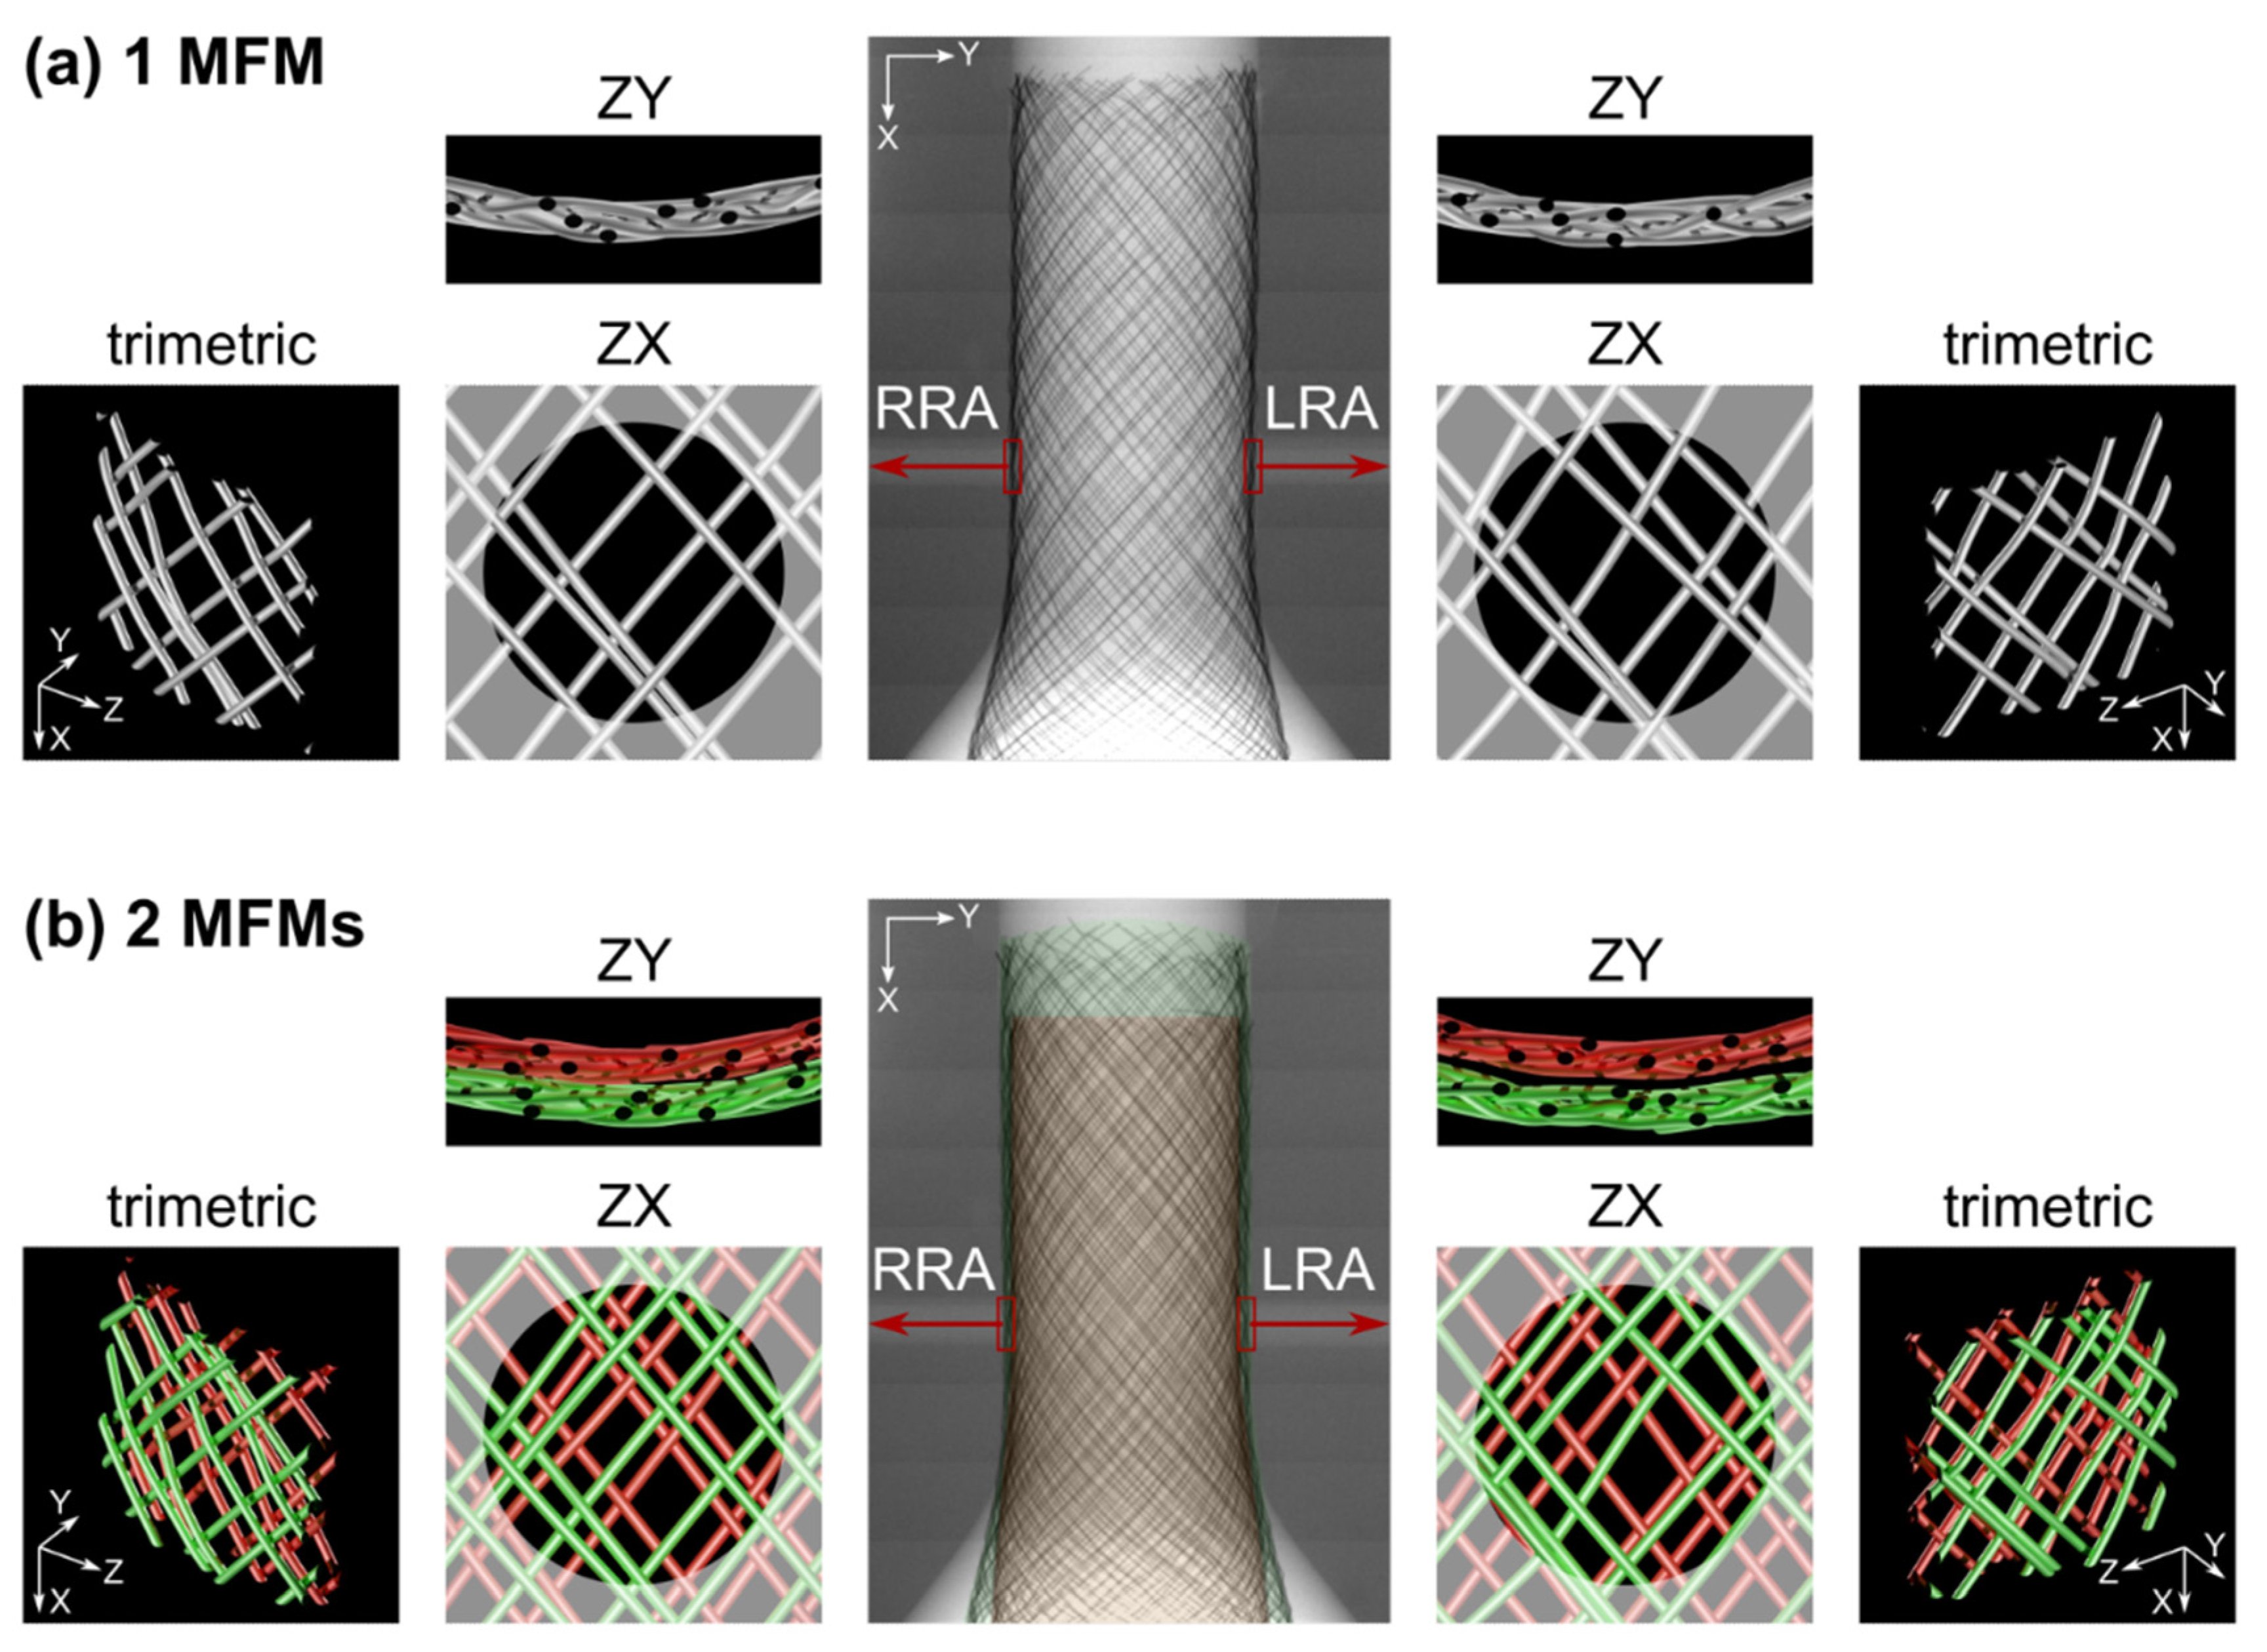
2.3. Micro-CT Imaging and Microstructure Evaluation

After deployment, stents geometry was analyzed by micro-computed tomography (micro-CT) imaging using a ScanXmate-D180RSS270 (Comscantecno Co. Ltd., Yokohama, Japan) at the Museum of Natural History (Sendai, Japan). The scan conditions selected for this study were as follows. The detector size was 1856 × 1472 pixels and an X-ray tube voltage of 200 kV and a current of 180 μA were selected. Magnification ratio was set to 6.045, leading to a voxel size of 21 μm in each direction. 1500 projections were recorded over 360° and 3D data were reconstructed using the software coneCTexpress (White Rabbit Corporation, Tokyo, Japan).
Centerlines of MFM wires were extracted from the micro-CT reconstructed data using Matlab 2018b (Mathworks, Natick, MA, USA). MFM geometry was finally reconstructed by sweeping a 180 µm diameter disk along each centerline. ZX, ZY and trimetric projections of this geometry were imaged at high resolution using Blender v2.80 (Blender Foundation, Amsterdam, Netherlands).
ZX projection images were used to evaluate microstructural parameters in the bifurcation area using Matlab. A region of interest (ROI) was defined as a 4 mm disk to only analyze the microstructure affecting the flow to the renal artery.
Pore size ( S p ) and pore density ( D p ) were calculated in the ROI as: [18]
S p = i = 1 n A i 2 i = 1 n A i
D p = n A R O I
where A R O I denotes the area of the ROI; A i refers to the area of the i th pore; and n the number of pores within the ROI. As the distribution of pore size is not normal, a weighted mean evaluation was determined for the pore size in order to give more importance to bigger pores, which have a greater influence on the flow resistance.
Following ISO standard on cardiovascular implants evaluation [19], planimetric ( φ 2 D ) and gravimetric ( φ 3 D ) porosities of each MFM device were evaluated using following equations:
φ 2 D = 100 × i = 1 n A i A R O I
φ 3 D = 100 × ( 1 V w i r e s V V O I )
with Vwires the volume of wires and VVOI the total volume of the volume of interest (VOI). The VOI is defined as the intersection of a 4 mm diameter cylinder with a tube of 20 mm outer diameter and a thickness equal to the number of wire layers (3 and 6 for single and overlapped case, respectively) multiplied by the wire diameter (180 µm).
Finally, the specific surface area of the device in the VOI was calculated as:
S S A = S A w i r e s V V O I
with SAwires the surface area of all wires in the VOI.
In the overlapped case, the whole evaluation was performed 3 times to evaluate outer and inner MFMs separately, then together.

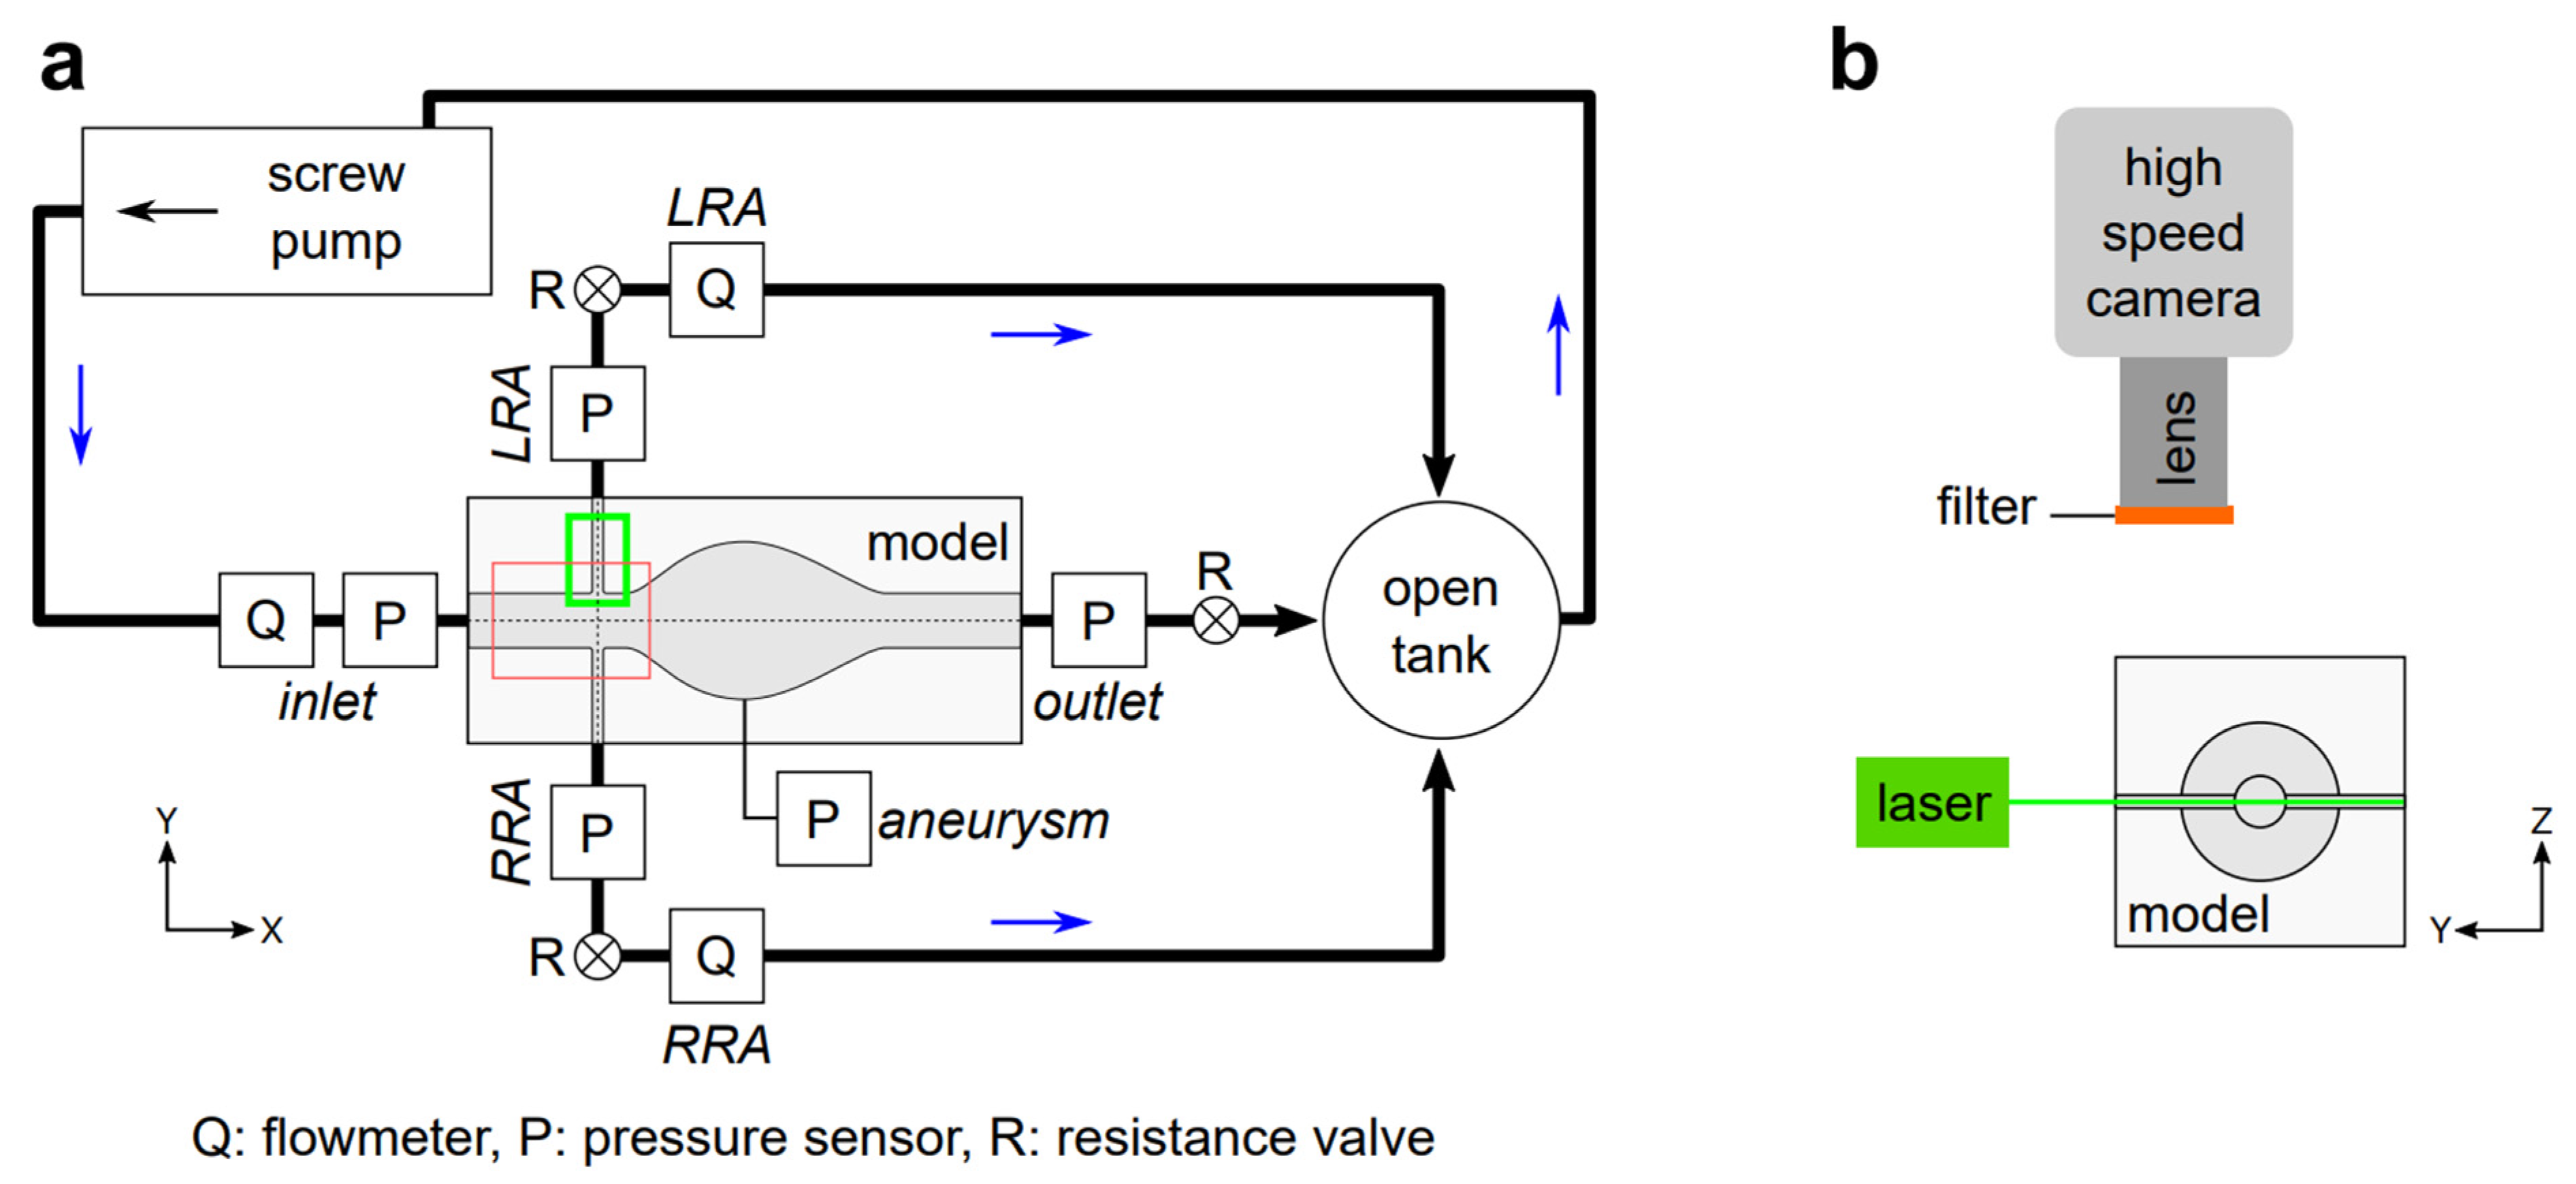
2.4. Circulation System

A previously reported experimental system [17] was adapted for this infrarenal AAA model (Figure 2a).
A mixture of glycerin, sodium iodide and distilled water was used as blood mimicking fluid (BMF) in order to reproduce the rheological properties of blood and match the reflective index of the silicone model [20]. BMF properties were evaluated at room temperature as following: a density of 1.2 × 10³ kg/m3, a kinematic viscosity of 4.0 × 10⁻⁶ m2/s and a reflective index of 1.41.
The fluid was stored in an open tank and injected into the silicone model in a steady flow condition using an eccentric screw pump (RMP200, R’Tech, Shizuoka, Japan).
Flow rates of 3 L/min [21] and 500 mL/min were selected for the aortic inlet and the renal arteries, respectively. A pressure close to 80 mmHg was selected as aortic pressure.
Four pressure sensors (AP-12S, Keyence, Osaka, Japan) and three flow meters (FD-Q20C and FD-SS2A, Keyence, Osaka, Japan for the aortic inlet and renal branches, respectively) were used to monitor the flow conditions at each inlet and outlet points of the silicone model (Figure 2a). Pressure inside the aneurysm was recorded using a 0.6 mm diameter fiber optic-based pressure sensor (OPP-M250, Opsens Inc., Québec, QC, Canada) placed at the edge of the aneurysm wall through the silicone model wall. Current signals from sensors were converted to voltage and recorded at a sampling of 1kHz using a CompactDAQ system (National Instruments, Austin, TX, USA) and a specific software developed on LabVIEW (National Instruments, Austin, TX, USA).
Three resistance valves were used at the aortic outlet tube and the renal branches in order to control the aortic pressure and branches flow rate in the control model (untreated). Specific connectors were designed and 3D printed (Agilista, Keyence, Osaka, Japan) in order to easily exchange the silicone model in the experiments without modifying the resistance settings in the circuit. The effect of MFM devices only can then be evaluated.

2.5. PIV Experiments

Laser PIV experiments were conducted on the left aorta-renal bifurcation. A Nd:YAG solid laser system (BWI-532-300E, B&W TEK, Plainsboro, NJ, USA) was used to provide a nominal 1-mm-thick continuous laser sheet through the center plane of the silicone model (Figure 2b) with a power of 300 mW and a wavelength of 532 nm. Fluorescent microspheres (Fluostar, EBM, Tokyo, Japan) of 15 µm diameter and 1.1 × 10³ kg/m3 density, were selected as particles for the PIV experiments. Images were captured using a high-speed camera (Fastcam SA3, Photron, Tokyo, Japan) equipped with a 105 mm lens (Nikon, Tokyo, Japan) and a long pass filter. A total of 1001 images were recorded with a resolution of 1024 × 256 pixels and 42.5 µm by pixel using the software Photon FASTCAM Viewer (PFV, Photron, Tokyo, Japan). Frame rate and shutter speed were set to 3800 fps and 0.26 ms, respectively.
Sets of images were analyzed using a sum of correlation method with the software DaVis 8.4 (LaVision, Göttingen, Germany). The velocity vector analysis was performed using a fast Fourier transform (FFT) algorithm, employed in an adaptive multi-pass scheme with interrogation areas of 16 × 16 pixels. The area averaged displacement was calculated by cross correlating the particle image intensities between two subsequent recordings. An iterative interrogation window refinement with an overlapping factor of 50% was applied to increase spatial resolution.
Streamlines, velocity magnitude (u) and vorticity (ω) maps were computed using Matlab. To quantify and compare renal flow, the average velocity magnitude was evaluated 10 mm distal the bifurcation.

2.6. Flow Rate & Pressure Evaluation

Flow rate and pressure values were measured during the PIV experiments on each model. The acquisition workflow was defined as follows:
  • Acquire sensors values for 10 s without flow (zero initialization);
  • Start the pump;
  • Wait 30 s for the flow to stabilize;
  • Start the acquisition of PIV images and sensors values for 30 s.
The mean values and standard deviation of each sensor during these 30 s were then calculated after.

3. Results

3.1. Microstructure Analysis of the MFM Devices in 2 and 3 Dimensions

To the best of our knowledge, this is the first study that evaluates MFM microstructure in both two and three dimensions. Although the standard ISO 7198:2016 [19] defines a gravimetric porosity parameter and the way to evaluate it, this 3D porosity is never reported in the literature of braided stent. Compared to other kind of stents and flow diverters, the layer-based geometry of MFM induces a sizeable thickness that makes this 3D evaluation necessary.
Device microstructures reconstructed from the micro-CT images at the bifurcations are presented in Figure 3. Evaluated metrics are reported in Table 1.
3D metrics (gravimetric porosity and specific surface area) are related to the permeability of the structure. Large gravimetric porosity (90.1 ± 0.5 %) and small specific surface area (2.32 ± 0.13 mm−1) were evaluated in all cases, attesting the low hydraulic resistance of the device. No significant difference was evaluated between single and overlapped cases. Although more wires are present in front of the bifurcations, those 3D parameters remain the same as the thickness and the volume of the structure increase.
Furthermore, 2D metrics (planimetric porosity, pore size and density) allow us to characterize the traversing pores, which affect local flow patterns and velocity. ZX projection of the geometries were imaged to evaluate those 2D metrics, as shown in Figure 4.
When considering the devices separately, planimetric porosity ranged between 61.3 and 67.0%, pore density between 1.51 and 1.75 mm−2 and maximal pore size between 1.05 and 1.90 mm2. Those variations are due to an uneven spacing between MFM wires. Despite this unevenness, evaluated values fit well with theoretical ones calculated following Bouillot et al. [22]: porosity of 67.3% and pore size of 70 mm2. The measured variability might become larger as the ROI (branch diameter) decreases. The variation of porosity needs to be studied over the whole structure and for different branch diameters in order to determinate the lowest porosity value (worst case) and its possible impact on small branches perfusion.
Overlapping 2 MFMs largely affected 2D metrics. Both planimetric porosity and pore size decrease while the pore density increases. More struts are present at the bifurcations leading to a lower planimetric porosity (average decrease of 26.1%), a higher pore density (average of 2.6 times increase) and a lower pore size (average of 3.8 times decrease).
The size of the deployed MFM devices (length × maximal diameter) were 161.9 × 28.5 mm, 154.6 × 29.4 mm and 118.7 × 25.3 mm, for the single case, overlapped case outer and overlapped case inner devices, respectively. Although the first device deployed in each case is the same model, deployment of a second device induced further expansion of the outer stent diameter (+0.9 mm) which results in a shorter length (−7.3 mm) (Figure 1b,c). Benjelloun et al. [12] warned against the difficulty to predict foreshortening potential of the MFM due to its braided design. Particular caution should be taken when choosing the size of the device in case of overlapping, as shortening can be severe and compromise the success of the operation.

3.2. Flow Rate & Pressure Evaluation Reveal Branch Perfusion Preservation

The main purpose of this study was to analyze the impact of MFM devices deployment on renal arteries perfusion. Flow rate and pressure values measured during the PIV experiments are presented in Table 2.
The experiments revealed minimal variations in pressure and flow rate in all 3 cases (less than 5%—approaching the repeatability of the sensors). Control flow rate was preserved after deployment of a single or two overlapped MFMs. Those results are also confirmed in the PIV experiments where the velocity in the branch of all cases were found similar (Figure 5h). Such preservation after MFM deployment was previously reported in animal model [11] and in vivo reports for single [12] and overlapped MFMs [10].
The 3D analysis of the microstructure was important for understanding the perfusion preservation mechanism. The combination of high 3D porosity and low specific surface area leads to low flow resistance and high permeability, allowing for full flow rate preservation even in the overlapped case.
The deployment of the second MFM induced a slight increase in the pressure difference (+4 mmHg) between the renal artery and the aorta. This behavior can be explained by Darcy’s law (Equation (6)) [23]: as the thickness ( L ) of the porous medium increases, an increase in the pressure drop ( Δ P ) is necessary for the flow rate ( Q ) to be maintained.
Δ P L = μ Q k A
where μ is the fluid dynamic viscosity, and k , the permeability of the porous medium.
In contrast, the pressure drop between the aortic inlet and the aneurysm was found low and similar in all cases: intra-aneurysmal flow velocity is reduced after deployment of MFM devices as seen in our previous study [17].
As both flow rate and pressure are changing, it is critical to use a resistance-based evaluation system, as the one developped in this study, to accurately record the hemodynamics changes that occur following endovascular devices deployment.

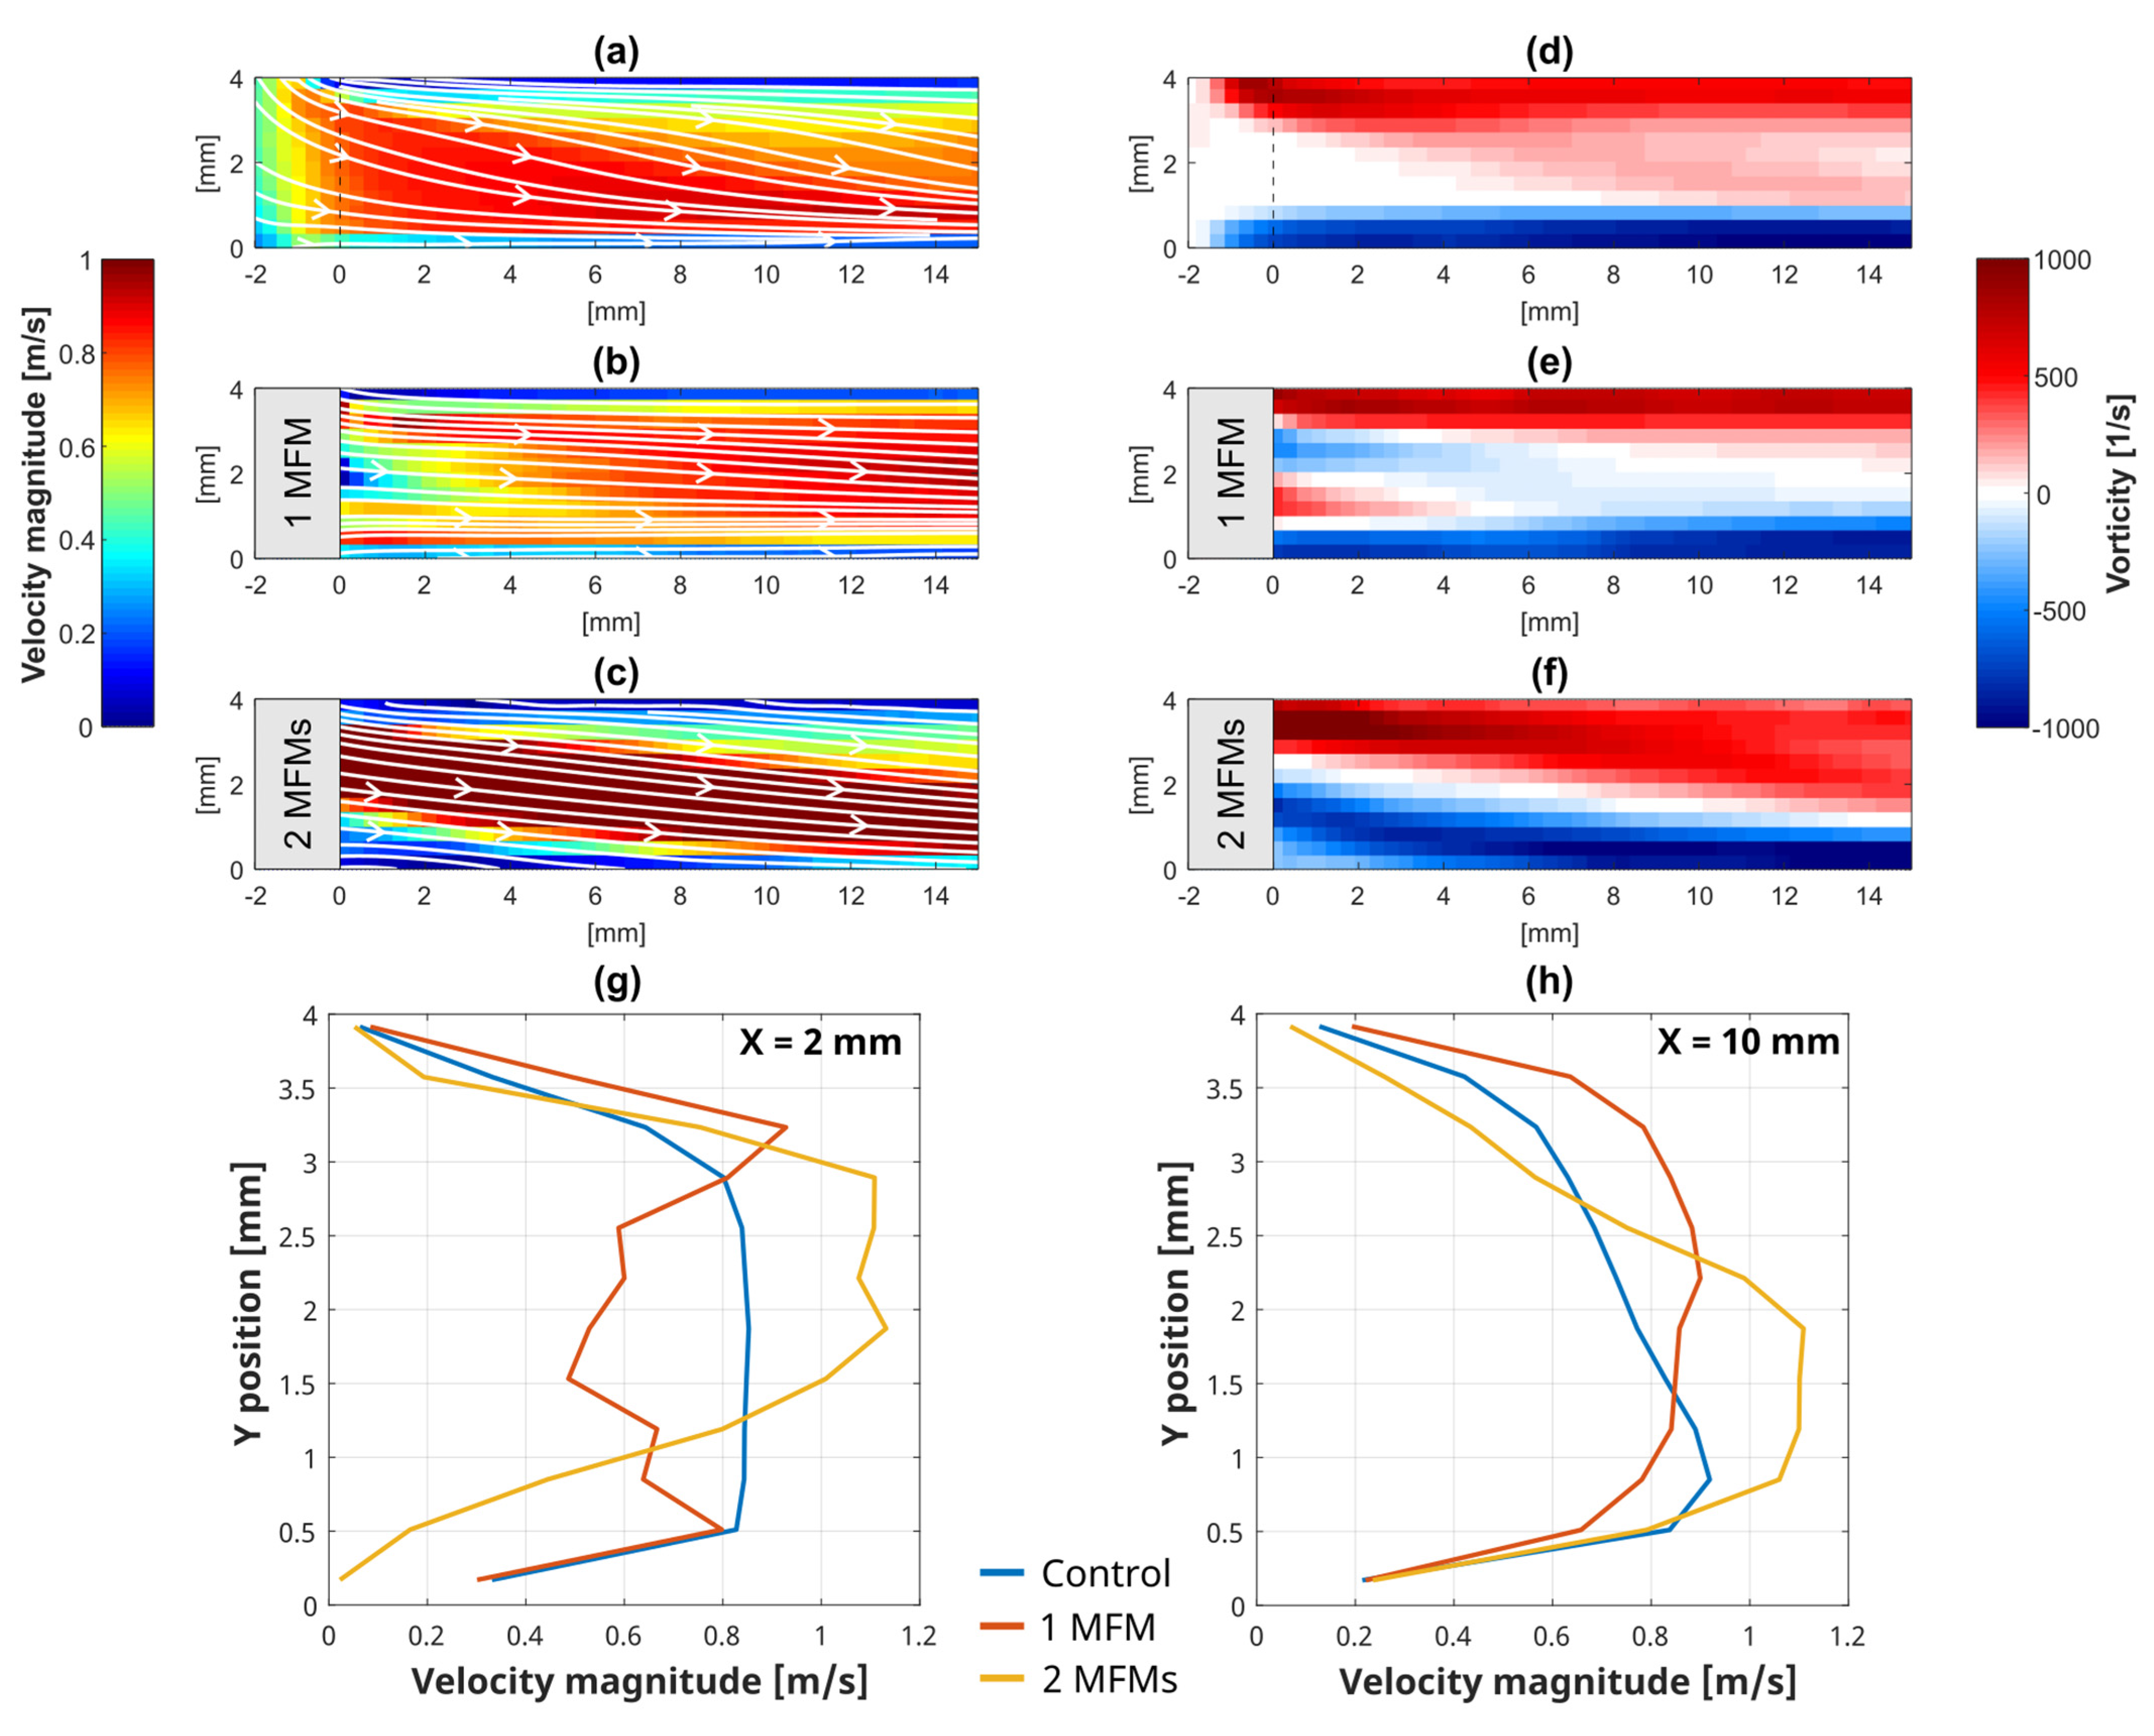
3.3. Local Flow Analysis Evaluated by PIV at the LRA Bifurcation

Velocity magnitude and vorticity maps evaluated by PIV experiments on the left aorta-renal bifurcation are presented in Figure 5. Results revealed differences in flow patterns, velocity and vorticity between cases.
In the control model, due to the ideal 90° bifurcation geometry, the fluid enters the renal artery oriented with an angle, leading to a concentration of high flow velocity at the caudal side of the artery (Figure 5a). The vorticity map was not symmetric due to this angle, with positive vorticity at the center of the artery (Figure 5d).
The deployment of a single MFM induced changes in the flow orientation and velocity distribution. As the flow passes through the device pores, it is broken into sub-paths that affect the flow profile (Figure 5g). Li et al. [24] reported a deflection behavior in braided stents as they act similarly to a screen that refracts the incident flow towards the locally normal direction to its surface. This allows for the re-orientation of the flow concentrically to the renal artery (Figure 5b). The velocity and vorticity profiles 1 cm after the bifurcation were found to be more symmetric than in the control case (Figure 5h).
In the overlapped case, a jet flow is observed in the renal artery (Figure 5c). As the jet was not parallel to the artery, a concentration of high velocity was imaged at the caudal side after 1 cm, similar to the control model. The vorticity map was also found not symmetric (Figure 5f), following the jet flow orientation. Planimetric porosity and pore size were found highly reduced with the second MFM deployment (Section 3.1). Due to the unevenness of pore size, flow may concentrate in some of the larger pores, affecting the flow patterns balance in the artery. Although the branch flow rate itself is not decreased, perturbed flow patterns may lead to biological effects and should be further studied.
Mean velocity, evaluated 1 cm after the bifurcation, were 0.63, 0.76 and 0.70 m/s for the control, single and overlapped cases, respectively. Those results further validate the branch perfusion preservation after deployment of the MFM devices.

3.4. Study Limitations

Geometry and flow conditions were intentionally kept simple (ideal symmetry under steady flow rate) as a first study. Patient specific geometry and physiological flow conditions should be tested to validate the current results.
Modelling the arterial wall with a compliant material may also affect the flow in the branches and decrease pressure in the aneurysm [25].
Finally, 2D PIV measurements performed in this study focused on the symmetry plane of the models. However, flow in such bifurcating geometry is known to be complex with 3D patterns and oscillations [26]. Additional investigations need to be performed especially at the cross-section of the branch to further analyze the mechanism of the MFM device.

4. Conclusions

The purpose of this study was to experimentally evaluate the effect of an infrarenal AAA treatment using a single or two overlapped MFMs on the flow perfusion to the renal arteries. PIV experiments were conducted under pressure and flow rate monitoring and results revealed renal perfusion preservation for both single and overlapped MFMs cases. Analysis of the devices microstructure by micro-CT revealed a highly porous layers configuration with uneven distribution of wires. This experimental system was found to be useful for evaluating quantitative microstructure data and finely analyze flow modifications occurring after the deployment of endovascular devices.

Author Contributions

Conceptualization, S.T., M.O. and K.T.; methodology, S.T. and M.O.; software, S.T.; validation, M.O. and K.T.; formal analysis, S.T.; investigation, S.T.; resources, M.O.; data curation, S.T.; writing—original draft preparation, S.T.; writing—review and editing, M.O. and K.T.; visualization, S.T.; supervision, M.O. and K.T.; project administration, M.O.; funding acquisition, M.O. and S.T. All authors have read and agreed to the published version of the manuscript.

Funding

This work was supported by JSPS KAKENHI [grant number 18K18356], ImPACT program of Council for Science, Technology and Innovation (Cabinet Office, Government of Japan) and Cardiatis (Isnes, Belgium).

Institutional Review Board Statement

Not applicable.

Informed Consent Statement

Not applicable.

Data Availability Statement

The data presented in this study are available on request from the corresponding author.

Acknowledgments

The authors would like to thank Harumasa Kano and Osamu Sasaki (The Tohoku University Museum, Sendai, Japan) for their help with the micro-CT imaging.

Conflicts of Interest

Makoto Ohta has received a grant from Cardiatis (Isnes, Belgium). The funders had no role in the design of the study; in the collection, analyses, or interpretation of data; in the writing of the manuscript, or in the decision to publish the results.

References

  1. Buck, D.B.; van Herwaarden, J.A.; Schermerhorn, M.L.; Moll, F.L. Endovascular Treatment of Abdominal Aortic Aneurysms. Nat. Rev. Cardiol. 2014, 11, 112–123. [Google Scholar] [CrossRef] [PubMed] [Green Version]
  2. Schroeder, M.; Donas, K.P.; Stavroulakis, K.; Stachmann, A.; Torsello, G.; Bisdas, T. Anatomical Suitability of the Zenith Off-the-Shelf (p-Branch) Endograft in Juxtarenal Aortic Aneurysms Previously Treated Using the Chimney Technique. J. Endovasc. Ther. 2017, 24, 223–229. [Google Scholar] [CrossRef] [PubMed]
  3. O’Mara, J.E.; Bersin, R.M. Endovascular Management of Abdominal Aortic Aneurysms: The Year in Review. Curr. Treat. Options Cardiovasc. Med. 2016, 18, 54. [Google Scholar] [CrossRef]
  4. Wanhainen, A.; Verzini, F.; van Herzeele, I.; Allaire, E.; Bown, M.; Cohnert, T.; Dick, F.; van Herwaarden, J.; Karkos, C.; Koelemay, M.; et al. Editor’s Choice–European Society for Vascular Surgery (ESVS) 2019 Clinical Practice Guidelines on the Management of Abdominal Aorto-Iliac Artery Aneurysms. Eur. J. Vasc. Endovasc. Surg. 2019, 57, 8–93. [Google Scholar] [CrossRef] [Green Version]
  5. Saratzis, A.; Melas, N.; Mahmood, A.; Sarafidis, P. Incidence of Acute Kidney Injury (AKI) after Endovascular Abdominal Aortic Aneurysm Repair (EVAR) and Impact on Outcome. Eur. J. Vasc. Endovasc. Surg. 2015, 49, 534–540. [Google Scholar] [CrossRef] [Green Version]
  6. Boyle, J.R. Poor Cardiac Function Is Associated With Renal Injury Following EVAR. Eur. J. Vasc. Endovasc. Surg. 2017, 53, 725. [Google Scholar] [CrossRef] [Green Version]
  7. De Souza, L.R.; Oderich, G.S. Renal Function Deterioration in Complex Aortic Repair. In Endovascular Aortic Repair; Springer International Publishing: Cham, Switzerland, 2017; pp. 721–731. [Google Scholar]
  8. Ou, J.; Chan, Y.-C.; Chan, C.Y.-T.; Cheng, S.W.K. Geometric Alteration of Renal Arteries After Fenestrated Grafting and the Impact on Renal Function. Ann. Vasc. Surg. 2017, 41, 89–95. [Google Scholar] [CrossRef]
  9. Sultan, S.; Hynes, N.; Kavanagh, E.P.; Diethrich, E.B. How Does the Multilayer Flow Modulator Work? The Science Behind the Technical Innovation. J. Endovasc. Ther. 2014, 21, 814–821. [Google Scholar] [CrossRef] [Green Version]
  10. Tolva, V.S.; Bianchi, P.G.; Cireni, L.V.; Lombardo, A.; Keller, G.C.; Parati, G.; Casana, R.M. Multiple Multilayer Stents for Thoracoabdominal Aortic Aneurysm: A Possible New Tool for Aortic Endovascular Surgery. Int. J. Gen. Med. 2012, 5, 629–632. [Google Scholar] [CrossRef] [Green Version]
  11. Sultan, S.; Kavanagh, E.P.; Bonneau, M.; Kang, C.; Hynes, N. Abdominal Aortic Aneurysm Repair Using the Multilayer Flow Modulator in Porcine Animal Models. Univers. J. Med. Sci. 2015, 3, 1–10. [Google Scholar] [CrossRef]
  12. Benjelloun, A.; Henry, M.; Taberkant, M.; Berrado, A.; Houati, R.E.; Semlali, A. Multilayer Flow Modulator Treatment of Abdominal and Thoracoabdominal Aortic Aneurysms With Side Branch Coverage: Outcomes From a Prospective Single-Center Moroccan Registry. J. Endovasc. Ther. 2016, 23, 773–782. [Google Scholar] [CrossRef]
  13. Debing, E.; Aerden, D.; Gallala, S.; Vandenbroucke, F.; van den Brande, P. Stenting Complex Aorta Aneurysms with the Cardiatis Multilayer Flow Modulator: First Impressions. Eur. J. Vasc. Endovasc. Surg. 2014, 47, 604–608. [Google Scholar] [CrossRef] [Green Version]
  14. Sun, Z.; Chaichana, T. Investigation of the Hemodynamic Effect of Stent Wires on Renal Arteries in Patients with Abdominal Aortic Aneurysms Treated with Suprarenal Stent-Grafts. CardioVascular Interv. Radiol. 2009, 32, 647–657. [Google Scholar] [CrossRef] [Green Version]
  15. Sun, Z.; Chaichana, T. Fenestrated Stent Graft Repair of Abdominal Aortic Aneurysm: Hemodynamic Analysis of the Effect of Fenestrated Stents on the Renal Arteries. Korean J. Radiol. 2010, 11, 95. [Google Scholar] [CrossRef]
  16. Boersen, J.T.; Groot Jebbink, E.; Versluis, M.; Slump, C.H.; Ku, D.N.; de Vries, J.-P.P.M.; Reijnen, M.M.P.J. Flow and Wall Shear Stress Characterization after Endovascular Aneurysm Repair and Endovascular Aneurysm Sealing in an Infrarenal Aneurysm Model. J. Vasc. Surg. 2017, 66, 1844–1853. [Google Scholar] [CrossRef] [Green Version]
  17. Tupin, S.; Takase, K.; Ohta, M. Experimental Analysis of Pressure and Flow Alterations During and After Insertion of a Multilayer Flow Modulator into an AAA Model with Incorporated Branch. CardioVascular Interv. Radiol. 2021, 44, 1251–1259. [Google Scholar] [CrossRef]
  18. Zhang, M.; Tupin, S.; Li, Y.; Ohta, M. Association Between Aneurysmal Haemodynamics and Device Microstructural Characteristics After Flow-Diversion Treatments With Dual Stents of Different Sizes: A Numerical Study. Front. Physiol. 2021, 12, 663668. [Google Scholar] [CrossRef]
  19. International Organization for Standardization. Cardiovascular Implants and Extracorporeal Systems-Vascular Prostheses-Tubular Vascular Grafts and Vascular Patches; ISO 7198:2016; International Organization for Standardization: Geneva, Switzerland, 2016. [Google Scholar]
  20. Shida, S.; Kosukegawa, H.; Ohta, M. Development of a Methodology for Adaptation of Refractive Index Under Controlling Kinematic Viscosity for PIV. In Proceedings of the Volume 2: Biomedical and Biotechnology Engineering; Nanoengineering for Medicine and Biology, Denver, CO, USA, 11–17 November 2011; pp. 313–321. [Google Scholar] [CrossRef]
  21. Les, A.S.; Yeung, J.J.; Schultz, G.M.; Herfkens, R.J.; Dalman, R.L.; Taylor, C.A. Supraceliac and Infrarenal Aortic Flow in Patients with Abdominal Aortic Aneurysms: Mean Flows, Waveforms, and Allometric Scaling Relationships. Cardiovasc. Eng. Technol. 2010, 1, 39–51. [Google Scholar] [CrossRef]
  22. Bouillot, P.; Brina, O.; Ouared, R.; Yilmaz, H.; Farhat, M.; Erceg, G.; Lovblad, K.O.; Vargas, M.I.; Kulcsar, Z.; Pereira, V.M. Geometrical Deployment for Braided Stent. Med. Image Anal. 2016, 30, 85–94. [Google Scholar] [CrossRef] [Green Version]
  23. Tupin, S.; Ohta, M. Assessing Porous Media Permeability in Non-Darcy Flow: A Re-Evaluation Based on the Forchheimer Equation. Materials 2020, 13, 2535. [Google Scholar] [CrossRef]
  24. Li, S.; Latt, J.; Chopard, B. Model for Pressure Drop and Flow Deflection in the Numerical Simulation of Stents in Aneurysms. Int. J. Numer. Methods Biomed. Eng. 2018, 34, e2949. [Google Scholar] [CrossRef]
  25. Tupin, S.; Saqr, K.M.; Ohta, M. Effects of Wall Compliance on Multiharmonic Pulsatile Flow in Idealized Cerebral Aneurysm Models: Comparative PIV Experiments. Exp. Fluids 2020, 61, 164. [Google Scholar] [CrossRef]
  26. Yamaguchi, R.; Mashima, T.; Amagai, H.; Fujii, H.; Hayase, T.; Tanishita, K. Variation of Wall Shear Stress and Periodic Oscillations Induced in the Right-Angle Branch During Laminar Steady Flow. J. Fluids Eng. 2005, 127, 1013–1020. [Google Scholar] [CrossRef]
Figure 1. (a) Lumen geometry of the infrarenal AAA model. All dimensions are in mm. Aortic flow direction is from left to right. (b,c) Schematic of deployed MFM devices including micro-CT reconstruction near the aorta-renal bifurcations in single and overlapped cases, respectively. Color code for the overlapped case is green and red for outer and inner MFM, respectively.
Fluids 07 00220 g001
Figure 2. Experimental system. (a) Flow circuit with sensors. Green and red rectangles denote ROIs for PIV and uCT imaging, respectively. (b) Optical set-up for PIV experiments.
Fluids 07 00220 g002
Figure 3. MFM devices microstructure analysis in front of the RAs. (a) single and (b) overlapped case. Micro-CT projection (center) and reconstructed stent geometry in trimetric, ZX and ZY views. Flow crosses the MFM devices through axis Y. Color code for the overlapped case is green and red for outer and inner MFM, respectively. Size of the cropped geometry is 5 × 5 mm2.
Fluids 07 00220 g003
Figure 4. Pore size evaluation on MFM devices extracted geometries. (a) single and (b) overlapped case. Diameter of the extracted ROI is 4 mm.
Fluids 07 00220 g004
Figure 5. Local flow analysis. Velocity magnitude (ac) and vorticity (df) maps evaluated by PIV in the LRA of (a,d) control, (b,e) single and (c,f) overlapped cases. (g,h) Velocity magnitude profile extracted 2 and 10 mm away from the bifurcation, respectively.
Fluids 07 00220 g005
Table 1. Microstructural parameters evaluated on the extracted MFM geometries. Pore size values are reported as weighted mean ± weighted standard deviation.
Model1 MFM2 MFMs
LocationLRARRALRARRA
Sampleouterinnerbothouterinnerboth
2D Porosity [%]61.366.464.264.939.063.667.038.0
3D Porosity [%]89.190.690.090.190.189.790.990.3
Specific surface area [mm−1]2.542.212.382.322.352.392.102.25
Pore density [mm−2]1.831.591.511.513.661.751.514.86
Pore size [mm2]0.71 ± 0.410.93 ± 0.451.08 ± 0.620.74 ± 0.410.22 ± 0.170.83 ± 0.500.68 ± 0.290.21 ± 0.16
Maximum pore size [mm2]1.311.501.901.330.601.591.050.55
Table 2. Flow rate and pressure values measured during PIV experiments. Values are reported as mean ± standard deviation. Pressure drop compared to inlet pressure is indicated under bracket.
ModelFlow rate [L/min]Pressure [mmHg]
InletLRARRAInletLRARRAAneurysmOutlet
Control2.9 ± 0.10.498 ± 0.0070.515 ± 0.00783 ± 2 (0)69 ± 2 (14)69 ± 2 (14)82 ± 2 (1)81 ± 2 (2)
1 MFM2.9 ± 0.10.492 ± 0.0070.510 ± 0.00782 ± 2 (0)69 ± 2 (13)68 ± 2 (14)81 ± 2 (1)80 ± 2 (2)
2 MFMs2.9 ± 0.10.493 ± 0.0070.506 ± 0.00786 ± 2 (0)69 ± 2 (17)68 ± 2 (18)86 ± 2 (0)84 ± 2 (2)
Publisher’s Note: MDPI stays neutral with regard to jurisdictional claims in published maps and institutional affiliations.

