Article

Experience of Patient-Specific CFD Simulation of Blood Flow in Proximal Anastomosis for Femoral-Popliteal Bypass

1
Higher School of Applied Mathematics and Computational Physics, Peter the Great St. Petersburg Polytechnic University, 29 Polytechnicheskaya Str., 195251 St. Petersburg, Russia
2
Research Institute for Surgery and Emergency Medicine, Pavlov First St. Petersburg State Medical University, 6-8 L’va Tolstogo Str., 197022 St. Petersburg, Russia
*
Author to whom correspondence should be addressed.
Fluids 2022, 7(10), 314; https://doi.org/10.3390/fluids7100314
Submission received: 15 August 2022 / Revised: 7 September 2022 / Accepted: 12 September 2022 / Published: 21 September 2022
(This article belongs to the Special Issue Cardiovascular Hemodynamics)

Abstract

:
Femoral artery bypass surgery needs postoperative monitoring due to the high complication risks after bypass. Numerical simulation is an effective tool to help solve this task. This work presents the experience of patient-specific CFD simulation of blood flow in proximal anastomosis for femoral-popliteal bypass, including patient follow-up after bypass surgery. Six cases of proximal anastomosis of femoral-popliteal bypass 3–30 months after surgery were studied. A repeated study was performed for four patients to monitor geometric and hemodynamic changes. The blood flow structure variety in proximal anastomoses and the blood flow dynamics during the cardiac cycle are described in detail using CFD simulation. Special attention is paid to time-average wall shear stresses (TAWSS) and oscillatory shear index (OSI) distributions. Low and oscillatory wall shear stresses were registered in the graft downstream from the suture, especially in case of low inlet flow. It was shown that the postoperative geometry changes led to significant hemodynamic changes; thereby, neointima has grown in areas with initially low and oscillatory wall shear stresses.

1. Introduction

Atherosclerotic lesion of the artery walls gradually leads to a decrease in their effective lumen. The artery narrowing due to increasing atherosclerotic plaque ultimately leads to a significant decrease in blood flow in this artery. The decreased blood flow may lead to the development of stroke, myocardial infarction, ischemia of the lower extremities and ischemia of other organs [1]. According to the European Society of Cardiology (ESC) about 4 million deaths are caused by cardiovascular disease within ESC member countries. These equal to 45% of all deaths [2]. Clinically significant atherosclerosis is more often observed in people older than 70 years, especially in combination with diabetes mellitus, smoking and hypertension [1,3,4,5]. In Russia, cardiovascular diseases account for 57% of the causes of population death. According to WHO experts, the number of such deaths in the world may increase by 1.5 times by 2030. For example, in 2017, there were 2.2 million new cases of PAD in the ESC member countries [2].
It is known that artery bifurcation zones are most susceptible to atherosclerotic plaque formation. An important example is the bifurcation of the common femoral artery into the superficial femoral and deep femoral arteries. Plaque in these vessels differ from coronary plaque in their structure (denser, more often calcified) and stability [6,7]. Blood flow destruction in these arteries leads to lower limb ischemia, intermittent lameness development and, as a result, the appearance of trophic disorders and limb loss. In case of occlusion or hemodynamically significant stenosis of the superficial femoral artery, femoral-popliteal bypass surgery is performed. It is preferable to use autogenous vein grafts as a shunt [8,9]. However, autogenous vein grafts are not always available. In such cases, synthetic shunts are used. During the bypass surgery, an artery wall incision is performed, and the graft is sewn to the artery wall. Such mechanical damage of the vessel (incision and suturing) at the artery–graft junction leads to the vascular wall response—the inner vessel layer (intima) thickens. However, sometimes there is an excessive growth of the neointima, called neointimal hyperplasia (NIH) [10,11,12]. The NIH may lead to anastomosis stenosis and, in extreme cases, complete graft occlusion. In some cases, graft replacement surgery may be required. The proportion of repeated graft replacement surgeries is about 30% [13]. The study of the causes of vascular graft failure is an actual task in vascular surgery. However, there is no universal answer to this question yet.
Researchers have been trying for a long time to find the relationship between NIH development and patients’ hemodynamic parameters, namely wall shear stress parameters, such as the time-averaged shear stress, the oscillatory shear index and others [14,15,16,17]. It was revealed that there are no dangerous local changes of wall shear stresses in the femoral arteries of healthy adults [18]. According to numerical calculations [19], wall shear stresses decrease and their oscillations increase with age which leads to an increase in NIH risk [20,21]. These correlations may vary for different vessels.
In recent years, much attention has been paid to patient-specific simulations using computational fluid dynamic (CFD). For example, with this approach, the wall hypertrophy bypass grafts, the atherosclerosis risk in blood vessels or postoperative complications in stented arteries are investigated [15,22,23,24]. Patient-specific CFD simulations are based on the use of personalized data, including geometry, inlet and outlet flow rates and others. Geometric models of arteries and grafts are usually obtained from magnetic resonance imaging data [15,24,25] or computed tomography (CT) data [18,22,26,27,28]. Both of these methods are used in patient-specific simulation, but computed tomography is more common due to its simplicity. Ultrasound measurements of velocity (flow rate) are used to set the inlet and outlet boundary conditions [15,22,25]. The results of CFD simulation in personalized models of femoral-popliteal bypass with a vein graft are reported in [15]. An interesting feature of this research is the postoperative monitoring of the neointima growth. The authors have established that areas of low wall shear stresses in the graft cause a further neointima growth in these areas. However, postoperative monitoring was carried out only for neointima thickness measurements, and the flow simulation was carried out only at the initial stage.
In several papers [26,27,28], patient-specific numerical simulations of the blood flow in femoral-popliteal bypass by vein graft were performed. The authors of these contributions considered numerical results together with CT measurements to compare wall shear stress areas with neointima growth areas. In addition, the authors used a mathematical model of NIH growth and compared it with the CT scans. It has been revealed that low-velocity zones contribute to a decrease in wall shear stress values, which, in turn, correlate with neointima growth areas. As noted above, synthetic vascular grafts are more susceptible to NIH [9] and, accordingly, require more thorough research.
In most works which cover patient-specific simulations of the femoral-popliteal bypass, attention is paid to distal anastomoses. However, there is also a risk of NIH in proximal anastomoses. In addition, the literature data do not include long-term follow-ups of a specific patient, which reduces the chances of correctly determining postoperative complications.
In the present study, six personalized models of proximal anastomoses for femoral-popliteal bypass are considered based on clinically obtained data. The blood flow structure variety in proximal anastomoses and the blood flow dynamics during the cardiac cycle are analyzed in detail using CFD simulation. In addition, postoperative follow-ups for four out of six patients were carried out.

2. Materials and Methods

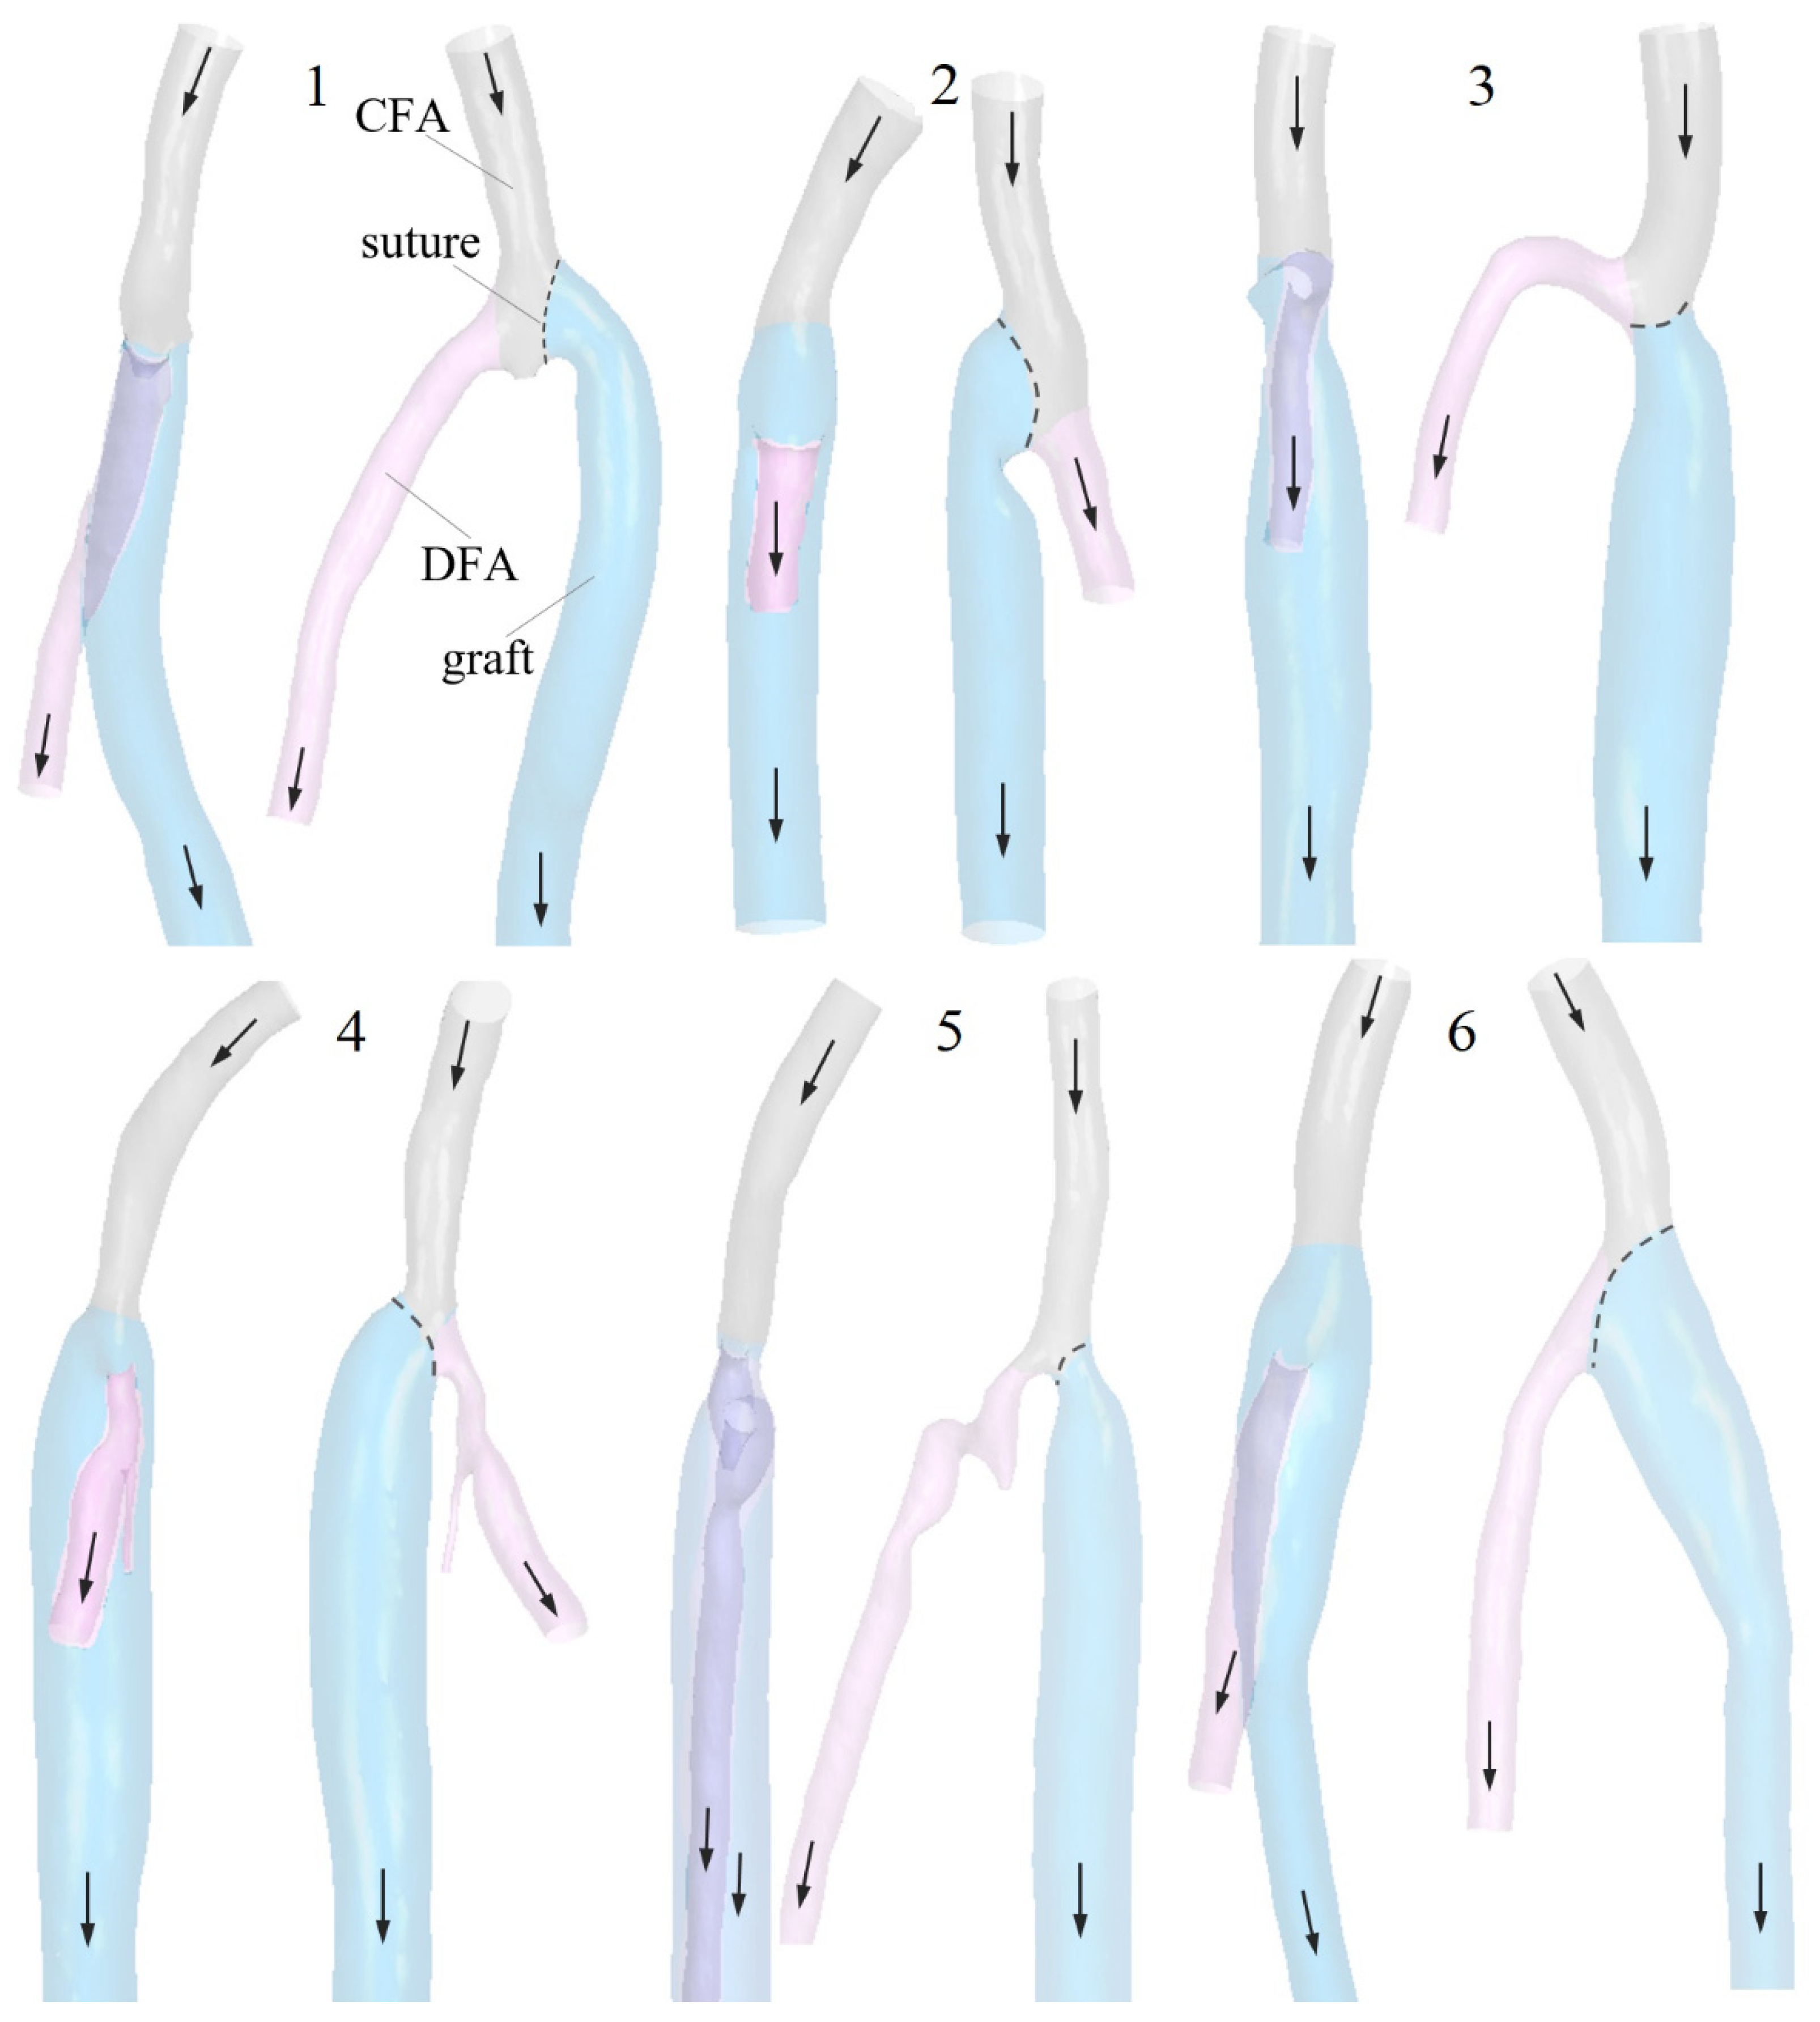
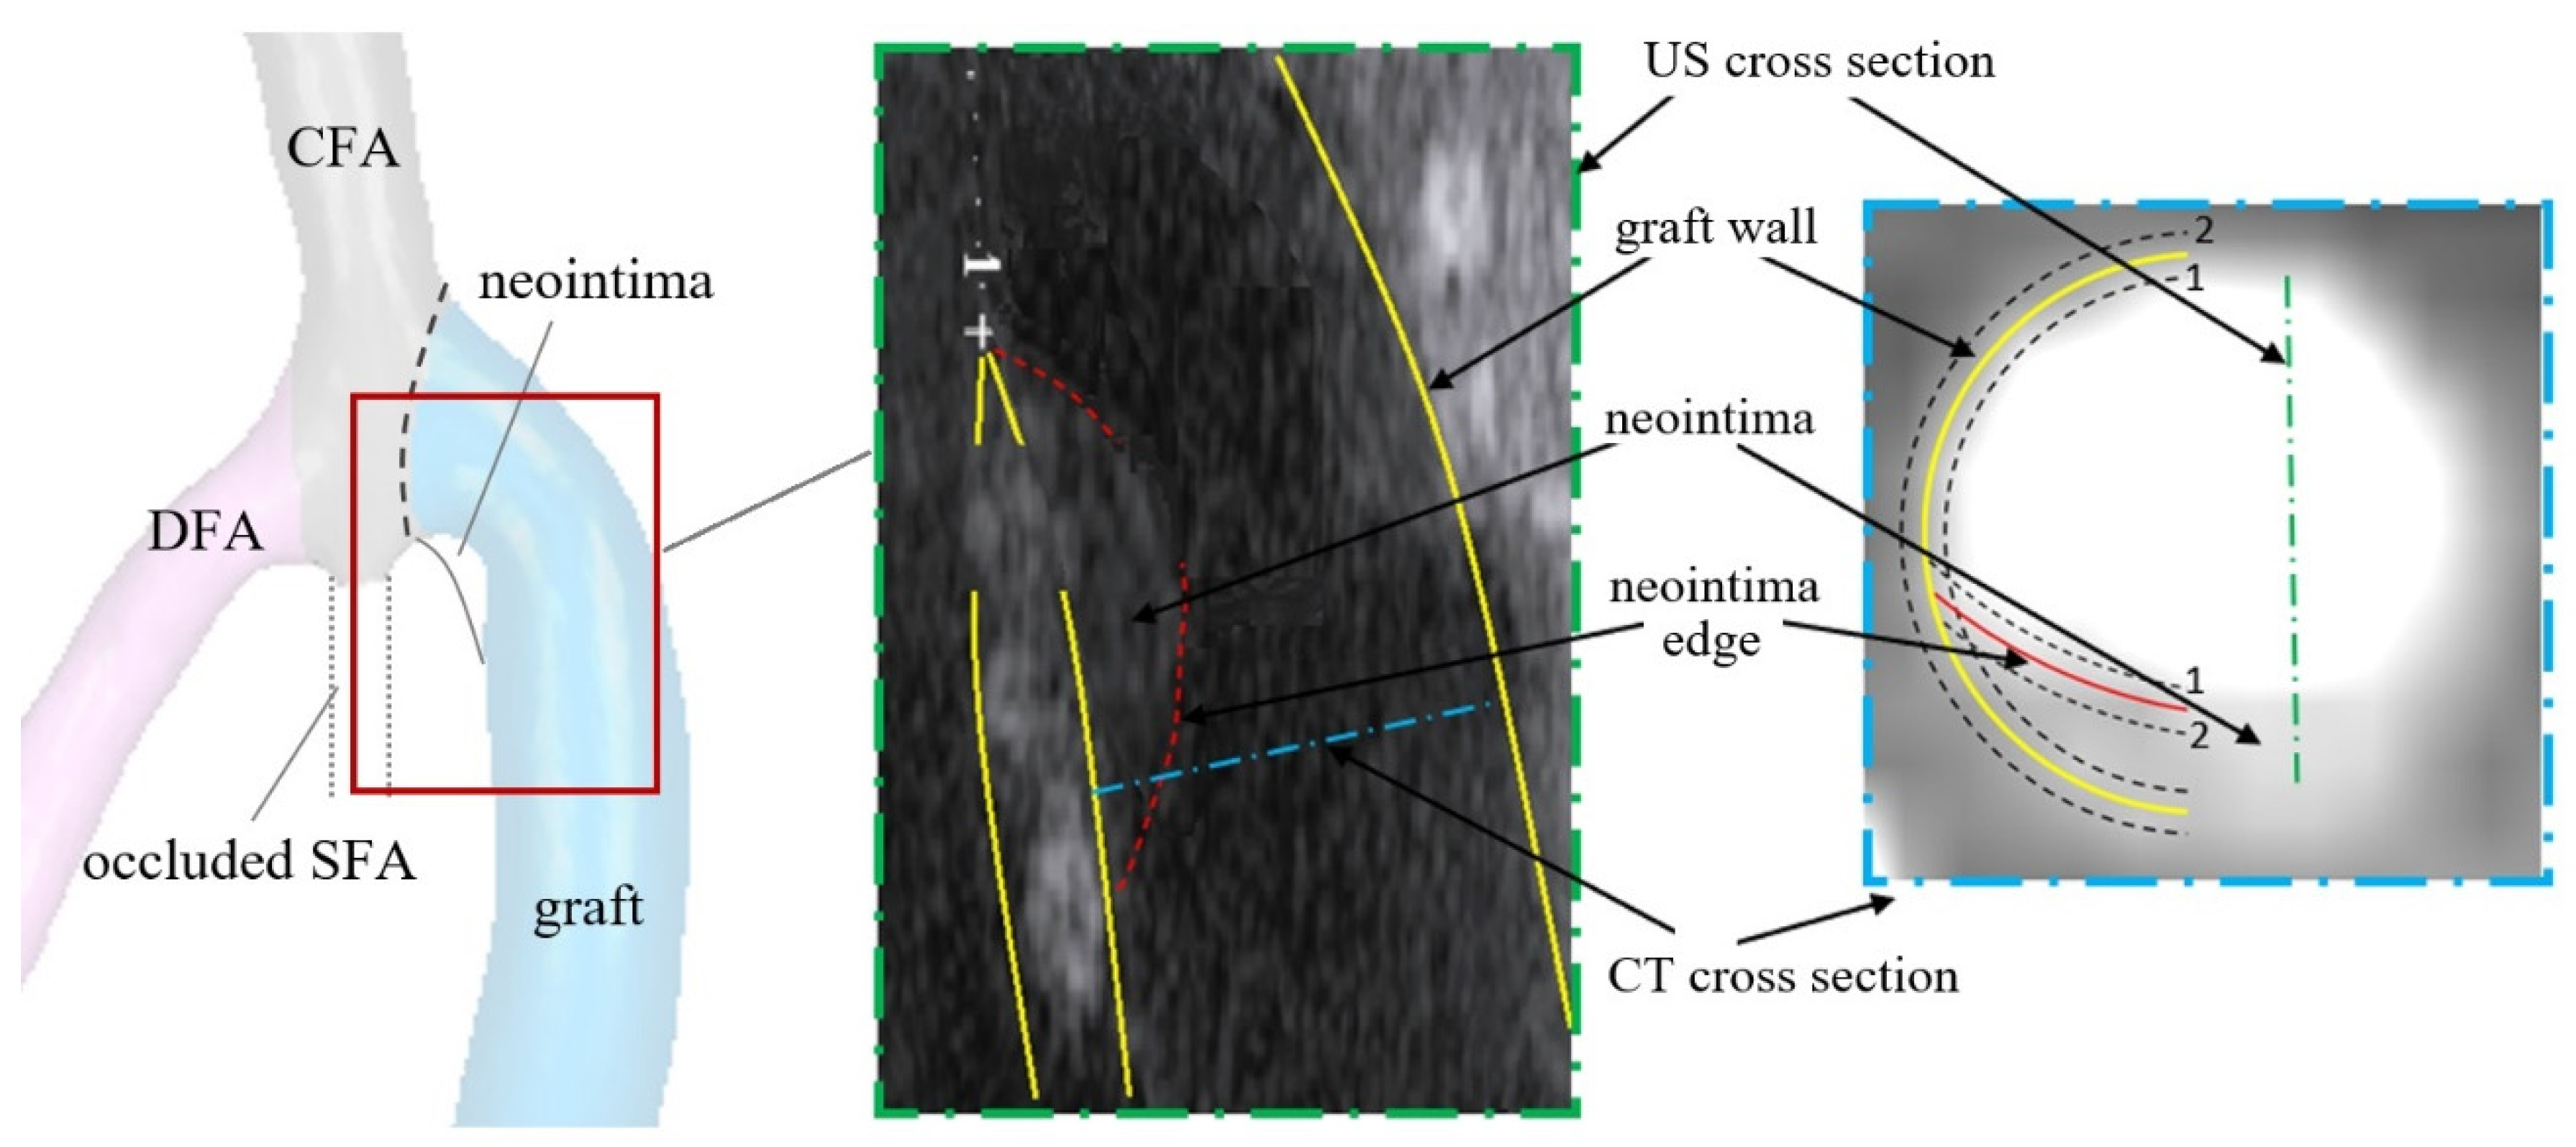
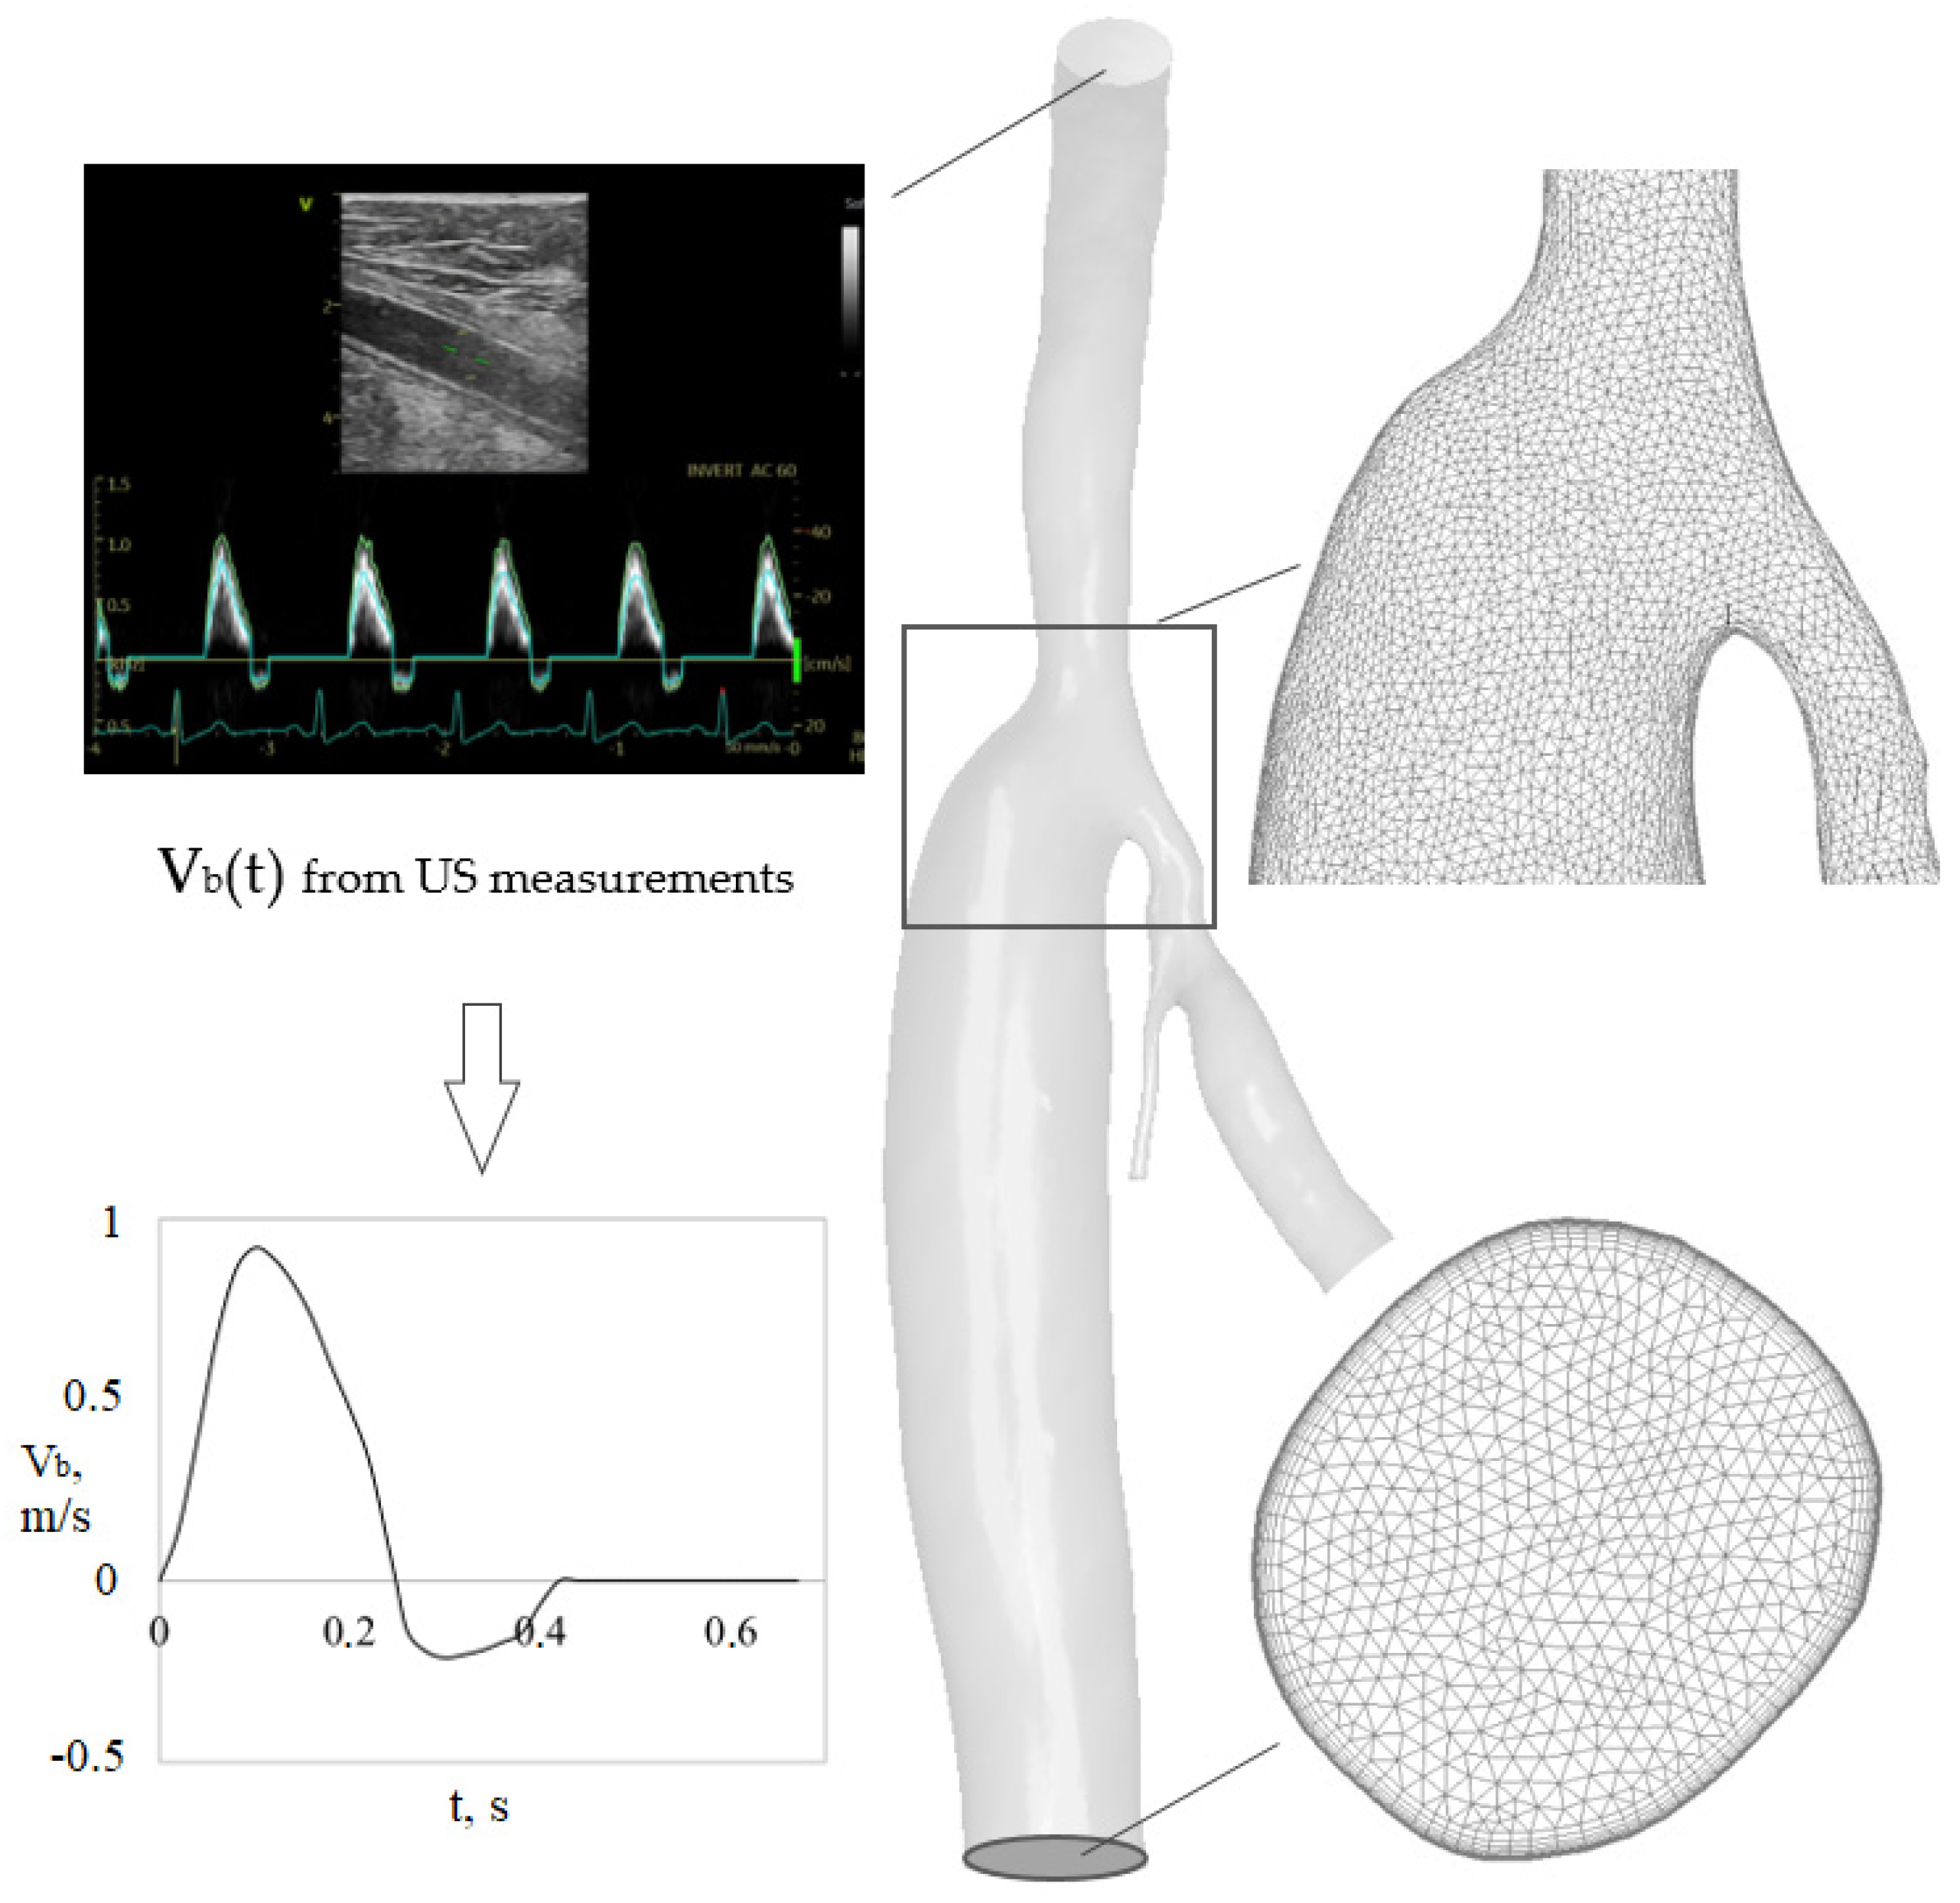
2.1. Geometric Models and Blood Flow Parameters

Personalized models of proximal anastomoses for femoral-popliteal bypass by synthetic graft are considered. The schemes of femoral-popliteal bypass and the blood flow in proximal anastomosis are shown in Figure 1a,b. The graft is fixed bypassing the occluded superficial femoral artery (SFA). The common femoral artery (CFA) is branched into the graft and the deep femoral artery (DFA). Femoral-popliteal bypass models were clinically obtained using multispiral computed tomography (MSCT) performed on a Optima 660 (GE Healthcare, Waukesha, WI, USA). Multispiral computed tomography angiography was performed in two stages. The first stage is the execution of a scan in two projections. When performing an overview planar X-ray image, the following scanning parameters were used: the voltage on the tube is 100 kV, and the tube current is 10 mA. The length of the scan was from the upper border of the aortic arch to the level of the knee joints. At the second stage, the following scanning parameters were applied: rotation time of the X-ray tube—0.8 s; tube voltage—120 kV; tube current—from 320 to 440 mA; slice thickness—1.25 mm; pitch—4i; field of view (FOV)—“Large body”, detector working area—40.0 mm, pitch and speed—0.984:1 mm/rpm, rotation length—“Full”. As contrast agents, Ultravist 370 mg/mL (Bayer Schering Pharma AG, Leverkusen, Germany) or Omnipack 350 mg/mL (GE Healthcare Ireland, Dublin, Ireland) were used in all cases. The drug was administered intravenously bolus in a volume of 100 mL at a rate of 3 mL/s using an automatic KV injector “Dual Shot Alpha” (Nemoto Kyorindo co., Ltd., Tokyo, Japan). Image processing was carried out on the AW Server workstation (Version 3.2, GE Healthcare, Waukesha, WI, USA, 2016). Models were constructed on the contrasted lumen of arteries and grafts data. Vessel walls, including neointima, are not included in the model. An example of MSCT images is shown in Figure 1c,d. Smooth-walled 3D models of femoral-popliteal bypass used for numerical simulation were constructed from MSCT scans.
Blood flow in six cases of proximal anastomosis of femoral-popliteal bypass 4–30 months after surgery was studied. In addition, a 10-month-separated observation of postoperative changes in four proximal anastomoses was carried out. The right and front views of studied models are presented in Figure 2. Here, models are presented in order of decreasing maximum-inlet-flow rate. The CFA is marked in gray, the graft in blue and the DFA in pink. The suture line is schematically shown by a dashed line. Arrows indicate the blood flow direction.
Geometric characteristics of the models and blood flow parameters are presented in Table 1. The parameter ∆t defines the number of months after femoral-popliteal bypass surgery. Measurements of internal diameters of the vessels were carried out using MSCT and ultrasound B-mode images obtained with a Vivid S60N (GE Healthcare, Waukesha, WI, USA) ultrasound scanner by GE 9L-D linear transducer with a frequency of 2–8 MHz. In some models, the neointimal hyperplasia (NIH) was found. The scheme of determining the graft and neointima edges is shown in Figure 3. Identification of the vessel wall and the neointima edge was carried out using auxiliary curves (numbers 1 and 2 in Figure 3), where the first line was drawn along the white edge, and the second along the light gray and the dark gray boundary. Then, it was assumed that the true edge is equidistant between these curves. The graft wall is drawn in yellow, the neointima edge is drawn in red and US and MSCT cross sections are shown in green and blue, respectively. For studied models, the CFA internal diameter ranges from 5.5 to 8.2 mm, and the graft internal diameter ranges from 6.7 to 11.0 mm. The angle α between CFA and graft central axes in the branching area ranges from 35 to 150°.
Blood flow parameters were obtained from clinical ultrasound (US) velocity measurements carried out with Vivid S60N (GE Healthcare, Waukesha, WI, USA) ultrasound scanner by a linear ultrasonic transducer with an operating frequency of 7.5 MHz in pulsed-wave (PW) Doppler mode. A control volume occupying 3/4 of the diameter was placed in the center of the vessel. The weighted average envelope of the Doppler spectrum was digitized to define the time-dependent inlet and outlet average flow velocities needed to set boundary conditions in numerical simulation. The cycle-average inlet flow in CFA ranges from 109 to 823 mL/min for the studied models. The ratio of the graft outlet flow to the inlet flow ranges from 0.5 to 0.9. The major blood flow characteristics—the Reynolds number at the maximum flow instance, ReCFA max (1) and the Womersley number, WoCFA (2)—were calculated based on the measured maximum inlet velocity and inlet diameter.
R e C F A   m a x = V C F A · D C F A · ρ μ  
W o C F A = D C F A 2 2 π ρ μ T
where ρ = 1050 kg/m3—blood density, µ = 0.0035 Pa∙s—blood dynamic viscosity, T—the cycle time. As seen in Table 1, ReCFA max values range from 470 to 2920, and the WoCFA numbers range from 8.4 to 16.2, the latter indicates that the inlet velocity profile is close to flat.

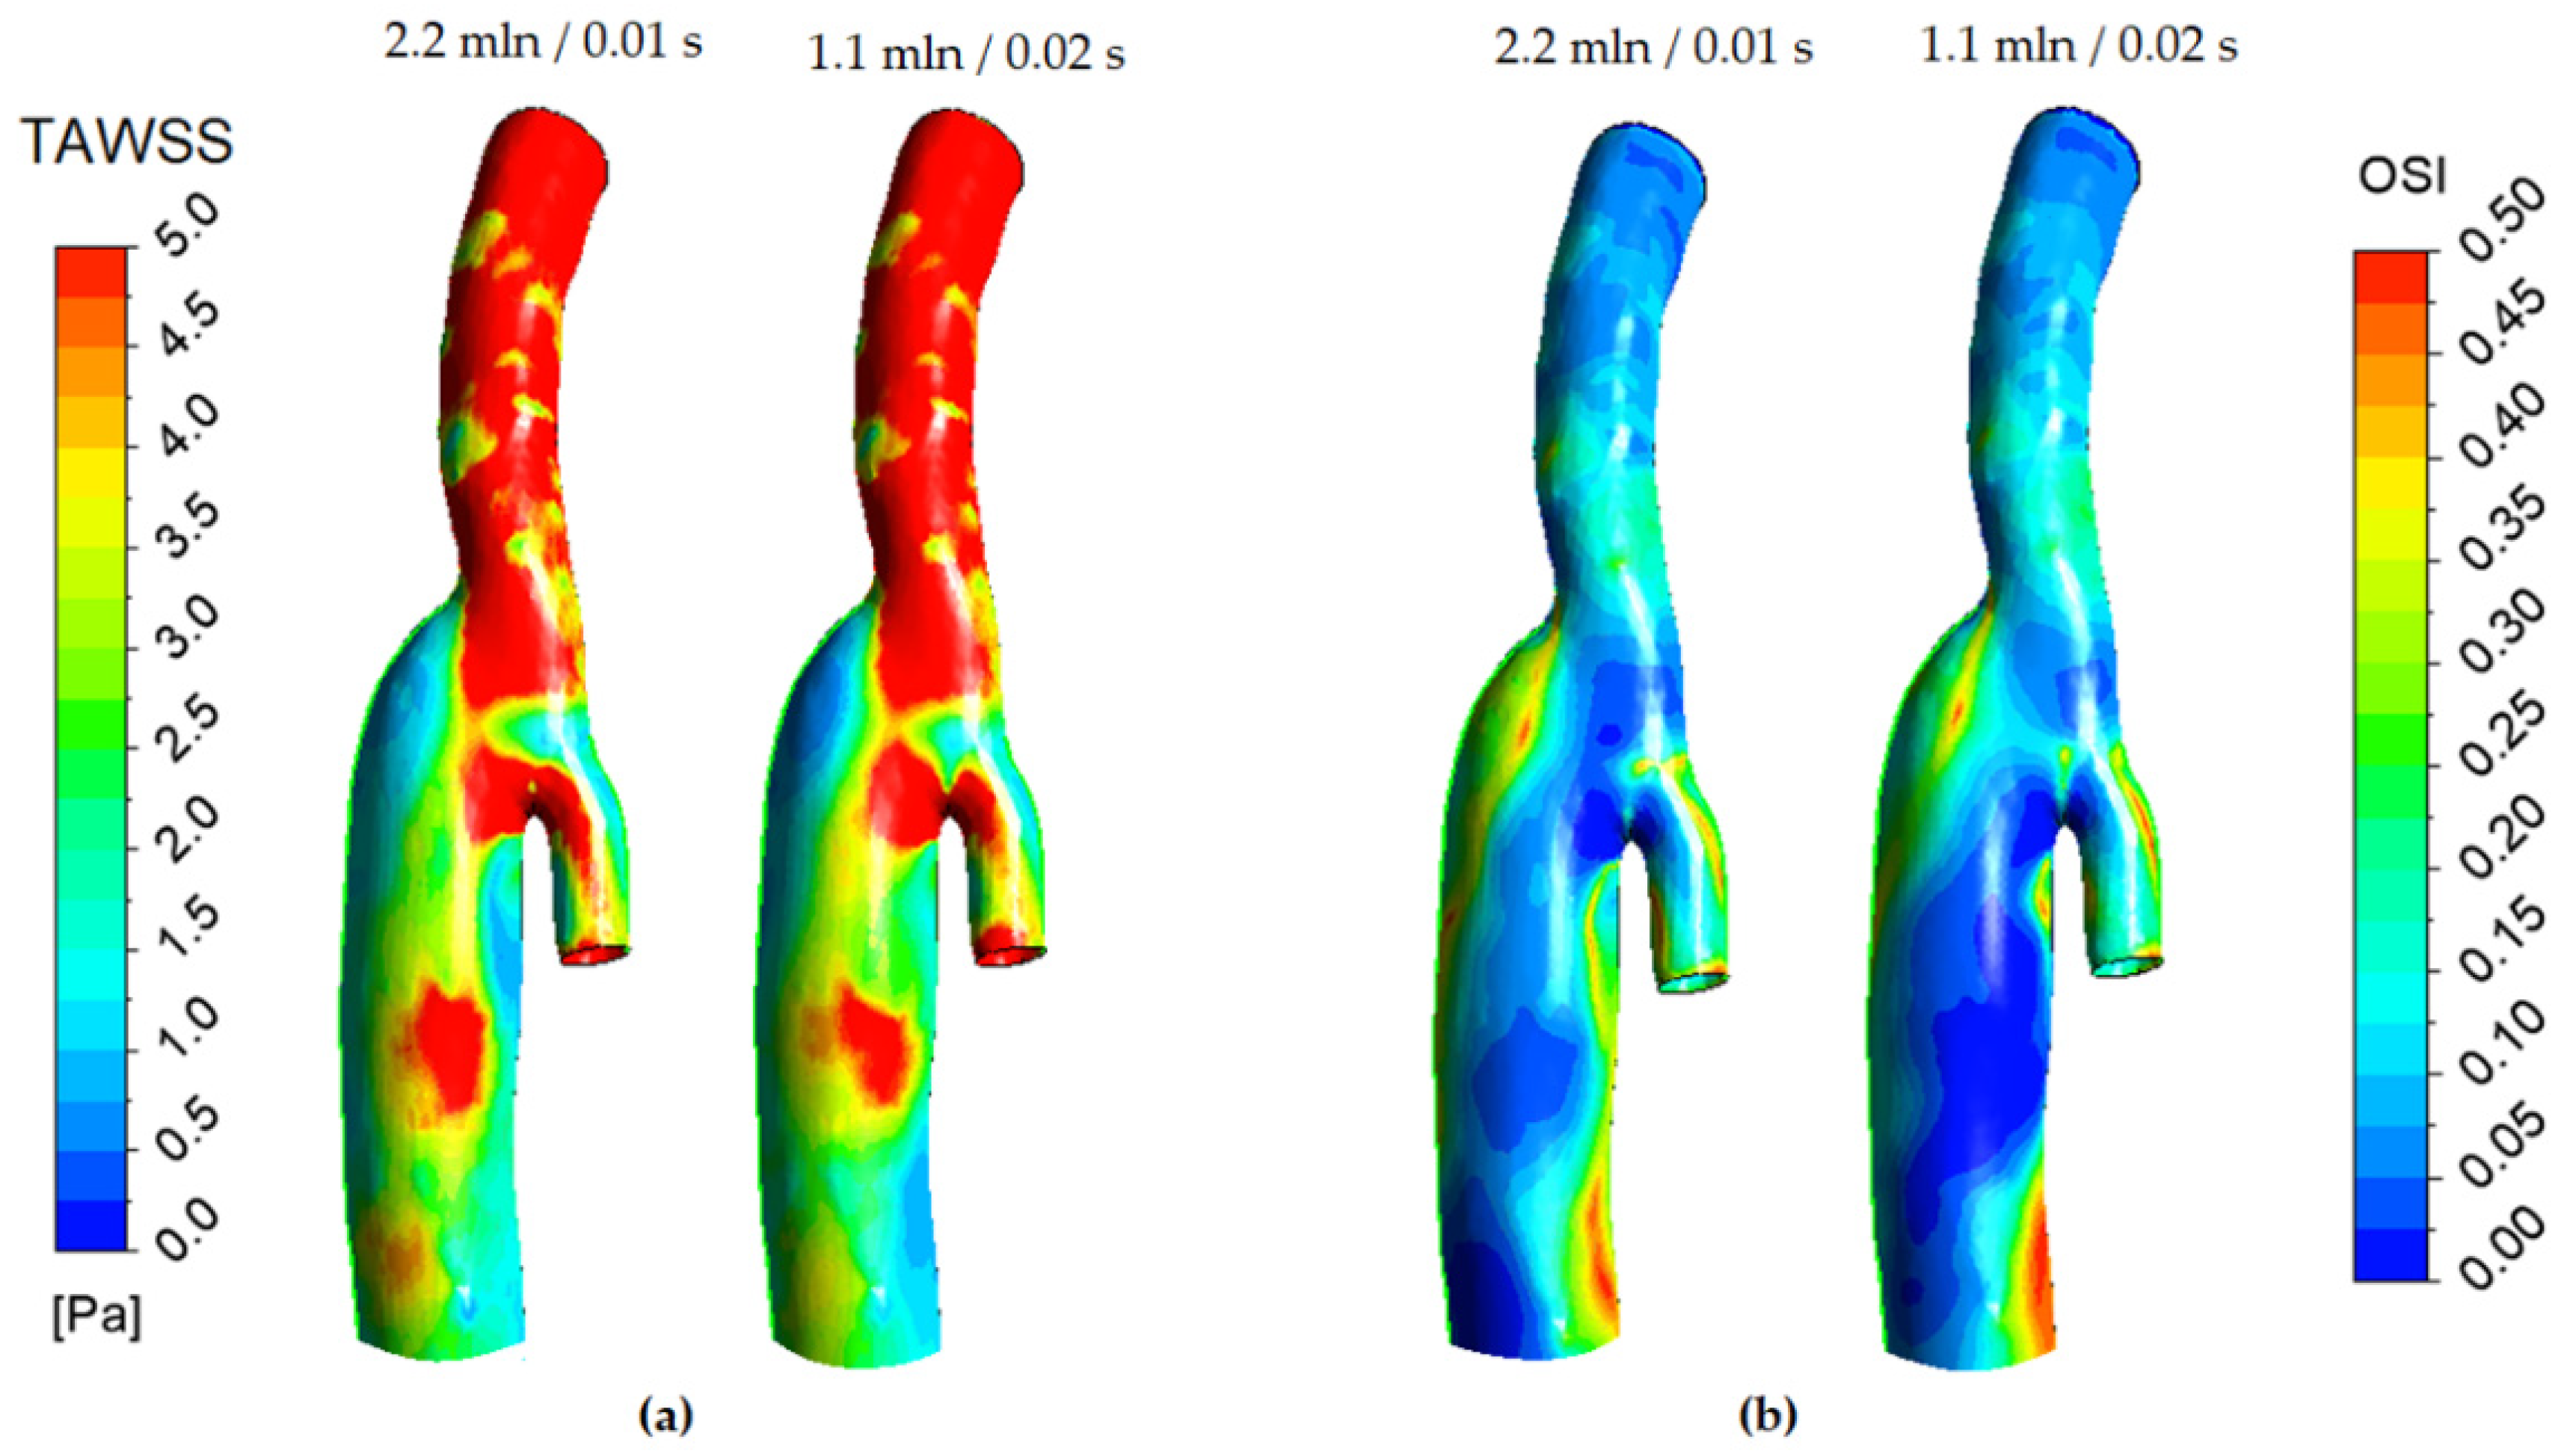
2.2. Numerical Simulation Aspect

Numerical simulation of the pulsating incompressible fluid flow using the quasi-laminar approximation was carried out for each model. The walls’ elasticity was not taken into account. The ANSYS CFX fluid dynamics package was used for the calculations, solving the non-stationary three-dimensional Navier–Stokes Equation (3) using the finite volume method. This software, well validated for 3D flow computations based on the Navier–Stokes equations, was widely used for previous related patient-specific simulations [22,23,26,27,28]. A second-order accuracy scheme was used to evaluate convective and diffusion fluxes at the control volume faces. Temporal discretization was of second-order accuracy as well.
{     v i t + v j v i x j = 1 ρ p x i + μ ρ x j ( v i x j + v j x i ) v i x i = 0                                                            
Unstructured computational grids of 2.2–3.5 million elements were constructed. Each grid contained a prismatic elements layer to resolve near wall flows. Figure 4 shows an example of a computational grid and the time-dependent inlet boundary conditions for one of the patients.
The CFA inlet velocity curves, Vb(t), were set in accordance with clinical ultrasound measurements (with the type of boundary condition “inlet” as implemented in the ANSYS CFX). The inlet velocity profile was assumed to be flat. The graft end section (outlet) velocity was set (with the same curve shape) according to a personalized ratio of inlet to graft flow rates (Table 1) with the type of boundary condition “opening”. Zero reduced pressure was set at the free outlet (DFA) to provide the mass flow conservation. The no-slip condition was set on the walls, where velocity components are equal to zero. The time step was 0.01 s. The maximum number of iterations for each time step was 100, and the convergence level was set to 10−5. Typically, three time cycles were calculated to achieve a fully developed periodic solution.
Velocity fields and wall shear stress parameters affecting the neointima growth were analyzed. The time-averaged wall shear stress (4) and the oscillatory shear index (5) were evaluated. The oscillatory shear index (OSI) allows us to estimate the degree of WSS directional changes. Its values range from 0 to 0.5, where OSI = 0 indicates unidirectional WSS, and OSI = 0.5 indicates unsteady, highly oscillatory shear flow.
T A W S S = 1 T 0 T | τ w | d t
O S I = 1 2 ( 1 | 0 T τ w d t | / 0 T | τ w | d t )
As mentioned above, (basic) computational grids consisting of 2.2 to 3.5 million elements, depending on the geometrical model, were used to get numerical solutions. Despite the fact that grids of similar topology and size were typically used in the previous related contributions [22,23,24,26,27,28], a grid sensitivity study was also performed for the considered models, combining with evaluations of the time-step effect on the solutions. As an example, Figure 5 shows a comparison of TAWSS and OSI distributions obtained for model 2 (see Figure 2) in two cases: with the basic grid (2.2 mln elements) and the basic time step (0.01), and with a coarser grid (1.1 mln elements) and a larger time step (0.02 s). As seen, the distributions obtained with different numerical resolutions are rather close to each other, especially in suture area, which is of the main interest. In the next Section, the results obtained with basic grids are presented.

3. Results and Discussion
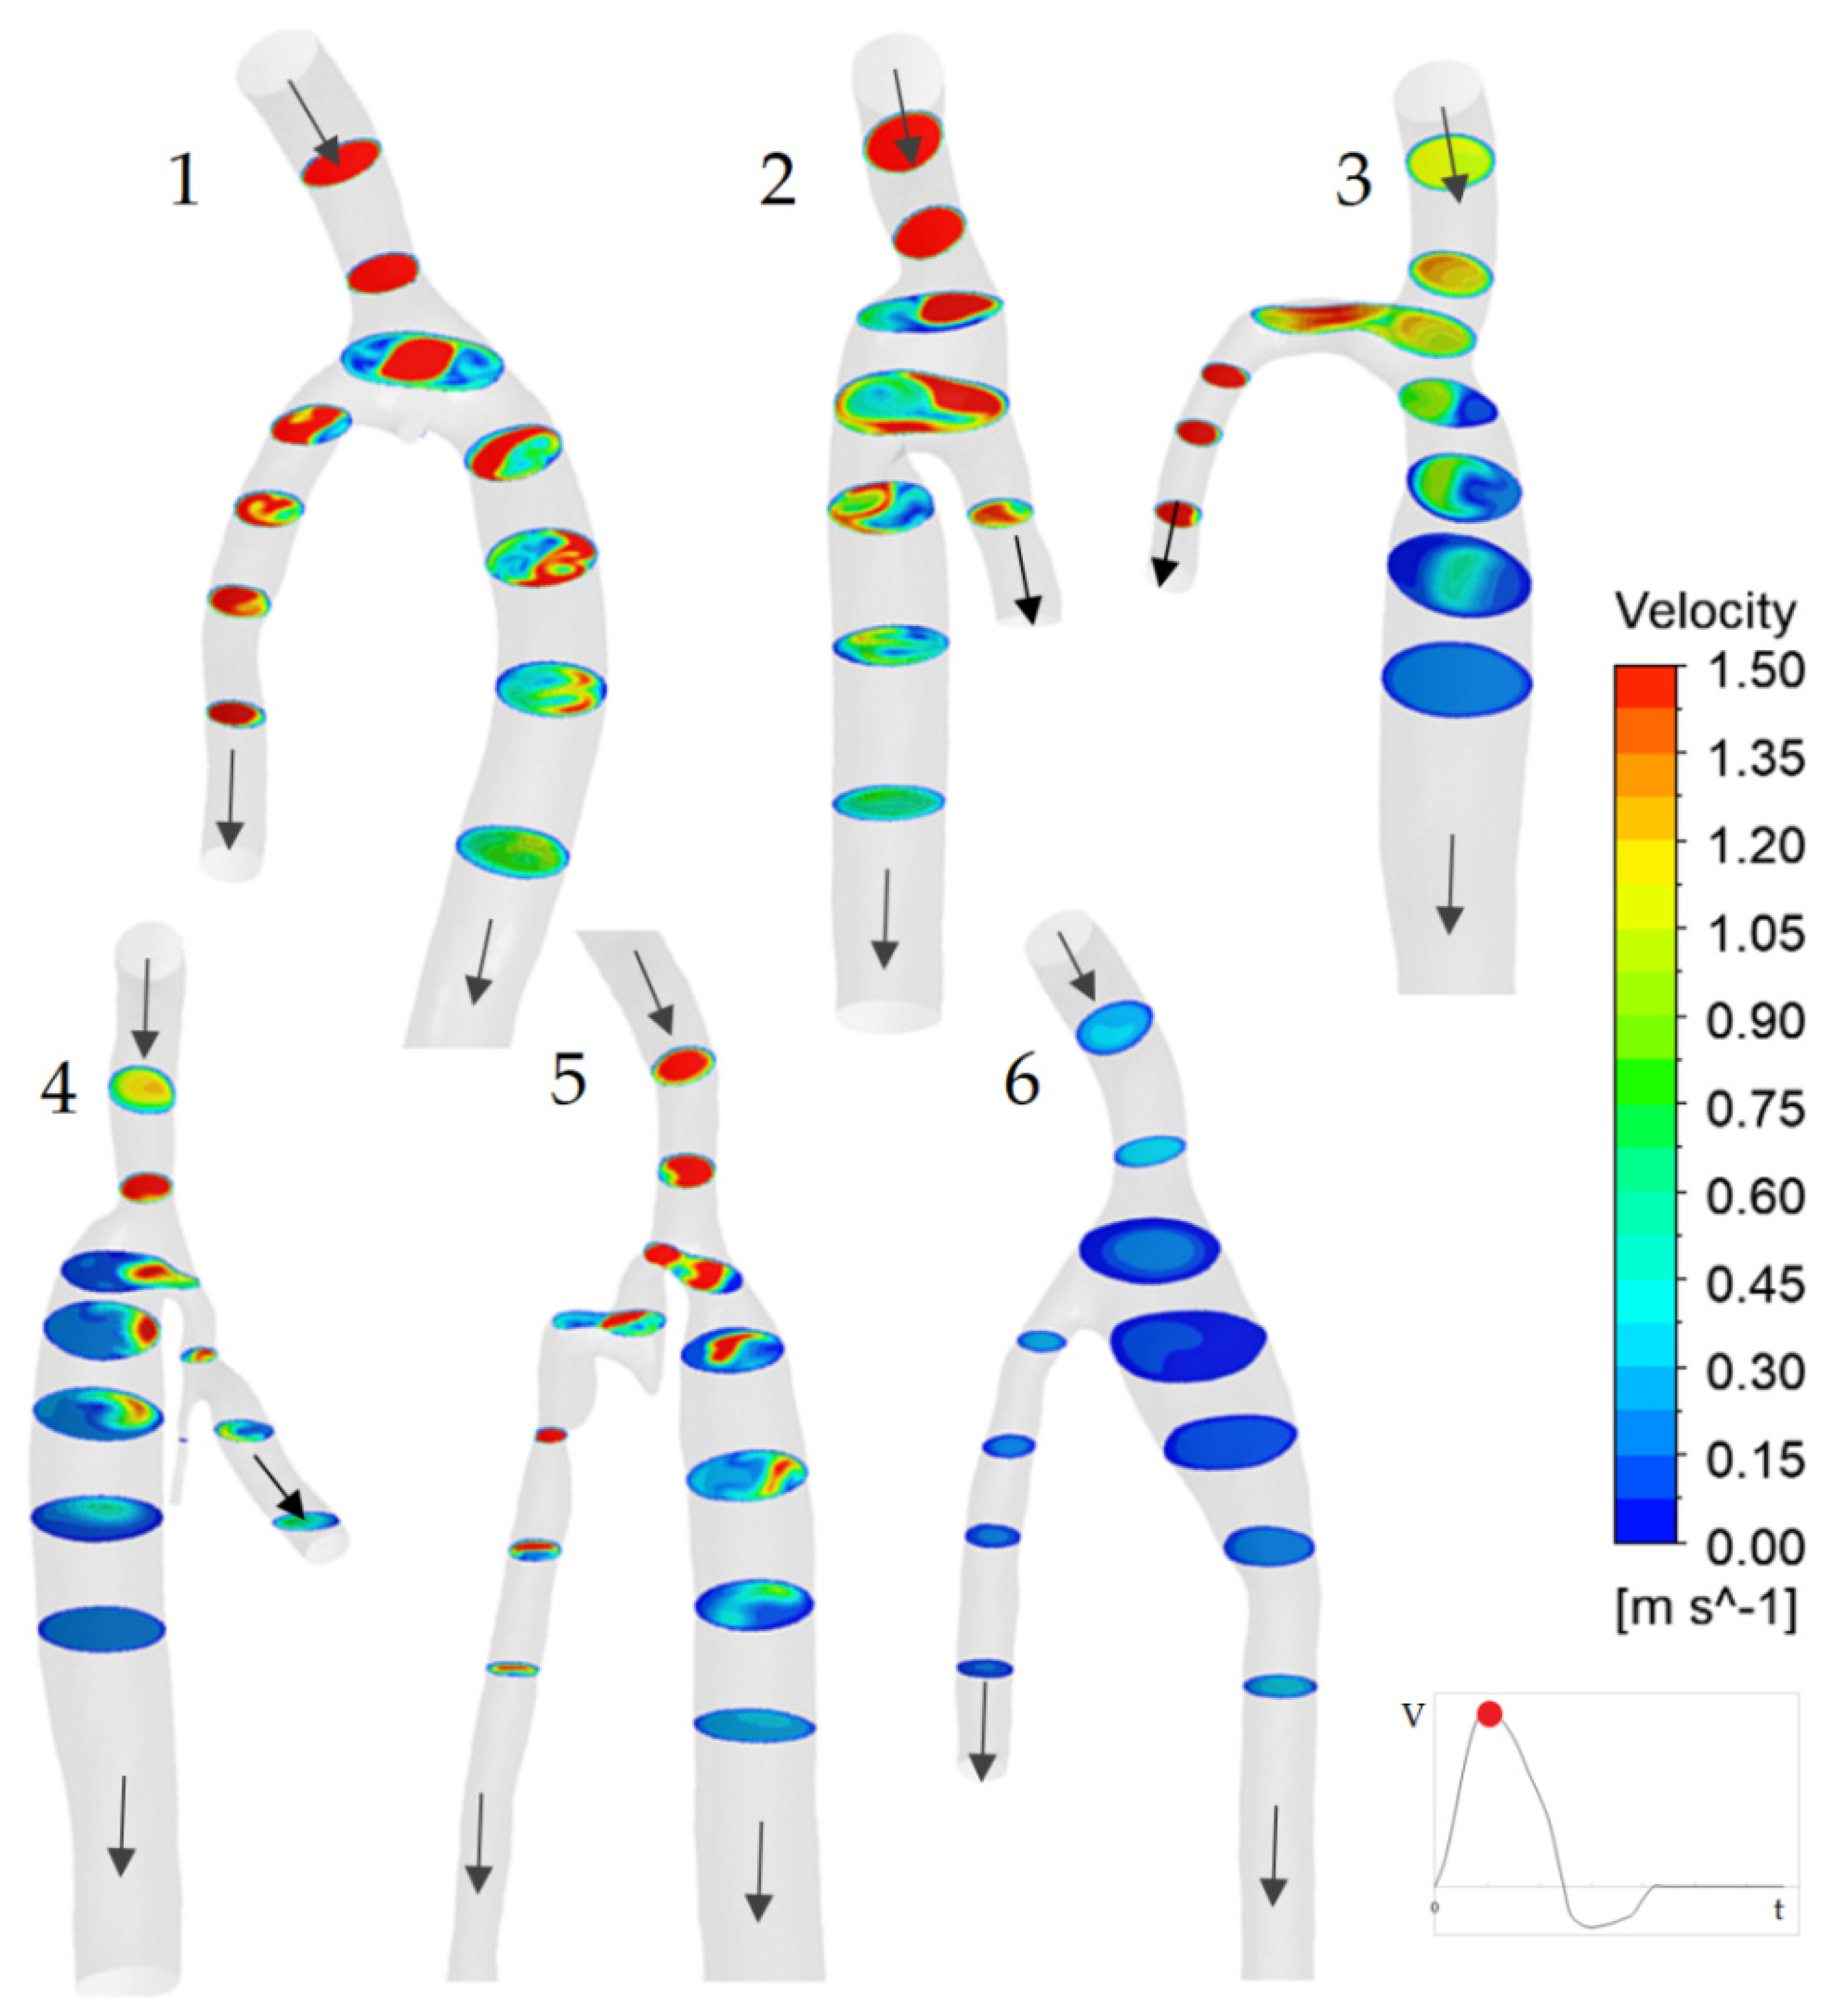
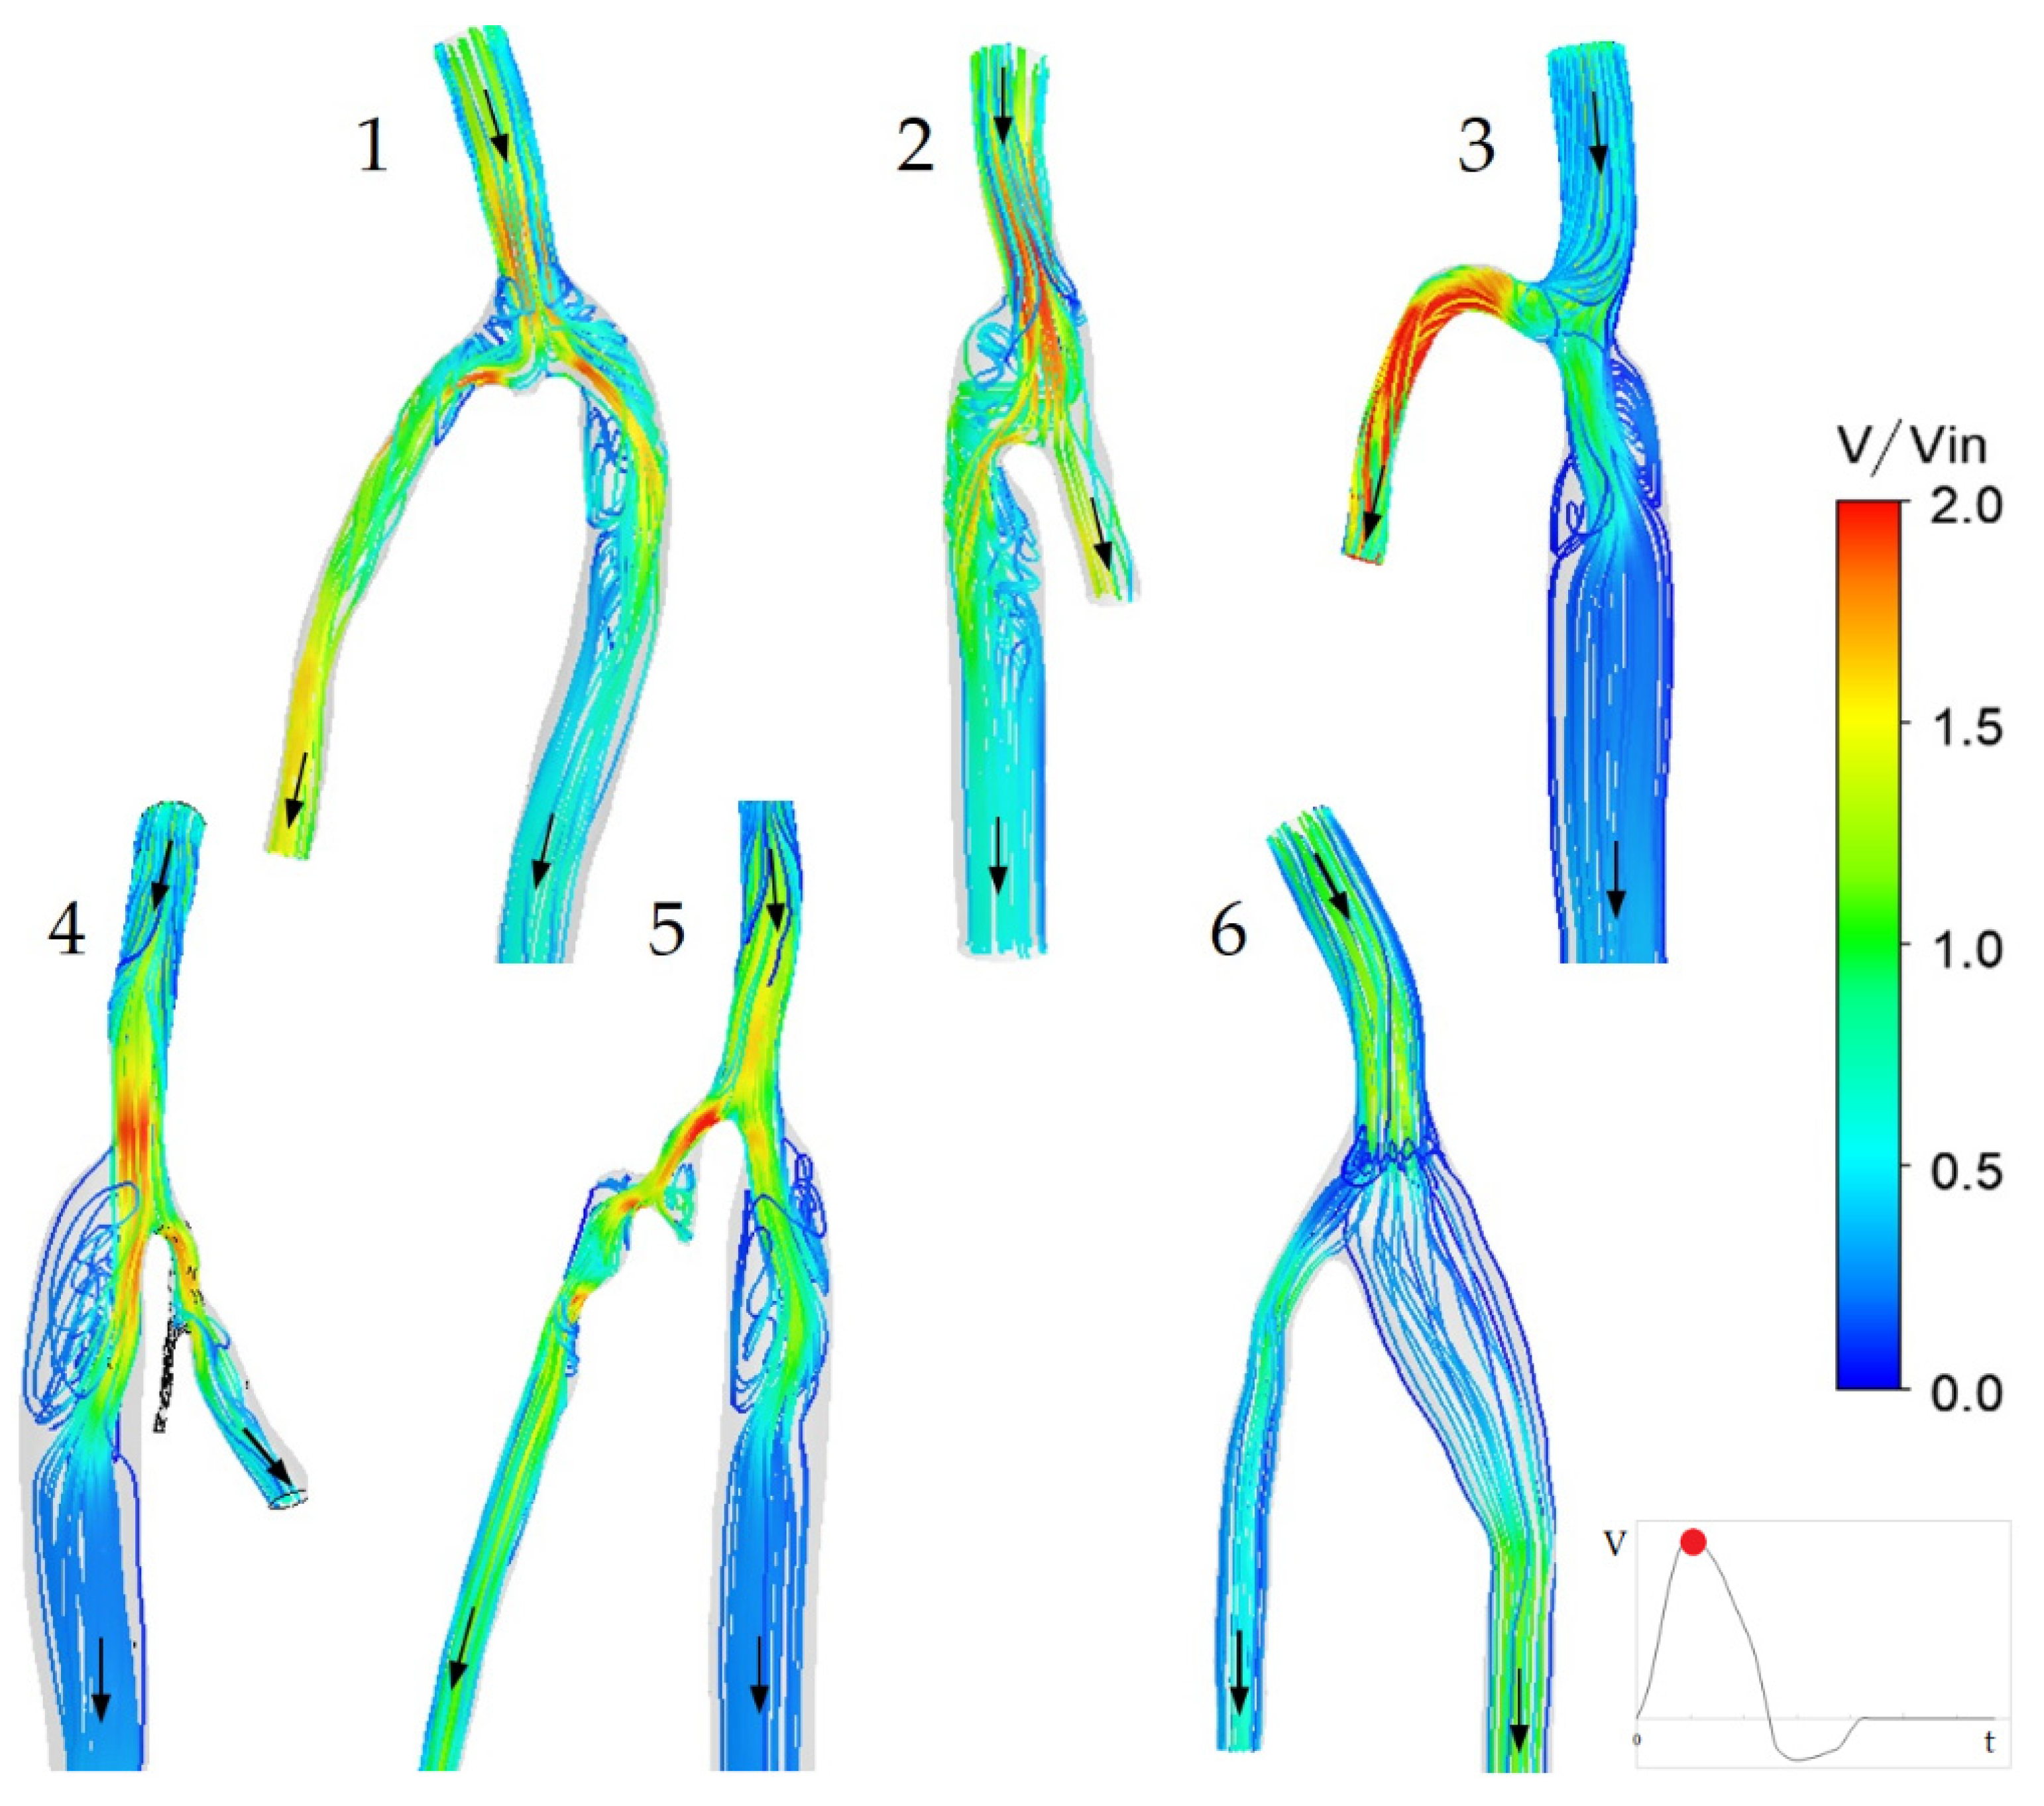
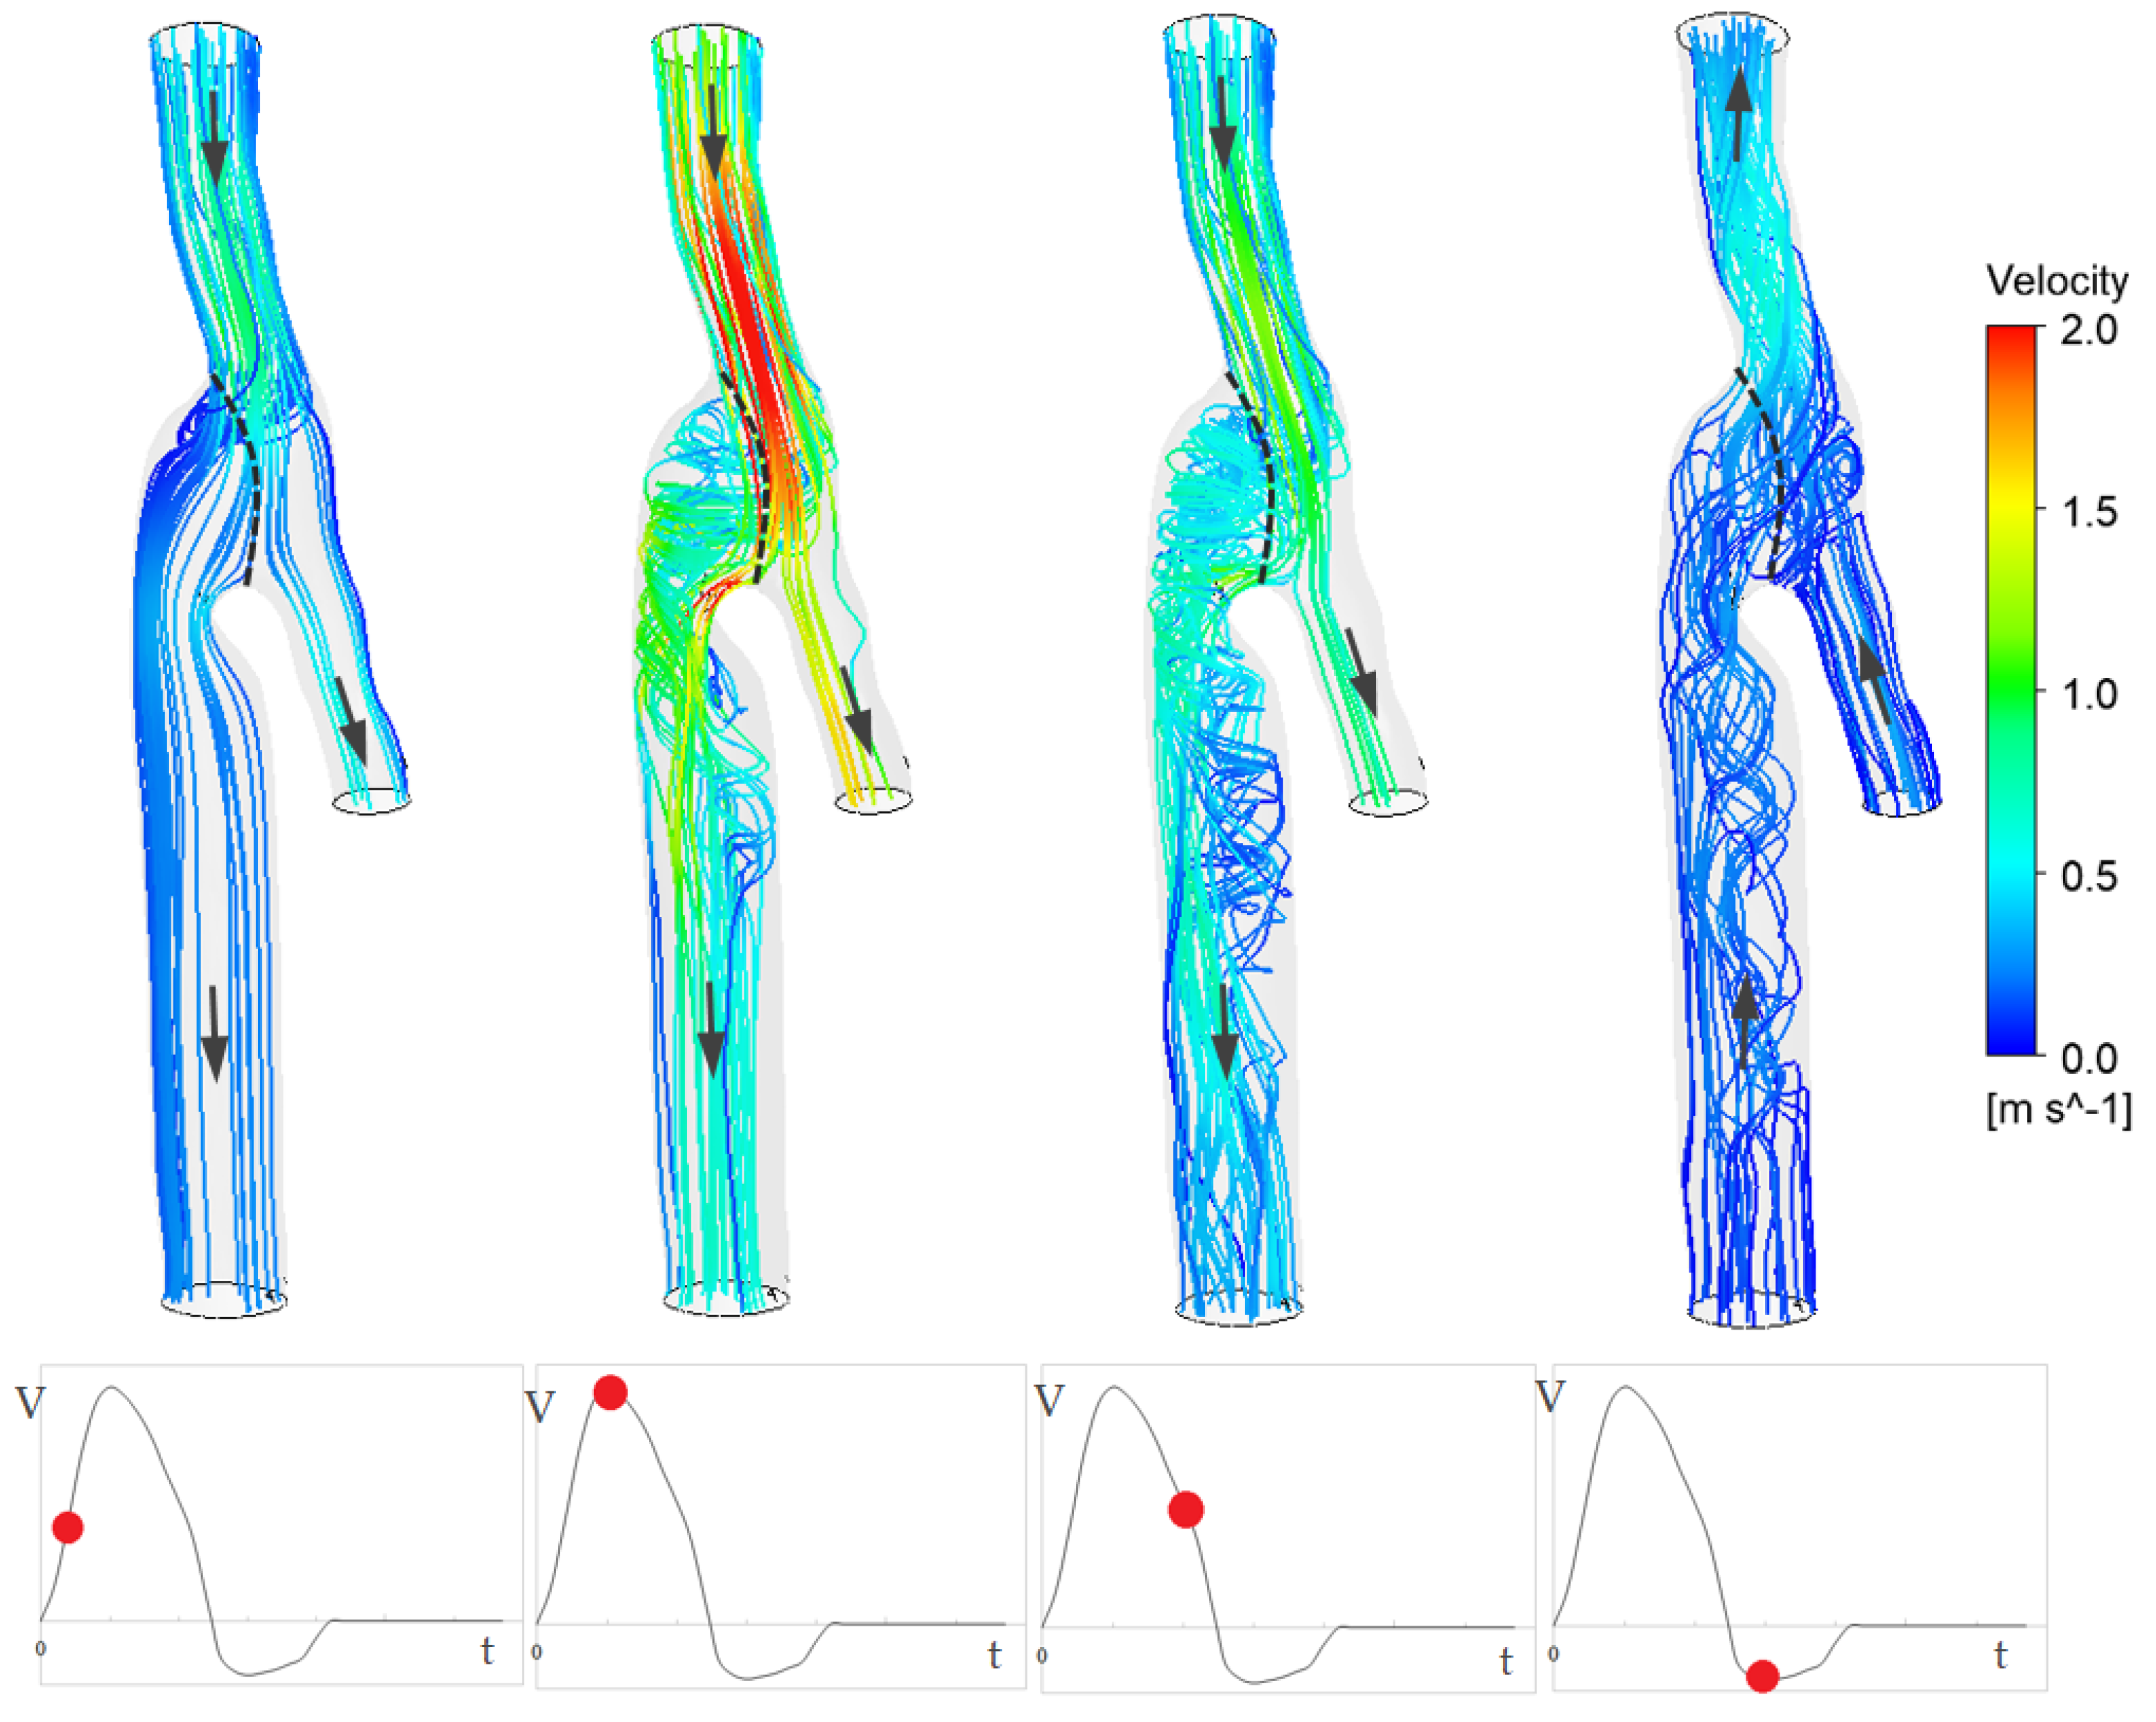
3.1. Flow Features

Figure 6 illustrates velocity fields in cross sections of six proximal anastomosis models at the instance of maximum flow. Peak inlet velocities are as follows: for model 1—1.4 m/s, model 2—1.1 m/s, model 3—0.93 m/s, model 4—0.93 m/s, model 5—1.2 m/s, model 6—0.27 m/s. The blood flow from the common femoral artery (CFA) is branched into the graft and the deep femoral artery (DFA). Velocity maximum is located near the external wall of the graft in models 1, 2 and 5, and near the inner wall in models 3, 4 and 6. This distinction is caused by differences in the anastomosis 3D geometry. The velocity maximum remains at the inner wall in case of “severe” branching (the branching angle α is more than 50°), and downstream the velocity maximum moves again to the graft centerline. The velocity maximum shifts to the external wall in case of a small branching angle (less than 50°), and downstream the velocity maximum moves again to the graft centerline.
Figure 7 shows streamline patterns at the maximum flow instance. A low velocity zone (stagnant zone) of various sizes (about 5–30 mm long) is formed downstream from the suture area in almost all cases. The relationship between the stagnant zone length and models’ parameters was out of the scope of the present study. For models 1–3, 5, two low flow zones were formed downstream from the suture area, whereas one low flow zone was formed in the case of model 4. Such zones are typically observed due to flow separation and the formation of a boundary layer. No stagnant zone was detected in the case of model 6.
The blood flow dynamics during the cycle is shown in Figure 8 for model 2. Three-dimensional streamline patterns are shown for four time instances: of increasing flow, of maximum flow, of decreasing flow and of reverse flow. At the first time instance considered, the flow is more or less uniform, and there are no pronounced secondary flows. There are stagnant zones in the graft at the instance of maximum flow. A very complicated vortex flow structure is formed at the flow decreasing phase.
As mentioned in the Introduction, in a series of papers [26,27,28], results of patient-specific numerical simulations of the blood flow in femoral-popliteal bypass by vein have been reported. In a comparison of geometrical aspects of the proximal anastomosis considered in [26,27,28] and in the present study, one can note considerable distinctions caused by the usage of grafts of different types. The vein grafts used for bypass surgery in the cases considered in [26,27,28] are characterized by the inner diameter that is lower than the diameter of the common femoral artery. Under these conditions, the blood flow of a confuser type is formed in the anastomosis, as one can conclude from the illustrations presented in [26,27,28]. Contrary to that, the synthetic grafts used in the present study had inner diameters which typically exceeded DCFA (Table 1). In this case, the bifurcating flow tends to be of a diffuser type that commonly has a considerably more complicated structure. Figure 6, Figure 7 and Figure 8 clearly illustrate this fact.
An increased complexity of the “diffuser-type” 3D flow in a proximal anastomosis for femoral-popliteal bypass by a synthetic graft is accompanied by highly non-uniform distributions of TAWSS and OSI in the bifurcation area and in the initial downstream section of the graft. Moreover, these distributions are extremely case dependent.
The occurrence of low-velocity zones is associated with areas of time-averaged shear stress (TAWSS) low values and the oscillatory shear index (OSI) high values. These parameters are of the most interest for the evaluation of the neointimal hyperplasia (NIH) risk [14,15,20,21]. It is often noted that the most “dangerous” TAWSS and OSI values for NIH are TAWSS < 0.5 Pa and OSI > 0.3 [19,23]. Figure 9 shows TAWSS distributions for six proximal anastomosis models. The largest values of TAWSS (more than 5 Pa) are located in high velocity areas, for example, in the CFA and in the flow branching area. The lowest values of TAWSS are located in the graft downstream from the branching, where the graft diameter is generally larger than the CFA one. Lower TAWSS values (less than 1 Pa) and higher OSI values (more than 0.2) are observed in the case of model 6. This is due to a relatively low flow rate in this case and large diameters. Corresponding conclusions can be reached for OSI fields (Figure 10). The lowest OSI values are observed in high velocity areas—in the CFA and in the branching area. The highest OSI values are located in the graft. It should be noted that there is a correlation between TAWSS and OSI fields—high OSI is observed in low TAWSS areas and vice versa. In terms of the NIH, the most “dangerous” areas are located in the graft downstream from the branching, where wall shear stress is oscillatory and has low values.

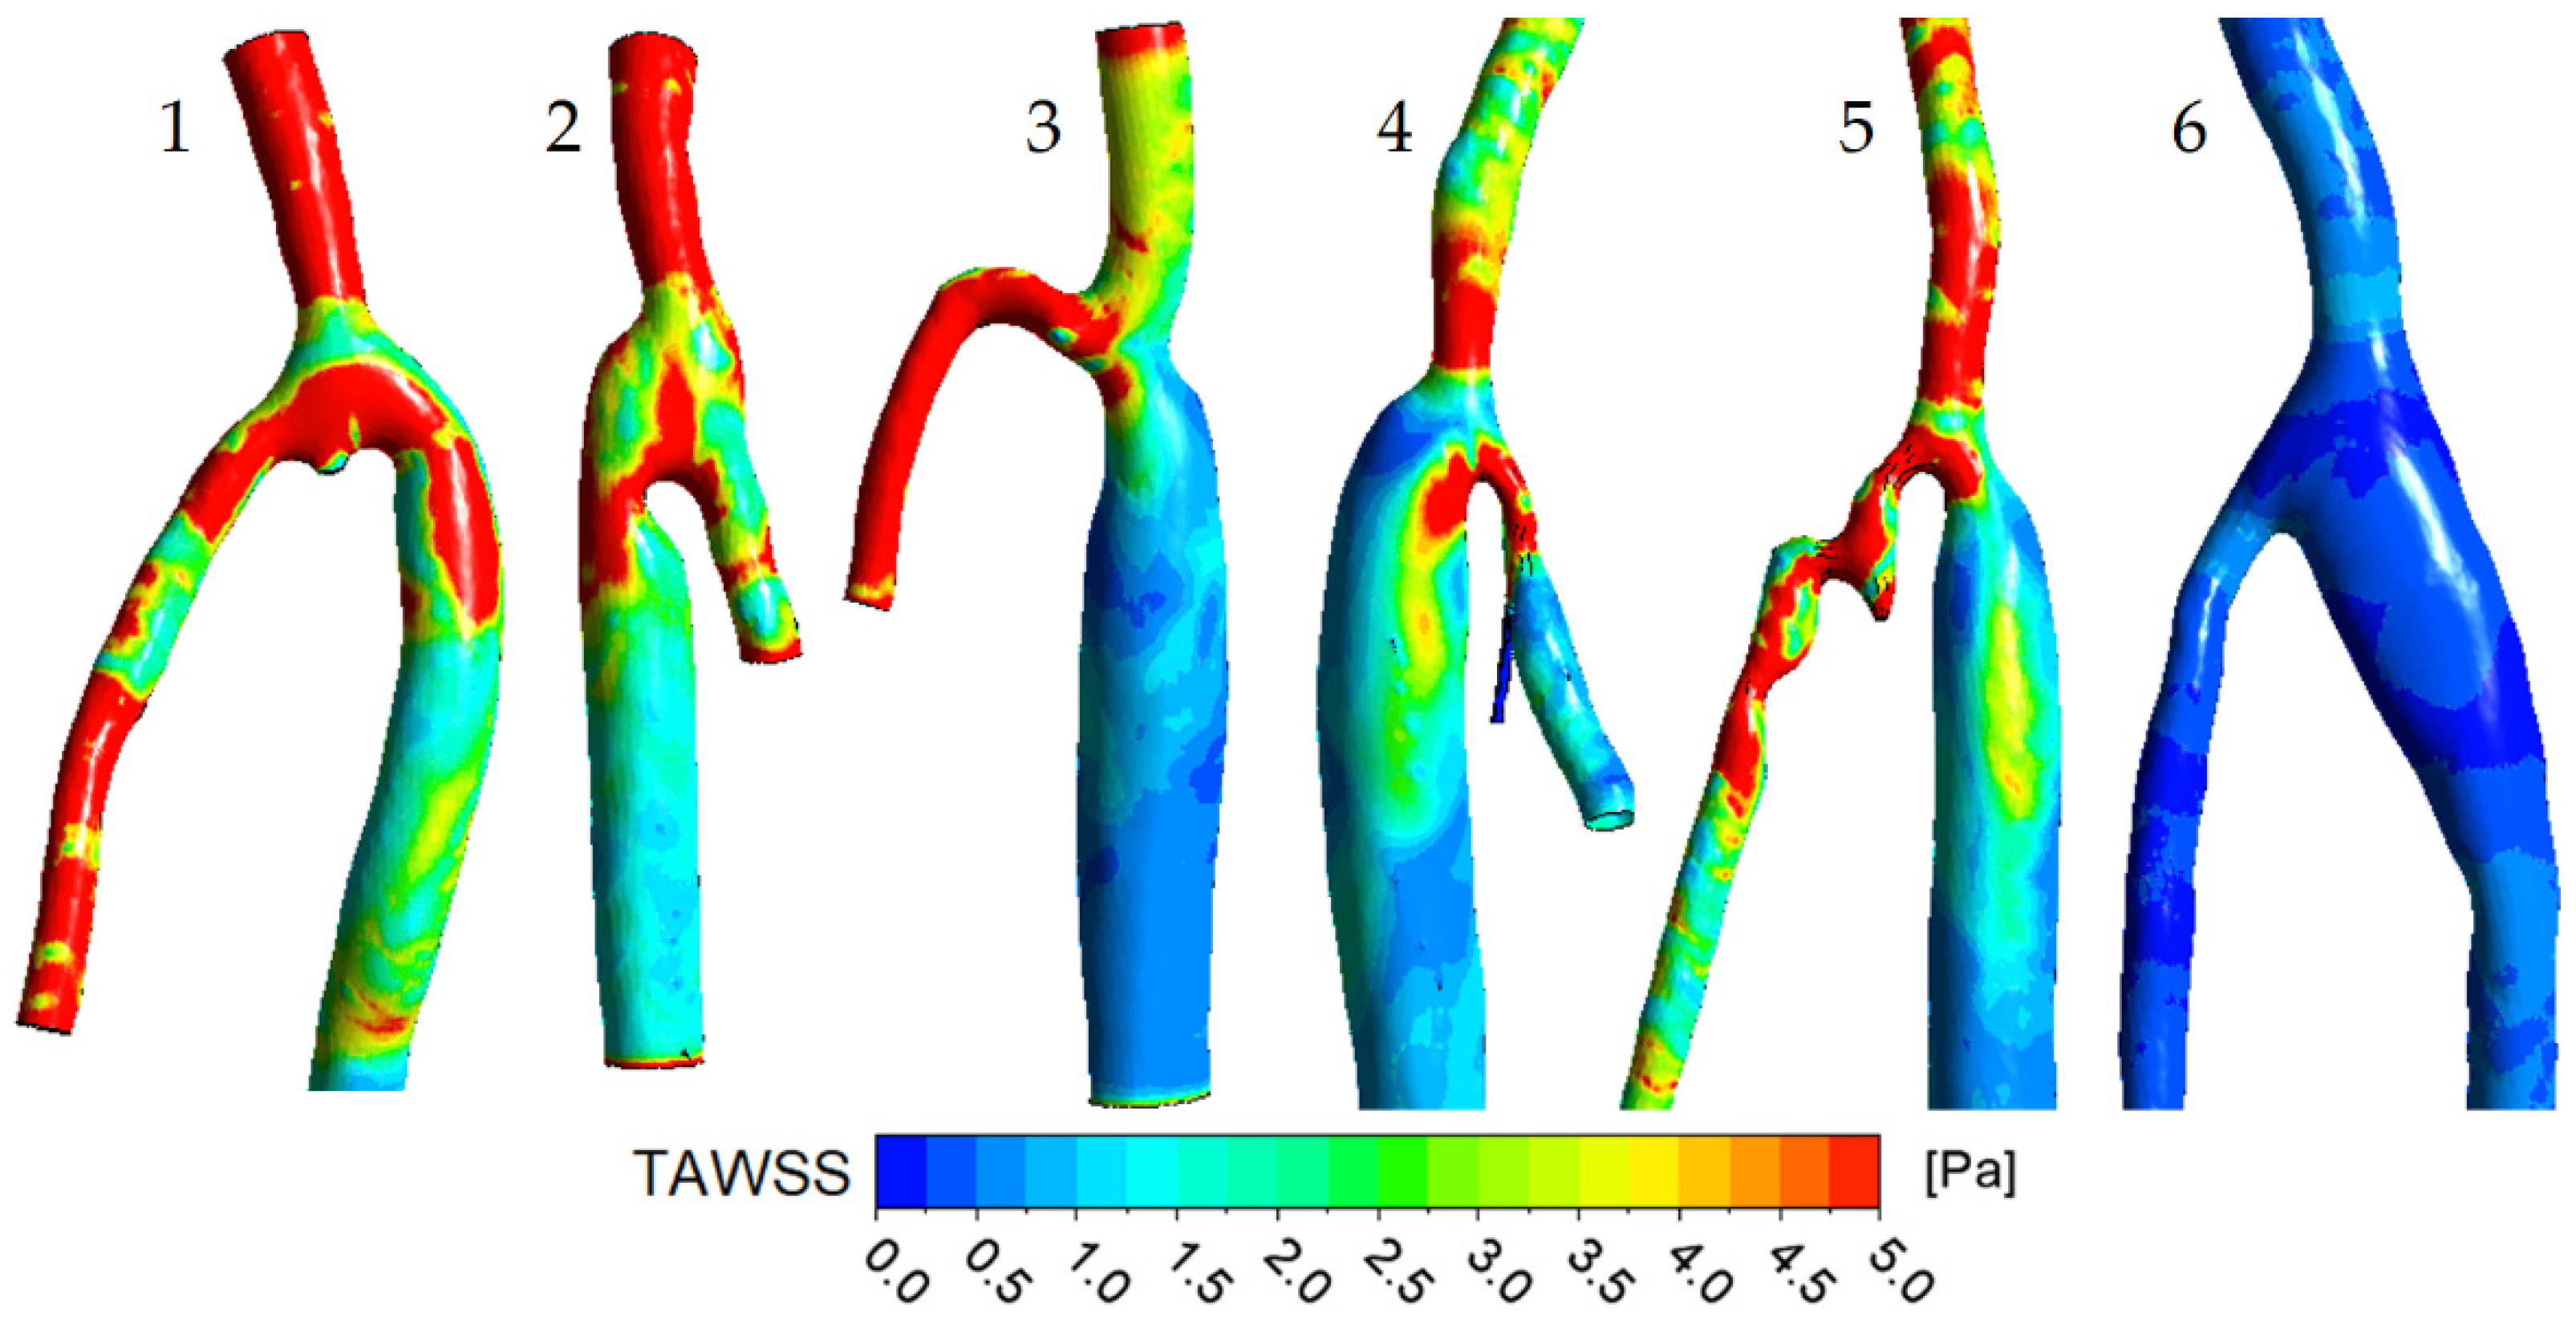
3.2. The Impact of the Geometry Changes on the Blood Flow

Postoperative repeated follow-ups were carried out for four patients out of the six presented above. For the present paper, only one case was chosen to demonstrate the impact of the postoperative geometry changes on the blood flow. There are MSCT scans taken with a time shift of 10 months for this model: 18 and 28 months after bypass surgery. Note that the model constructed on the base of the 28-month data is denoted above as model 2. There has been a considerable change in geometry for ten months, consisting of the CFA shape change (at 28 months, it had a straighter shape) and neointima growth at the suture area. The maximum neointima thickness has been evaluated as 3.8 mm, and the graft cross-section area narrowing is about 20%. Numerical simulation in these two models was performed under the same boundary and initial conditions to exclude other effects except the geometry changes.
Figure 11a shows the TAWSS distributions for the models related to 18 and 28 months after bypass surgery. Arrows indicate the flow direction, the dashed line shows the suture and the gray area indicates the neointima. In general, a wall shear stress increase is noted throughout the model at 28 months after bypass (compared to the model at 18 months after bypass). The cross-section narrowing in the NIH area led to a considerable velocity increase and, accordingly, a TAWSS increase in this area. In particular, the TAWSS averaged over the wall section with NIH is 5.7 Pa for the model related to 18 months after bypass and 8.7 Pa for the model related to 28 months after bypass. Thus, the 20% graft cross-section area narrowing caused by neointima growth has led to a TAWSS increase of about 50% in this area.
Figure 11b shows the OSI distributions for the modes related to 18 and 28 months after bypass surgery. At first sight, the OSI distribution does not have any changes. However, increased OSI values are registered in the graft after 28 months compared to the model related to 18 months after bypass. In the neointima growth area, the OSI averaged over the wall NIH section were calculated. The OSI value has been evaluated as 0.15 for the model related to 18 months after bypass, and as 0.11 in the case of the 28-month model. Thus, the graft cross-section area narrowing of about 20% caused by neointima growth has led to an OSI decrease of about 25% in this area. It should be noted also that the neointima has grown in the graft downstream from the suture area, where areas of low and oscillatory wall shear stress were registered already at 18 months after bypass. These results once again confirm that the areas of low and oscillatory wall shear stress are “dangerous” areas in terms of the NIH risk.

4. Conclusions

For the first time, blood flow in proximal anastomosis for femoral-popliteal bypass by synthetic graft was studied numerically under varied, patient-specific, conditions. Analysis of time-dependent flow structure in six personalized models with different geometric and hydrodynamic parameters was carried out. It has been shown in particular that the CFA-to-graft branching angle has a decisive effect on velocity non-uniformities at the proximal anastomosis. If the branching angle exceeds a value of about 50°, the velocity maximum at the initial section of the graft is located close to the inner wall, whereas the velocity maximum is shifted to the external wall for the branching angle lower than 50°. The most complicated vortex flow structure, with a pronounced flow swirl within the graft is formed at the decreasing phase of flow rate. A correlation between TAWSS and OSI distributions has been revealed: high OSI values are observed in low TAWSS areas and vice versa. Areas of low and oscillatory wall shear stress were registered in the graft downstream from the suture for all six models. This peculiarity is especially pronounced in the case of the models with relatively low cycle-average inlet flow rates.
The impact of the vascular geometry changes with more time after bypass surgery on the blood flow characteristics was evaluated and demonstrated with an example of two models related to the same patient. In this case, the neointima has grown in the area with initially low and oscillatory wall shear stress. It has been revealed that the geometry changes due to the neointima growth for 10 months led to significant hemodynamic changes. In particular, the graft cross-section area narrowing by 20% led to a TAWSS increase of about 50% and an OSI decrease of about 25% in the area of growth. The patient-specific numerical simulation performed with the data of repeated follow-up after bypass surgery has confirmed and specified the assumption that neointima will grow inside the graft downstream from the suture area.
The developed technique for the postoperative study of changes in the geometry and hemodynamics of proximal anastomoses can be used to create a unique database for synthetic vascular prostheses overgrowth. This technique includes MSCT and US measurements of the anastomosis geometry, neointima thickness and time averaged velocity curves, followed by patient-oriented numerical computations of wall shear stresses distributions. Potentially, such a database could serve as a basis for establishing correlations between the thickness or growth rate of the neointima in proximal anastomoses and the parameters of the wall shear stress vector field. Such statistically significant correlations can be used in the development of the new vascular prostheses and its implantation techniques, as well as in the optimization and personalization of the bypass surgery postoperative management.

Author Contributions

Conceptualization, Y.I., A.Y. and E.S.; Data curation, G.K. and V.V.; Investigation, L.T., A.V., A.S. and A.M.; Methodology, L.T. and A.V.; Writing – original draft, Y.I.; Writing – review and editing, A.Y. and E.S. All authors have read and agreed to the published version of the manuscript.

Funding

This research was funded by the Russian Science Foundation, project No. 20-65-47018.

Institutional Review Board Statement

Not applicable.

Informed Consent Statement

Informed written consent was obtained from each patient prior to inclusion in the study. The patient consented to the operation, as well as to a postoperative examination. Patients were informed that the results of the study may be published in scientific journals and presented at medical meetings and can be made available for other researchers to use in other research projects, but that the information that directly identifies any person will not be used. The operation was performed according to the indications of the clinical recommendations of the Ministry of Health of the Russian Federation and did not differ from the standard procedure. Postoperative examination included standard multispiral computed tomography and ultrasound examination. No invasive methods were used. Thus, the study was conducted in accordance with the Helsinki Declaration and did not require passing through the Ethics Committee.

Data Availability Statement

The data presented in this study are available on request from the corresponding author.

Acknowledgments

Simulations were performed on the Polytechnic RSC Tornado cluster of the Polytechnic Supercomputer Center (http://www.scc.spbstu.ru, accessed on 1 September 2022).

Conflicts of Interest

The authors declare no conflict of interest.

References

  1. Herrington, W.; Lacey, B.; Sherliker, P.; Armitage, J.; Lewington, S. Epidemiology of atherosclerosis and the potential to reduce the global burden of atherothrombotic disease. Circ. Res. 2016, 118, 535–546. [Google Scholar] [CrossRef] [PubMed]
  2. Timmis, A.; Townsend, N.; Gale, C.P.; Torbica, A.; Lettino, M.; Petersen, S.E.; Mossialos, E.A.; Maggioni, A.P.; Kazakiewicz, D.; May, H.T.; et al. European society of cardiology: Cardiovascular disease statistics 2019. Eur. Heart J. 2020, 41, 12–85. [Google Scholar] [CrossRef]
  3. Bozkurt, A.K.; Tasci, I.; Tabak, O.; Gumus, M.; Kaplan, Y. Peripheral artery disease assessed by anklebrachial index in patients with established cardiovascular disease or at least one risk factor for atherothrombosis—CAREFUL Study: A national, multi-center, cross-sectional observational study. BMC Cardiovasc. Disord. 2011, 11, 4. [Google Scholar] [CrossRef]
  4. Dieter, R.S.; Chu, W.W.; John, P.; Pacanowski, J.P., Jr.; McBride, P.E.; Tanke, T.E. The significance of lower extremity peripheral arterial disease. Clin. Cardiol. 2002, 25, 3–10. [Google Scholar] [CrossRef] [PubMed]
  5. Shu, J.; Santulli, G. Update on peripheral artery disease: Epidemiology and evidence-based facts. Atherosclerosis 2018, 275, 379–381. [Google Scholar] [CrossRef] [PubMed]
  6. Poredos, P.; Poredos, P.; Jezovnik, M.K. Structure of atherosclerotic plaques in different vascular territories: Clinical relevance. Curr. Vasc. Pharmacol. 2018, 16, 125–129. [Google Scholar] [CrossRef] [PubMed]
  7. Poredos, P.; Cevc, M.; Blinc, A. Characteristics of atherosclerosis in femoropopliteal artery and its clinical relevance. Atherosclerosis 2021, 335, 31–40. [Google Scholar] [CrossRef]
  8. So, B.J.; Byun, S.J. Usefulness of PTFE graft in above-knee femoropopliteal artery bypass. J. Korean Surg. Soc. 2009, 77, 410–416. [Google Scholar] [CrossRef]
  9. Ambler, G.K.; Twine, C.P. Graft type for femoro-popliteal bypass surgery. Cochrane Database Syst. Rev. 2018, 2, 86. [Google Scholar] [CrossRef]
  10. Lemson, M.S.; Tordoir, J.H.M.; Daemen, M.J.A.P.; Kitslaar, P.J.E.H.M. Intimal hyperplasia in vascular grafts. Eur. J. Vasc Endovasc Surg 2000, 19, 336–350. [Google Scholar] [CrossRef] [Green Version]
  11. Subbotin, V.M. Analysis of arterial intimal hyperplasia: Review and hypothesis. Theor. Biol. Med. Model. 2007, 4, 41. [Google Scholar] [CrossRef] [PubMed]
  12. Li, l.; Terry, C.M.; Shiu, Y.-T.; Cheung, A.K. Neointimal hyperplasia associated with synthetic hemodialysis grafts. Kidney Int. 2008, 74, 1247–1261. [Google Scholar] [CrossRef]
  13. Krepkogorskiy, N.V.; Bulatov, D.G. Results of in situ femoropopliteal (tibial) bypass in patients with extended lower limbs arterial bed lesion and critical ischemia. Kazan. Meditsinskiy Zhurnal 2015, 96, 942–949. [Google Scholar] [CrossRef]
  14. Loth, F.; Jones, S.A.; Zarins, C.K.; Giddens, D.P.; Nassar, R.F.; Glagov, S.; Bassiouny, H.S. Relative contribution of wall shear stress and injury in experimental intimal thickening at PTFE end-to-side arterial anastomoses. J. Biomech. Eng. 2002, 124, 44–51. [Google Scholar] [CrossRef]
  15. Jackson, M.; Wood, N.B.; Zhao, S.; Augst, A.; Wolfe, J.H.; Gedroyc, W.M.W.; Hughes, A.D.; Thom, S.A.M.G.; Xu, X.Y. Low wall shear stress predicts subsequent development of wall hypertrophy in lower limb bypass grafts. Artery Res. 2009, 3, 32–38. [Google Scholar] [CrossRef] [PubMed]
  16. Himburg, H.A.; Grzybowski, D.M.; Hazel, A.L.; LaMack, J.A.; Li, X.-M.; Friedman, M.H. Spatial comparison between wall shear stress measures and porcine arterial endothelial permeability. Am. J. Physiol Heart Circ. Physiol 2003, 286, 1916–1922. [Google Scholar] [CrossRef] [PubMed]
  17. Hoogendoorn, A.; Kok, A.M.; Hartman, E.M.J.; de Nisco, G.; Casadonte, L.; Chiastra, C.; Coenen, A.; Korteland, S.-A.; Van der Heiden, K.; Gijsen, F.J.H.; et al. Multidirectional wall shear stress promotes advanced coronary plaque development: Comparing five shear stress metrics. Cardiovasc. Res. 2020, 116, 1136–1146. [Google Scholar] [CrossRef]
  18. Schlager, O.; Giurgea, A.; Margeta, C.; Seidinger, D.; Steiner-Boeker, S.; van der Loo, B.; Koppensteiner, R. Wall shear stress in the superficial femoral artery of healthy adults and its response to postural changes and exercise. Eur. J. Vasc Endovasc. Surg. 2011, 41, 821–827. [Google Scholar] [CrossRef]
  19. Desyatova, A.; MacTaggart, J.; Romarowski, R.; Poulson, W.; Conti, M.; Kamenskiy, A. Effect of aging on mechanical stresses, deformations, and hemodynamics in human femoropopliteal artery due to limb flexion. Biomech. Model. Mechanobiol. 2017, 17, 181–189. [Google Scholar] [CrossRef]
  20. Dolan, J.M.; Kolega, J.; Meng, H. High wall shear stress and spatial gradients in vascular pathology: A review. Ann. Biomed. Eng. 2012, 41, 1411–1427. [Google Scholar] [CrossRef]
  21. Colombo, M.; He, Y.; Corti, A.; Gallo, D.; Casarin, S.; Rozowsky, J.M.; Migliavacca, F.; Berceli, S.; Chiastra, C. Baseline local hemodynamics as predictor of lumen remodeling at 1-year follow-up in stented superficial femoral arteries. Sci. Rep. 2021, 11, 1613. [Google Scholar] [CrossRef] [PubMed]
  22. Li, X.; Liu, X.; Li, X.; Xu, L.; Chen, X.; Liang, F. Tortuosity of the superficial femoral artery and its influence on blood flow patterns and risk of atherosclerosis. Biomech. Model. Mechanobiol. 2019, 18, 883–896. [Google Scholar] [CrossRef] [PubMed]
  23. Gökgöl, C.; Diehm, N.; Räber, L.; Büchler, P. Prediction of restenosis based on hemodynamical markers in revascularized femoro-popliteal arteries during leg flexion. Biomech. Model. Mechanobiol. 2019, 18, 1883–1893. [Google Scholar] [CrossRef] [PubMed]
  24. Singh, J.; Brunner, G.; Morrisett, J.D.; Ballantyne, C.M.; Lumsden, A.B.; Shah, D.J.; Decuzzi, P. Patient-specific flow descriptors and normalised wall index in peripheral artery disease: A preliminary study. Comput. Methods Biomech. Biomed. Eng. Imaging Vis. 2016, 6, 119–127. [Google Scholar] [CrossRef] [PubMed]
  25. Xu, P.; Liu, X.; Song, Q.; Chen, G.; Wang, D.; Zhang, H.; Yan, L.; Liu, D.; Huang, W. Patient-specific structural effects on hemodynamics in the ischemic lower limb artery. Sci. Rep. 2016, 6, 39225. [Google Scholar] [CrossRef]
  26. Donadoni, F.; Pichardo-Almarza, C.; Bartlett, M.; Dardik, A.; Homer-Vanniasinkam, S.; Díaz-Zuccarini, V. Patient-specific, multi-scale modeling of neointimal hyperplasia in vein grafts. Front. Physiol. 2017, 8, 226. [Google Scholar] [CrossRef]
  27. Donadoni, F.; Bonfanti, M.; Pichardo-Almarza, C.; Homer-Vanniasinkam, S.; Dardik, A.; Díaz-Zuccarini, V. An in silico study of the influence of vessel wall deformation on neointimal hyperplasia progression in peripheral bypass grafts. Med. Eng. Phys. 2019, 74, 137–145. [Google Scholar] [CrossRef]
  28. Donadoni, F.; Pichardo-Almarza, C.; Homer-Vanniasinkam, S.; Dardik, A.; Díaz-Zuccarini, V. Multiscale, patient-specific computational fluid dynamics models predict formation of neointimal hyperplasia in saphenous vein grafts. J. Vasc. Surg. Cases Innov. Tech. 2020, 6, 292–306. [Google Scholar] [CrossRef]
Figure 1. (a) Scheme of femoral-popliteal bypass. (b) Scheme of blood flow in proximal anastomosis. Examples of (c) cross and (d) longitudinal images by multispiral computed tomography. Arrows indicate the blood flow direction.
Fluids 07 00314 g001
Figure 2. Geometric models based on MSCT data for six patients with femoral-popliteal bypass: right view (left) and front view (right). The common femoral artery (CFA) is marked in gray, the graft in blue and the deep femoral artery (DFA) in pink. Arrows indicate the blood flow direction.
Fluids 07 00314 g002
Figure 3. Scheme to the approach used for determination of the graft (yellow line) and neointima (red line) edges using MSCT and US images. The common femoral artery (CFA) is marked in gray, the graft in blue, the deep femoral artery (DFA) in pink and neointima in dark gray. Auxiliary curves are marked as 1 and 2.
Fluids 07 00314 g003
Figure 4. An example of computational grids and inlet boundary conditions used in CFD simulation.
Fluids 07 00314 g004
Figure 5. Distributions of (a) TAWSS and (b) OSI computed for patient-specific model 2 with different numerical resolutions.
Fluids 07 00314 g005
Figure 6. Velocity distributions in cross sections of six proximal anastomosis models at the instance of maximum flow. Arrows indicate the blood flow direction.
Fluids 07 00314 g006
Figure 7. 3D streamlines at the instance of maximum flow. Arrows indicate the blood flow direction.
Fluids 07 00314 g007
Figure 8. Streamlines at four time instances for the model 2 case: increasing, maximum, decreasing and reverse flow. Arrows indicate the blood flow direction.
Fluids 07 00314 g008
Figure 9. Time-average wall shear stress distributions.
Fluids 07 00314 g009
Figure 10. Oscillatory shear index distributions.
Fluids 07 00314 g010
Figure 11. (a) TAWSS and (b) OSI distributions for the models related to 18 and 28 months after bypass surgery. Arrows indicate the blood flow direction.
Fluids 07 00314 g011
Table 1. Parameters of the considered models.
∆t,
month
DCFA,
mm
Dgraft/DCFAα, °QCFA,
mL/min
Qgraft/QCFAReCFAmaxWoCFA
1128.21.0458230.5292012.6
2287.41.2355160.7203011.4
3306.81.3853700.5158010.4
4186.41.7553280.914909.8
5145.51.7453130.616508.4
646.81.01501090.947010.4
Publisher’s Note: MDPI stays neutral with regard to jurisdictional claims in published maps and institutional affiliations.

