
A Wavelet-Based Adaptive Finite Element Method for the Stokes Problems


Abstract
:1. Introduction
2. Governing Equations
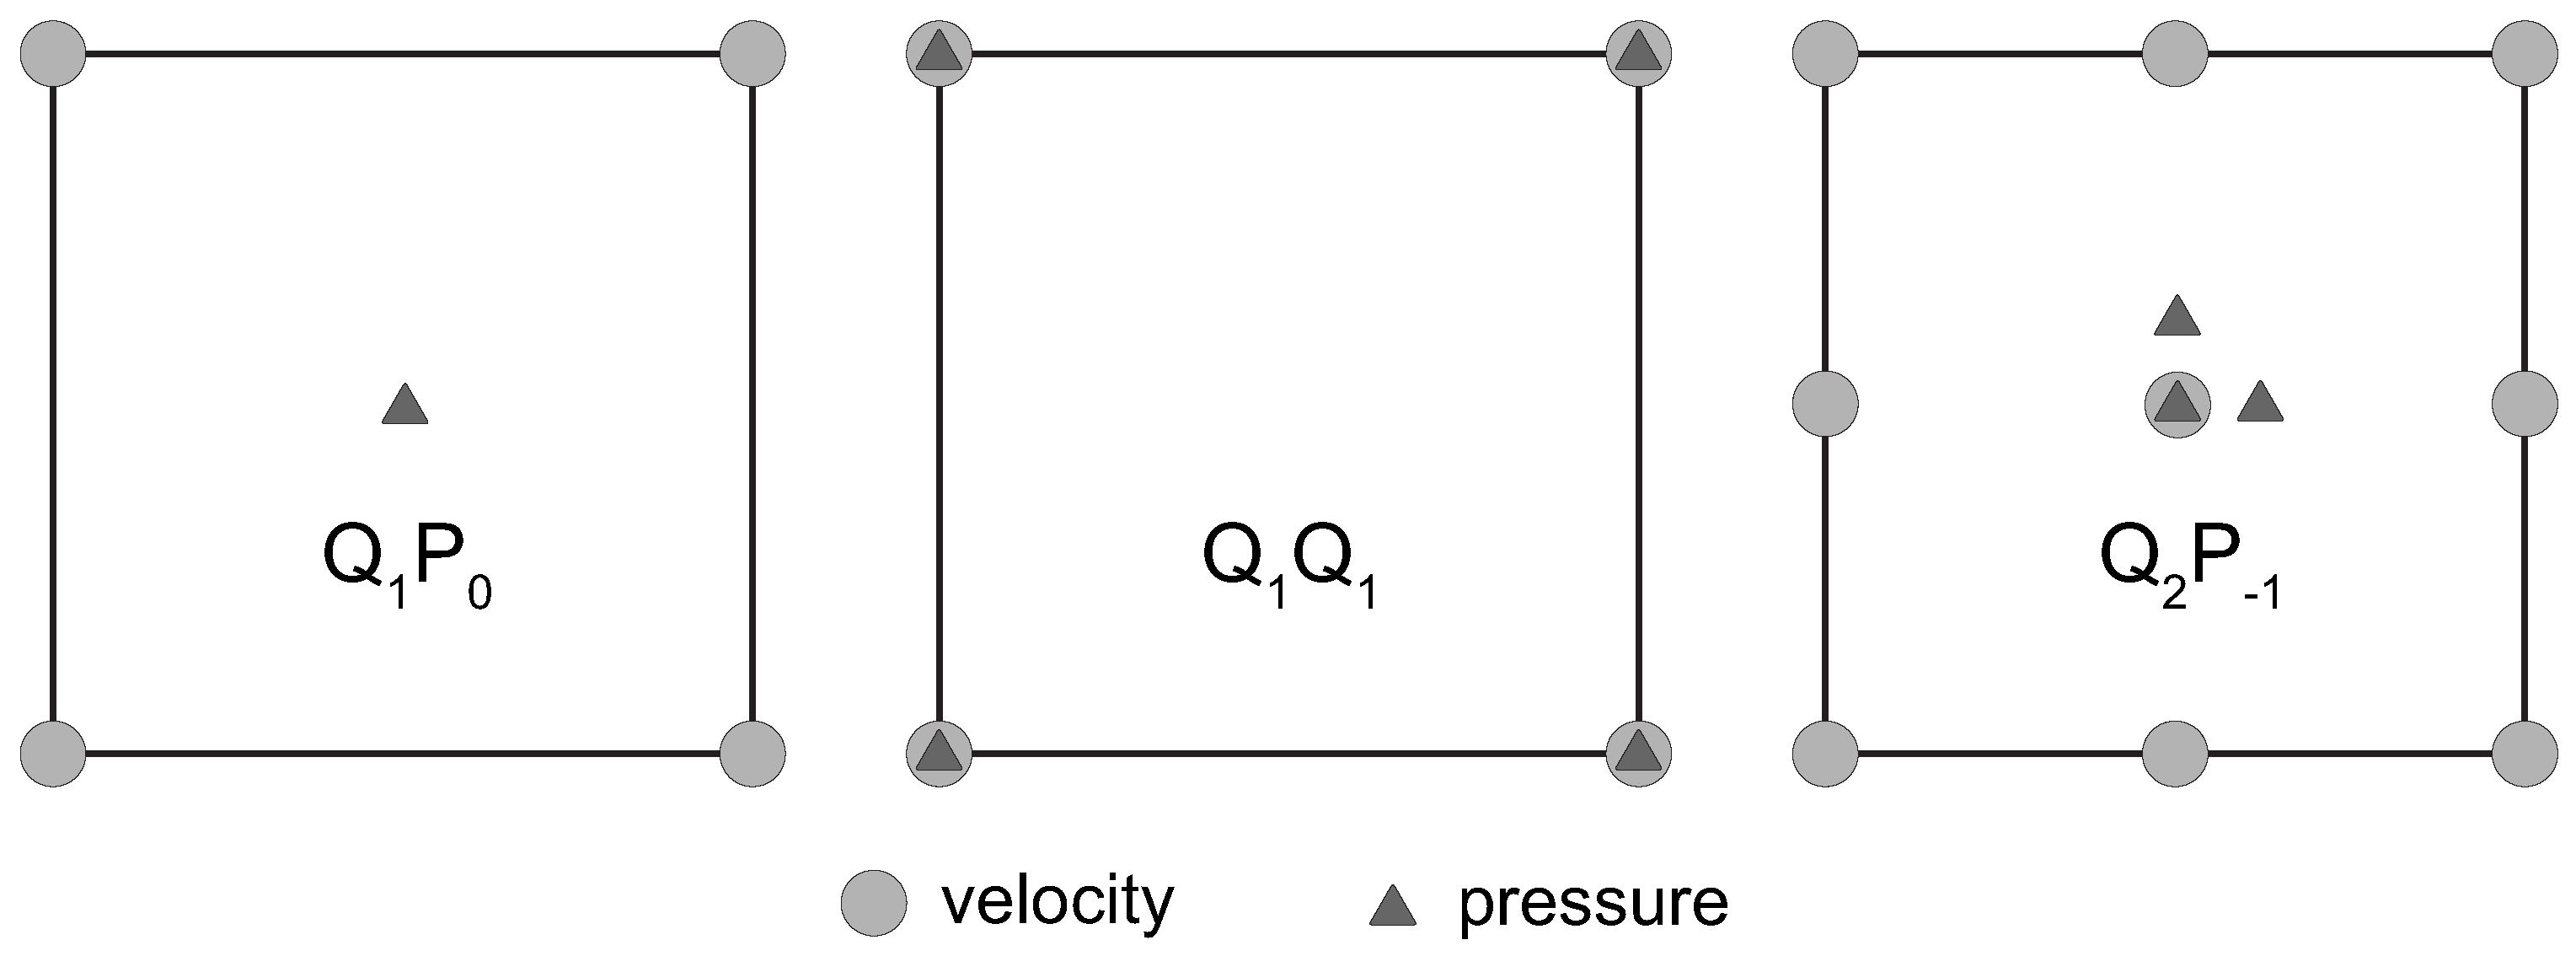
3. Finite Element Discretization of the Stokes System
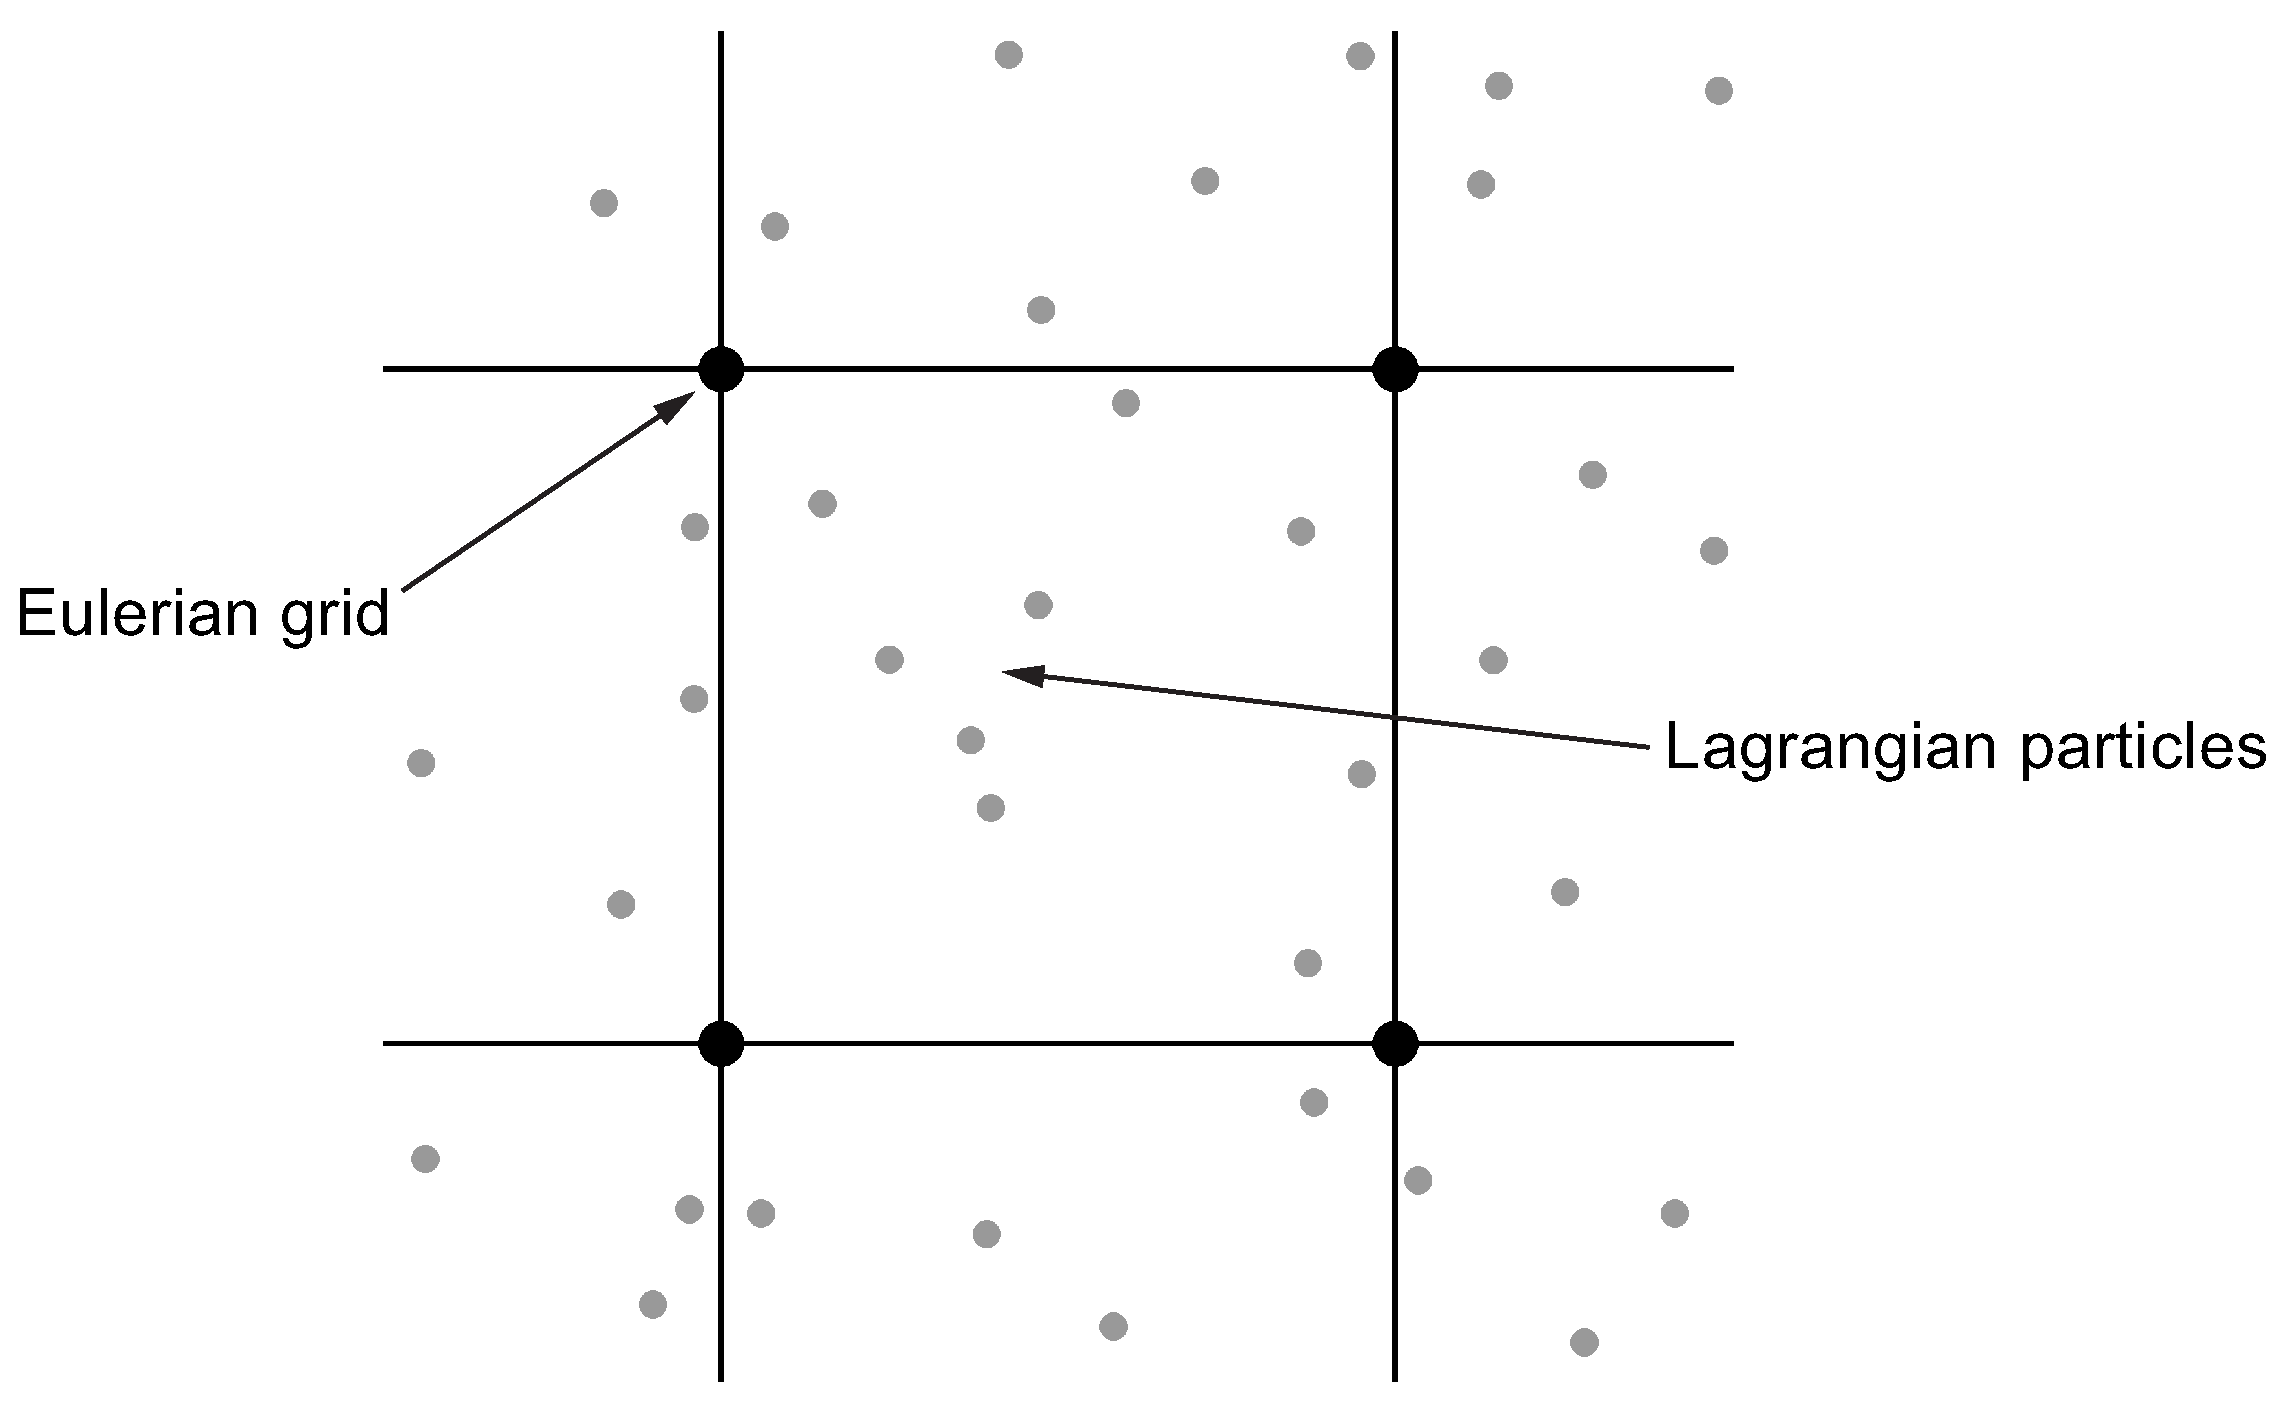
4. Particle-In-Cell Simulation Methodology
- Interpolation of physical properties from Lagrangian particles to Eulerian grid.
- Assemblage of the Stokes system using interpolated physical properties.
- Solution of the system on an Eulerian grid (see Section 3).
- Interpolation of computed velocities to Lagrangian particles positions.
- Particles advection using the interpolated velocities.
5. Wavelet-Based Grid Adaptation
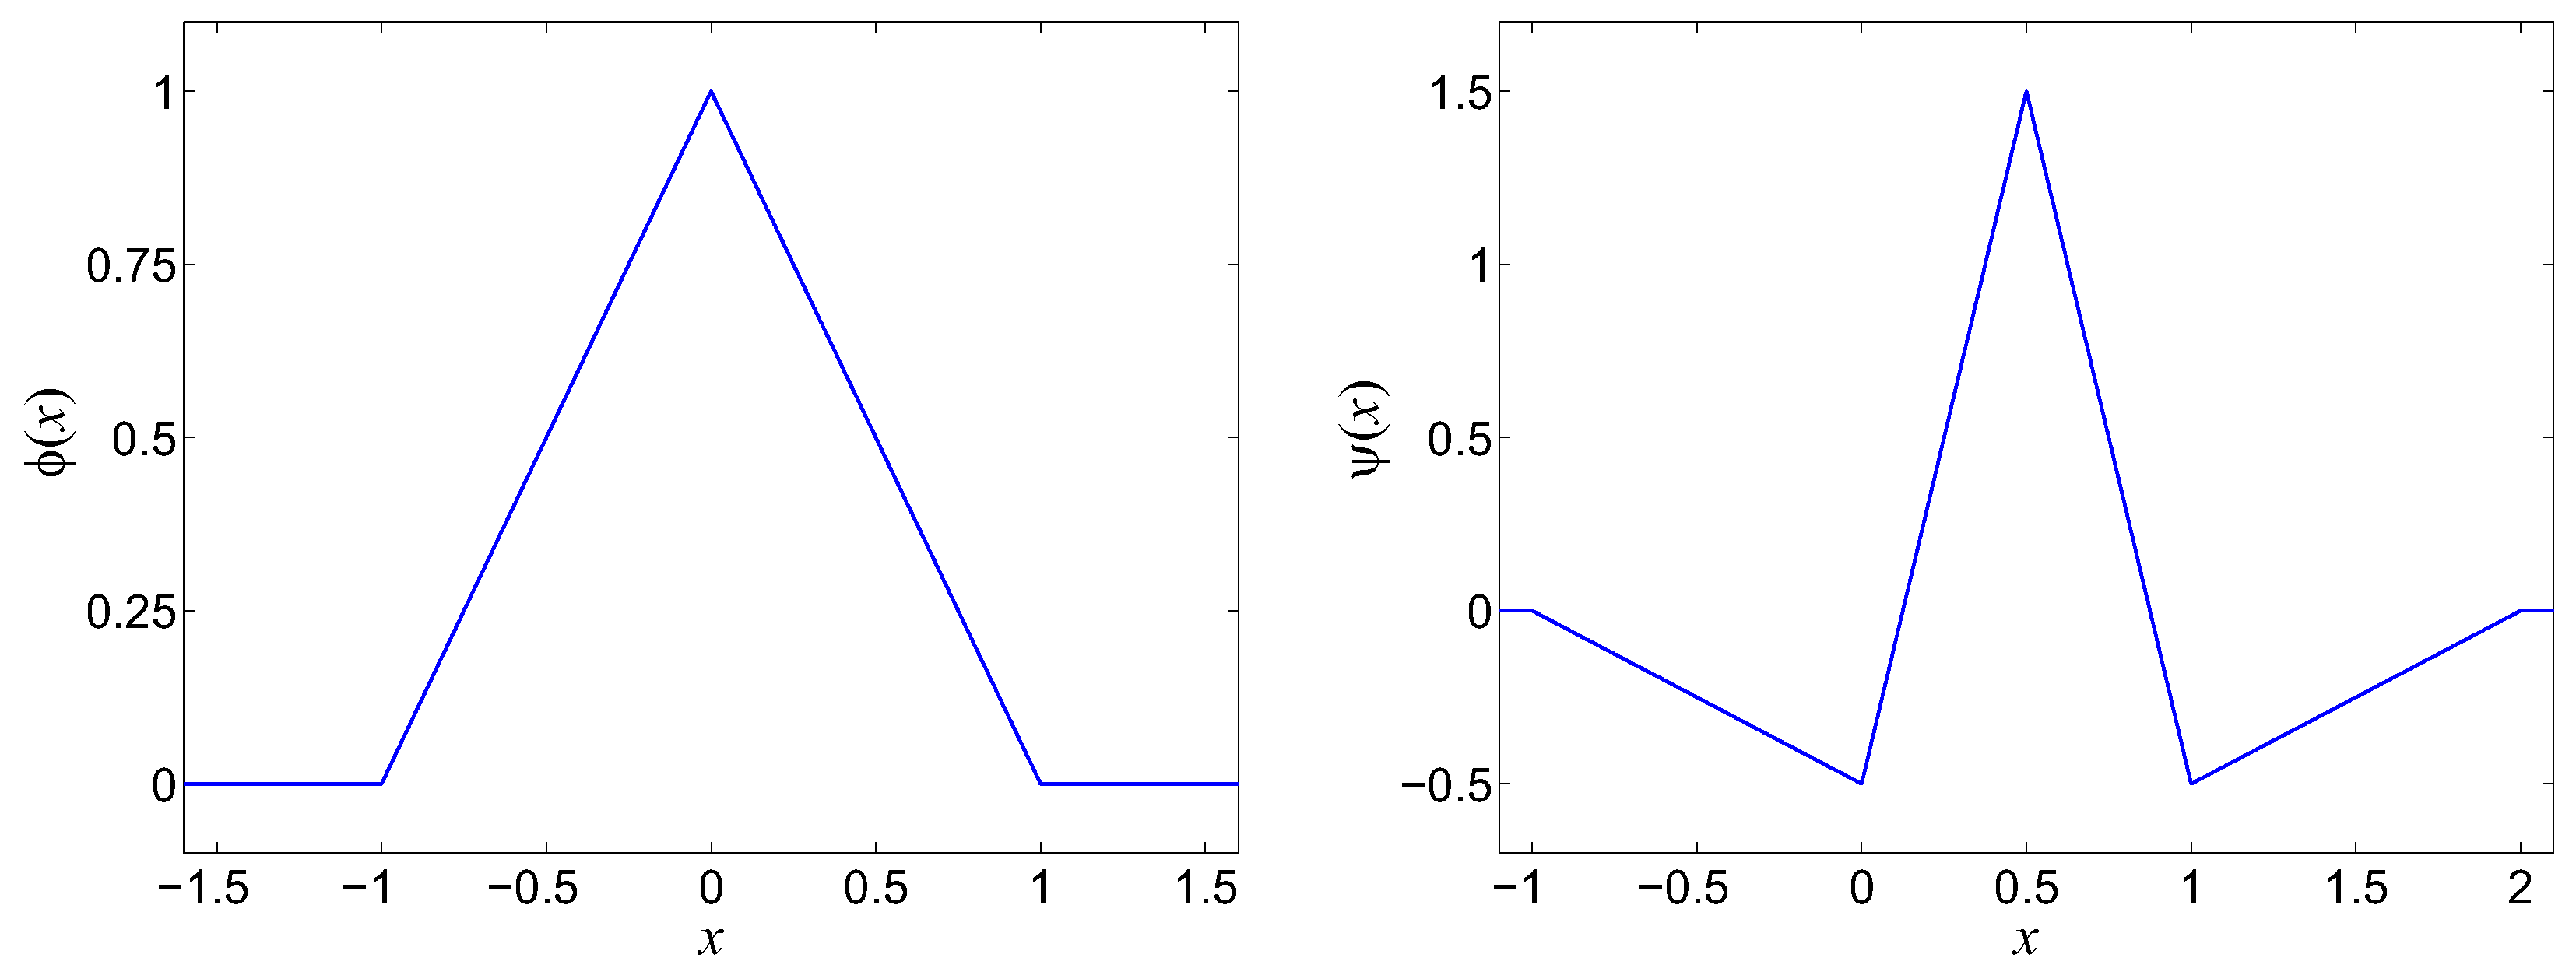
5.1. Linear Interpolating Wavelet Transform
5.2. Grid Adaptation Algorithm
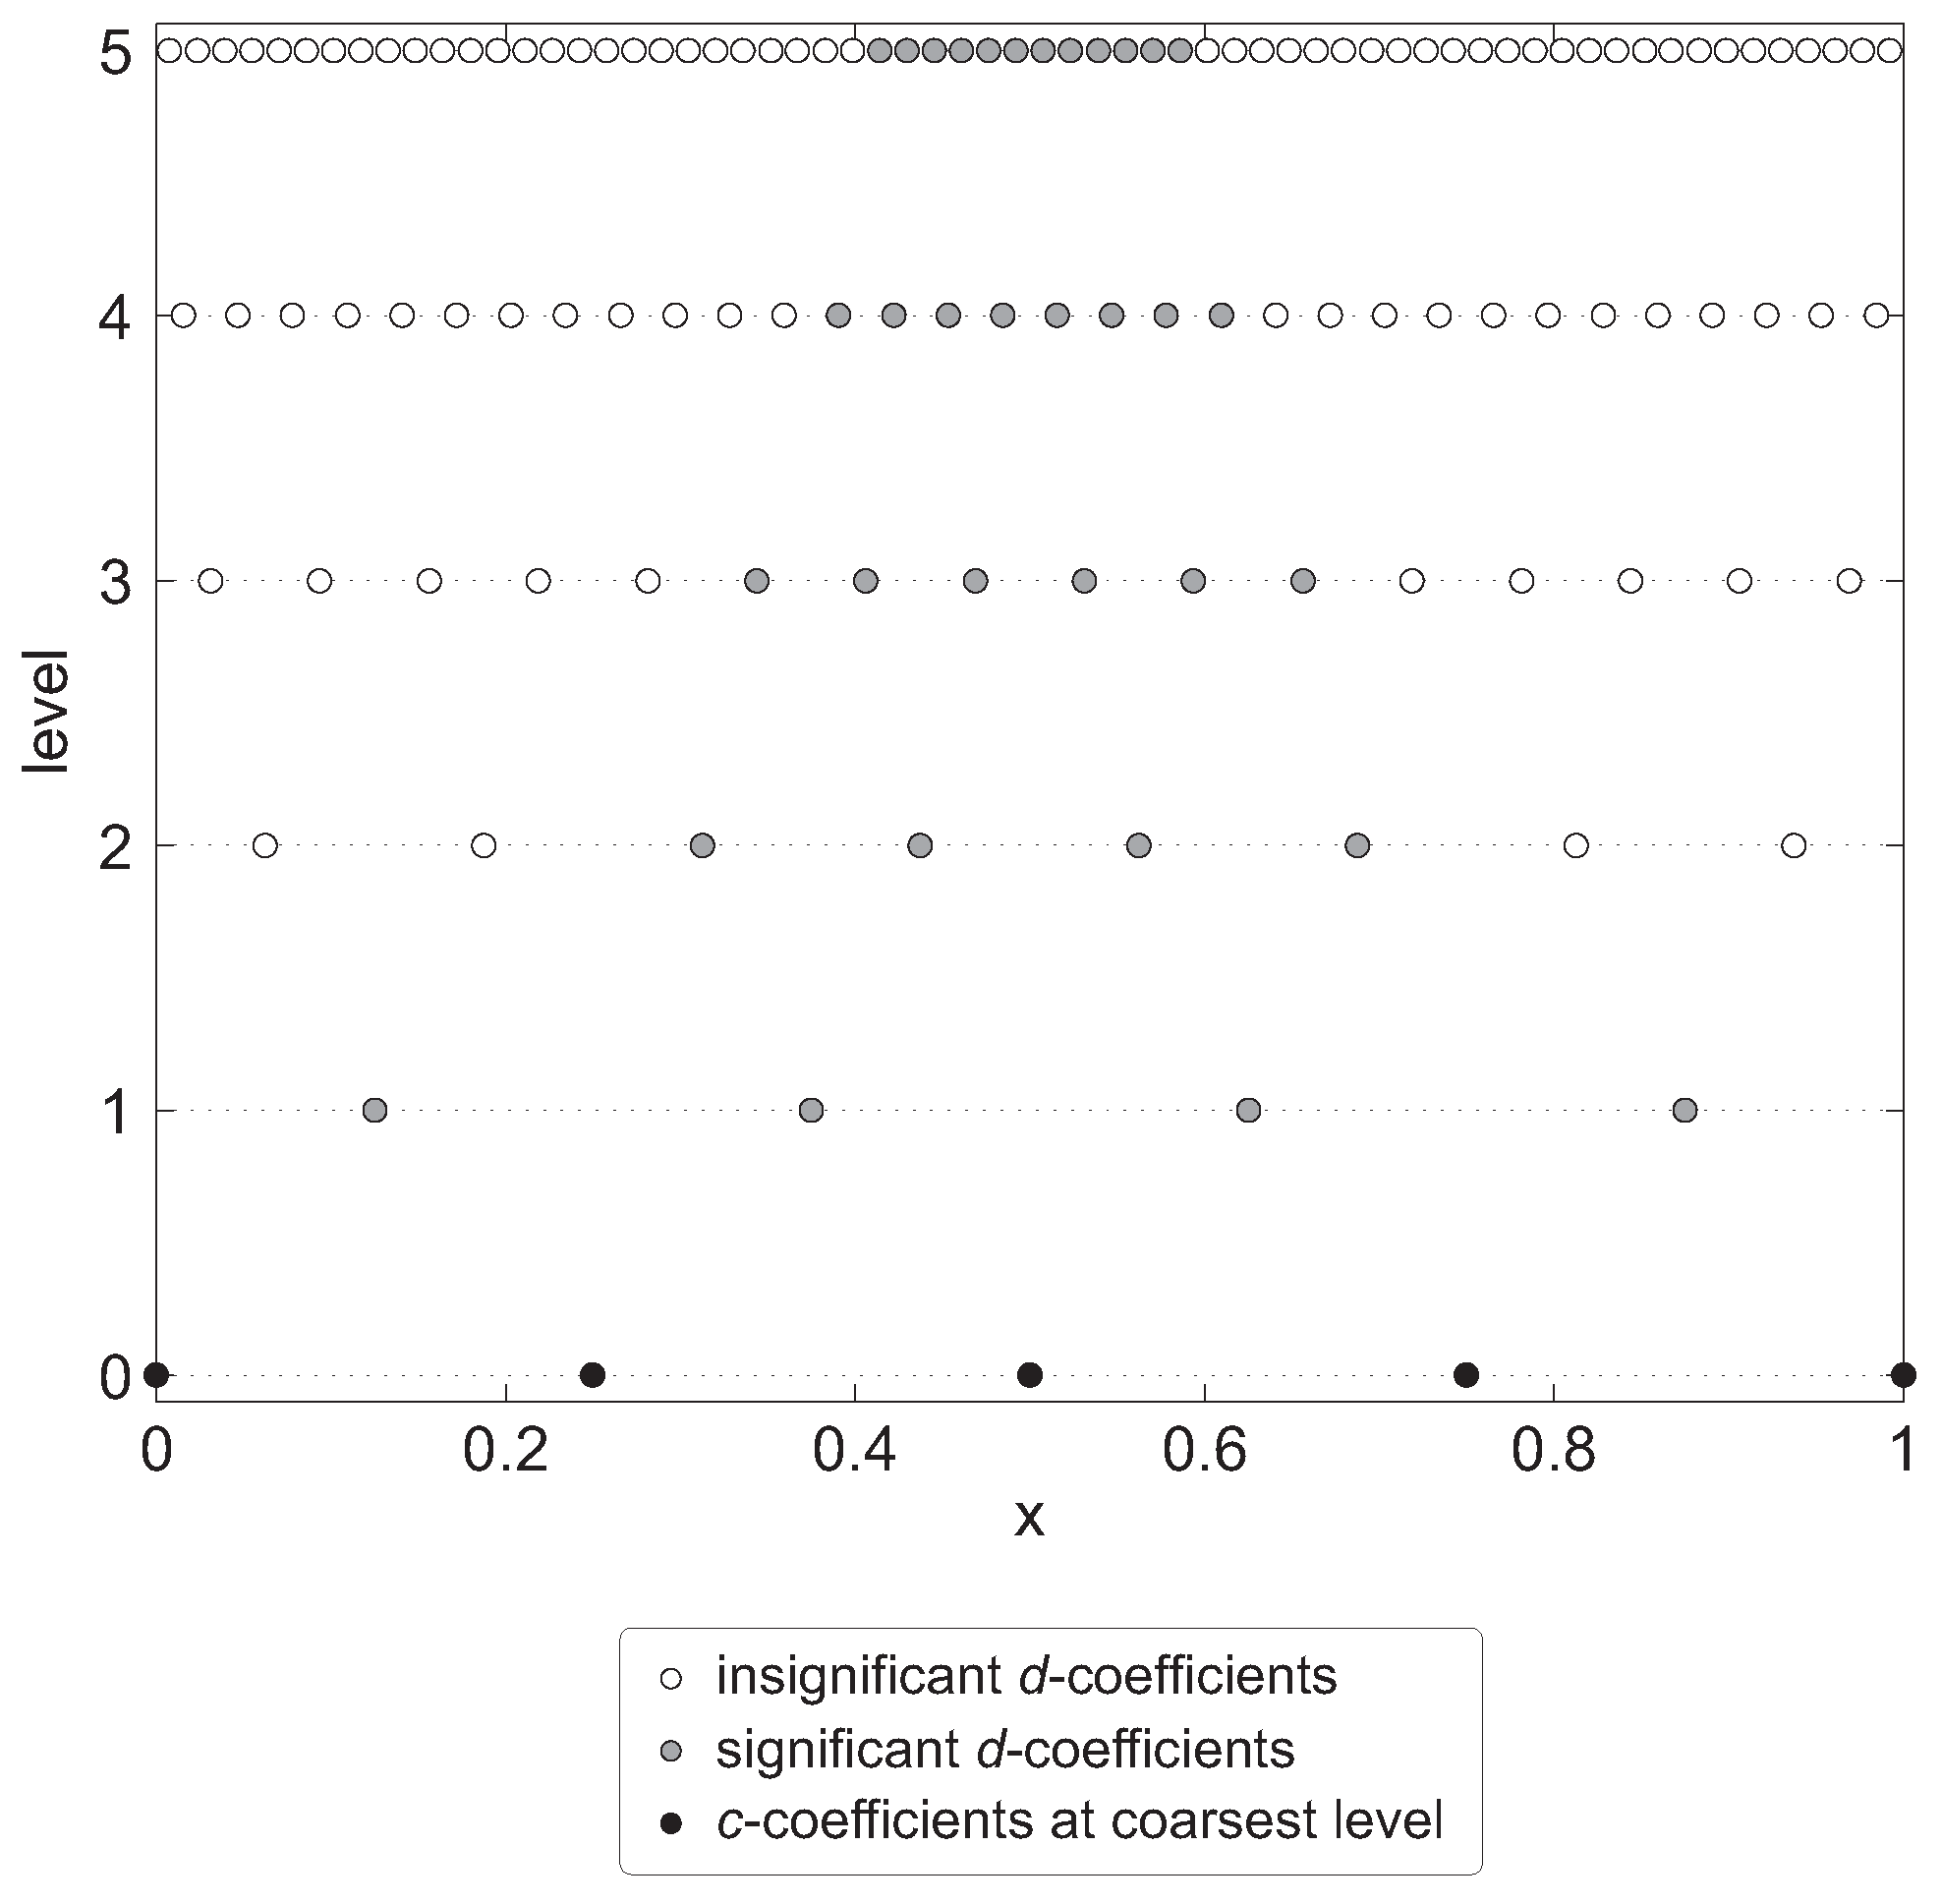
- Perform the forward wavelet transform of a physical field which is considered as an adaptation criterion and get all and coefficients. If a physical property field is defined on Lagrangian particles, the interpolation from particles to grid nodes is performed first.
- Analyze wavelet coefficients at all levels and create a mask containing grid nodes associated with significant .
- Include into the mask all grid nodes from the coarsest level, i.e. associated with coefficients .
- Extend the mask with grid nodes associated with adjacent to significant . This is to ensure that the mask includes all nodes whose coefficients can potentially become significant at the next simulation time step.
- Apply recursively the reconstruction check procedure to the mask . This is to guarantee that all wavelet coefficients necessary to perform the forward transform at the next time step will be available.
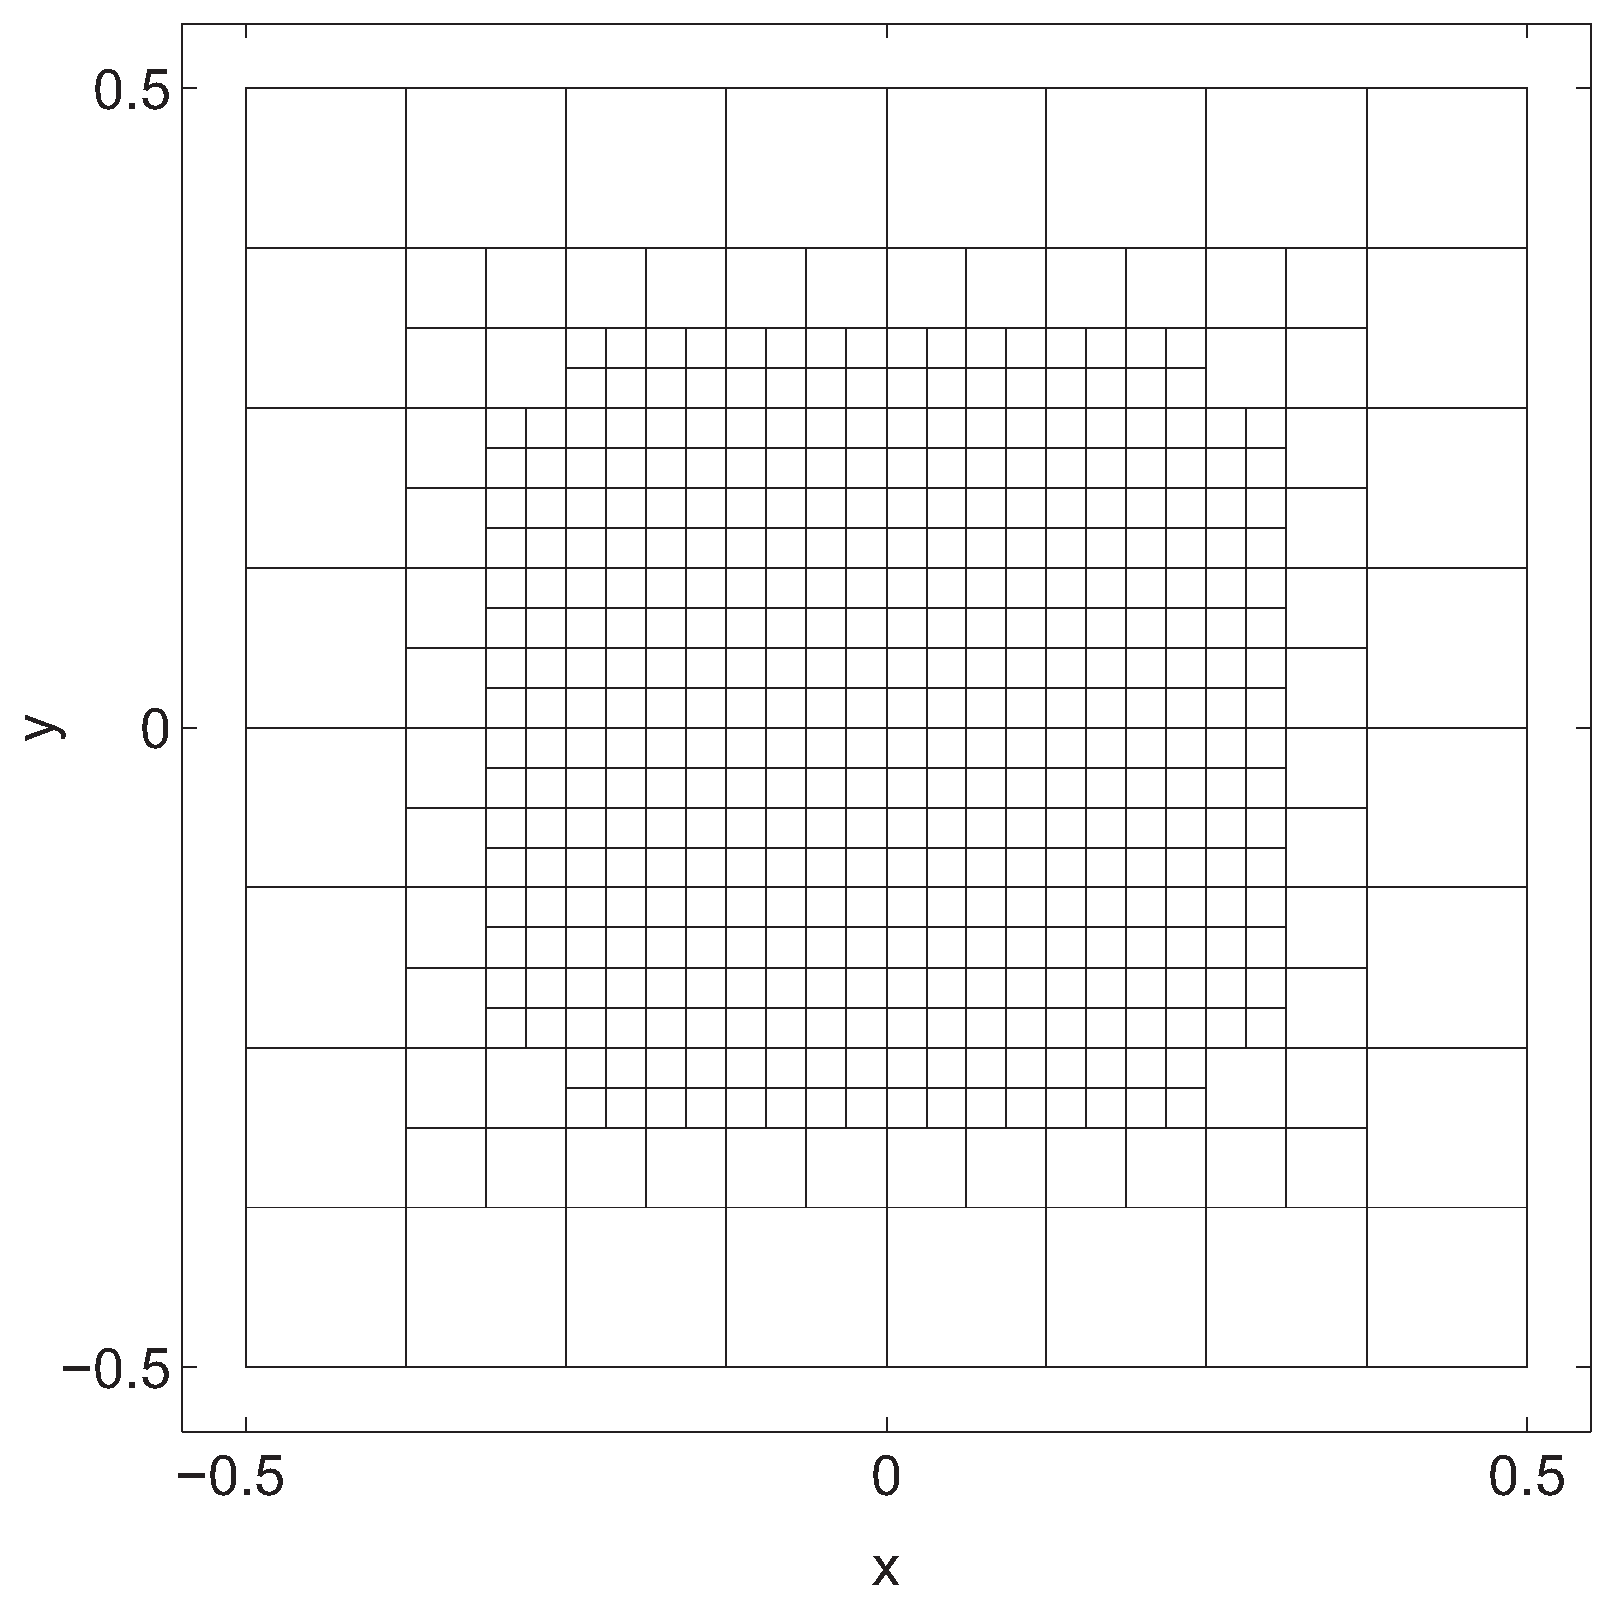
- Using the adapted mask , construct a new multilevel finite element grid.
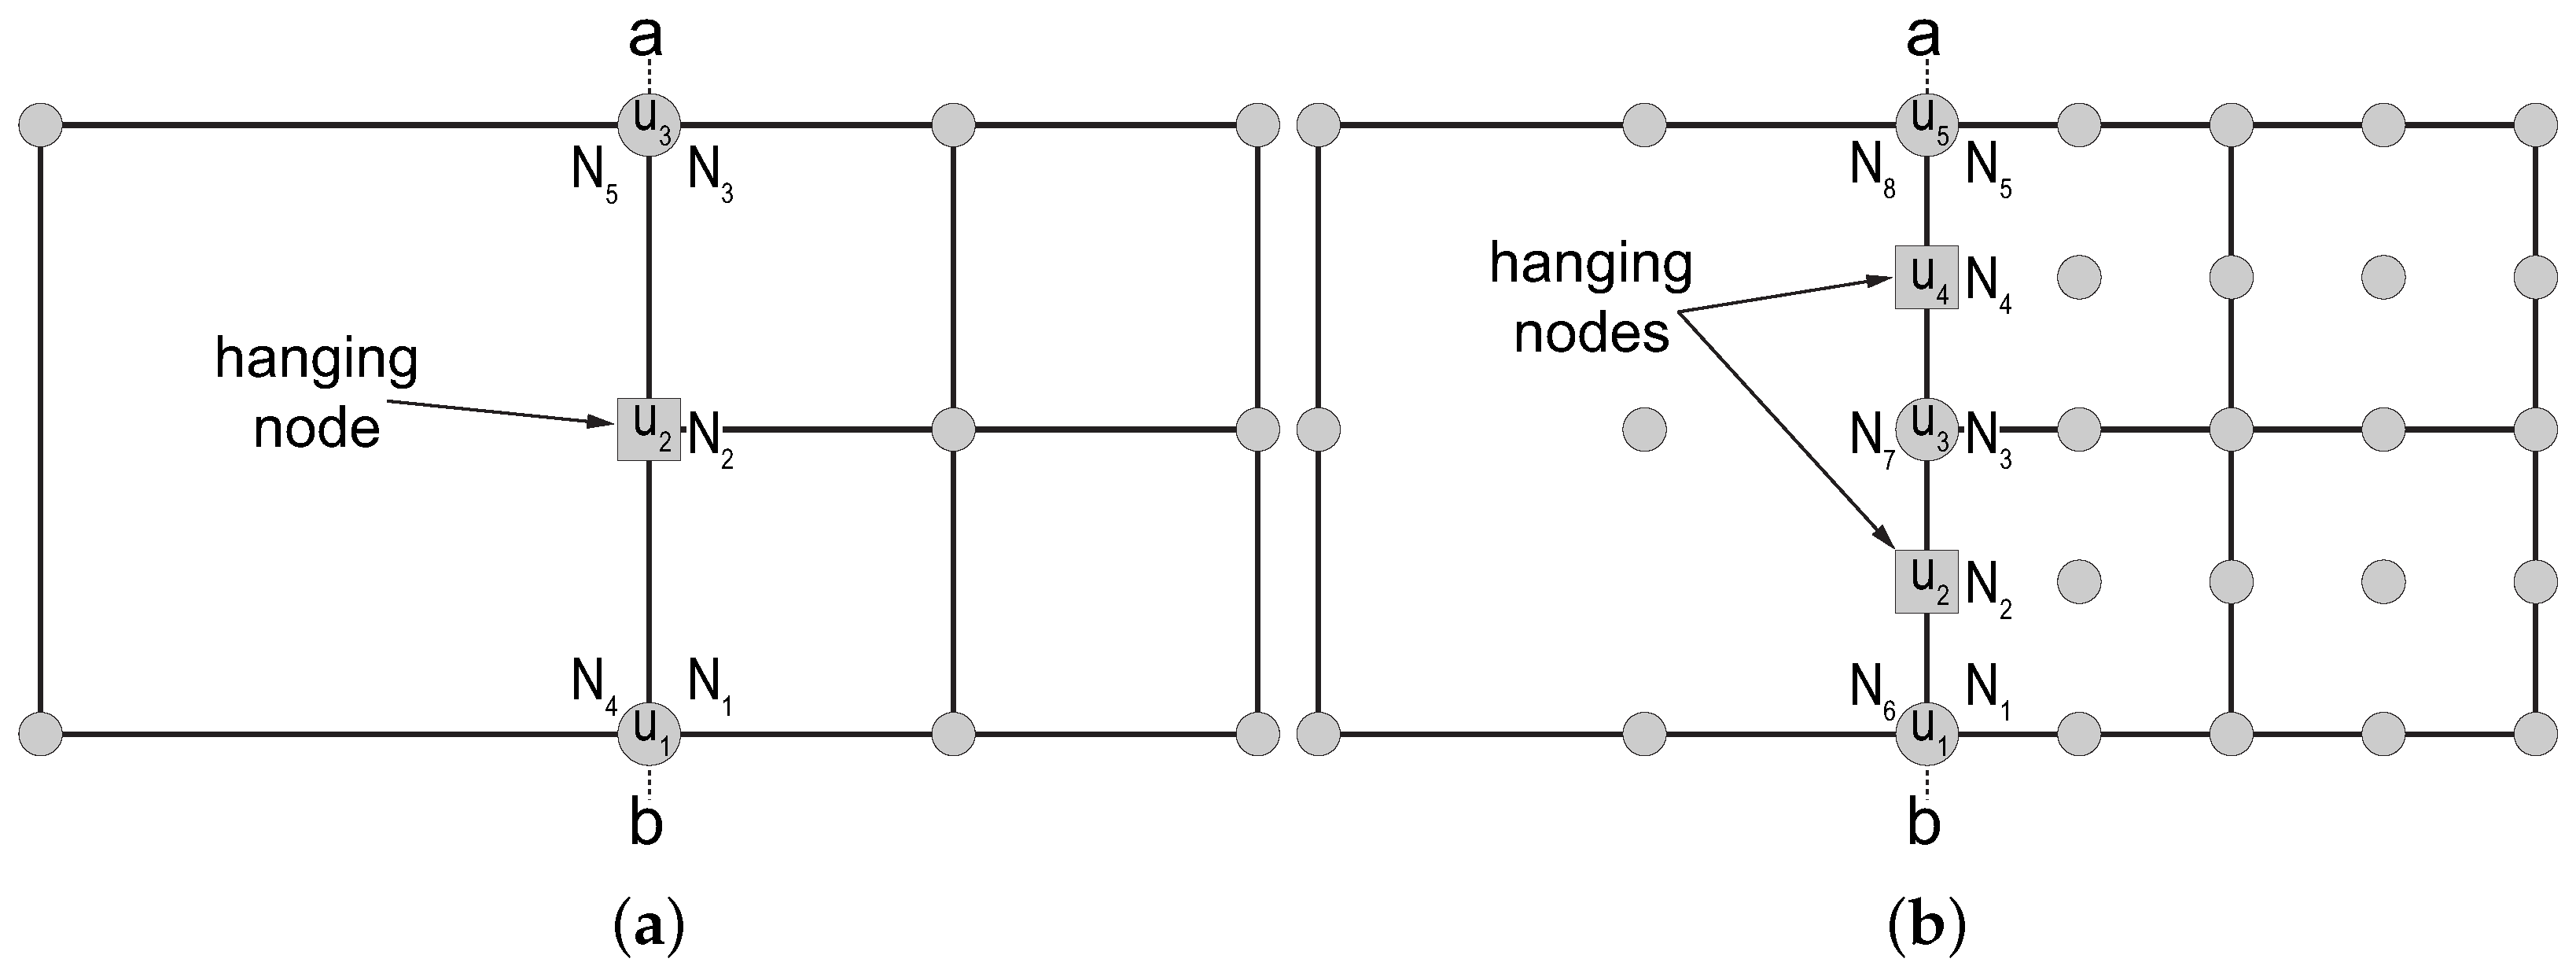
6. Dealing with Hanging Nodes
7. Implementation Aspects
8. Numerical Benchmarks
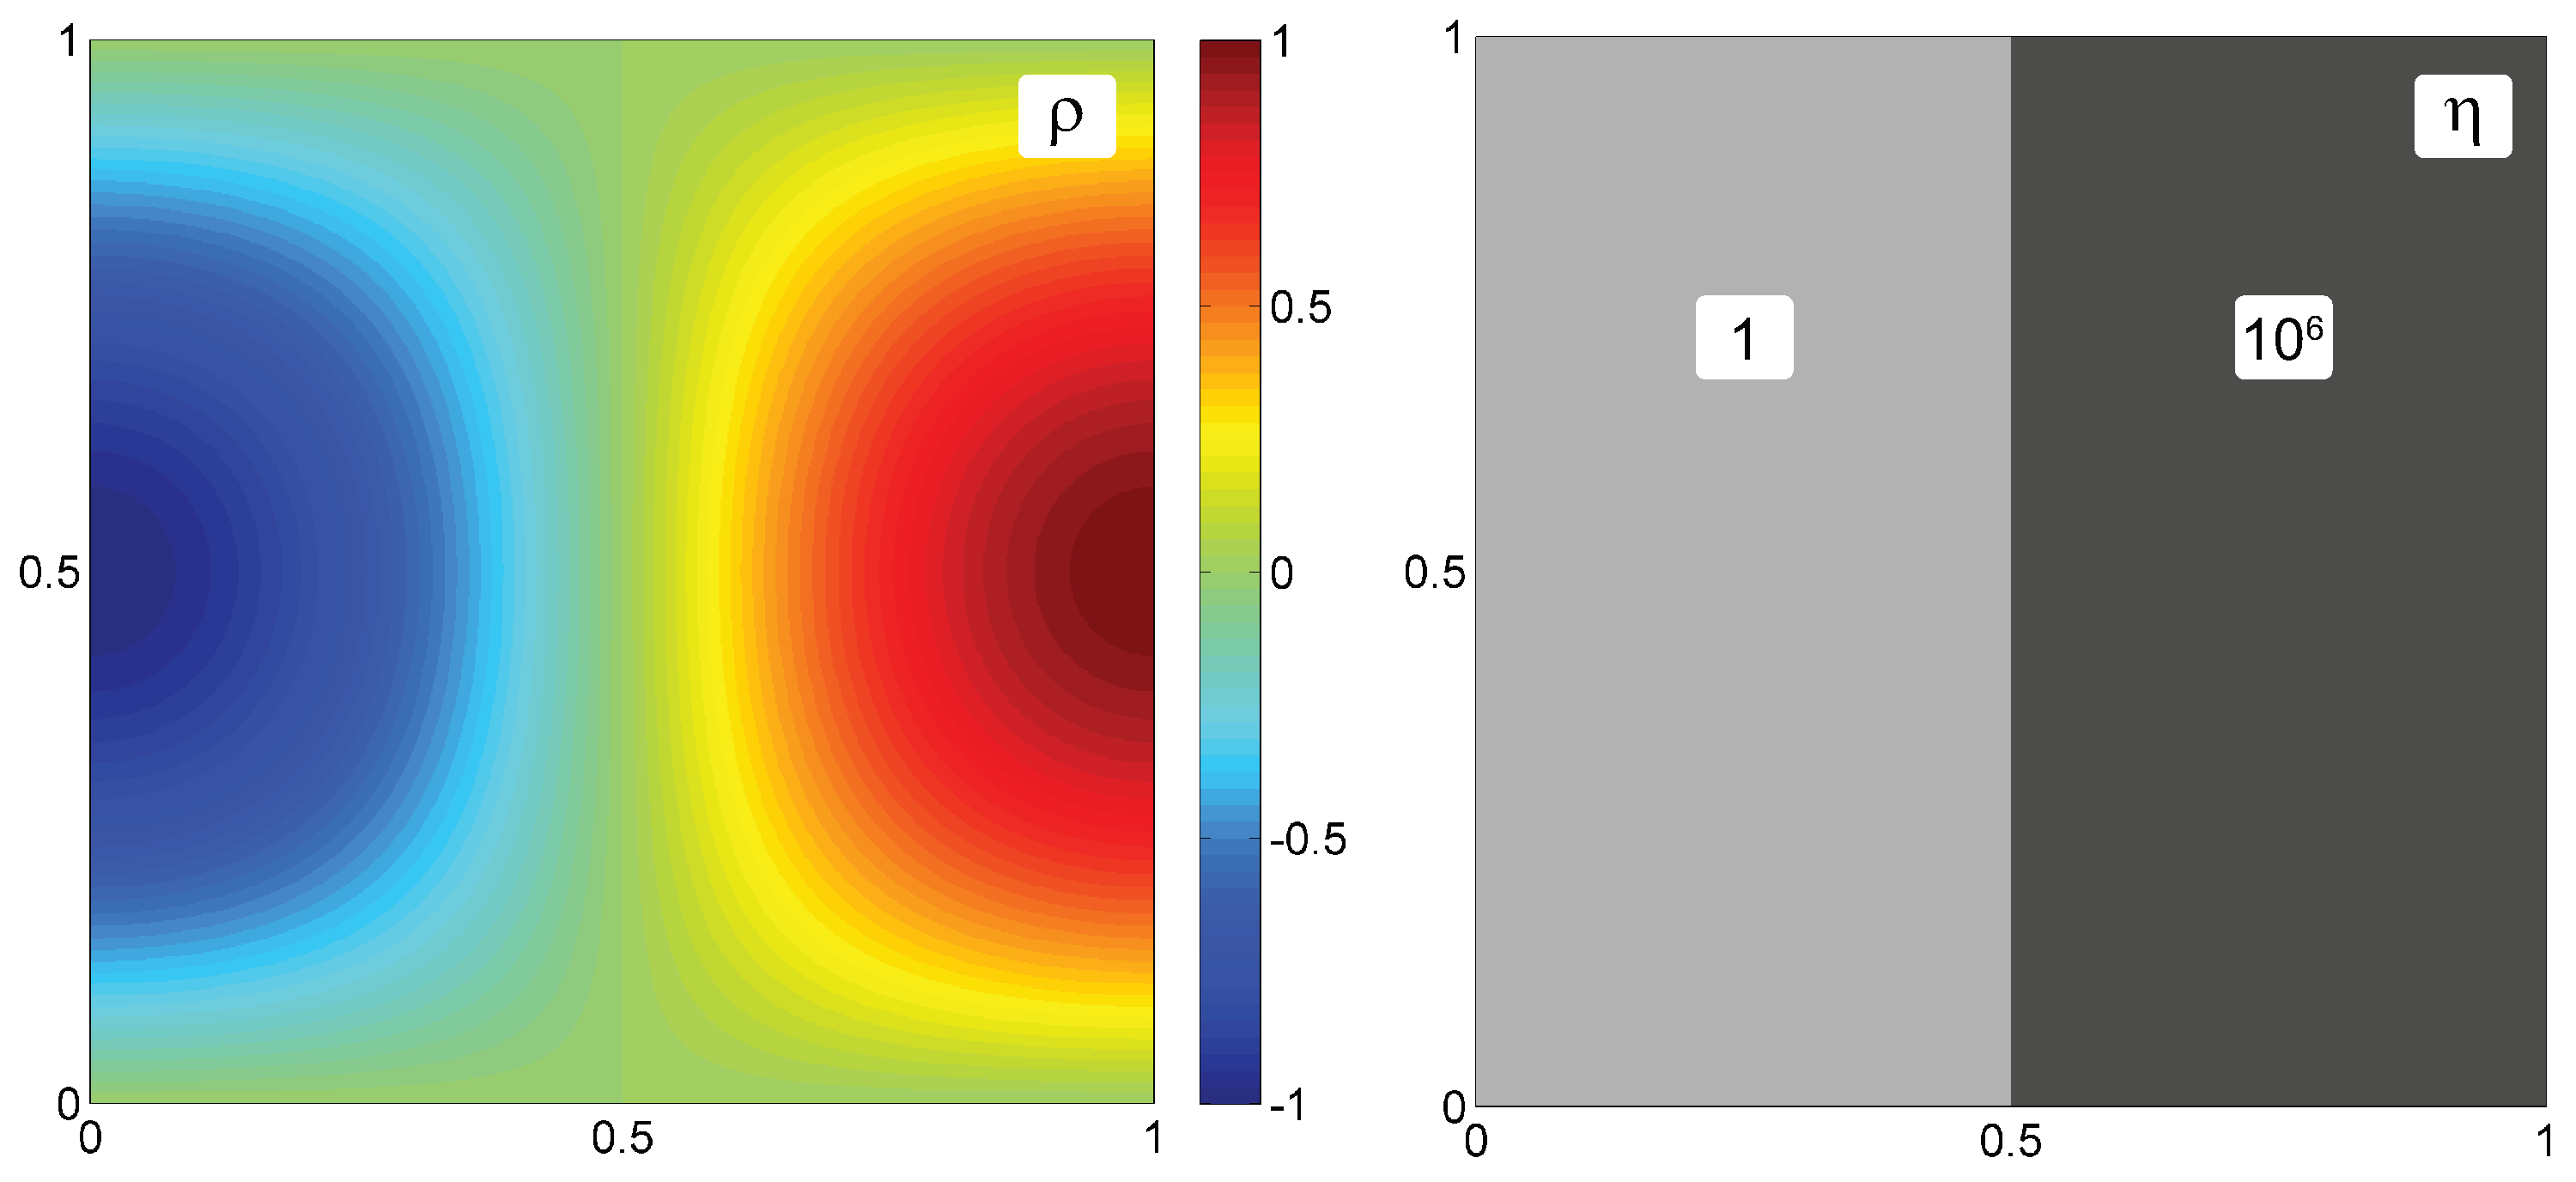
8.1. Lateral Viscosity Variation Benchmark
8.1.1. Setup and Parameters
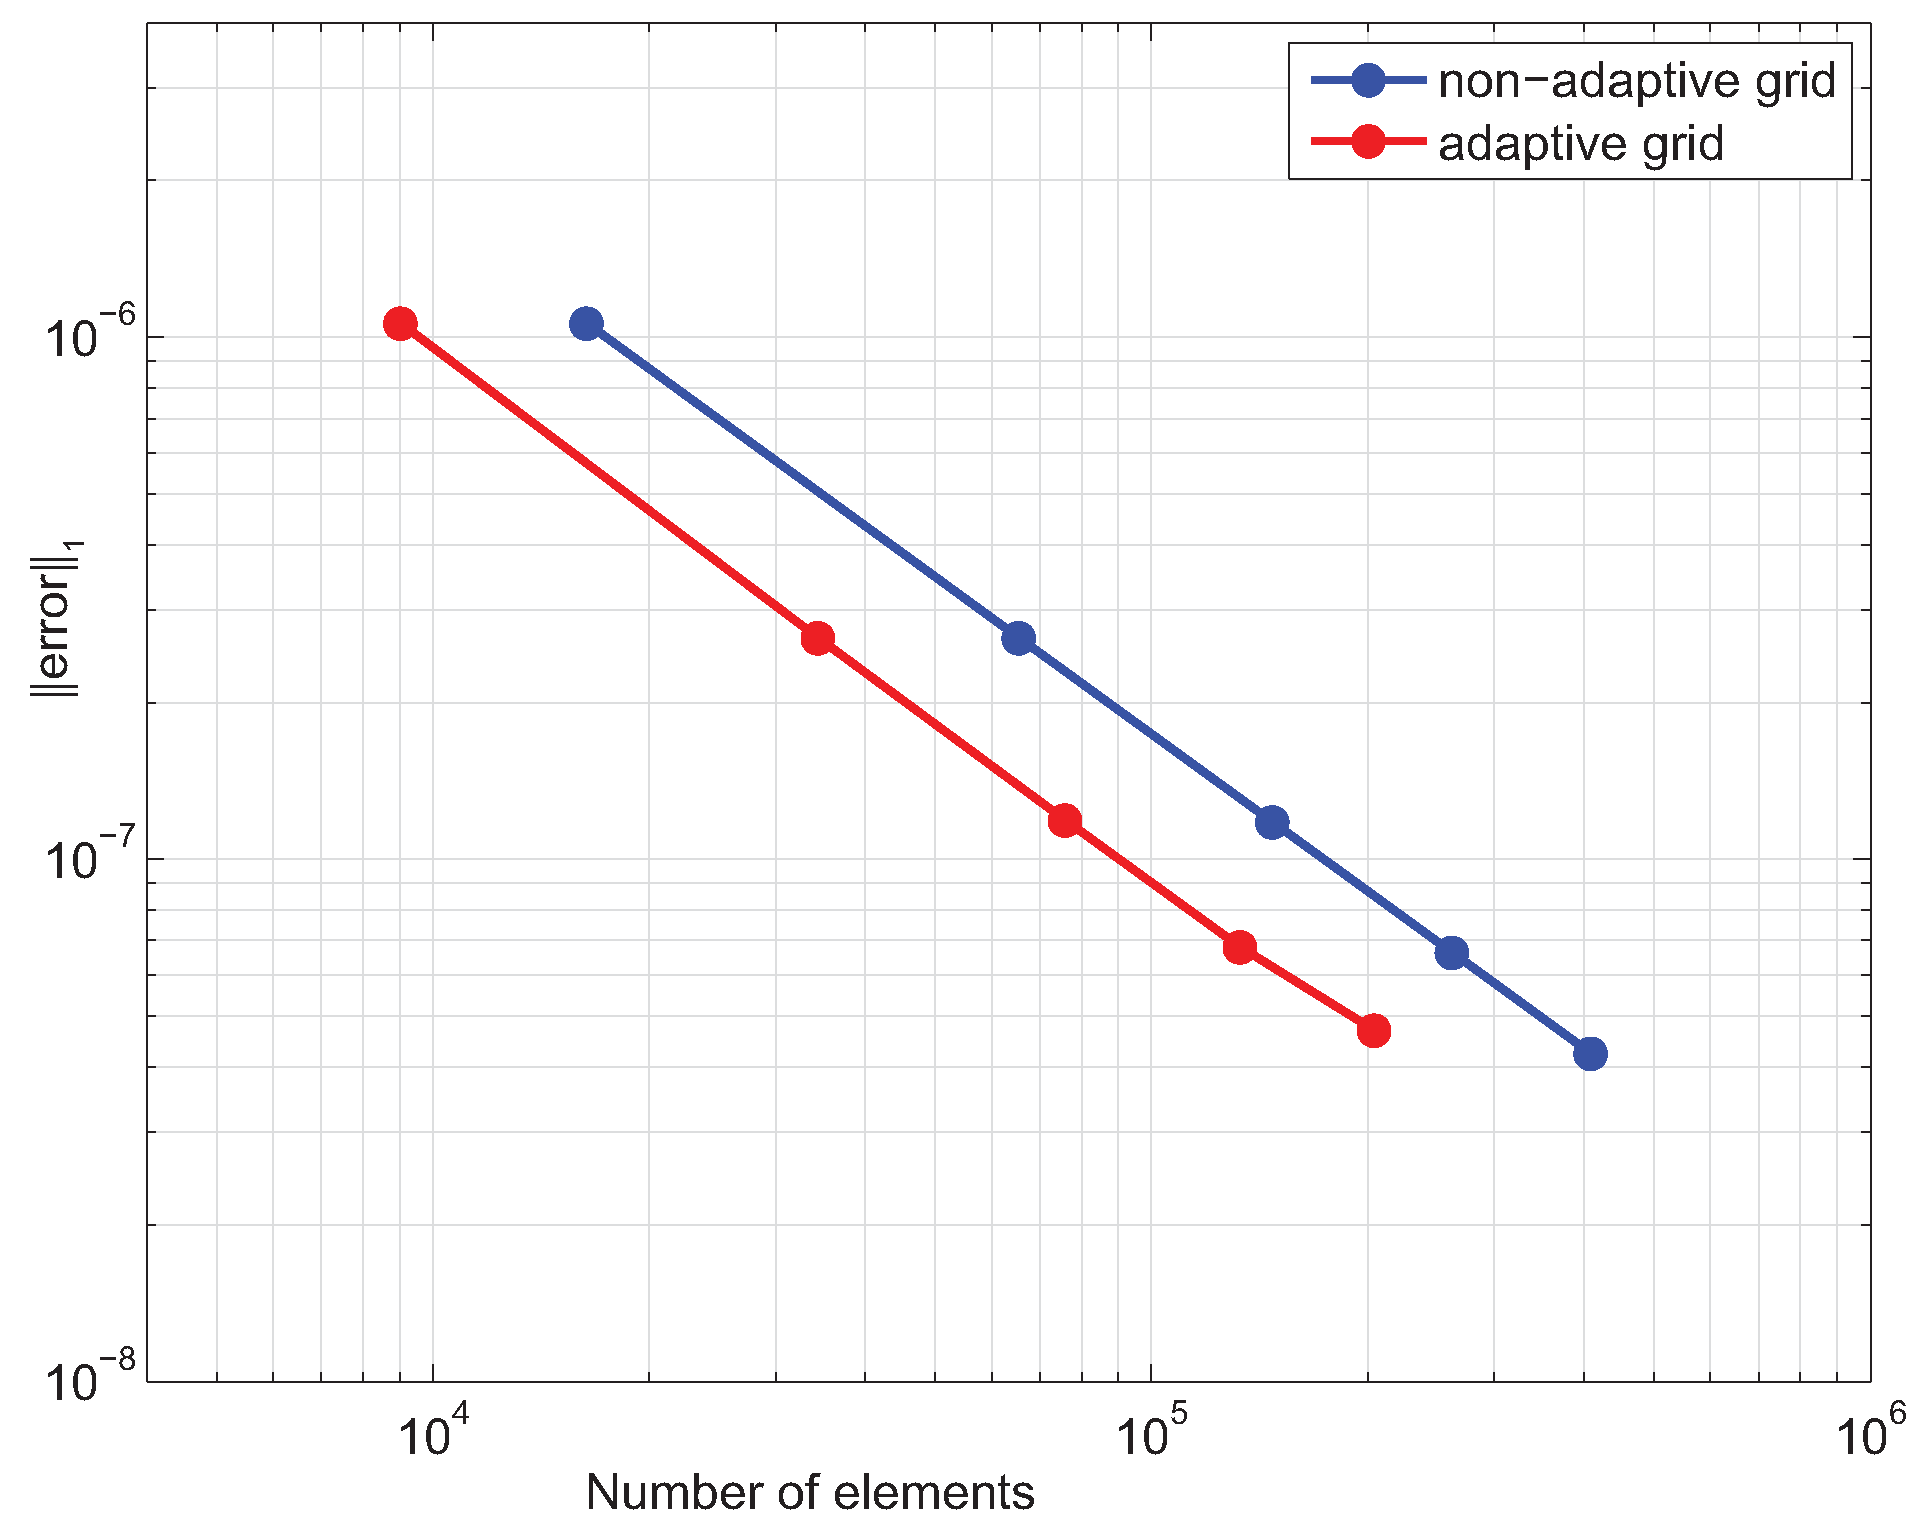
8.1.2. Convergence Test
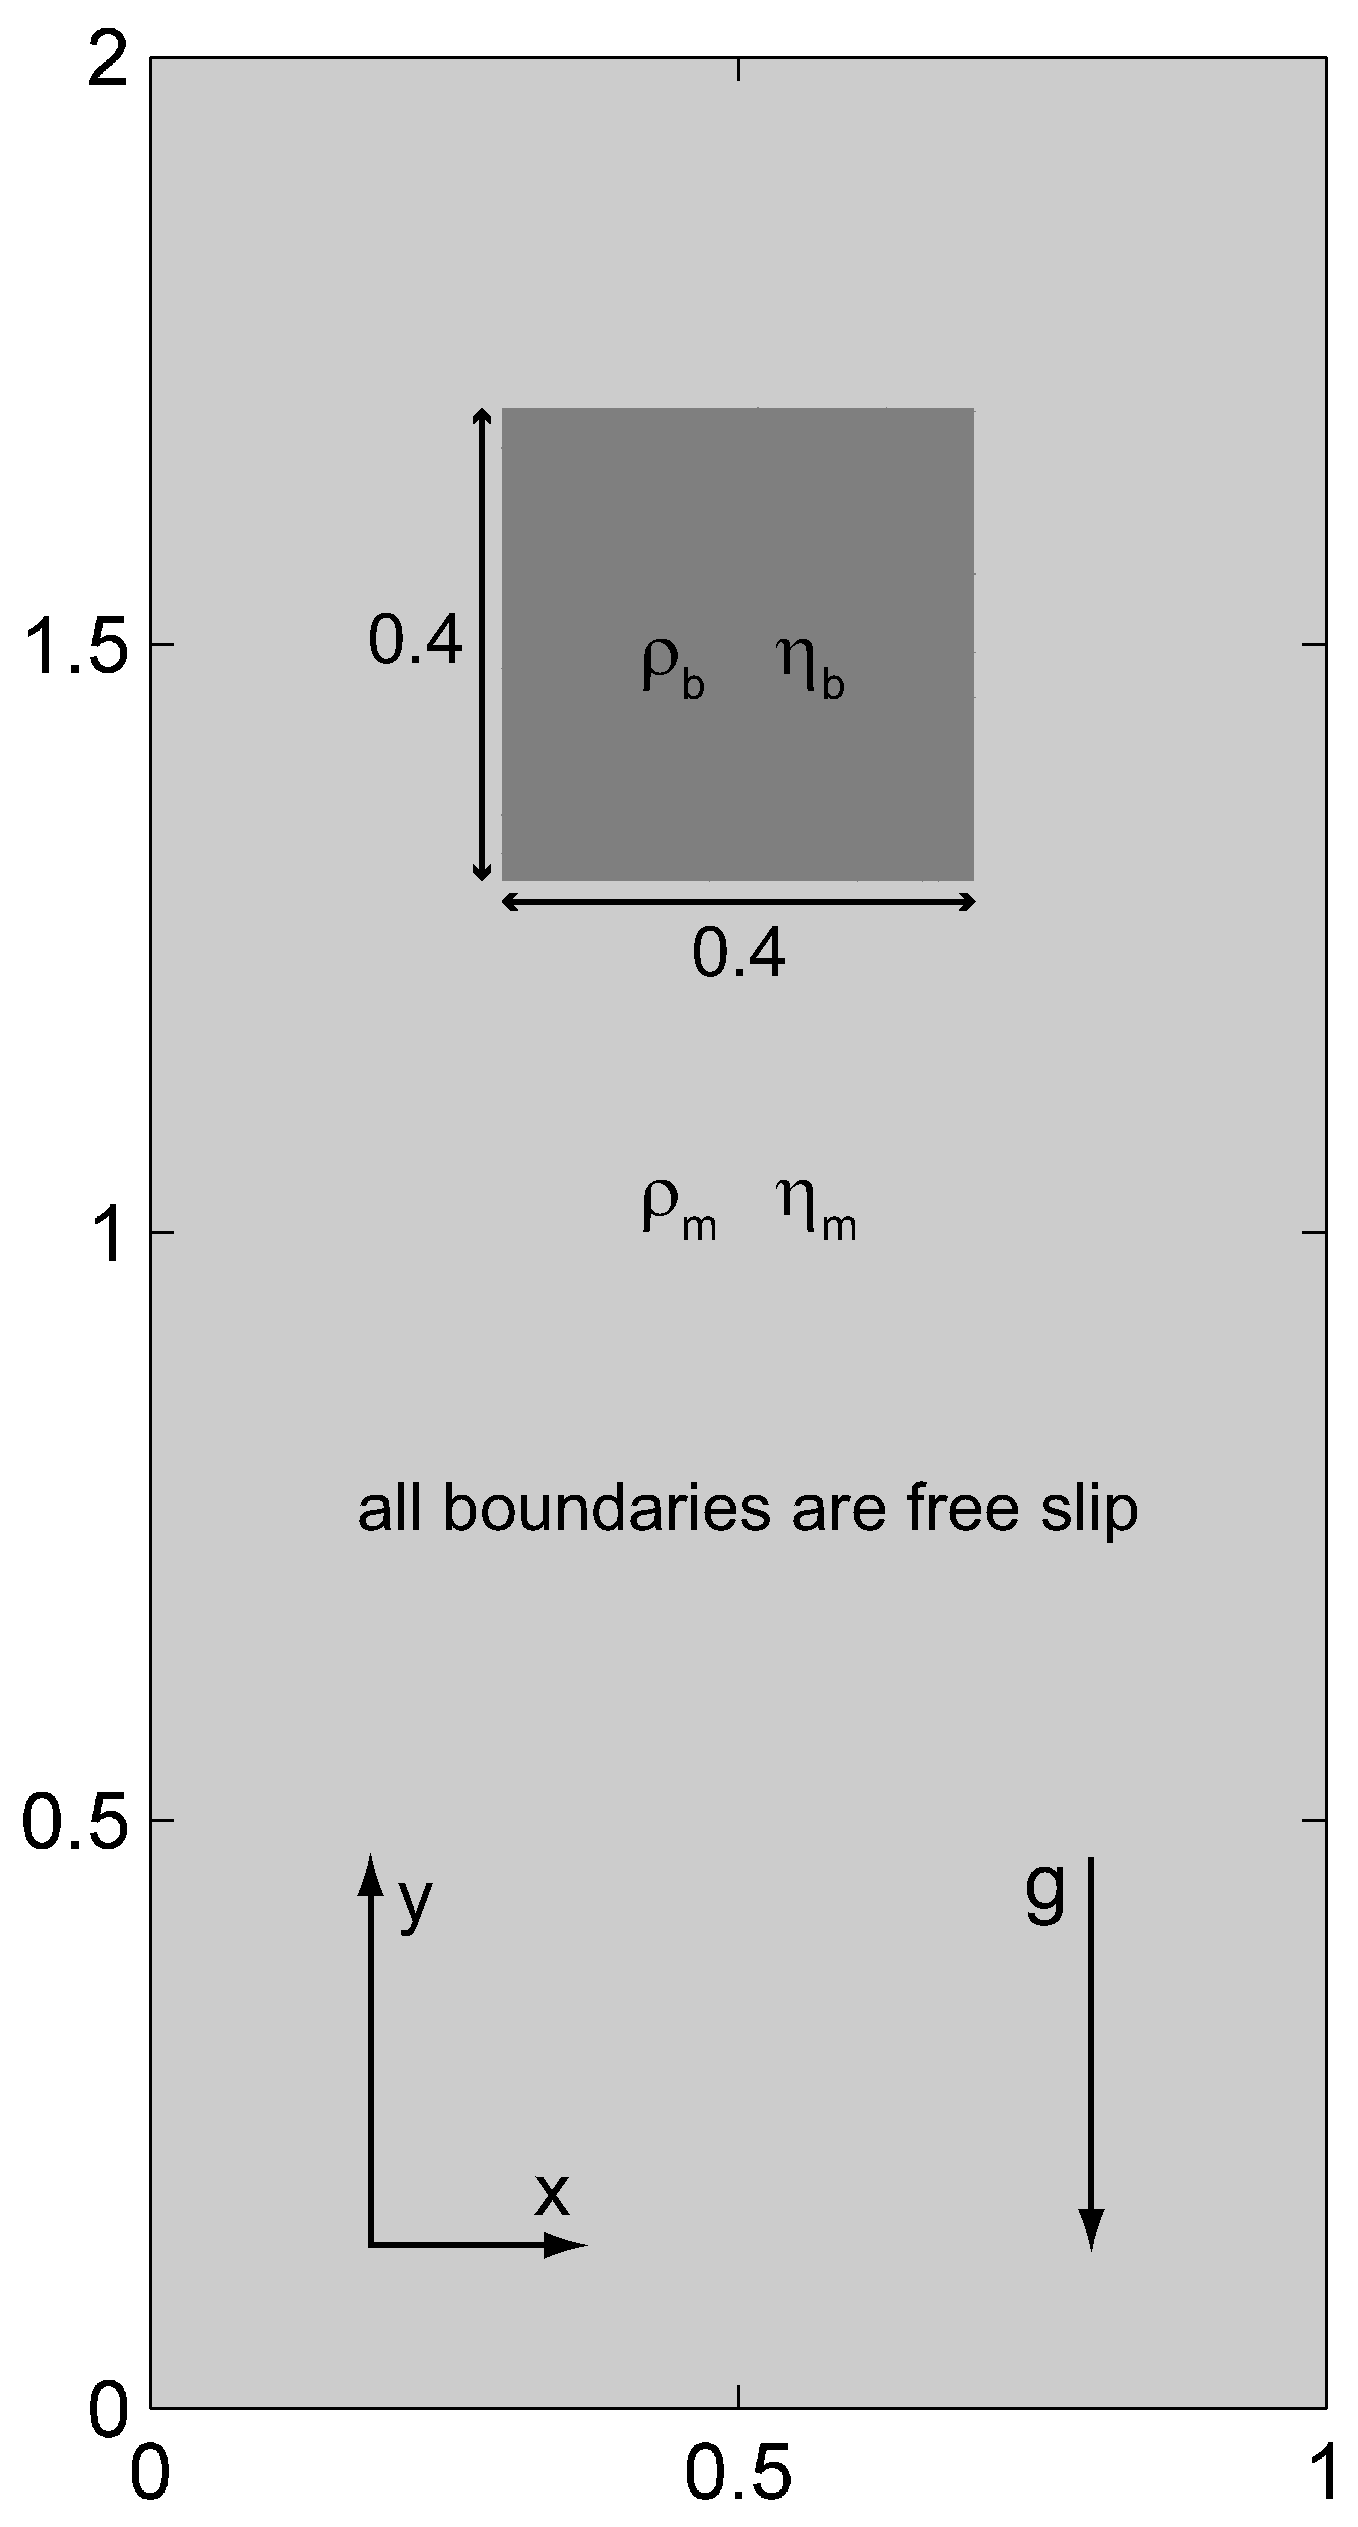
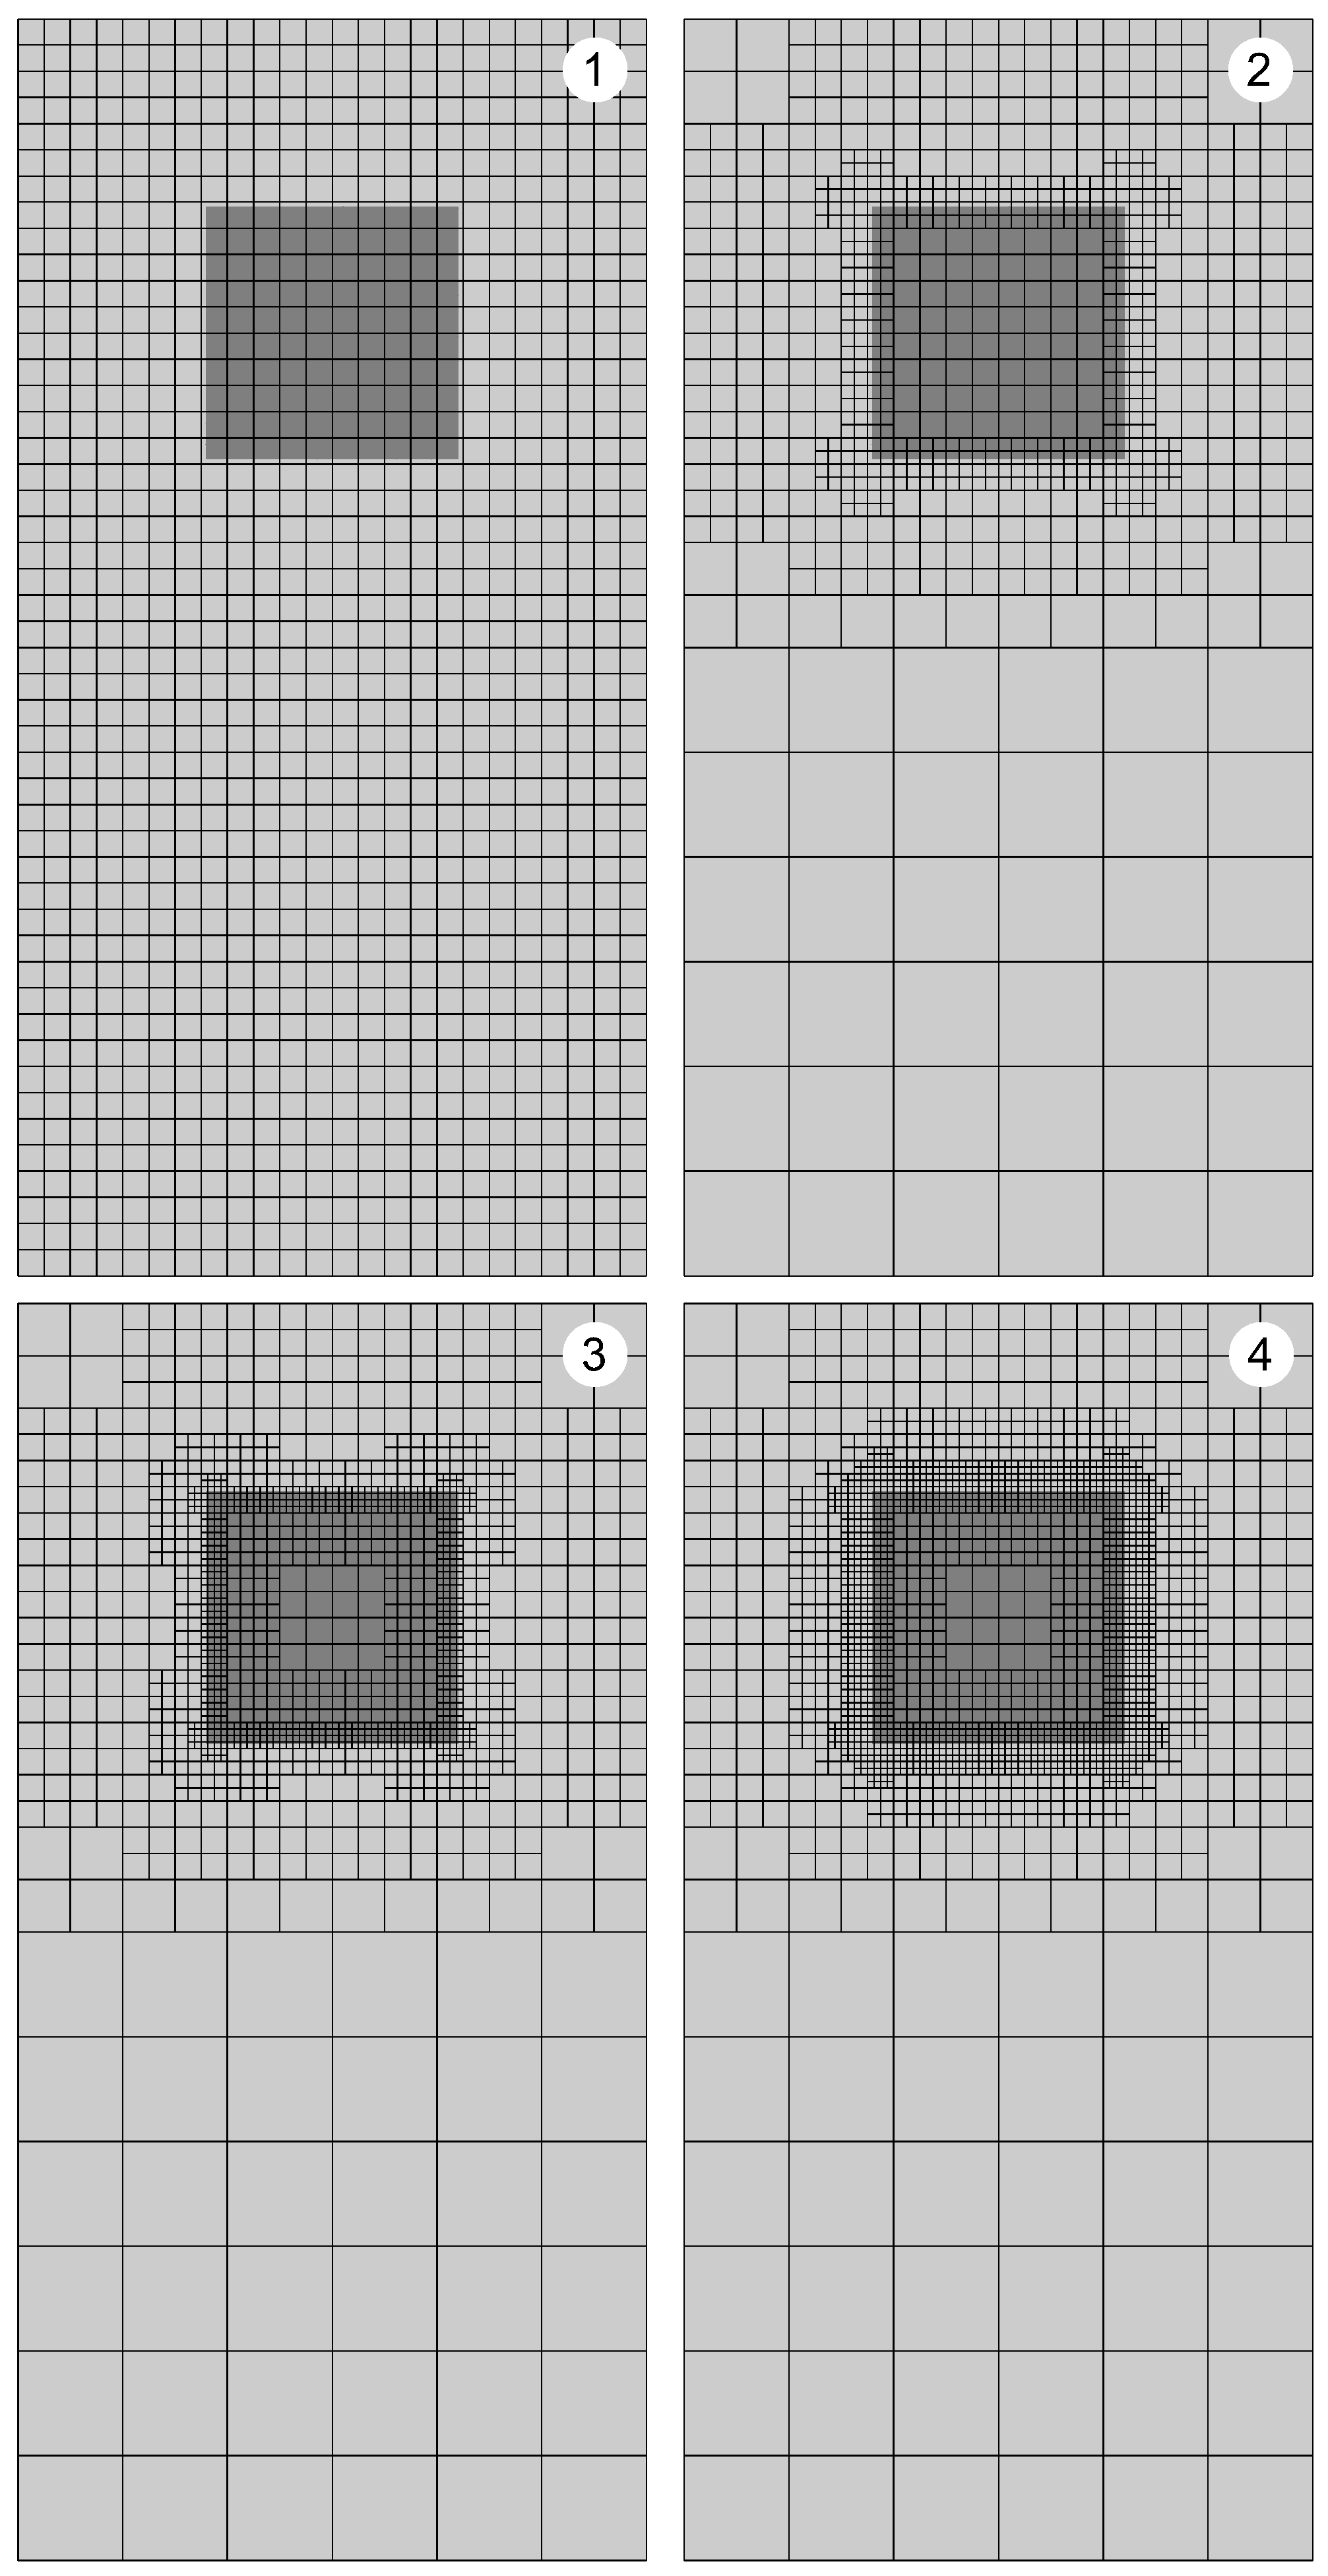
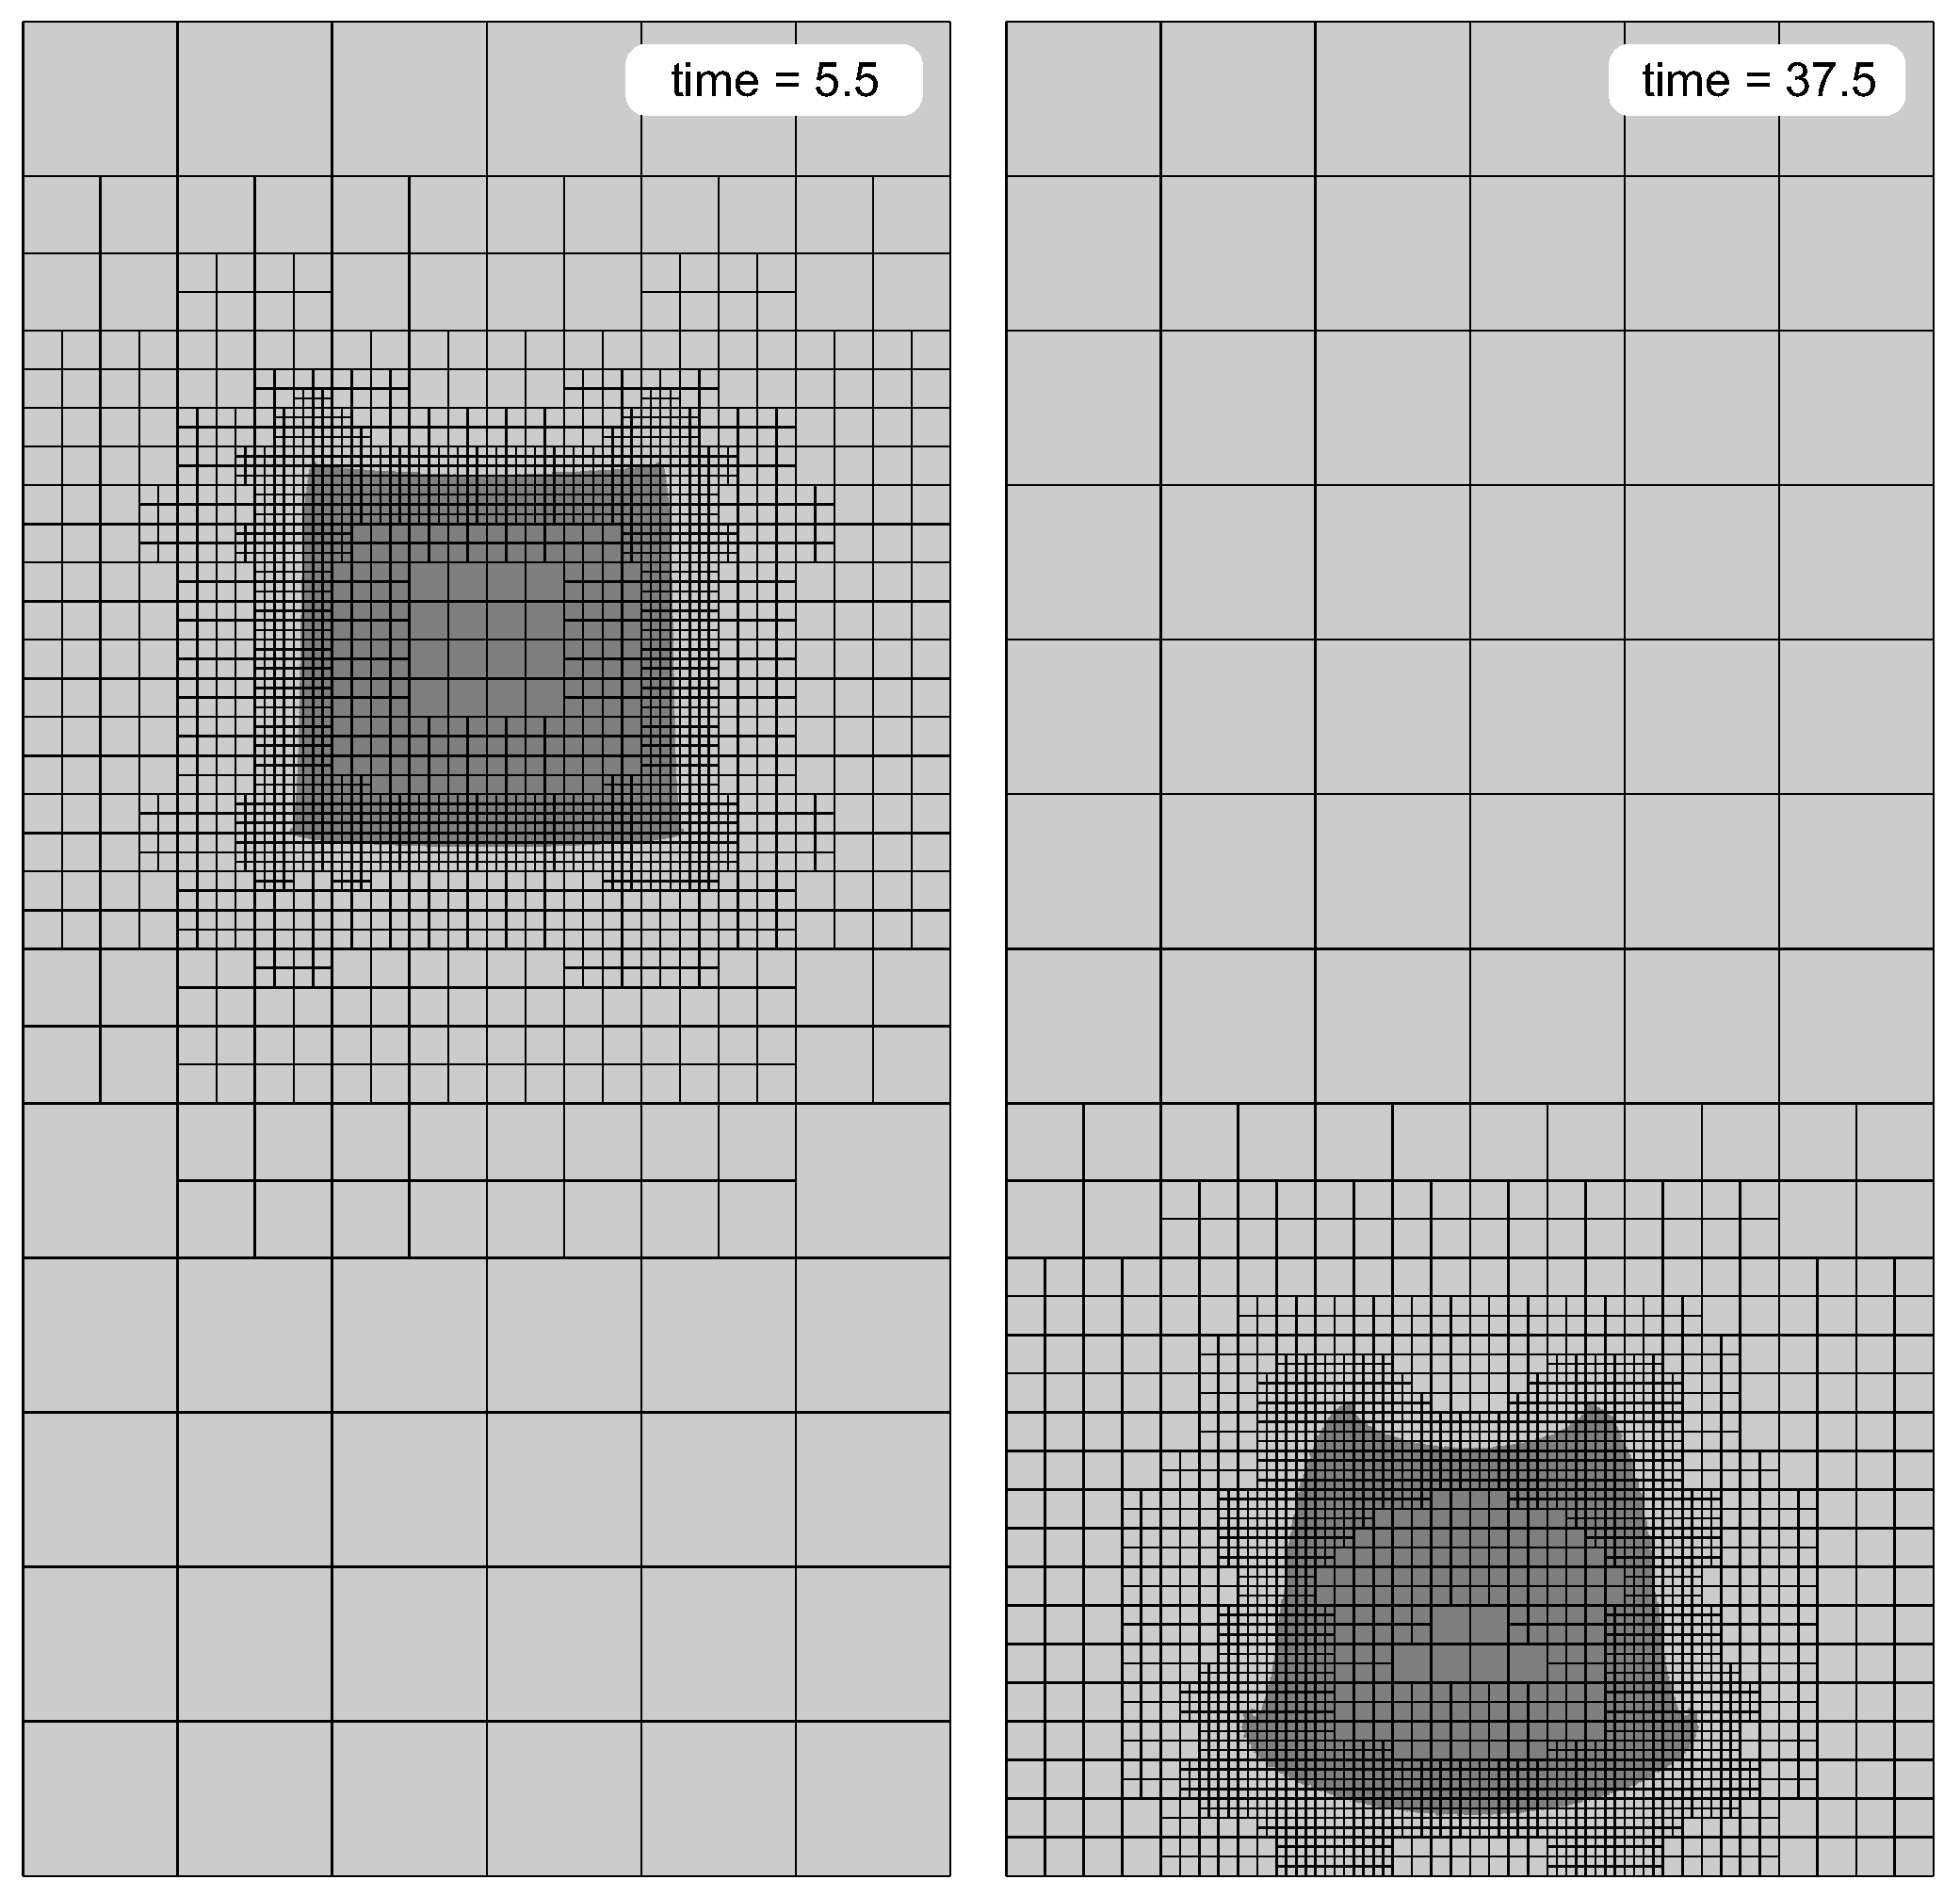
8.2. Sinking Block Benchmark
8.2.1. Setup and Parameters
8.2.2. Effect of Viscosity Contrast
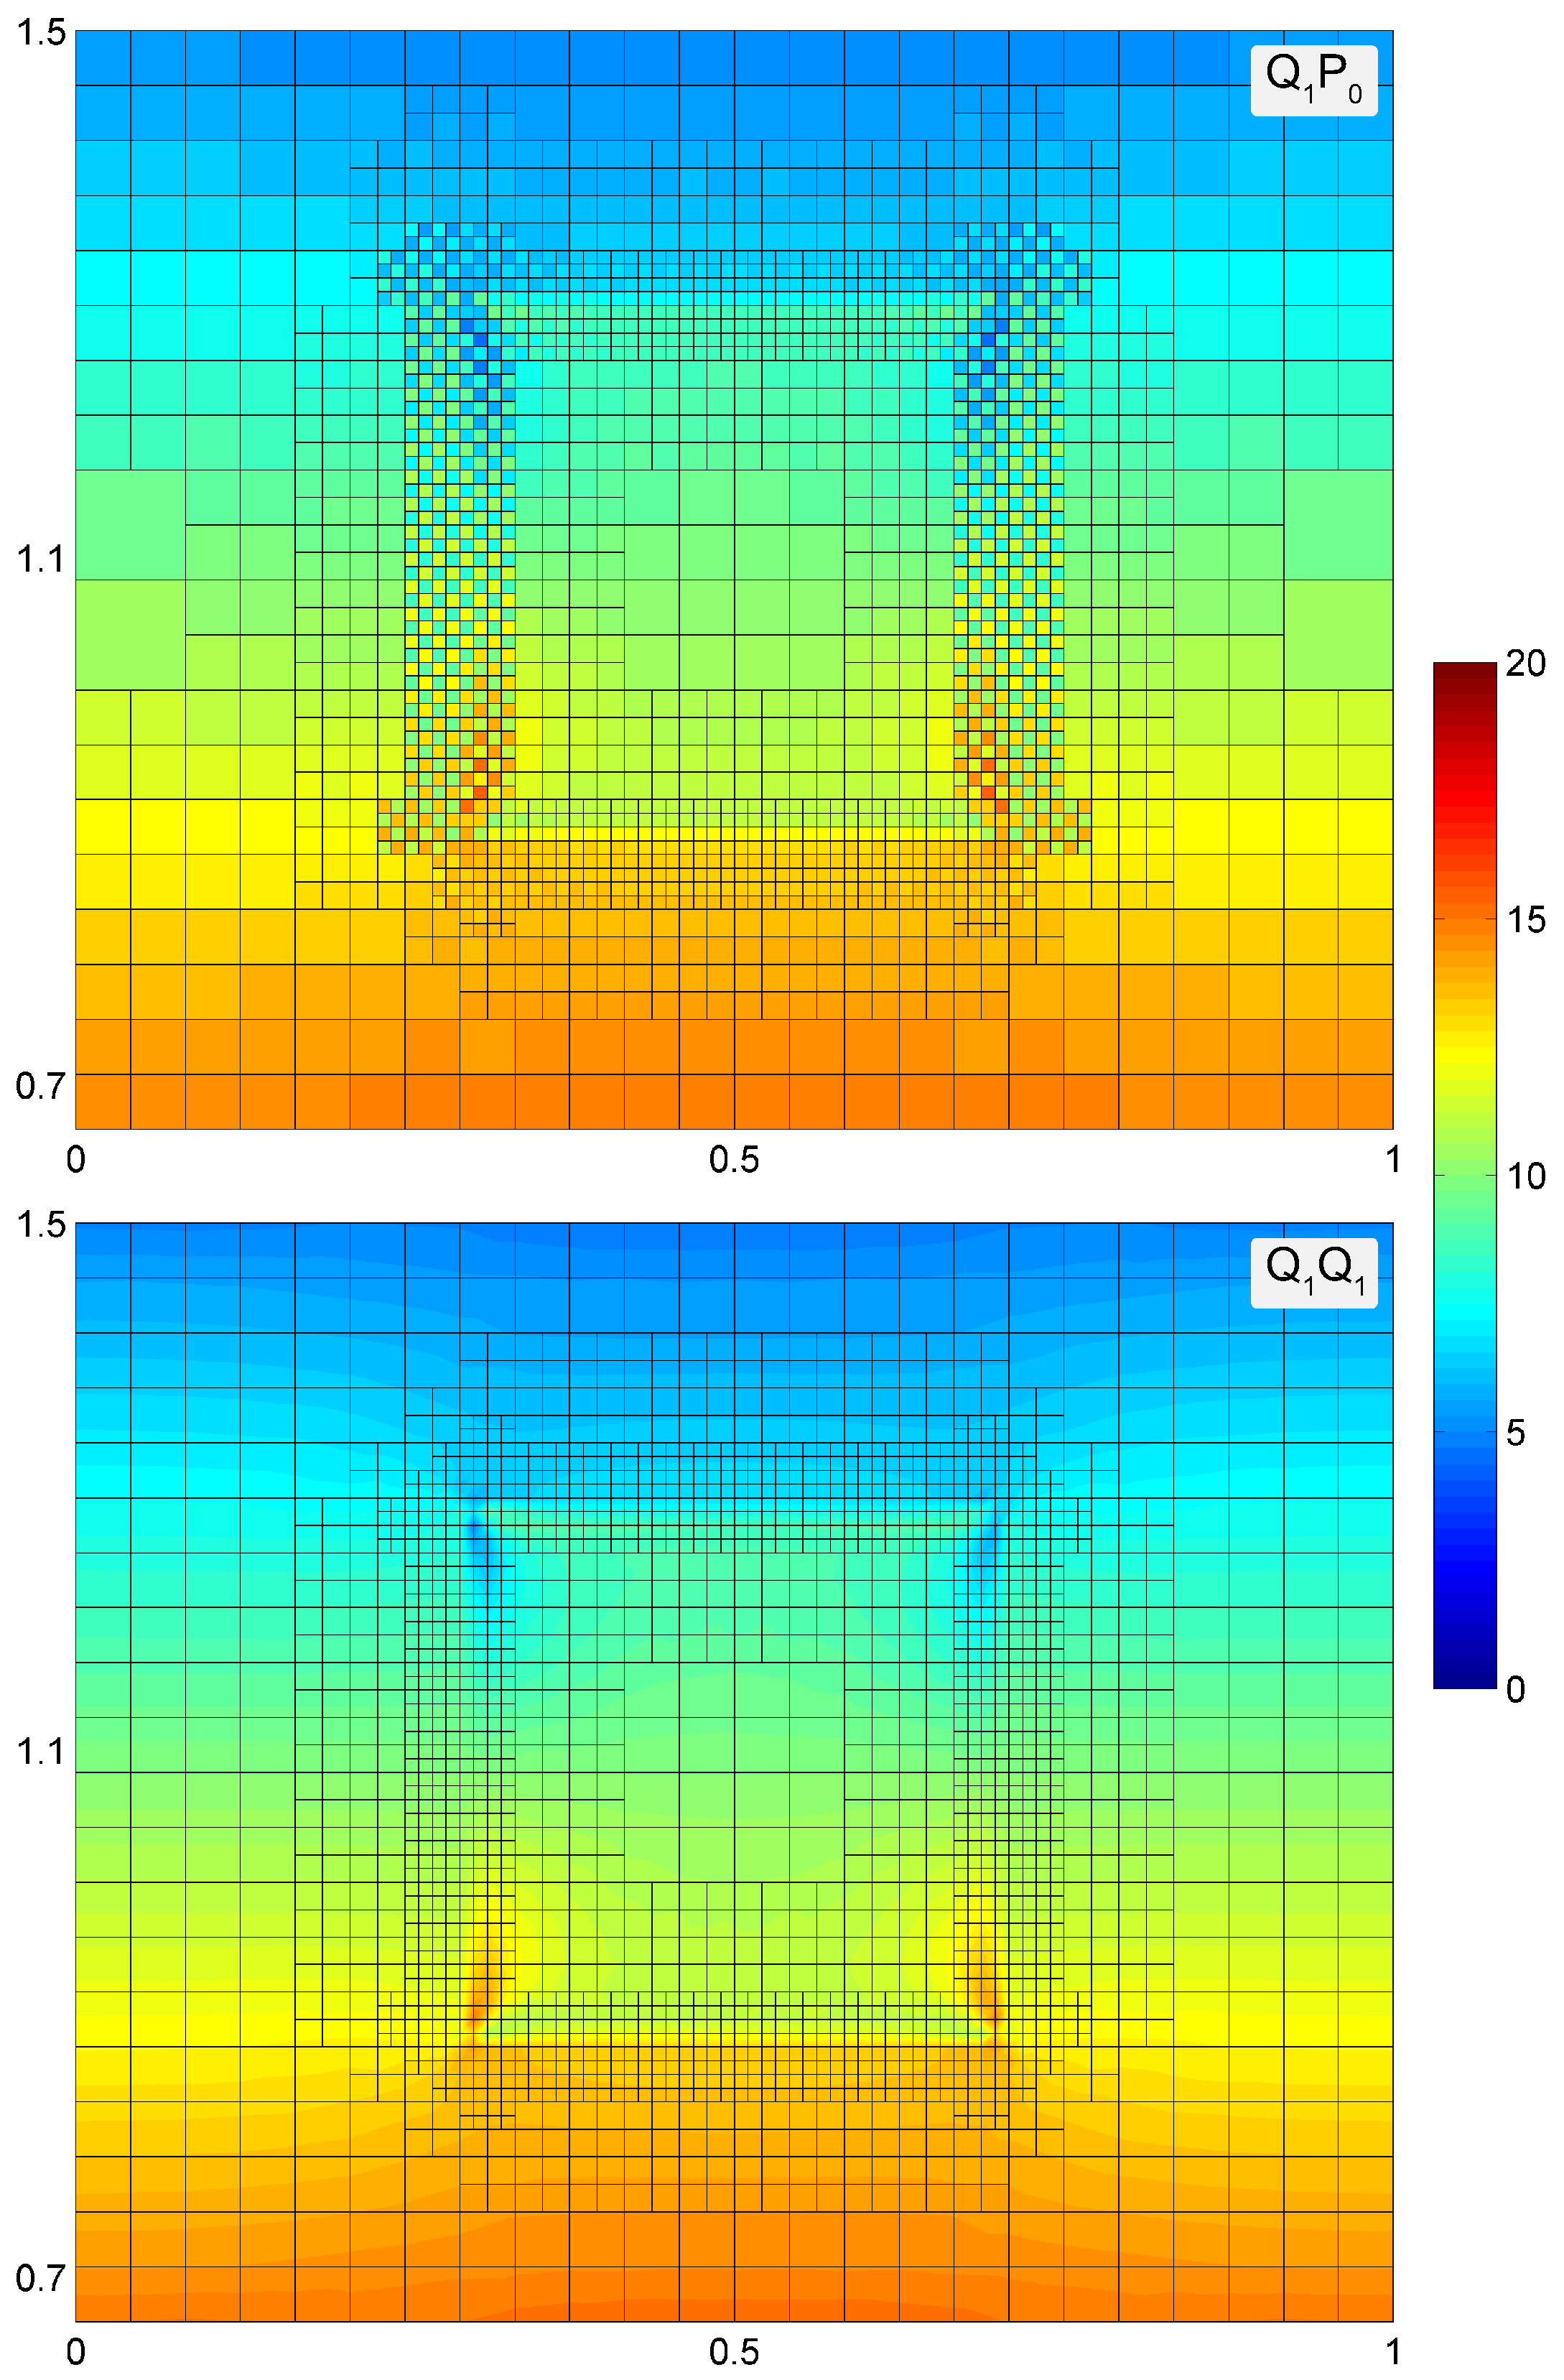
8.2.3. Checkerboard Pressure Problem with Element
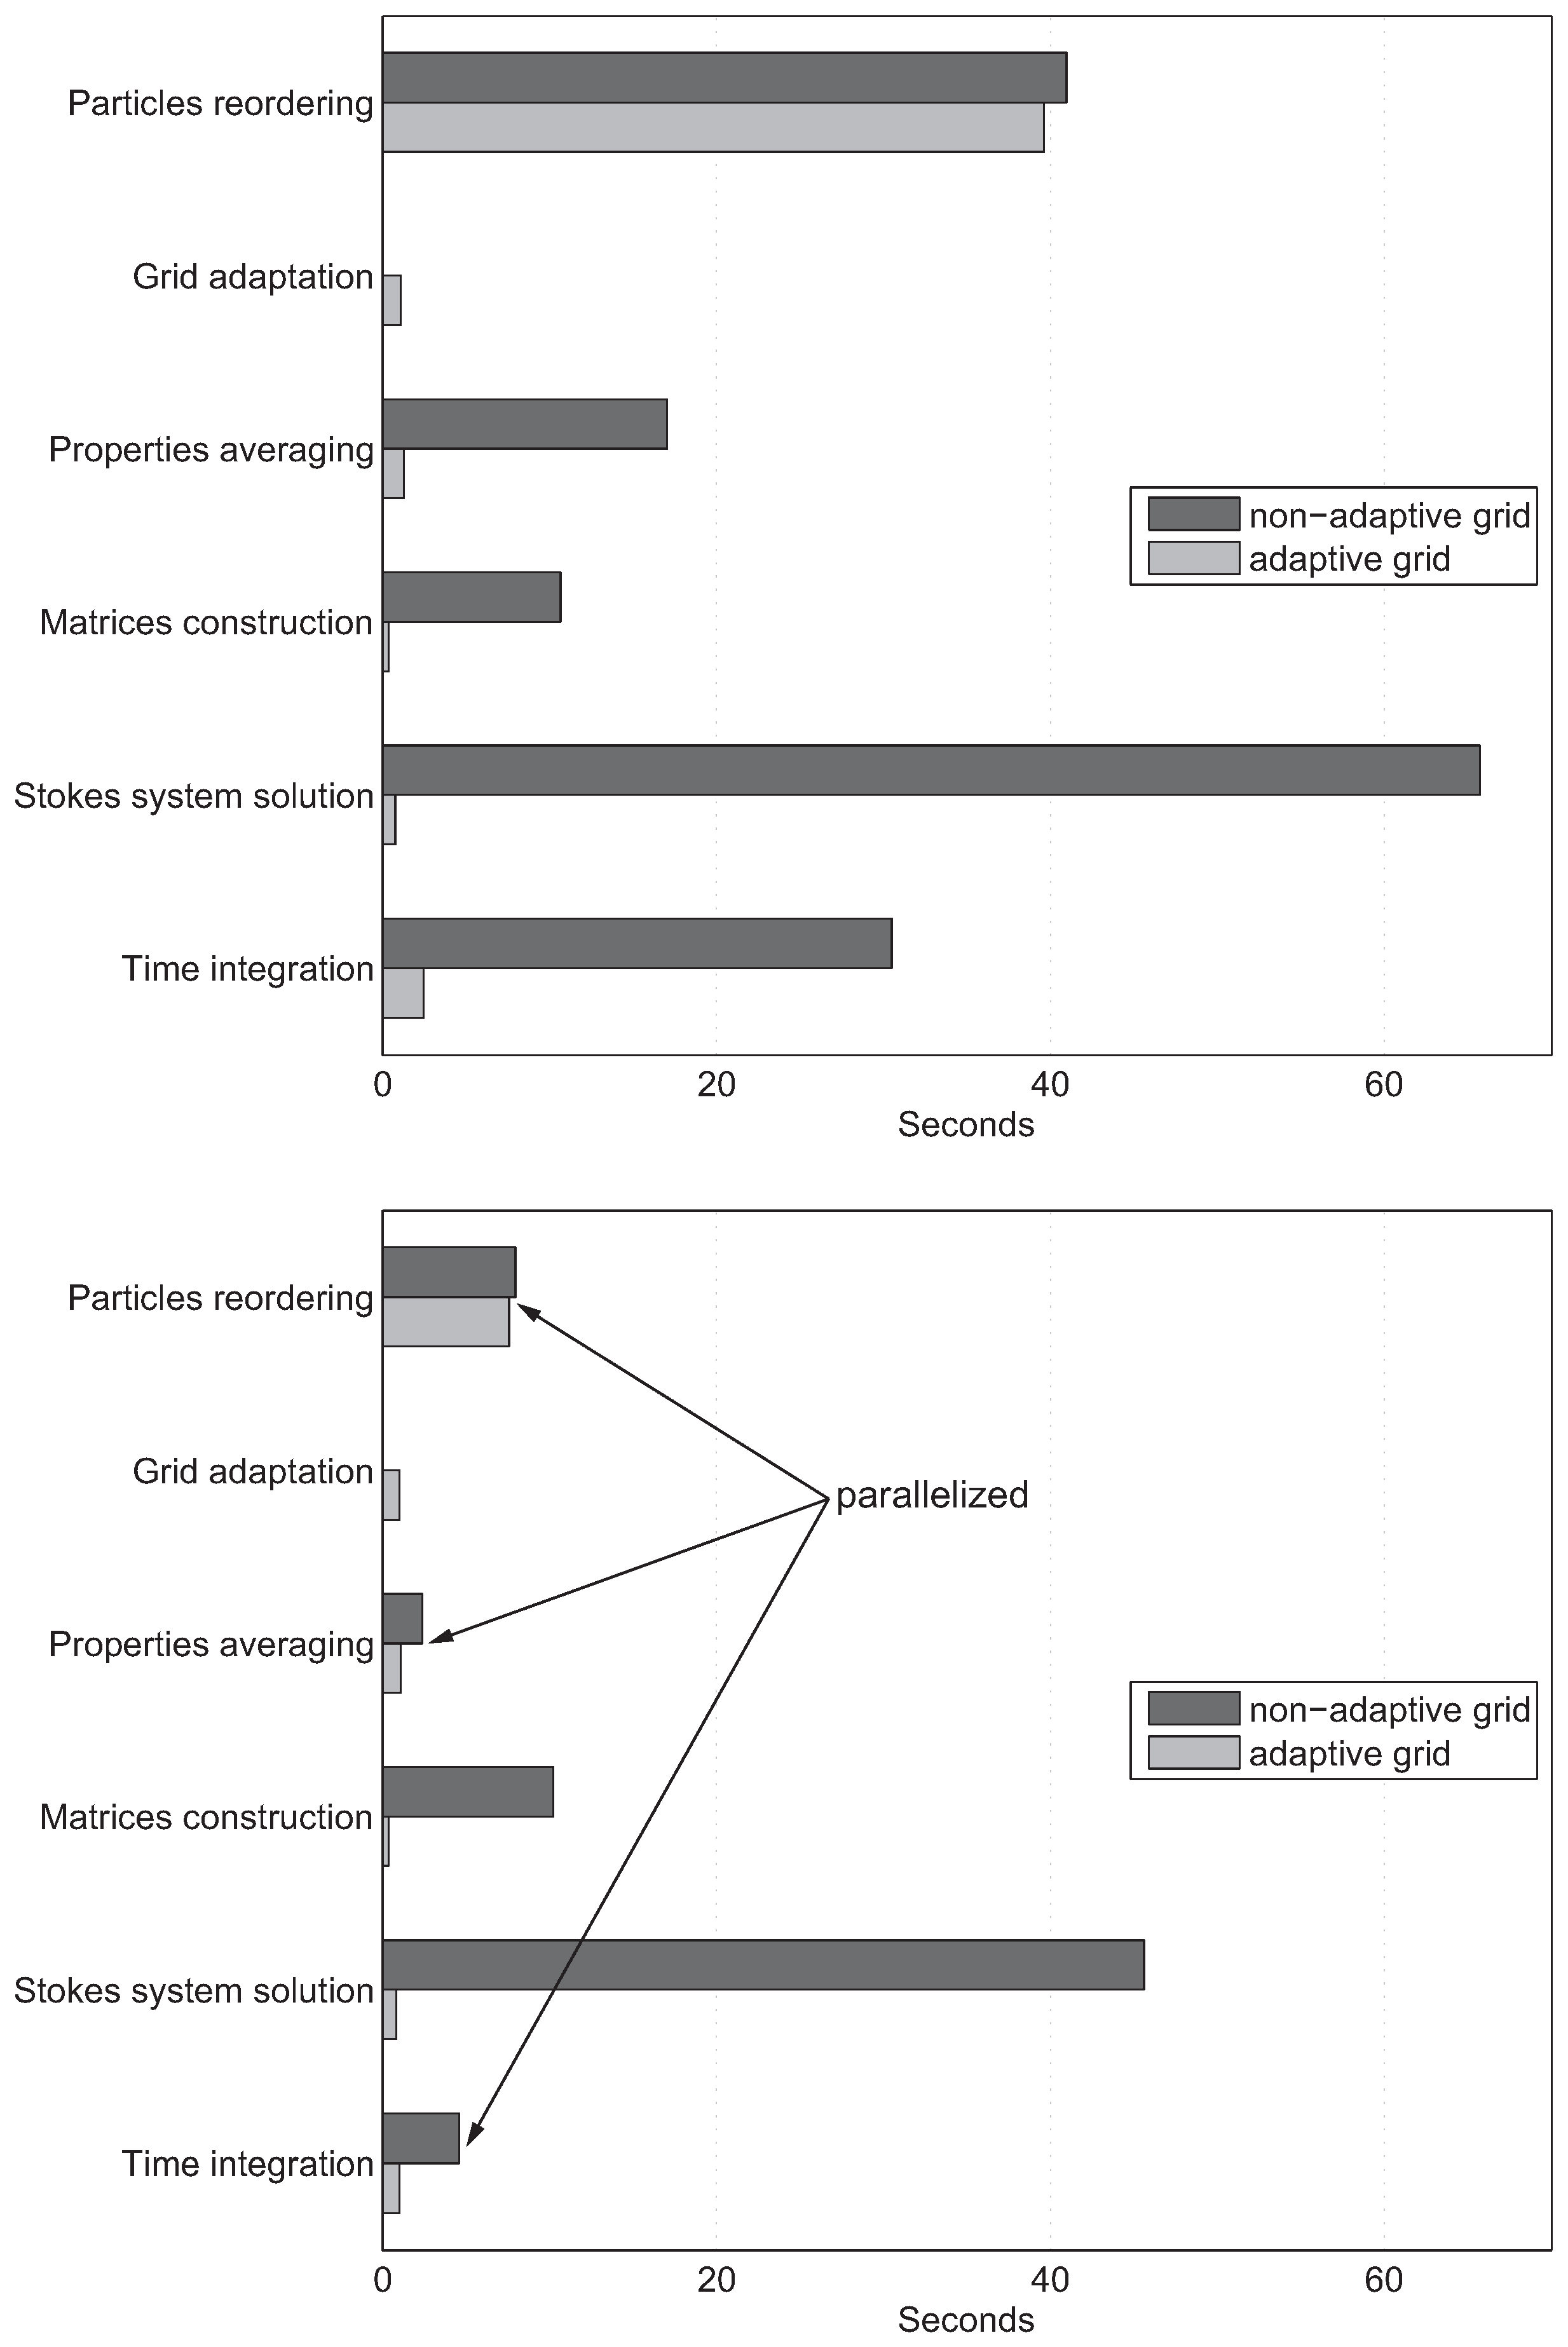
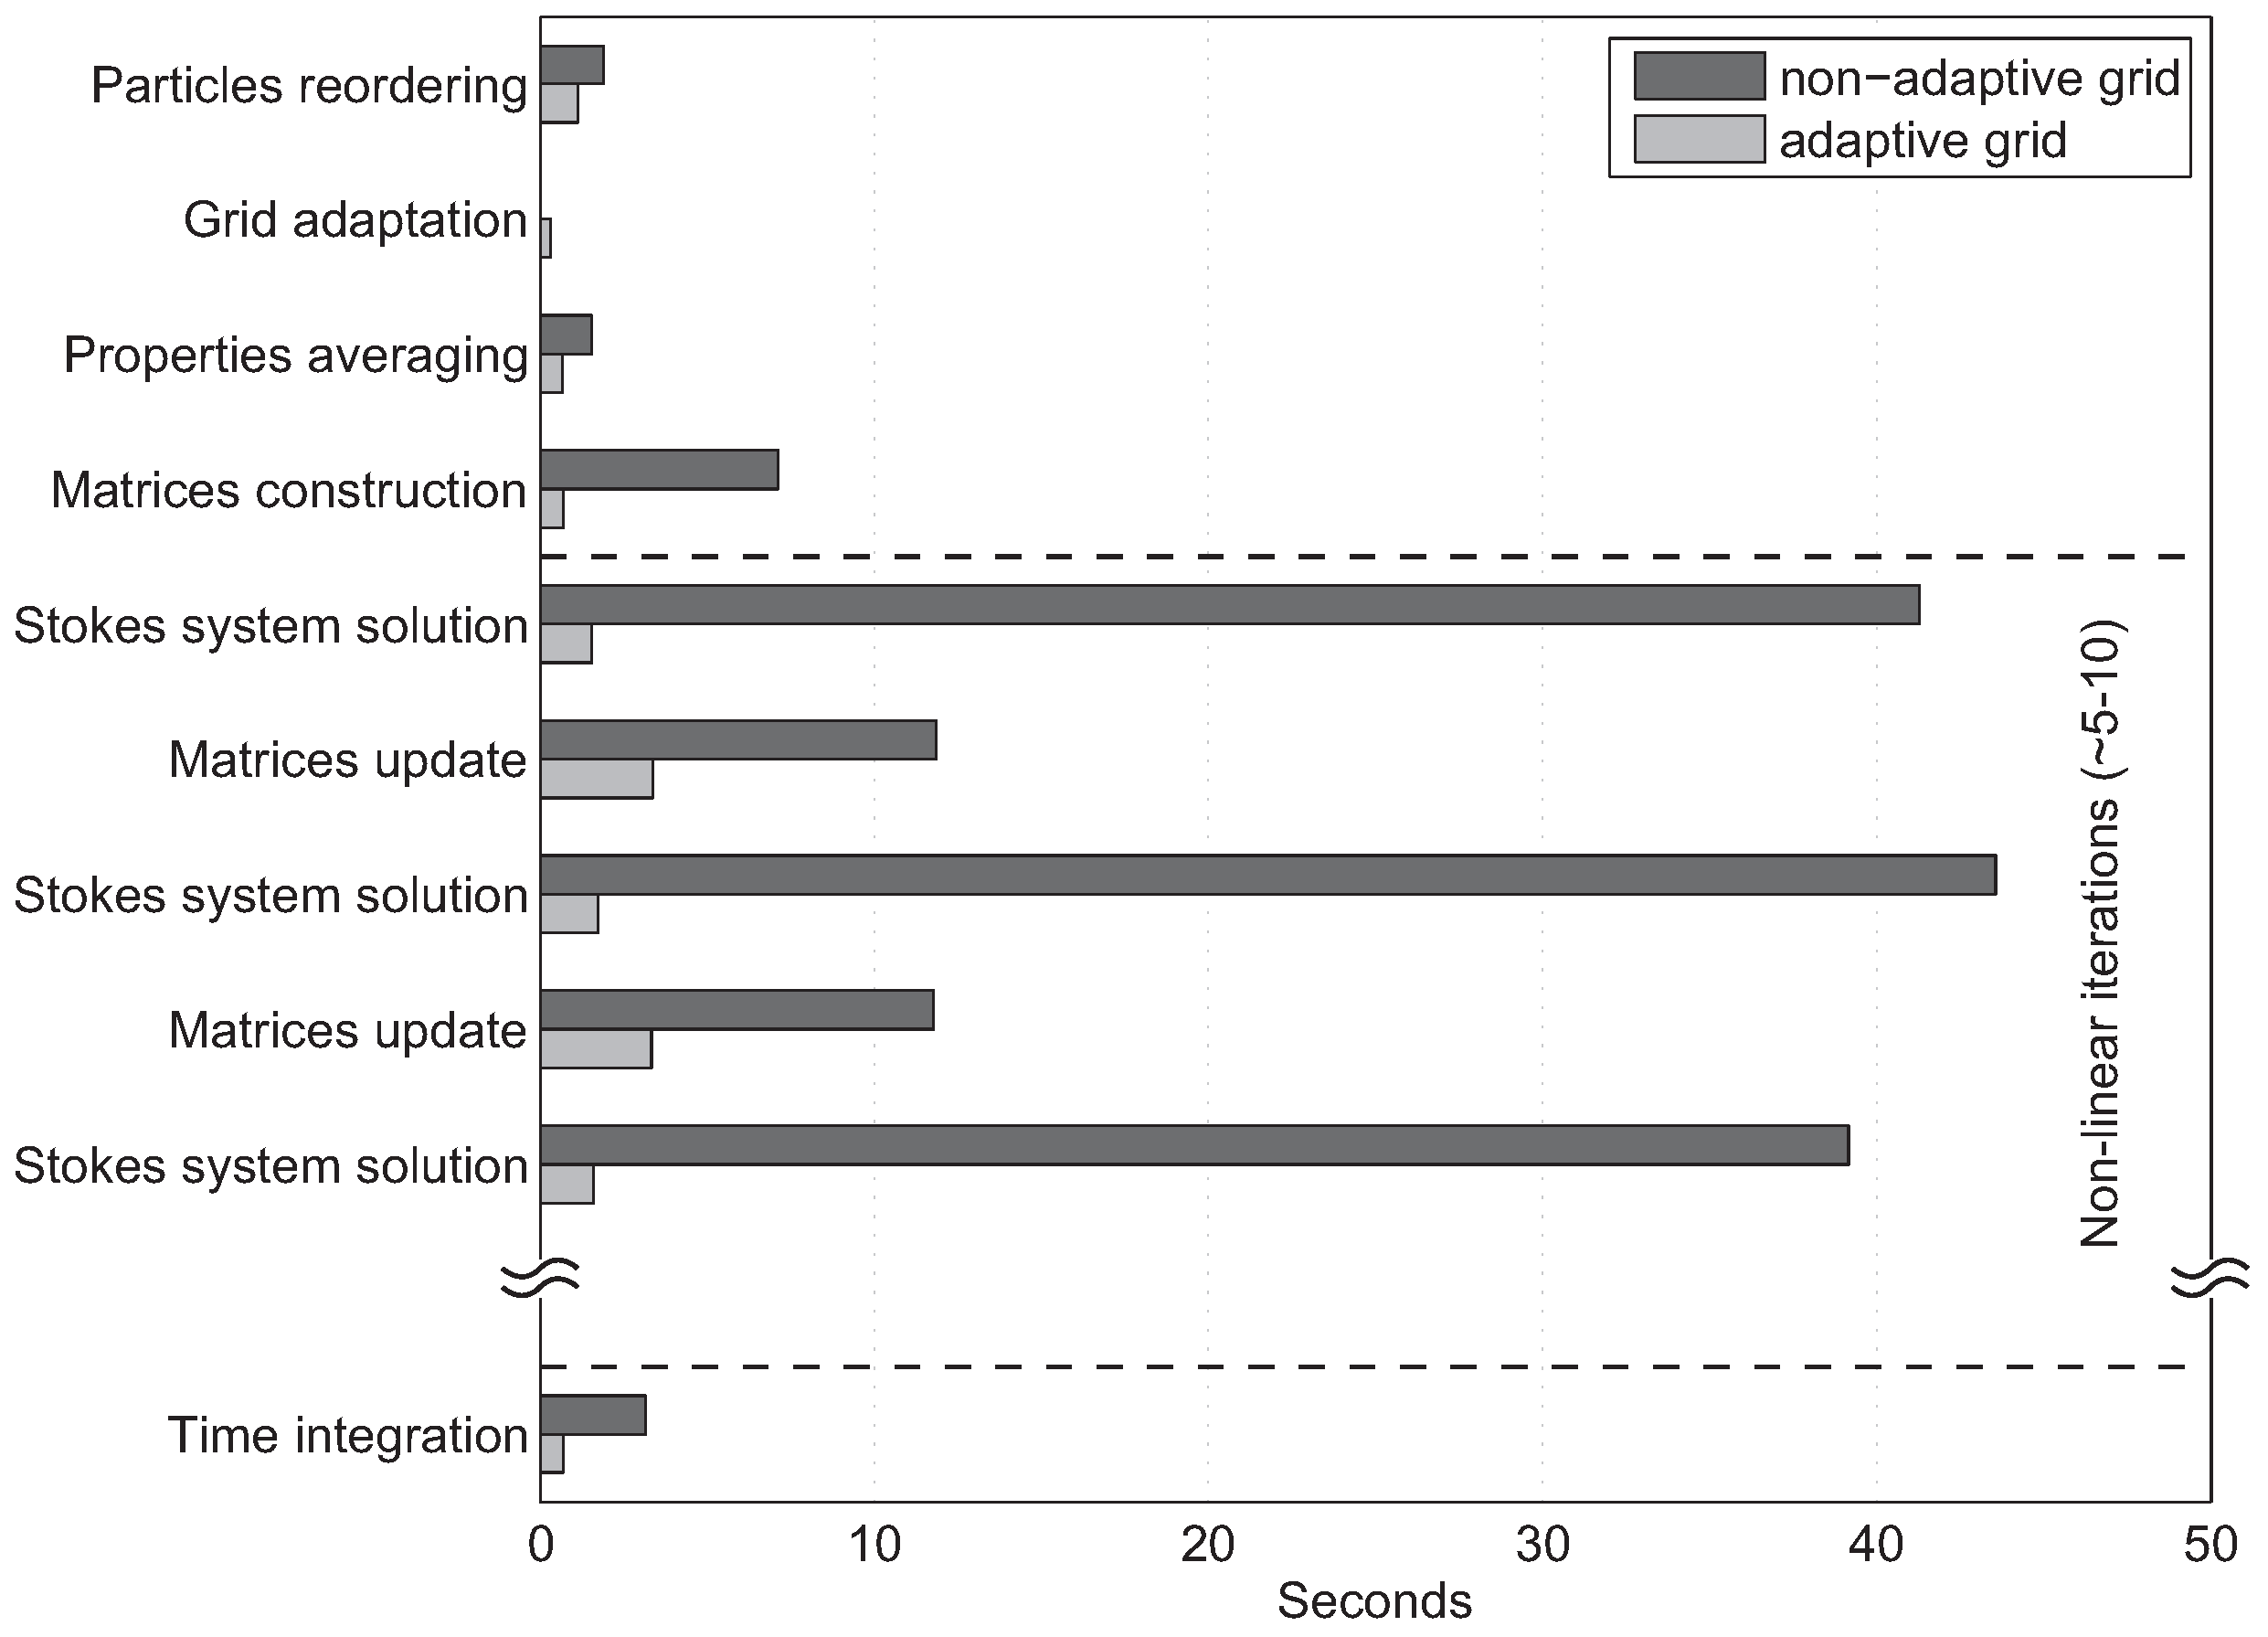
8.2.4. Performance Analysis
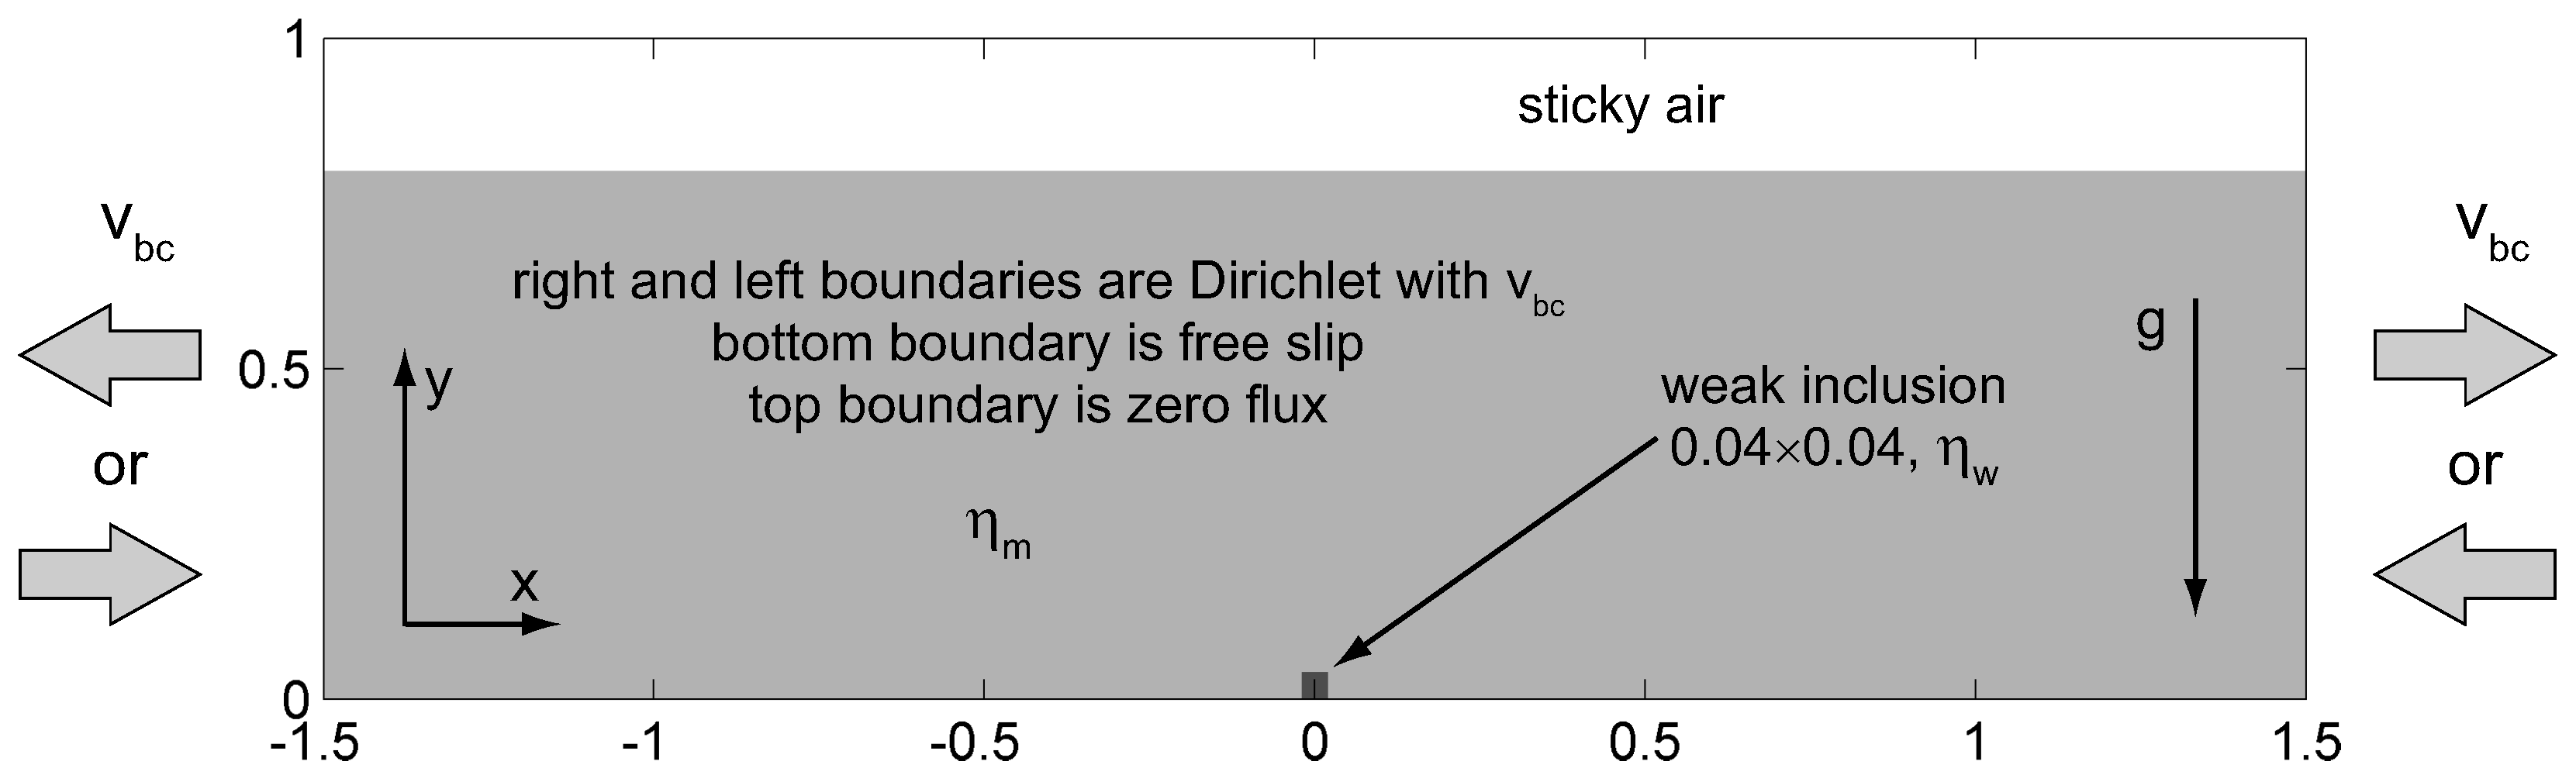
8.3. Brittle Extension/Compression Benchmark
8.3.1. Setup and Parameters
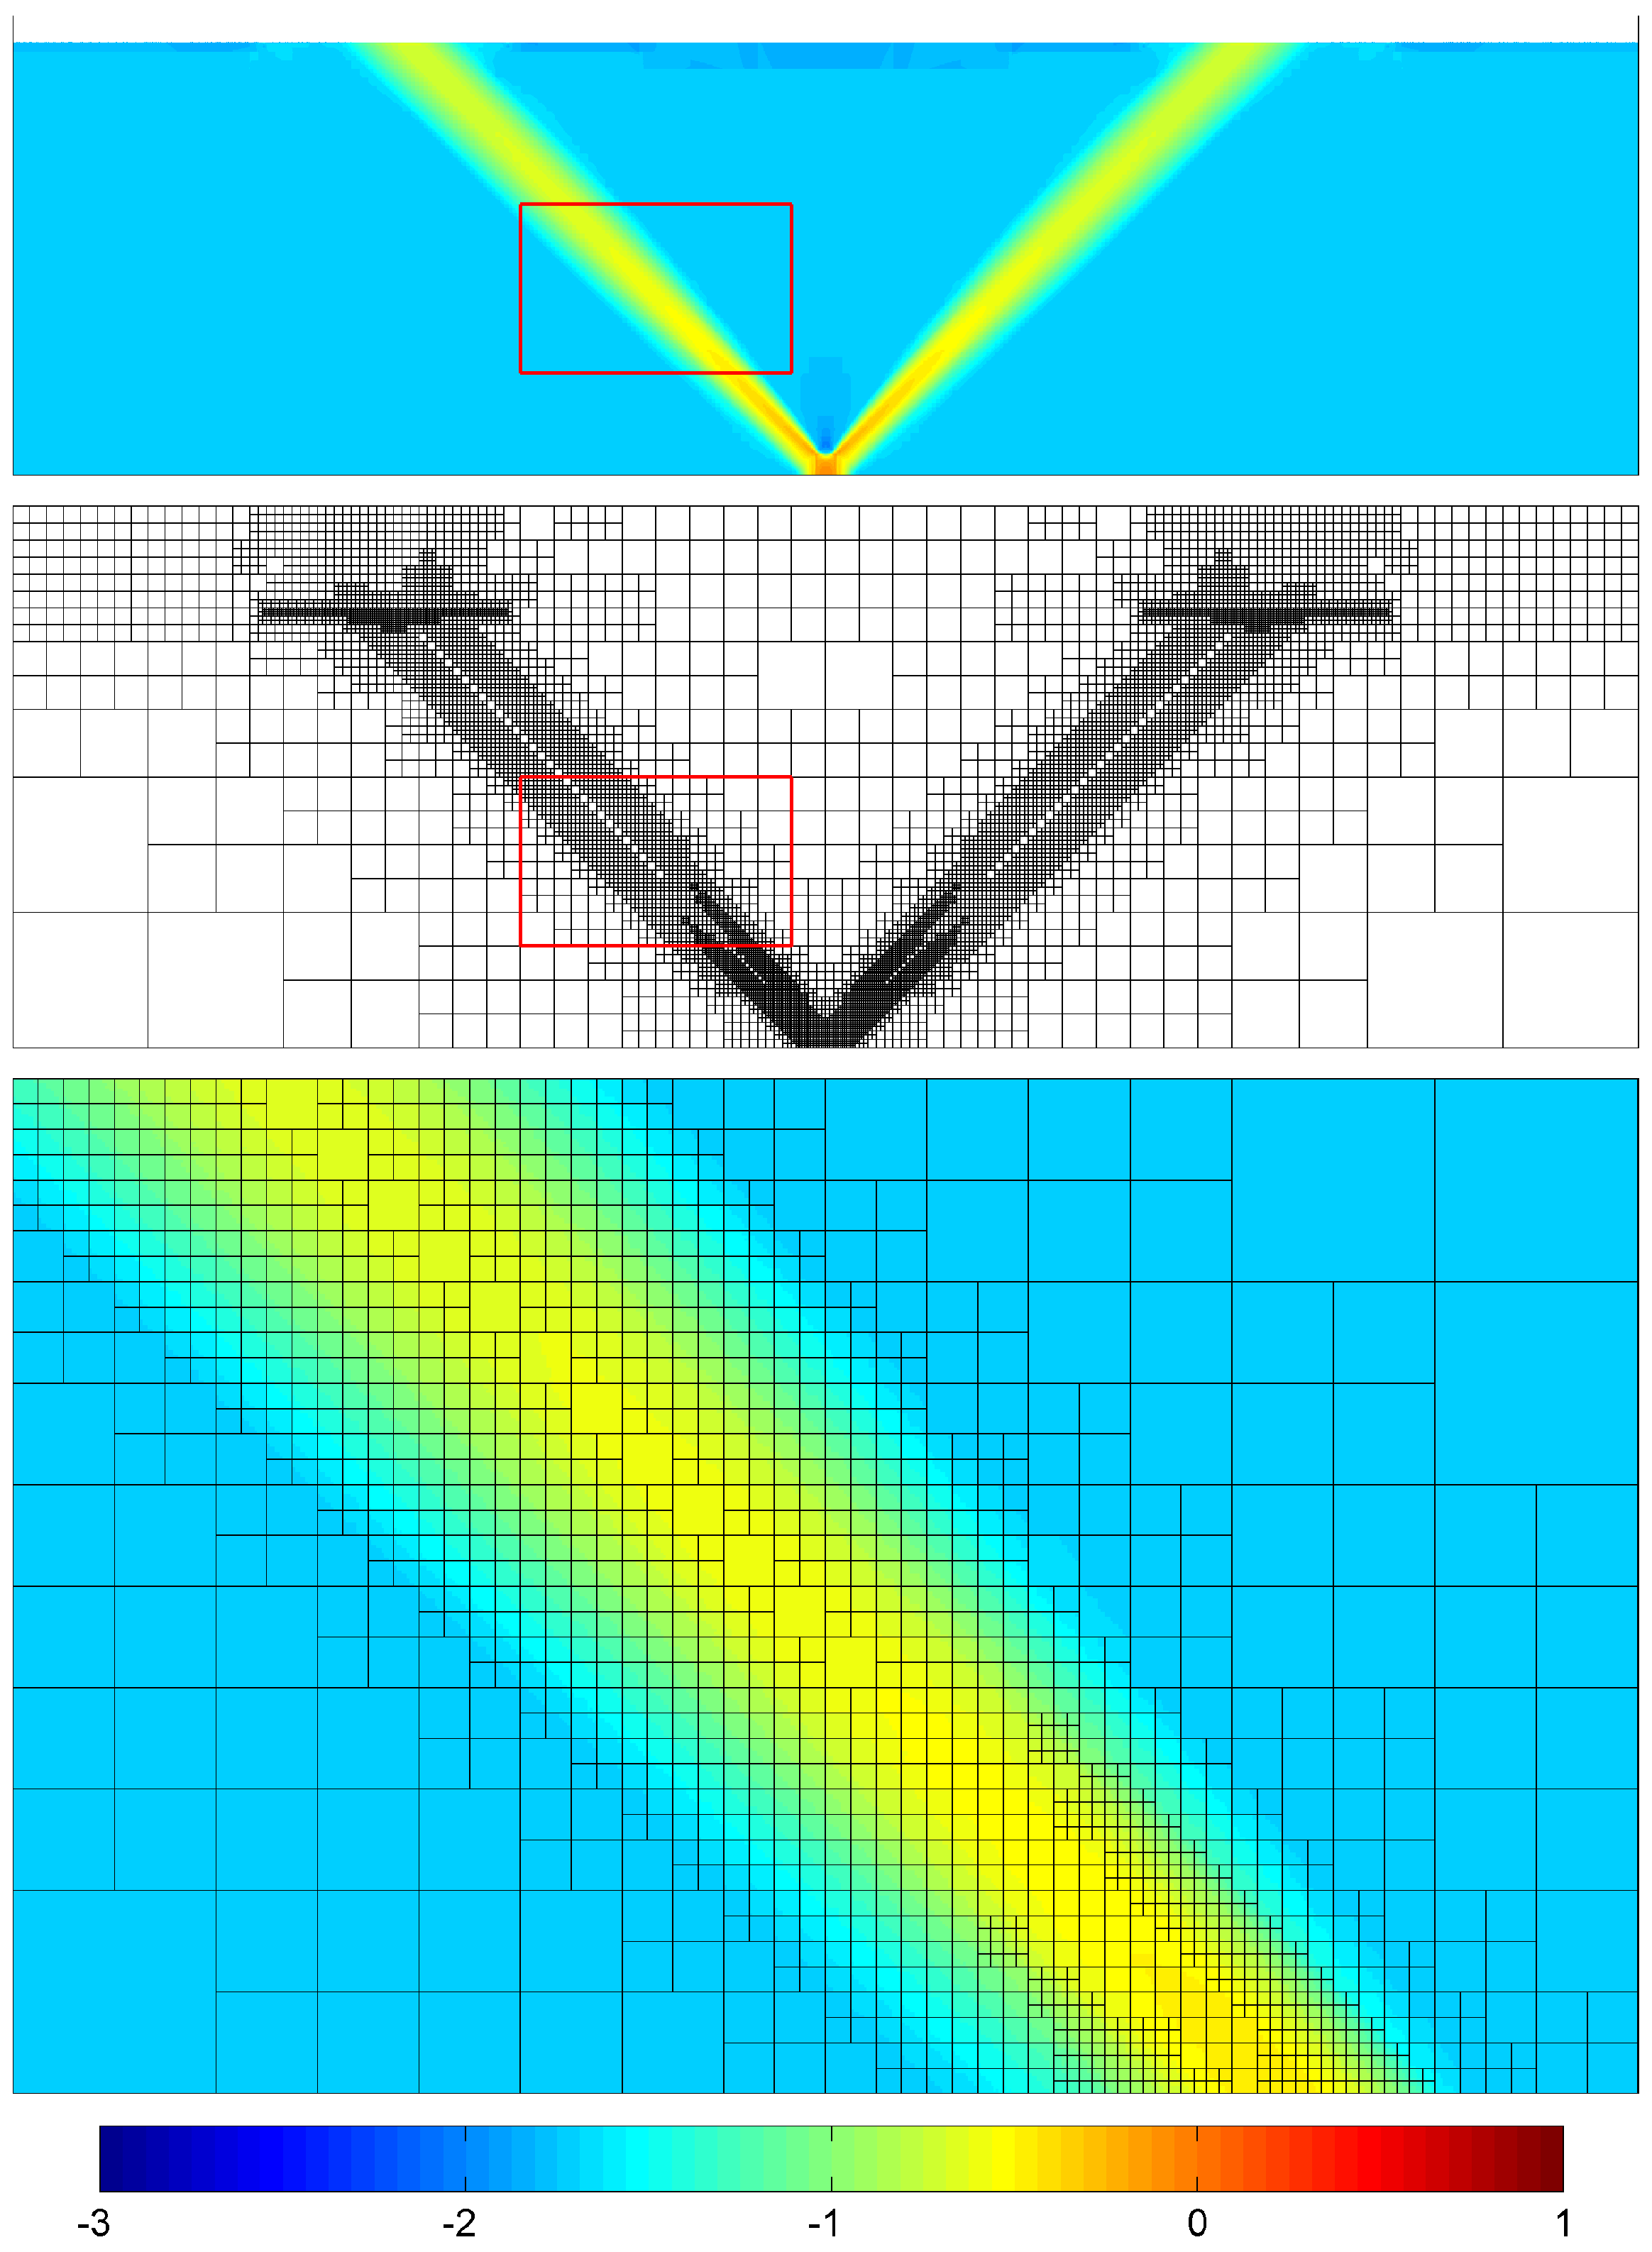
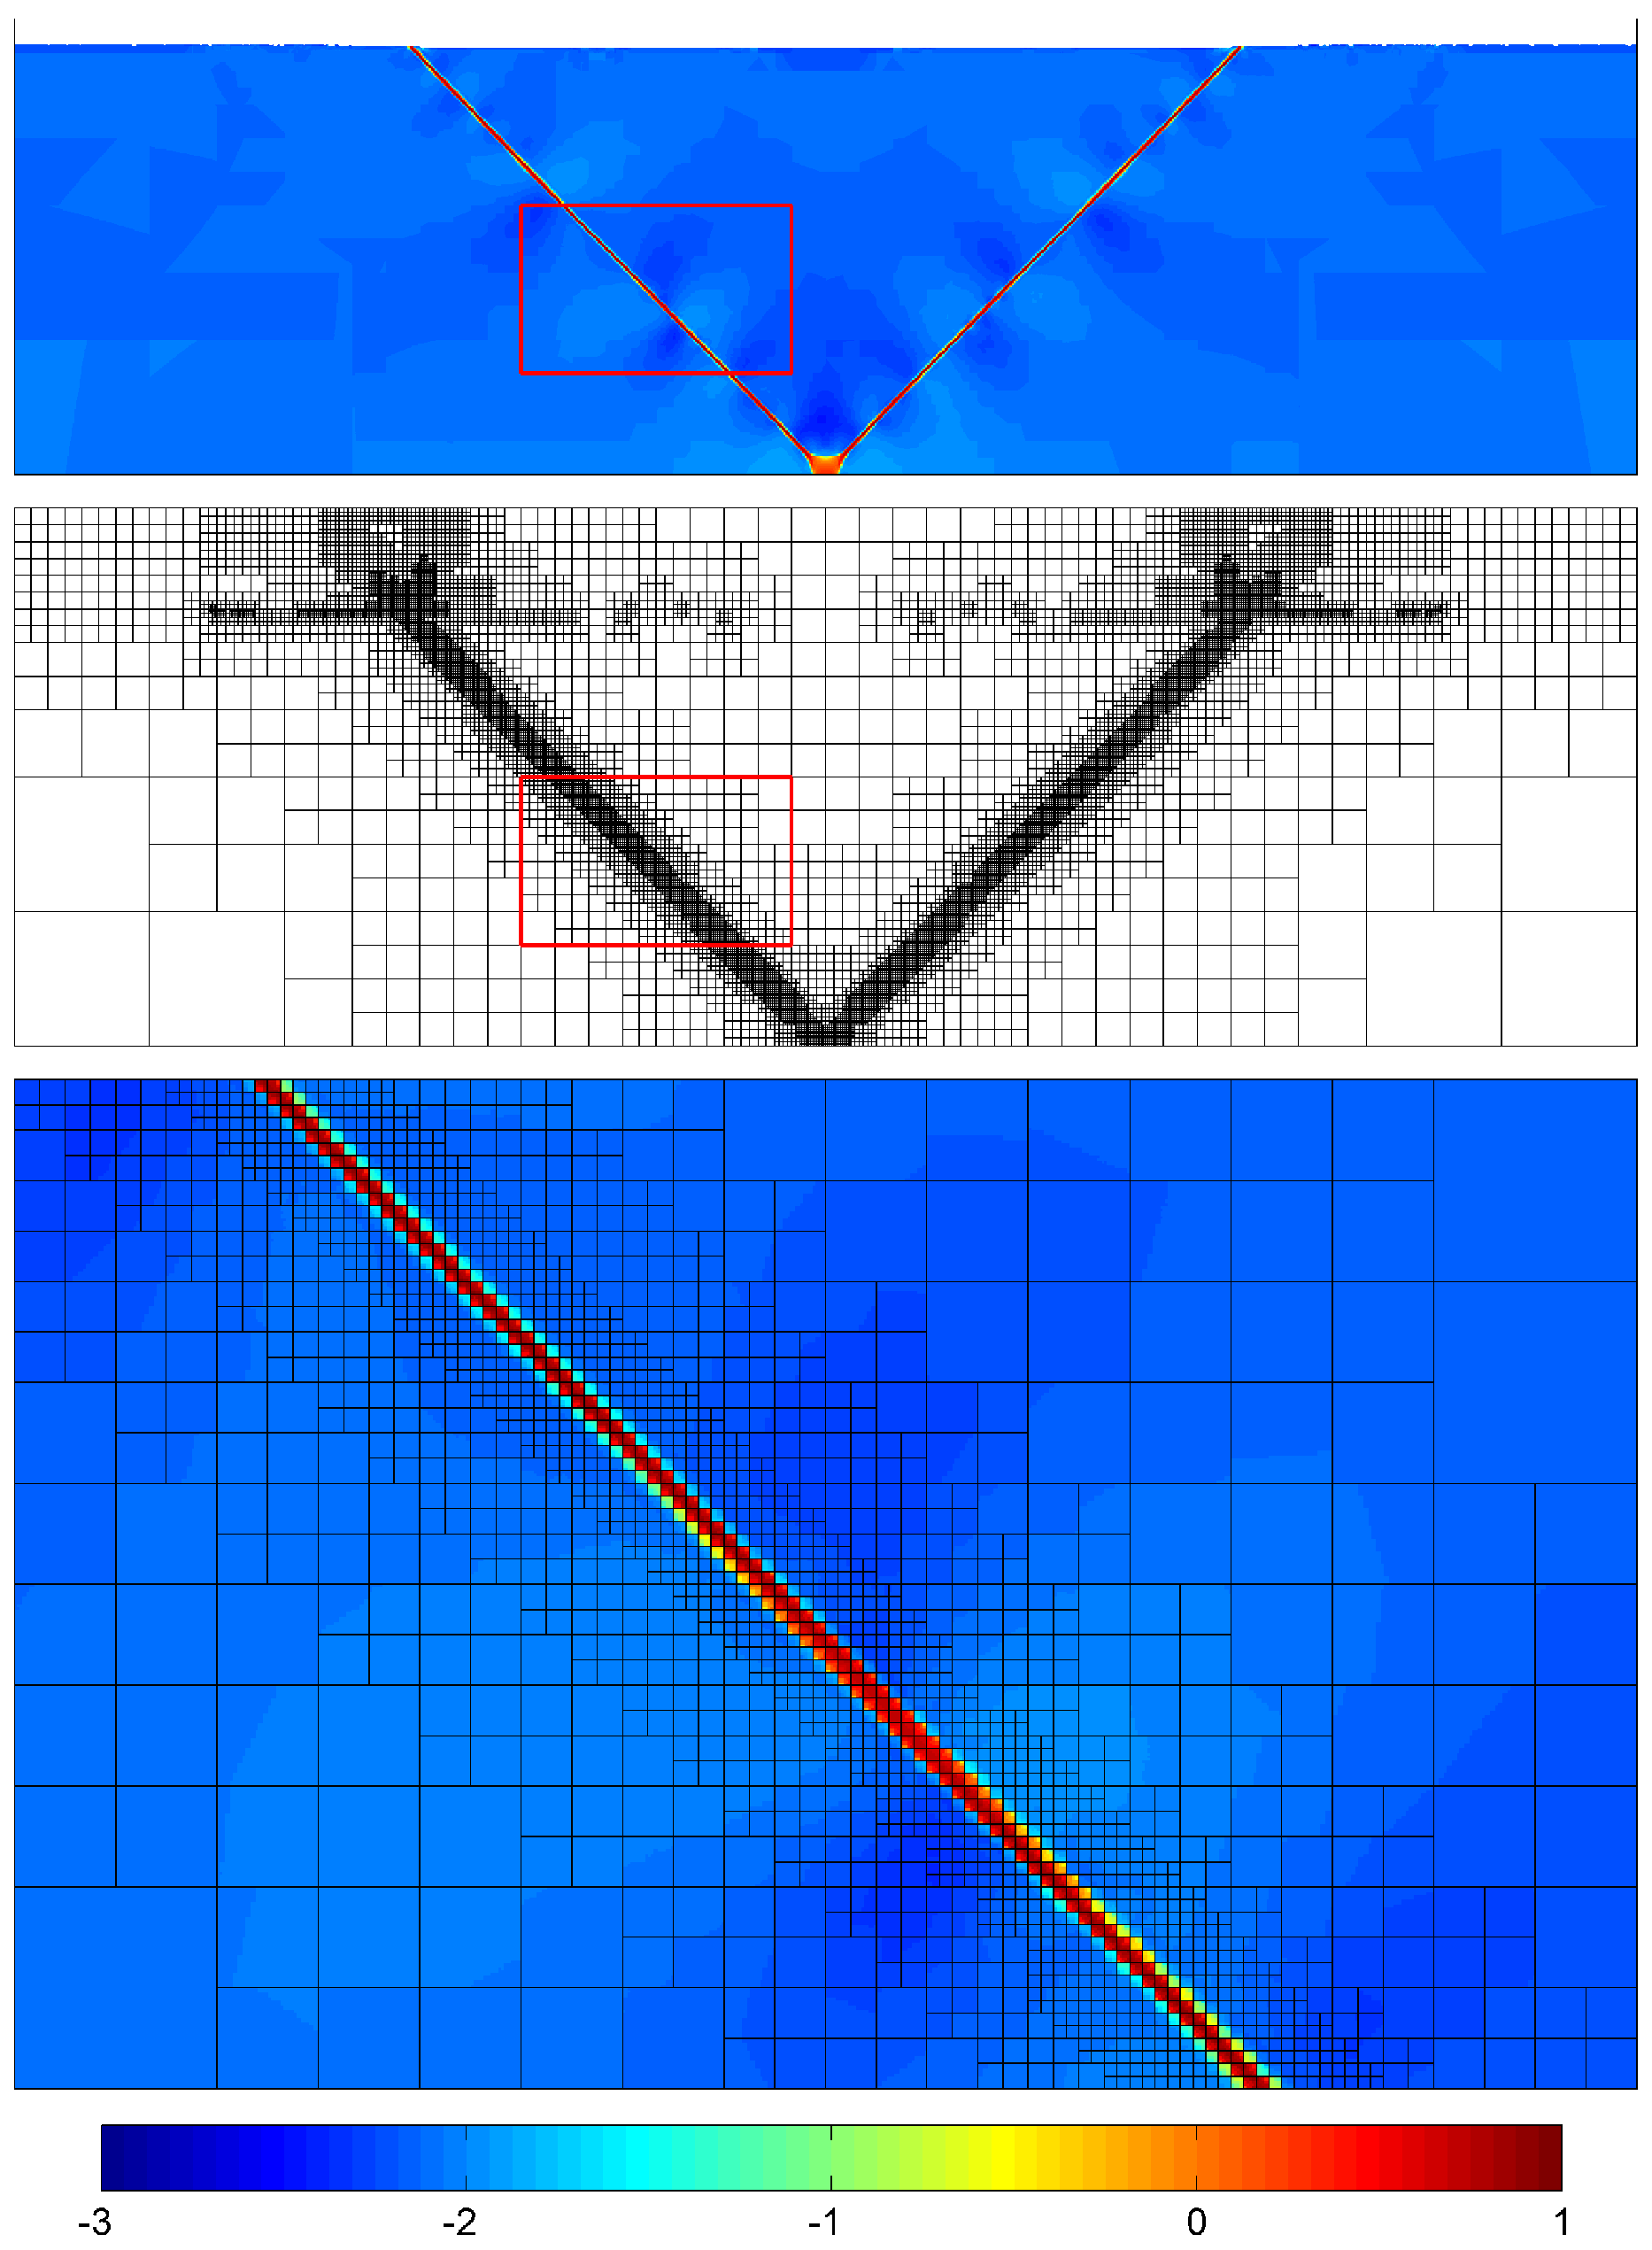
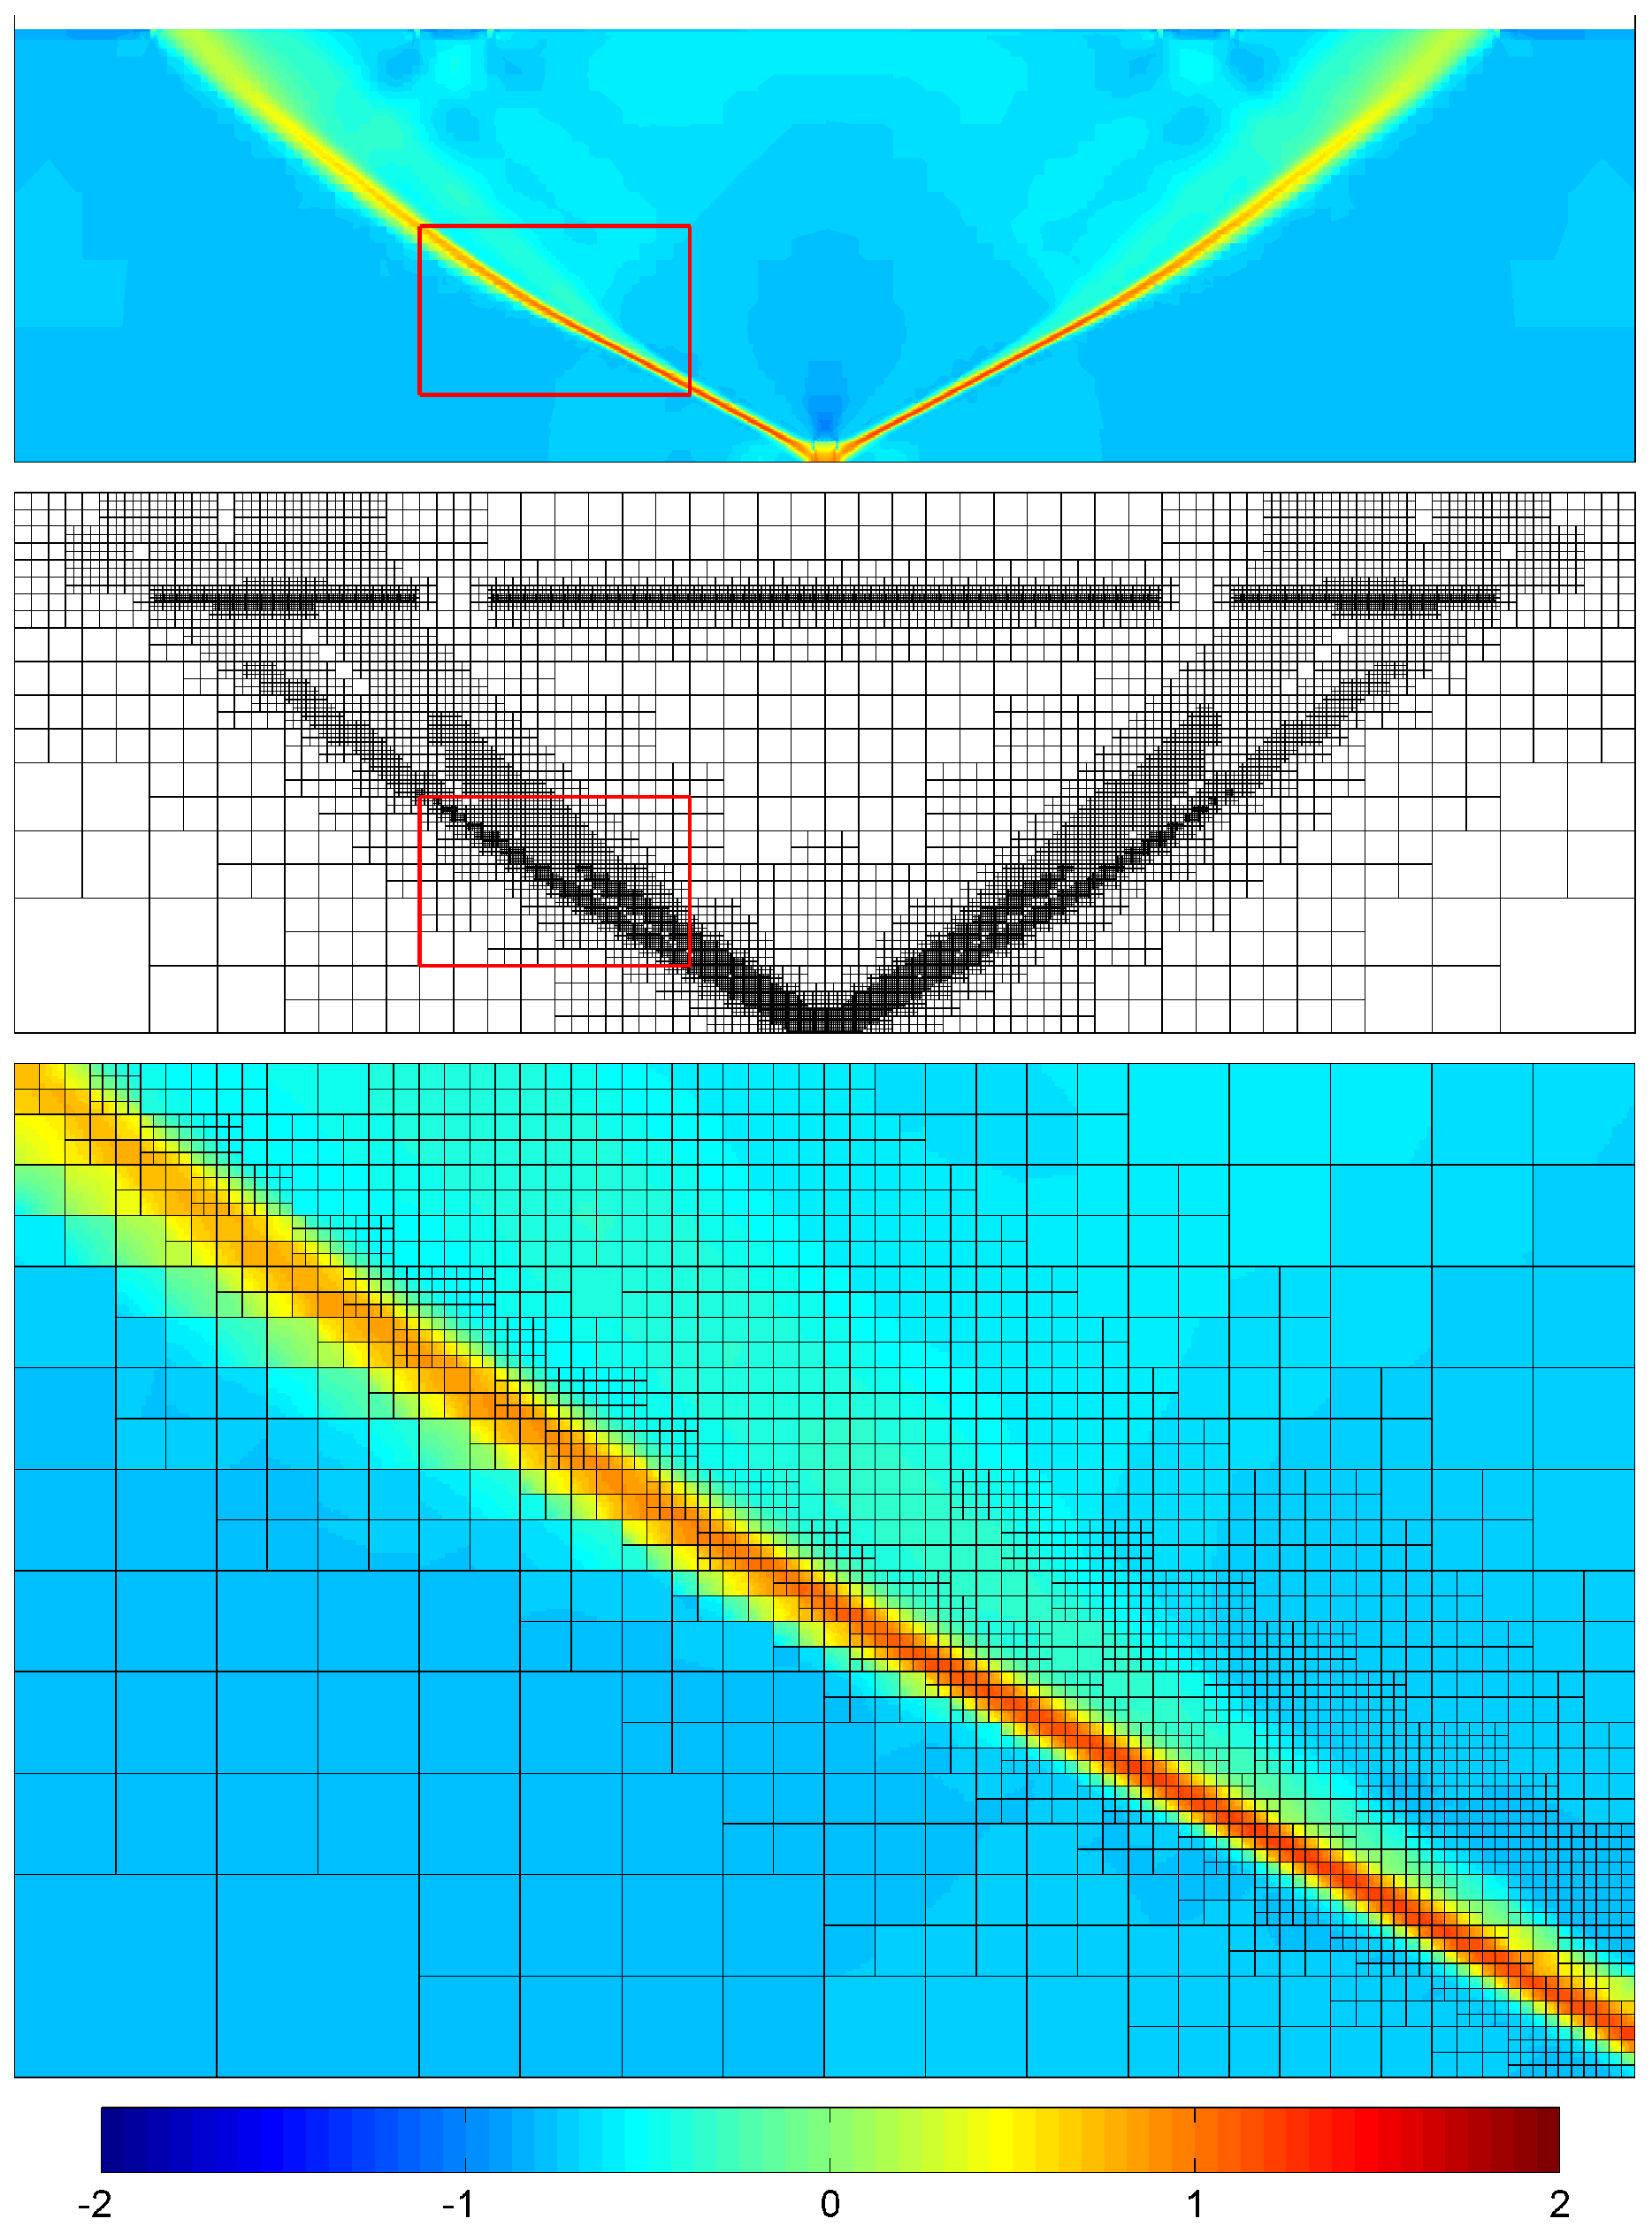
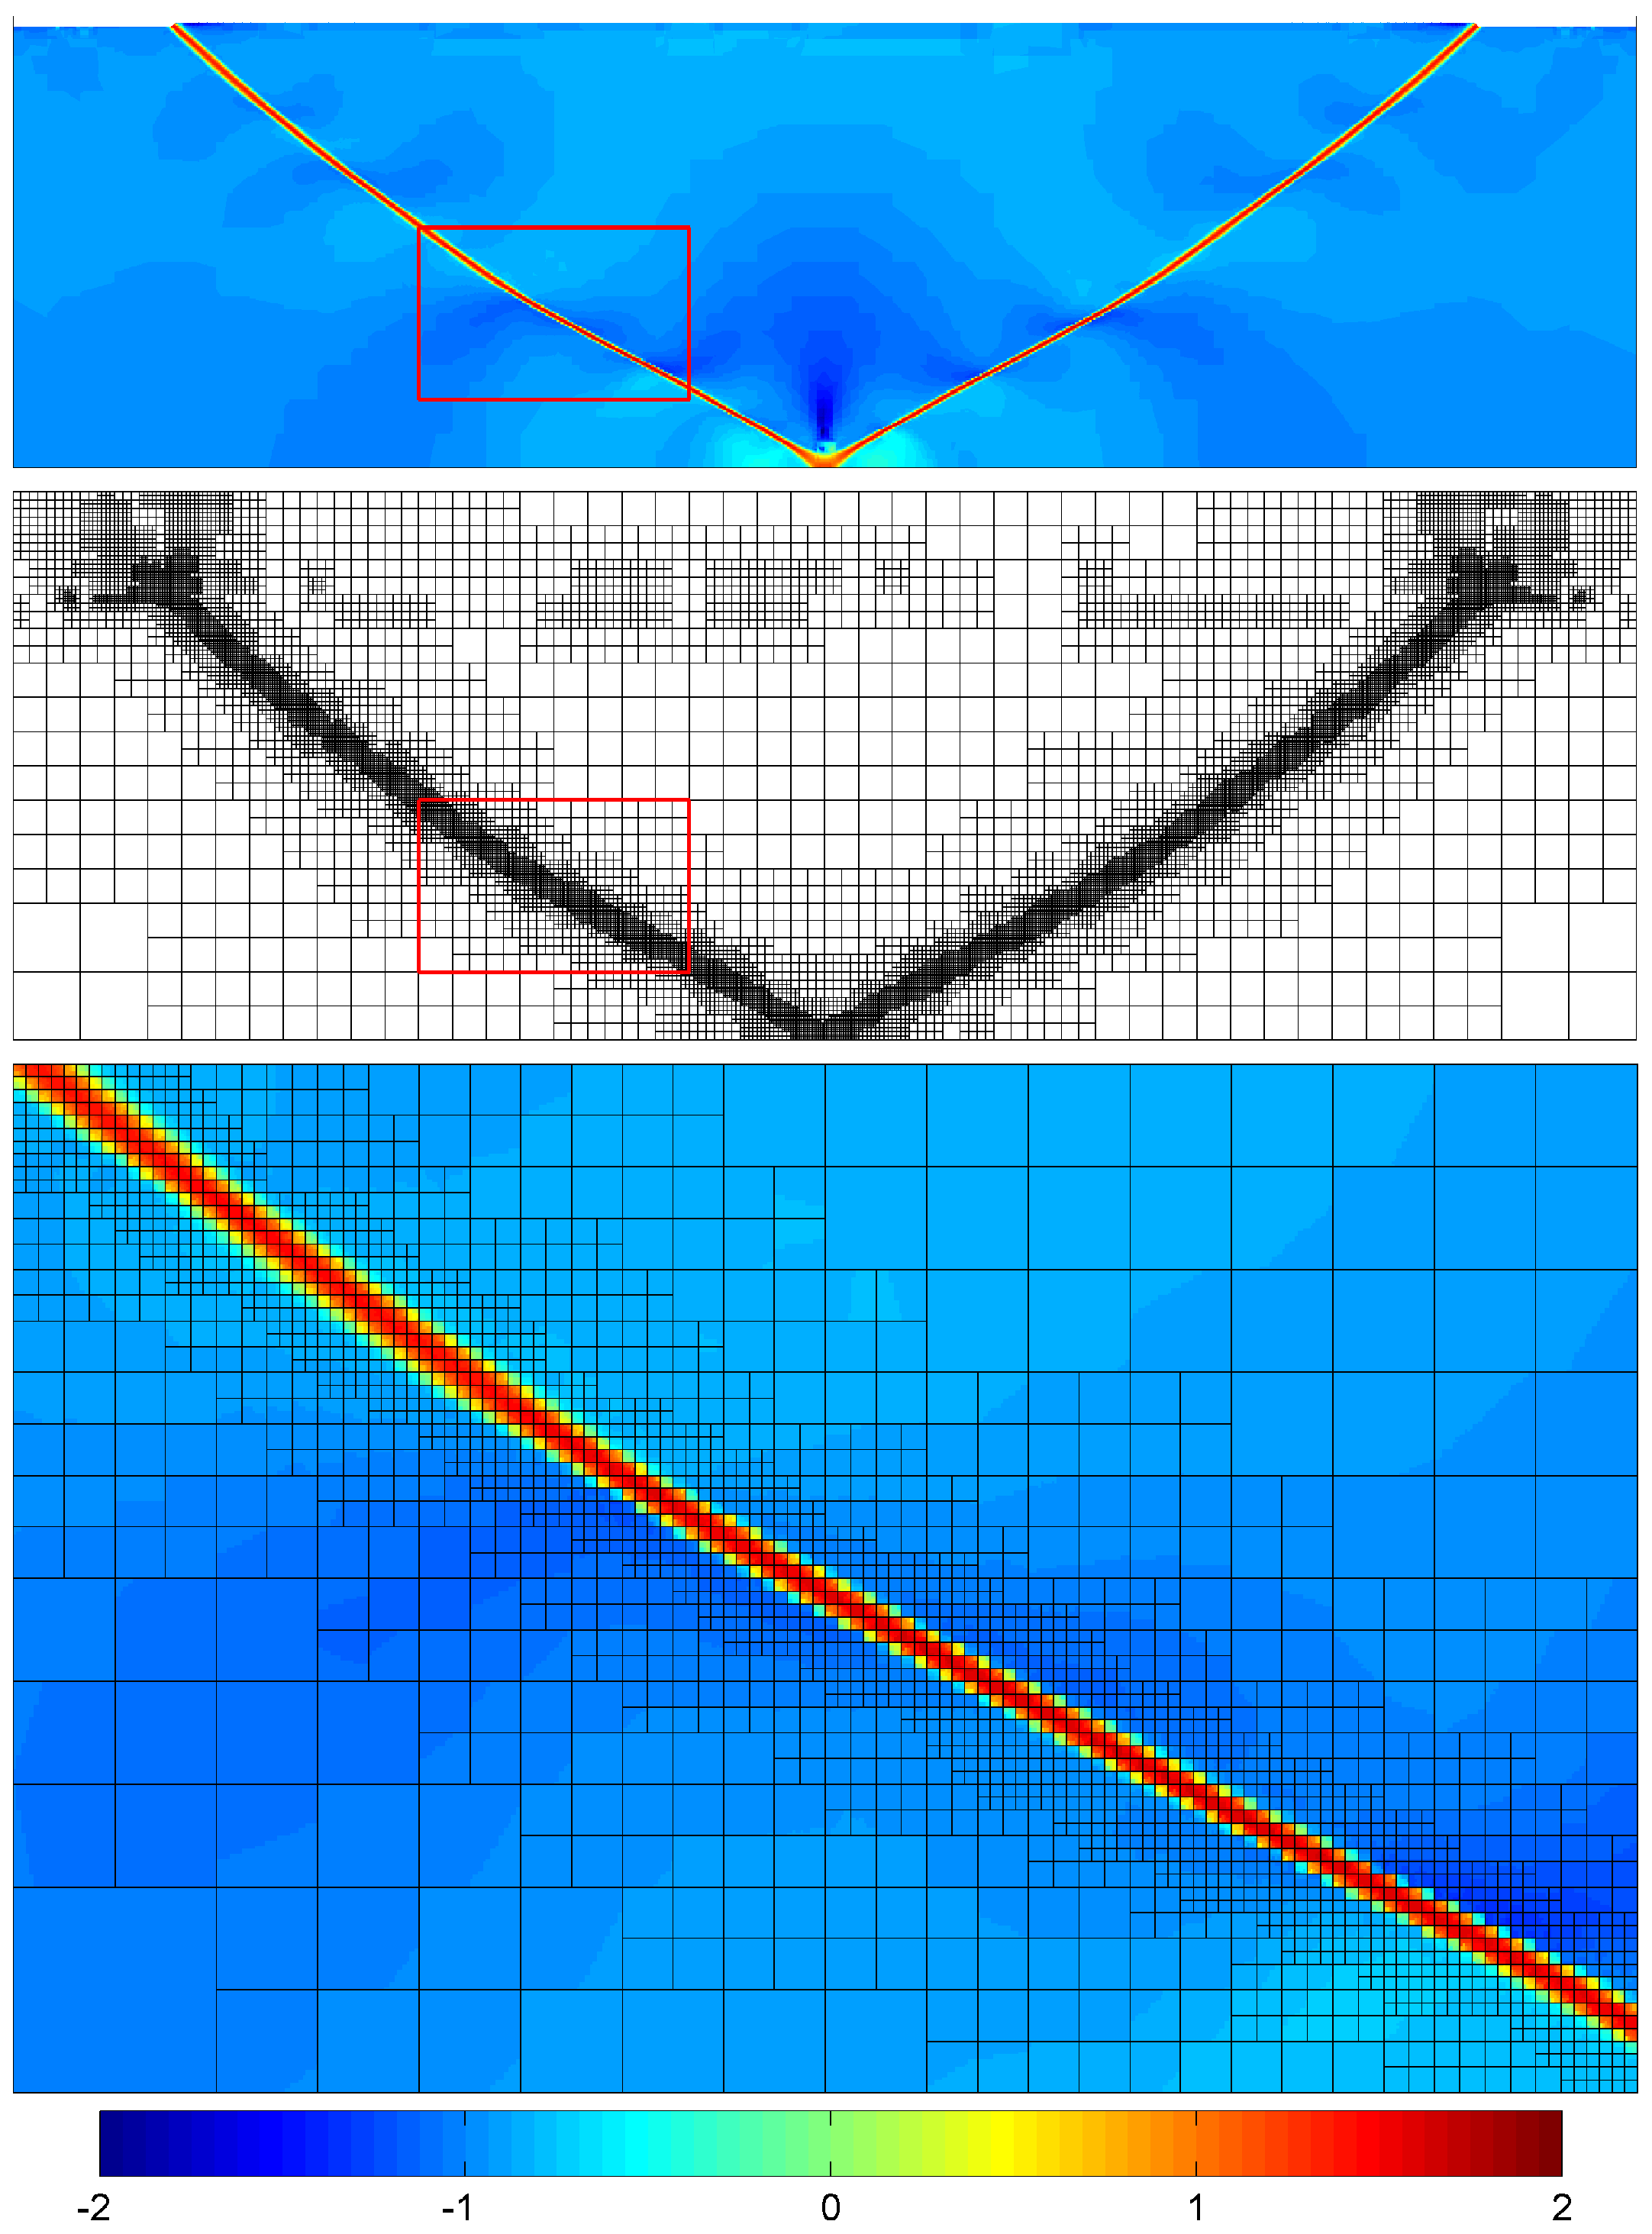
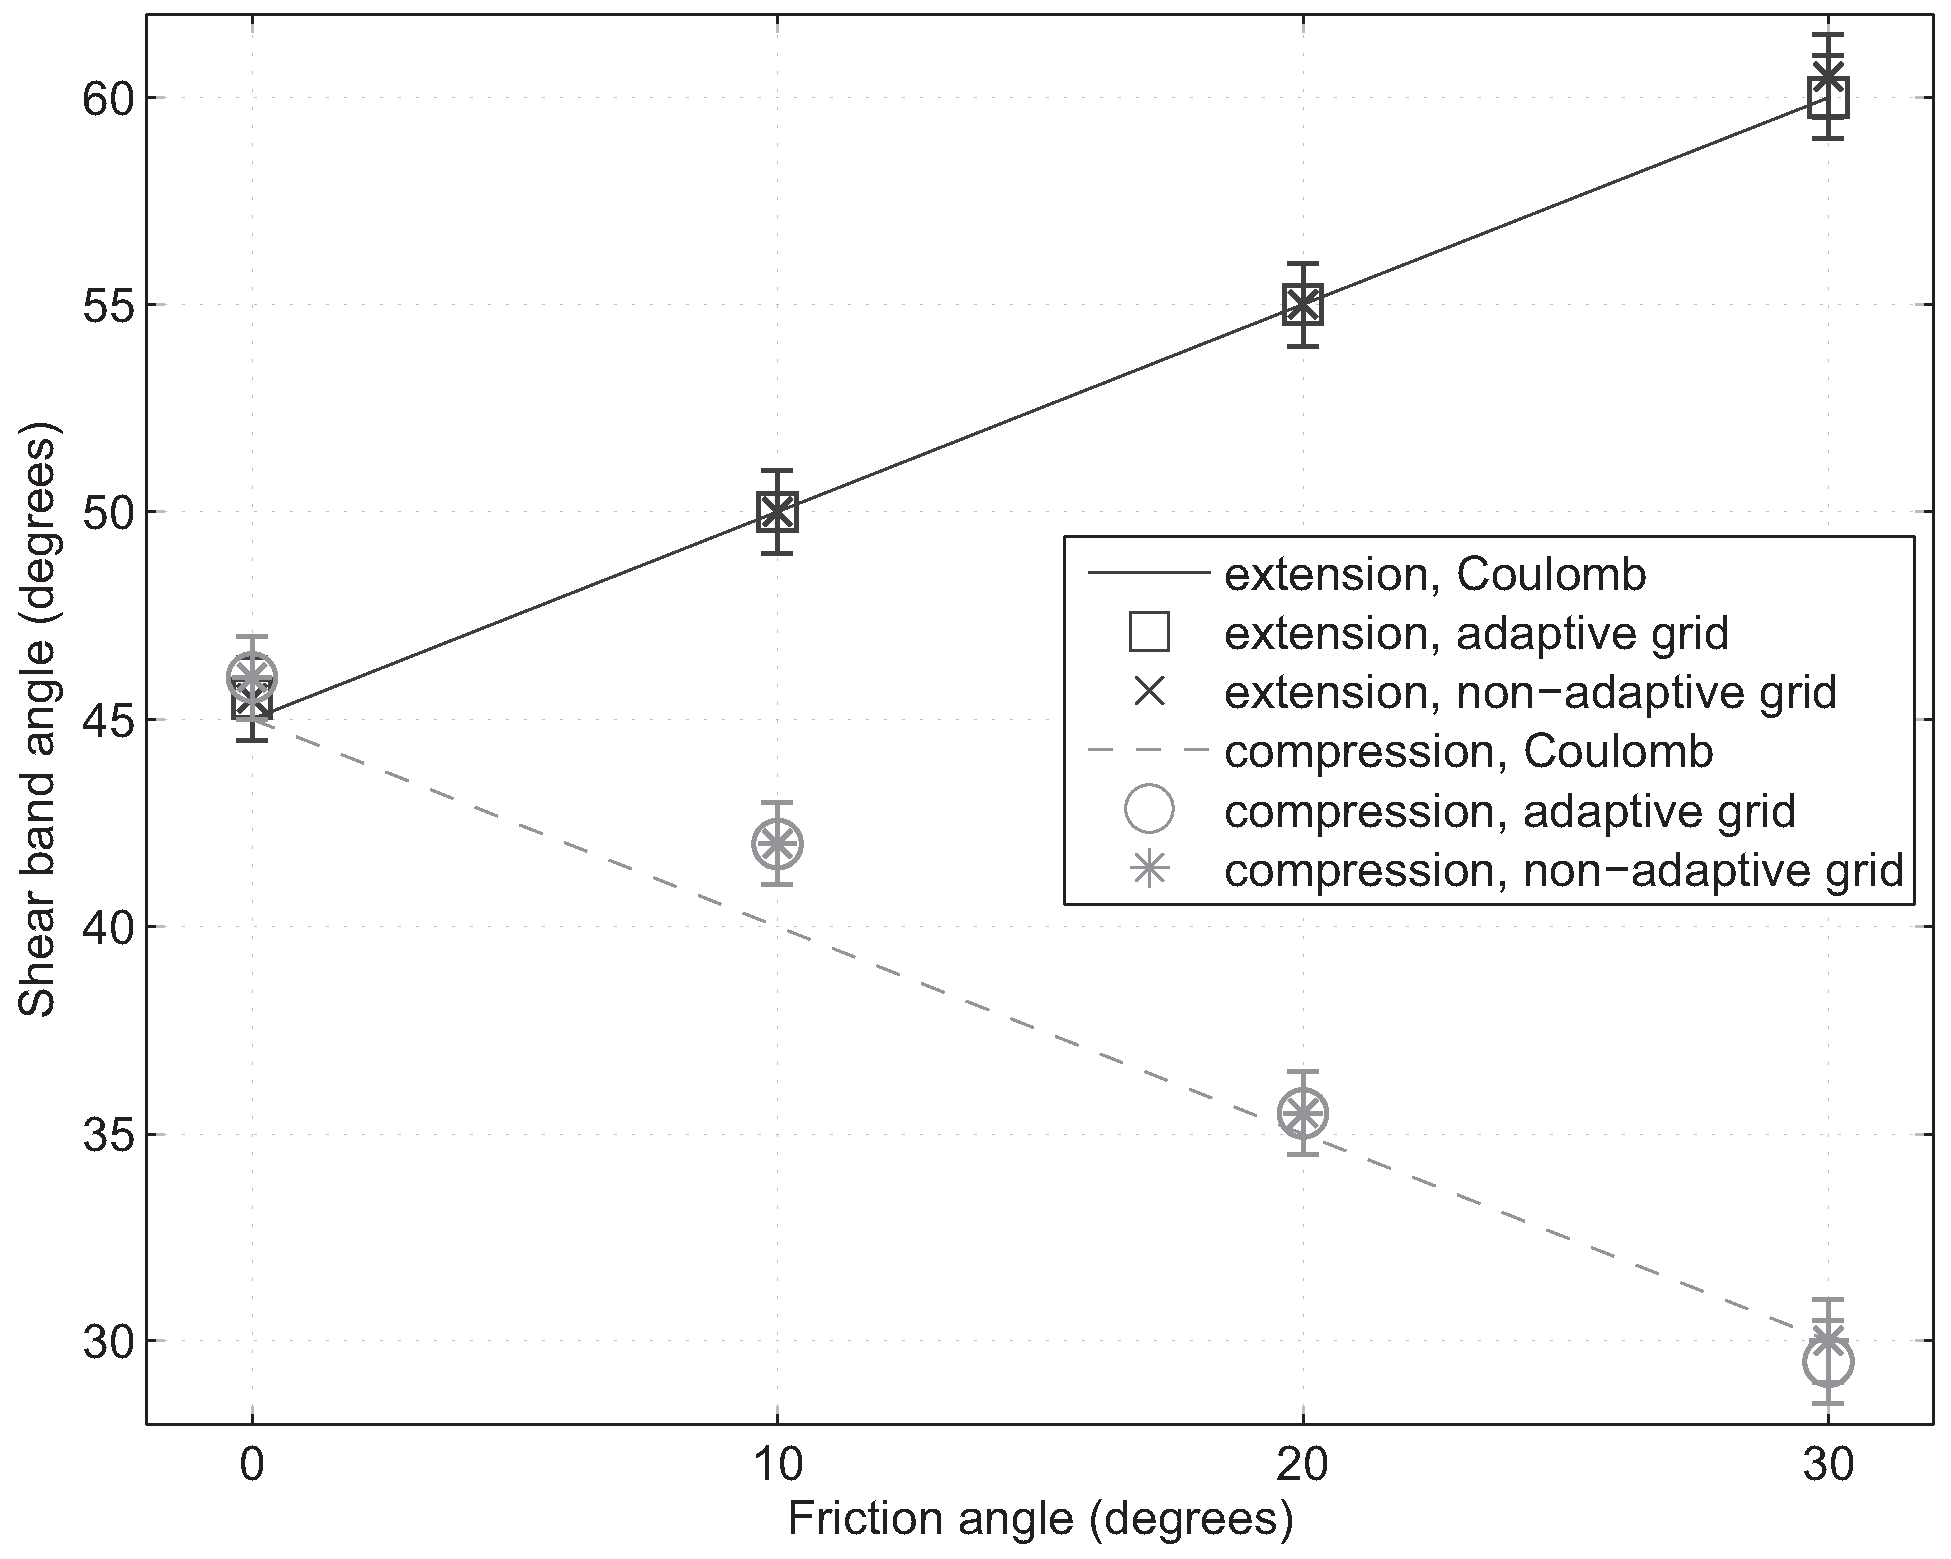
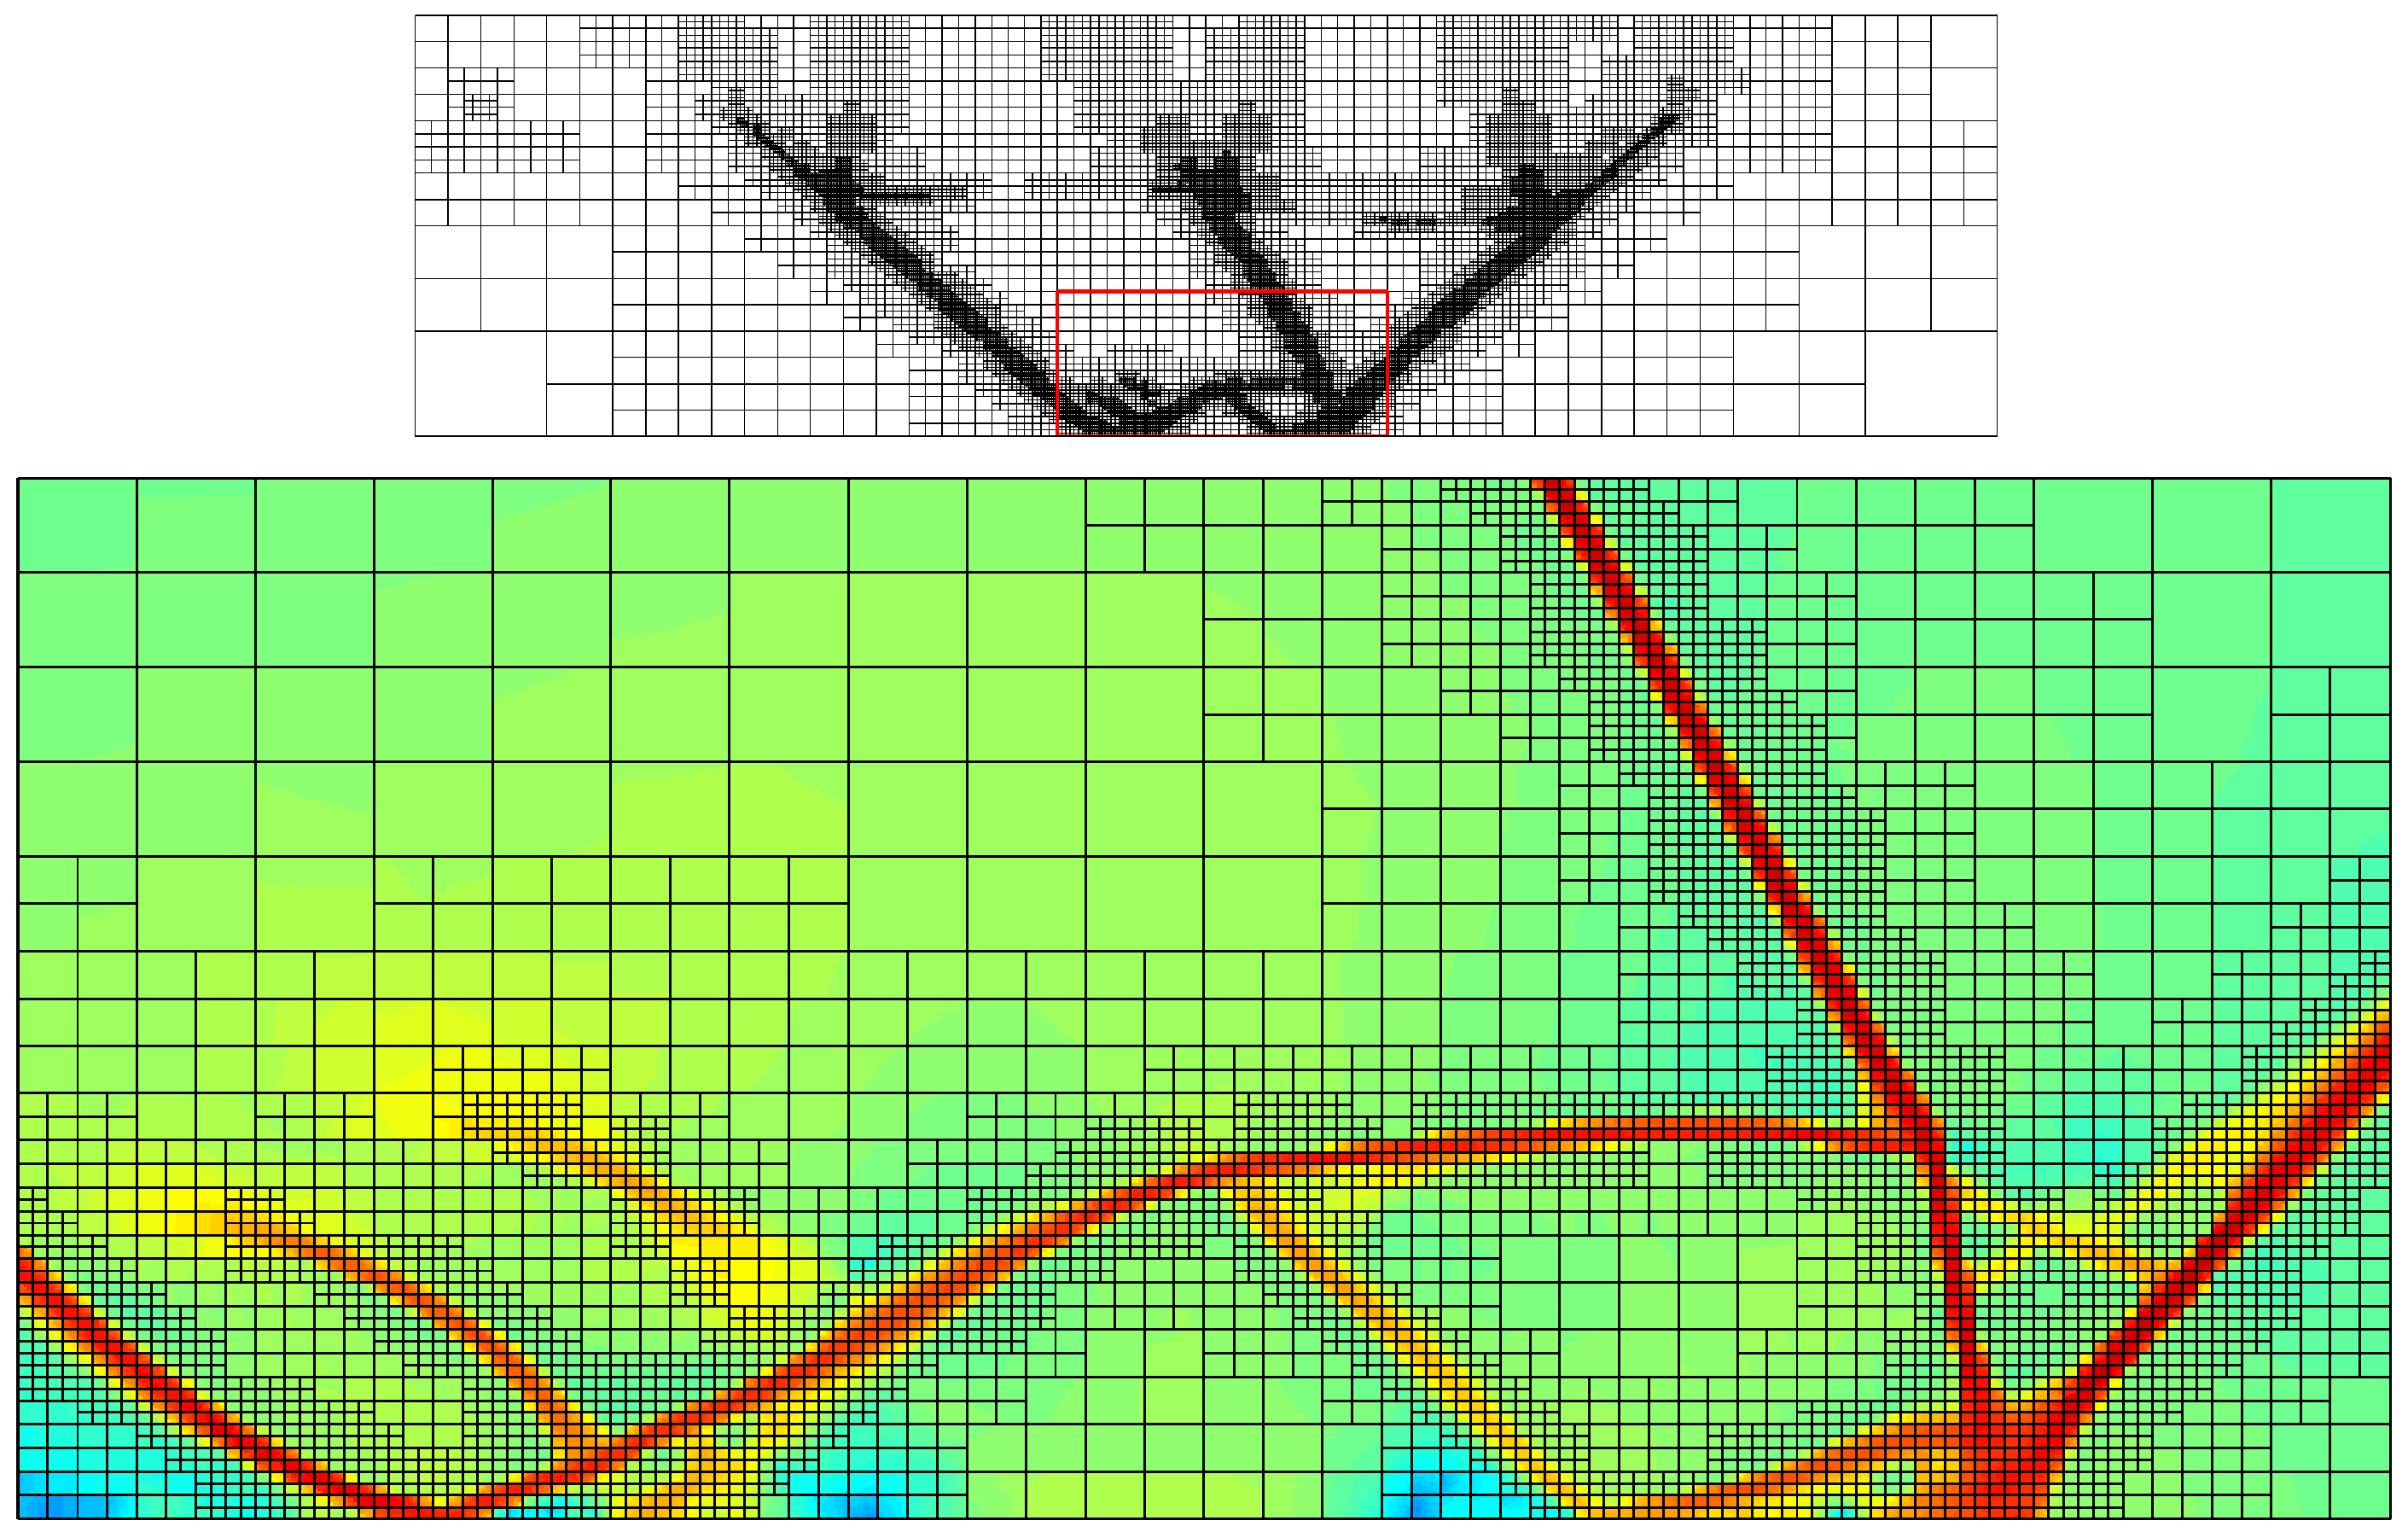
8.3.2. Shear Bands Formation
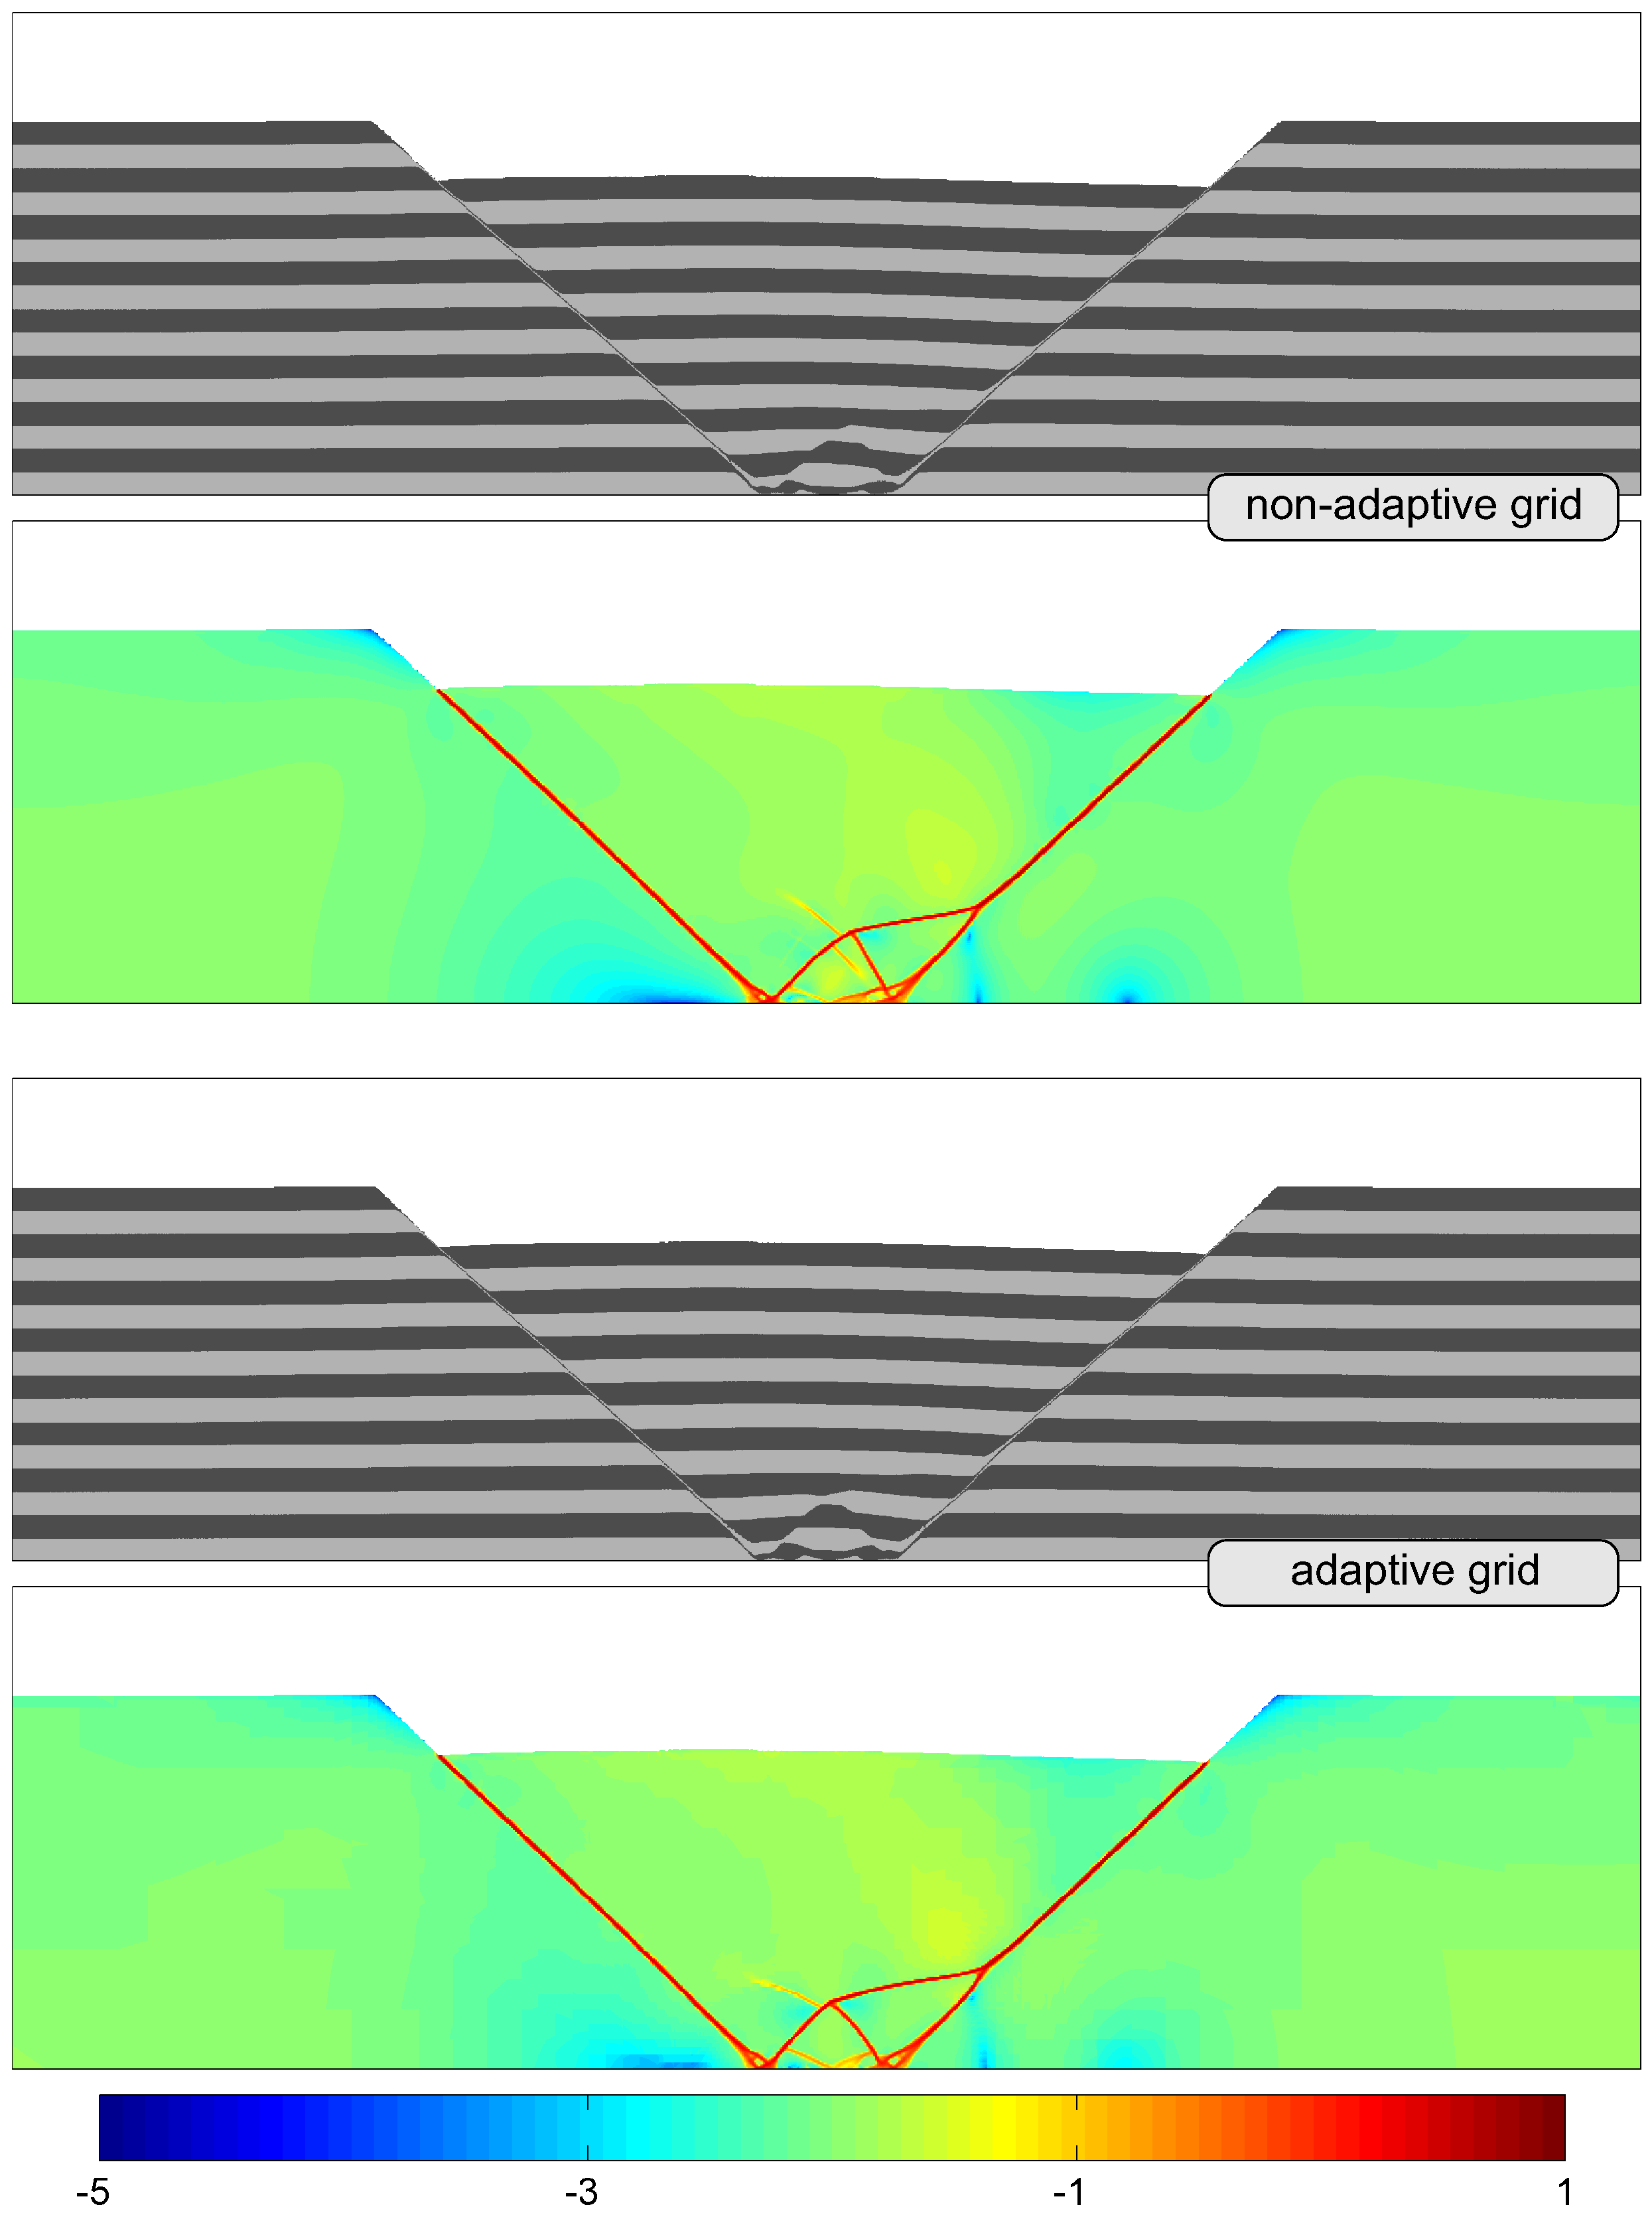
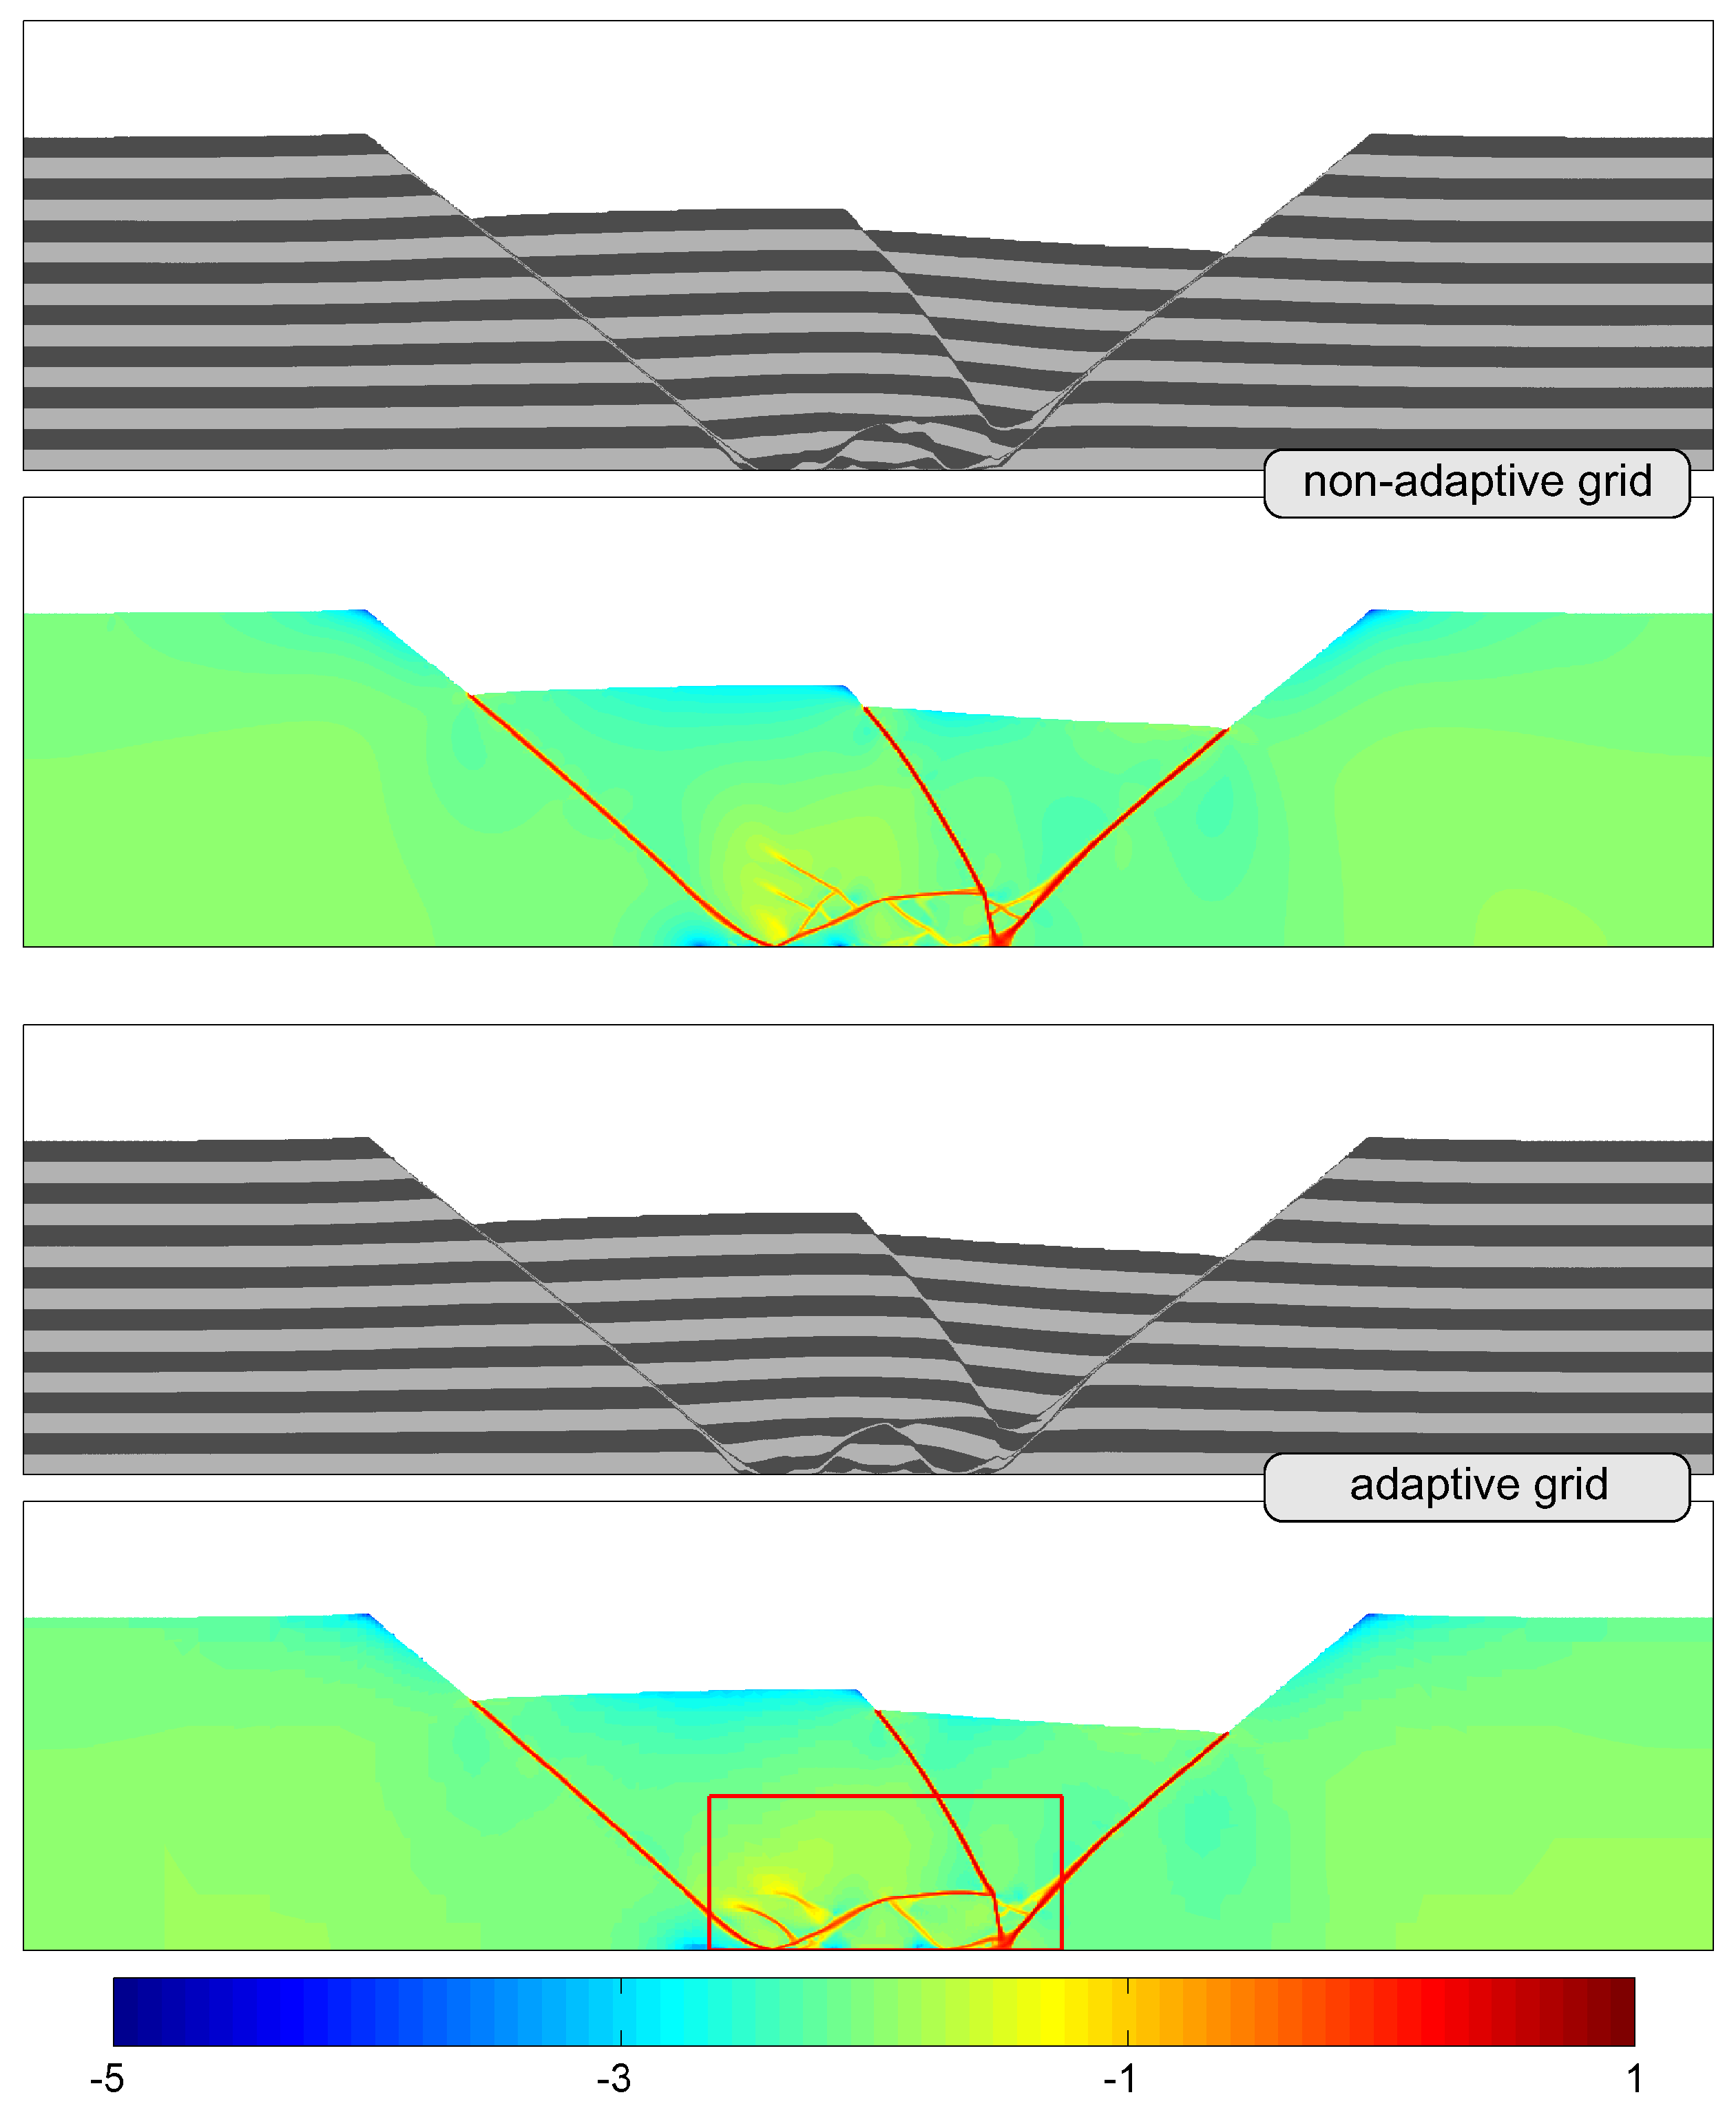
8.3.3. Long-Term Brittle Extension
8.3.4. Performance Analysis
8.4. Incompressibility Issue with Element
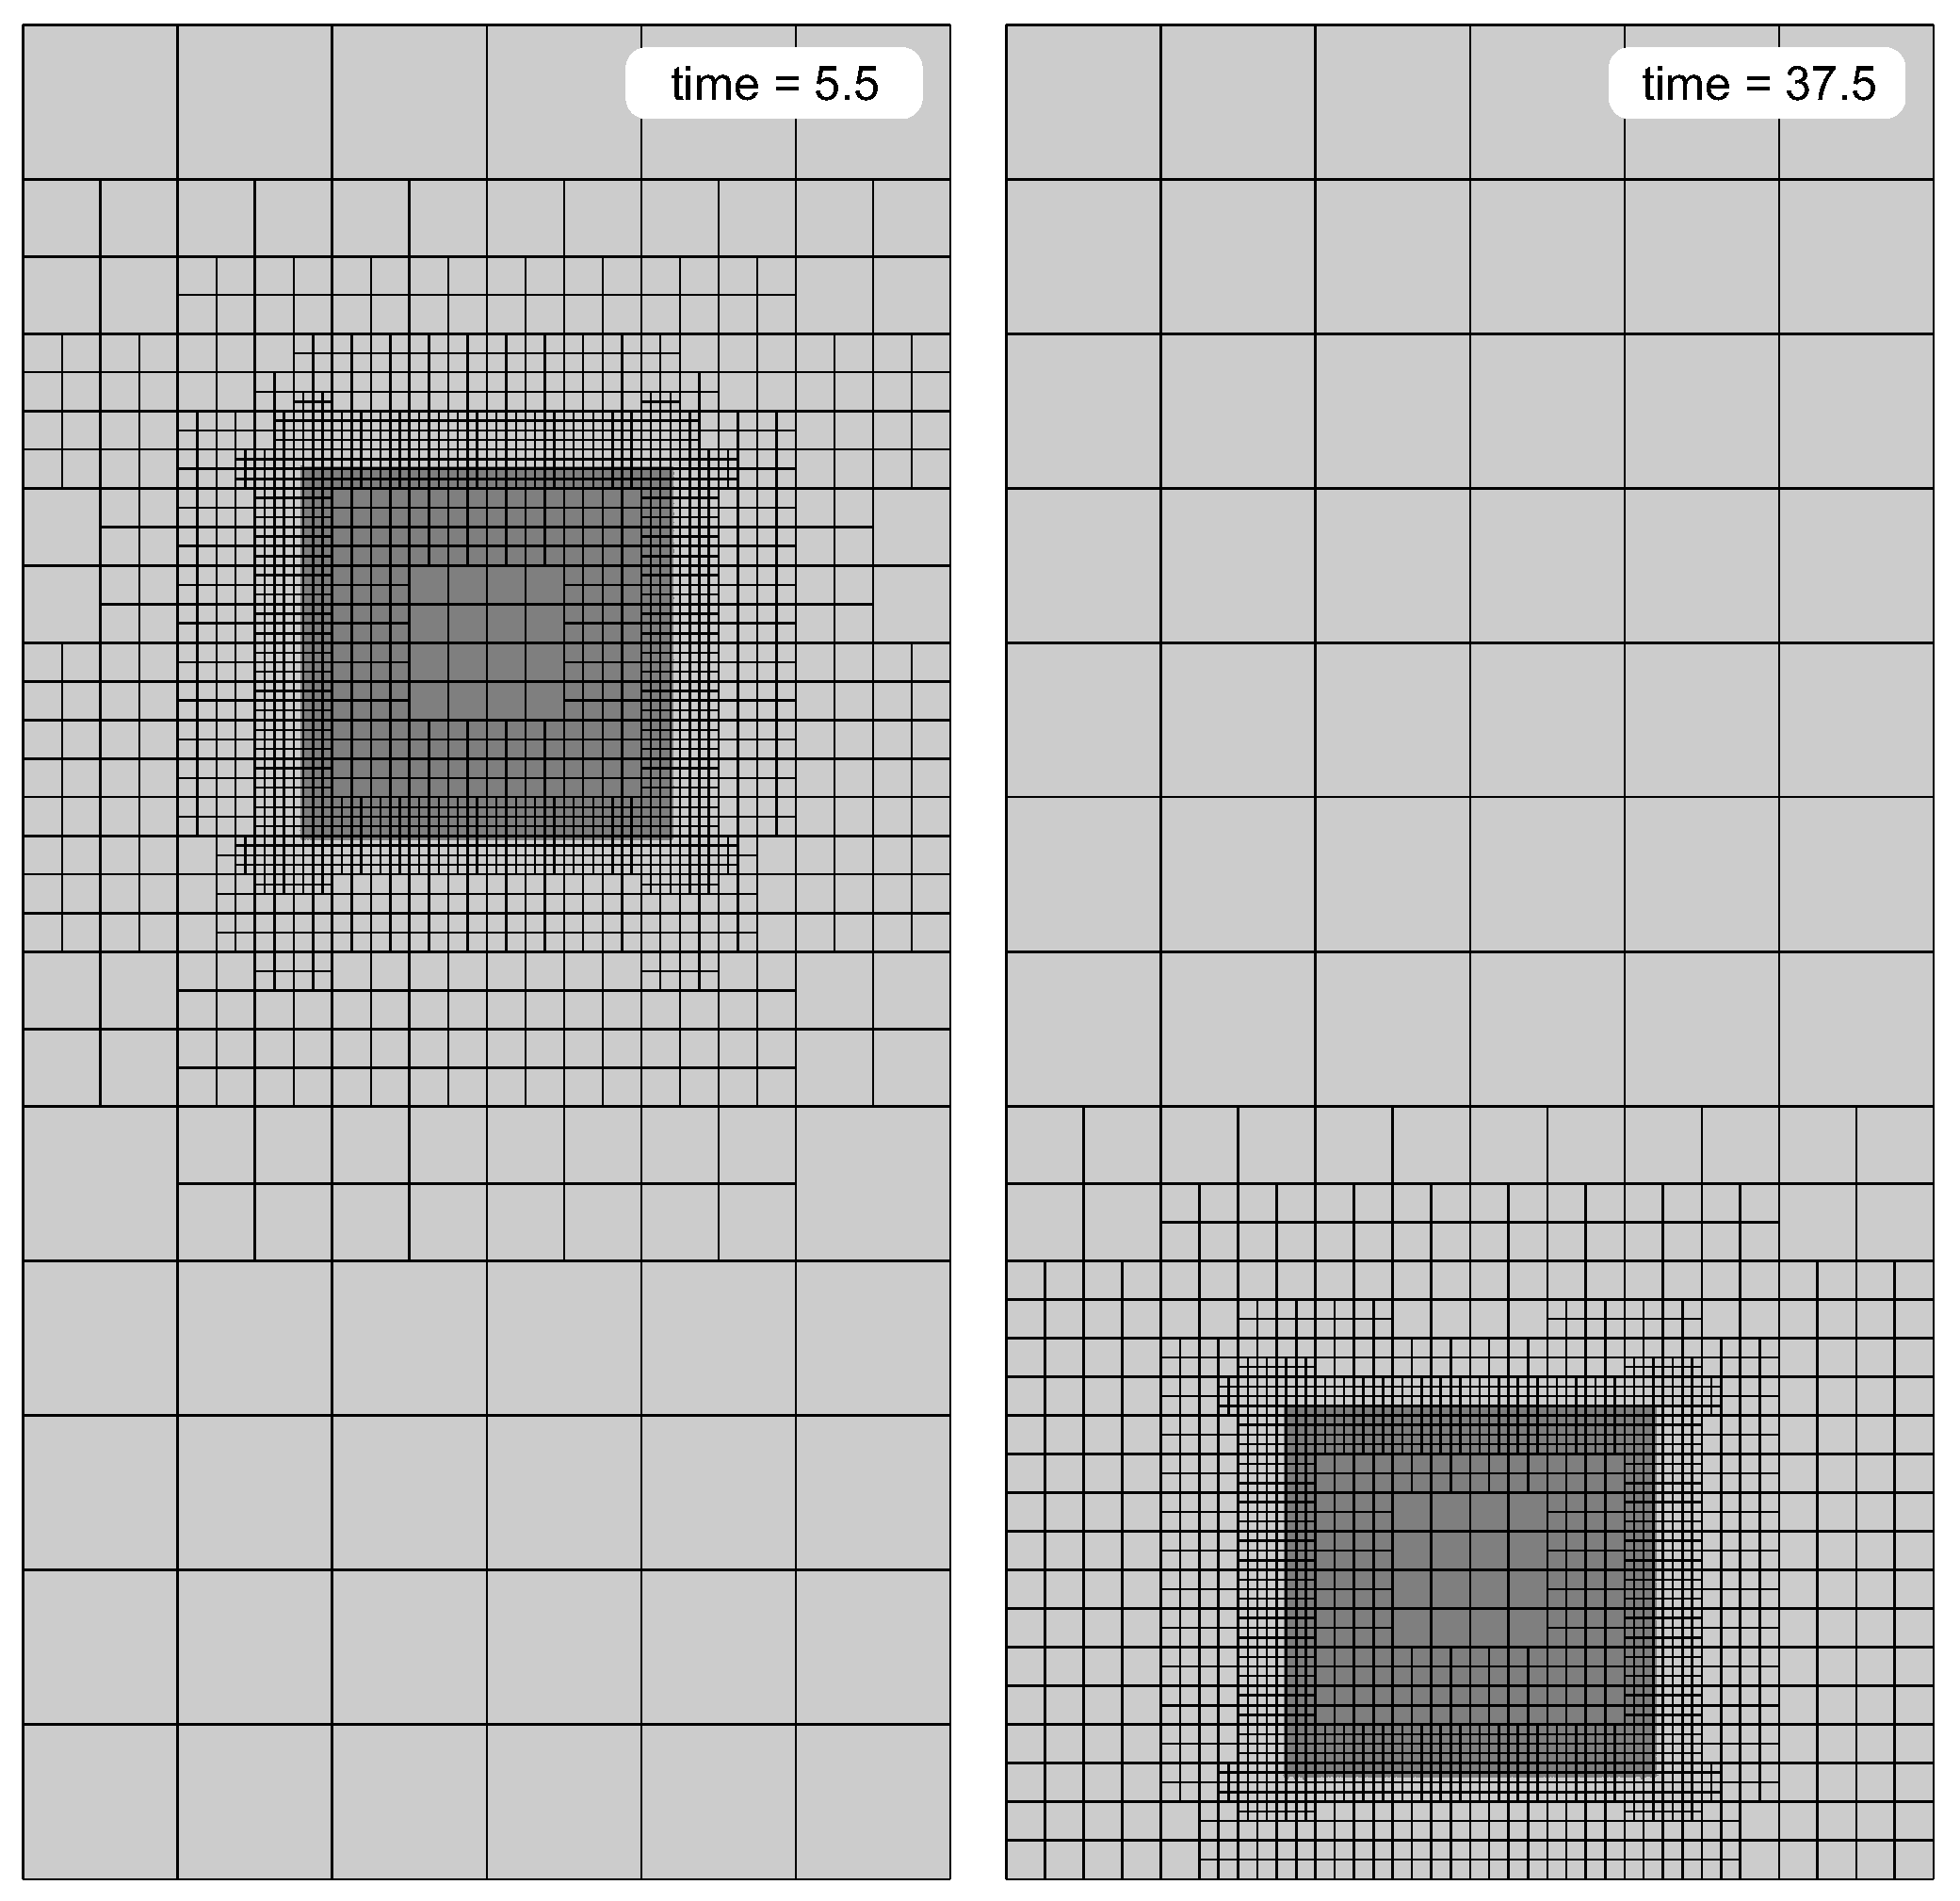
8.5. Rayleigh-Taylor Instability Benchmark
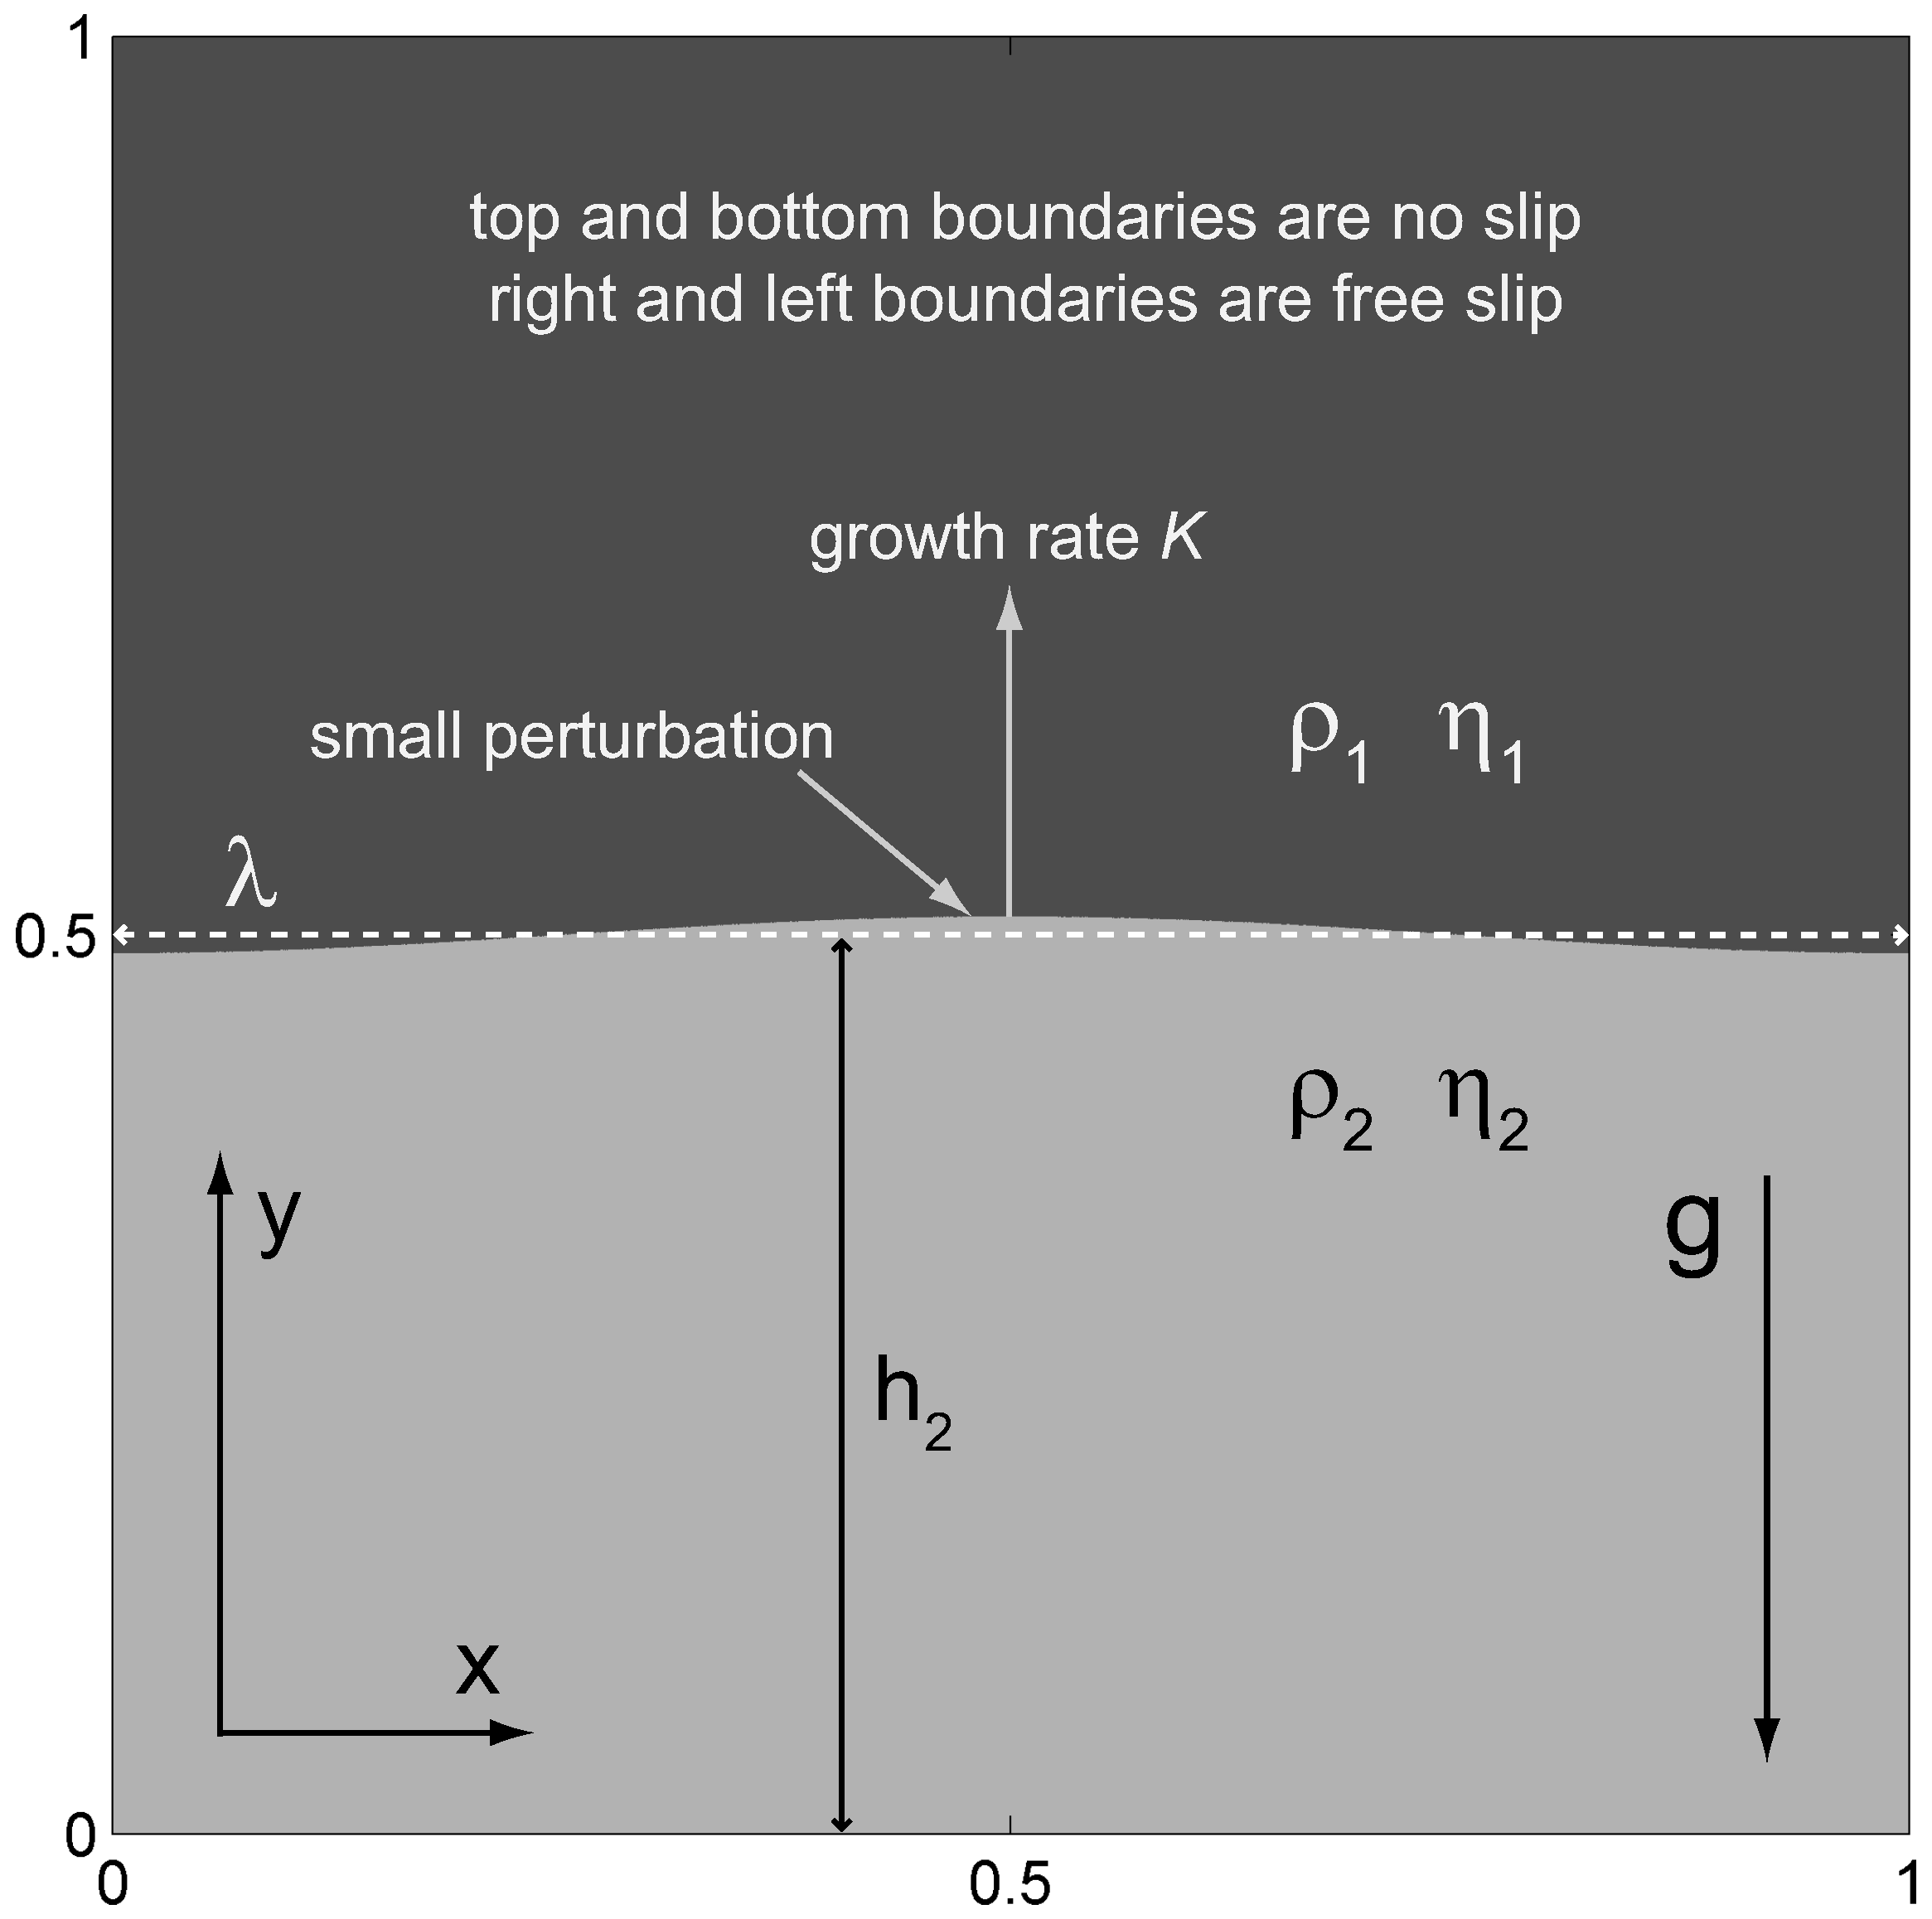
8.5.1. Setup and Parameters
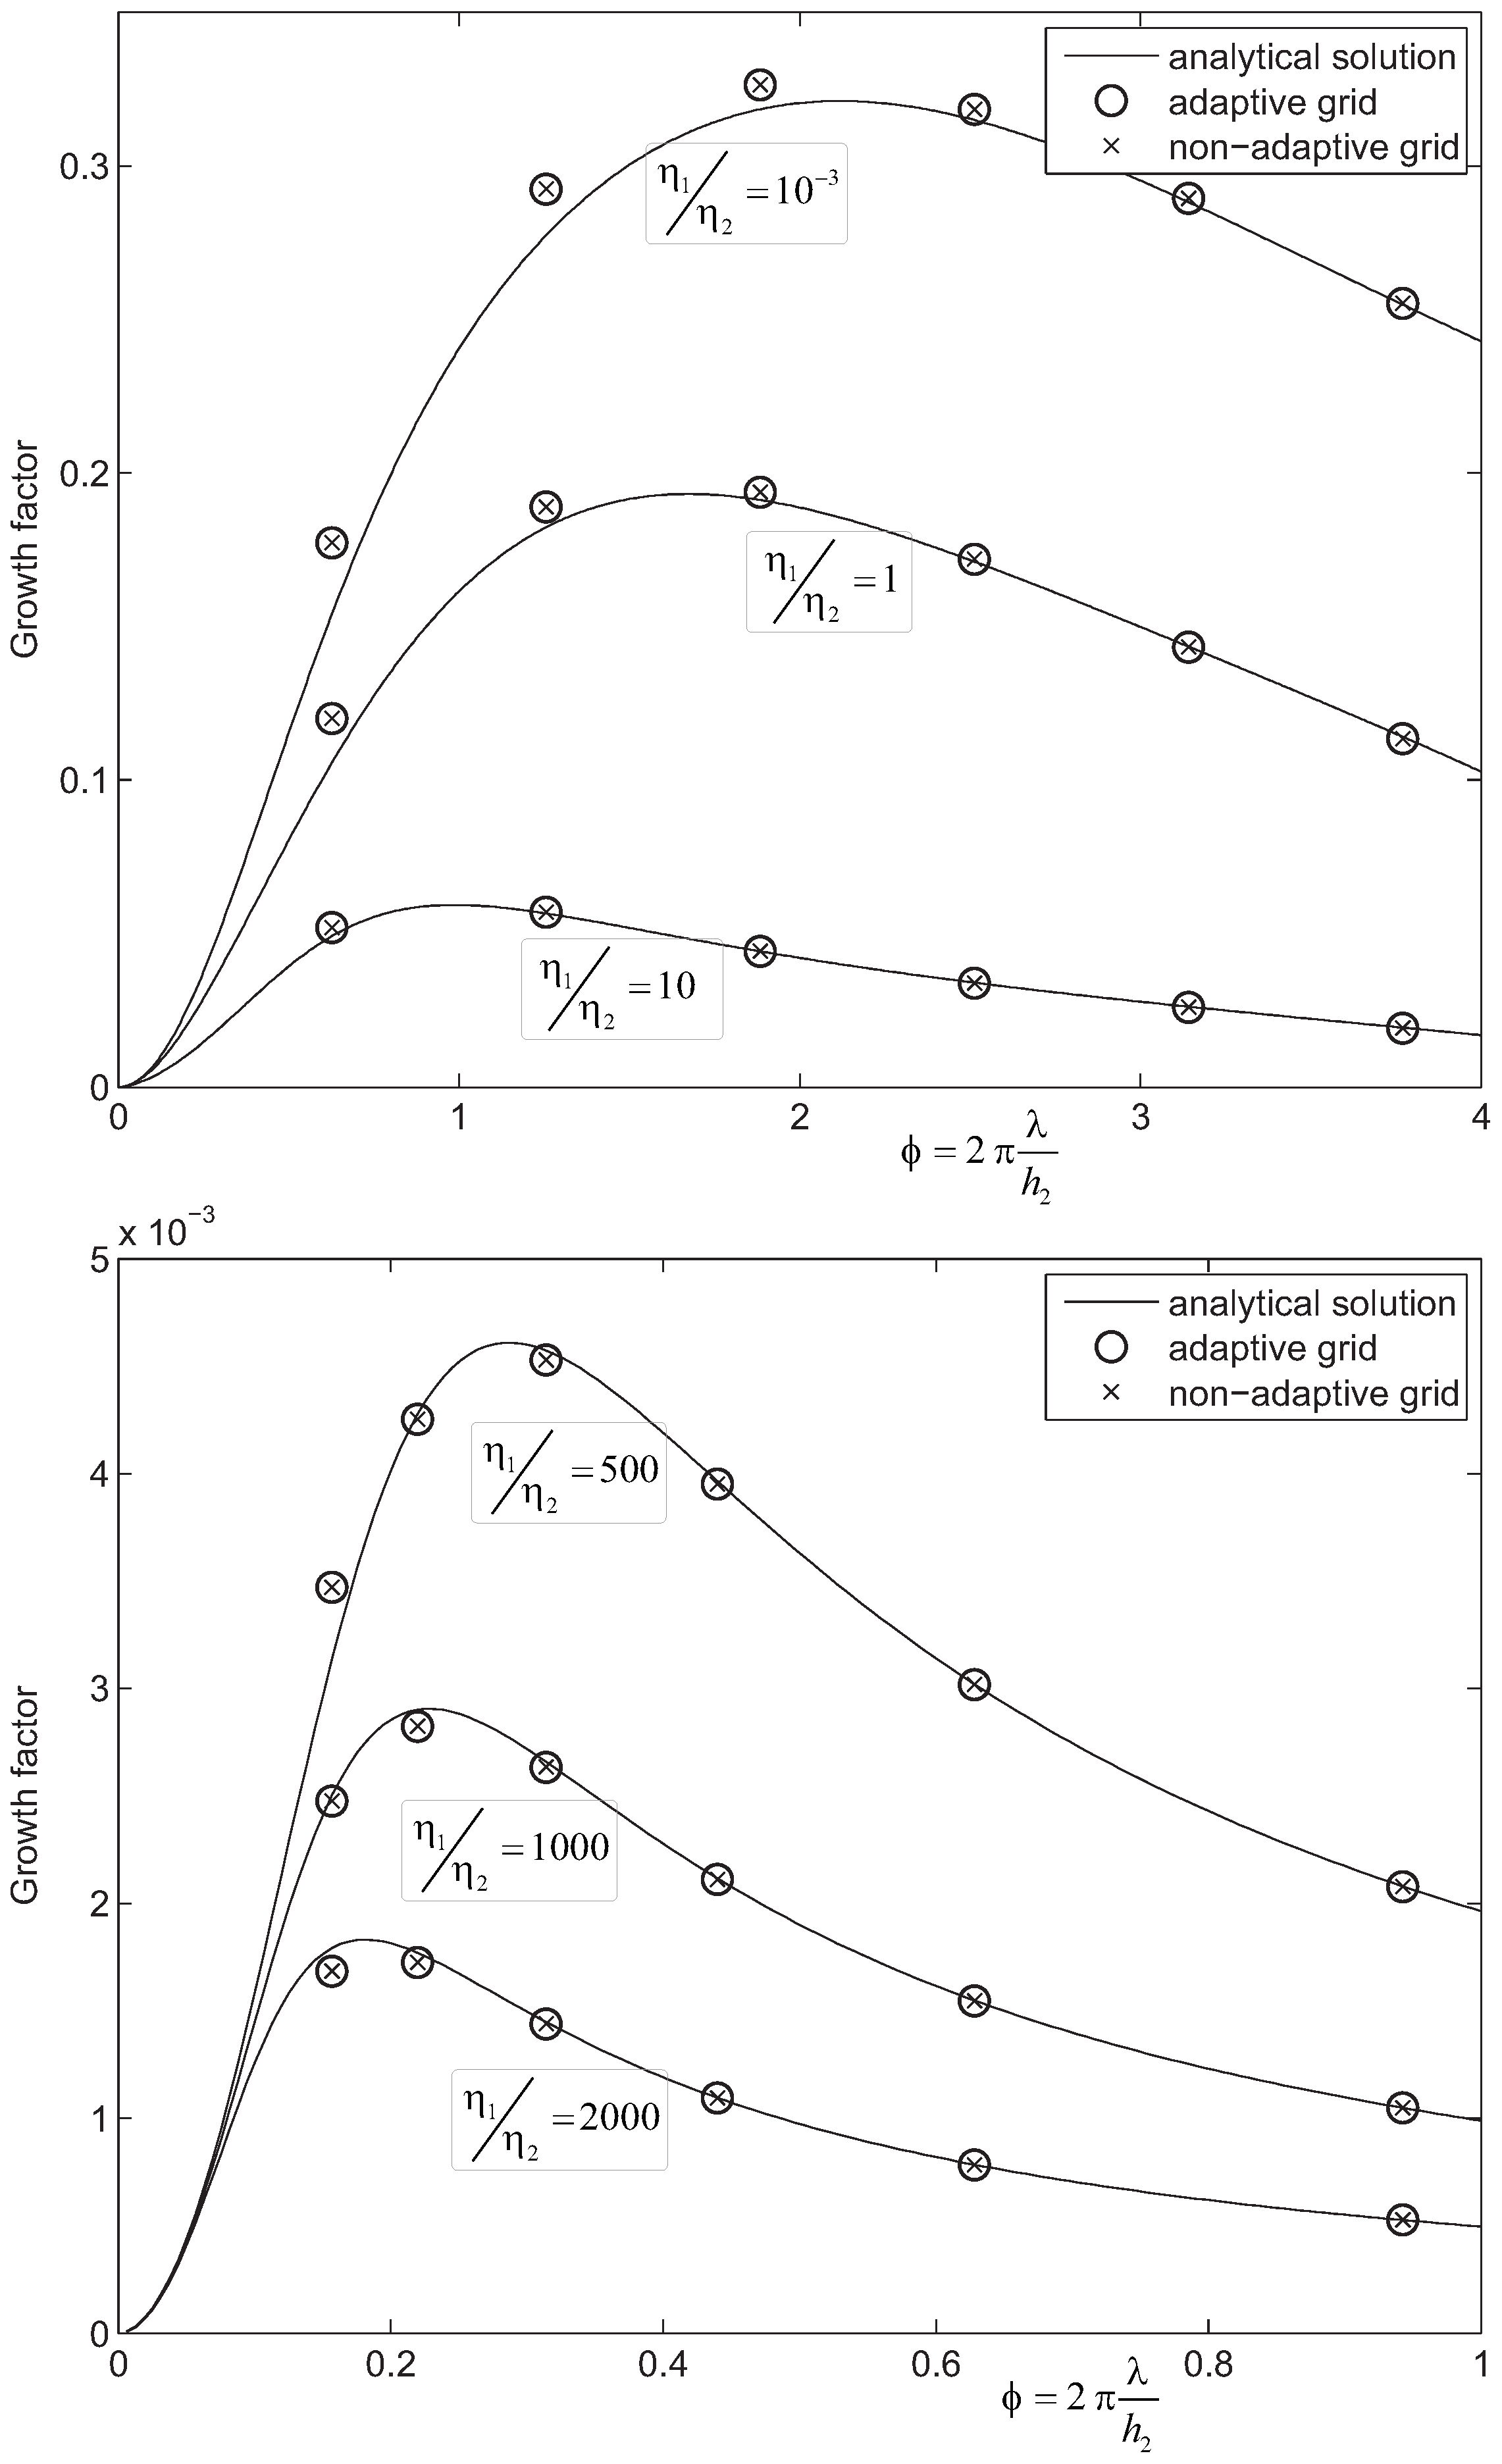
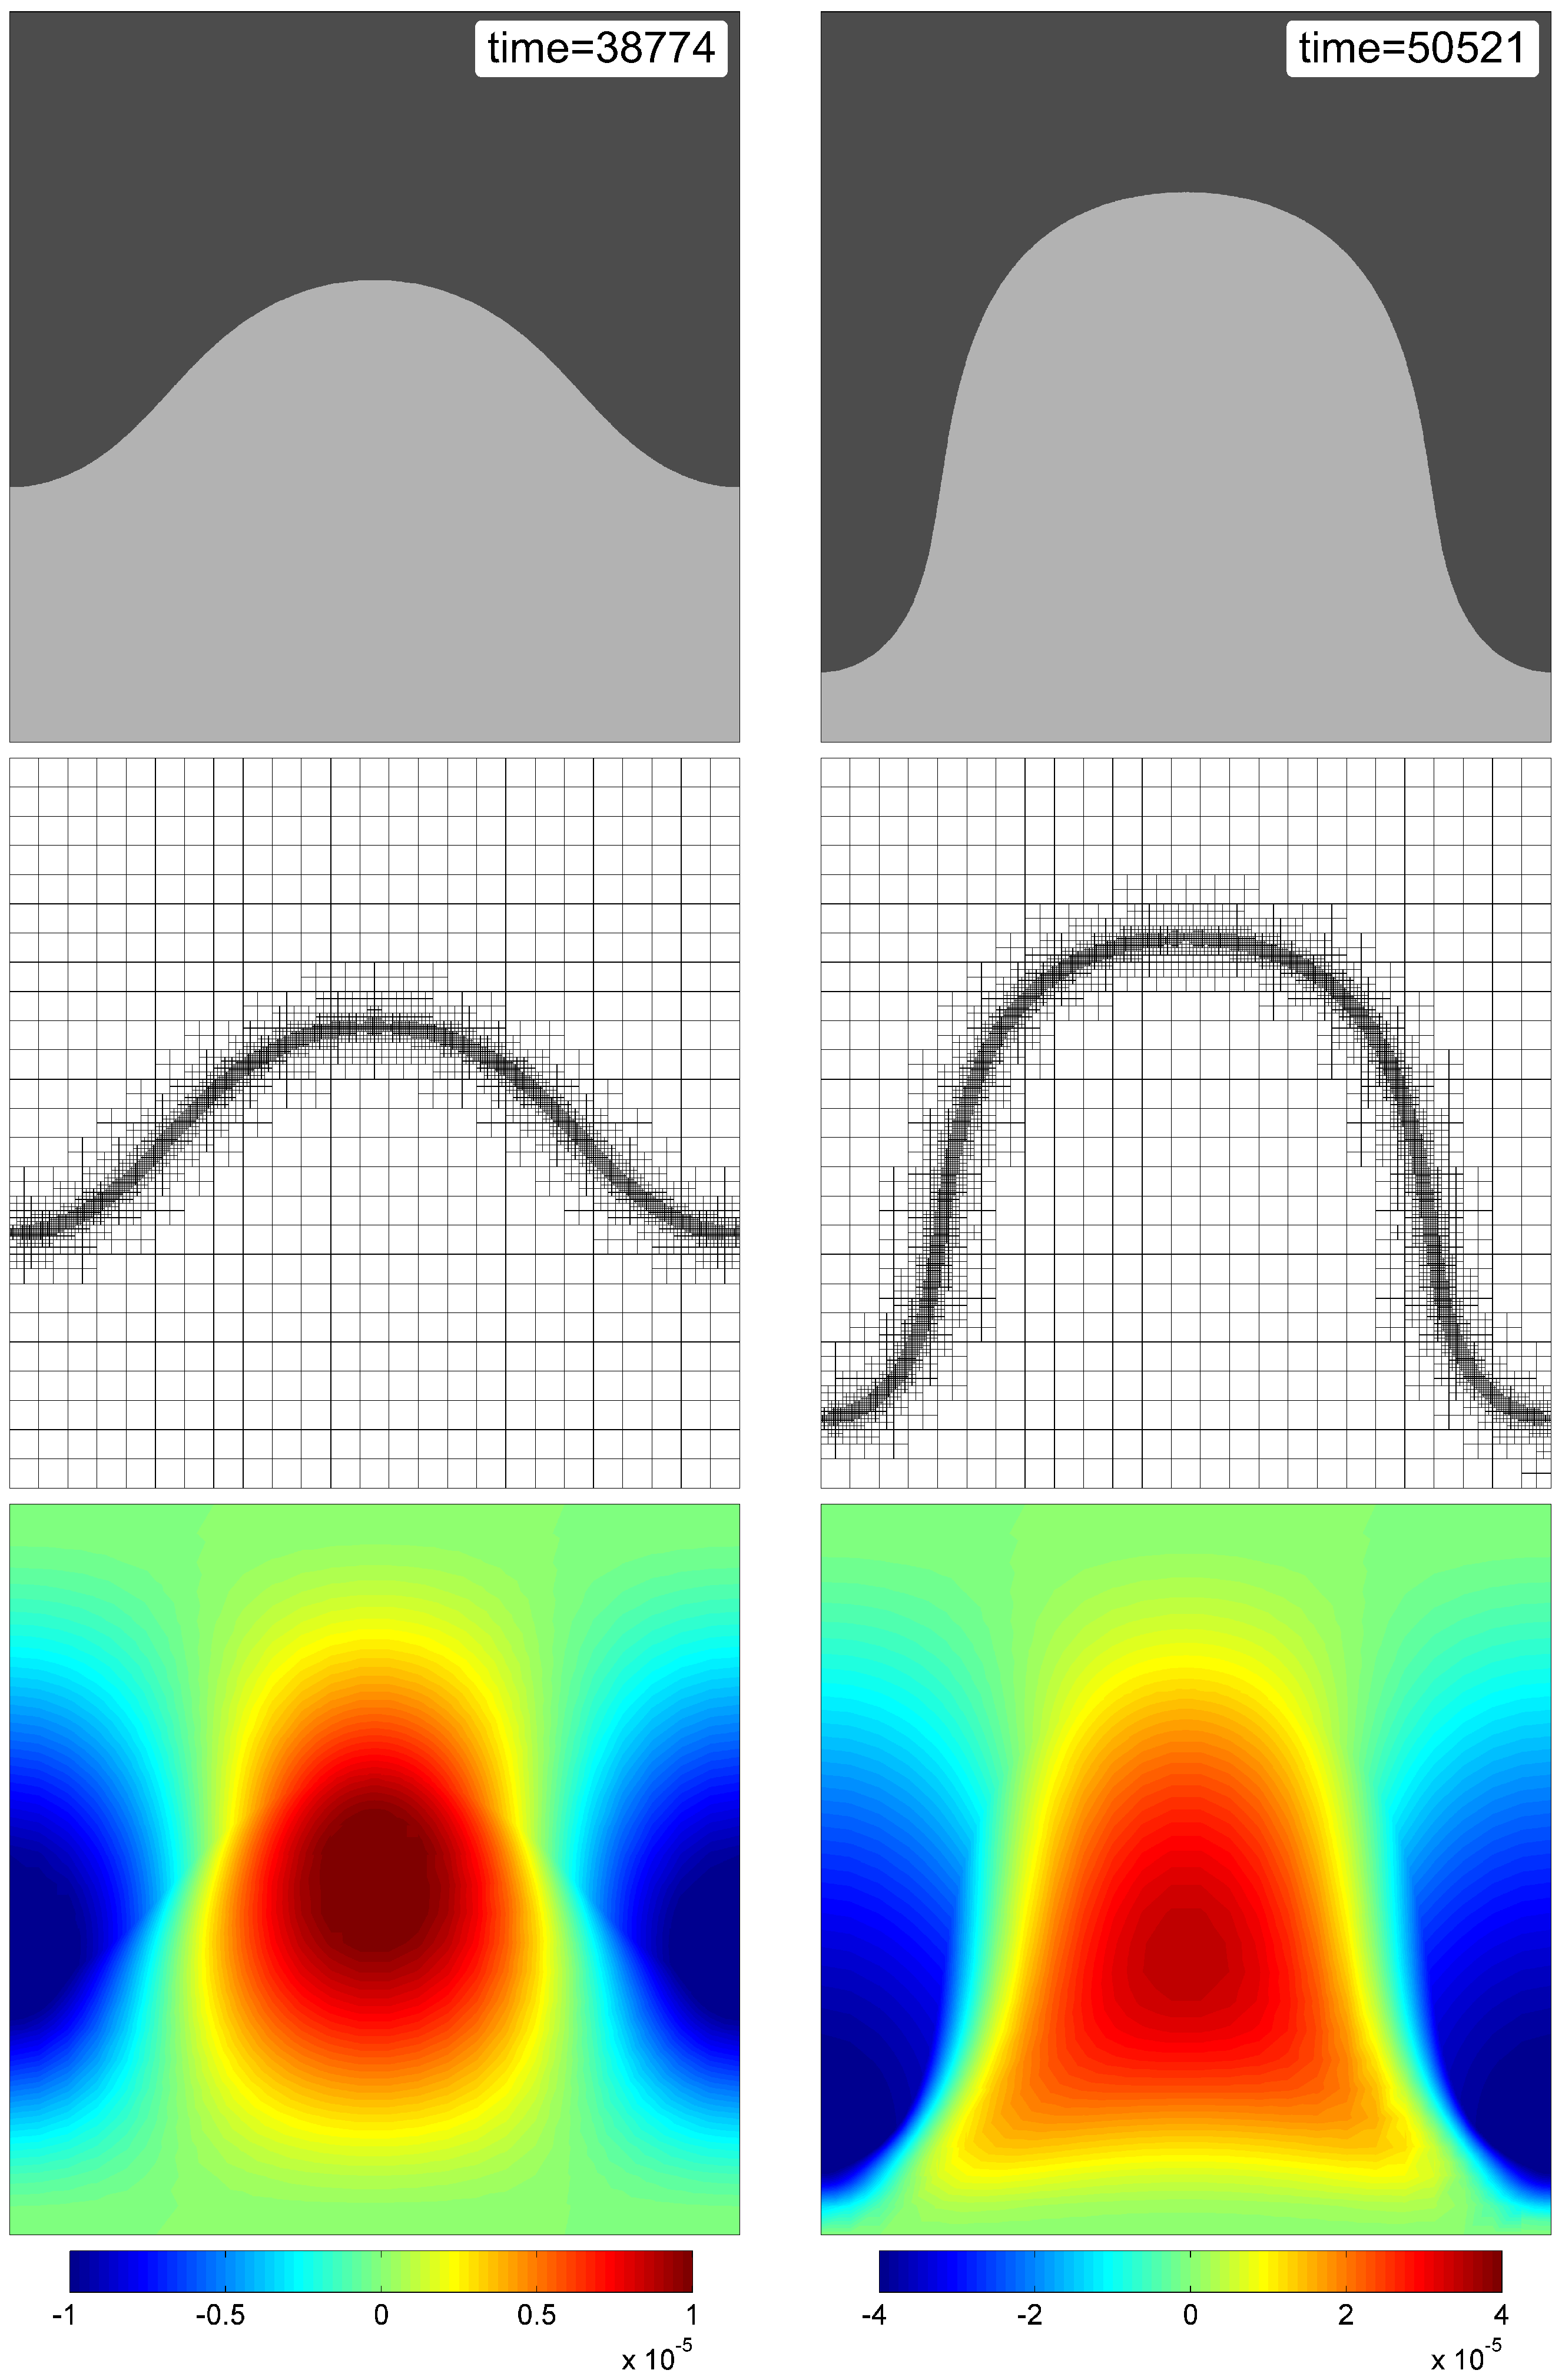
8.5.2. Growth of Diapirs
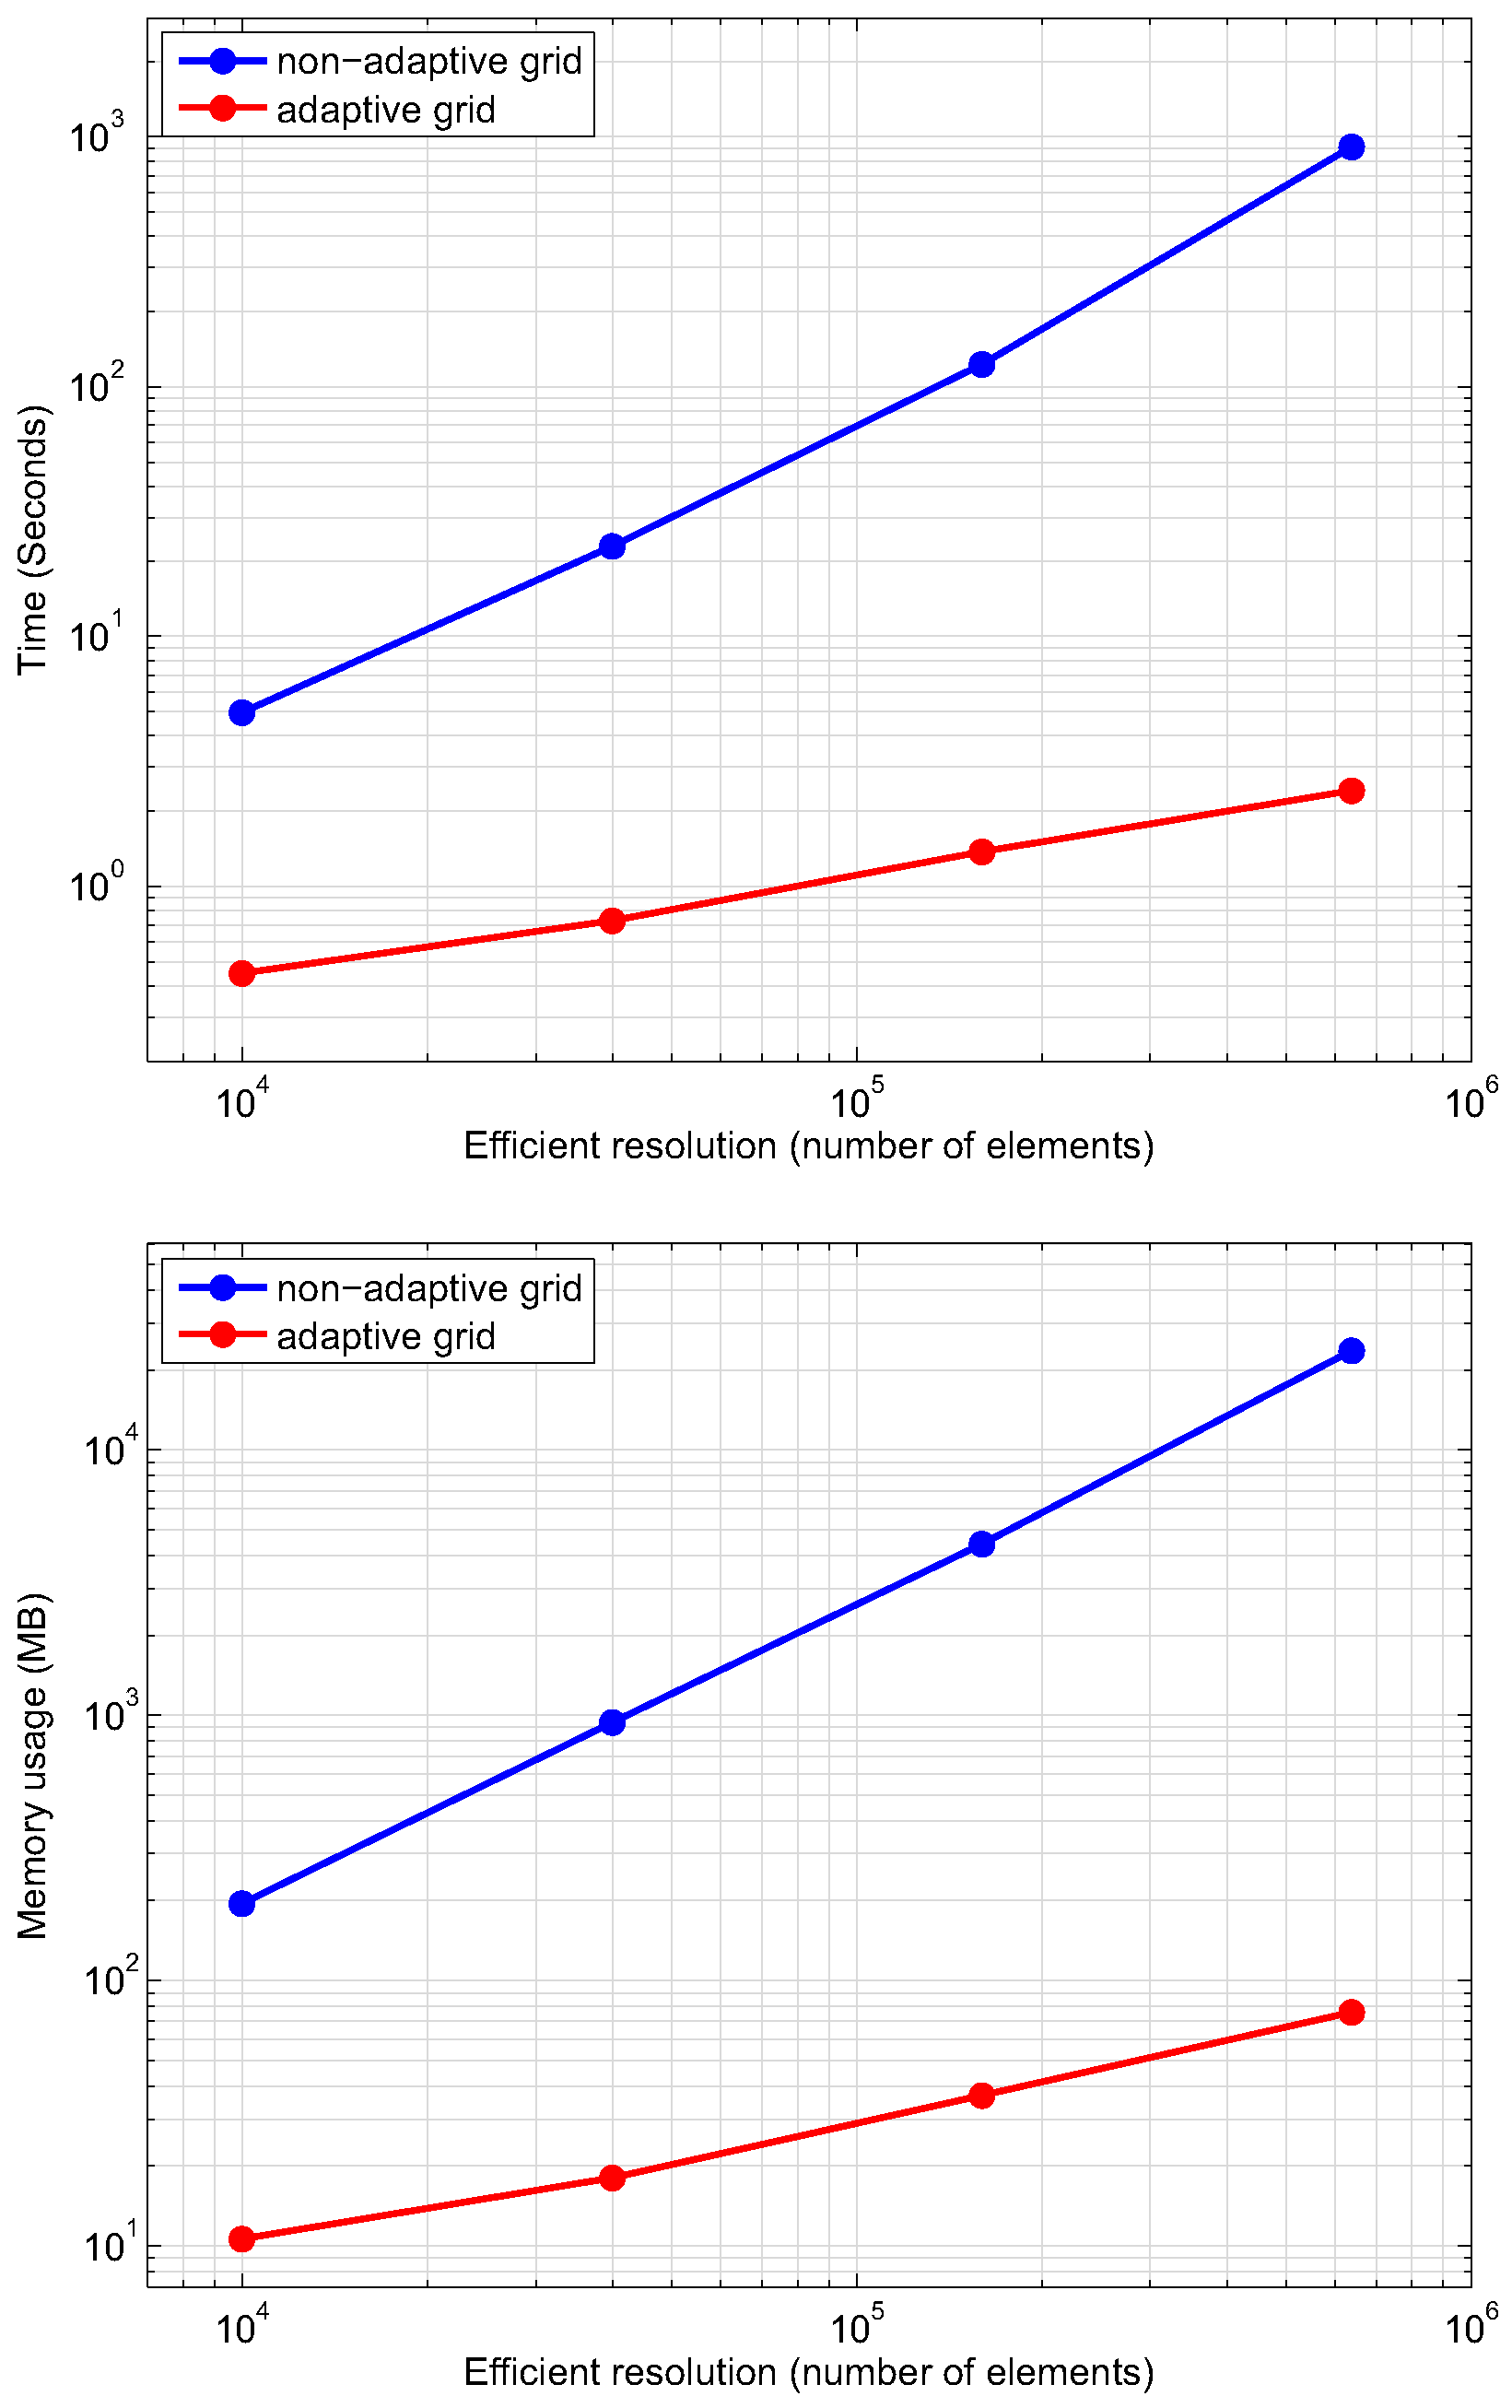
8.5.3. Performance Analysis
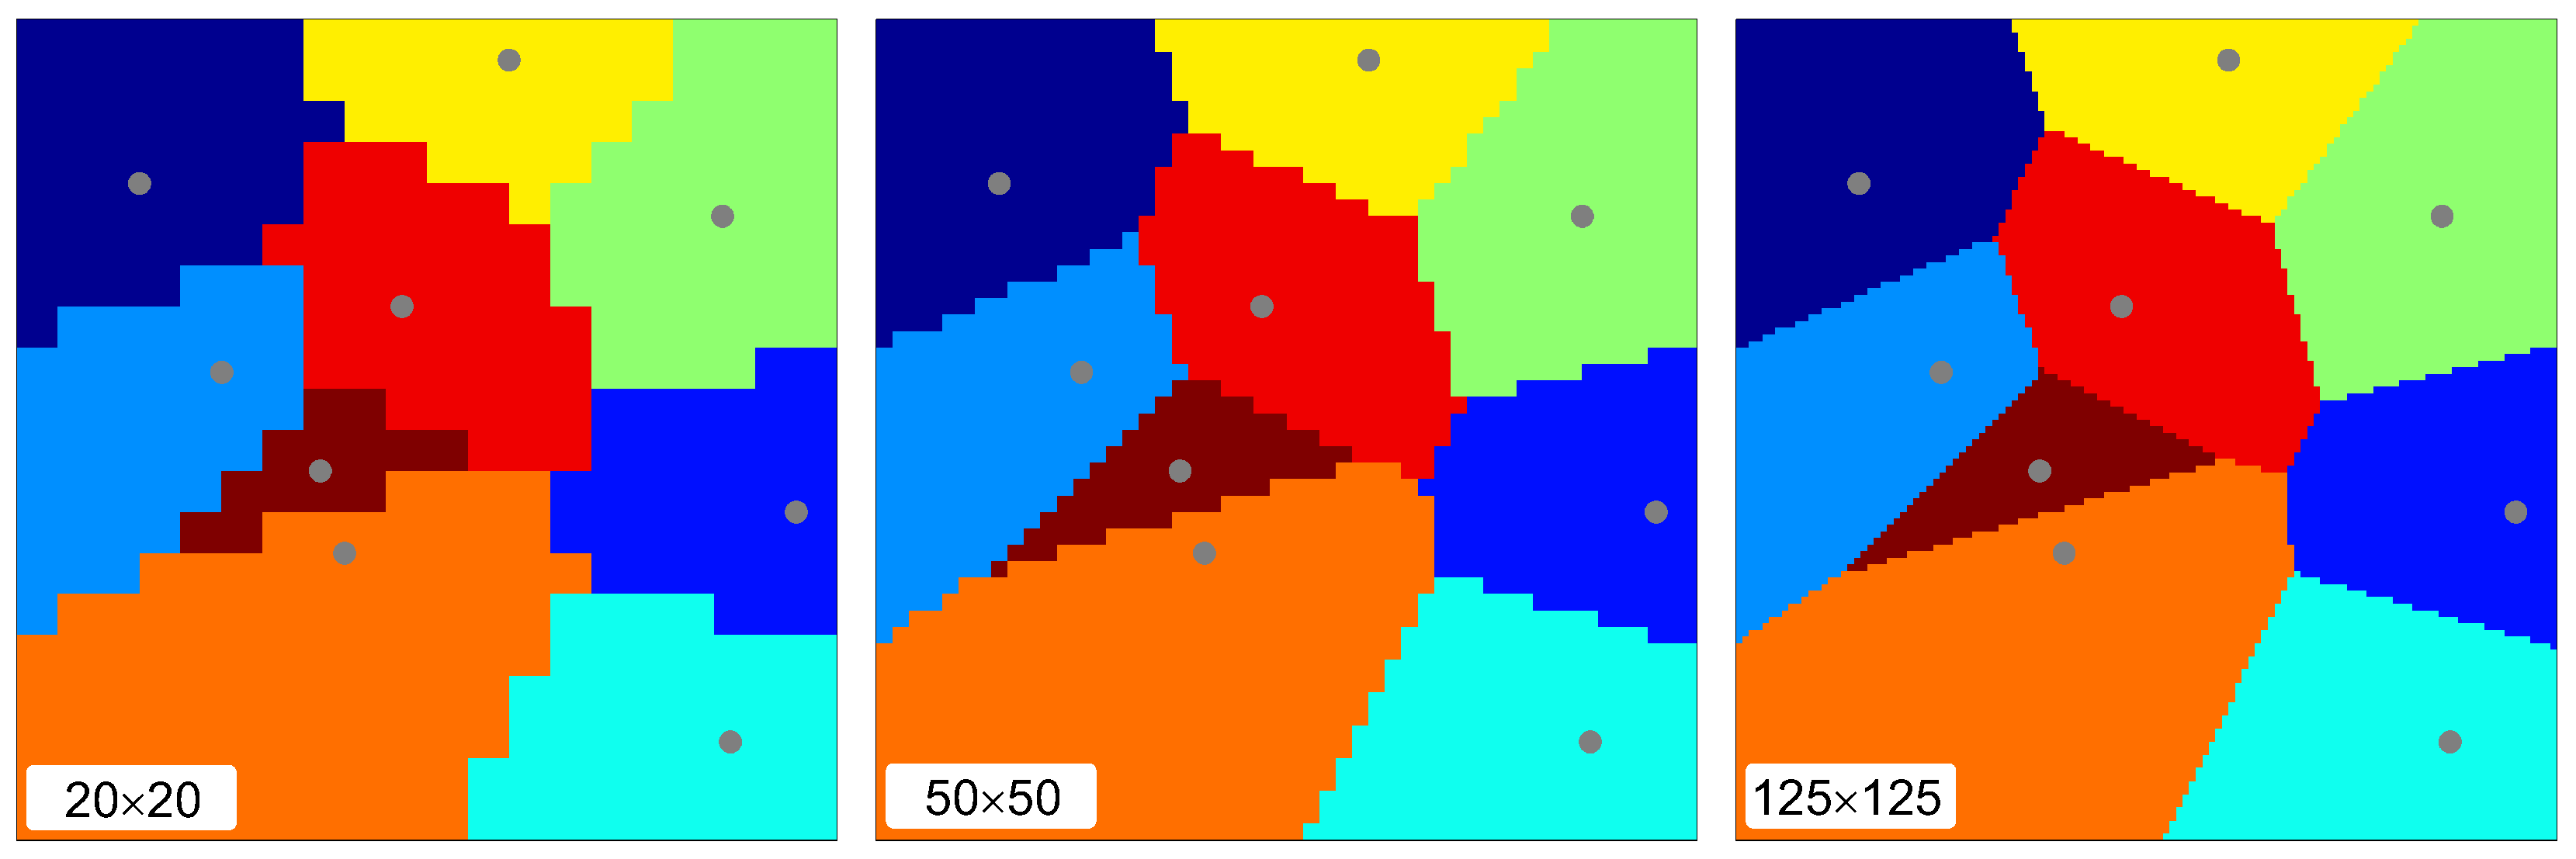
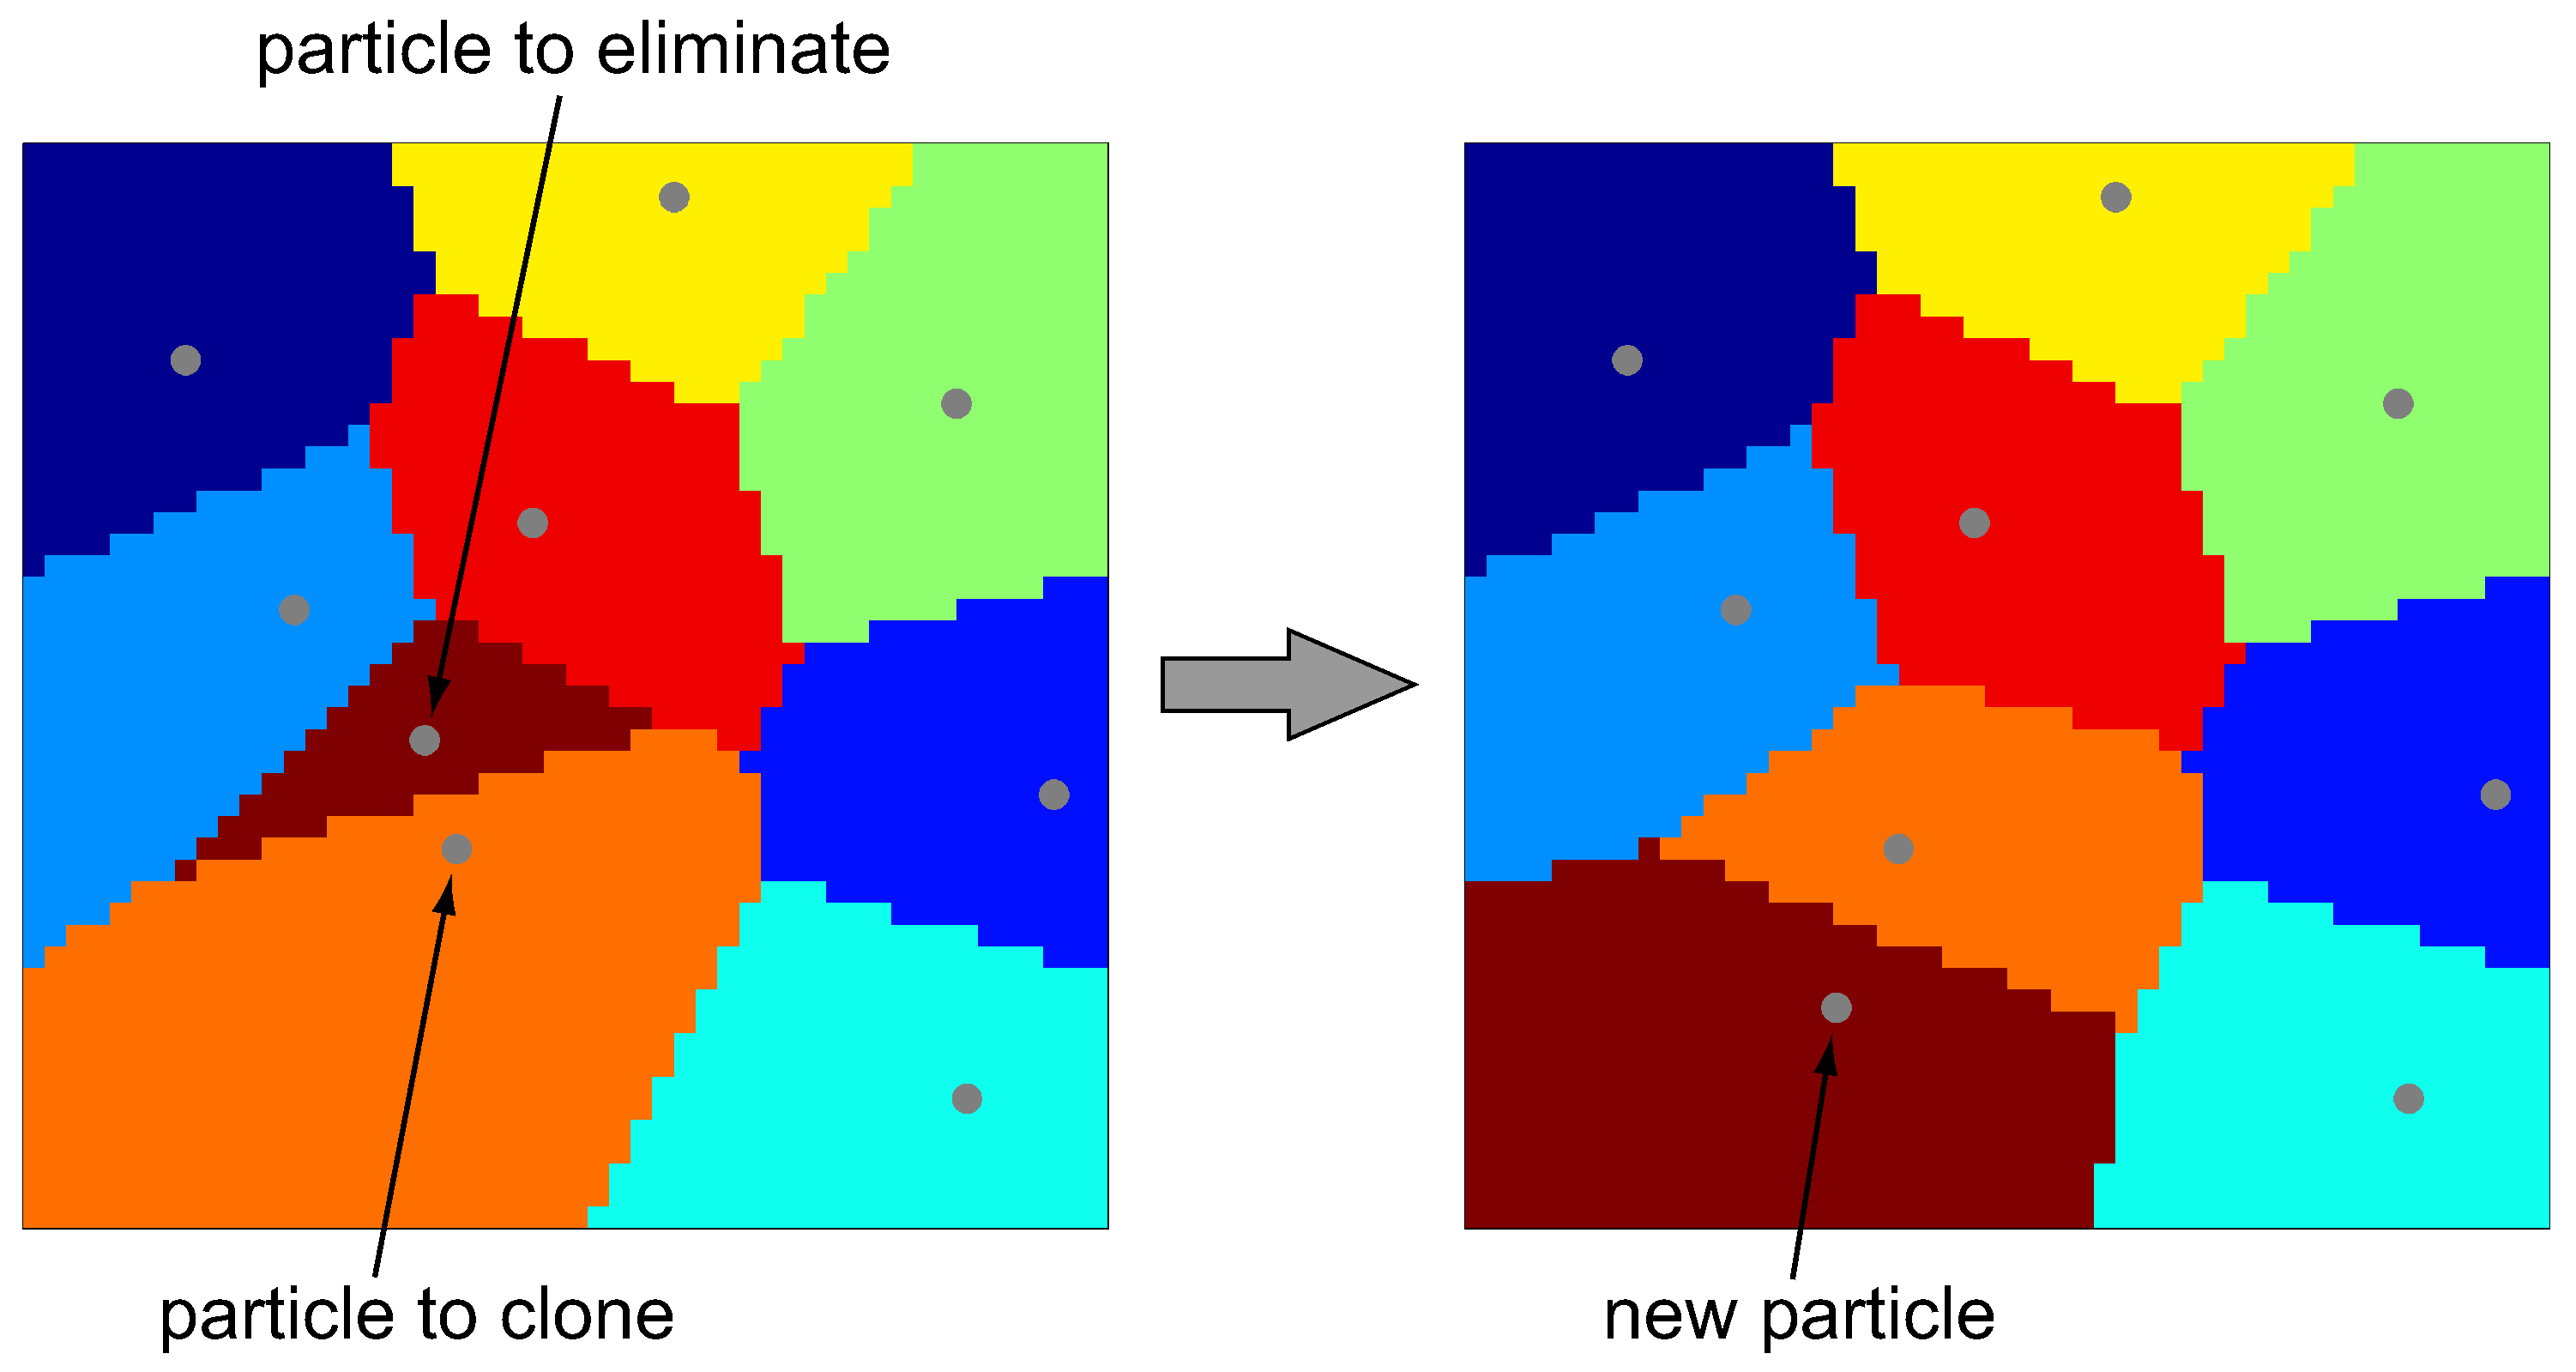
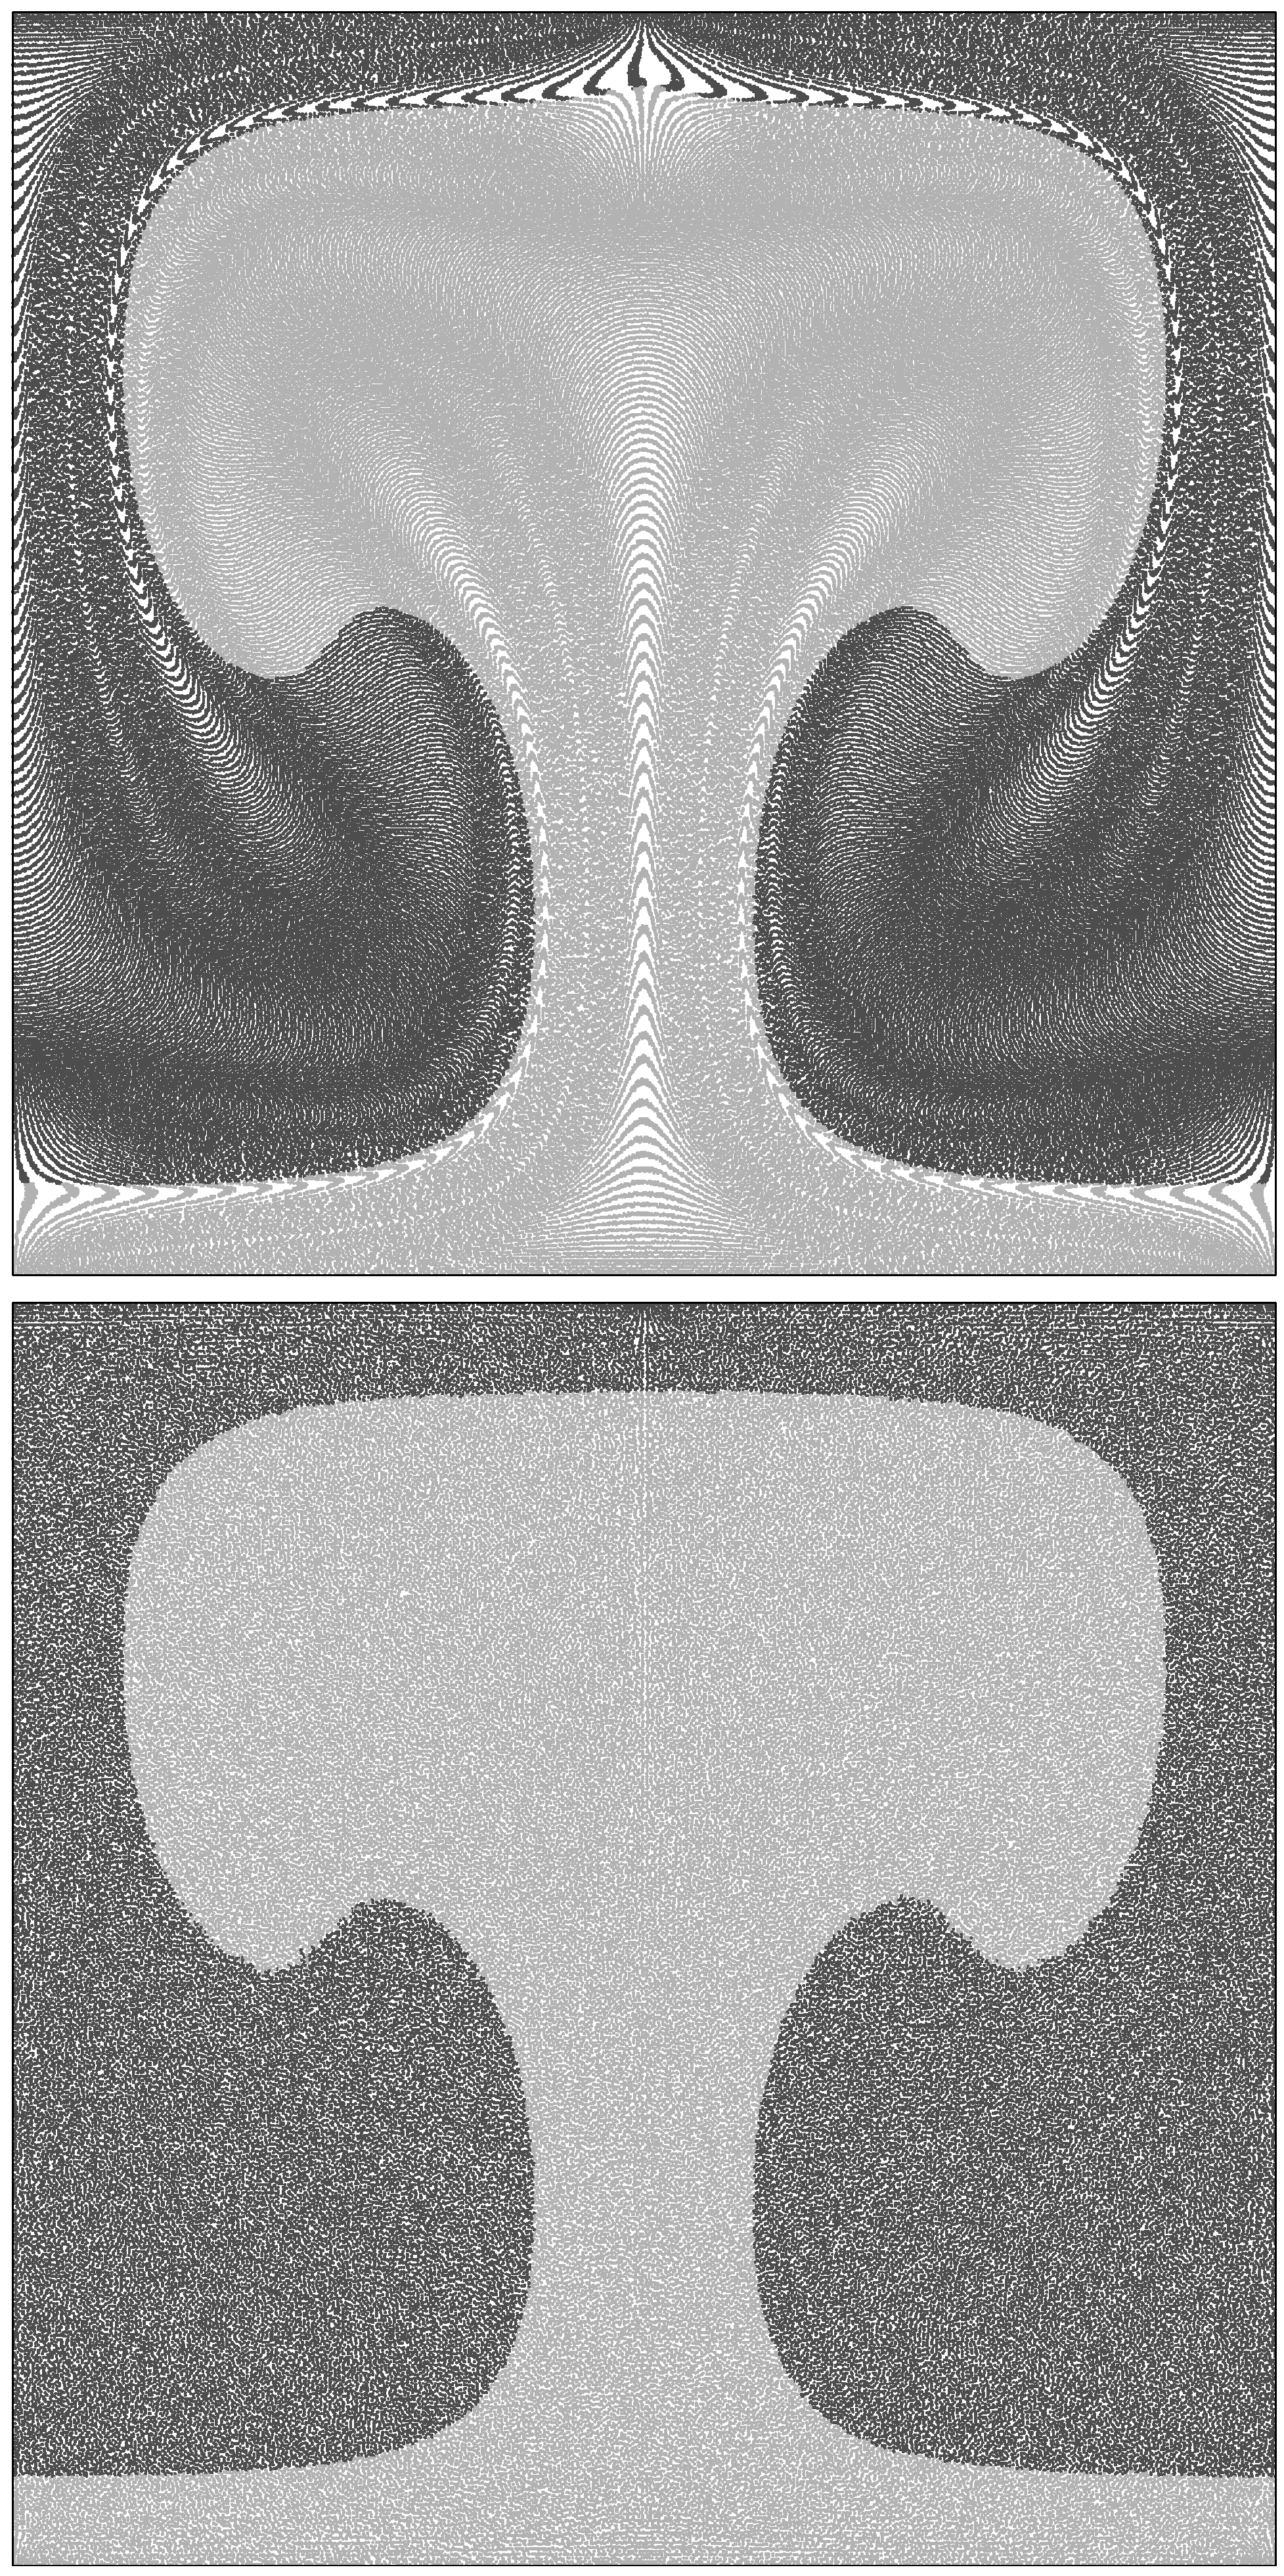
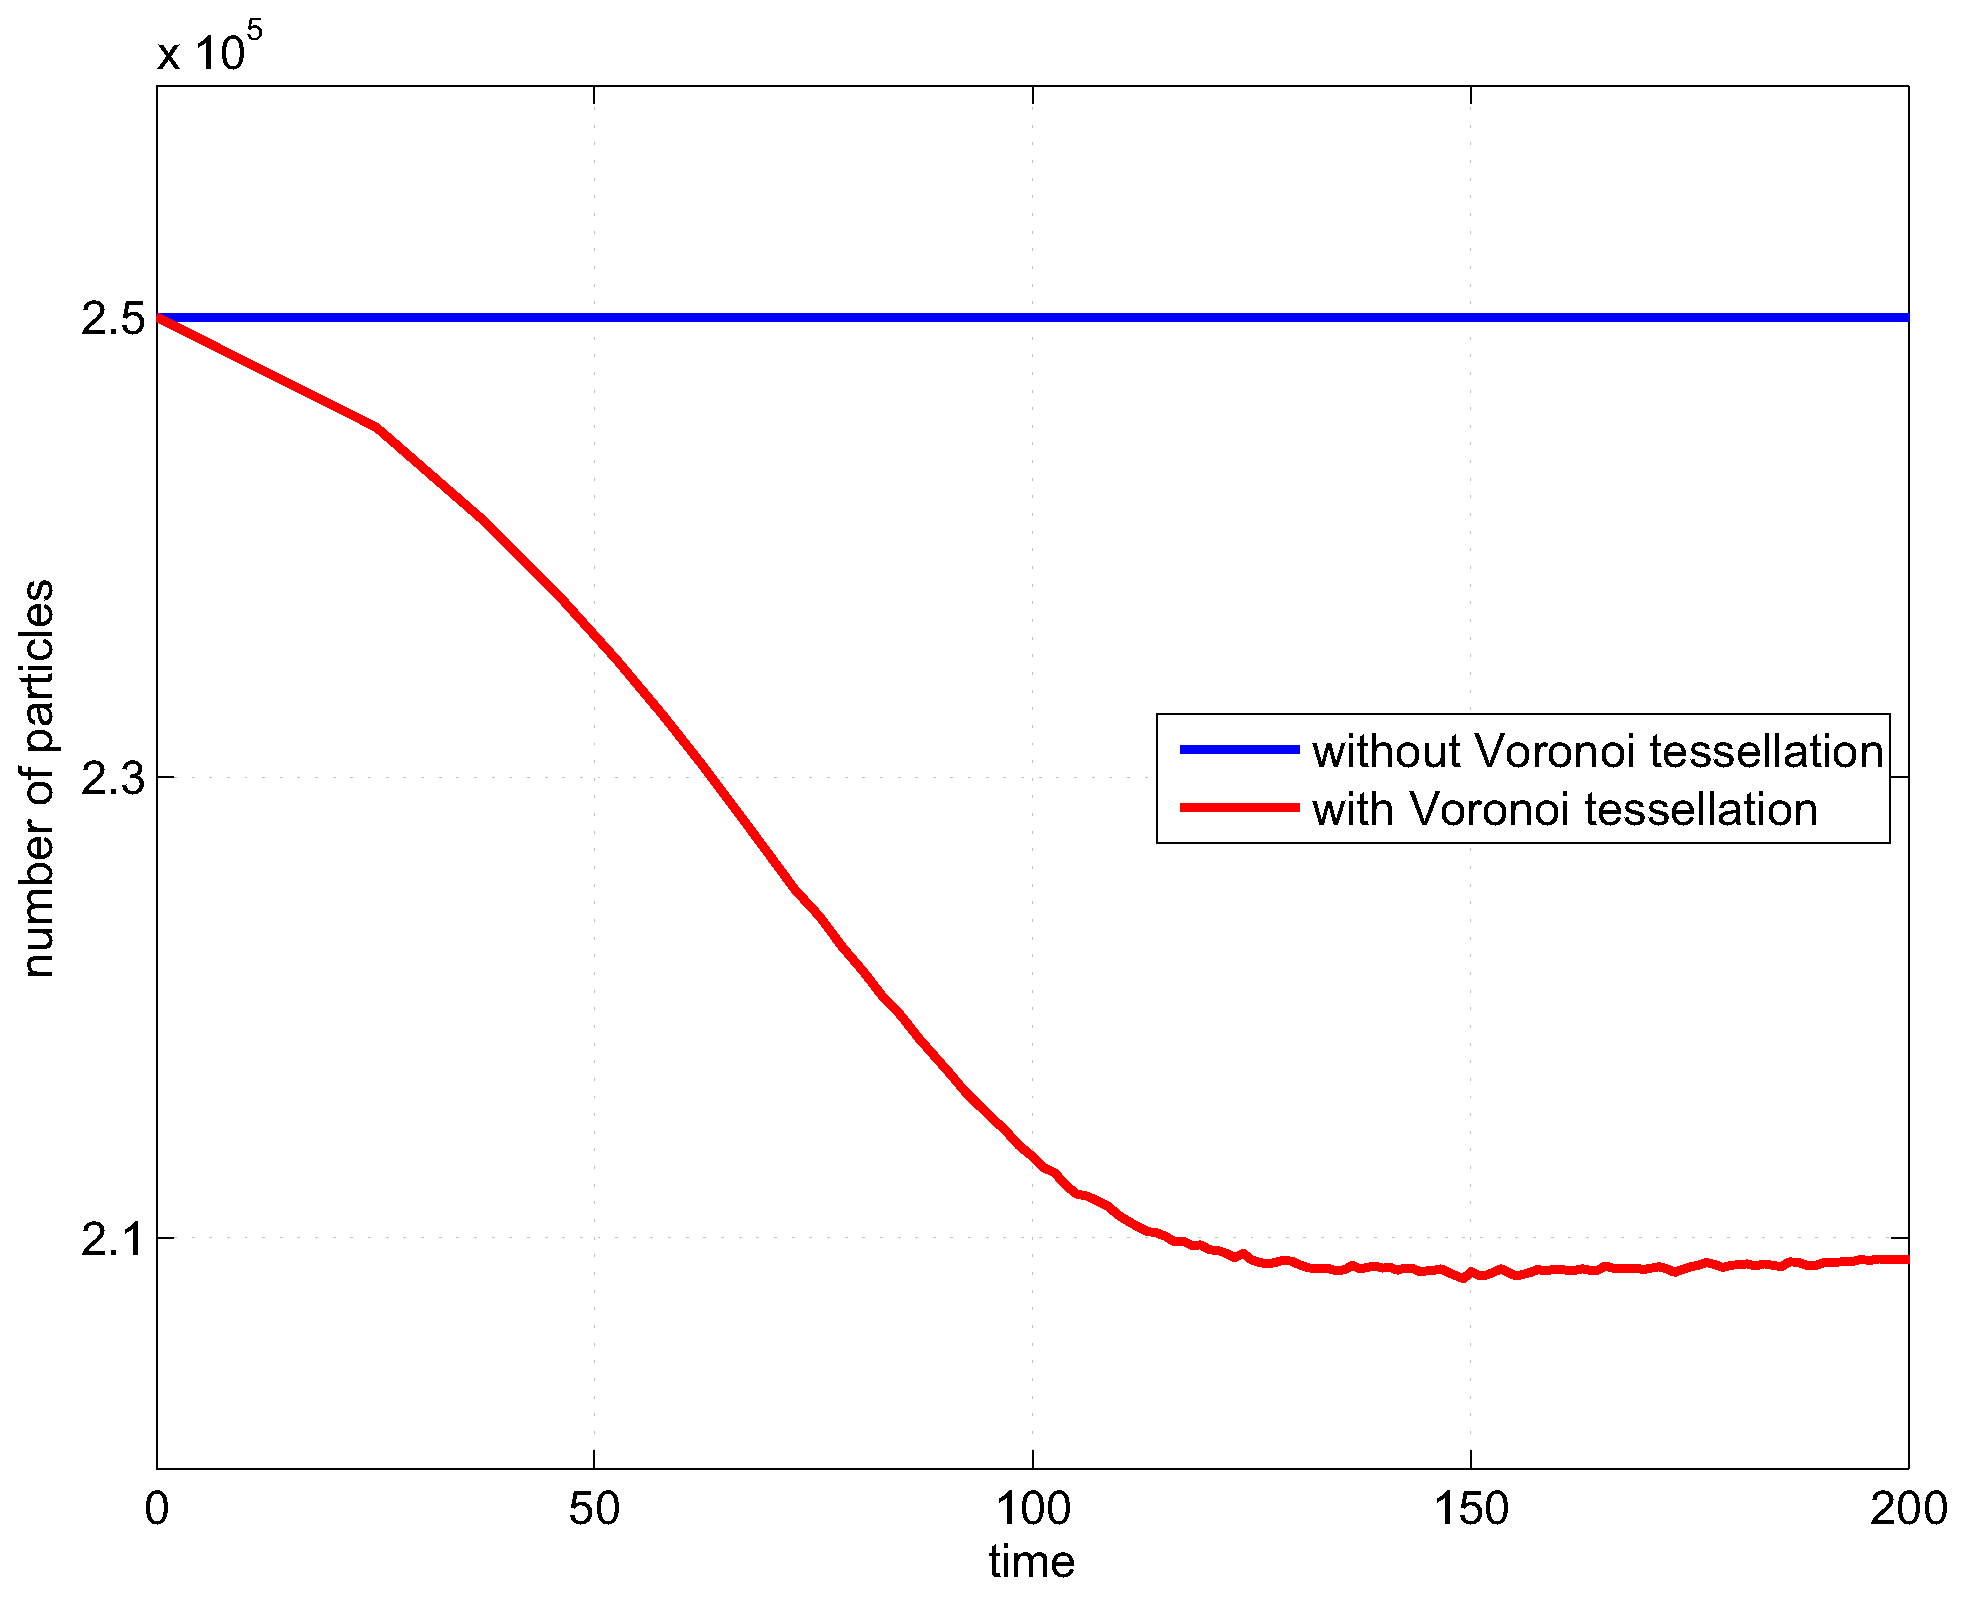
8.5.4. Effect of Voronoi Tessellation
9. Conclusions
Author Contributions
Funding
Acknowledgments
Conflicts of Interest
Abbreviations
| FEM | finite element method |
| bilinear form of FEM | |
| bilinear form of FEM | |
| biquadratic form of FEM | |
| CPU | central processing unit |
References
- Albers, M. A Local Mesh Refinement Multigrid Method for 3-D Convection Problems with Strongly Variable Viscosity. J. Comput. Phys. 2000, 160, 126–150. [Google Scholar] [CrossRef]
- Stadler, G.; Gurnis, M.; Burstedde, C.; Wilcox, L.C.; Alisic, L.; Ghattas, O. The Dynamics of Plate Tectonics and Mantle Flow: From Local to Global Scales. Science 2010, 329, 1033–1038. [Google Scholar] [CrossRef] [PubMed]
- Gerya, T.V.; May, D.A.; Duretz, T. An adaptive staggered grid finite difference method for modeling geodynamic Stokes flows with strongly variable viscosity. Geochem. Geophys. Geosyst. 2013, 14, 1200–1225. [Google Scholar] [CrossRef]
- Vasilyev, O.V.; Bowman, C. Second-Generation Wavelet Collocation Method for the Solution of Partial Differential Equations. J. Comput. Phys. 2000, 165, 660–693. [Google Scholar] [CrossRef] [Green Version]
- Vasilyev, O.V. Solving Multi-Dimensional Evolution Problems with Localized Structures Using Second Generation Wavelets. Int. J. Comp. Fluid Dyn. 2003, 17, 151–168. [Google Scholar] [CrossRef]
- Vasilyev, O.V.; Gerya, T.V.; Yuen, D.A. The application of multidimensional wavelets to unveiling multi-phase diagrams and in situ physical properties of rocks. Earth Planet. Sci. Lett. 2004, 223, 49–64. [Google Scholar] [CrossRef]
- Schneider, K.; Vasilyev, O.V. Wavelet Methods in Computational Fluid Dynamics. Ann. Rev. Fluid Mech. 2010, 42, 473–503. [Google Scholar] [CrossRef] [Green Version]
- Nejadmalayeri, A.; Vezolainen, A.; Brown-Dymkoski, E.; Vasilyev, O.V. Parallel Adaptive Wavelet Collocation Method for PDEs. J. Comp. Phys. 2015, 298, 237–253. [Google Scholar] [CrossRef] [Green Version]
- Ranalli, G. Rheology of the Earth; Chapman and Hall: London, UK, 1995. [Google Scholar]
- Fullsack, P. An arbitrary Lagrangian-Eulerian formulation for creeping flows and its application in tectonic models. Geophys. J. Int. 1995, 120, 1–23. [Google Scholar] [CrossRef] [Green Version]
- Moresi, L.; Solomatov, V. Mantle convection with a brittle lithosphere: Thoughts on the global tectonic styles of the Earth and Venus. Geophys. J. Int. 1998, 133, 669–682. [Google Scholar] [CrossRef]
- Tackley, P.J. Self-consistent generation of tectonic plates in time-dependent, three-dimensional mantle convection simulations, 1, Pseudoplastic yielding. Geochem. Geophys. Geosyst. 2000, 1. [Google Scholar]
- Chakrabarty, J. Theory of Plasticity; Butterworth-Heinemann: Oxford, UK, 2006. [Google Scholar]
- Lemiale, V.; Mühlhaus, H.B.; Moresi, L.; Stafford, J. Shear banding analysis of plastic models formulated for incompressible viscous flows. Phys. Earth Planet. Inter. 2008, 171, 177–186. [Google Scholar] [CrossRef]
- Zienkiewicz, O.C.; Morgan, K. Finite Elements and Approximation; Wiley: New York, NY, USA, 1983. [Google Scholar]
- Fortin, M.; Brezzi, F. Mixed and Hybrid Finite Element Methods; Springer: New York, NY, USA, 1991. [Google Scholar]
- Elman, H.C.; Silvester, D.J.; Wathen, A.J. Finite Elements and Fast Iterative Solvers; Oxford University Press: Oxford, UK, 2005. [Google Scholar]
- Dohrmann, C.R.; Bochev, P.B. A stabilized finite element method for the Stokes problem based on polynomial pressure projections. Int. J. Num. Meth. Fluids 2004, 46, 183–201. [Google Scholar] [CrossRef] [Green Version]
- Bochev, P.B.; Dohrmann, C.R.; Gunzburger, M.D. Stabilization of low-order mixed finite elements for the Stokes equations. SIAM J. Num. Anal. 2006, 44, 82–101. [Google Scholar] [CrossRef]
- Zienkiewicz, O.C.; Taylor, R.L.; Zhu, J.Z. The Finite Element Method: Its Basis and Fundamentals; Butterworth-Heinemann: Oxford, UK, 2005. [Google Scholar]
- Zienkiewicz, O.C.; Vilotte, J.P.; Toyoshima, S.; Nakazawa, S. Iterative method for constrained and mixed approximation. An inexpensive improvement of FEM performance. Comp. Meth. Appl. Mech. Eng. 1985, 51, 3–29. [Google Scholar] [CrossRef]
- Dabrowski, M.; Krotkiewski, M.; Schmid, D.W. MILAMIN: MATLAB-based finite element method solver for large problems. Geochem. Geophys. Geosyst. 2008, 9, Q04030. [Google Scholar] [CrossRef]
- Schmid, D.W.; Dabrowski, M.; Krotkiewski, M. Evolution of large amplitude 3D fold patterns: A FEM study. Phys. Earth Planet. Inter. 2008, 171, 400–408. [Google Scholar] [CrossRef]
- May, D.A.; Moresi, L. Preconditioned iterative methods for Stokes flow problems arising in computational geodynamics. Phys. Earth Planet. Inter. 2008, 171, 33–47. [Google Scholar] [CrossRef]
- Cuvelier, C.; Segal, A.; van Steenhoven, A.A. Finite Element Methods and Navier-Stokes Equations; Reidel: Dordrecht, The Netherlands, 1986. [Google Scholar]
- Gerya, T.V.; Yuen, D.A. Characteristics-based marker-in-cell method with conservative finite-differences schemes for modeling geological flows with strongly variable transport properties. Phys. Earth Planet. Inter. 2003, 140, 293–318. [Google Scholar] [CrossRef]
- Gerya, T.V.; Yuen, D.A. Robust characteristics method for modelling multiphase visco-elasto-plastic thermo-mechanical problems. Phys. Earth Planet. Inter. 2007, 163, 83–105. [Google Scholar] [CrossRef]
- O’Neill, C.; Moresi, L.; Müller, D.; Albert, R.; Dufour, F. Ellipsis 3D: A particle-in-cell finite-element hybrid code for modelling mantle convection and lithospheric deformation. Comp. and Geosci. 2006, 32, 1769–1779. [Google Scholar] [CrossRef] [Green Version]
- Gerya, T.V. Introduction to Numerical Geodynamic Modelling; Cambridge University Press: Cambridge, UK, 2010. [Google Scholar]
- OzBench, M.; Regenauer-Lieb, K.; Stegman, D.R.; Morra, G.; Farrington, R.; Hale, A.; May, D.A.; Freeman, J.; Bourgouin, L.; Mühlhaus, H.; et al. A model comparison study of large-scale mantle-lithosphere dynamics driven by subduction. Phys. Earth Planet. Inter. 2008, 171, 224–234. [Google Scholar] [CrossRef]
- Velic, M.; May, D.; Moresi, L. A Fast Robust Algorithm for Computing Discrete Voronoi Diagrams. J. Math. Model. Algorithm. 2009, 8, 343–355. [Google Scholar] [CrossRef]
- Boggess, A.; Narcowich, F.J. A First Course in Wavelets with Fourier Analysis; Prentice Hall: Upper Saddle River, NJ, USA, 2001. [Google Scholar]
- Sweldens, W. The Lifting Scheme: A Construction of Second Generation Wavelets. SIAM J. Math. Anal. 1998, 29, 511–546. [Google Scholar] [CrossRef] [Green Version]
- Sweldens, W. Wavelets and the lifting scheme: A 5 min tour. Z. Angew. Math. Mech. 1996, 76, 41–44. [Google Scholar]
- Bangerth, W.; Kayser-Herold, O. Data structures and requirements for hp finite element software. ACM Trans. Math. Softw. 2009, 36, 1486529. [Google Scholar] [CrossRef]
- Carey, G.F. Computational Grids: Generation, Adaptation and Solution Strategies; Taylor and Francis: Washington, DC, USA, 1997. [Google Scholar]
- Chen, Y.; Davis, T.A.; Hager, W.W.; Rajamanickam, S. Algorithm 887: CHOLMOD, Supernodal Sparse Cholesky Factorization and Update/Downdate. ACM Trans. Math. Softw. 2008, 35, 1–14. [Google Scholar] [CrossRef]
- Duff, I.S. MA57—A code for the solution of sparse symmetric definite and indefinite systems. ACM Trans. Math. Softw. 2004, 30, 118–144. [Google Scholar] [CrossRef]
- Amestoy, P.R.; Enseeiht-Irit.; Davis, T.A.; Duff, I.S. Algorithm 837: AMD, an approximate minimum degree ordering algorithm. ACM Trans. Math. Softw. 2004, 30, 381–388. [Google Scholar] [CrossRef]
- Duretz, T.; May, D.A.; Gerya, T.V.; Tackley, P.J. Discretization errors and free surface stabilization in the finite difference and marker-in-cell method for applied geodynamics: A numerical study. Geochem. Geophys. Geosyst. 2011, 12, Q07004. [Google Scholar] [CrossRef]
- Zhong, S. Analytic solutions for Stokes’ flow with lateral variations in viscosity. Geophys. J. Int. 1996, 124, 18–28. [Google Scholar] [CrossRef] [Green Version]
- Kaus, B.J.P. Factors that control the angle of shear bands in geodynamic numerical models of brittle deformation. Tectonophysics 2010, 484, 36–47. [Google Scholar] [CrossRef]
- Ramberg, H. Instability of layered systems in the field of gravity. I. Phys. Earth Planet. Inter. 1968, 1, 427–447. [Google Scholar] [CrossRef]
- Ramberg, H. Instability of layered systems in the field of gravity. II. Phys. Earth Planet. Inter. 1968, 1, 448–474. [Google Scholar] [CrossRef]


| Section | Benchmark Problem | Main Aspects of the Algorithm Tested by the Benchmark Problem |
|---|---|---|
| Section 8.1 | Lateral viscosity variation | Comparison with the analytical solution |
| Section 8.2 | Sinking block | Ability to handle large viscosity contrasts |
| Section 8.3 | Brittle extension/compression | Ability to capture and resolve spontaneously forming shear zones |
| Section 8.4 | Incompressibility test | Influence of the artificial incompressibility |
| Section 8.5 | Rayleigh-Taylor instability | Comparison with the analytical solution |
| Parameter | Value |
|---|---|
| Block viscosity | |
| Medium viscosity | |
| Block density | |
| Medium density | |
| Gravitational acceleration g | |
| Time step |
| Parameter | Value | |
|---|---|---|
| Weak inclusion viscosity | ||
| Medium viscosity | ||
| Weak inclusion and medium density | ||
| Air viscosity | ||
| Air density | ||
| Gravitational acceleration g | ||
| Friction angle | ||
| Strain values | ||
| Cohesion | Extension | |
| Compression | ||
| Boundary velocity | Extension | |
| Compression | ||
| Time step | Extension | |
| Compression | ||
| Nonlinear tolerance |
| Element Type | Resolution | |||
|---|---|---|---|---|
| Parameter | Value |
|---|---|
| Top layer viscosity | |
| Bottom layer viscosity | |
| Top layer density | |
| Bottom layer density | |
| Gravitational acceleration g | |
| Courant number |
Publisher’s Note: MDPI stays neutral with regard to jurisdictional claims in published maps and institutional affiliations. |
© 2022 by the authors. Licensee MDPI, Basel, Switzerland. This article is an open access article distributed under the terms and conditions of the Creative Commons Attribution (CC BY) license (https://creativecommons.org/licenses/by/4.0/).
Share and Cite
Mishin, Y.A.; Vasilyev, O.V.; Gerya, T.V. A Wavelet-Based Adaptive Finite Element Method for the Stokes Problems. Fluids 2022, 7, 221. https://doi.org/10.3390/fluids7070221
Mishin YA, Vasilyev OV, Gerya TV. A Wavelet-Based Adaptive Finite Element Method for the Stokes Problems. Fluids. 2022; 7(7):221. https://doi.org/10.3390/fluids7070221
Chicago/Turabian StyleMishin, Yury A., Oleg V. Vasilyev, and Taras V. Gerya. 2022. "A Wavelet-Based Adaptive Finite Element Method for the Stokes Problems" Fluids 7, no. 7: 221. https://doi.org/10.3390/fluids7070221
APA StyleMishin, Y. A., Vasilyev, O. V., & Gerya, T. V. (2022). A Wavelet-Based Adaptive Finite Element Method for the Stokes Problems. Fluids, 7(7), 221. https://doi.org/10.3390/fluids7070221