Abstract
We report a cyclic growth/retraction phenomena observed for saline droplets placed on a cured poly (dimethylsiloxane) (PDMS) membrane with a thickness of 7.8 ± 0.1 µm floating on a pure water surface. Osmotic mass transport across the micro-scaled floating PDMS membrane provided the growth of the sessile saline droplets followed by evaporation of the droplets. NaCl crystals were observed in the vicinity of the triple line at the evaporation stage. The observed growth/retraction cycle was reversible. A model of the osmotic mass transfer across the cured PDMS membrane is suggested and verified. The first stage of the osmotic growth of saline droplets is well-approximated by the universal linear relationship, whose slope is independent of the initial radius of the droplet. The suggested physical model qualitatively explains the time evolution of the droplet size. The reported process demonstrates a potential for use in industrial desalination.
1. Introduction
Polydimethylsiloxane (PDMS) membranes are broadly used for the manufacturing of microfluidic devices [1], separation of organics from water [2,3], gas separation [4,5,6,7,8,9], and removing aldehydes from the reactants [10]. Osmotic mass transport across PDMS-based liquid layers has already been implemented for the controlled crystallization of proteins [11,12]. In our recent research, we demonstrated osmotic mass transport between the saline water encapsulated within a composite liquid marble coated with liquid PDMS and the supporting layer of water [13]. Our present research is devoted to osmotic mass transport across cross-linked (cured), floating PDMS membranes. PDMS membranes may be manufactured by dip- or spin-coating [14] or by 3D printing [15]. Micro-scale thickness cured PDMS osmotic membranes may be manufactured by drop-casting on the water/vapor interface [16]. We demonstrate that cured floating osmotic PDMS membranes enable completely reversible growth/retraction oscillations of sessile saline droplets deposited on the membranes. The observed oscillations of the droplet size are explained by the osmotic mass transport and evaporation cycles as described below in detail. The investigated process demonstrates the potential of cross-linked PDMS membrane use for desalination.
2. Materials and Methods
2.1. Materials
The following materials were used in the recent experiment: polystyrene Petri dish (); poly (dimethylsiloxane) (PDMS) Sylgard 184, supplied by Dow Corning, USA (with the following characteristics: molecular weight 207.4 g/mol, viscosity 5.5 Pa , surface tension 20.4 mN/m); deionized water (DI) from Millipore SAS (France) (with the following characteristics: specific resistivity Ω at 25 °C, surface tension γ = 72.9 mN/m; viscosity Pa ); sodium chloride (NaCl) was supplied by Melach Haaretz Ltd., Kfar Monash, Israel. Droplets of 5 mL of the saturated aqueous NaCl solution (25.9% w/w) were used in the experiment. The thickness of the PDMS membrane was established by weighting as 7.8 ± 0.1 µm.
2.2. Methods
The floating PDMS membrane was prepared as depicted in Figure 1 by pouring a mixture containing liquid PDMS and a curing agent on the distilled water/vapor interface (see also [16]). Afterwards, a 5 µL saline droplet was placed on the PDMS membrane, floating within the closed vessel (chamber), as shown in Figure 2.
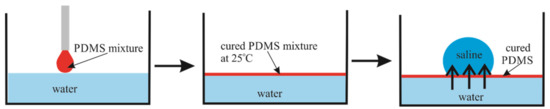
Figure 1.
Schematic representation of the PDMS membrane preparation method.
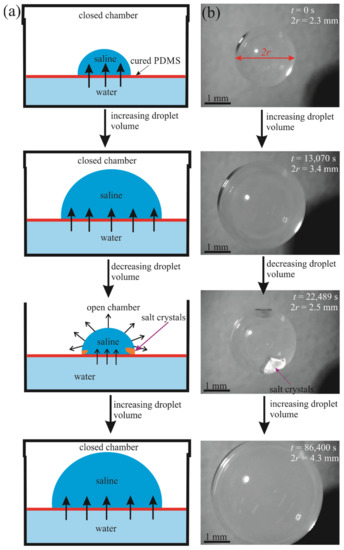
Figure 2.
Growth and decay of a 5 µL saline droplet on a floating PDMS membrane due to osmosis and evaporation; (a) schematic and (b) images.
A mixture of PDMS and the crosslinker (Sylgard 184 silicone elastomer curing agent) was prepared with a weight ratio of 10:1. After that, a polystyrene Petri dish was taken and half-filled with DI water. Then, 10 µL of the PDMS mixture was gently deposited on top of the surface and kept at room temperature for curing. After complete curing of the PDMS mixture at room temperature (the curing time was 48 h), a 5 µL saline droplet (saturated solution) was deposited, and simultaneously, a video was captured to observe the changes in the droplet diameter over time. The preparation method is schematically shown in Figure 1. The apparent contact angle of the saline droplet on the PDMS membrane is . Uniformity of the PDMS membrane was controlled with an optical digital microscope BW1008-500X (New Taipei City, Taiwan)
A BW1008-500X digital microscope and Ramé-Hart advanced goniometer model 500-F1 (Succasunna, NJ, USA) were used to capture images and movies of the saline droplet. The experiments were carried out at an ambient air temperature of °C. The relative humidity of air was equal to RH = 44%.
3. Results and Discussion
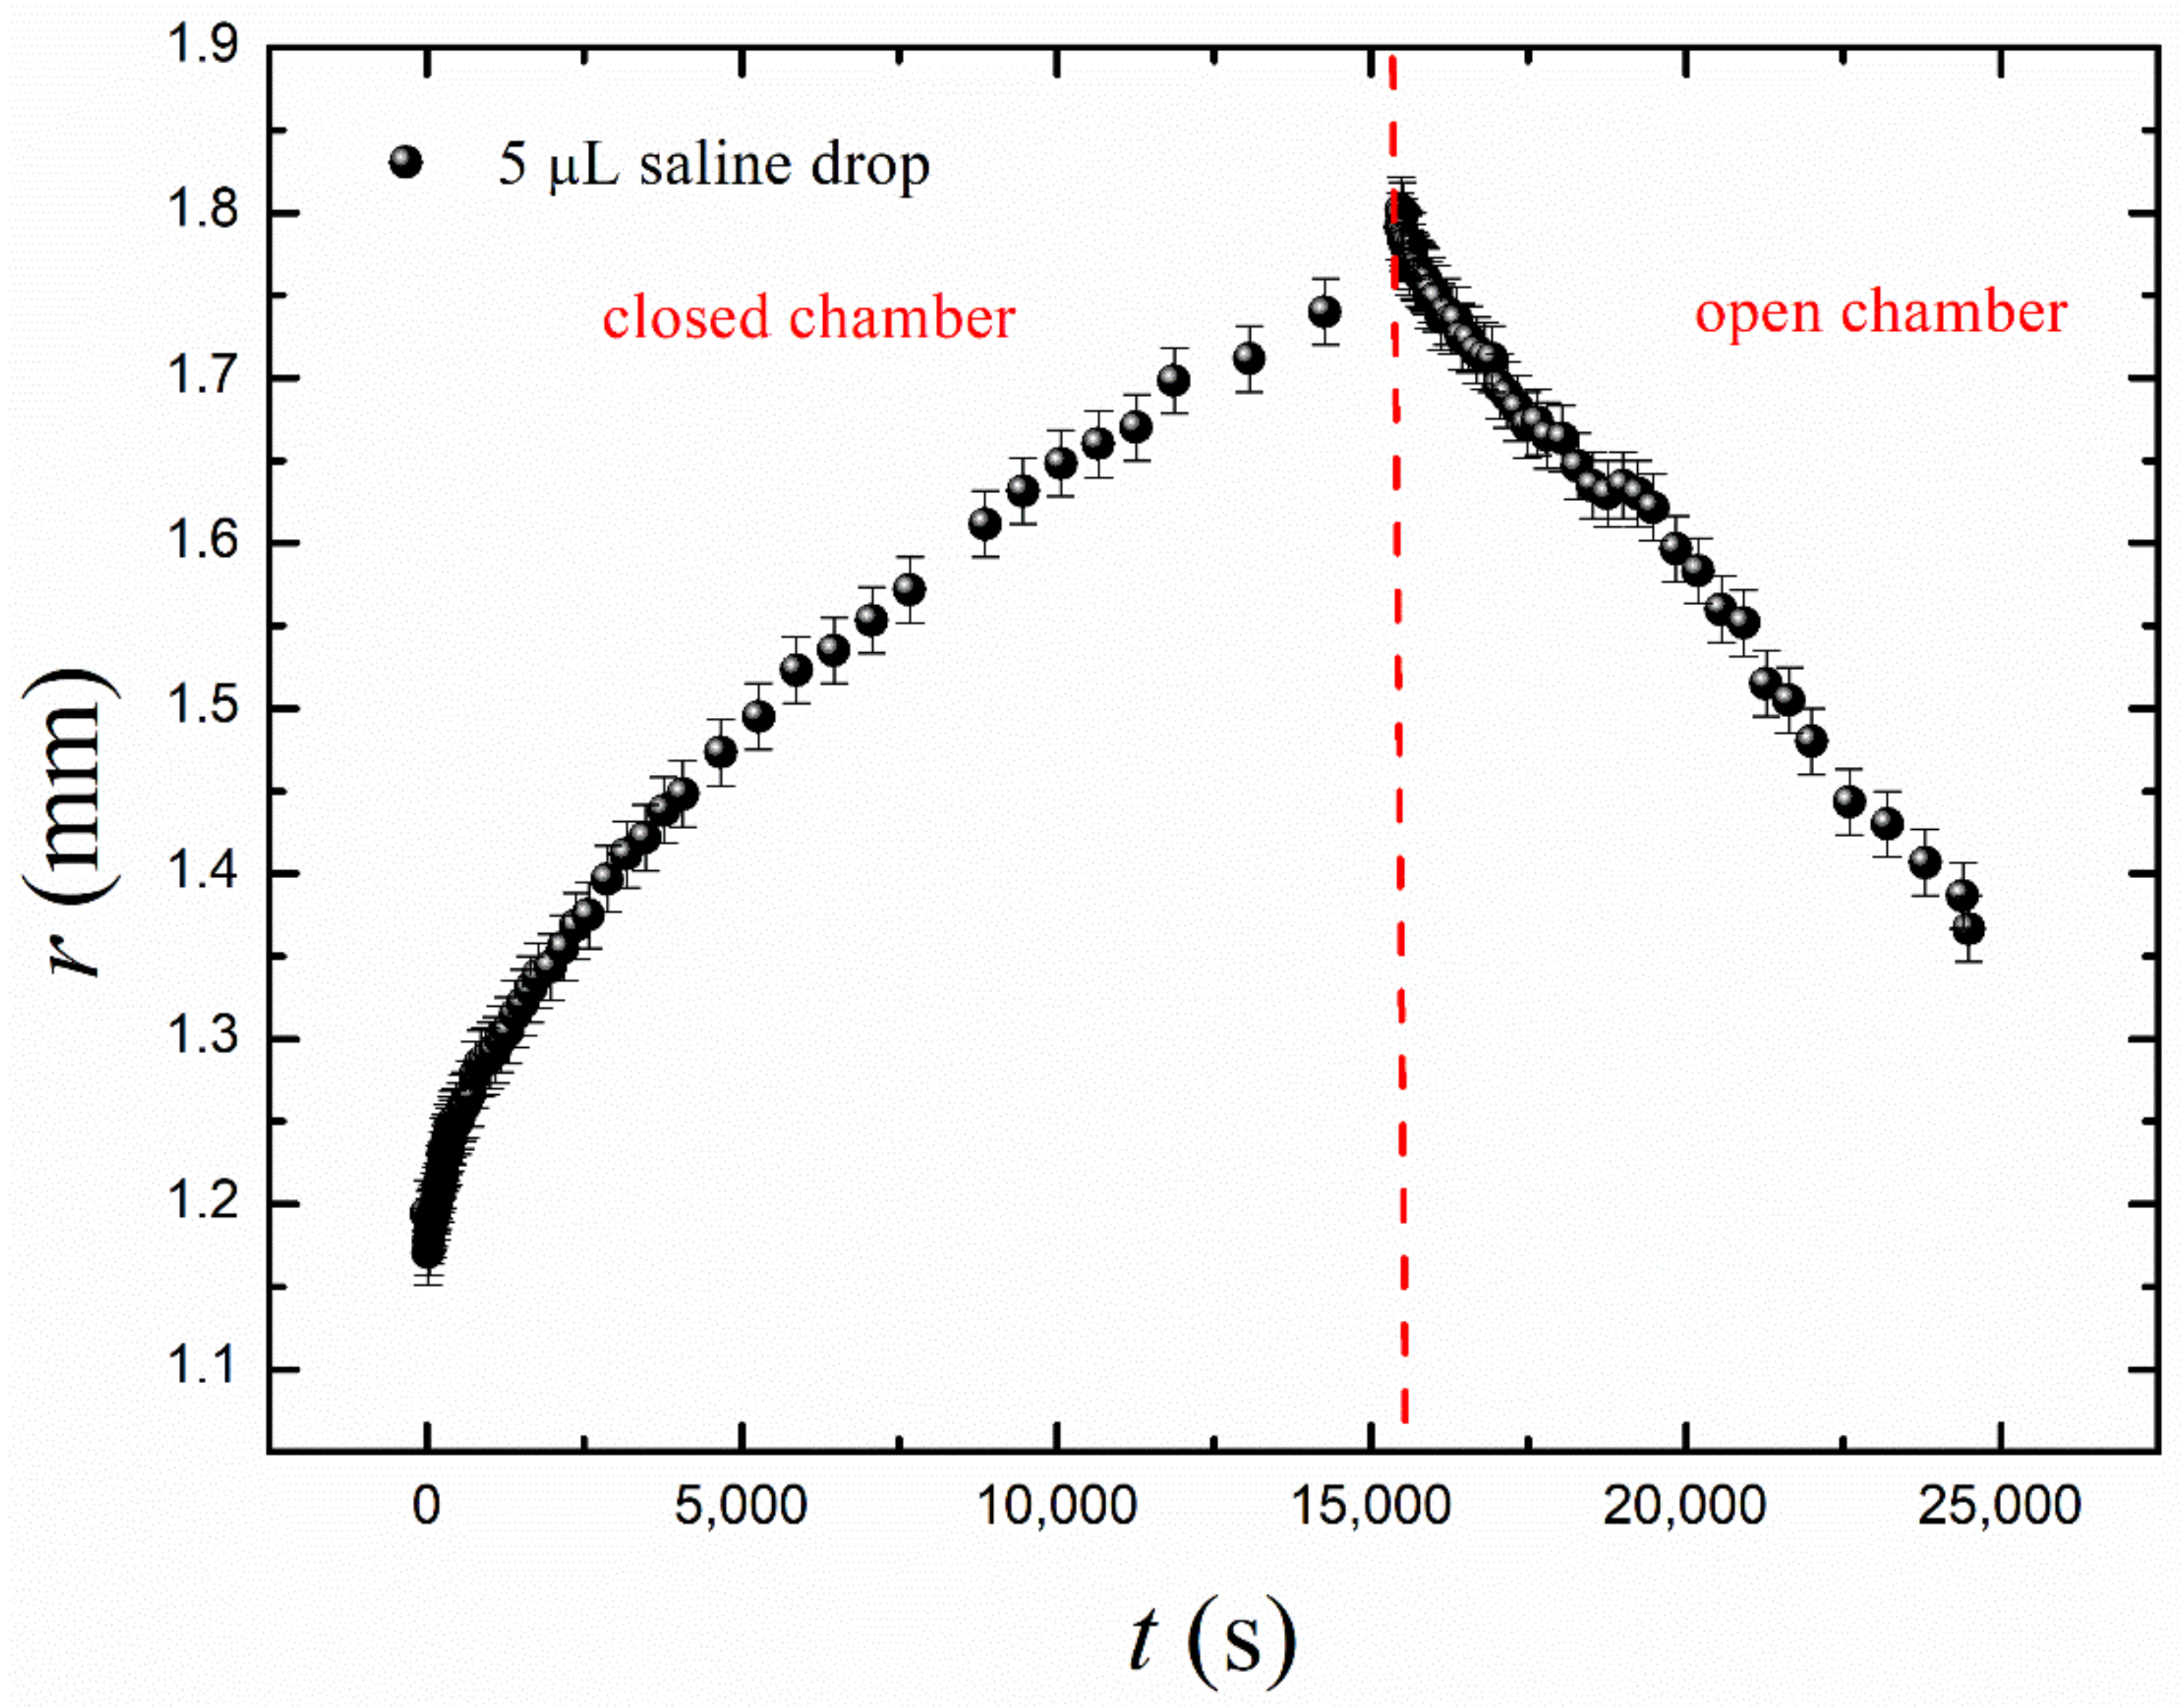
The floating PDMS membrane was prepared as depicted in Figure 1 by pouring a mixture containing liquid PDMS and a curing agent on the distilled water/vapor interface as described in detail in the Materials and Methods Section (see also [16]). Afterwards, 5–15 µL saline droplets were placed on the PDMS membrane floating within the closed vessel (chamber), as shown in Figure 2. Osmotic mass transport across the PDMS membrane gave rise to the increase in the volume of the droplet, accompanied by advancing motion of the triple (three-phase) line, as depicted in Figure 2 (diffusion of water through thin oil layers was reported recently in [17]). We performed two series of experiments with (i) long-range and (ii) short-range cycles of the osmotic growth/evaporation of droplets as described below. Time evolution of the droplet contact radius r(t) and the apparent contact angle shown in Figure 3 were registered with the goniometer.
Figure 3.
Geometrical parameters of saline droplet placed on the floating PDMS membrane are depicted. R(t) is the current radius of the droplet; r(t) is the current radius of the contact area and is the apparent contact angle of the droplet.
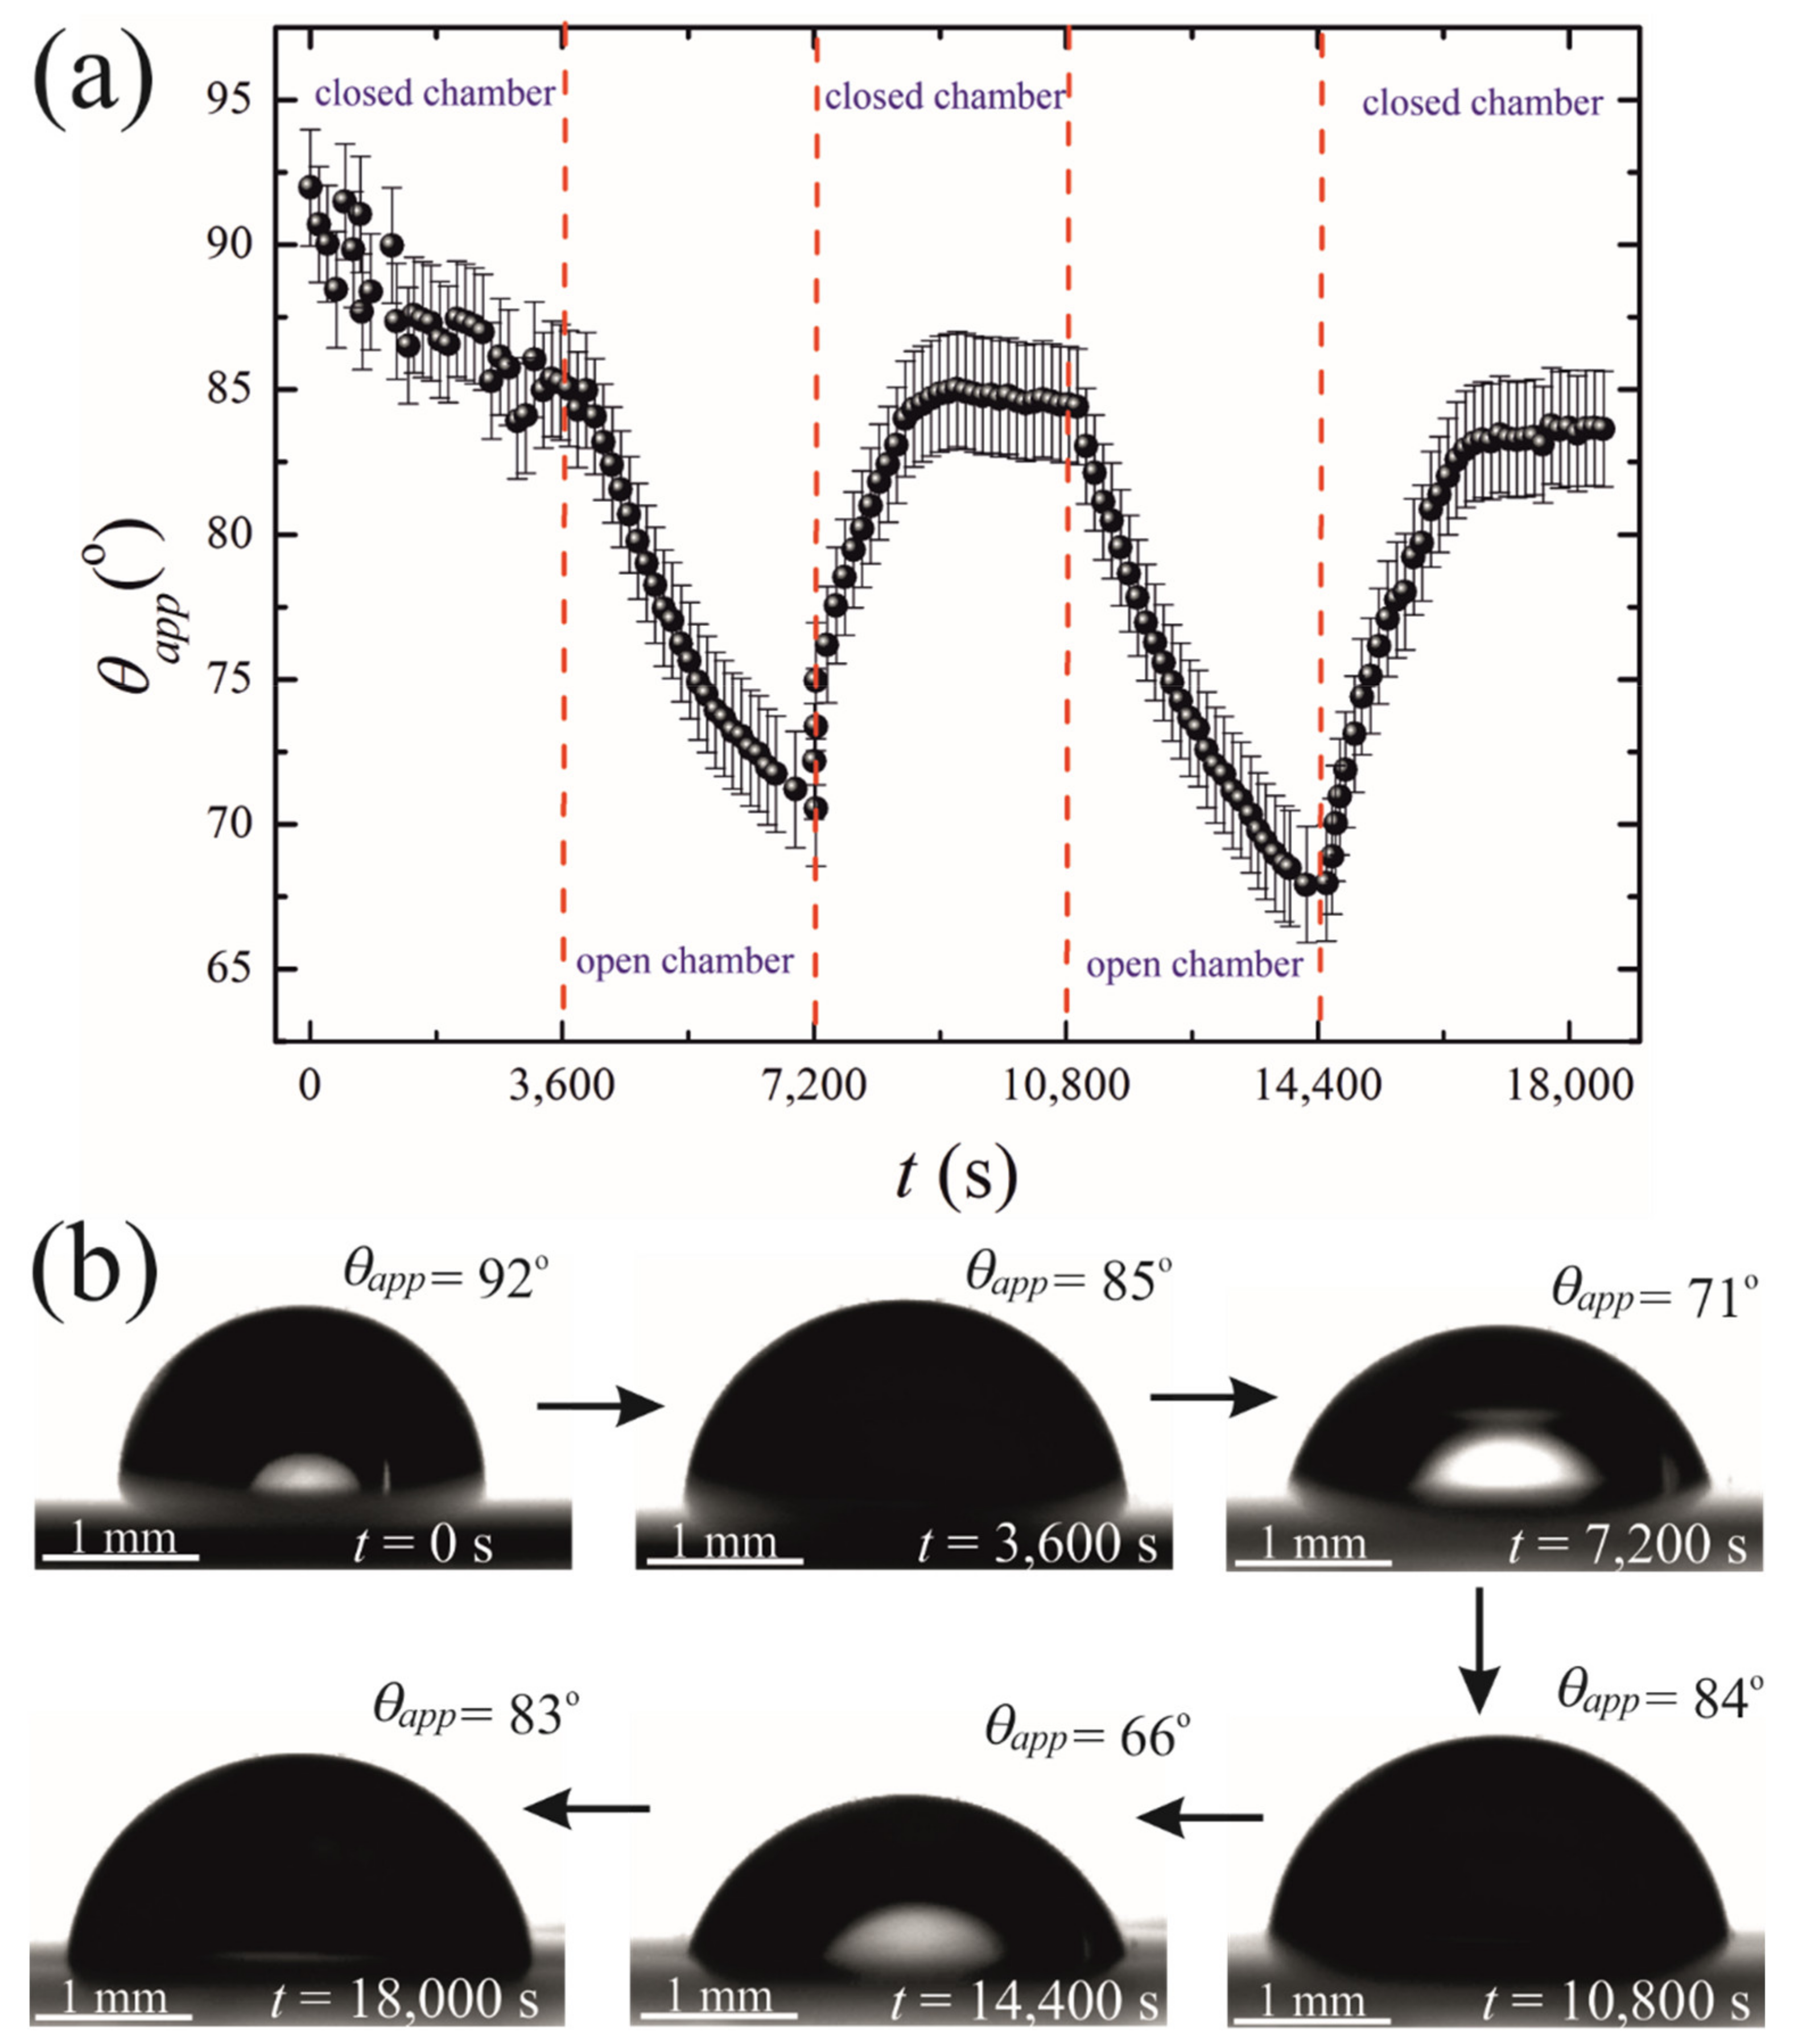
- In the long-time experiments, the stage of growth continued for . During this time, the droplet volume increased from 5 µL to 30 µL. Afterwards, the chamber was opened, as shown in Figure 2 and Video S1 and the droplet was evaporated during Increasing the evaporation time scale gave rise to the formation of the NaCl crystals in the vicinity of the triple line as shown in Figure 2. At this stage, the volume of the droplet was decreased, and the triple line retracted. We performed cycles of the long-time osmotic growth/evaporation of a droplet and observed that the process is reversible. Statistical scattering of the contact radius and volume of the droplet within growth/evaporation cycles were established as ±0.05 mm and ±0.3 μL, respectively.
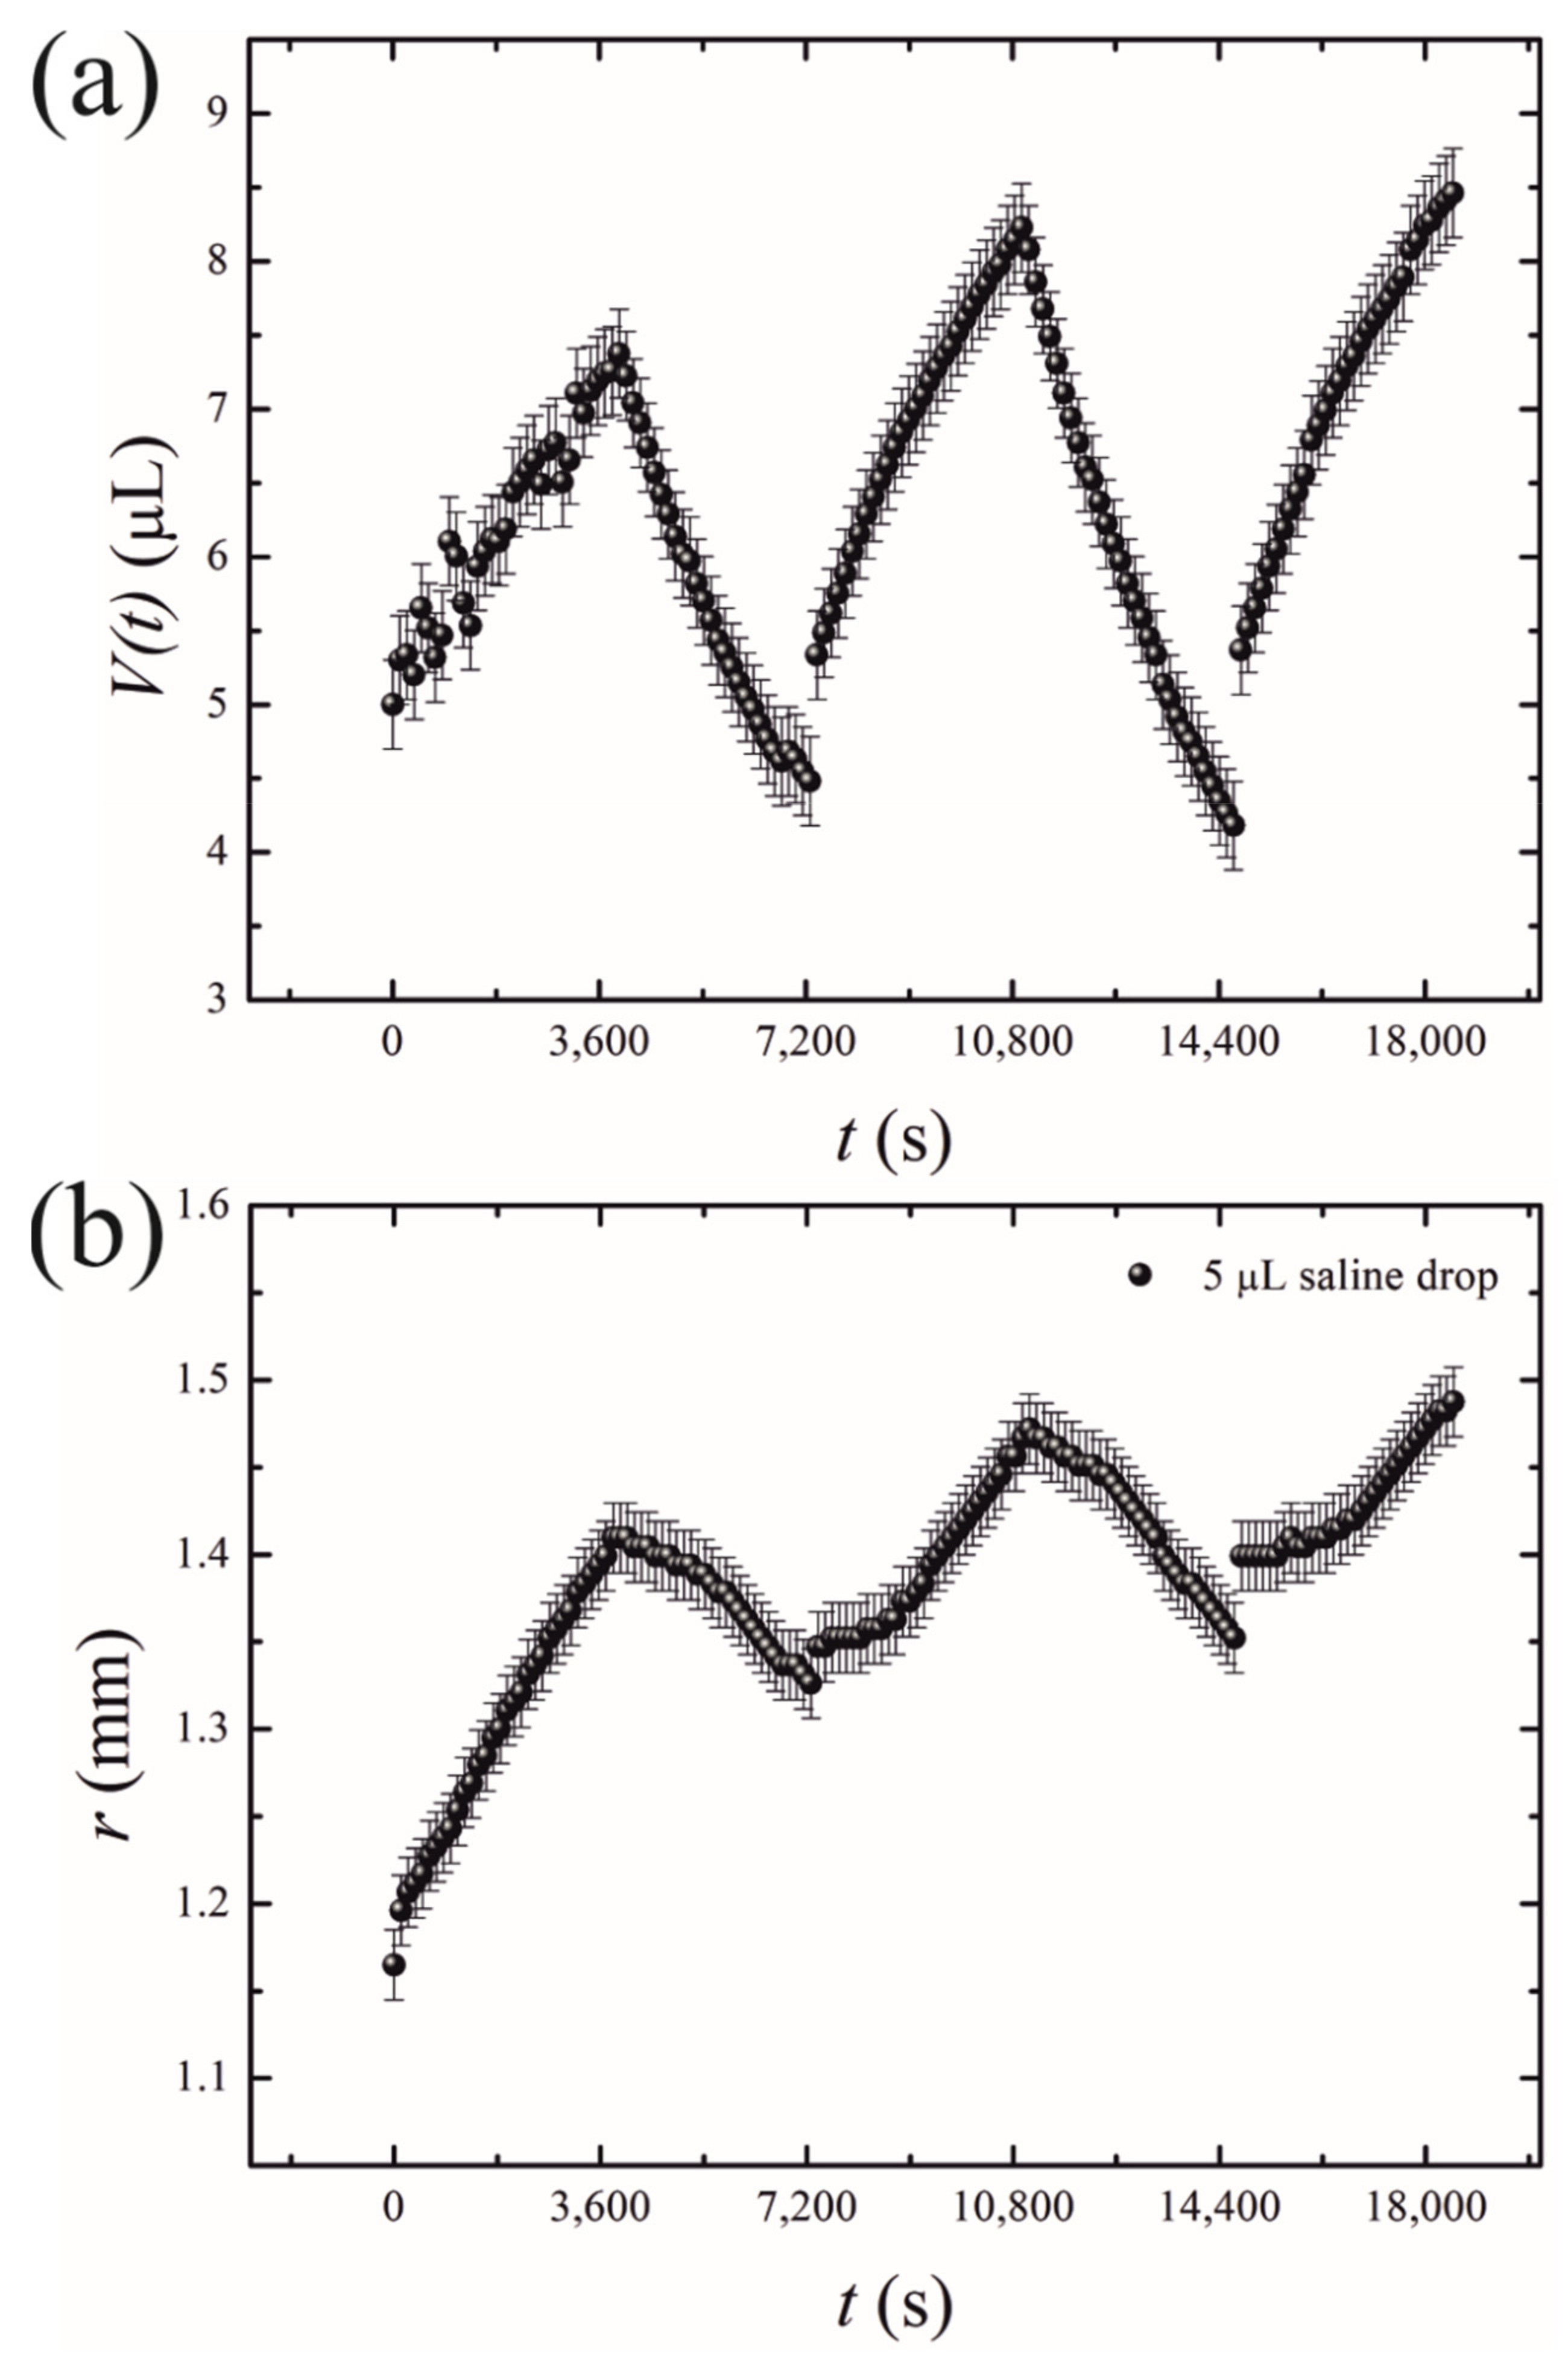
- Short-time growth/evaporation (retraction) experiments are illustrated in Figure 4 and Video S2, depicting the cyclic change in the volume V and contact diameter D of the droplet. In these experiments, the time scales were ; , and reversible growth/evaporation cycles were performed.
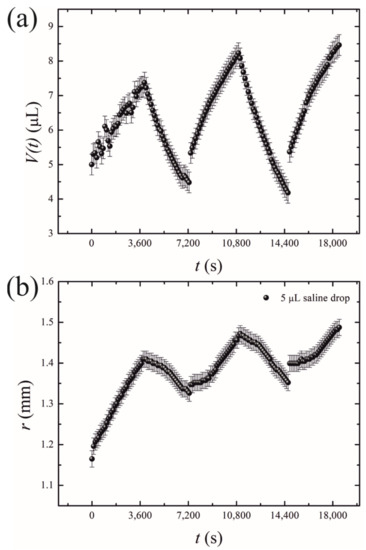 Figure 4. Oscillatory behavior of the droplets exposed to the osmotic mass transport/evaporation cycles is depicted. (a) Time evolution of the drop volume V(t); (b) the time dependence of the contact radius r.
The initial volume of the droplets in these experiments was confined within the range of . The final volume of these droplets was in the range of . The changes in both the volume and the contact area diameter of a droplet were accompanied by a change in the apparent contact angle, illustrated in Figure 5. The range of the apparent contact angles registered during the osmotic growth/retraction cycles was established as . This change in the apparent contact angle is reasonably attributed to the phenomenon of the contact angle hysteresis [18,19,20,21,22,23,24]. In our experiments, this hysteresis is strengthened by the pinning of the triple line arising from the coffee-stain effect inevitable under evaporation of saline droplets [24,25,26,27,28,29,30]. The coffee-stain effect is evidenced by the formation of NaCl crystals close to the triple line, as depicted in Figure 2.
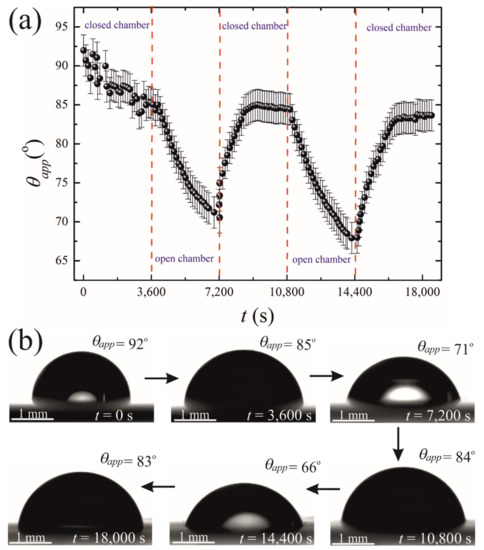
Figure 5.
(a) Time evolution of the apparent contact angle is depicted. (b) Sequence of images illustrating the side view of the time evolution of the droplet placed on the PDMS membrane is shown.
We now address the stage of the osmotic growth of the droplets in more detail as illustrated in Figure 6. Consider an approximate model of the osmotic growth of the water droplet observed in recent experiments.

Figure 6.
Growth and decay of a 5 µL saline drop on a floating PDMS membrane due to osmosis and evaporation.
In contrast to spherical small liquid marbles, considered recently in [13], the water droplet is almost hemispherical. The current density of salt water in the droplet can be expressed as follows:
where , is the current radius of the droplet, and are the initial radius of the droplet and the initial density of salt water, respectively, and is the density of pure water under the membrane. According to Equation (1), and the value of decreases with time due to the osmotic growth of the droplet.
The balance equation for the volume of the growing hemispherical droplet appears as follows:
where is the constant osmotic flow rate of pure water measured in kg/(m2·s). It is natural to assume that is directly proportional to the following difference in densities:
This proportionality can be written as:
where is the unknown phenomenological osmotic parameter of the membrane [13]. It is convenient to introduce the characteristic time of the process:
and rewrite Equation (2) as follows:
The obvious initial condition for the droplet radius is:
The analytical solution to the Cauchy problem, defined by Equations (6) and (7) is simply:
where is the dimensionless time of the osmotic evolution of the droplet. At the beginning of the process (at ), Equation (8) is approximated as:
It is interesting that Equations (8) and (9) do not contain any dependence on the initial radius of the droplet. Thus, the experimental date obtained with different initial radii of the droplets should be fitted with the universal straight line. This prediction is confirmed by the measurements carried out for the saline water droplets of different initial volumes (5 µL, 10 µL, and 15 µL). One recognizes from Figure 7 that the initial time dependences of the growing droplet radius are almost linear, and the slope of all the curves is very close to that predicted by Equation (9). This enables us to estimate the characteristic time of the process, which appears to be in the range of
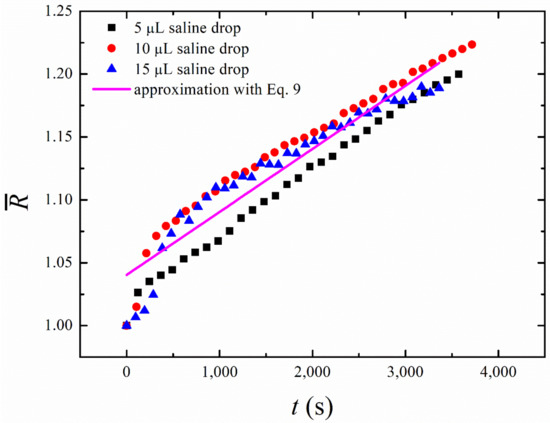
Figure 7.
Experimental curves describing the osmotic evolution of a droplet of different initial volumes during the “short-time” growth are presented (black squares—, red circles—; blue triangles—); the solid line demonstrates the best linear fitting of the experimental data for . The osmotic growth is satisfactorily approximated by the universal linear time dependence, reproduced by the solid line, whose slope is independent of the initial volume of a droplet.
Radii of the studied droplets were smaller than the capillary length, which is for water droplets [24], and the apparent contact angles were close to ; thus, the shape of the droplets is close to hemispherical.
Note that a more comprehensive model of the osmotic growth of droplets should take into account the non-perfectly spherical shape of the droplets and inevitably uneven distribution of salt over the droplet volume. Most likely, the latter effect is responsible for the relatively fast increase in the droplet size at the very beginning of its osmotic growth (see Figure 7).
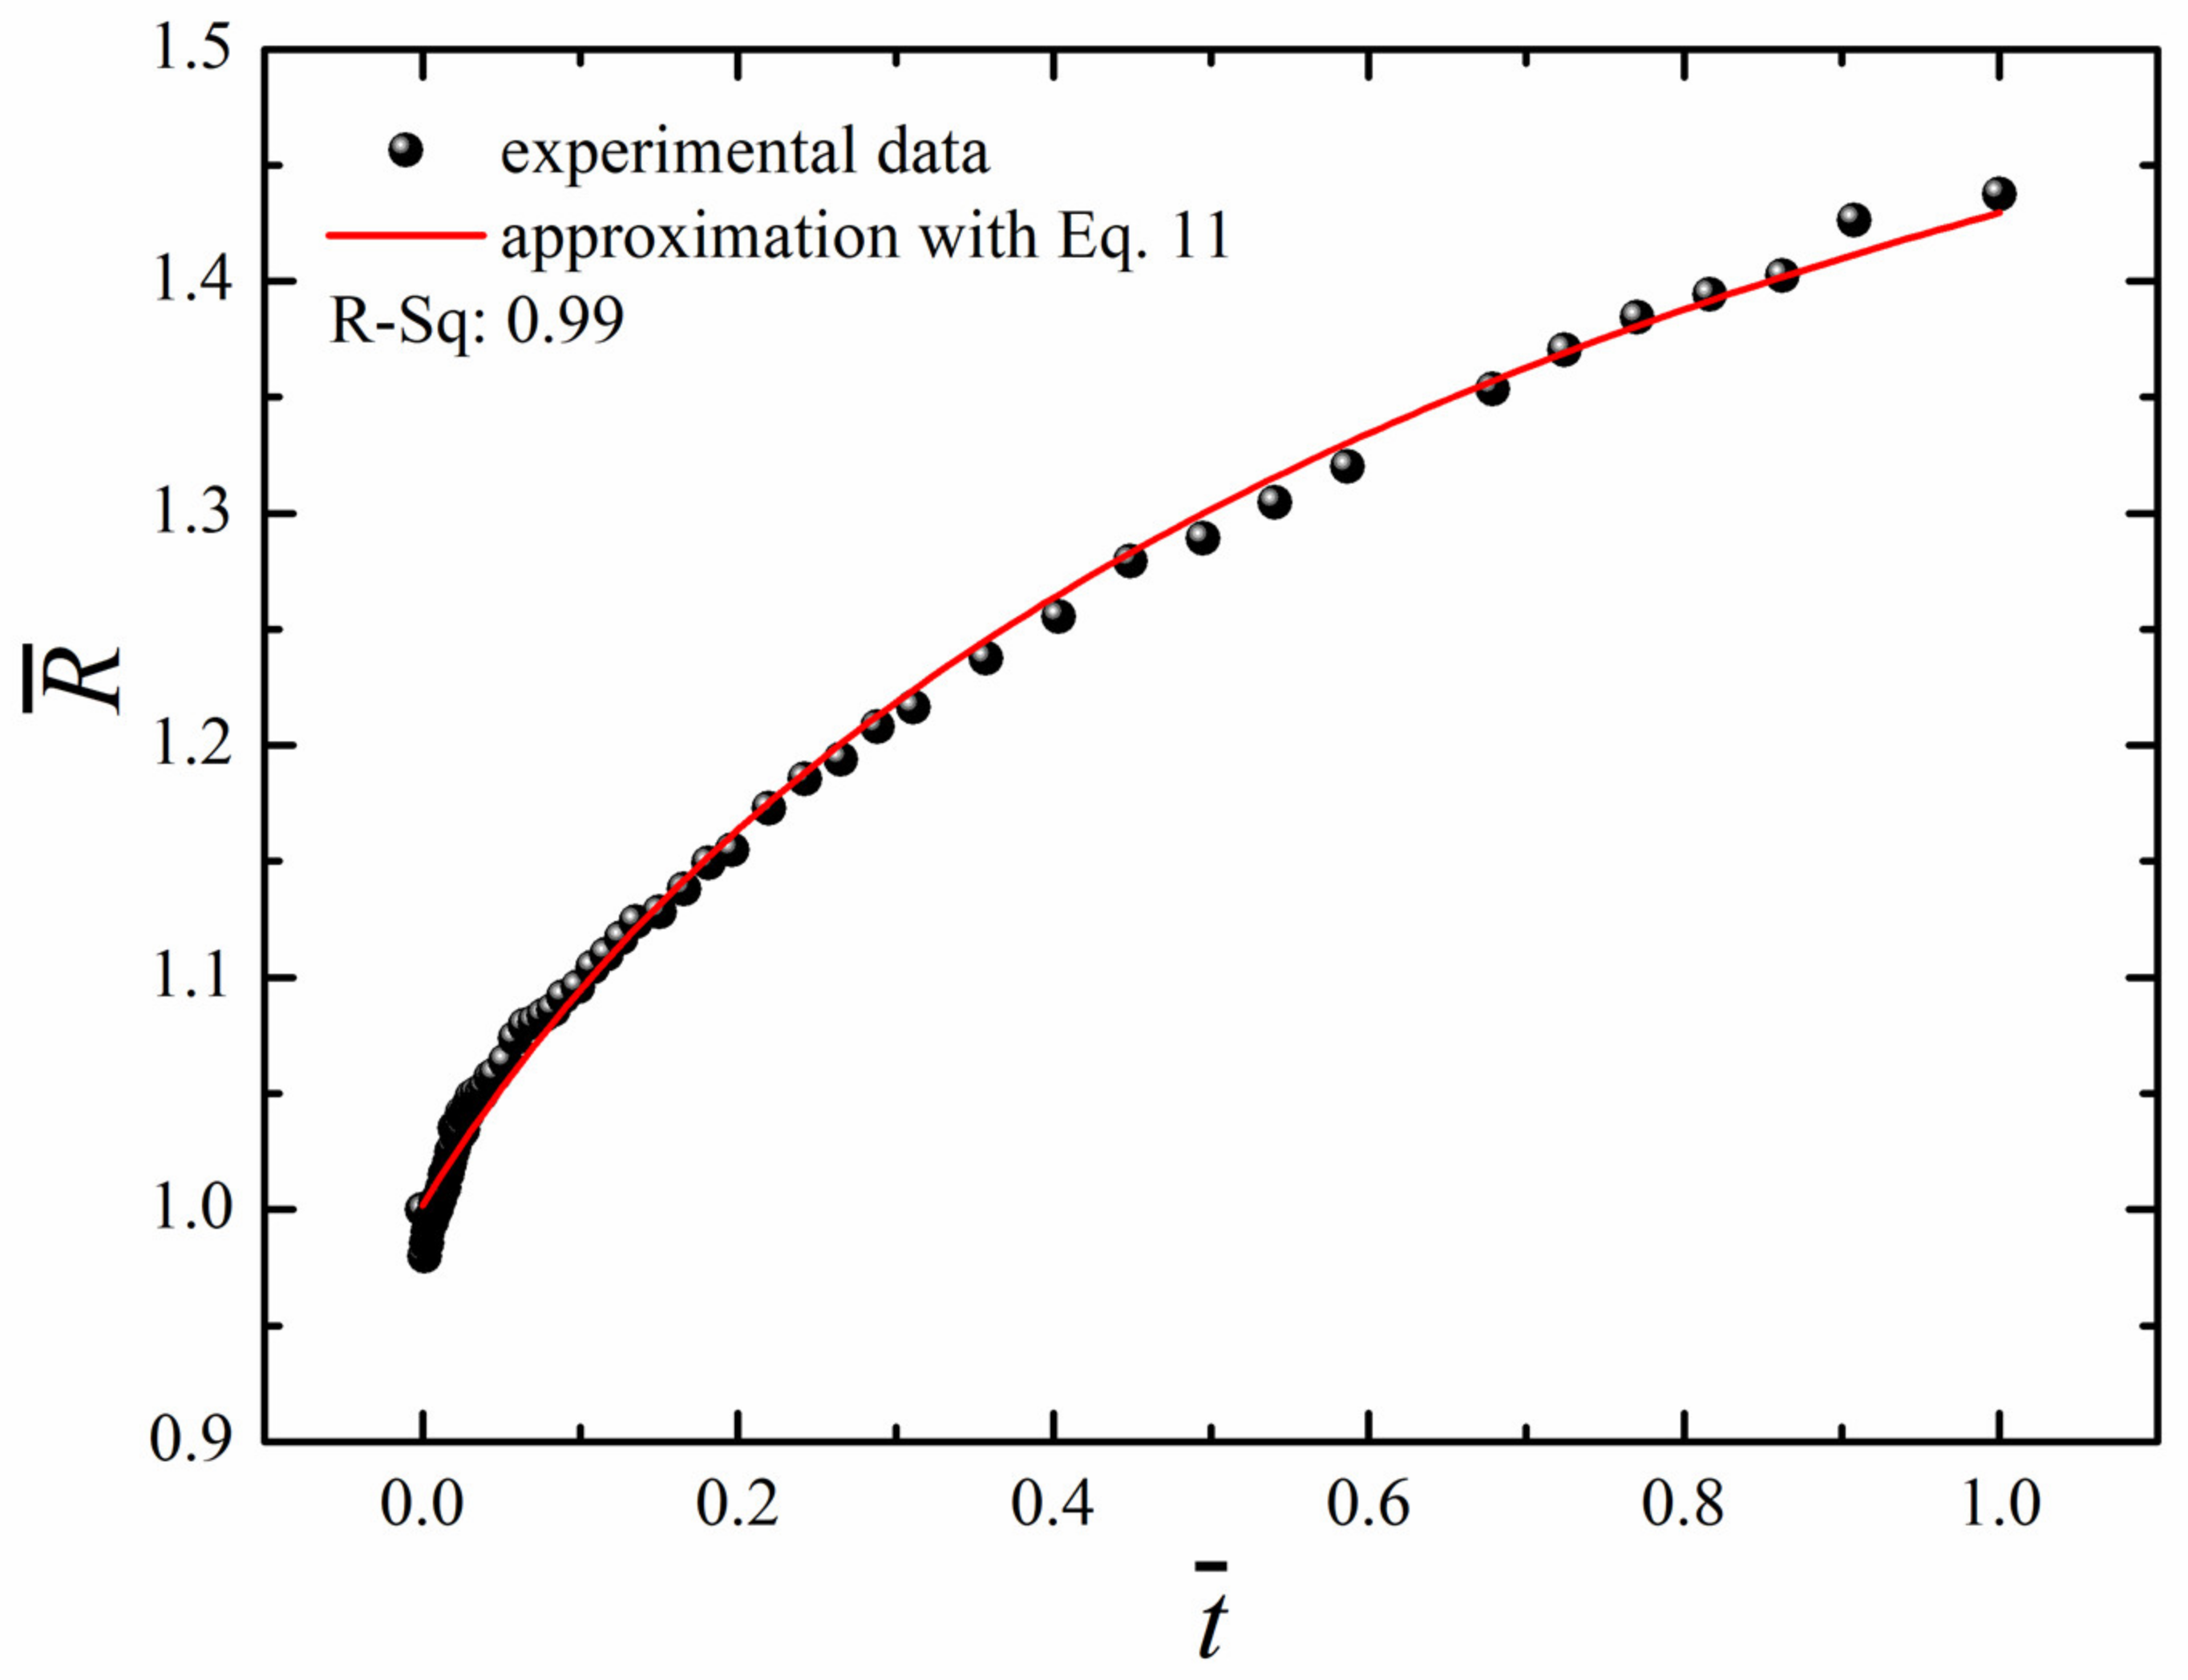
The “long-time” non-linear osmotic growth of droplets may be described by the phenomenological equation, suggested recently in [13].
where the triad , , and, were taken as parameters. The best possible fit established with the least square method, depicted in Figure 8, was obtained at , and .

Figure 8.
Time evolution of the dimensionless radius of the droplet (black circles) and its fit with Equation (11) at R0 = 1.2 mm and .
4. Conclusions
We conclude that water diffusion across floating micro-scale thickness cured PDMS film gives rise to the osmotic growth of a saline water droplet placed on the film. The phenomenological model of the osmotic mass transfer to the droplet is suggested. The dimensionless equation describing the osmotic growth of a droplet is shaped: . The initial stage of osmotic growth of saline droplets is satisfactorily approximated by the universal linear time dependence, whose slope is independent of the initial radius of a droplet. The calculations using this physical model are in good agreement with the experimental data for droplets of different initial volume. The osmotic growth of the droplet followed by the evaporation of the droplet yields reversible growth/retraction cycles. NaCl crystals were observed in the vicinity of the triple line at the evaporation stage due to the pinning of the triple line and the coffee-stain effect [21,22,23,24,25,26]. The reversibility of the reported growth/retraction cycles should be emphasized. The “long-time” osmotic growth of droplets is described by the phenomenological equation: . The characteristic time scale of the osmotic mass transport is established as . The reported cured PDMS membranes and the process have potential for desalination [31] and development of separators for batteries [32].
Supplementary Materials
The following are available online at https://www.mdpi.com/article/10.3390/fluids6070232/s1, Video S1: Long-time growth/evaporation, Video S2: Short-time growth/evaporation.
Author Contributions
Conceptualization, P.K.R., S.S., and E.B.; methodology, P.K.R. and L.A.D.; software, P.K.R.; validation, P.K.R. and E.B.; physical modeling, L.A.D.; investigation, P.K.R., S.S., E.B., and L.A.D.; resources, S.S.; data curation, P.K.R.; writing—original draft preparation, E.B.; writing—review and editing, S.S., E.B., and L.A.D.; visualization, P.K.R.; supervision, S.S. and E.B.; project administration, S.S. All authors have read and agreed to the published version of the manuscript.
Funding
This research received no external funding.
Institutional Review Board Statement
Not applicable.
Informed Consent Statement
Not applicable.
Data Availability Statement
The data presented in this study are available on request from the corresponding author.
Conflicts of Interest
The authors declare no conflict of interests.
References
- Mitrovski, S.M.; Elliott, L.C.C.; Nuzzo, R.G. Microfluidic devices for energy conversion: Planar integration and performance of a passive, fully immersed H2−O2 fuel cell. Langmuir 2004, 20, 6974–6976. [Google Scholar] [CrossRef] [PubMed]
- Vankelecom, I.F.J.; de Kinderen, J.; Dewitte, B.M.; Uytterhoeven, J.B. Incorporation of hydrophobic porous fillers in PDMS membranes for use in pervaporation. J. Phys. Chem. 1997, 101, 5182–5185. [Google Scholar] [CrossRef]
- Li, L.; Xiao, Z.; Tan, S.; Pu, L.; Zhang, Z. Composite PDMS membrane with high flux for the separation of organics from water by pervaporation. J. Membr. Sci. 2004, 243, 177–187. [Google Scholar] [CrossRef]
- Fu, Y.-J.; Qui, H.-Z.; Liao, K.-S.; Lue, S.J.; Hu, C.-C.; Lee, K.-R.; Lai, J.-Y. Effect of UV-ozone treatment on poly(dimethylsiloxane) membranes: Surface characterization and gas separation performance. Langmuir 2010, 26, 4392–4399. [Google Scholar] [CrossRef]
- Firpo, G.; Angeli, E.; Repetto, L.; Valbusa, U. Permeability thickness dependence of polydimethylsiloxane (PDMS) membranes. J. Membr. Sci. 2015, 481, 1–8. [Google Scholar] [CrossRef] [Green Version]
- Nour, M.; Berean, K.; Balendhran, S.; Ou, J.Z.; Du Plessis, J.; McSweeney, C.; Bhaskaran, M.; Sriram, S.; Kalantar-zadeh, K. CNT/PDMS composite membranes for H2 and CH4 gas separation. Int. J. Hydrog. Energy 2013, 38, 10494–10501. [Google Scholar] [CrossRef] [Green Version]
- Nour, M.; Berean, K.; Griffin, M.J.; Matthews, G.I.; Bhaskaran, M.; Sriram, S.; Kalantar-zadeh, K. Nanocomposite carbon-PDMS membranes for gas separation. Sens. Actuator B Chem. 2012, 161, 982–988. [Google Scholar] [CrossRef] [Green Version]
- Sanchis-Perucho, P.; Robles, Á.; Durán, F.; Ferrer, J.; Seco, A. PDMS membranes for feasible recovery of dissolved methane from AnMBR effluents. J. Membr. Sci. 2020, 604, 118070. [Google Scholar] [CrossRef]
- Ataeivarjovi, E.; Tang, Z.; Chen, J. Study on CO2 Desorption Behavior of a PDMS–SiO2 Hybrid Membrane Applied in a Novel CO2 Capture Process. ACS Appl. Mater. Interfaces 2018, 10, 28992–29002. [Google Scholar] [CrossRef]
- Logemann, M.; Alders, M.; Wist, M.; Pyankova, V.; Krakau, D.; Gottschalk, D.; Wessling, M. Can PDMS membranes separate aldehydes and alkenes at high temperatures? J. Membr. Sci. 2020, 615, 118334. [Google Scholar] [CrossRef]
- Zheng, B.; Tice, J.D.; Roach, L.S.; Ismagilov, R.F. A droplet-based, composite PDMS/glass capillary microfluidic system for evaluating protein crystallization conditions by microbatch and vapor-diffusion methods with on-chip X-ray diffraction. Angew. Chem. Int. 2004, 43, 2508–2511. [Google Scholar] [CrossRef]
- Zheng, B.; Gerdts, C.J.; Ismagilov, R.F. Using nanoliter plugs in microfluidics to facilitate and understand protein crystallization. Curr. Opin. Struct. Biol. 2005, 15, 548–555. [Google Scholar] [CrossRef] [Green Version]
- Roy, P.K.; Legchenkova, I.; Shoval, S.; Dombrovsky, L.A.; Bormashenko, E. Osmotic evolution of composite liquid marbles. J. Colloid Interface Sci. 2021, 592, 167–173. [Google Scholar]
- Thangawng, A.L.; Ruoff, R.S.; Swartz, M.A.; Glucksberg, M.R. An ultra-thin PDMS membrane as a bio/micro–nano interface: Fabrication and characterization. Biomed. Microdevices 2007, 9, 587–595. [Google Scholar] [CrossRef]
- Koo, J.W.; Ho, J.S.; An, J.; Zhang, Y.; Chua, C.K.; Chong, T.H. A review on spacers and membranes: Conventional or hybrid additive manufacturing? Water Res. 2020, 188, 116497. [Google Scholar] [CrossRef]
- Kim, D.; Kim, S.-H.; Park, Y. Floating-on-water fabrication method for thin Polydimethylsiloxane membranes. Polymers 2019, 11, 1264. [Google Scholar] [CrossRef] [Green Version]
- Zhang, R.; Liao, W.; Wang, Y.; Wang, Y.; Wilson, D.I.; Clarke, S.M.; Yang, Z. The growth and shrinkage of water droplets at the oil-solid interface. J. Colloid Interface Sci. 2021, 584, 738–748. [Google Scholar] [CrossRef]
- Erbil, H.Y. Surface Chemistry of Solid and Liquid Interfaces; Blackwell: Oxford, UK, 2006. [Google Scholar]
- Tadmor, R. Line energy and the relation between advancing, receding, and young contact angles. Langmuir 2004, 20, 7659–7664. [Google Scholar] [CrossRef]
- Tadmor, R. Approaches in wetting phenomena. Soft Matter 2011, 7, 1577–1580. [Google Scholar] [CrossRef]
- Tadmor, R.; Yadav, P.S. As-placed contact angles for sessile drops. J. Colloid Interface Sci. 2008, 317, 241–246. [Google Scholar] [CrossRef]
- Liu, J.; Xia, R.; Zhou, X. A new look on wetting models: Continuum analysis. Sci. China Phys. Mech. Astron. 2012, 55, 2158–2166. [Google Scholar] [CrossRef]
- Liu, J.; Mei, Y.; Xia, R. A new wetting mechanism based upon triple contact line pinning. Langmuir 2011, 27, 196–200. [Google Scholar] [CrossRef] [PubMed]
- Bormashenko, E. Physics of Wetting Phenomena and Applications of Fluids on Surfaces; Walter de Gruyter: Berlin, Germany, 2017. [Google Scholar]
- Deegan, R.D.; Bakajin, O.; Dupont, T.F.; Huber, G.; Nagel, S.R.; Witten, T.A. Capillary flow as the cause of ring stains from dried liquid drops. Nature 1997, 389, 827–829. [Google Scholar] [CrossRef]
- Deegan, R.D.; Bakajin, O.; Dupont, T.F.; Huber, G.; Nagel, S.R.; Witten, T.A. Contact line deposits in an evaporating drop. Phys. Rev. E 2000, 62, 756–765. [Google Scholar] [CrossRef] [Green Version]
- Hu, H.; Larson, R.G. Analysis of the effects of Marangoni stresses on the microflow in an evaporating sessile droplet. Langmuir 2005, 21, 3972–3980. [Google Scholar] [CrossRef]
- Zhong, X.; Ren, J.; Duan, F.J. Wettability effect on evaporation dynamics and crystalline patterns of sessile saline droplets. J. Phys. Chem. B 2017, 121, 7924–7933. [Google Scholar] [CrossRef]
- Shao, X.; Duan, F.; Hou, Y.; Zhong, X. Role of surfactant in controlling the deposition pattern of a particle-laden droplet: Fundamentals and strategies. Adv. Colloid Interface Sci. 2020, 275, 102049. [Google Scholar] [CrossRef]
- Shao, Z.; Hou, Y.; Zhong, X. Modulation of evaporation-affected crystal motion in a drying droplet by saline and surfactant concentrations. Colloids Surfaces A 2021, 623, 126701. [Google Scholar] [CrossRef]
- Yao, M.; Tijing, L.D.; Naidu, D.; Kim, S.-H.; Matsuyama, H.; Fane, A.G.; Shon, K. A review of membrane wettability for the treatment of saline water deploying membrane distillation. Desalination 2020, 479, 114312. [Google Scholar] [CrossRef]
- Angulakshmi, N.; Stephan, A.M. Efficient electrolytes for lithium–sulfur batteries. Front. Energy Res. 2015, 3, 1–8. [Google Scholar] [CrossRef] [Green Version]


Publisher’s Note: MDPI stays neutral with regard to jurisdictional claims in published maps and institutional affiliations. |
© 2021 by the authors. Licensee MDPI, Basel, Switzerland. This article is an open access article distributed under the terms and conditions of the Creative Commons Attribution (CC BY) license (https://creativecommons.org/licenses/by/4.0/).