Article

High-Efficiency Can Be Achieved for Non-Uniformly Flexible Pitching Hydrofoils via Tailored Collective Interactions

1
Aerodynamics and Flight Mechanics Group, Faculty of Engineering and the Environment, University of Southampton, Southampton SO17 1BJ, UK
2
Mechanical Engineering and Mechanics, Lehigh University, Bethlehem, PA 18015, USA
*
Author to whom correspondence should be addressed.
Fluids 2021, 6(7), 233; https://doi.org/10.3390/fluids6070233
Submission received: 22 April 2021 / Revised: 30 May 2021 / Accepted: 18 June 2021 / Published: 25 June 2021
(This article belongs to the Special Issue Hydrodynamics of Swimming)

Abstract

:
New experiments examine the interactions between a pair of three-dimensional ( A R = 2) non-uniformly flexible pitching hydrofoils through force and efficiency measurements. It is discovered that the collective efficiency is improved when the follower foil has a nearly out-of-phase synchronization with the leader and is located directly downstream with an optimal streamwise spacing of X * = 0.5 . The collective efficiency is further improved when the follower operates with a nominal amplitude of motion that is 36 % larger than the leader’s amplitude. A slight degradation in the collective efficiency was measured when the follower was slightly-staggered from the in-line arrangement where direct vortex impingement is expected. Operating at the optimal conditions, the measured collective efficiency and thrust are η C = 62 % and C T , C = 0.44 , which are substantial improvements over the efficiency and thrust of η C = 29 % and C T , C = 0.16 of two fully-rigid foils in isolation. This demonstrates the promise of achieving high-efficiency with simple purely pitching mechanical systems and paves the way for the design of high-efficiency bio-inspired underwater vehicles.

1. Introduction

Many fish propel themselves by passing a traveling wave down their bodies, which in turn oscillates their caudal fin with a large amplitude as well as any anal or dorsal fins with a lesser amplitude. Consequently, these fins generate thrust through hydrofoil-like mechanics [1]. Moreover, the force generation and energy expenditure of the caudal fins can be improved and reduced, respectively, by their interaction with the unsteady flow generated from the anal/dorsal fins [2,3]. Additionally, these various propulsive surfaces exhibit different structural and morphological characteristics [4], which can lead to varying degrees of flexibility, not only between species [5,6,7], but also along a single fin [8,9]. Thus, both the flexibility characteristics of the fins and fin-fin interactions play key roles in achieving high-efficiency swimming.
Inspired by biology, we postulate that high-efficiency swimming ( η 60 % ) can be achieved even with a simple purely pitching hydrofoil system through the combined effects of flexibility and collective interactions. To determine a pathway to achieving high-efficiency swimming, we adopt a hypothesis-driven approach that is informed by previous work on flexibility and collective interactions instead of a comprehensive parameter/variable optimization.
Uniform flexibility is widely known to dramatically improve or degrade performance of isolated unsteady hydrofoils [7,10,11,12,13,14]. It has also been appreciated that not only is the degree of flexibility important, but also the bending pattern [15]. This has led to recent studies examining the effects of non-uniform flexibility [16,17]. In fact, Ref. [17] independently varied the degree of flexibility and the flexion ratio, λ , defined as the dimensionless length along the foil chord where flexion begins, to determine that both are significant and should be tailored to maximize the propulsive efficiency. Ongoing research [18] has experimentally determined a specific effective flexibility and flexion ratio to achieve a propulsive efficiency of 48 % for an isolated pitching foil (reproduced efficiency data in Section 3.1). This moderate efficiency foil ( 40 % η < 60 % ) is a significant improvement over its low efficiency ( η = 29 % ) fully rigid counterpart, and it will be used as the baseline, non-uniformly flexible pitching foil in the current study. With a moderate efficiency foil in hand, the key to achieving high-efficiency is the tailoring of collective interactions between two such flexible pitching foils.
There is a growing body of research that shows that rigid foils in in-line arrangements can generate higher thrust and perform more efficiently compared to foils in isolation when they are properly spaced and synchronized [19,20,21,22,23]. Even bio-robots with multiple flexible fins show dramatic alterations in their thrust production through the proper synchronization of their anal/dorsal fins and caudal fin [24]. While this research suggests the potential to significantly improve the efficiency and thrust of a flexible pitching foil system through tailored collective interactions, it is by no means guaranteed. There are two complicating factors. First, pitching hydrofoils systems are typically low-efficiency systems (Figure 1) that never break 40% efficiency, which makes it surprising that a pitching foil system can exceed 60% and achieve high-efficiency. The second complication is that the dramatic collective efficiency gains observed in previous work occurred on systems that were low efficiency to begin with. For example, in recent work [25] a NACA 0012 pitching foil in isolation has an efficiency of η = 15 % , and with a follower foil slightly staggered in the wake of the leader, the collective efficiency rises to η C = 28 % ; a nearly 100% increase. This dramatic gain in efficiency would place the current baseline foils at nearly 100% collective efficiency; an unlikely scenario. To provide a better back-of-the-envelope estimate of the possible collective efficiency enhancement we can use this previous data by assuming that the leader efficiency remains at 15% and that the collective efficiency is a simple average of the foil efficiencies (this is approximate; see Equation (1)). Then the follower efficiency is estimated at η = 41 % . With a leader efficiency of 15 % , 85 units of power would go into the leader’s wake as “wasted” power [26], which consequently becomes power available to the follower. However, to achieve 41% efficiency, the follower would have only extracted 26 units of power; a 31% energy extraction efficiency, which is in-line with power generation by oscillating rigid hydrofoils [27,28,29]. Now, this estimate of the energy extraction efficiency can be applied to the current baseline follower foil to provide a back-of-the-envelope projection of a collective efficiency of 56%; a modest gain. We postulate that flexibility can improve the energy extraction efficiency of the follower beyond this rigid foil prediction. Specifically, we hypothesize that the collective efficiency of two non-uniformly flexible foils operating at their optimal isolated foil conditions can achieve significantly higher efficiency exceeding 56% through properly spaced and synchronized in-line interactions. In-line interactions can significantly improve performance, however, as mentioned above recent studies are showing that a staggered or slightly staggered arrangement of swimmers can enhance performance further when the vortices shed from a leader directly impinge onto a follower [25,30,31]. This leads to our second hypothesis that the collective efficiency can be further improved by adjusting the follower to a slightly-staggered arrangement where a direct vortex impingement is expected.
In previous work examining the performance of two interacting hydrofoils [19,20,21,22,23,25], both foils typically operate at the same amplitude of motion. However, the anal/dorsal and caudal fin interactions of real fish exhibit a larger amplitude of the follower fin relative to the leader fin [3]. For example, in one case the amplitude of the caudal fin of a teleost fish is 19 % larger than its dorsal fin amplitude [2]. Moreover, hydrofoil studies that have detailed the individual performance of the leader and follower note that the follower experiences significant improvements in efficiency while the leader typically only experiences more modest efficiency benefits [19,20]. It can then be postulated that increasing the amplitude of follower relative to the leader can increase the weighting from the high-efficiency of the follower in determining the collective efficiency of the leader-follower pair. In fact, the definition of the collective efficiency can be rearranged as follows,
η C = ζ ζ + 1 leader   weight η L + 1 ζ + 1 follower   weight η F ,
to explicitly show this idea (see Appendix B for details). Here, the power input ratio between the leader and the follower is ζ = P ¯ L / P ¯ F , and the collective, leader, and follower efficiencies are η C , η L , and η F , respectively. This leads to our third hypothesis that the collective efficiency can be further improved by increasing the amplitude of the follower relative to the leader. This will provide a heavier weighting from the high-efficiency follower towards the collective efficiency, however, if the amplitude ratio is too large we would expect the collective efficiency to reduce since there would be little wake energy available for the follower to extract.
In this study, we will use a moderate-efficiency, non-uniformly flexible foil discovered in ongoing research as a baseline pitching foil. Then, we will probe each of our three hypotheses through targeted experiments. Our hypotheses are that (1) the collective efficiency of two non-uniformly flexible foils operating at their optimal isolated foil conditions can achieve significantly higher efficiency exceeding 56% through properly spaced and synchronized in-line interactions, (2) the collective efficiency can be further improved by adjusting the follower to a slightly-staggered arrangement where a direct vortex impingement is expected, and (3) the collective efficiency can be further improved by increasing the amplitude of the follower relative to the leader. In the process of probing our hypotheses, we will chart a path to take a simple pitching hydrofoil system from a low efficiency of η C = 29 % for two fully rigid foils in isolation to a high efficiency of η C = 62 % for non-uniformly flexible pitching hydrofoils with tailored collective interactions.

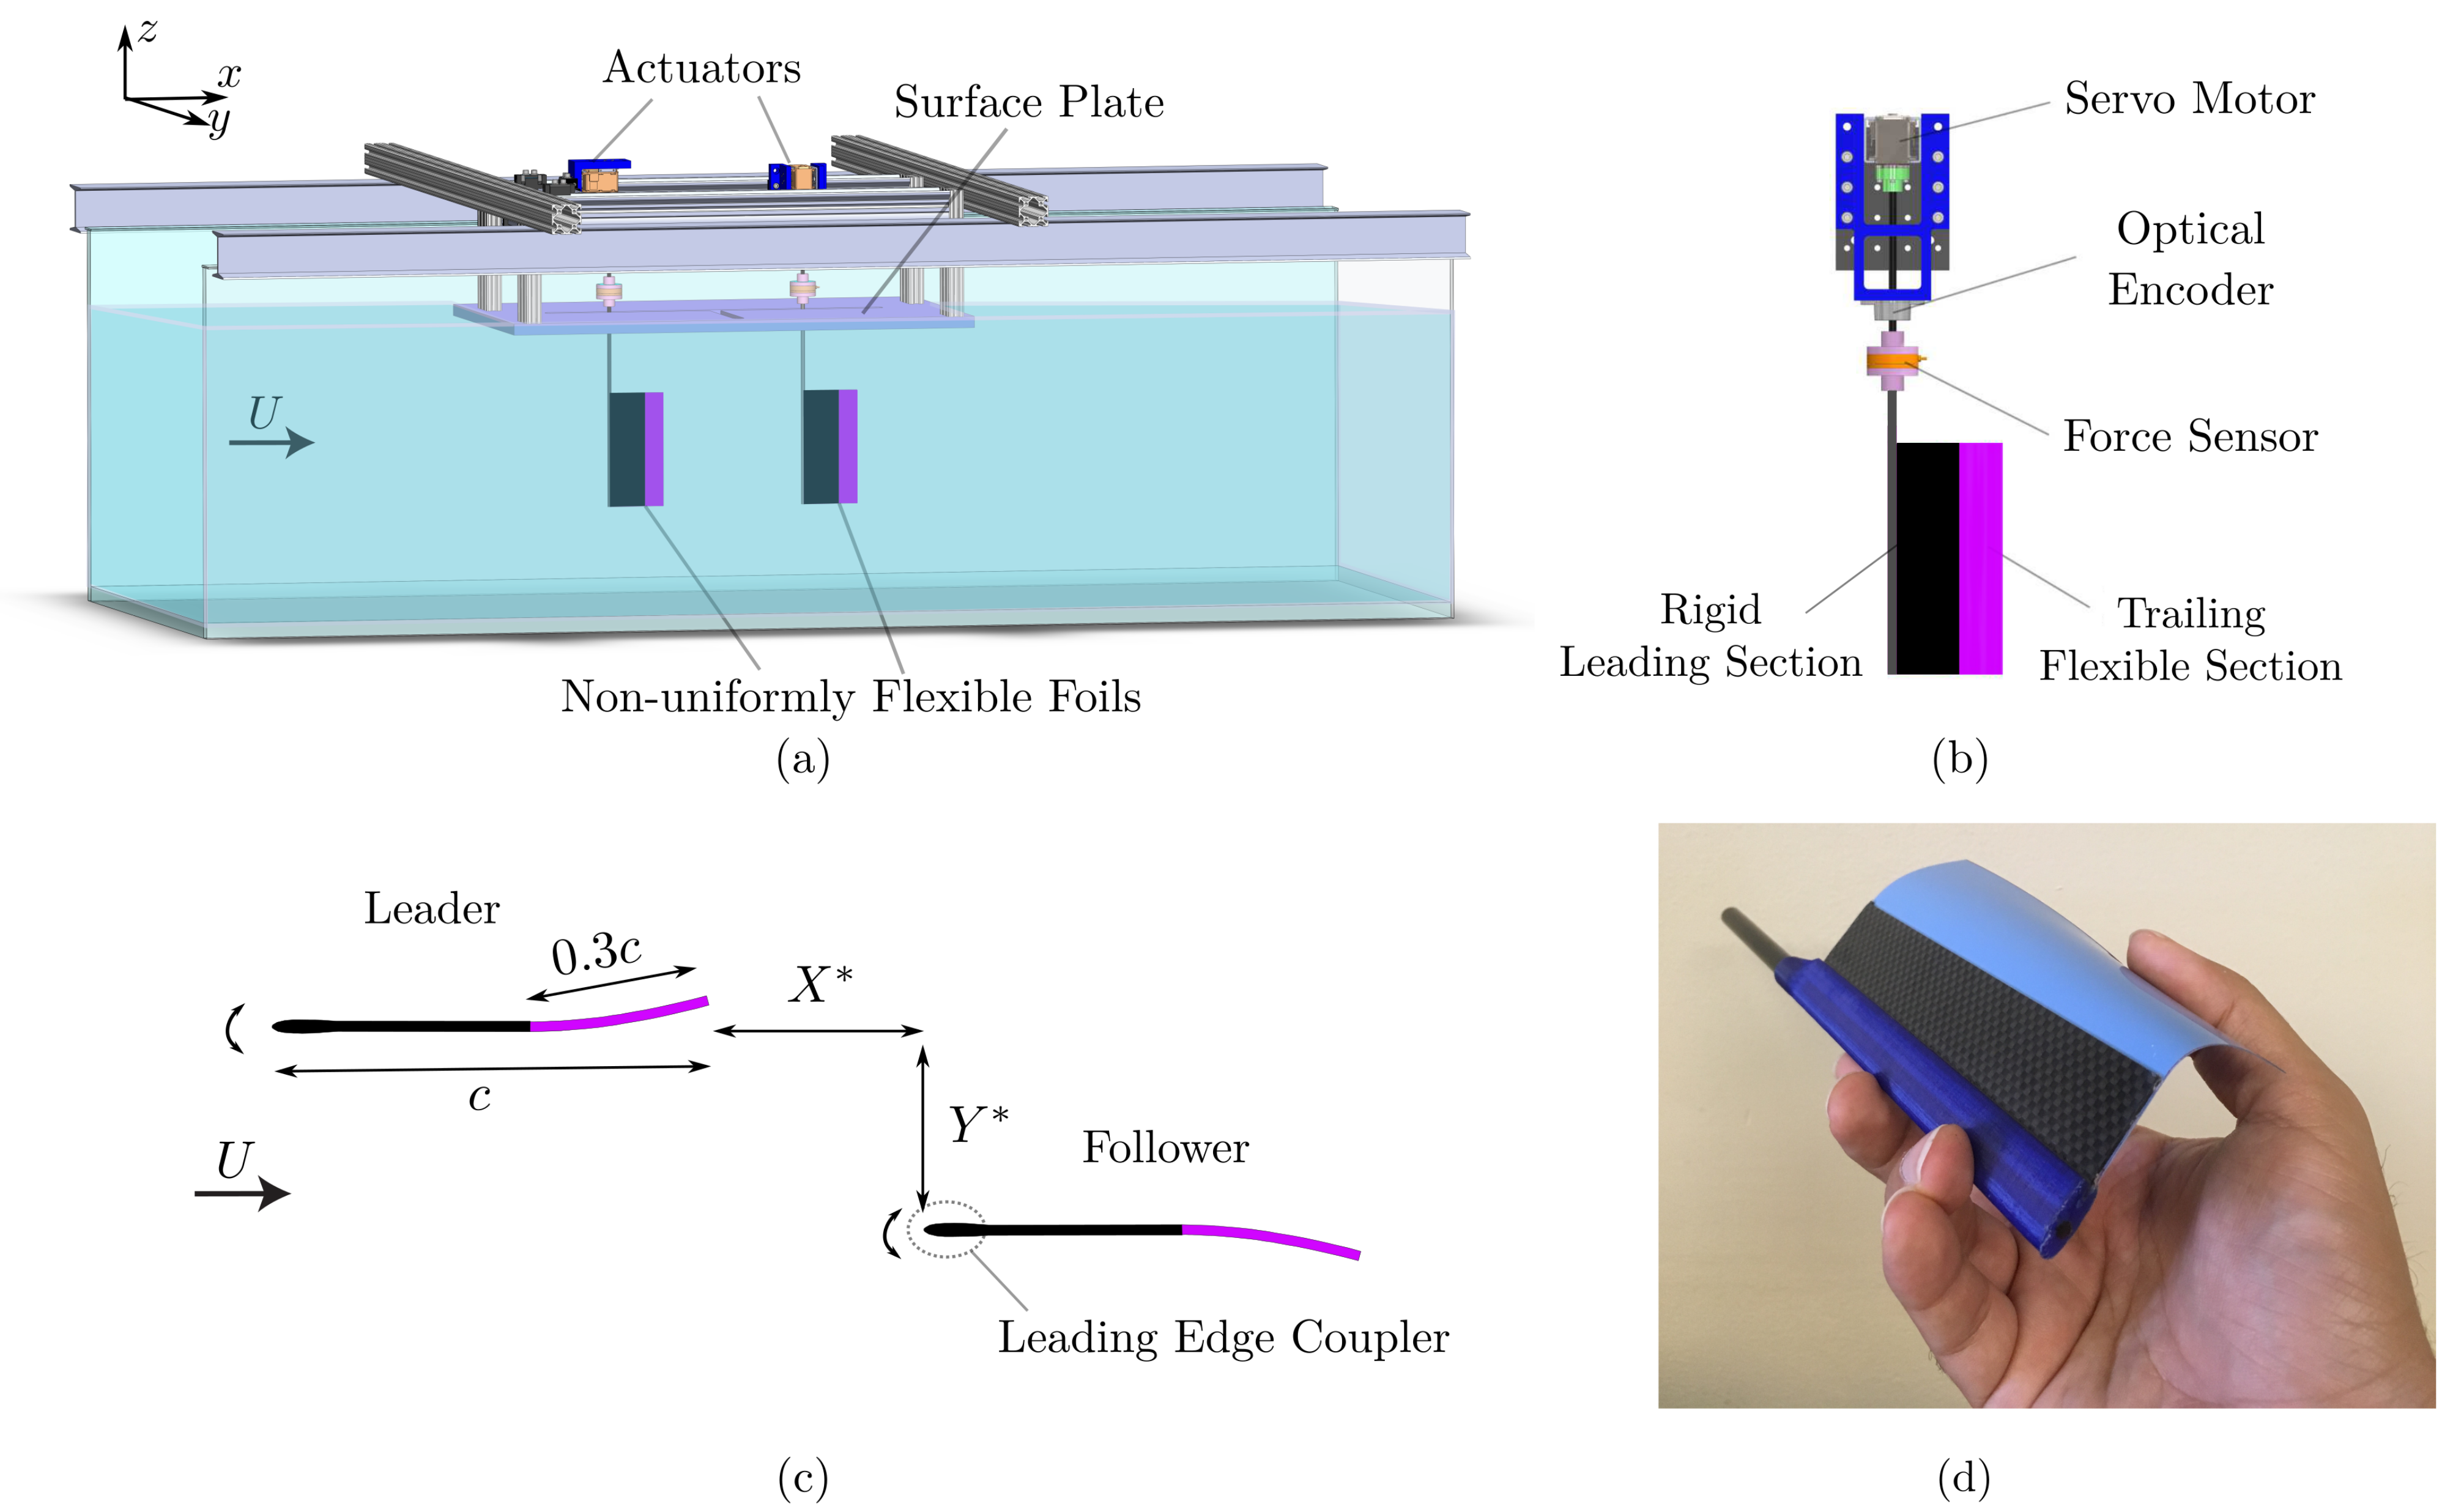
2. Experimental Methods

Force and power measurements were conducted in a recirculating, free-surface water channel, which has a test section length, width, and depth of 4.9 m, 0.93 m, and 0.61 m, respectively (Figure 2). The flow speed was constant throughout the experiments at U = 0.094 m/s, corresponding to a chord based Reynolds number of R e = 9000 . In order to minimize the effect of surface waves on the force measurements, a surface plate was installed in the water channel (Figure 2a), which had a T-shaped slot allowing for both in-line (along the x-axis) and staggered (in the x-y plane, but not along the x-axis) arrangements of the foils.
Two identical A R   =   2 hydrofoils were used in a leader-follower arrangement. They had a rectangular planform shape with a chord length of c = 0.095 m, a span length of s = 0.19 m, and a thickness-to-chord ratio of b / c = 0.058 . The foils were fabricated to have a step change in their flexibility from a rigid leading section to a flexible trailing section (Figure 2b,d) producing a simple non-uniform distribution of flexibility [16,17]. The foils rigid leading sections composed 70 % of the chord length and were constructed of NACA 0012 shaped couplers at the leading edge with carbon fiber sheets embedded into the couplers. The foils flexible trailing sections composed 30 % of the chord length and were fabricated from polyester plastic shim stock adhered to the rigid sections (Figure 2c). The bending stiffness of the flexible trailing section was E I = 2.26 × 10 6 N m 2 . The flexion ratio, λ = 0.7 (ratio of the rigid section length to the total length), and the bending stiffness of the flexible section were chosen to match optimal properties for maximizing the efficiency from unpublished, in-preparation research [18].
Servo motors (Dynamixel MX-64AT) actuated the foils about their leading edge with sinusoidal pitching motions. The leader was prescribed with a pitching motion of θ L ( t ) = θ 0 , L sin ( 2 π f t ) . The follower was pitched similarly, θ F ( t ) = θ 0 , F sin ( 2 π f t + ϕ ) , but with a different phase and amplitude. Here, the pitching frequency is denoted by f, the phase difference or synchrony between the foils is denoted by ϕ , and the pitching amplitude of the leader and follower are denoted by θ 0 , L and θ 0 , F , respectively. In the experiments, the foils were moved to different in-line and staggered arrangements through the manipulation of the foil spacing in the streamwise, x, and cross-stream, y, directions where the dimensionless foil spacings are X * = x / c and Y * = y / c (Figure 2c). Three different cases, referred to as Case I, II, and III, were used to examine the three hypotheses. In all of the cases the synchrony was varied from 0 ϕ 2 π in increments of π / 12 , resulting in 24 synchronies for each foil arrangement. In Case I, the foils were considered in seven different in-line configurations ( Y * = 0 ), as the streamwise spacing was varied from 0.25 X * 1.25 . In this case, the leader and follower were oscillated at the same amplitude where the peak-to-peak nominal amplitude-to-chord ratio ( A 0 * = 2 sin θ 0 ) was held constant at A 0 , L * = A 0 , F * = 0.25 . Note that the nominal dimensionless amplitude is not the measured peak-to-peak trailing edge amplitude of the non-uniformly flexible foil, but the peak-to-peak trailing edge amplitude of an equivalent fully rigid pitching foil. In Case II, the foils were considered in five staggered arrangements where the follower was moved to different cross-stream spacings from 0 Y * 0.4 while at a constant streamwise spacing of X * = 0.5 . Again, the foils were pitched at the same amplitudes of A 0 , L * = A 0 , F * = 0.25 . In Case III, the foils were considered in an in-line arrangement of ( X * , Y * ) = ( 0.5 , 0 ) . In this case, the leader was oscillated at a fixed amplitude of A 0 , L * = 0.25 and the follower’s amplitude was varied over eight amplitudes within the range of 0.25 A 0 , F * 0.37 giving a range of follower-to-leader amplitude ratio, R A * = A 0 , F * / A 0 , L * of 1 R A * 1.48 . A summary of the parameters and variables for each case is given in Table 1.
A six-axis force sensor (ATI Nano43) was used to measure the net thrust, T, and pitching moment, τ , acting on each foil, as an incremental rotary optical encoder (US Digital E5) was tracking the angular position of the foils. A schematic of a single actuator showing the location of these components along the shaft is presented in Figure 2b. The instantaneous total power input was calculated as the product of the pitching moment and the angular velocity as P total = τ θ ˙ , when the foils were in the water channel. Then, the inertial power obtained from the experiments conducted in air were subtracted from the total power to determine the instantaneous power input to the fluid, P = P total P inertial . Each force measurement was conducted for 100 flapping cycles, and repeated five times. The reported data are the mean values computed from these five trials. The coefficient of thrust, C T , and power, C P , and the propulsive efficiency, η , for the isolated foil, or leader or follower foils separately are defined as,
C T = T ¯ 1 2 ρ U 2 c s , C P = P ¯ 1 2 ρ U 3 c s , η = C T C P ,
where ρ is the fluid density.
We focus on the collective performance, that is, the combined performance of the leader and follower foils, as if they are attached to a single fish or device. The collective thrust, power and efficiency are denoted by ( . ) C and defined as,
C T , C = T ¯ L + T ¯ F ρ U 2 c s , C P , C = P ¯ L + P ¯ F ρ U 3 c s , η C = C T , C C P , C .
Note that the collective performance coefficients use the combined planform area of the leader and the follower, 2 c s , which cancels the one-half in the denominator of the performance coefficients. The normalized collective performance metrics compare the collective performance of two interacting foils with that of two foils in isolation (see Appendix C for more details) and are defined as,
C T , C * = C T , C C T , i s o , C P , C * = C P , C C P , i s o , η C * = η C η i s o .

3. Results

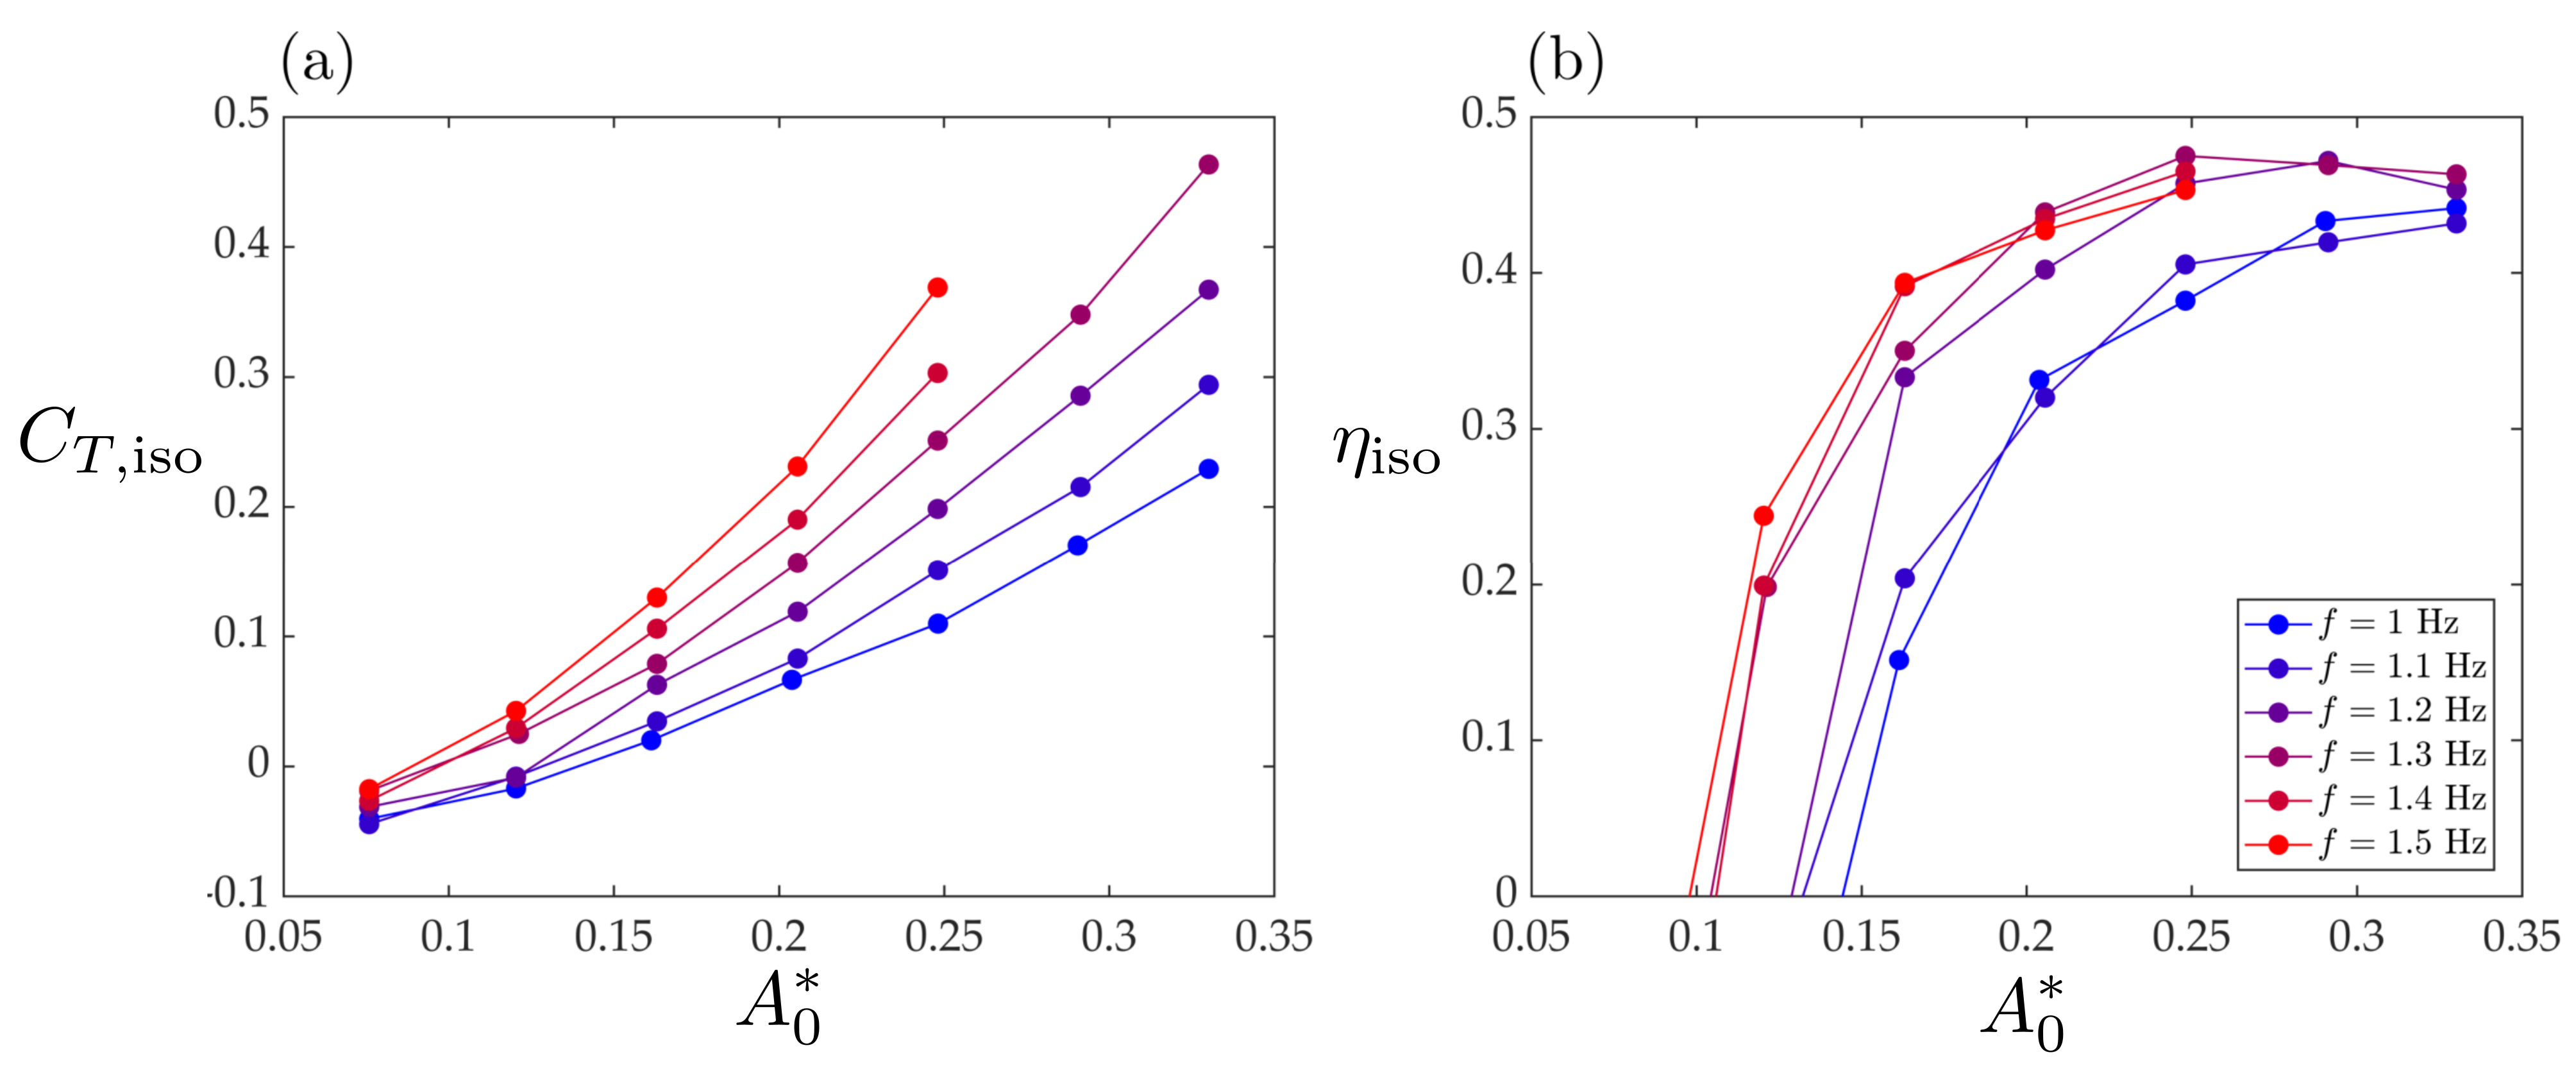
3.1. Isolated Flexible Foil Performance

Amplitude and frequency sweeps are conducted for a single isolated flexible foil to determine the optimal kinematic conditions to maximize the propulsive efficiency. These kinematics are then fixed for Cases I, II, and III, with the exception of the amplitude of the follower foil in Case III. The parameter sweep consists of seven dimensionless amplitudes, A 0 * = 0.076 , 0.12 , 0.16 , 0.2 , 0.25 , 0.29 , 0.33 , and six pitching frequencies varying within the range of 1 f 1.5 with 0.1 Hz increments. To avoid gauge saturation of the force sensors, the amplitude range was limited to A 0 * 0.25 , at f = 1.4 and 1.5 Hz.
Figure 3a shows the variation in the thrust generation as a function of the dimensionless amplitude and frequency. The line color is mapped from blue to red for the lowest to the highest frequencies, respectively, as indicated in the legend in Figure 3b. The isolated foil thrust increases with increasing amplitude and frequency. Figure 3b shows the efficiency as a function of the amplitude and frequency as well. The efficiency of the isolated foil reaches a peak value of η iso = 48 % for the amplitude of A 0 * = 0.25 and for the frequency of f = 1.3 Hz, which corresponds to a Strouhal number based on the nominal amplitude of S t 0 = f A 0 / U = 0.33 , where A 0 = 2 c sin θ 0 . This trend in efficiency has been widely observed in previous studies for rigid foils [36,37,38], as well as flexible foils [13,16]. It should be noted that the efficiency of this isolated flexible foil is substantially better than its fully rigid counterpart, which has an efficiency of η iso rigid = 29 % (see Table 2 and Appendix A). The manuscript detailing the tailoring of the non-uniform flexibility to achieve this improvement is in preparation [18]. Using the optimal kinematics the isolated non-uniformly flexible foil will serve as the baseline case for the rest of this study. We use our hypotheses to explore ways in which the efficiency can be improved from the moderate efficiency ( 40 % η < 60 % ) of the baseline case to high efficiency ( η 60 % ) by exploiting collective or schooling interactions between two flexible foils.

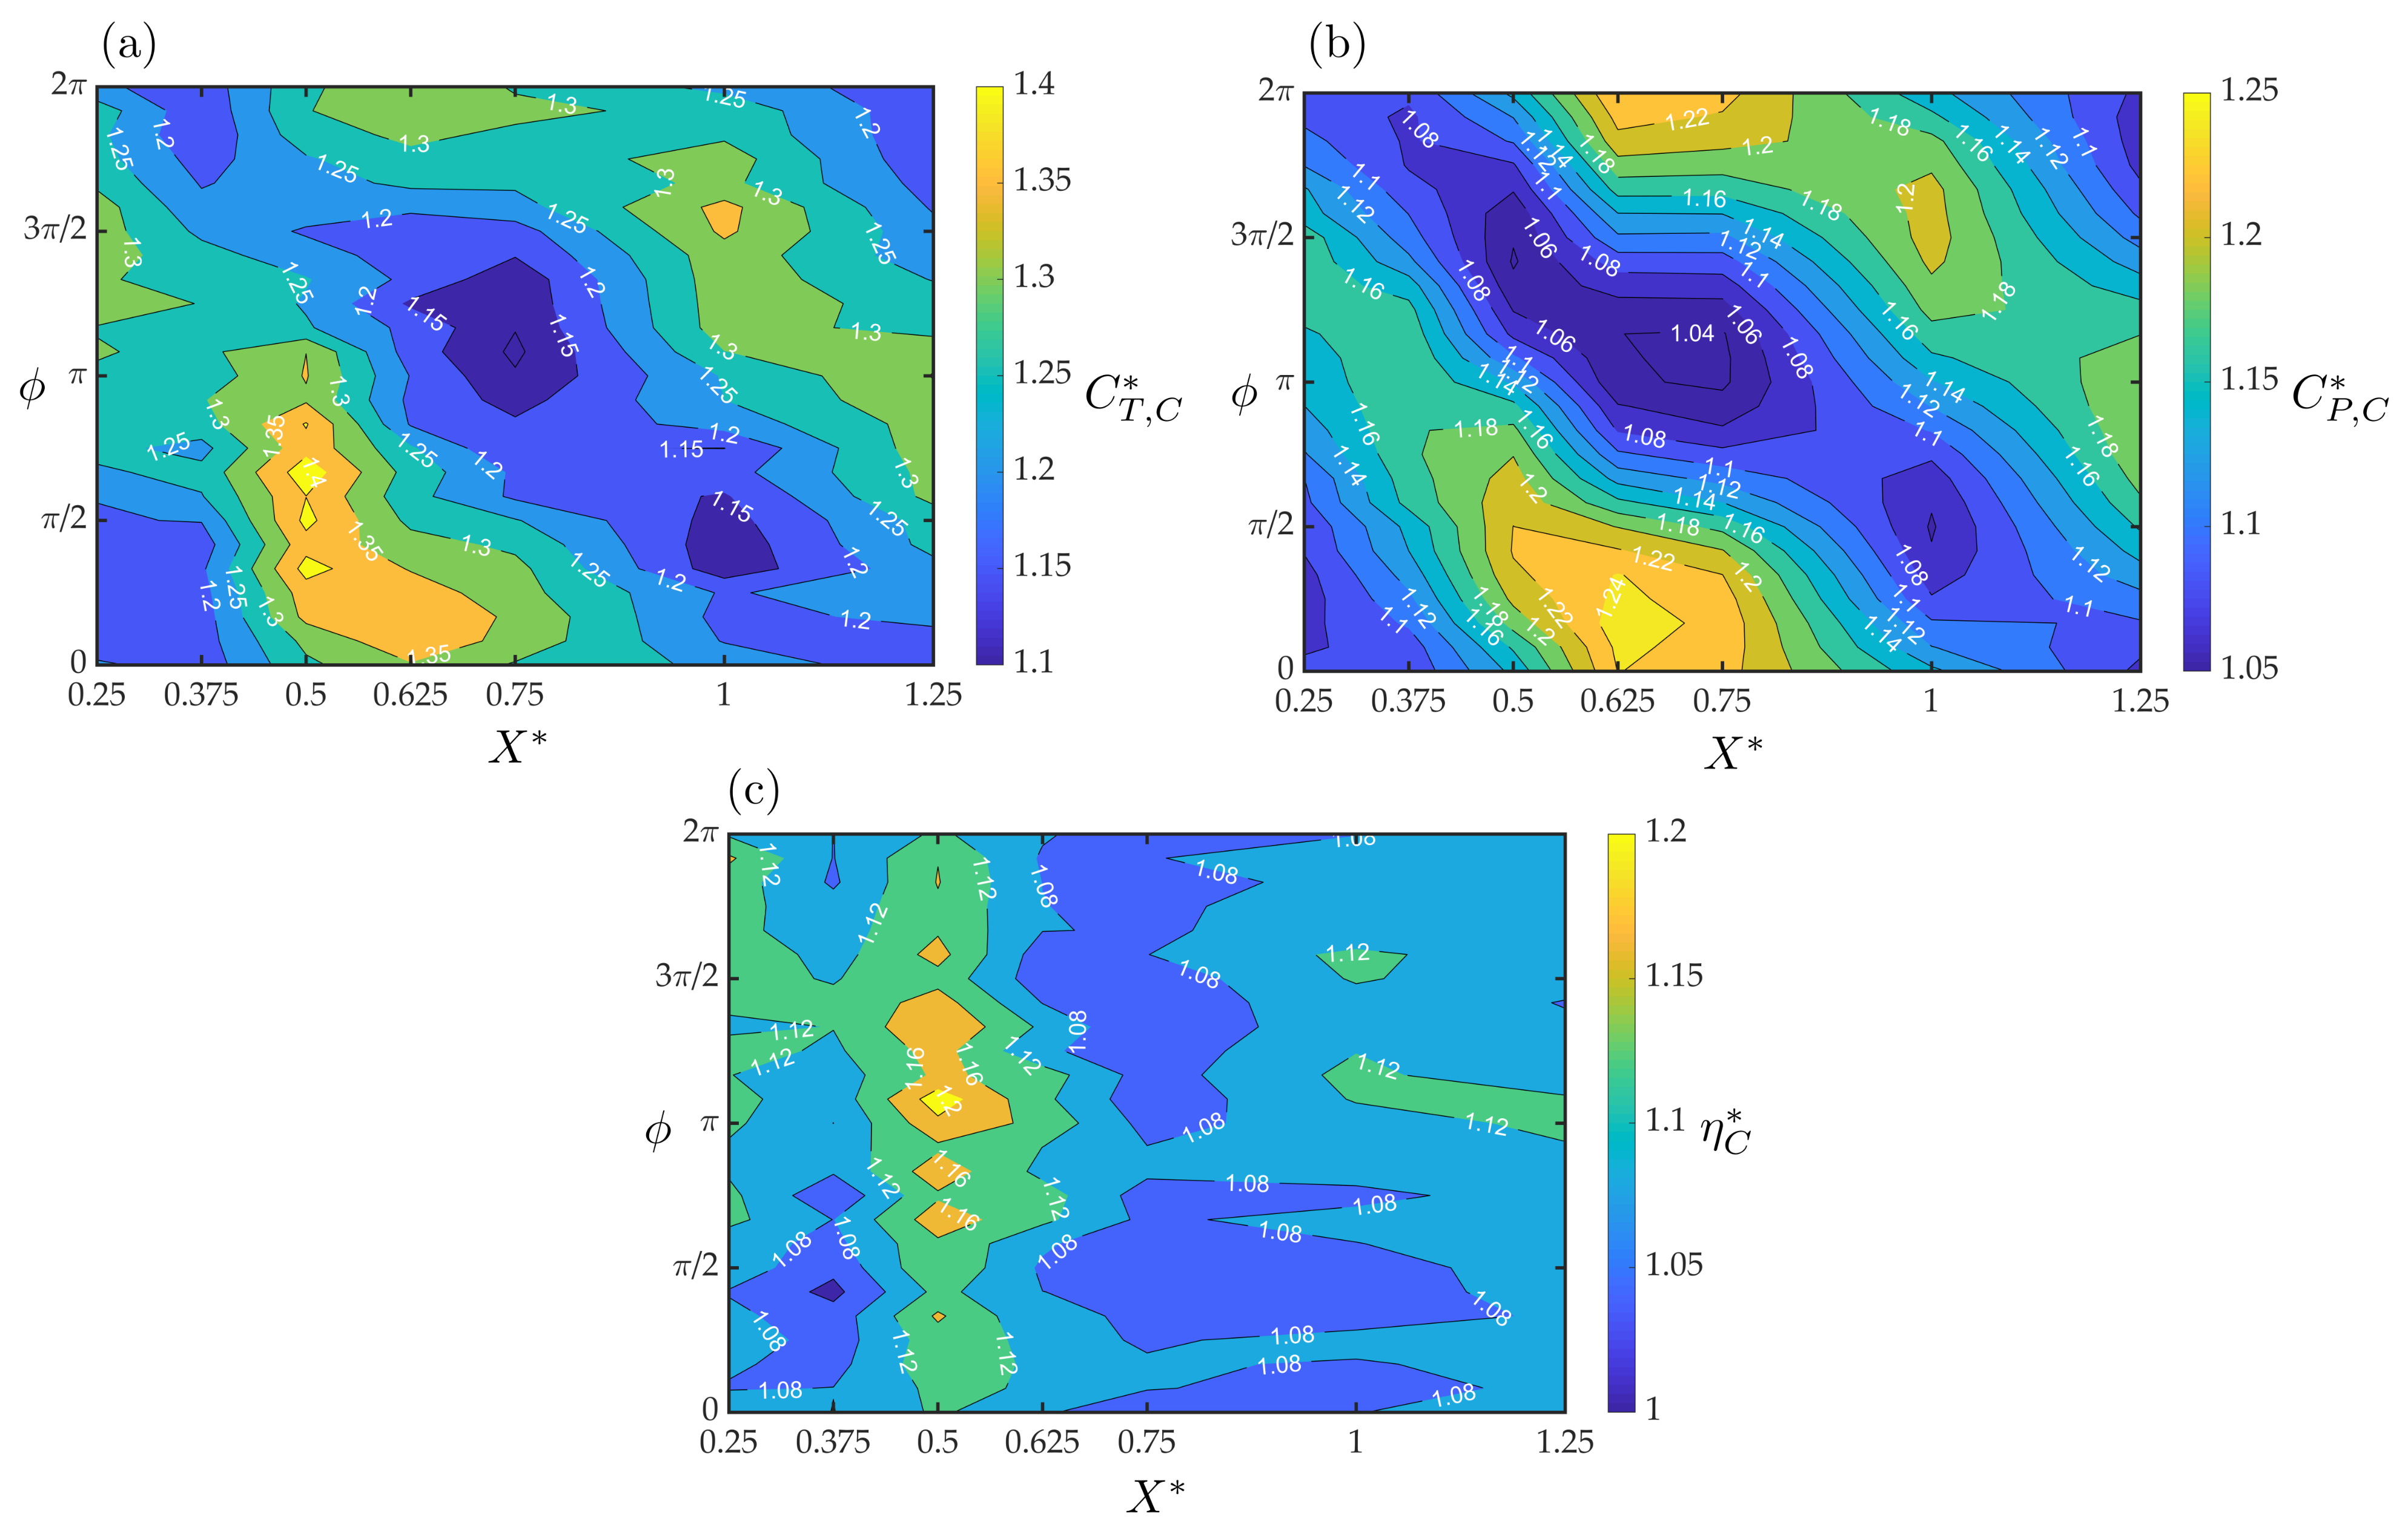
3.2. Case I: Flexible Foils in In-Line Arrangements

Our first hypothesis is that the collective efficiency of two non-uniformly flexible foils operating at their optimal isolated foil conditions can achieve significantly higher efficiency exceeding 56% through properly spaced and synchronized in-line interactions. We examine this hypothesis by considering leader and follower foils in in-line arrangements ( Y * = 0 ) at seven different streamwise spacings of X * = 0.25 , 0.375 , 0.5 , 0.625 , 0.75 , 1, and 1.25 . The synchrony between the foils is also varied as summarized in Table 1.
Figure 4a,b present the normalized collective thrust and power coefficients, respectively, as functions of the streamwise spacing and synchrony. One striking feature of the thrust and power performance are the diagonal band structures that correspond to peaks and troughs in performance. These diagonal bands, observed previously for rigid foils [19,20], indicate that the collective thrust and power are driven by the performance of the follower foil, since diagonal lines of ( X * , ϕ ) relate to conditions where the timing is preserved between the follower’s motion and the impinging vortex wake shed from the leader. In general, the peak band structures in both thrust and power are aligned, revealing that increases in thrust have a concurrent rise in power. In fact, across the entire variable space the collective thrust varies over 1.1 C T , C * 1.43 while the collective power varies over 1.04 C P , C * 1.25 , which indicates that the two interacting foils generate higher thrust and power than that of two foils in isolation. The largest peaks in thrust occur for near-wake interactions at X * = 0.5 , for the synchronies of ϕ = π / 3 , π / 2 and 2 π / 3 , where the collective obtains thrust gains of 41–43% compared to two foils in isolation.
Figure 4c shows the normalized collective efficiency within the same variable space. Surprisingly, the diagonal band structures disappear from the collective efficiency, in contrast to previous rigid foil interactions [20], and vertical bands emerge indicating the importance of the streamwise spacing in maximizing the collective efficiency. The optimal streamwise spacing of X * = 0.5 exhibits a broad range of synchrony of π / 2 < ϕ < 3 π / 2 where efficiency enhancements are substantial, ranging from a 17–22% increase over non-interacting foils. The peak collective efficiency gain of 22 % occurs at ϕ = 13 π / 12 , where there is also a thrust enhancement of 35 % . These improvements correspond to an absolute collective efficiency of η C = 59 % and an absolute collective thrust of C T , C = 0.34 , confirming that properly spaced and synchronized in-line interactions can indeed significantly improve the efficiency performance of two interacting non-uniformly flexible foils. In the subsequent Case II and III, the streamwise spacing will be fixed to its optimal value of X * = 0.5 based on these findings. Further details on the individual performance of the leader and follower can be found in Appendix D.1.

3.3. Case II: Flexible Foils in Staggered Arrangements

Our second hypothesis is that the collective efficiency can be further improved by adjusting the follower to a slightly-staggered arrangement where a direct vortex impingement is expected. To examine this hypothesis the two flexible interacting foils are arranged in slightly-staggered arrangements with X * = 0.5 . To approximate where a direct vortex impingement will potentially occur, images of the leader flexible foil, while interacting with the follower, were acquired using a GoPro camera to measure the actual excursion of the trailing flexible section of the foil. The trailing edge was measured to reach its maximum displacement at Y * = 0.15 , which, without direct flow measurements, is assumed to be the shedding location of the wake vortices. Thus, the foils were moved to five different cross-stream spacings within the range of 0 Y * 0.4 , including Y * = 0.15 where a direct vortex impingement onto the follower is anticipated.
Figure 5a,b show the normalized collective thrust and power, respectively, as functions of the synchrony and cross-stream spacing. The collective thrust generation is maximized when the follower is oscillating in the wake of the leader ( Y * 0.2 ) and the synchrony is 0 ϕ π . In this region, the normalized collective thrust is generally C T , C * 1.25 , however the largest thrust improvements of up to 43 % occur for in-line interactions with a synchrony more closely aligned with ϕ = π / 2 . Outside of this high thrust region, there are still thrust improvements of 15–25% observed over the entire variable space. Similarly, the normalized collective power shows an increased power region that overlaps the increased thrust region with increases of up to 22 % more power than isolated foils. Additionally, over the entire examined variable space their is elevated power required over that for isolated foils.
Still, this increase in collective power is lower than the increase in collective thrust, which leads to collective efficiency improvements of 4–22% compared to isolated foils as shown in Figure 5c. There are indeed local efficiency peaks that occur at the presumed direct impingement location of Y * = 0.15 within the synchrony range of π / 2 ϕ 3 π / 2 that show efficiency improvements of 19–20%. However, these peaks are not the global efficiency peak of 22 % improvement observed for an in-line arrangement at Y * = 0 . We can conclude that our second hypothesis was incorrect, at least for these interacting flexible foils, even though there is an efficiency signature detected at the location where a direct vortex impingement is expected to occur. In light of these findings, Case III will have the follower fixed in an in-line arrangement at ( X * , Y * ) = ( 0.5 , 0 ) . Further details on the individual performance of the leader and follower can be found in Appendix D.2.

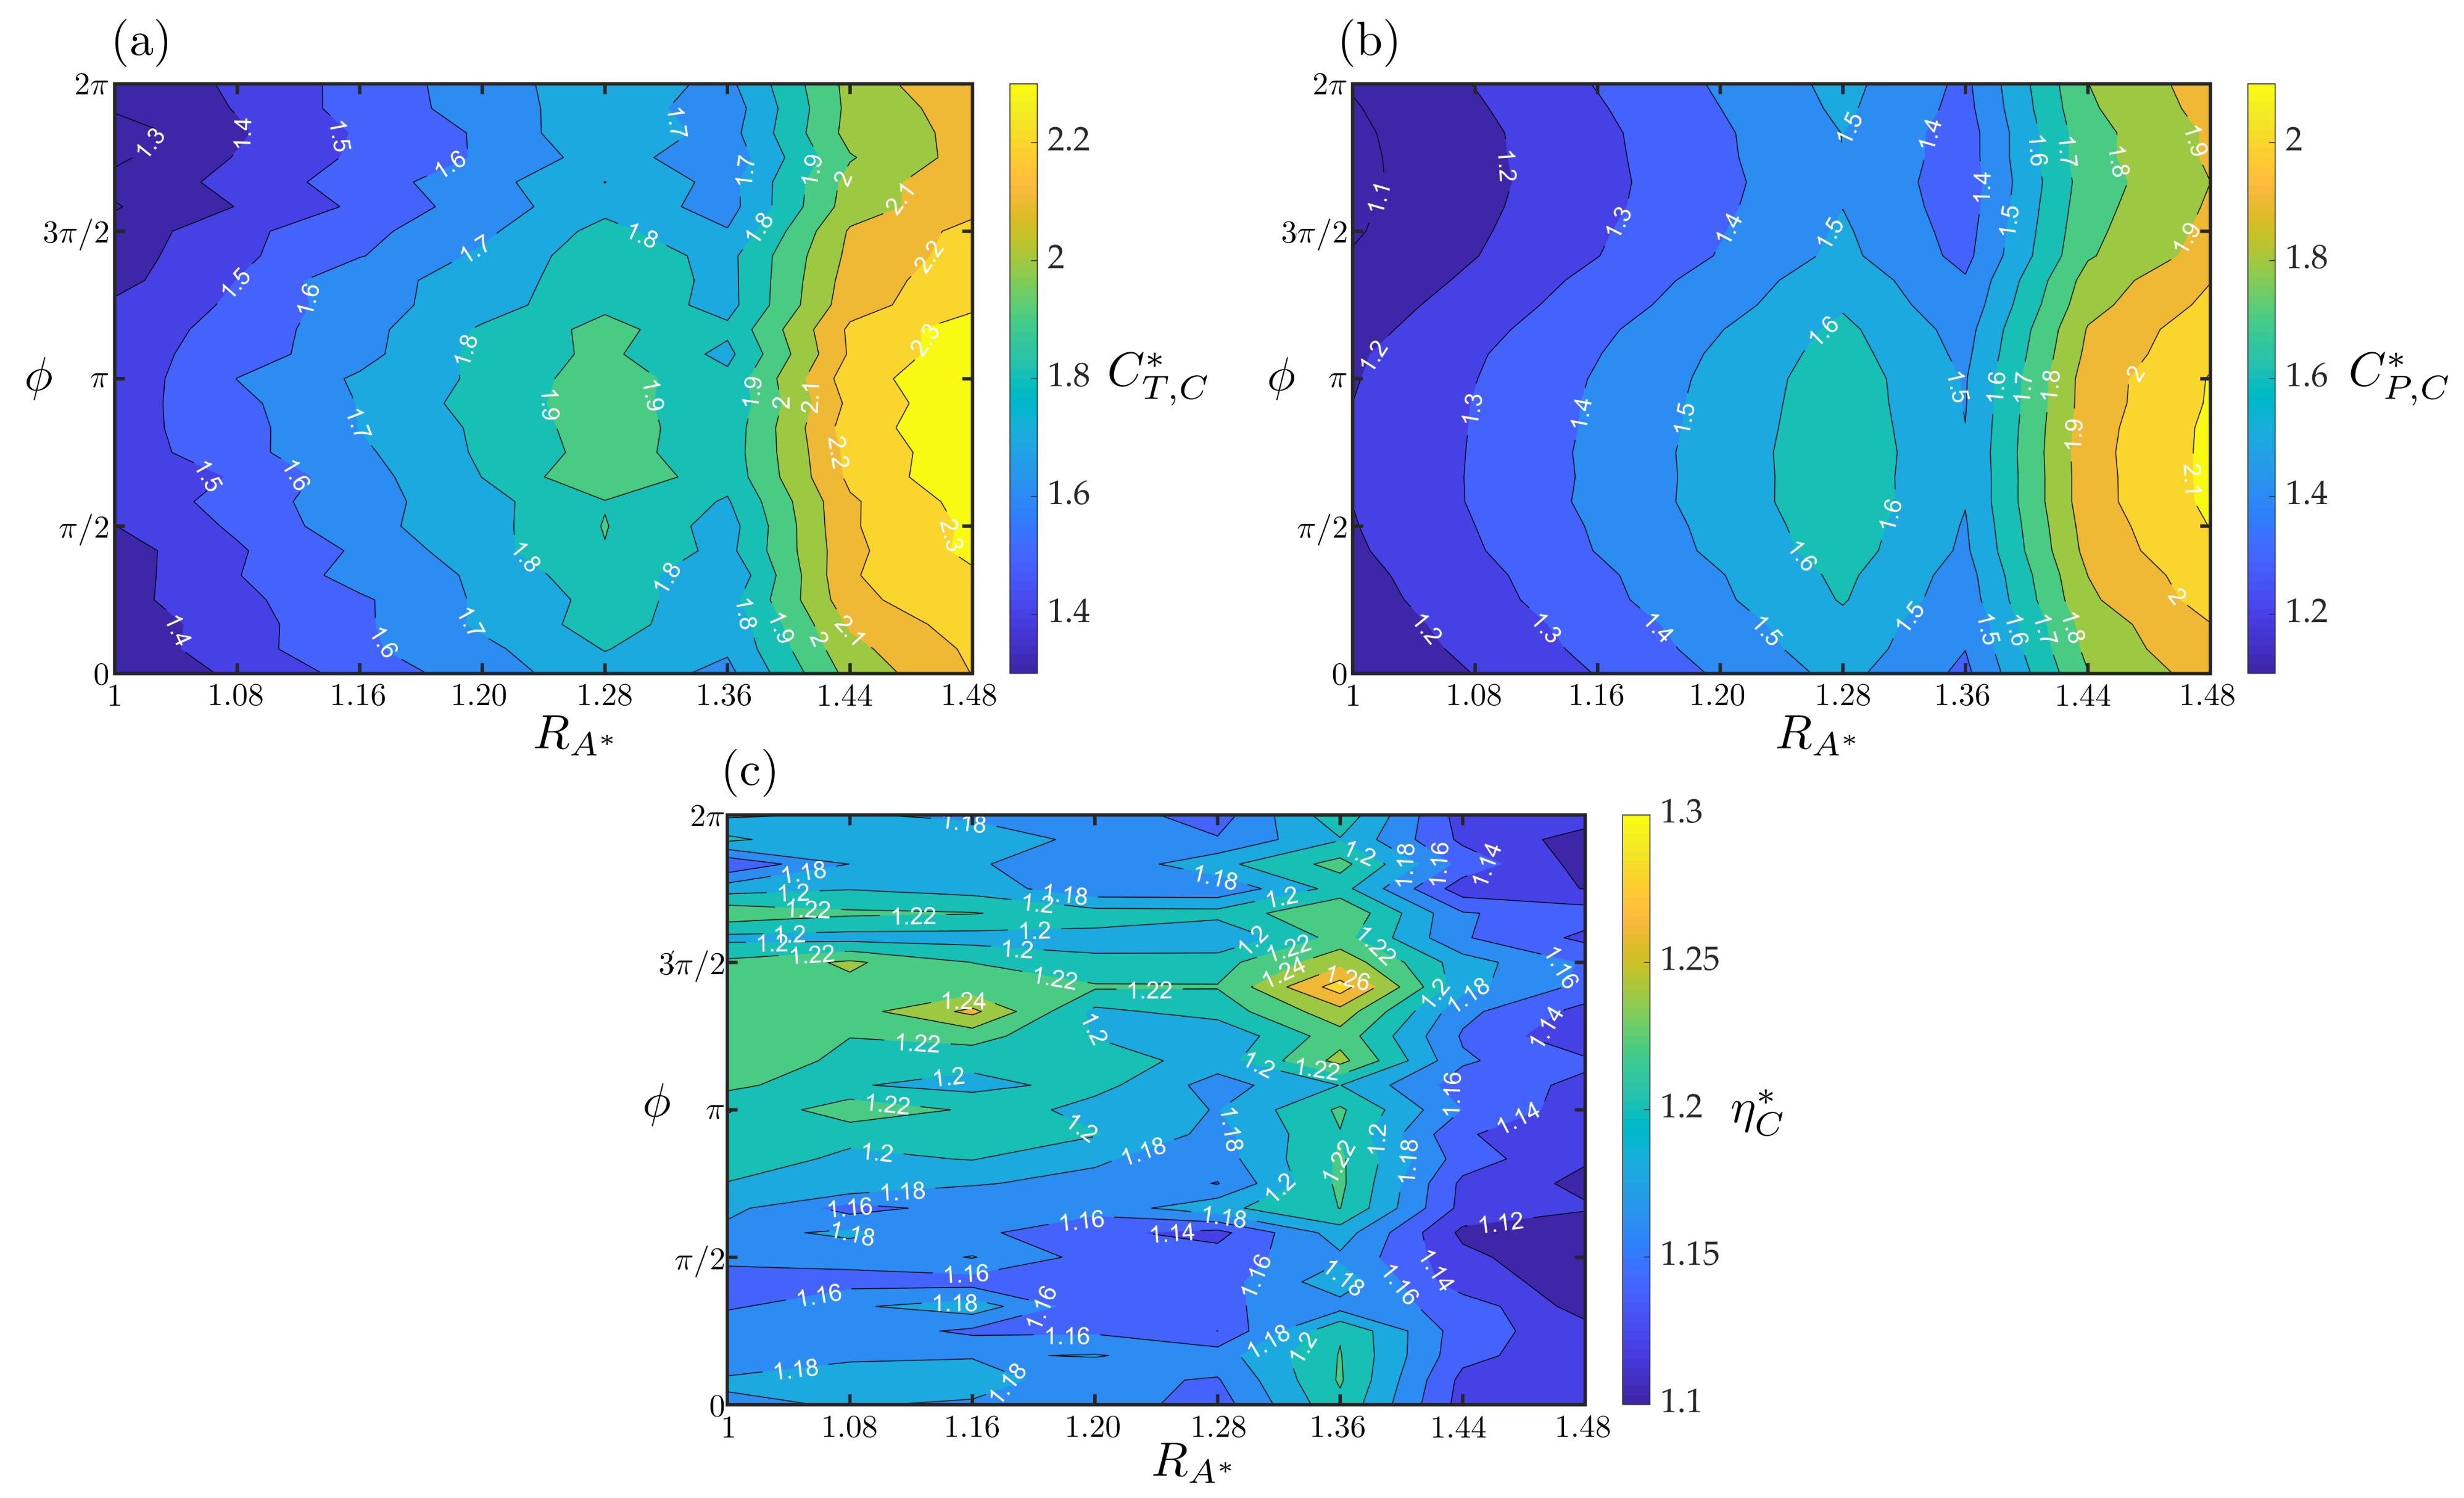
3.4. Case III: Flexible Foils Pitching at Different Amplitudes
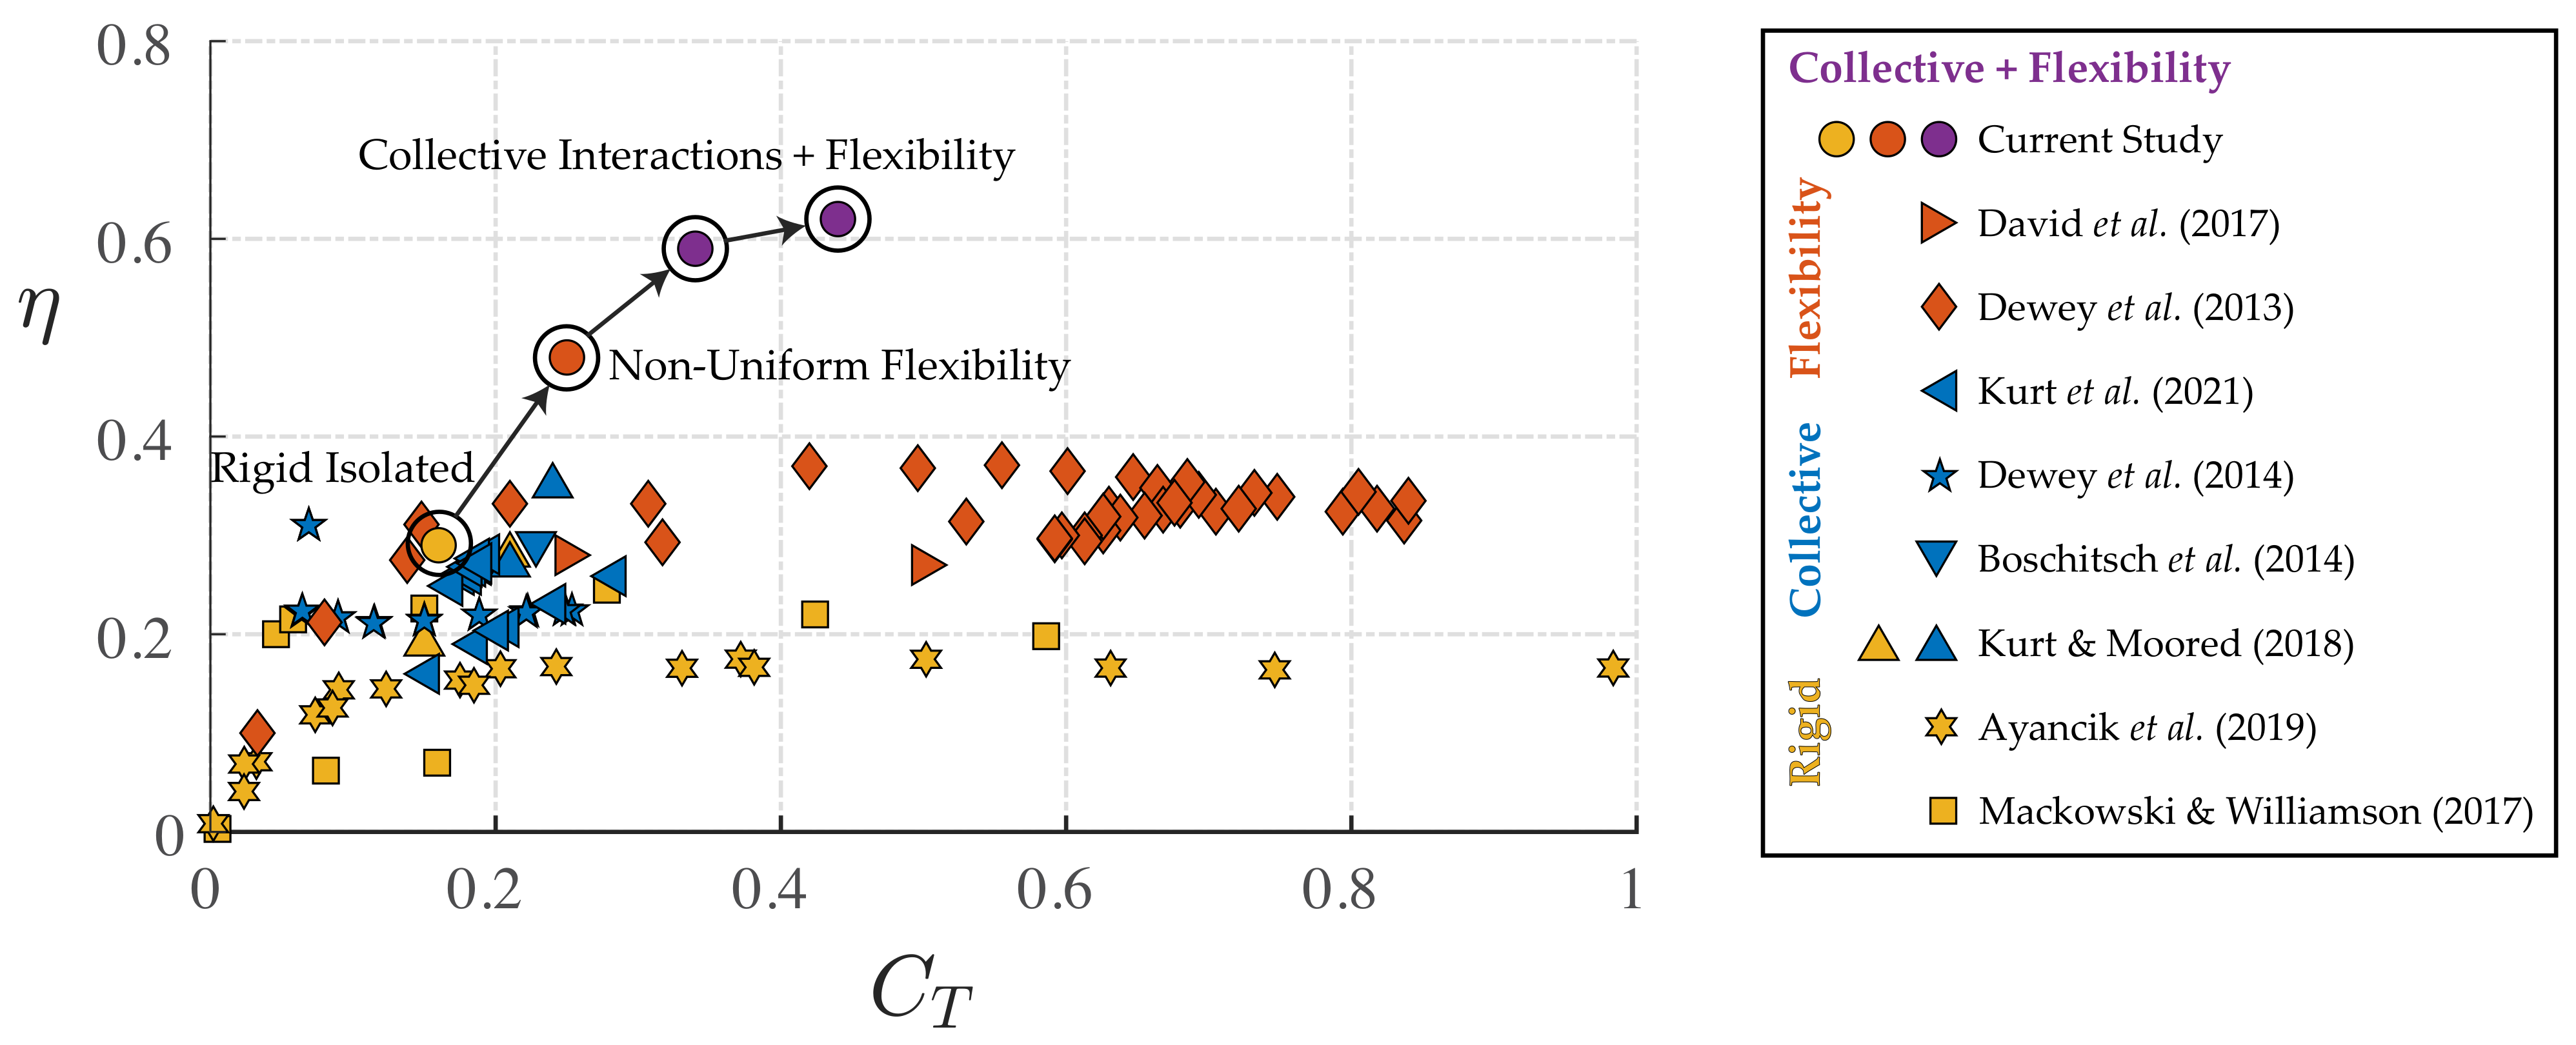
Our third hypothesis is that the collective efficiency can be further improved by increasing the amplitude of the follower relative to the leader. The foils are fixed in an in-line arrangement at X * = 0.5 and Y * = 0 , where the previous cases have shown a peak collective efficiency. Instead of varying the spatial arrangement of the foils, the follower’s amplitude and synchrony are varied, while the leader’s amplitude was held constant at A 0 , L * = 0.25 . Eight different follower-to-leader amplitude ratios are prescribed in the range of 1 R A * 1.48 with synchronies in the range of 0 ϕ 2 π as summarized in Table 1.
Figure 6 presents the normalized collective thrust, power and efficiency as functions of the amplitude ratio and synchrony. Here, the normalized performance metrics compare the combined performance of the leader and follower pitching with different amplitudes to the performance of two isolated foils pitching with the same amplitude of A 0 * = 0.25 . For a foil pitching in isolation it is expected that the thrust (Figure 3a) and power increase monotonically with increasing amplitude [39,40]. Surprisingly, both the thrust and power exhibit a non-monotonic trend where they decrease at R A * = 1.36 relative to surrounding ratios of R A * = 1.28 and R A * = 1.44 . Despite this local minimum in the thrust and power, the collective still generates 63–84% higher thrust and requires 34–50% more power than two foils in isolation.
The amplitude ratio of R A * = 1.36 also gives rise to a ridge of high efficiency improvements. Along the ridge, at a synchrony of ϕ = 17 π / 12 a peak efficiency increase of 29 % over that of two foils in isolation is achieved. Concurrently, the thrust is also substantially increased by 77 % over two foils in isolation. Further details on the individual performance of the leader and follower can be found in Appendix D.3. This data shows that indeed increasing the amplitude of the follower relative to the leader can substantially improve the efficiency of the collective. In fact, the absolute efficiency and thrust of the collective operating at this optimal condition are η C = 62 % and C T , C = 0.44 , showing that simple three-dimensional pitching foil systems can achieve high-efficiency and high-thrust conditions with the proper tailoring of the material properties and collective interactions.

4. Discussion

We present new hypothesis-driven experiments that demonstrate a pathway to improve the performance from a low-efficiency and low-thrust system to a high-efficiency and high-thrust system with η C = 62 % and C T , C = 0.44 . Achieving this high-efficiency is surprising for a simple pitching foil system since these systems typically never exceed 40% efficiency (Figure 1). This level of efficiency is even comparable to standard fixed-pitch propellers such as the Wageningen B-series, which range in peak efficiencies from 60–85% [41].
Although there is a substantial improvement in the performance, it is by no means the globally optimal solution for this system, even within the design variables examined. For instance, the dimensionless parameters/variables that are relevant to this study are the aspect ratio, A R , dimensionless flexibility, Π k , flexion ratio, λ , Strouhal number, S t , dimensionless nominal amplitude, A 0 * , dimensionless spacing, X * and Y * , and synchrony, ϕ . The aspect ratio, dimensionless flexibility, and flexion ratio, were all parameters for this study, which were determined from ongoing research on isolated foils. However, increasing the aspect ratio is likely to improve the efficiency and thrust performance up to A R = 3 , where for pitching foils there are diminishing returns for higher aspect ratios [42]. It is likely that the dimensionless flexibility and flexion ratio could be further tuned to improve the performance since the foil-foil interactions were not accounted for in determining the optimal material properties of the foils. Moreover, tuning the Strouhal number and leader amplitude could further improve performance for the dual foil system. Beyond the variables/parameters examined in this study, the planform shape [40,42], foil cross-sectional shape [43,44], more complex flexibility distributions [45,46,47], and even adding additional in-line foils could be considered as pathways to further improving the performance.
It is fascinating that the pathway to developing a high-efficiency system is one that essentially reproduces the features of multi-finned fish [2,48]. Non-uniformly flexible foils, dual interacting foils in an in-line arrangement, and a larger amplitude of the follower relative to the leader foil were all found to improve the efficiency and thrust performance of the pair of foils. Along these lines, some fish have essentially two dorsal fins or numerous finlets interacting with a caudal fin [48,49], which provides some bio-inspiration for examining a triad or more of interacting foils. One other interesting note is that the foil system examined in the current study is composed of two purely pitching mechanisms, which are quite simple mechanical systems. Developing a high efficiency system based on these simple mechanisms opens a door to practical engineering solutions [50].

Author Contributions

The authors contributed to this work in the following ways: Conceptualization, K.M. and M.K.; methodology and data gathering, M.K. and A.M.; writing—original draft preparation, M.K.; writing—review and editing, K.M., M.K. and A.M.; supervision and funding acquisition, K.M. All authors have read and agreed to the published version of the manuscript.

Funding

This work was supported by the National Science Foundation under Program Director Ronald Joslin in Fluid Dynamics within CBET on NSF CAREER award number 1653181. This work was also supported by the Office of Naval Research under Program Director Robert Brizzolara on MURI grant number N00014-08-1-0642.

Institutional Review Board Statement

Not applicable.

Informed Consent Statement

Not applicable.

Data Availability Statement

Not applicable.

Conflicts of Interest

The authors declare no conflict of interest.

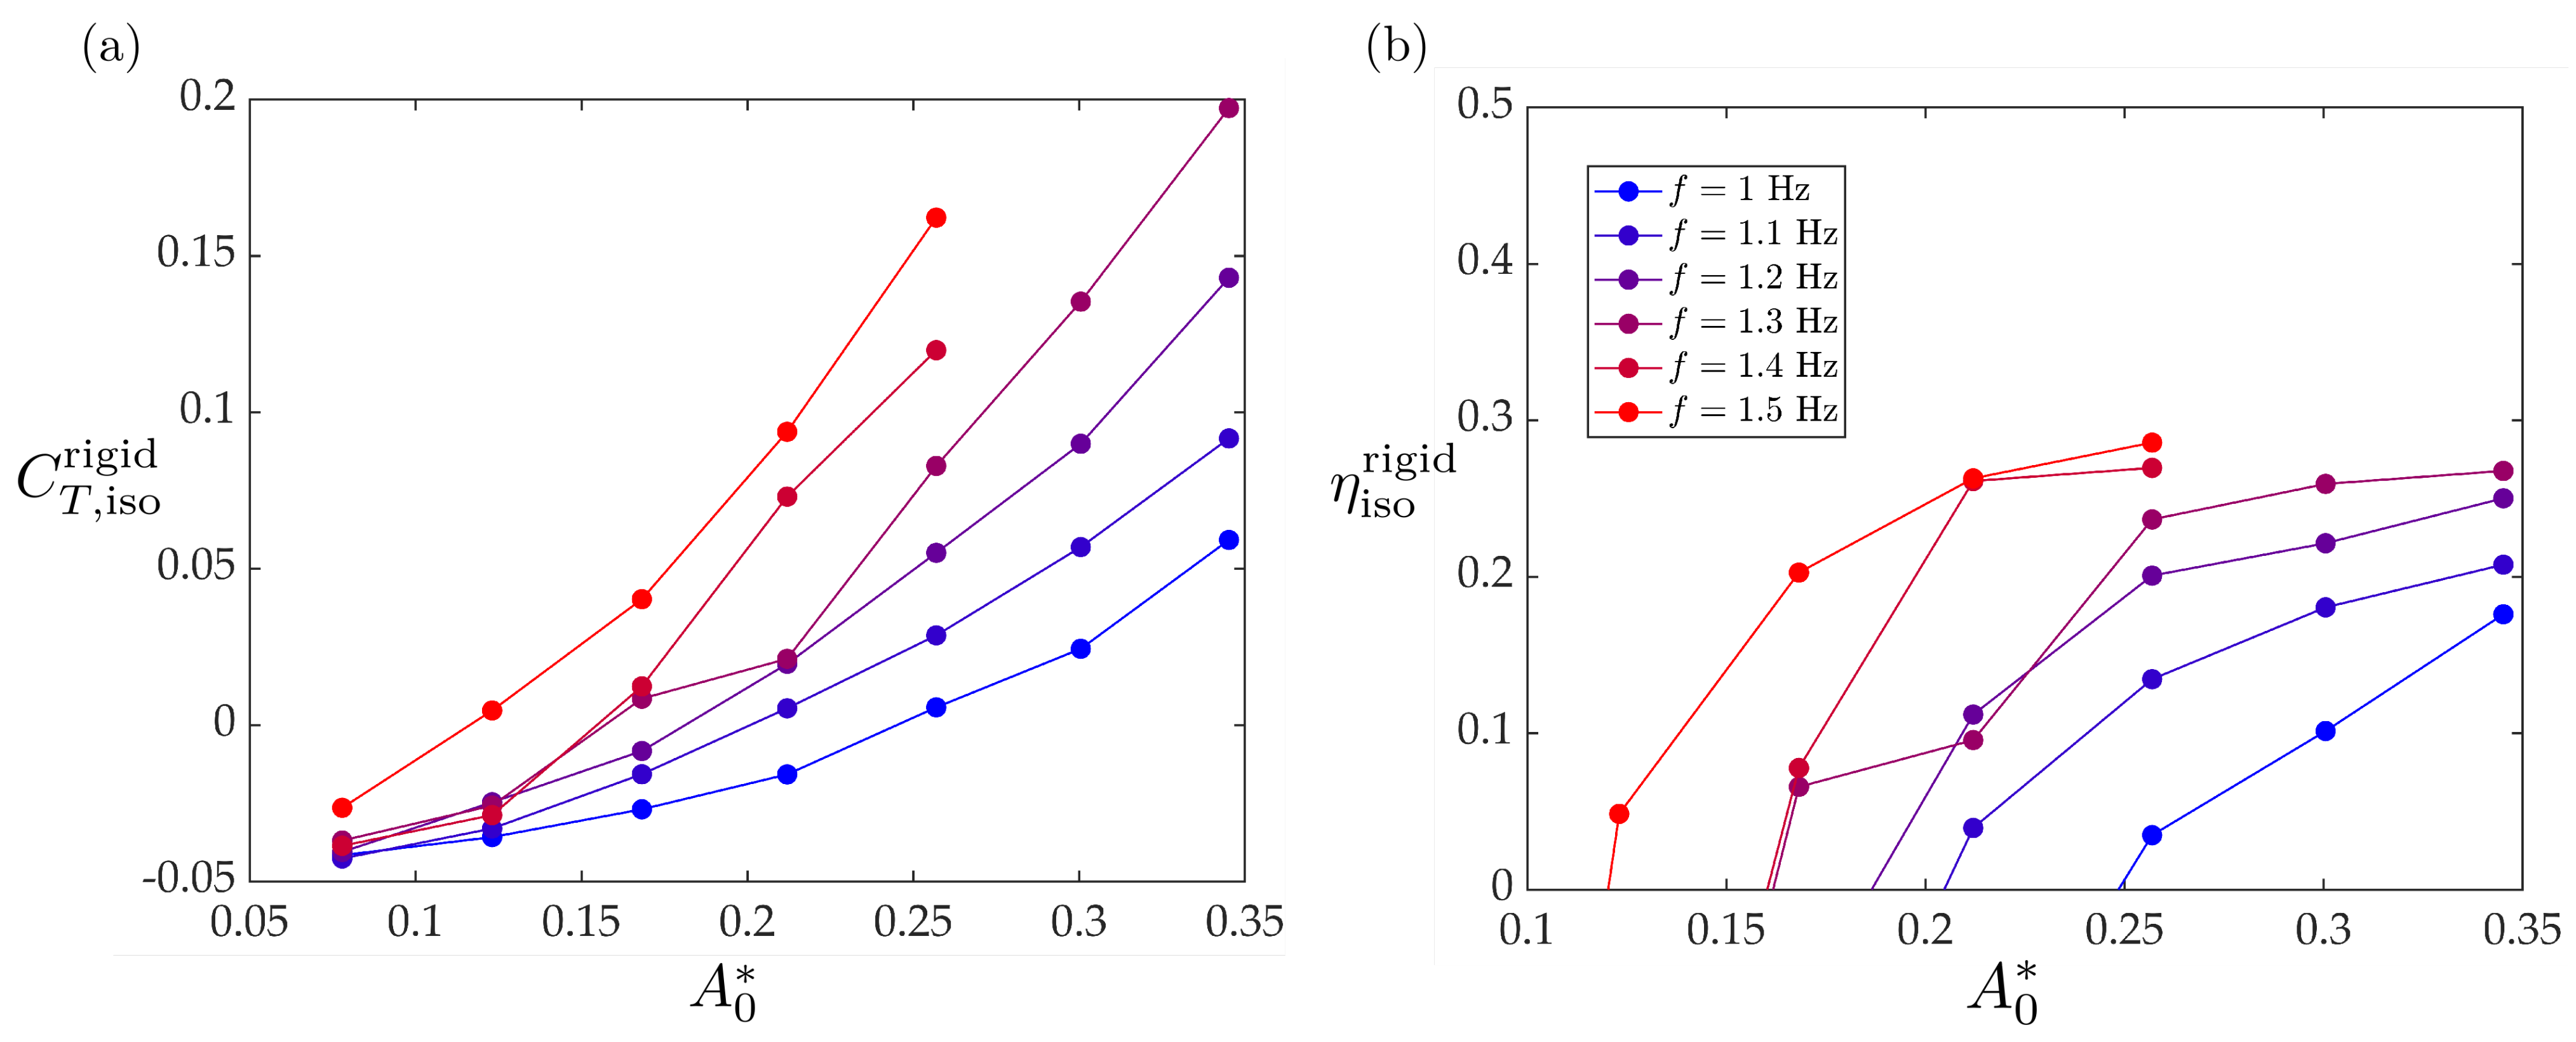
Appendix A. Fully Rigid Foil Isolated Thrust and Efficiency

The thrust and efficiency for a fully rigid foil in isolation are presented in Figure A1 as a function of the dimensionless nominal amplitude and frequency. The thrust increases monotonically with increases in both the amplitude and the frequency. The efficiency is seen to reach a peak of η iso rigid = 29 % when A 0 * = 0.25 and f = 1.5 Hz. At peak efficiency the thrust is C T , iso rigid = 0.16 .
Figure A1. Isolated rigid foil (a) thrust coefficient and (b) efficiency as a function of dimensionless amplitude. The colors from blue to red are mapped from the lowest to highest frequencies as indicated in the legend.
Fluids 06 00233 g0a1

Appendix B. Weighted Average

Rewriting Equations (3), the collective efficiency is defined as,
η C = T ¯ L + T ¯ F U P ¯ L + P ¯ F .
Consequently, this can be algebraically manipulated in the following manner,
η C = T ¯ L U P ¯ L + P ¯ F + T ¯ F U P ¯ L + P ¯ F = P ¯ L P ¯ L + P ¯ F T ¯ L U P ¯ L + P ¯ F P ¯ L + P ¯ F T ¯ F U P ¯ F ,
and,
η C = P ¯ L P ¯ L + P ¯ F η L + P ¯ F P ¯ L + P ¯ F η F = P ¯ L / P ¯ F P ¯ L / P ¯ F + 1 η L + 1 P ¯ L / P ¯ F + 1 η F .
The leader-to-follower power ratio can be defined as ζ = P ¯ L / P ¯ F and the collective efficiency can be written compactly as,
η C = ζ ζ + 1 leader   weight η L + 1 ζ + 1 follower   weight η F ,
This represents a weighted average of the leader and follower efficiencies. If the power of the leader and follower are equal then ζ = 1 and the leader and follower have equal weights: ζ / ζ + 1 = 1 / ζ + 1 = 1 / 2 . As the leader power goes to zero, say from reducing the amplitude of motion of the leader to zero, then ζ 0 , ζ / ζ + 1 = 0 , and 1 / ζ + 1 = 1 , making the collective efficiency equal to the follower efficiency.

Appendix C. Normalized Collective Performance Metrics

The normalized collective thrust is defined as
C T , C * = C T , C C T , i s o ,
where the absolute thrust of the isolated foil and collective are,
C T , i s o = T ¯ i s o 1 2 ρ U 2 c s , C T , C = T ¯ L + T ¯ F ρ U 2 c s .
When Equation (A6) is substituted in Equation (A5) the normalized collective thrust can be rewritten as,
C T , C * = C T , C C T , i s o = T ¯ L + T ¯ F ρ U 2 c s T ¯ i s o 1 2 ρ U 2 c s = T ¯ L + T ¯ F 2 T i s o .
Thus, the normalized collective thrust is revealed as the ratio of the combined thrust generation of the leader and follower foils to the thrust of two isolated foils.

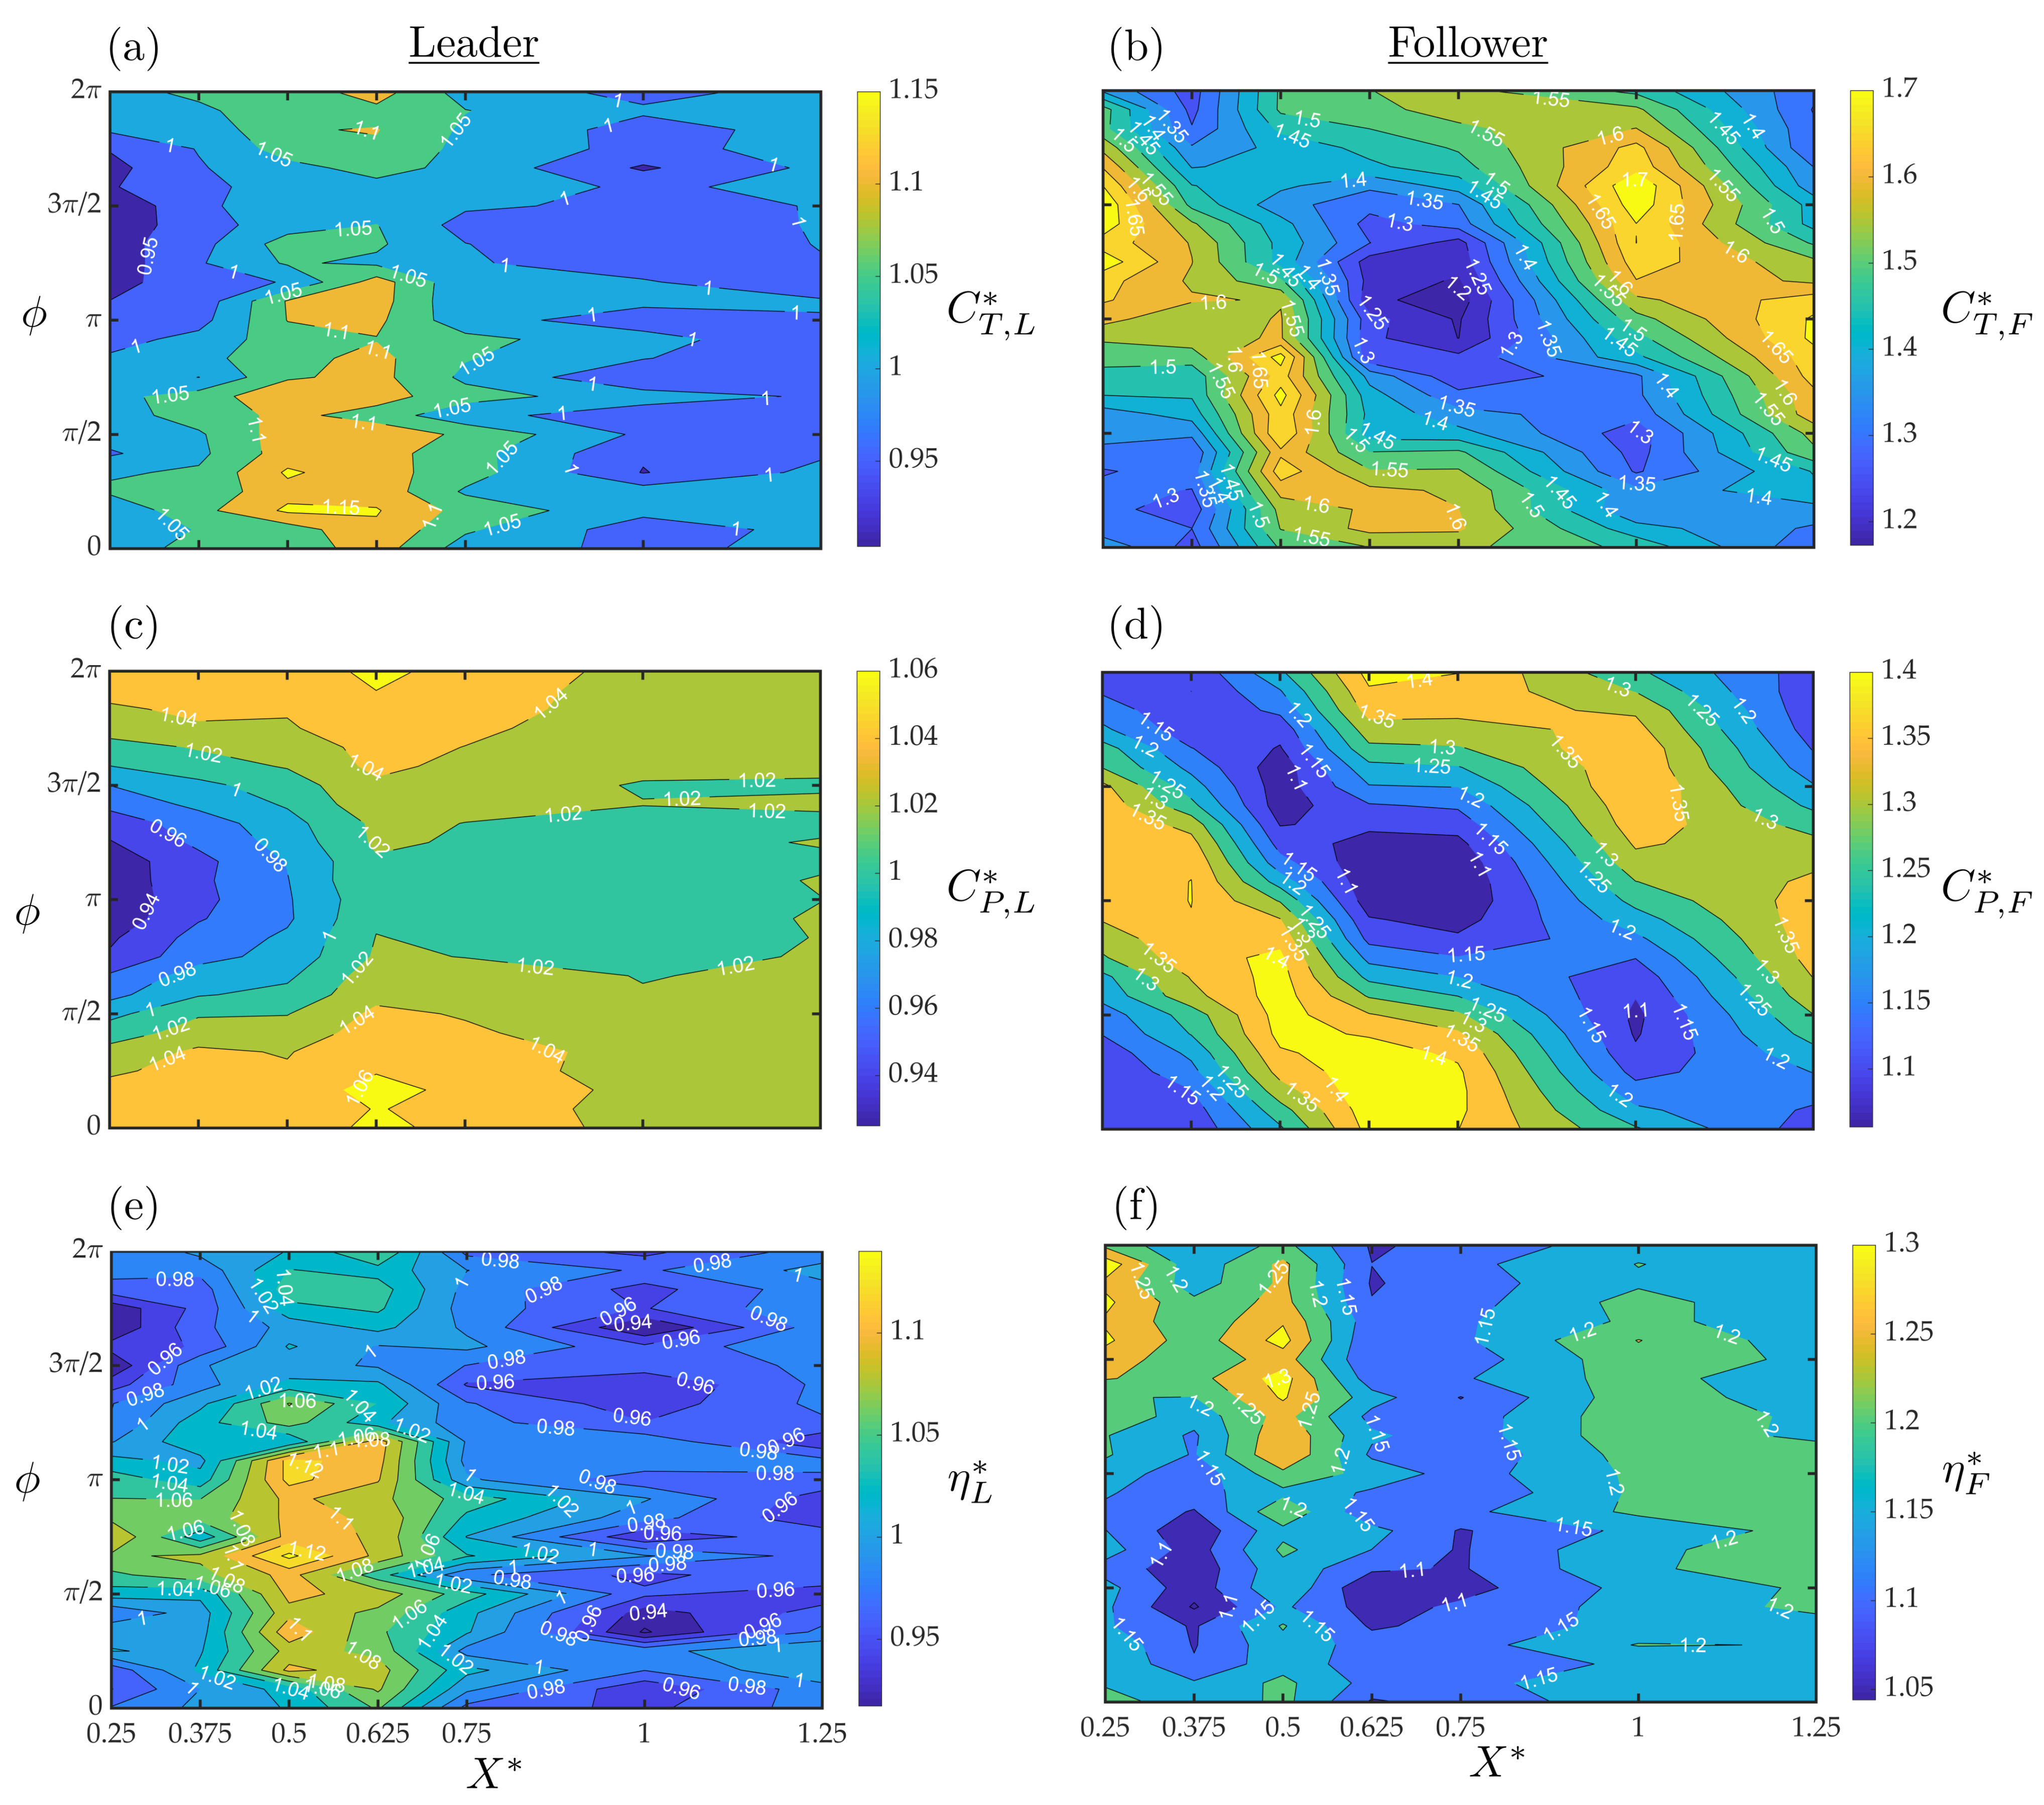
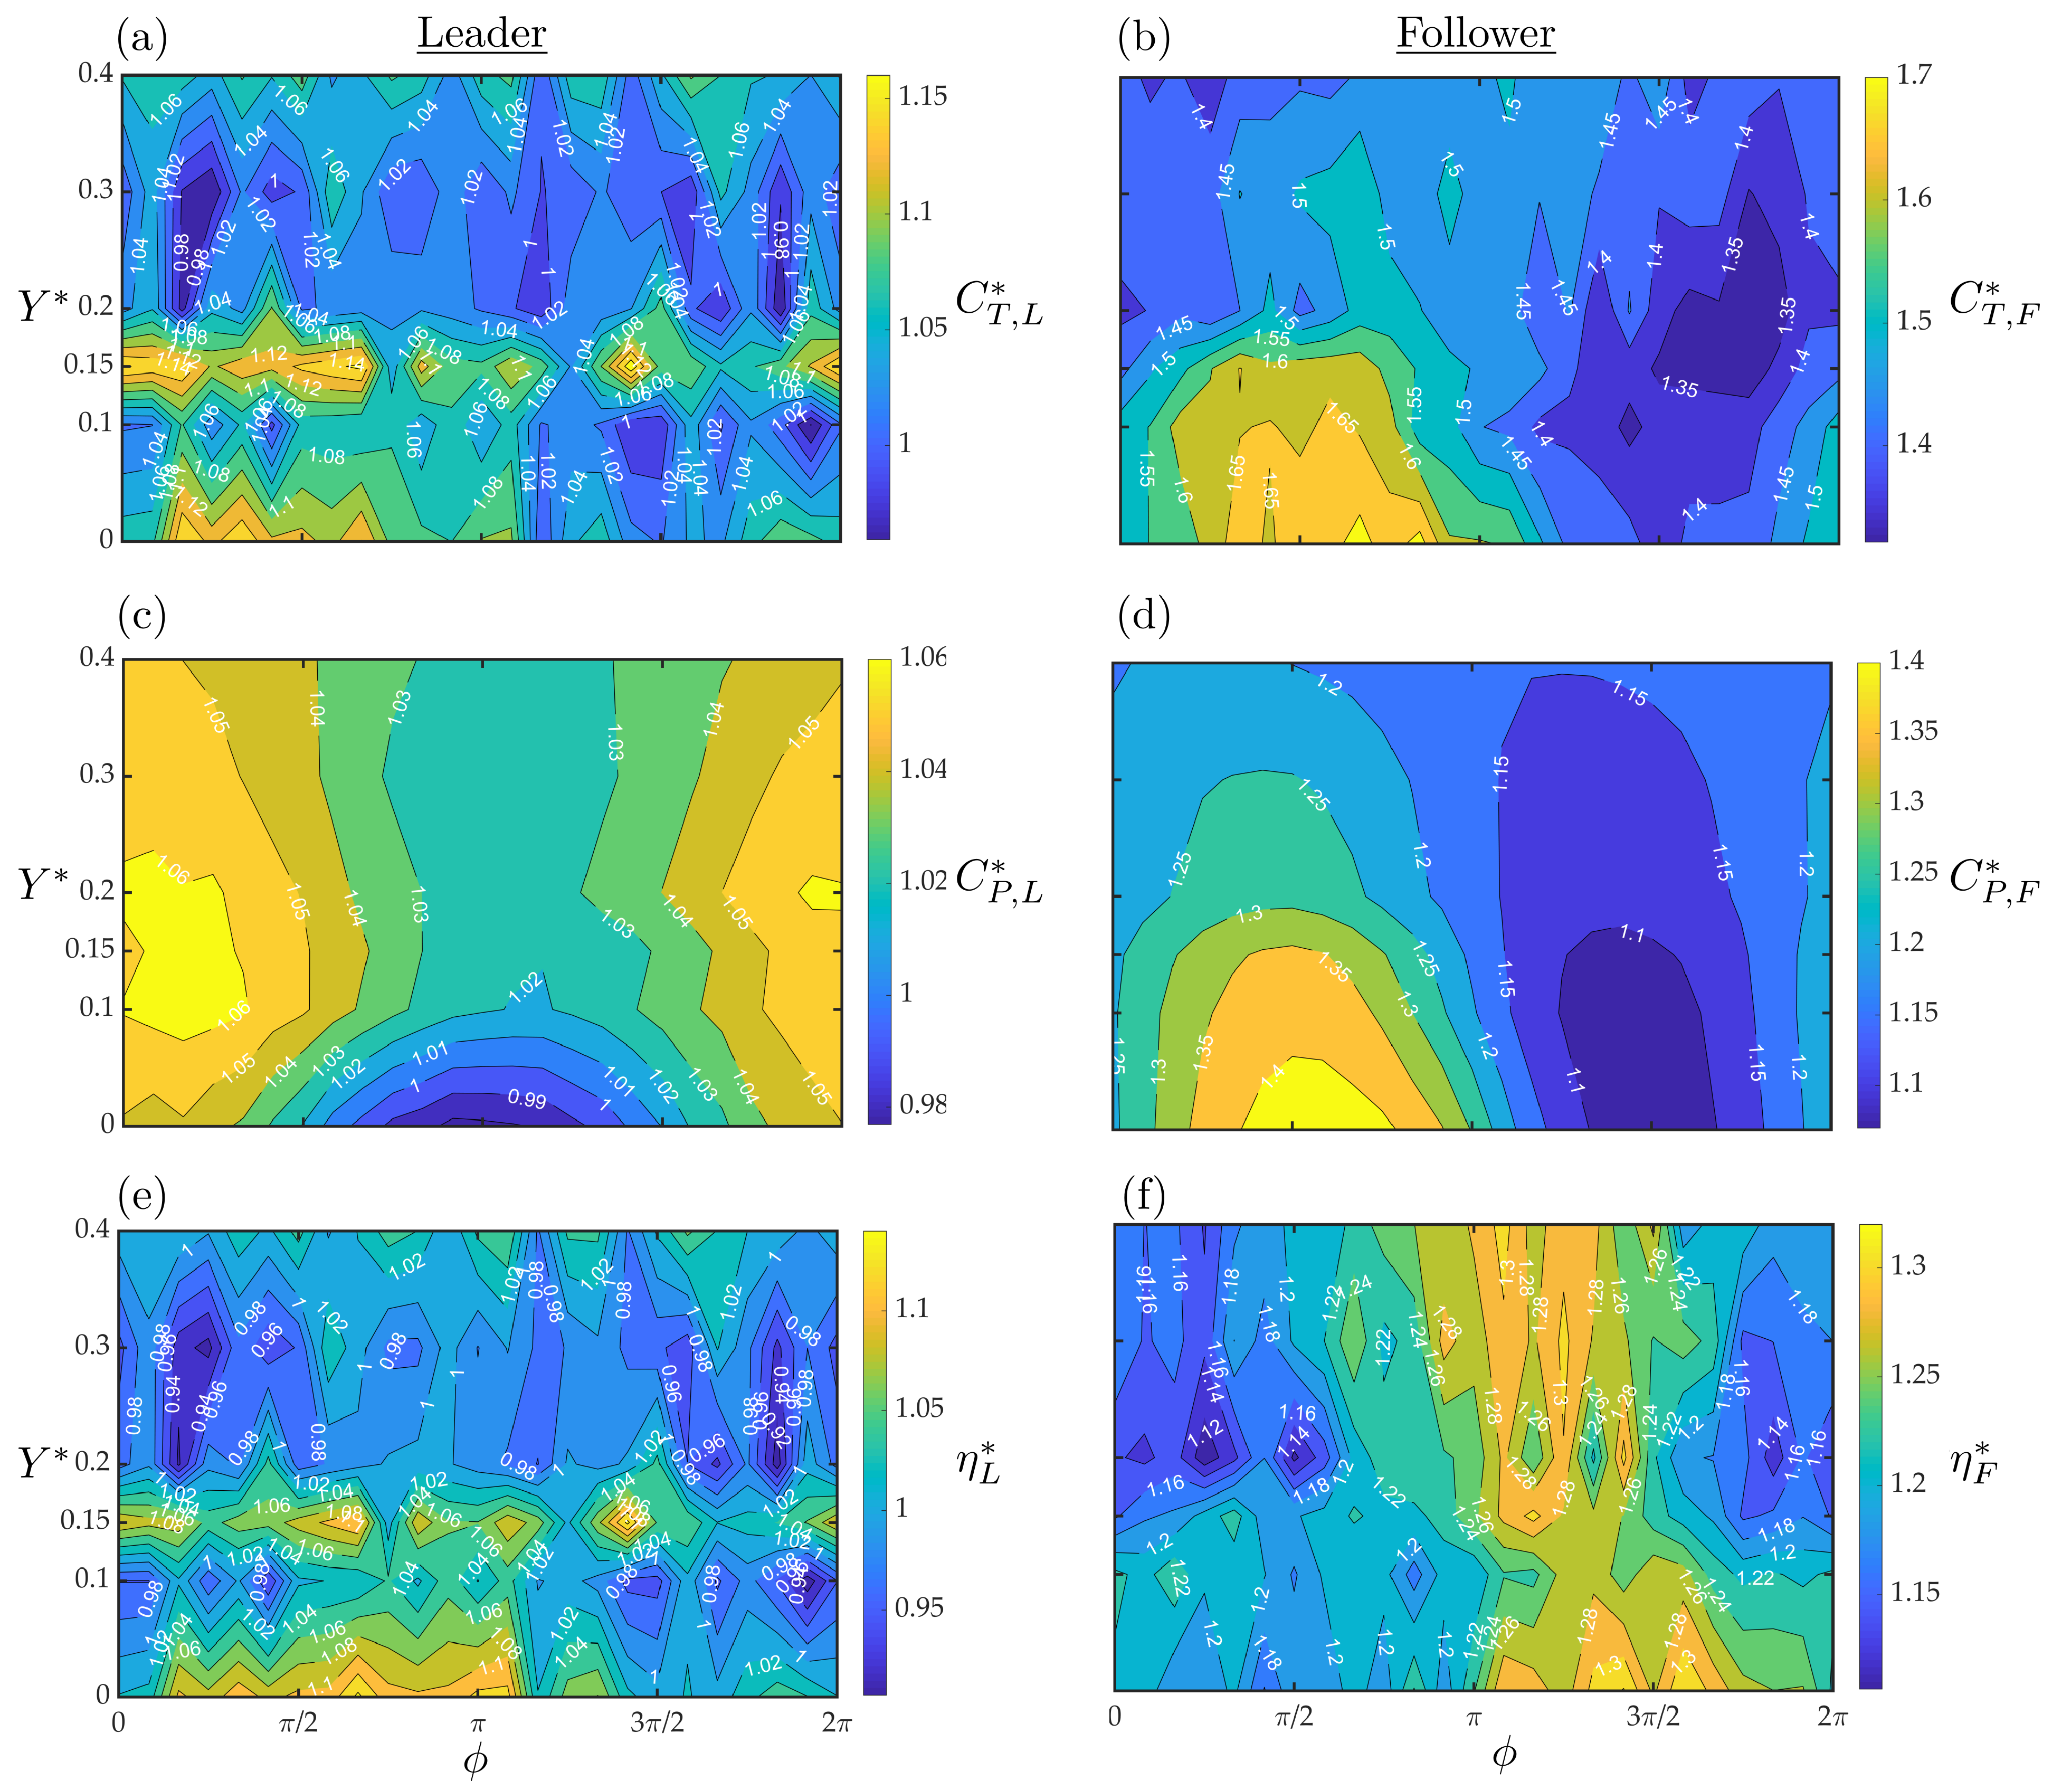
Appendix D. Leader and Follower Foil Performance

Appendix D.1. Flexible Foils in In-Line Arrangements

Figure A2 presents the normalized thrust, power and efficiency of the leader and follower foils in in-line arrangements as functions of synchrony and streamwise foil spacing. The leader shows a modest thrust increase of up to 15% in the region of 0.5 X * 0.625 and 0 ϕ π . This region of increased thrust drives a similar increase in efficiency of up to 12 % in the region X * = 0.5 and 0 ϕ π since in this region the power stays within ± 4 % of its value for an isolated foil. The leader thrust and efficiency shows a more narrowly located beneficial region around X * = 0.5 than previous rigid foil in-line interactions [19,20], suggesting that fluid-structure interactions are playing a role.
When the follower foil performance is considered, diagonal band structures are the first feature to be noted in the thrust and power, marking the minimum and maximum values, as previously observed for rigid foil systems in in-line arrangements [19,20,22]. If examined closely, vertical distortions to the thrust band structures around X * = 0.5 and 2 π / 3 ϕ 5 π / 6 as well as more weakly around X * = 1 and ϕ 3 π / 2 can be identified. In these regions, the follower thrust goes up to 72 and 74% higher than isolation, respectively. These peaks in thrust also correspond to peaks in power as well, where the follower requires up to 39 to 41% more power than isolation. The vertical distortions are not observed in rigid interacting foils [19,20] and they lead to a strikingly different follower efficiency map from previous rigid foils interactions. In rigid foil interactions the efficiency contour shows diagonal band structures like the thrust and power contours, but here the efficiency contour shows strong vertical band structures indicating that the fluid-structure interactions of the interacting flexible foils is significantly altering the efficiency. The global peaks in follower efficiency occur with up to 32 % increases over the isolated foil at X * = 0.5 and π ϕ 2 π . This peak in follower efficiency can be explained by the low levels of increase in the follower power of 10–25% and the concurrent moderate thrust gains of up to 35–45%.
Figure A2. Normalized (a,b) thrust, (c,d) power and (e,f) efficiency of leader (left column) and follower (right column) in in-line arrangements as a function of synchrony and streamwise foil spacing.
Fluids 06 00233 g0a2

Appendix D.2. Flexible Foils in Staggered Arrangements

Figure A3 presents the leader and follower foils in staggered arrangements at a fixed streamwise spacing of X * = 0.5 as a function of synchrony and cross-stream spacing. Although the leader thrust generation shows modest gains over an isolated foil, similar to in-line arrangements, there is a region where the leader performs better than the isolated foil with up to 17 % gains for Y * = 0.15 at ϕ 2 π / 3 and ϕ 3 π / 2 , that is, higher than the leader thrust peaks reported in Appendix D.1. Although, there is a small increase in power of up to 5 % , these peaks in leader thrust lead to concurrent efficiency gains of up to 9 % and 14 % , respectively.
The follower generates 35–70% higher thrust than in isolation over the entire tested variable range. The follower thrust reveals a high-thrust region at 0 Y * 0.15 and 0 ϕ π with 55–70% gains where the two foils closely interact with each other. In this high-thrust region there is a concurrent rise in power of up to 41 % leading to only moderate follower efficiency gains around 20 % . A high-efficiency region occurs at π ϕ 2 π with up to 30 % increase in follower efficiency.
Figure A3. Normalized (a,b) thrust, (c,d) power and (e,f) efficiency of the leader (left column) and the follower (right column) foils in staggered arrangements for a fixed streamwise spacing of X * = 0.5 as a function of synchrony and cross-stream foil spacing.
Fluids 06 00233 g0a3

Appendix D.3. Flexible Foils Pitching at Different Amplitudes

Figure A4 presents the normalized thrust, power, and efficiency of the leader and follower foils as a function of synchrony and follower-to-leader amplitude ratio for an in-line arrangement at ( X * , Y * ) = ( 0.5 , 0 ) . There is a striking effect of the amplitude ratio of R A * = 1.36 in the leader data showing a drop in both the thrust and power. The effect is also weakly observed as a break in monotonically increasing trend of the follower thrust and power. The leader gets a substantial boost in efficiency at R A * = 1.36 and 2 π / 3 ϕ 5 π / 6 of 26–29%. Outside of R A * = 1.36 the leader data is essentially unaffected by the increasing amplitude ratio.
As expected, the follower thrust increases with the increase in the prescribed follower amplitude. The synchronies of ϕ π consistently output higher thrust generation for the follower at each R A * . Similar trends can be observed for the follower power where the power increases with the increase R A * . Consequently, the follower exhibits moderate peak efficiency gains of up to 30–36% within the synchrony range π ϕ 2 π , for 1 R A * 1.44 .
From the leader and follower data the power sharing ratio can be calculated at the peak collective efficiency giving ζ 0.4 . This means that the collective efficiency is a weighted average with approximately 70 % coming from the follower efficiency and 30 % coming from the leader. The leader and follower efficiencies are nearly the same for R A * = 1 and 1.36 at their respective optimal efficiency conditions, however, it is the heavier weighting of the follower efficiency that drives the increase in the collective efficiency as hypothesized.
Figure A4. Normalized (a,b) thrust, (c,d) power and (e,f) efficiency of leader (left column) and follower (right column) foils as a function of synchrony and follower-to-leader amplitude ratio for an in-line arrangement at ( X * , Y * ) = ( 0.5 , 0 ) .
Fluids 06 00233 g0a4

References

  1. Lucas, K.N.; Lauder, G.V.; Tytell, E.D. Airfoil-like mechanics generate thrust on the anterior body of swimming fishes. Proc. Natl. Acad. Sci. USA 2020, 117, 10585–10592. [Google Scholar] [CrossRef]
  2. Drucker, E.G.; Lauder, G.V. Locomotor function of the dorsal fin in teleost fishes: Experimental analysis of wake forces in sunfish. J. Exp. Biol. 2001, 204, 2943–2958. [Google Scholar] [CrossRef] [PubMed]
  3. Standen, E.; Lauder, G.V. Hydrodynamic function of dorsal and anal fins in brook trout (Salvelinus fontinalis). J. Exp. Biol. 2007, 210, 325–339. [Google Scholar] [CrossRef] [PubMed] [Green Version]
  4. Fish, F.; Lauder, G. Passive and Active Flow Control By Swimming Fishes and Mammals. Annu. Rev. Fluid Mech. 2006, 38, 193–224. [Google Scholar] [CrossRef] [Green Version]
  5. Lauder, G.V.; Tytell, E.D. Hydrodynamics of undulatory propulsion. Fish Physiol. 2005, 23, 425–468. [Google Scholar]
  6. Lauder, G.V.; Madden, P.G. Fish locomotion: Kinematics and hydrodynamics of flexible foil-like fins. Exp. Fluids 2007, 43, 641–653. [Google Scholar] [CrossRef]
  7. Rosic, M.L.N.; Thornycroft, P.J.; Feilich, K.L.; Lucas, K.N.; Lauder, G.V. Performance variation due to stiffness in a tuna-inspired flexible foil model. Bioinspir. Biomimetics 2017, 12, 016011. [Google Scholar] [CrossRef]
  8. Bose, N.; Lien, J.; Ahia, J. Measurements of the bodies and flukes of several cetacean species. Proc. R. Soc. B Biol. Sci. 1990, 242, 163–173. [Google Scholar] [CrossRef]
  9. DeBlois, M.C.; Motani, R. Flipper bone distribution reveals flexible trailing edge in underwater flying marine tetrapods. J. Morphol. 2019, 280, 908–924. [Google Scholar] [CrossRef]
  10. Katz, J.; Weihs, D. Hydrodynamic propulsion by large amplitude oscillation of an airfoil with chordwise flexibility. J. Fluid Mech. 1978, 88, 485–497. [Google Scholar] [CrossRef]
  11. Moore, M.N.J. Analytical results on the role of flexibility in flapping propulsion. J. Fluid Mech. 2014, 757, 599–612. [Google Scholar] [CrossRef] [Green Version]
  12. Heathcote, S.; Gursul, I. Flexible Flapping Airfoil Propulsion at Low Reynolds Numbers. AIAA J. 2007, 45. [Google Scholar] [CrossRef]
  13. Dewey, P.A.; Boschitsch, B.M.; Moored, K.W.; Stone, H.A.; Smits, A.J. Scaling laws for the thrust production of flexible pitching panels. J. Fluid Mech. 2013, 732, 29. [Google Scholar] [CrossRef]
  14. Quinn, D.B.; Lauder, G.V.; Smits, A.J. Maximizing the efficiency of a flexible propulsor using experimental optimization. J. Fluid Mech. 2015, 767, 430–448. [Google Scholar] [CrossRef] [Green Version]
  15. Lucas, K.N.; Johnson, N.; Beaulieu, W.T.; Cathcart, E.; Tirrell, G.; Colin, S.P.; Gemmell, B.J.; Dabiri, J.O.; Costello, J.H. Bending rules for animal propulsion. Nat. Commun. 2014, 5, 1–7. [Google Scholar] [CrossRef] [PubMed] [Green Version]
  16. Lucas, K.N.; Thornycroft, P.J.; Gemmell, B.J.; Colin, S.P.; Costello, J.H.; Lauder, G.V. Effects of non-uniform stiffness on the swimming performance of a passively-flexing, fish-like foil model. Bioinspir. Biomimetics 2015, 10, 056019. [Google Scholar] [CrossRef] [Green Version]
  17. Zeyghami, S.; Moored, K.W. Effect of Nonuniform Flexibility on Hydrodynamic Performance of Pitching Propulsors. J. Fluids Eng. 2019, 141, 4041976. [Google Scholar] [CrossRef] [Green Version]
  18. Han, T.; Kurt, M.; Mivehchi, A.; Moored, K.W. Tailoring the Bending Pattern of Non-Uniformly Flexible Pitching Propulsors Enhances Propulsive Efficiency. In APS Division of Fluid Dynamics Meeting Abstracts; P27-002; American Physical Society: Seattle, WA, USA, 2019. [Google Scholar]
  19. Boschitsch, B.M.; Dewey, P.A.; Smits, A.J. Propulsive performance of unsteady tandem hydrofoils in an in-line configuration. Phys. Fluids 2014, 26, 051901. [Google Scholar] [CrossRef]
  20. Kurt, M.; Moored, K.W. Flow interactions of two-and three-dimensional networked bio-inspired control elements in an in-line arrangement. Bioinspir. Biomimetics 2018, 13, 045002. [Google Scholar] [CrossRef] [PubMed] [Green Version]
  21. Gopalkrishnan, R.; Triantafyllou, M.; Triantafyllou, G.; Barrett, D. Active vorticity control in a shear flow using a flapping foil. J. Fluid Mech. 1994, 274, 1–21. [Google Scholar] [CrossRef] [Green Version]
  22. Muscutt, L.; Weymouth, G.; Ganapathisubramani, B. Performance augmentation mechanism of in-line tandem flapping foils. J. Fluid Mech. 2017, 827, 484–505. [Google Scholar] [CrossRef] [Green Version]
  23. Kurt, M.; Eslam Panah, A.; Moored, K.W. Flow interactions between low aspect ratio hydrofoils in in-line and staggered arrangements. Biomimetics 2020, 5, 13. [Google Scholar] [CrossRef] [Green Version]
  24. Mignano, A.P.; Kadapa, S.; Tangorra, J.L.; Lauder, G.V. Passing the wake: Using multiple fins to shape forces for swimming. Biomimetics 2019, 4, 23. [Google Scholar] [CrossRef] [Green Version]
  25. Kurt, M.; Mivehchi, A.; Moored, K.W. Two-dimensionally stable self-organization arises in simple schooling swimmers through hydrodynamic interactions. arXiv 2021, arXiv:2102.03571. [Google Scholar]
  26. Tytell, E.D.; Lauder, G.V. The hydrodynamics of eel swimming: I. Wake structure. J. Exp. Biol. 2004, 207, 1825–1841. [Google Scholar] [CrossRef] [PubMed] [Green Version]
  27. Kinsey, T.; Dumas, G.; Lalande, G.; Ruel, J.; Méhut, A.; Viarouge, P.; Lemay, J.; Jean, Y. Prototype testing of a hydrokinetic turbine based on oscillating hydrofoils. Renew. Energy 2011, 36, 1710–1718. [Google Scholar] [CrossRef]
  28. Ribeiro, B.L.R.; Frank, S.L.; Franck, J.A. Vortex dynamics and Reynolds number effects of an oscillating hydrofoil in energy harvesting mode. J. Fluids Struct. 2020, 94, 102888. [Google Scholar] [CrossRef] [Green Version]
  29. Ribeiro, B.L.R.; Su, Y.; Guillaumin, Q.; Breuer, K.S.; Franck, J.A. Wake-foil Interactions and Energy Harvesting Efficiency in Tandem Oscillating Foils. arXiv 2021, arXiv:2103.05892. [Google Scholar]
  30. Verma, S.; Novati, G.; Koumoutsakos, P. Efficient collective swimming by harnessing vortices through deep reinforcement learning. Proc. Natl. Acad. Sci. USA 2018, 115, 5849–5854. [Google Scholar] [CrossRef] [Green Version]
  31. Li, L.; Nagy, M.; Graving, J.M.; Bak-Coleman, J.; Xie, G.; Couzin, I.D. Vortex phase matching as a strategy for schooling in robots and in fish. Nat. Commun. 2020, 11, 1–9. [Google Scholar] [CrossRef]
  32. Dewey, P.A.; Quinn, D.B.; Boschitsch, B.M.; Smits, A.J. Propulsive performance of unsteady tandem hydrofoils in a side-by-side configuration. Phys. Fluids 2014, 26, 041903. [Google Scholar] [CrossRef]
  33. David, M.J.; Govardhan, R.N.; Arakeri, J.H. Thrust generation from pitching foils with flexible trailing edge flaps. J. Fluid Mech. 2017, 828, 70–103. [Google Scholar] [CrossRef]
  34. MacKowski, A.W.; Williamson, C.H. Effect of pivot location and passive heave on propulsion from a pitching airfoil. Phys. Rev. Fluids 2017, 2. [Google Scholar] [CrossRef]
  35. Ayancik, F.; Zhong, Q.; Quinn, D.B.; Brandes, A.; Bart-Smith, H.; Moored, K.W. Scaling laws for the propulsive performance of three-dimensional pitching propulsors. J. Fluid Mech. 2019, 871, 1117–1138. [Google Scholar] [CrossRef] [Green Version]
  36. Triantafyllou, G.S.; Triantafyllou, M.; Grosenbaugh, M. Optimal thrust development in oscillating foils with application to fish propulsion. J. Fluids Struct. 1993, 7, 205–224. [Google Scholar] [CrossRef]
  37. Buchholz, J.H.; Smits, A.J. The wake structure and thrust performance of a rigid low-aspect-ratio pitching panel. J. Fluid Mech. 2008, 603, 331. [Google Scholar] [CrossRef] [Green Version]
  38. Floryan, D.; Van Buren, T.; Smits, A.J. Efficient cruising for swimming and flying animals is dictated by fluid drag. Proc. Natl. Acad. Sci. USA 2018, 115, 8116–8118. [Google Scholar] [CrossRef] [Green Version]
  39. Moored, K.W.; Quinn, D.B. Inviscid scaling laws of a self-propelled pitching airfoil. AIAA J. 2018, 57, 3686–3700. [Google Scholar] [CrossRef] [Green Version]
  40. King, J.T.; Green, M.A. Experimental study of the three-dimensional wakes produced by trapezoidal panels with varying trailing edge geometry and piching amplitude. In AIAA SciTech; American Institute of Aeronautics and Astronautics: San Diego, CA, USA, 2019. [Google Scholar]
  41. Bernitsas, M.; Ray, D.; Kinley, P. KT, KQ and Efficiency Curves for the Wageningen b-Series Propellers; Technical Report; University of Michigan: Ann Arbor, MI, USA, 1981. [Google Scholar]
  42. Ayancik, F.; Fish, F.E.; Moored, K.W. Three-dimensional scaling laws of cetacean propulsion characterize the hydrodynamic interplay of flukes’ shape and kinematics. J. R. Soc. Interface 2020, 17. [Google Scholar] [CrossRef] [Green Version]
  43. Ramananarivo, S.; Mitchel, T.; Ristroph, L. Improving the propulsion speed of a heaving wing through artificial evolution of shape. Proc. R. Soc. A Math. Phys. Eng. Sci. 2019, 475. [Google Scholar] [CrossRef] [Green Version]
  44. Van Buren, T.; Floryan, D.; Smits, A.J.; Han, P.; Bode-Oke, A.T.; Dong, H. Foil shapes for efficient fish-like propulsion. In AIAA SciTech; American Institute of Aeronautics and Astronautics: San Diego, CA, USA, 2019. [Google Scholar]
  45. Moore, M.N.J. Torsional spring is the optimal flexibility arrangement for thrust production of a flapping wing. Phys. Fluids 2015, 27, 091701. [Google Scholar] [CrossRef] [Green Version]
  46. Yeh, P.D.; Li, Y.; Alexeev, A. Efficient swimming using flexible fins with tapered thickness. Phys. Rev. Fluids 2017, 2, 1–9. [Google Scholar] [CrossRef]
  47. Floryan, D.; Rowley, C.W. Distributed flexibility in inertial swimmers. J. Fluid Mech. 2020, 888, 1–37. [Google Scholar] [CrossRef] [Green Version]
  48. Tytell, E.D.; Standen, E.M.; Lauder, G.V. Escaping flatland: Three-dimensional kinematics and hydrodynamics of median fins in fishes. J. Exp. Biol. 2007, 211, 187–195. [Google Scholar] [CrossRef] [PubMed] [Green Version]
  49. Wang, J.; Wainwright, D.K.; Lindengren, R.E.; Lauder, G.V.; Dong, H. Tuna locomotion: A computational hydrodynamic analysis of finlet function. J. R. Soc. Interface 2020, 17. [Google Scholar] [CrossRef] [PubMed] [Green Version]
  50. Licht, S.; Durham, N. Biomimetic robots for environmental monitoring in the surf zone and in very shallow water. In Proceedings of the IEEE/RSJ International Conference on Intelligent Robots and Systems, Algarve, Portugal, 7–12 October 2012. [Google Scholar]
Figure 1. The current study charts a path to exceeding 60% collective efficiency while pitching foil studies typically never break 40% efficiency. The markers are colored yellow for single rigid foil studies, blue for studies of a pair of interacting rigid foils, red for single flexible foil studies, and purple for our current study where we examine a pair of interacting flexible foils. Not all data was extracted from each study. The highest efficiency cases were chosen for two-dimensional foils and three-dimensional foils with A R     2 [13,19,20,25,32,33,34,35].
Fluids 06 00233 g001
Figure 2. (a) Schematic of the water channel setup, (b) single pitching mechanism, (c) the flexible foils in a staggered arrangement, and (d) photograph of a non-uniformly flexible foil.
Fluids 06 00233 g002
Figure 3. (a) Thrust coefficient and (b) efficiency as a function of the dimensionless amplitude, A 0 * , for different pitching frequencies, f. The lowest to the highest frequencies within the range of 1 f 1.5 are mapped from blue to red.
Fluids 06 00233 g003
Figure 4. Normalized collective (a) thrust, (b) power, and (c) efficiency as a function of synchrony and streamwise spacing between the leader and follower foils.
Fluids 06 00233 g004
Figure 5. Normalized collective (a) thrust, (b) power and (c) efficiency as a function of synchrony and cross-stream spacing between the leader and follower.
Fluids 06 00233 g005
Figure 6. Normalized collective (a) thrust, (b) power and (c) efficiency as a function of synchrony and the follower-to-leader amplitude ratio for an in-line arrangement at ( X * , Y * ) = ( 0.5 , 0 ) .
Fluids 06 00233 g006
Table 1. Experimental parameters and input variables used in the present study.
Case ICase IICase III
X * 0.25–1.25 0.50.5
Y * 00–0.40
R A * 111–1.48
A 0 , L * 0.250.250.25
f [Hz]1.31.31.3
ϕ 0–2 π with π / 12 increments
U [m/s]0.0940.0940.094
Table 2. Time-averaged net thrust, power and drag coefficients, as well as propulsive efficiency of an isolated rigid foil at A 0 * = 0.25 and f = 1.5 Hz and an isolated flexible foil at A 0 * = 0.25 and f = 1.3 Hz. The reported values for the rigid and flexible foils are taken at their peak efficiency. ± ( · ) represents the standard deviation calculated from 5 experimental trials.
Performance Coefficients at Peak Efficiency
C T , iso rigid 0.16 ± 0.01
C P , iso rigid 0.55 ± 0.006
C D , iso rigid 0.04 ± 0.009
η iso rigid 0.29 ± 0.018
C T , iso 0.25 ± 0.01
C P , iso 0.53 ± 0.001
C D , iso 0.056 ± 0.008
η iso 0.48 ± 0.018
Publisher’s Note: MDPI stays neutral with regard to jurisdictional claims in published maps and institutional affiliations.

