Article

Study of Heat Pipe Thermal Performance with Internal Modified Geometry

by
Alaa A. B. Temimy
1,
Adnan A. Abdulrasool
2 and
F. A. Hamad
3,*
1
Training and Power Research Office, Ministry of Electricity, Baghdad, Iraq
2
Mechanical Engineering Department, Al-Mustansiriayah University, Ministry of Higher Education and Scientific Research, Baghdad, Iraq
3
School of Computing, Engineering & Digital Technologies, Teesside University, Middlesbrough, Tees Valley TS1 3BX, UK
*
Author to whom correspondence should be addressed.
Fluids 2021, 6(7), 231; https://doi.org/10.3390/fluids6070231
Submission received: 14 April 2021 / Revised: 6 June 2021 / Accepted: 18 June 2021 / Published: 22 June 2021
(This article belongs to the Special Issue Multiphase Flow in Pipes with and without Porous Media)

Abstract

:
The aim of this study was to investigate the effect of inserting a new internal tube packing (TP) on the thermal performance of a thermosyphon heat pipe (THP). The THP pipe was made from copper with an inner diameter of 17.4 mm and length of 600 mm. The new internal tube packing (TP) had a central copper disc with two copper tubes soldered onto both sides to transport vapor and condensate. The upper tube or riser had an inner diameter of 8.3 mm and was 300 mm long; it was connected to a hole in the disc from the upper side to transport the steam to the condenser section. The lower tube or downcomer had an inner diameter of 5 mm, was 225 mm long and was connected to the lower side of the disc to collect the condensate and transport it to the evaporator. The TP was inserted inside the THP to complete the design of the improved heat pipe (TPTHP). Experimental results showed that the TPTHP reduces the transit time from 16 to 11 min and the thermal resistance by 17–62% based on the input power and depending on the conditions of the THP. The results also showed that the inclination angle and filling ratio have no effect on the thermal resistance of the TPTHP.

1. Introduction

A heat pipe is one of the most efficient and passive heat transfer devices that can transport heat from a source (evaporator) to a sink (condenser) over relatively long distances via the latent heat of vaporization of a working fluid. Heat pipes are used in various applications such as solar and waste material energy devices [1,2,3], cooling of electronic devices [4], air conditioning applications for building environmental control [5,6], space and satellite missions [7,8], and thermal management of gas turbine blades [9]. A heat pipe is a closed pipe with a vacuum that consists of three sections, namely, an evaporator, an adiabatic, and a condenser that is partially filled with a working fluid (de-ionized water was used in this study). A heat pipe functions through cyclic evaporation and condensation of the working fluid that has a low thermal capacitance and low overall thermal resistance; there is no use of pumps.
In recent years, thermosyphon (wickless) heat pipes have been introduced as highly efficient heat transfer devices (thermal super conductors or thermal short circuits) compared to earlier designs which used wick to return the liquid by capillary action from the condenser to the evaporator section [10]. The amount of absorbed heat depends on the amount of vapor generated and the latent heat of evaporation of the working fluid. At the inner wall of the condenser, the vapor phase changes to the liquid phase. For a straight heat pipe, the condensate returns to the evaporator section by gravity.
A THP is the basic type of heat pipe (HP) upon which all others are based. In order to improve the performance of the THP and ensure its reliability under different working conditions, a number of improvements have been considered to enhance the performance of the simple THP. The main modifications adopted for this purpose are summarized as follows:
i.
The use of binary mixtures to improve the wettability of used fluids which affect the adhesion and surface tension forces that reduce the entrainment effect during the transit of the two-phases streams inside the THP [11,12].
ii.
The use of PCM-assisted heat pipes for electronic device cooling to enhance thermal performance [13].
iii.
The addition of nanoparticles to working fluids to increase heat transfer rates through the THP so it can be used for the high heat flux rates [14].
iv.
A geometry modification was also adopted to enhance the performance of THP. The main modification was introduced to the evaporator section by increasing the surface roughness to increase the heat transfer rate by accelerating bubble formation during the boiling process [15,16].
The roughness in the evaporator section was increased either directly to the evaporator inner heating walls or by manufacturing the inner evaporator walls from sintered copper particles. The condenser performance was also modified using extensive fins on the heat transfer/cooling walls. Several studies have shown that both techniques enhance the THP [11,12,17,18,19,20].
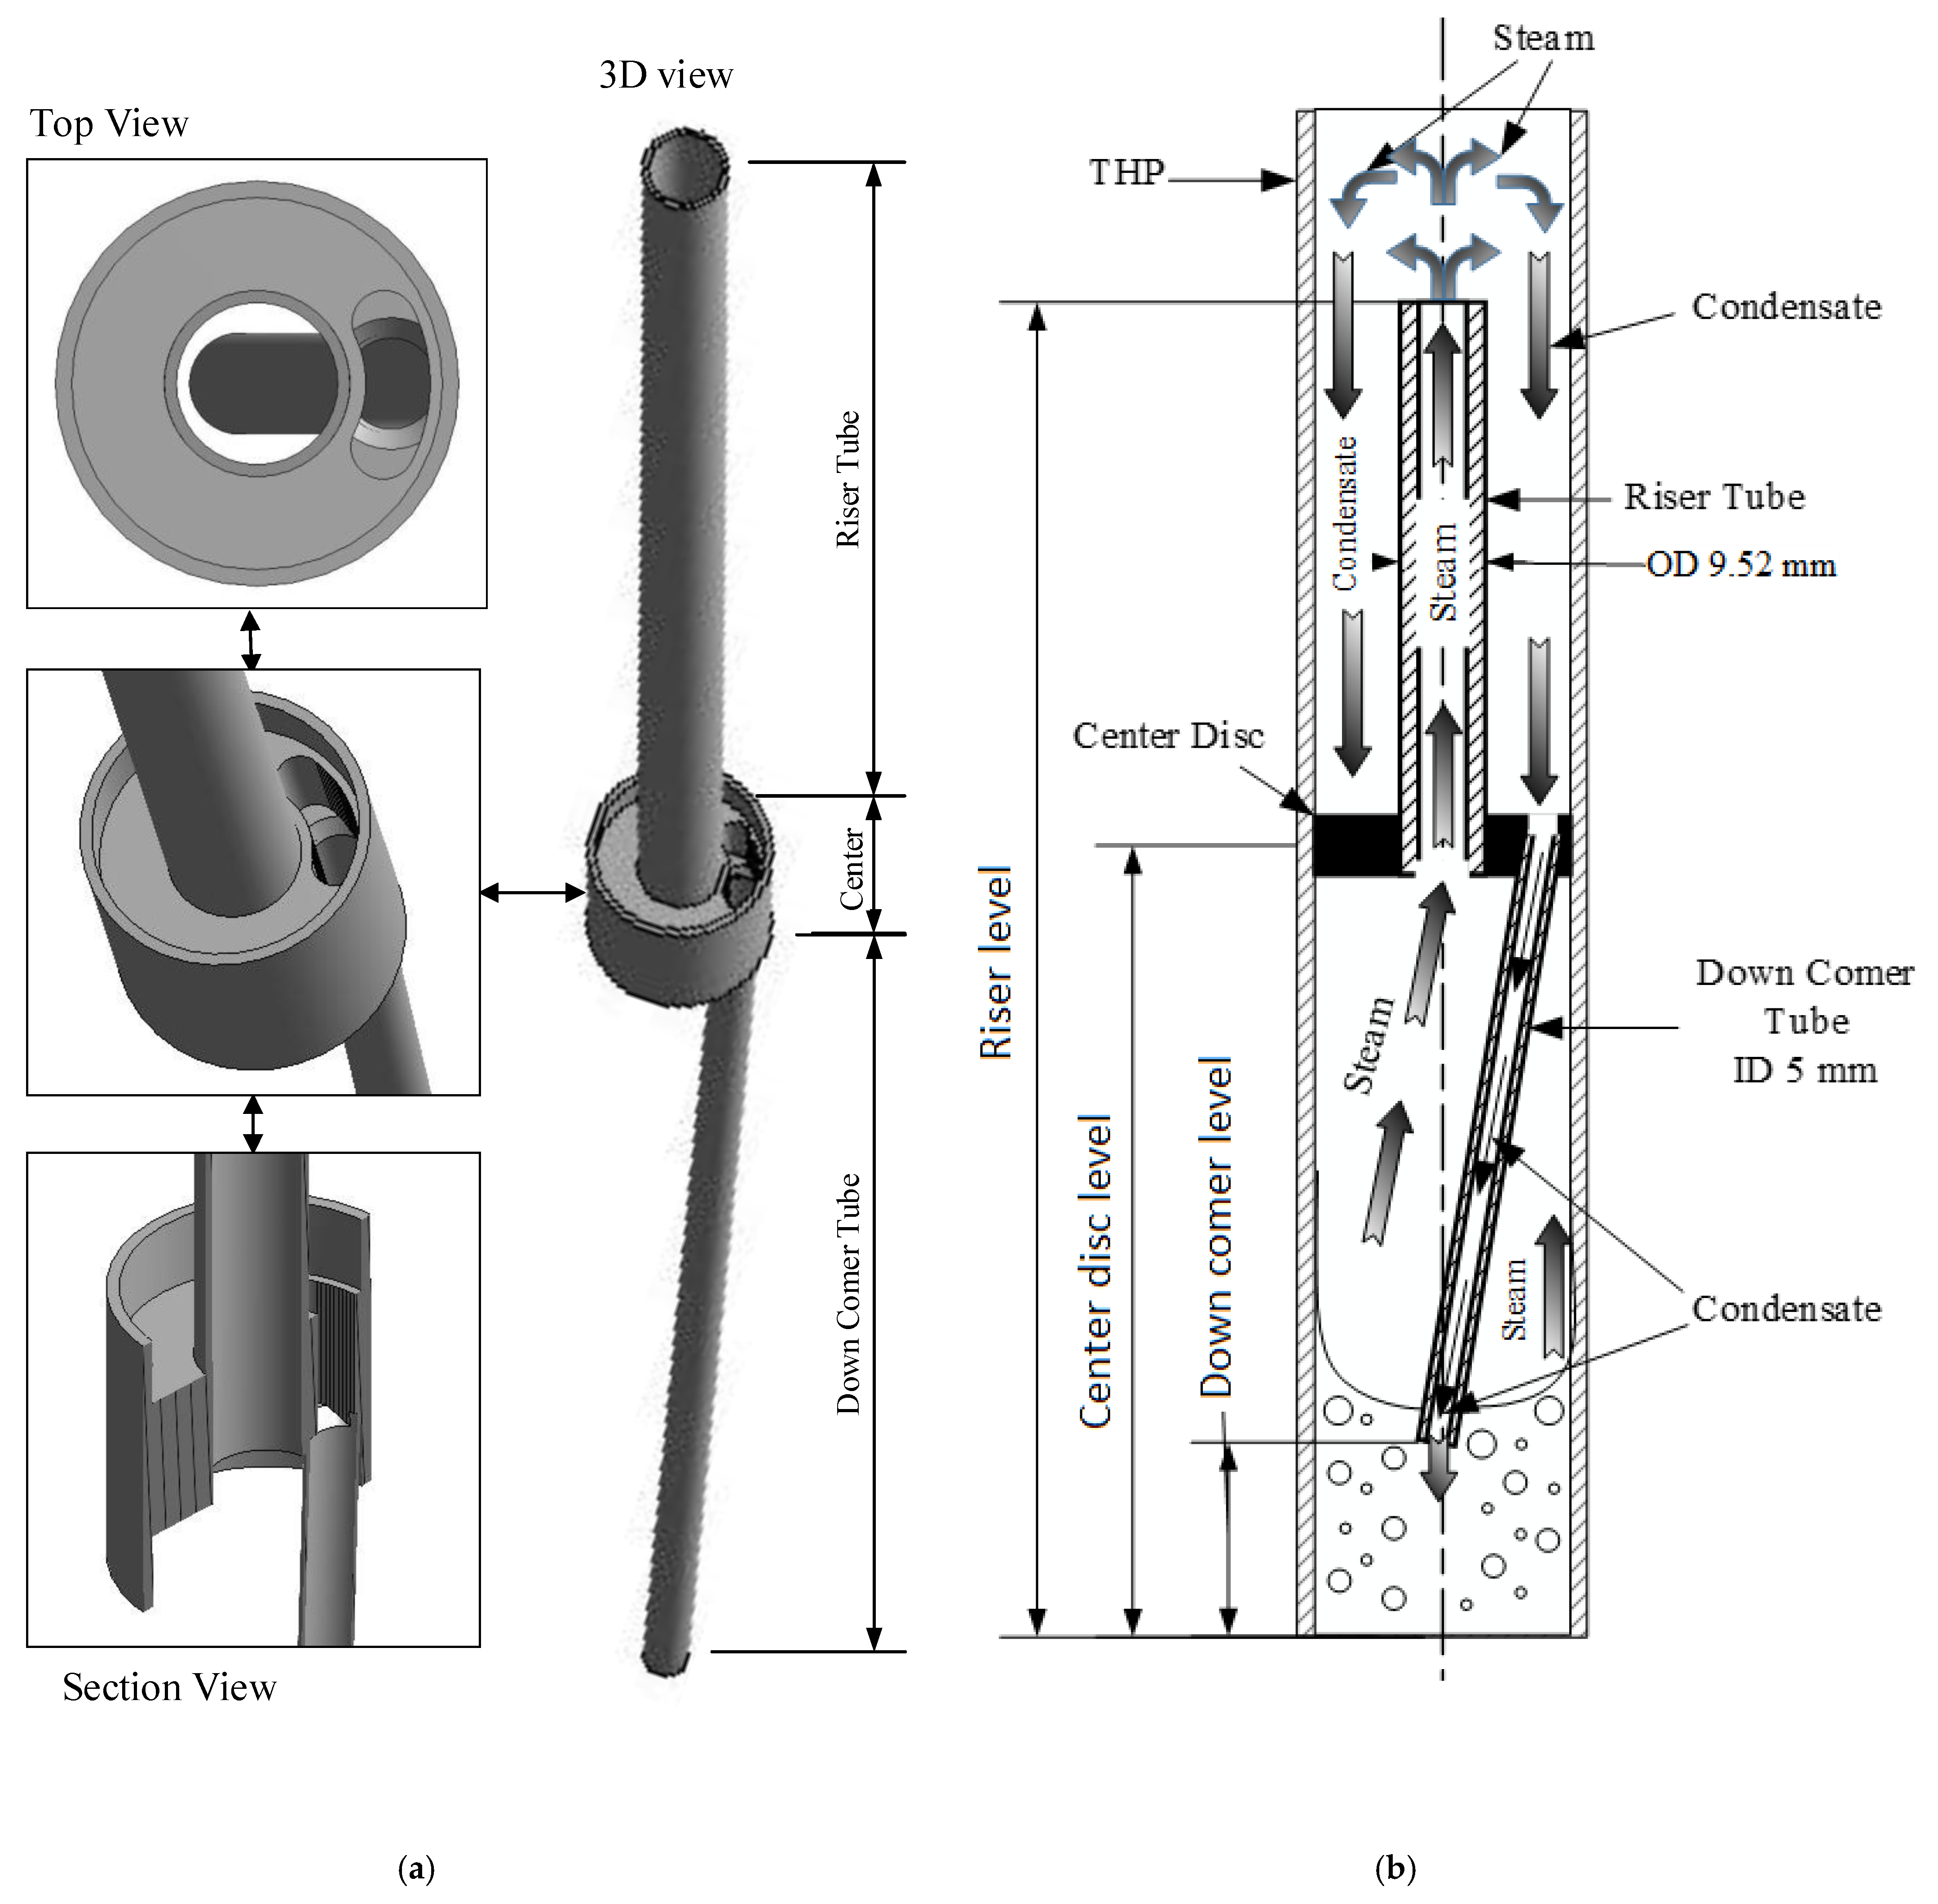
The principle of the THP performance enhancement used in this work is a novel technique that eliminates the entrainment effect at the interface between the vapor and condensate. It is based on the separation of the vapor streams generated at the evaporator from the condensate stream formed in the condenser. This separation process is performed using a central disk fitted at a certain designed location in the adiabatic section that enables the evaporator and condenser sections to operate separately. This means that the vapor and condensate flows without mixing. Further details of this will be given in Section 2. A summary of some recent experimental, analytical and CFD publications is provided in the remainder of this section.
Kim et al. [14] tested the effect of a sintered microporous coating of the evaporator section on the THP’s thermal performance. A copper tube with 25 mm ID, 935 mm length (evaporator: 300 mm, adiabatic: 300 mm, condenser: 335 mm) was tested at both vertical and inclined positions. Water was used as the working fluid for FR in the range of 25–100% and heat flux up to 300 kW/m2. The results showed that the reduction in Rth values was about 51% at FR 35% and about 30% at FR 70%. The best performance was recorded at an inclination of between 15° and 30° from the horizontal.
Solomon et al. [21] studied THP thermal performance with and without a thin porous copper coating on the inner surface of a copper pipe. The copper THP had a 16 mm ID and 19 mm OD and a length of 350 mm (evaporator: 100 mm, adiabatic: 100 mm, condenser: 150 mm). The heat supplied was varied in the range of 50–250 W with FR 30% of water at different inclination angles. The thin layer of porous copper was established to enhance pool boiling process and was made using electrochemical deposition process. They also tested the effect of coating with oxides on the thermal performance and found that the copper coat had better heat transfer performance.
Zhu et al. [4] investigated the geyser boiling inside a glass THP experimentally and numerically. They used an 18 mm ID glass tube with a total length of 500 mm (evaporator: 160 mm, condenser: 180 mm). Heating and cooling were achieved with water heat exchangers with circulation systems. A high-speed camera was arranged to capture the geyser boiling phenomenon inside evaporator section. The temperature distribution results showed good agreement between the CFD simulation and experimental results. The high-speed camera could not capture the geyser boiling, but the simulation provided a good visualization of the phenomenon.
Eidan et al. [6] investigated the thermal performance of the THP both experimentally and numerically. Six working fluids (water, ethanol, methanol, butanol, acetone, and R-134) were tested using a THP in HVAC systems. The filling ratios varied from 40% to 100% and heat supplied varied from 20 to 200 W. The THP was made from a commercial copper tube with a 16 mm OD and a total length of 400 m. The evaporator length was 150 mm, the adiabatic section length was 100 mm and the condenser section length was 150 mm. Heating and cooling were carried out with hot and cold water jacketed heat exchangers. Water provided the highest thermal performance at a temperature range of 30–50 °C, which is the temperature range of HVAC systems. The agreement between experimental and numerical simulation was within 10%.
Temimy and Abdulrasool [15,16] studied the flow pattern of the two-phase flow inside a THP numerically and experimentally. The THP was made from a copper tube with 16 mm OD and had a total length of 600 mm. The evaporator length was 250 mm, the adiabatic section length was 150 mm and the condenser section length was 200 mm. The simulation showed that the flow pattern was a non-steady spatial flow pattern. They also proposed the tube packing (TP) to be inserted into the THP to control the flow streams of steam and condensate. The 3-D CFD results showed that the insertion of the TP produced a uniform circulation of the two phases and enhanced the performance by reducing the Rth of the THP by up to 55%.
Fadhl et al. [22] simulated a THP under transient and steady state conditions using Ansys Fluent for Refrigerants R134a and R404a as the working fluids at 100% FR with a heat supply in the range of 20–100 W. The THP was made from a copper tube with an ID of 20.8 mm, an OD of 22 mm, and a total length of 500 mm (evaporator: 200 mm, adiabatic: 100 mm, condenser: 200 mm). The simulation results had good agreement with experimental data.
Lips and Lefevre [23] presented a general analytical solution for the temperature distribution, pressure, and velocity of different HP configurations. Fourier series expansion was used to solve the thermal and hydrodynamic models to find the temperature distribution for multiple heat sources and sinks along the HP. The main conclusion was that this solution can be used to predict the effective thermal conductivity (thermal resistance) of HPs with different configurations.
Alammar et al. [20] investigated the effect of FR and inclination angle on the thermal performance of THP numerically using a THP with 400 mm length (evaporator: 200 mm, condenser: 200 mm), an OD of 22 mm, and an ID of 20.2 mm. FR varied between 25 and 100% and the heat was supplied at 39, 81, and 101 W. The results showed that the optimum FR was 65%.
Hung and Seng [24] developed a 1D mathematical model to study the effect of star grooves, cross-sectional area, total length, adiabatic section length, and FR on the heat transfer capacity of a micro HP. The star groove mesh types were triangular, square, hexagonal, and octagonal. They concluded that for thin grooves the heat transfer capacity was increased due to the increase in capillary force. The heat transfer capacity was proportional to the cross-sectional area and inversely to the length of HP. The heat transfer was increased when the adiabatic section length decreased at a constant HP total length.
Nair and Balaji [17] studied the effect of the insertion of rectangular longitudinal fins (along the condenser section) and the number of fins on the thermal performance of THP numerically. The tested variable as the condensate mass of THP under steady state conditions. The THP was made of copper tube with an OD of 22 mm, an ID of 20 mm, and a length of 500 mm. The evaporator section length was 200 mm and the condenser section length was 200 mm. The fins were attached to the inner surface of the condenser section to increase the effective area for condensation. ANSYS Fluent with a VOF model was used to obtain numerical solution results. Water was selected as the working fluid with FR at 50%. The results were validated with published experimental data for a THP without fins. The results showed that the condensate mass increased by about 22% with eight fins, and by about 32% with 12 fins.
Aswath et al. [2] used a CFD simulation to compare the heat transfer using water and ammonia in vertical evacuated tubes of solar collectors. A copper tube with a 14 mm ID and 1800 mm length (evaporator: 650 mm, condenser: 200 mm) was used and the FR was set to 100%. They concluded that heat transfer with ammonia was better than water for the same geometry and working boundary conditions. This was attributed to the lower evaporation temperature of ammonia.
Fertahi et al. [19] established a 2D CFD numerical simulation using ANSYS/Fluent software to simulate a THP for a domestic water heating system. They used a 20.2 mm ID copper tube with a total length of 1000 mm (evaporator: 400 mm, condenser: 400 mm). A VOF model was used with the SIMPLE algorithm for pressure–velocity coupling. A transient solution was used with a 10−4 s time step. Steady state conditions were reached after a simulated time of 60 s. The results were validated using previous published work and a strong agreement was achieved. The authors suggested that the insertion of tilted fins in the condenser section would enhance the thermal performance of the THP.
This literature review shows that in spite of the extensive studies on heat pipes, there is limited published work on the use of the new internal tube packing (TP). Hence, in this study we aimed to investigate the effect of TP insertion on the thermal performance of heat pipes. Experimental measurements supported by CFD simulation were used to collect data on both the design of the thermosyphon heat pipe (THP) and the thermosyphon heat pipe with tube packing (TPTHP). To achieve the main aim, we carried out the following objectives:
  • The transient time for the filling ratio was set to 50%, the inclination angle was set to 45° and the input power was set to 200 W.
  • The temperature of the evaporator, condenser, and adiabatic sections was measured at different input powers of 50, 100 and 200 W.
  • We examined the effect of inclination angle on the thermal resistance of both designs. Inclination angles of 15, 30, 45, 60, 75, and 90° were used.
  • We optimized the TPTHP design. The selected upper end elevations of the riser tube were 500, 525, 550, and 575 mm. The selected center risk elevations were 250, 275, 300, and 325 mm. The selected lower end elevations of the downcomer tube were 25, 50, 75, and 100 mm.
  • We measured the evaporator excess temperature.
  • We determined the correlation of experimental and numerical simulation data.

2. Methodology

2.1. Experimental Rig

A copper tube with an OD of 19.05 mm, an ID of 17.4 mm and length of 600 mm was used to manufacture the thermosyphon heat pipe (THP), which included a 250 mm evaporator section, a 150 mm adiabatic section, and a 200 mm condenser section. Water was selected as the working fluid with filling ratios (FR) of 40%, 50%, 60%, and 70% of the evaporator section volume. Figure 1a shows a schematic diagram of the test rig without new internal tube packing (TP). Figure 1b shows the main dimension of the THP.
A water jacket of annular geometry was used for the flow of cooling fluid in the condenser section with an inner diameter of 19.05 mm and an outer diameter of 50 mm. A cooling water tank of 0.12 m3 with a 3000 W heater and temperature controller to maintain a temperature of 25 °C was used to supply the water under gravity. The level of water is also kept constant by using a float valve. The flow rate of cooling water was measured by a ZYIA rotameter adjusted to be constant at 0.00005 m3/s.
Six 50 W cartridge cylindrical heaters were arranged with equal spacing and tightened with two screw clamps around the evaporator section as shown in Figure 2A. The heaters were connected in series with thermally resistive wire. A thermal sleeve was mounted to the outer evaporator surface to protect the thermocouple wires from high temperatures. To ensure the heat generated by the heaters was distributed uniformly with minimum heat transfer to the evaporator surface, special thermal clay (density 1600 kg/m3, k 2.075 W/m °C) was applied to fill the spaces between heaters (Figure 2B). To minimize the loss of heat, the THP body and thermocouples were covered with a layer of thermal insulation glass wool (density 10 kg/m3) and wrapped with thermal insulation tape as shown in Figure 2C. A summary of the THP’s geometry and operating conditions is given in Table 1.

2.2. The Modified Thermosyphon Heat Pipe (TPTHP) with New Internal Tube Packing (TP)

The proposed internal tube packing (TP) shown in Figure 3a was inserted in the copper tube with an outer diameter of 19.05 mm, an inner diameter of 17.4 mm, and a length of 600 mm to improve the performance of the new THP shown in Figure 3b. Two copper tubes of 8.3 mm and 5 mm were soldered to the central copper disc that was fixed inside the main copper pipe. The riser tube had an 8.3 mm inner diameter where the saturated steam flows through it to the condenser section. The downcomer tube had a 5 mm inner diameter to transfer the condensate collected on the upper surface of the disc to the evaporator section.
The new design with TP was introduced to channel and control both the steam and condensate flow streams. All the generated steam was guided to the upper portion of condenser without mixing or interaction with the condensate layer on the THP wall. The produced condensate flowed downward and was guided to the lower portion of the evaporator section.

2.3. Measuring Techniques

Eleven thermocouples of type K were positioned on the surface of the THP/TPTHP and on the cooling water inlet and outlet to measure the temperature distribution along the THP, as shown in Figure 4. The thermocouples were distributed along the THP/TPTHP to observe the temperature variation in each section, especially the evaporation. Five thermocouples were used in the evaporator section (1, 2, 3, 4, 5), three thermocouples were used in the adiabatic section (5, 6, 7), and three thermocouples were used in the condenser section (7, 8, 9). A twelve-channel temperature recorder (BTM-4208SD—uncertainty ±0.5 °C) with a 16 GB SD card was used to record the temperature during the test under transient and steady state operation. A transient recording step was set to 1 s. The testing for operation of the THP/TPTHP was started from a full vacuum; therefore, a 0.373 kW air vacuum pump was used and connected to the vacuum tube of the THP. A vacuum gauge was used to trace and record pressure inside the THP/TPTHP.

2.4. Analysis of Experimental Data

The data collected from the thermocouples located in the evaporator and condenser were utilized to present the thermal performance of THP. The overall performance of the heat pipes can be measured by its thermal resistance. The thermal resistance can be used as an indicator to compare the effect of various parameters including the working fluid, pipe material, size/geometry, and filling ratio on the thermal performance of the heat pipe. The overall thermal resistance of the THP is given by the following equation [25,26,27]:
R t h = T e v a p . a v g . T c o n d . a v g . Q i n p u t
The evaporator and condenser average temperatures can be calculated from the thermocouple readings.
T e v a p . a v g . = T 1 + T 2 + T 3 + T 4 + T 5 5
T c o n d . a v g . = T 7 + T 8 + T 9 3
The enhancement of the thermal performance was calculated using the reduction of the Rth value.

2.5. Experimental Incertainty

Experimental uncertainty was calculated for the measurements from the instrumentation used in this study. For each measured parameter, one or more variable can contribute to the total uncertainty. The variable uncertainties were combined using the uncertainty method [25]. The total uncertainty measuring the heater input power, average evaporator/condenser temperature difference, and Rth values was in the range of 0.83–3.32% for the tests.

2.6. CFD Model and Simulation

ANSYS Fluent 19.0 was used to study the flow and heat transfer within the heat pipe. We generated a 3D geometry that mimicked the experimental THP/TPTHP. The models had the same dimensions as the experimental data. The purpose of the simulations was twofold: To compare the predicted temperature with experimental data at different input power; and to develop a better understanding of the flow (velocity) inside the evaporator and condenser.
The time averaged governing equations of mass, momentum transport and energy were used for each phase (steam and condensate of water) to measure the flow using the Volume of Fluid model (VOF). This model is one of the available Euler–Euler solution models in Fluent and was selected according to the recommendations of the software documentation [27]. Based on the volume fraction (VF) of both phases in each cell, the appropriate properties of each cell were calculated from momentum and energy equations. A time step of 1 × 10⁻⁴ s was set based on time independency procedure with an error of less than 1%. This also provided a Courant Number less than unity [22,28,29,30]. The details of the CFD model and the conservation equations were obtained from Temimy and Abdulrasool [15].
The VOF method relies on the fact that two or more phases are not interpenetrating and for each additional phase the volume fraction of the phase must be added in the computation. In the VOF model, the sum of the volume fractions of all phases in each control volume is equal to one. In the CFD model, the continuity equation, Navier–Stoke equations, and energy equation are solved simultaneously. These equations are as follows [27].
  • Continuity Equation
ρ t + · ( ρ V ) = 0
A mixture of the vapor (v) and liquid (l) phases exists when the cell is not full of primary phase (v) or with the secondary phase (l). Then, the mixture density is calculated as the average density using the volume fraction (αl) as follows:
ρ = l ρ l + ( 1 l ) ρ v
  • Momentum Equation
t   ( ρ V ) + · ( ρ V V ) = ρ g p + · [ μ ( V + V T ) ] + F C S F
The main forces that affect the momentum of the fluid phases in the VOF model are friction, surface tension, gravity, and pressure. Along the interface of the two phases, the effect of surface tension is important. Thus, the continuum surface force (FCSF) parameter was added to the momentum equation.
The dynamic viscosity µ was considered a mass that was averaged, which was calculated as follows:
μ = l μ l + ( 1 l ) μ v
Energy Equation
In the VOF model, there was a single set of equations for energy as follows:
t   ( ρ E ) + · ( ρ E V ) = · ( k T ) + · ( pV ) + S E
The energy source parameter SE was added to calculate the heat transfer during condensation and evaporation.
The initial conditions, boundary conditions, and convergence criteria are listed in Table 2.
The mesh for the 3D model was key to obtaining a realistic solution with minimal error. Mesh methods and properties were set based on the recommendation of ANSYS software documentation [28] for a single-component two-phase fluid flow and heat transfer case study simulation. Inflation techniques with different numbers of layers and thicknesses were used on desired surfaces to improve the formation of fluid flow and heat transfer boundary layers, and to capture phase changes in these layers. A non-independence procedure for the mesh with less than 1% error (error checked for the same points at the same operating time) was tested. Finally, in terms of nodes, 2 million elements for the THP and 4.5 million elements for the TPTHP were selected as a proper solution mesh.

3. Results and Discussions

3.1. Initial Data from CFD Simulation

To gain an initial understanding of the physical process inside the THP, the velocity vectors and temperature variation contours from CFD simulation for both THP and TPRHP for vertical case are presented in Figure 5I–III.
The spatial flow in Figure 5I appears as complex vortices which can be seen at different locations. The vectors’ behavior presents the variation of local velocity components of the axial velocity (along the THP) and radial velocity. Optimum heat transfer capabilities of the THP occur when the axial velocity is regular and located at the core of the THP [30,31,32,33]. This is because it will transport the generated steam from the evaporator section to the condenser section regularly. These unfavorable complex vortices will trigger the flooding operation limit which is one of the THP operation limits. The generated steam floods the condensate at the upper region of the THP (condenser section) and prevent it from flowing downward to the evaporator section, so the normal circulation processes of evaporation and condensation will stop, reducing the thermal performance of the THP [30,31,32,33].
To reduce or eliminate the appearance of vortices, the novel TP is inserted between the evaporator and condenser. The velocity vectors for the TPTHP in the central vertical plane for steady state operation are shown in Figure 5II. It can be observed that the axial velocity vectors become the main flow vector along the TPTHP. The radial flow almost disappears, except in the zones at the entrance and exit of the PT tube. This flow regularity enhances the evaporation and condensation cycle and enhances the thermal performance of the THP.
To investigate the effect on axial temperature distribution, Figure 5III presents a comparison between the temperature contours for both designs. It can be observed that the insertion of TP causes a significant difference in the temperature distribution along the axis of the heat pipe. The contours also show that the relatively high temperature zones appear at the upper end of the evaporator section and through the riser tube due to the separation between the condensate and steam. The temperature scales show a lower maximum temperature for the TPTHP compared to the THP.

3.2. Evolution of Temperature in Evaporator, Adiabatic Section and Condenser under Transient Heat Transfer Conditions

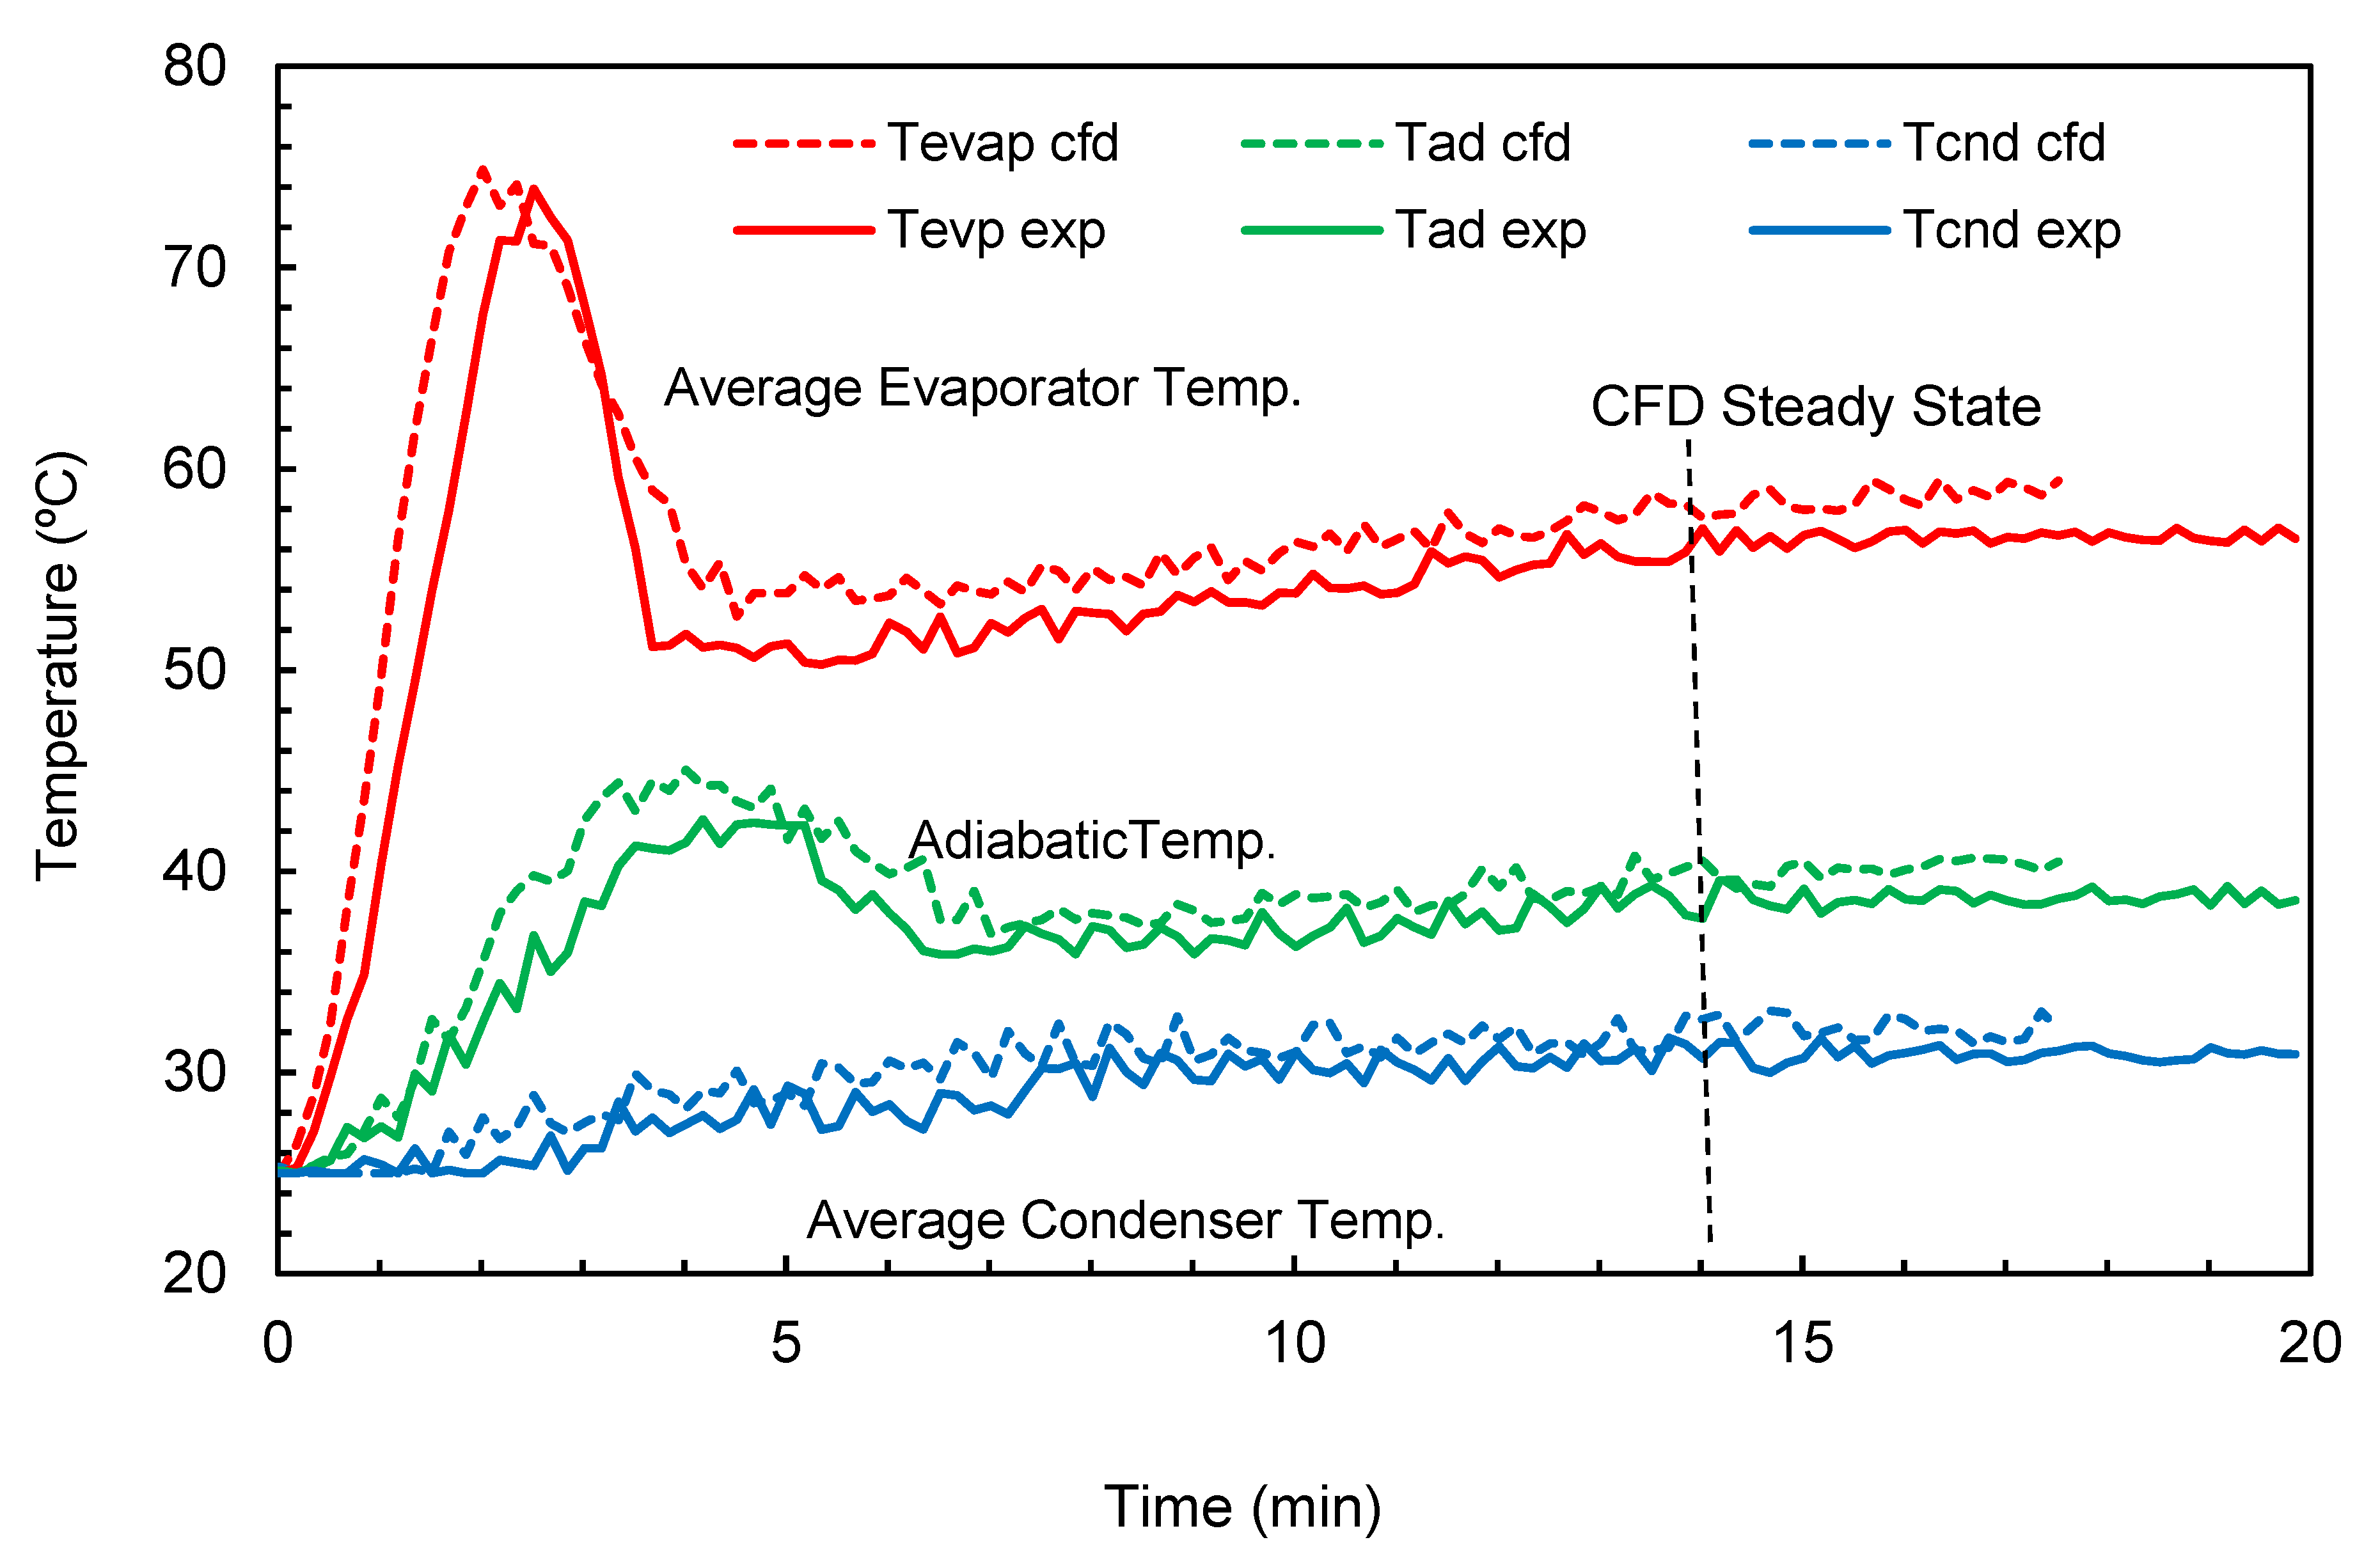
The variation of wall temperature with time along the length of the THP at a water filling ratio of 50%, inclination angle of 45°, and input power of 200 W is shown in Figure 6. As the fluid in the evaporator section is heated, the evaporation process begins and the vapor travels to the condenser due to the density differential. The average evaporator section temperature increases steeply to 73 °C, i.e., it becomes 30% higher than the steady state temperature (56 °C) over 2.5 min. The peak value was due to the accumulation of heat in the evaporator section before the generation of vapor. The formation of bubbles and their size depends on the thermo-physical properties of the working fluid, the nature of the inside surface, and the input energy. As the size of the bubbles increases, the thermal resistance in the evaporator increases and leads to the surface temperature increasing.
As the evaporation and condensation processes continue, the temperature will be decreased. It then increased gradually until both the evaporator and condenser reach steady state conditions after around 16 min.
The adiabatic section temperature behavior was influenced by the evaporator section behavior with a time lag and relatively low temperature. The time lag was due to the time required for heat transfer from the steam to the THP wall by convection and conduction through the THP copper material from the hot wall of the evaporator to the wall of the adiabatic section. The condenser section temperatures increased slowly until steady state conditions were achieved. The average transient operation time is around 17 min. The results from the CFD prediction are included in Figure 6. It can be observed that there is a strong agreement between the experimental values and predicted values.
Figure 7 shows the average temperatures of the evaporator section, adiabatic section, and condenser section data for both the TPTHP and the THP from the experimental measurements. The data were collected with an FR of 50%, inclination angle of 45°, and input power of 200 W. It can be observed that the evaporator section of the TPTHP has a lower average temperature than the THP, and the increase is not as steep as the THP and the time required to reach the maximum temperature is 1.68 min. This is attributed to the faster circulation of the vapor and condensation. The insertion of TP reduced the maximum temperature of the evaporator section during transient operation by 50% for the tested operating conditions. The average transient operation time was around 11 min compared to 17 min for the THP.
The adiabatic section temperature increased gradually to reach steady state conditions without the peak observed in the THP. The results show that the THP temperature was higher by around 10 °C. The temperature evolution in the condenser was gradual for both designs and the discrepancy was very small between them.

3.3. Comparison of Temperature Variation with the Length of the TPTHP and THP

Temperature distribution is one of the main performance parameters used to evaluate the THP [34,35]. As explained in Equation (1), the thermal resistance (Rth) of the THP was calculated from the temperature distribution in the THP.
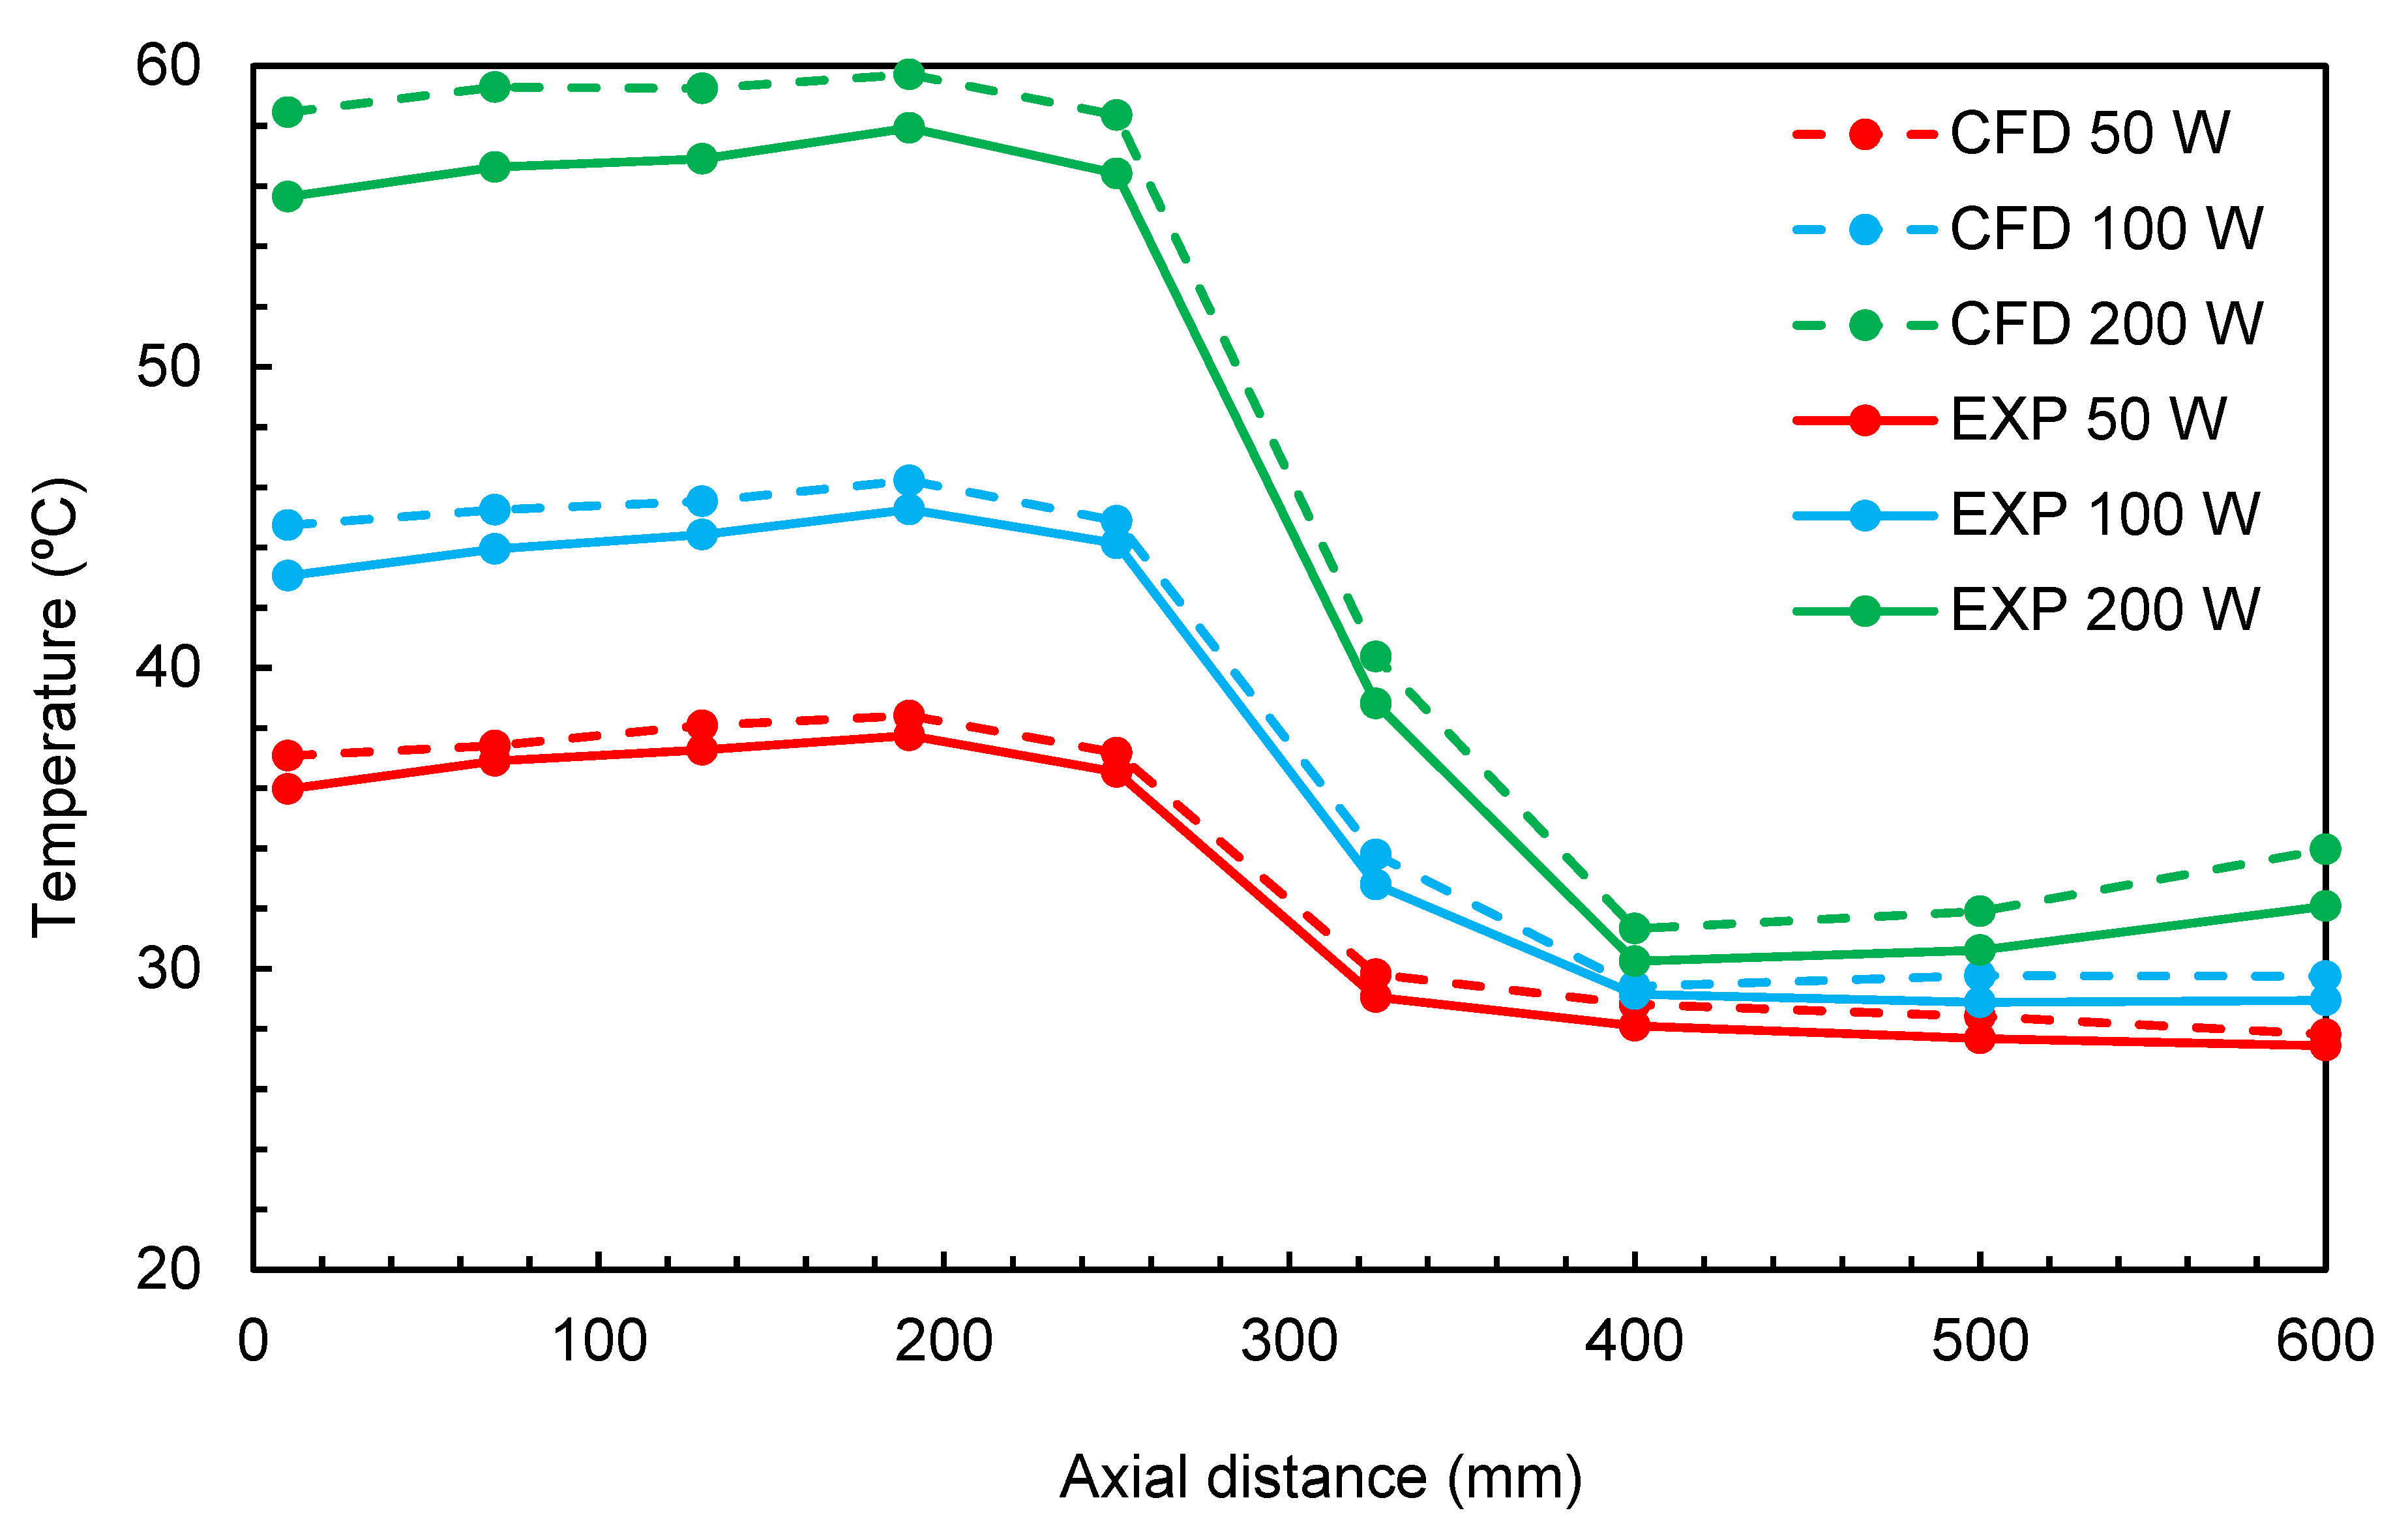
 Figure 8 and Figure 9 present the measured and predicted temperature distribution for two cases with a filling ratio of 50% and inclination angle of 45 °C for the TPTHP and THP. In general, as the supplied power increased, the temperature increased, and this was more pronounced in the evaporator section. The results showed a good agreement between the experimental measurements and CFD prediction.
Figure 10 presents the temperature distribution for the TPTHP and THP designs. It can be observed that the temperature increased by 20 °C in the evaporator and 4.5 °C in the condenser for the THP, while it increased by 16 °C in the evaporator and 6 °C in the condenser when the input energy increased from 50 to 200 W for the same cooling load. By inserting TP, the new design modified the flow streams for both the steam flowing up toward the condenser section and the condensate descending by gravity to the evaporator section. Figure 3b represents the flow patterns that exist due to TP insertion. With this design, no interaction between the two phases occurs and each phase flows separately. The main advantage of this design is that the condensate will reach the evaporator at a lower temperature, and this was confirmed by the experimental and numerical simulation results.

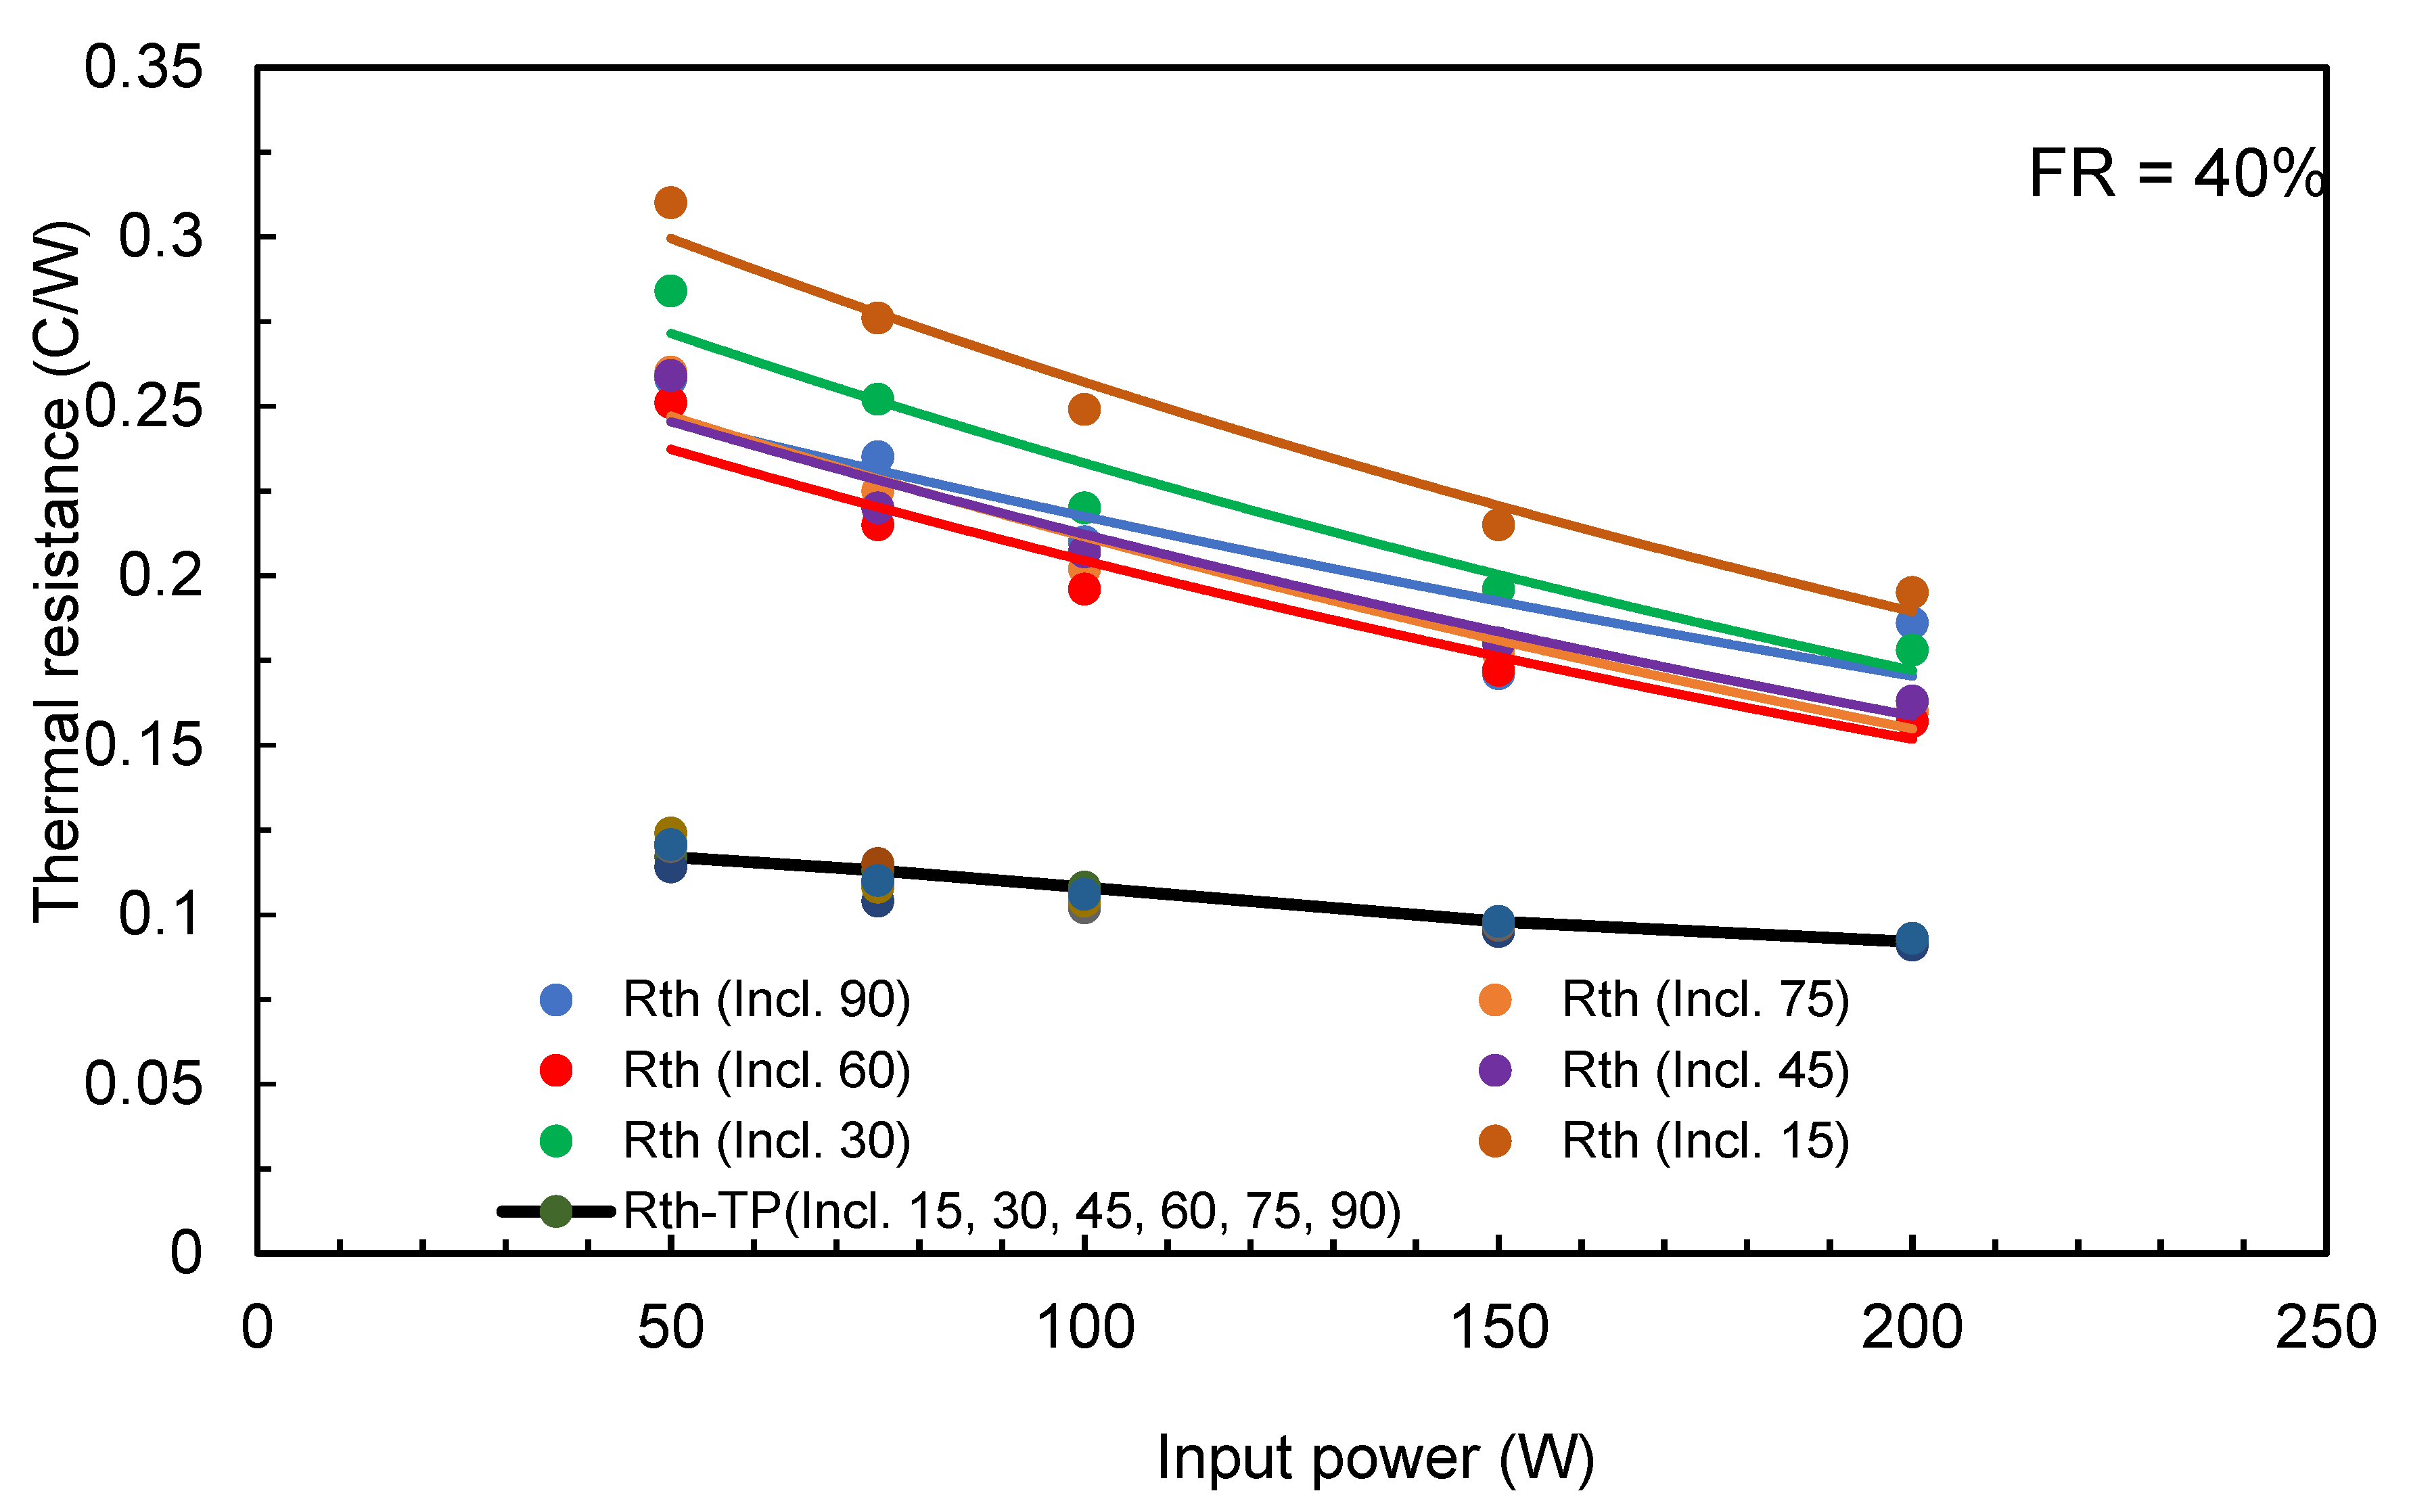
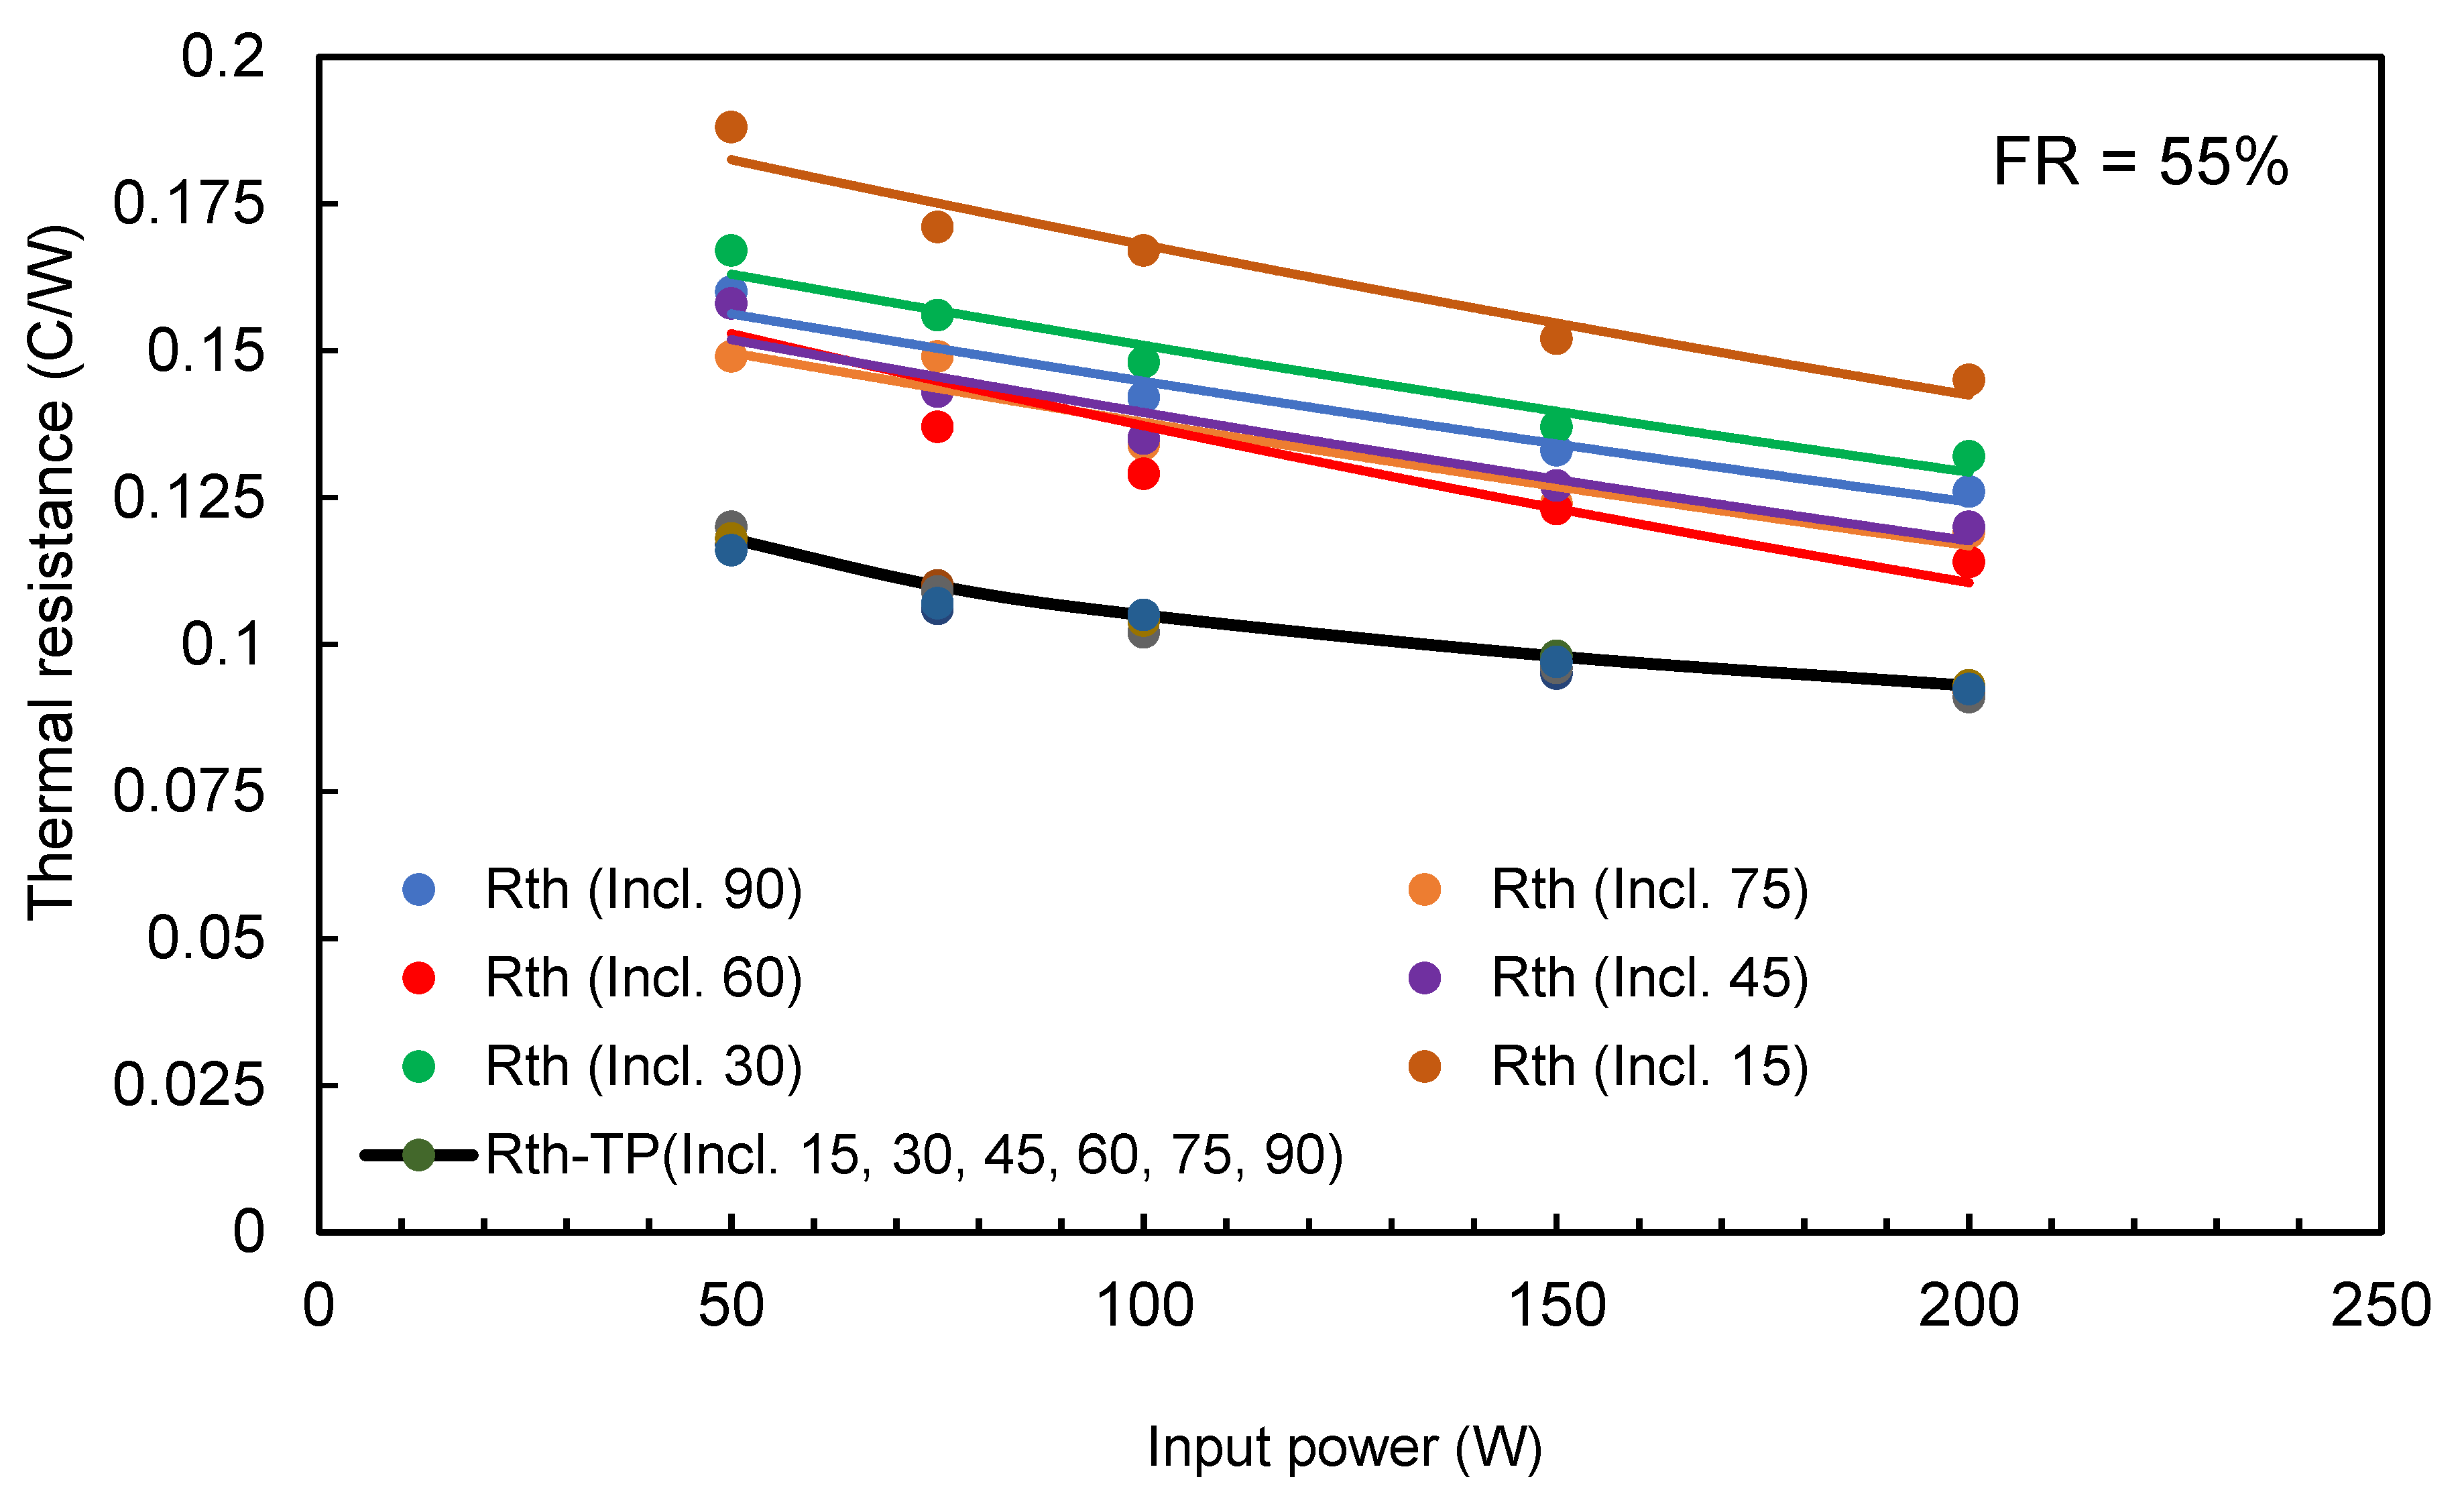
3.4. The Effect of Inclination Angle (α) on Heat Pipe Performance

The inclination angle is another important parameter that affects the THP’s thermal performance.
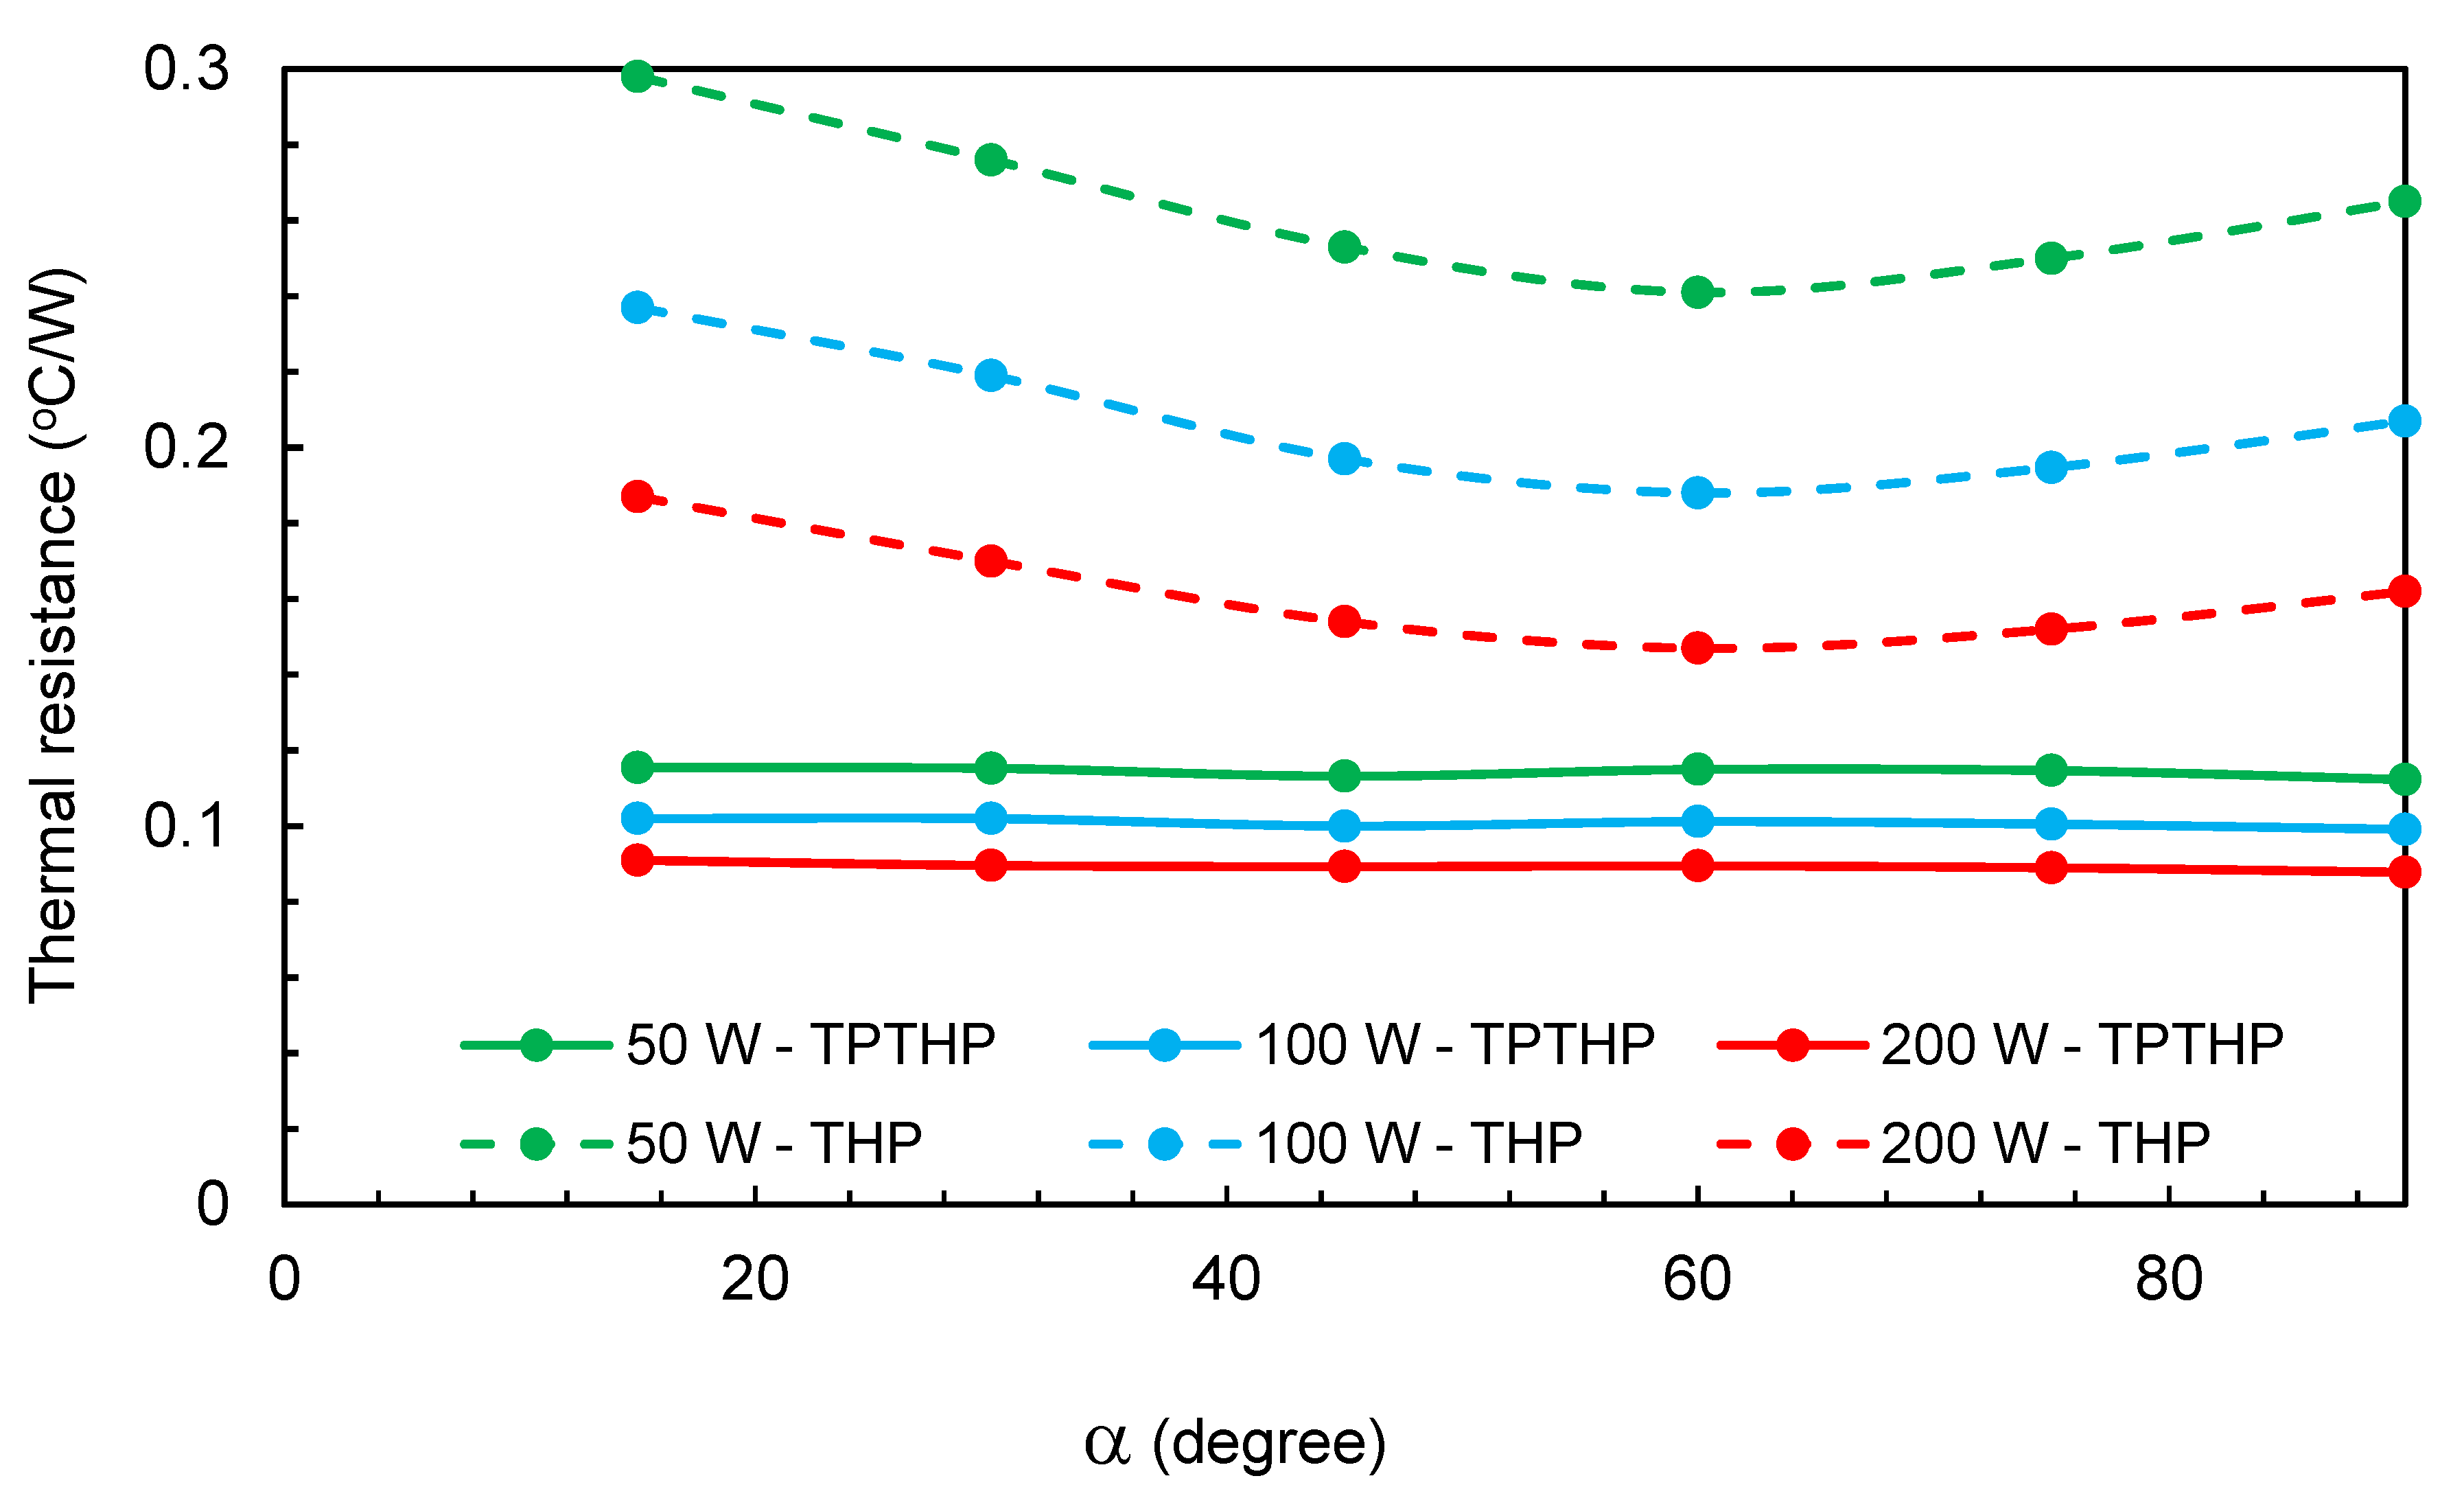
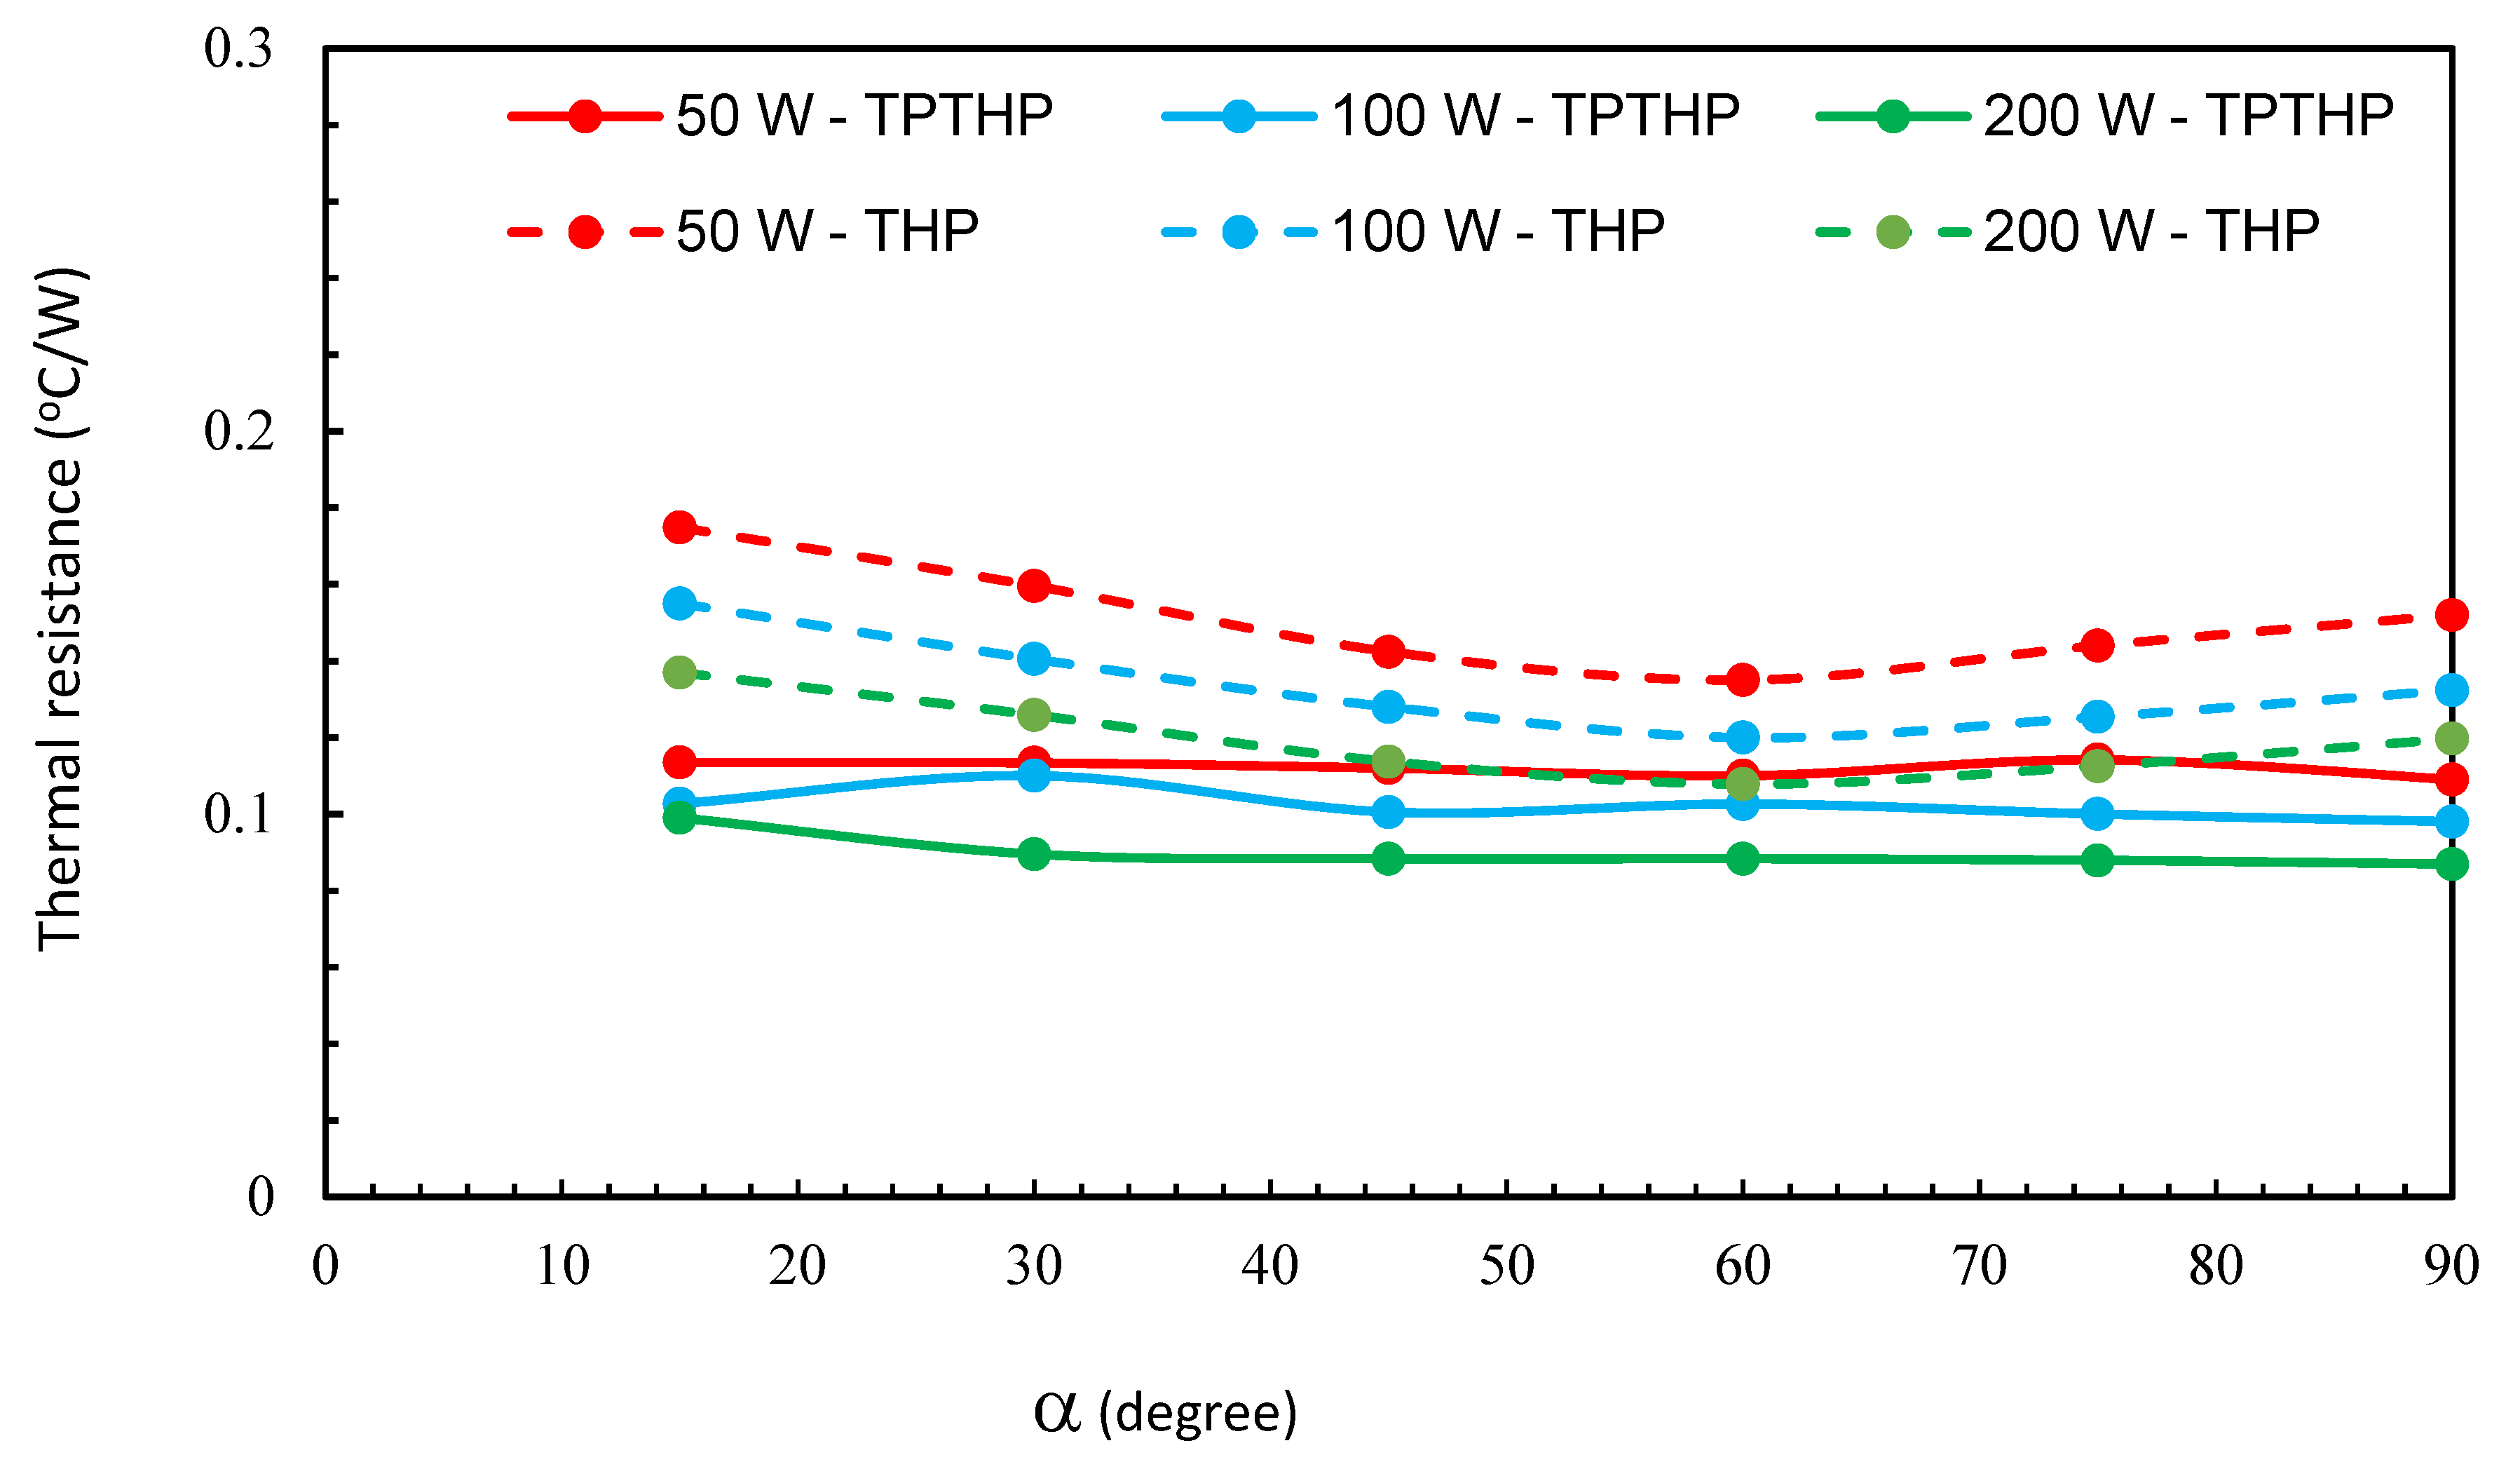
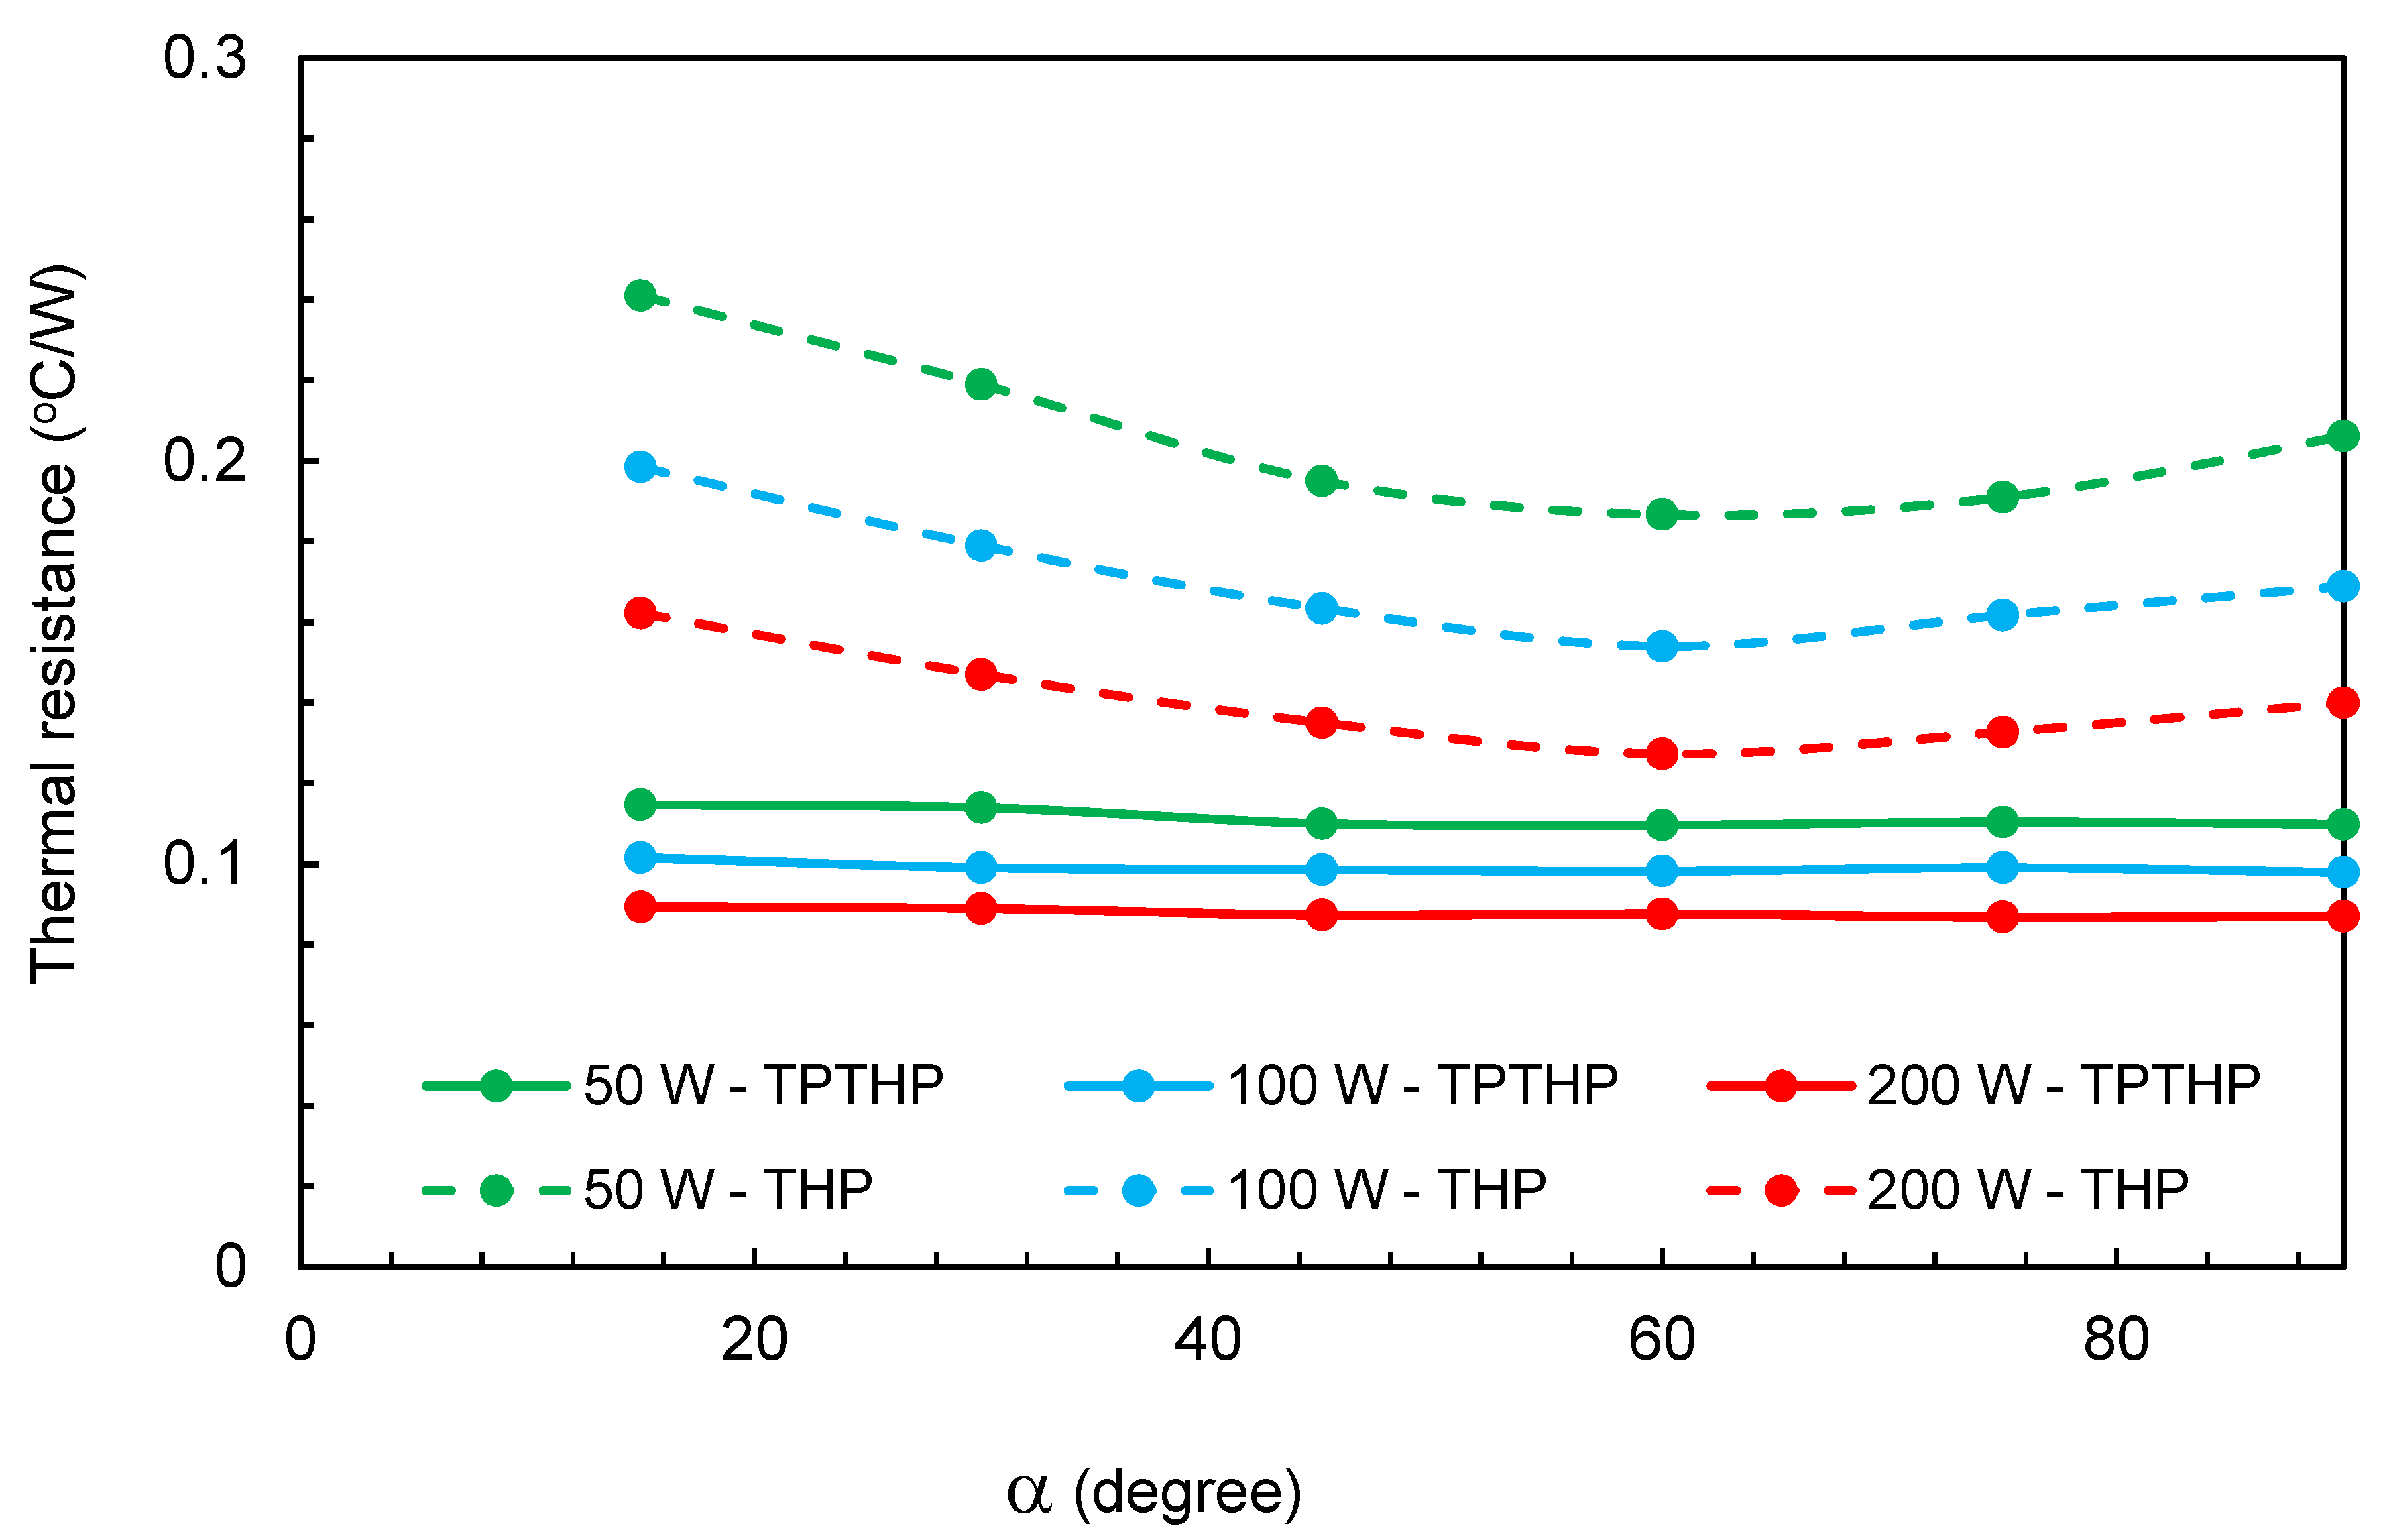
 Figure 11, Figure 12 and Figure 13 present the variation of thermal resistance with inclination angle for three different filling ratios (40%, 55% and 70%) for the TPTHP and THP. It can be observed that the inclination angle and filling ratio has a non-significant effect on the thermal resistance values of the TPTHP for all cases.
For THP cases, the results show that for a constant heat supply, the lowest thermal resistance is obtained at an inclination angle of 60°. This is due to gravity assisting the liquid flow back to the evaporator. The highest thermal resistance corresponds to an inclination angle of 90°, particularly at lower input power, which may be attributed to the presence of a large amount of liquid in the evaporator. The Rth values decreased when the inclination angle increased from 15° to 60° and decreased when the inclination angle went from 90° to 60°.
The main effect of the insertion of TP was the reduction in thermal resistance and the elimination of the effect of the inclination angle and filling ratio.

3.5. Initial Study on Optimization of TP Dimensions and Location

The advantages of insertion of the TP are as follows: (i) All generated steam flows to the upper end of the condenser without any obstruction, i.e., without flooding; (ii) all of the supplied heat can be absorbed by the evaporator to generate more steam, which means that the cooling ability is increased; (iii) the condensation will start at the upper zone of the condenser section, so the condensate temperature will decrease until it reaches the lower zone of the condenser section; (iv) the relatively cold condensate will flow to the lower zone of the evaporator section and cool the liquid pool, so the temperature difference between the hot source and the liquid will be high, improving the heat transfer in spite of the low average temperature of the evaporator.
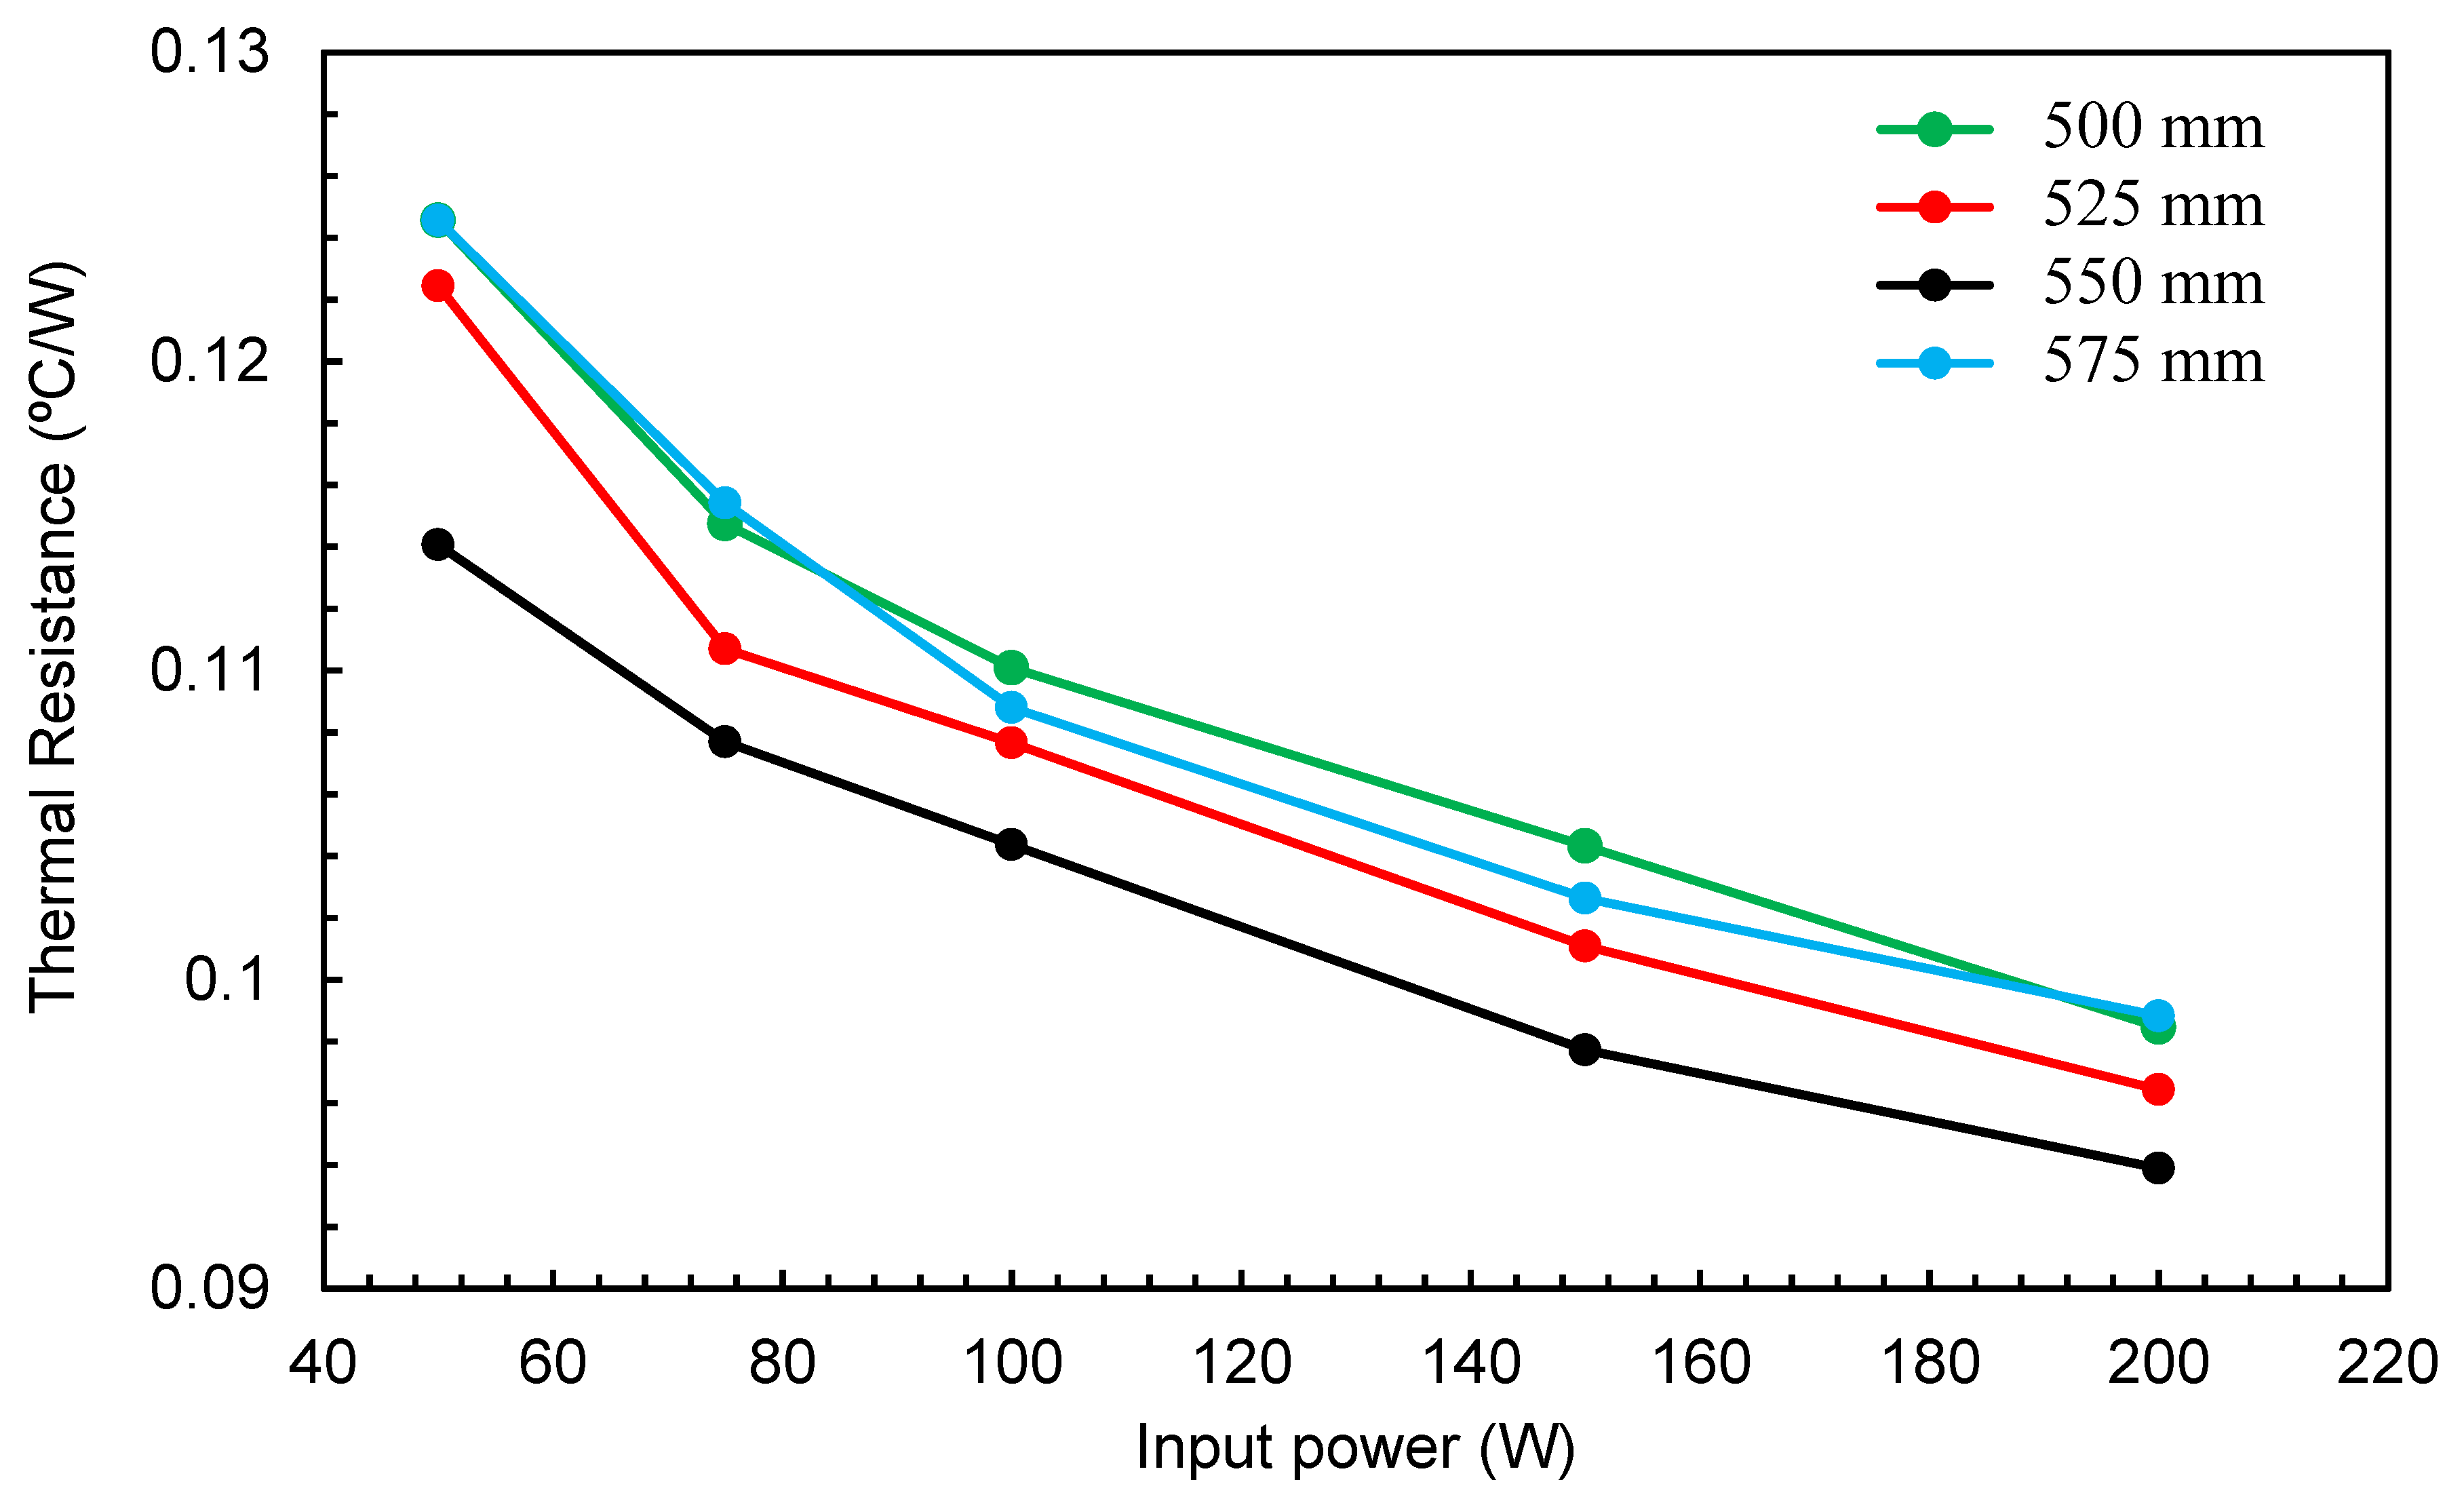
Geometry optimization was carried out using the CFD model to identify the most appropriate dimensions to give the best thermal performance of the TPTHP. The optimization was carried out at constant values of FR (50%) and a vertical inclination (90°), with an input power in the range of 50–200 W. The locations of the riser, central disc and downcomer were measured from the end of the evaporator, which is considered the datum for measured height. The riser tube exit was tested at heights of 500, 525, 550 and 575 mm for the central disc at 250 mm and the downcomer at 25 mm. The elevations tested for the central disk were 250, 275, 300 and 325 mm with the riser exit at 550 mm and downcomer exit at 25 mm. The downcomer tube was tested at heights of 25, 50, 75 and 100 mm with the central disc at 250 mm and riser exit at 550 mm. The effect of the locations of these three parameters on Rth values is plotted in Figure 14, Figure 15 and Figure 16. The results indicated that the lowest Rth was achieved with a riser level of 550 mm, the central disk at 250 mm and the downcomer at 25 mm.
One of the main outcomes of this study was that the new design of the TPTHP with TP gives a high reliability in the working of the THP so that it can be used for different applications because the temperature within the TPTHP is limited to relatively low values. In this work, initial testing of the suggested modification was performed to confirm if this was the case, and we carried out further investigation with different fluids and other conditions are to be tested.
Referring to Figure 3b, the separation of phases was performed and the evaporator was separated from the condenser so that there was no heating of the condensate by the rising steam, resulting in lower temperatures in the evaporator and lower overall temperature yet the same mass could be evaporated for the working fluid.

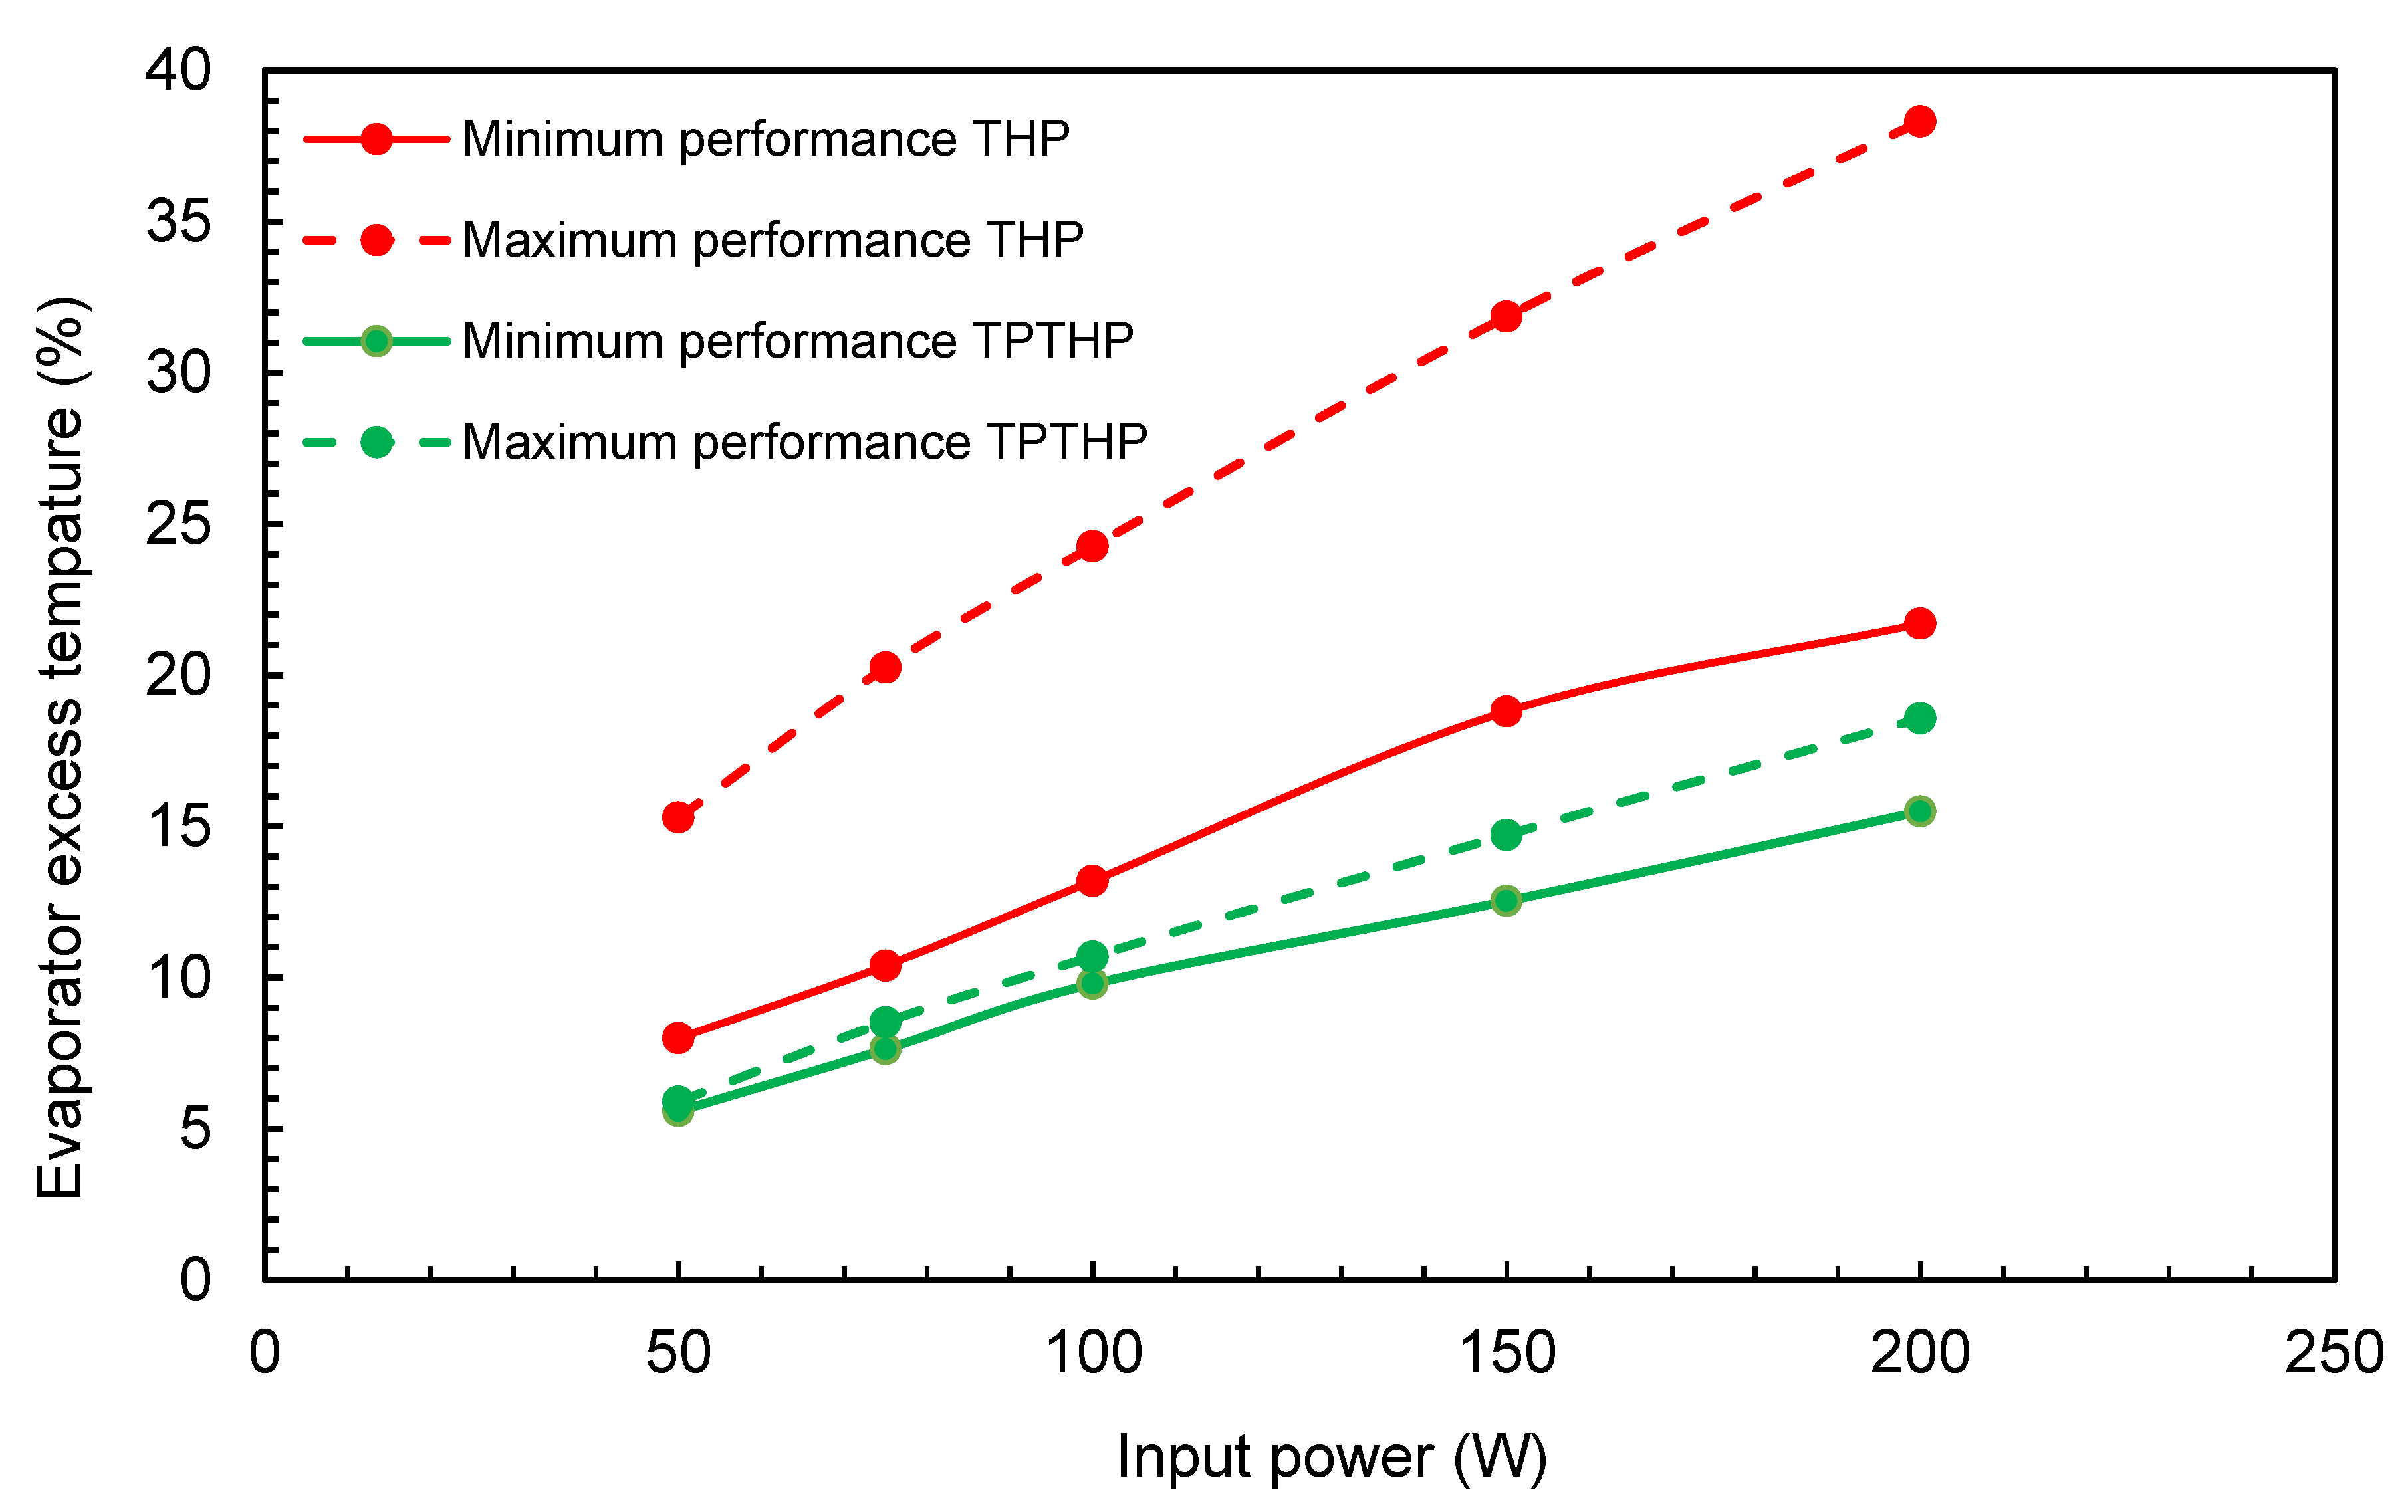
3.6. Evaporator Excess Temperature

Experimental results from the THP and the optimum design of the TPTHP were discussed in Section 3.4 and are shown in Figure 17. It can be observed that the lowest thermal resistance (maximum performance) for both cases occurred at an FR of 55% and an inclination angle of 60°, while the highest thermal resistance (minimum performance) occurred at an FR of 40% and an inclination angle of 15°.
The temperature between the evaporator wall and the saturation temperature of boiling water (estimated from the returning condensate from the condenser) was examined and was within the nucleation regime excess temperature given in the literature [28]. The results showed a lower maximum temperature in the case of the TPTHP design for almost the same condenser temperature (Figure 7). The evaporator operated at a lower temperature difference but generated the equivalent effect, q″α (ΔTe)3.

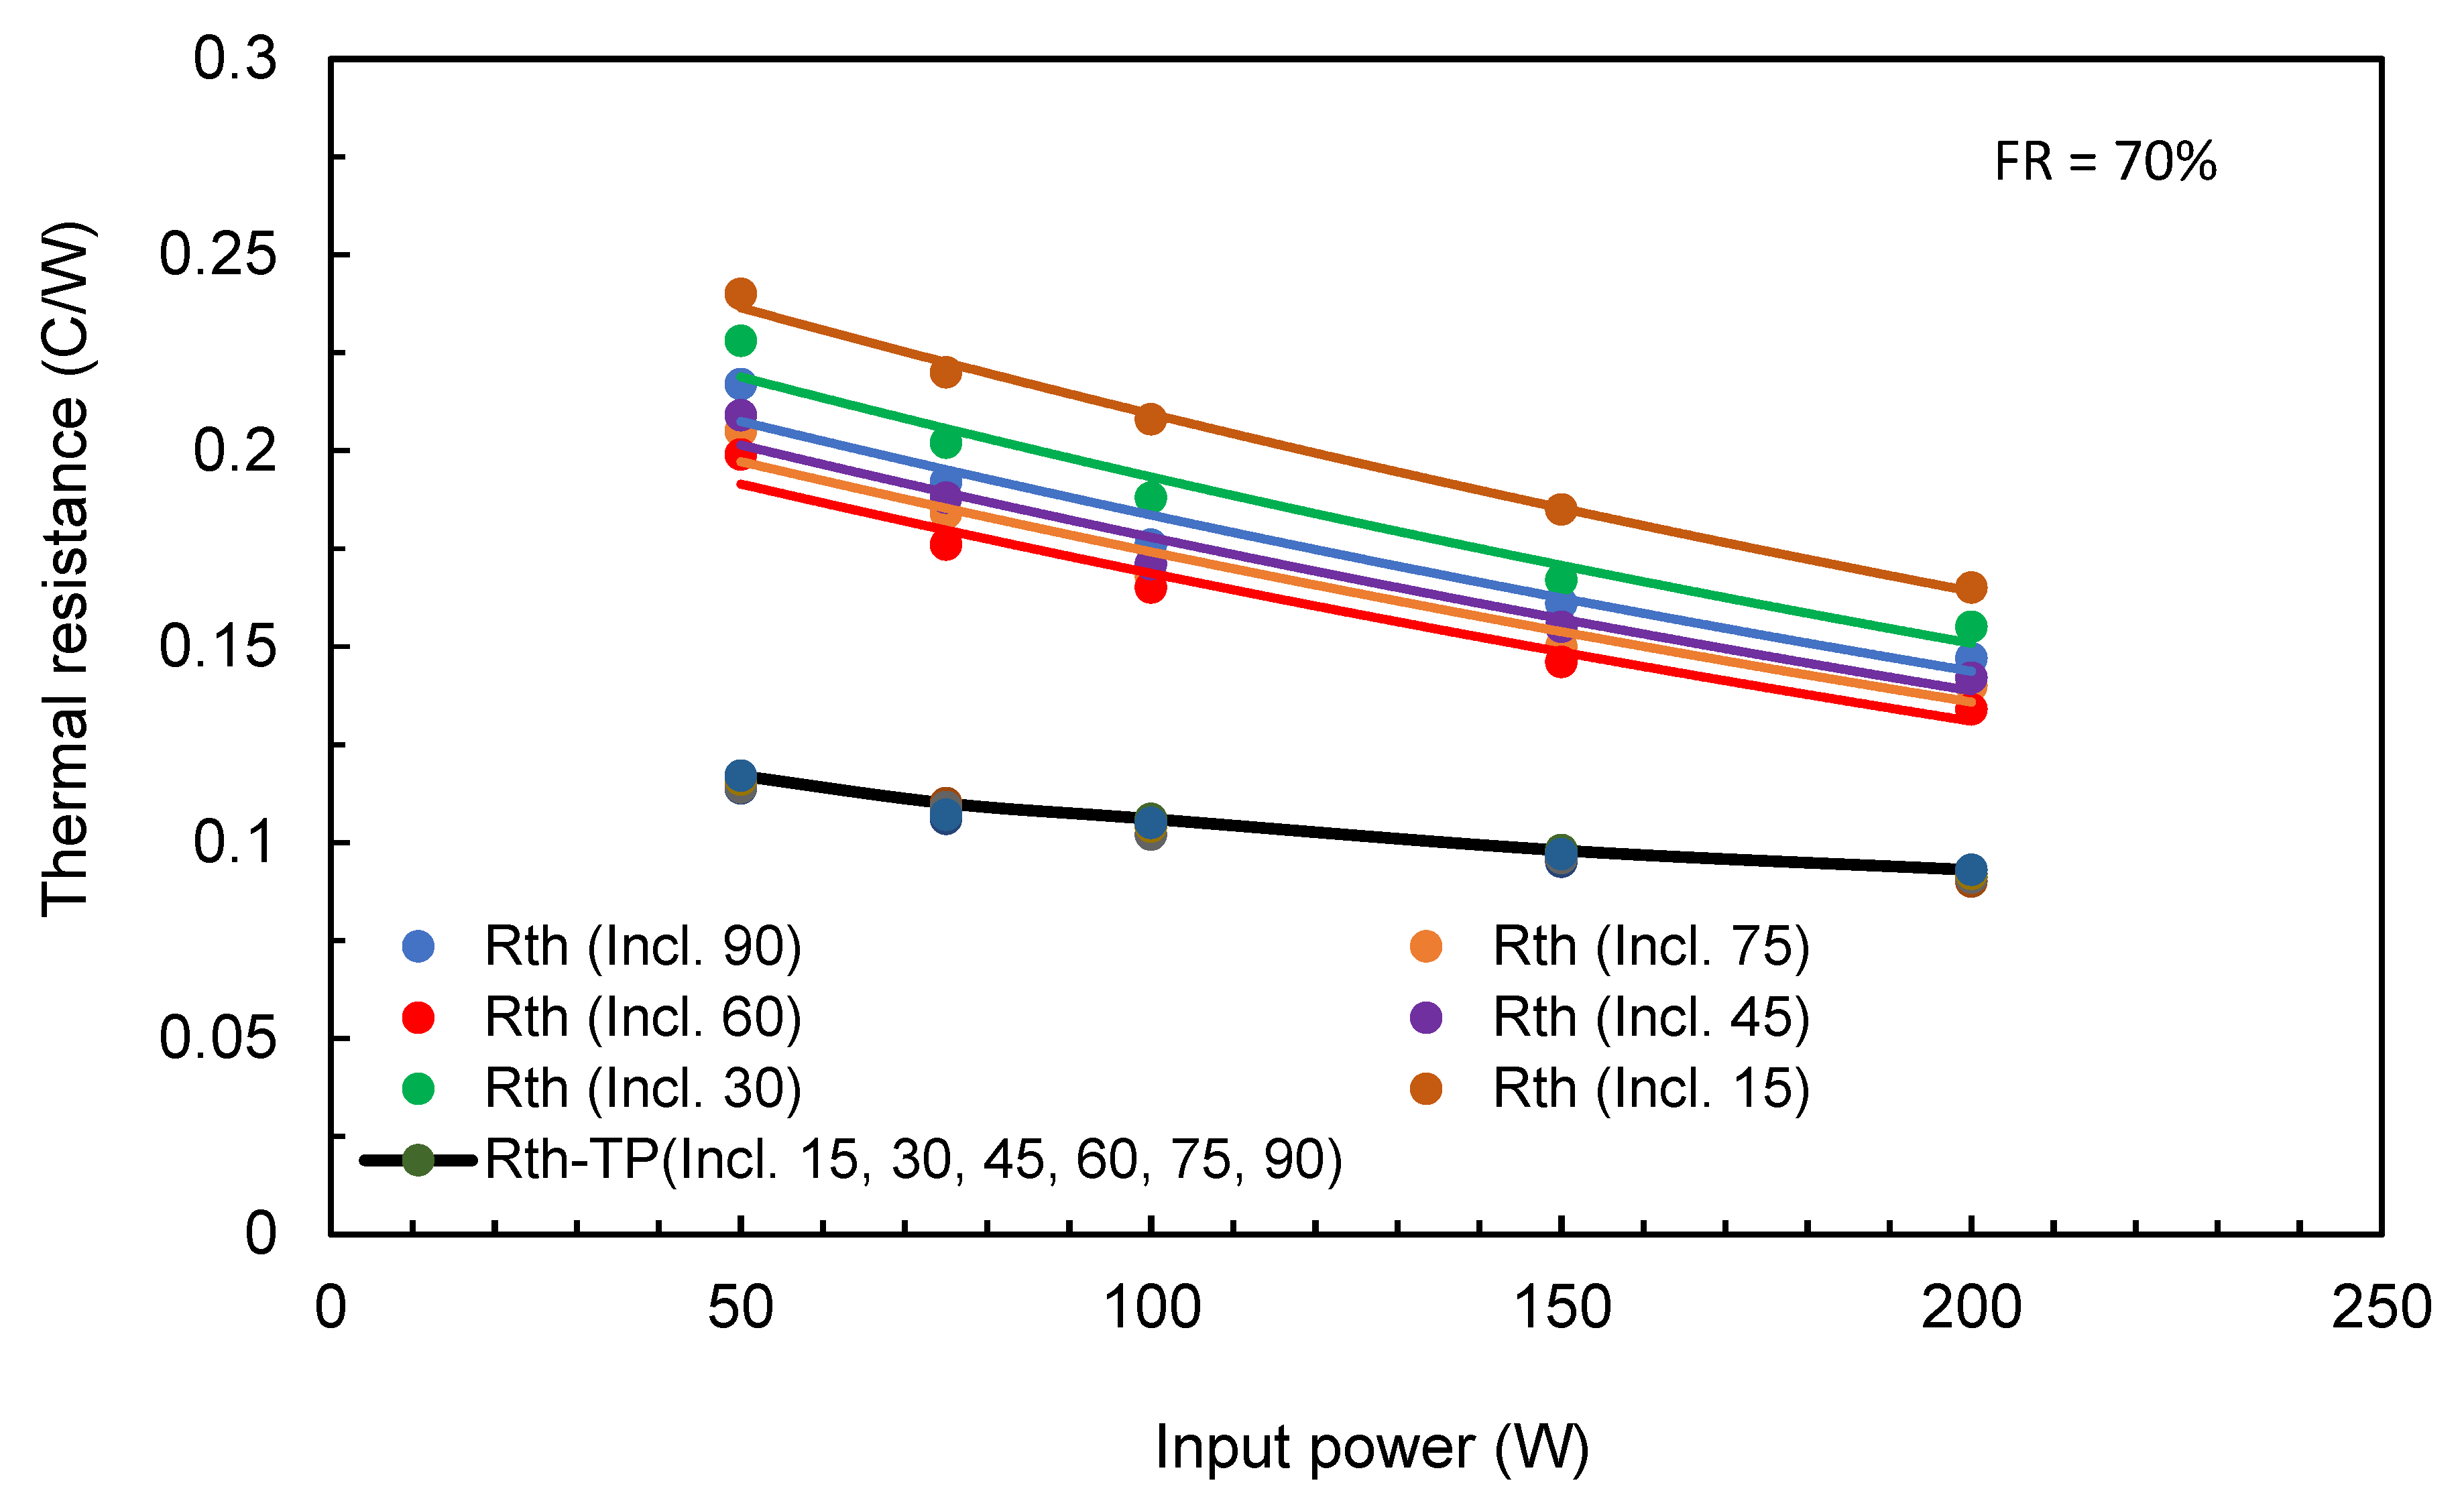
3.7. Empirical Correlation Based on Experimental Data

The data generated from the experimental measurements for both TPTHP and THP were used to calculate the thermal resistance for different FR ratios, inclination angles, and input power.
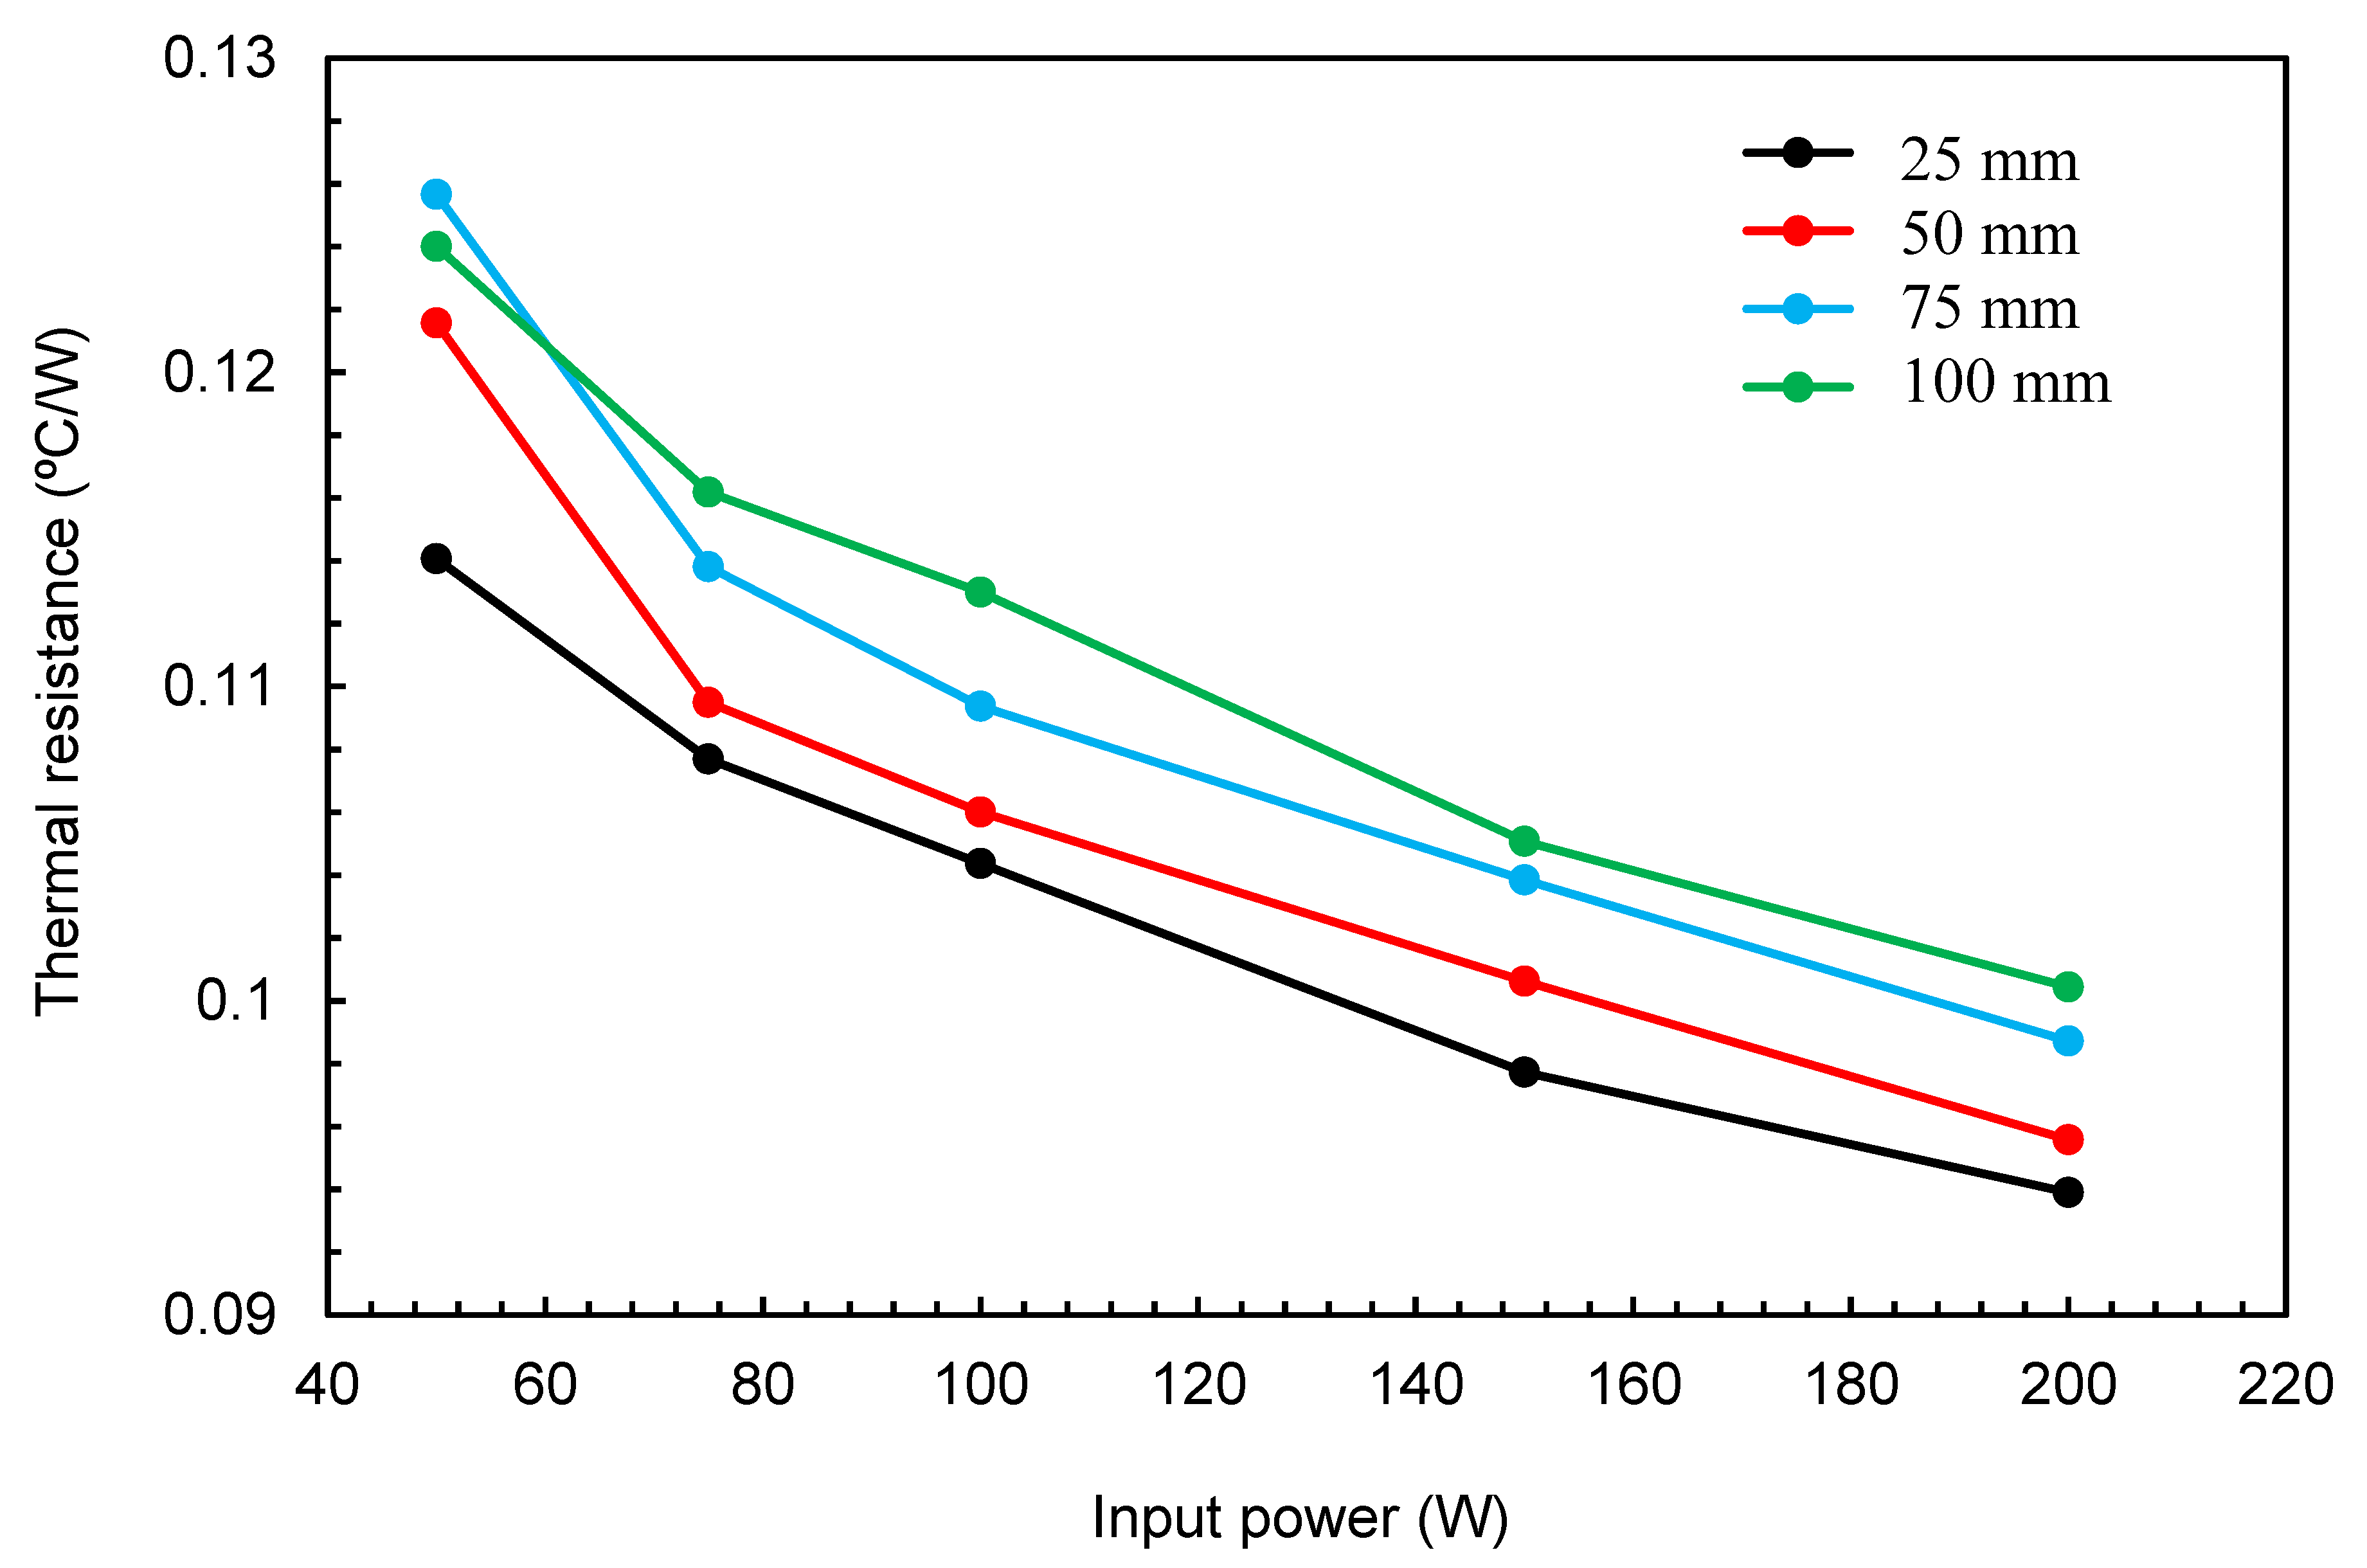
 Figure 18, Figure 19 and Figure 20 present the variation of thermal resistance with input power. It can be observed that the thermal resistance decreased with increasing input power. The results show that the TPTHP were all similar but for the THP there was more variation.
The graphs in Figure 18, Figure 19 and Figure 20 were included in empirical equations to predict the thermal resistance as a function of the inclination angle (α) and input power (IP). For THP, the following formulae can be used for each FR setting:
  • For filling ratio 40%:
Rth = (0.2543 + 0.0008α)e0.003IP
  • For filling ratio 55%:
Rth = (0.1582 + 0.0003α)e0.002IP
  • For filling ratio 70%:
Rth = (0.2661 − 0.0005α)e0.002IP
The results were similar for all filling ratios and inclination angles. However, the results show that the thermal resistance is a function of the input heat. Based on the experimental data from all tested cases for the TPTHP, the following formula for any filling ratio and inclination angle can be used:
Rth = 0.2332 IP−0.175
Figure 21 presents the estimated Rth from Equations (9)–(12).

4. Conclusions

In this study, heat pipe thermal performance was studied experimentally and numerically. TP was inserted into the heat pipe to reduce the interaction and mixing between the upward stream of saturated vapor and the downward stream of saturated condensate. We collected data for transient and steady state operation are collected. The effect of the filling ratio, inclination angle and input power on the temperature and thermal resistance were studied. The quality of the data were confirmed by comparing the experimental values with numerical simulation values. The main conclusions can be summarized as follows:
  • The average transient time for TPTHP is around 65% of the THP transient time;
  • The insertion of TP has a significant effect by reducing the evaporator temperature for the same cooling load. This reduces the thermal resistance and improves the performance of the heat pipe;
  • The inclination angle has no effect on the thermal resistance of the TPTHP. However, it does have an effect on THP, and the optimum inclination angle is 60°;
  • The optimum value for the filling ratio is about 55% for THP. There is no effect of filling ratio (FR) on the TPTHP;
  • The thermal resistance decreases for both TPTHP and THP with higher input power, which improves performance;
  • There was strong agreement between the experimental data and CFD simulation.

Author Contributions

A.A.B.T.: literature review, CFD simulation and experimental data collection, first draft preparation; A.A.A.: literature review, data analysis, editing the first draft, F.A.H.: writing, review and editing. All authors contributed to reviewing and editing the paper after submission to the journal. All authors have read and agreed to the published version of the manuscript.

Funding

This research received no external funding.

Data Availability Statement

Not applicable.

Conflicts of Interest

The authors declare no conflict of interest.

References

  1. Shafieian, A.; Khiadani, M.; Nosrati, A. A review of latest developments, progress, and applications of heat pipe solar collectors. Renew. Sustain. Energy Rev. 2018, 95, 273–304. [Google Scholar] [CrossRef]
  2. Aswath, S.; Naidu, V.H.N.; Padmanathan, P.; Sekhar, Y.R. Multiphase numerical analysis of heat pipe with different working fluids for solar applications. IOP Conf. Ser. Mater. Sci. Eng. 2017, 263, 1–7049. [Google Scholar] [CrossRef]
  3. Chaudhry, H.N.; Hughes, B.R.; Ghani, S.A. A review of heat pipe systems for heat recovery and renewable energy applications. Renew. Sustain. Energy Rev. 2012, 16, 2249–2259. [Google Scholar] [CrossRef]
  4. Zhu, K.; Li, X.; Wang, Y.; Chen, X.; Li, H. Dynamic performance of loop heat pipes for cooling of electronics. Energy Procedia 2017, 142, 4163–4168. [Google Scholar] [CrossRef]
  5. Chougule, N.S.; Jadhav, T.S.; Lele, M.M. A Review on Heat Pipe for Air Conditioning applications. Int. J. Curr. Eng. Technol. 2016, 4, 204–207. [Google Scholar]
  6. Eidan, A.A.; Najim, S.E.; Jalil, J.M. Experimental and numerical investigation of thermosyphone performance in HVAC system applications. Heat Mass Transf. 2016, 52, 2879–2893. [Google Scholar] [CrossRef]
  7. Riehl, R.R. Heat pipes and loop heat pipes acceptance tests for satellites applications. In AIP Conference Proceedings of the Space, Propulsion & Energy Sciences International Forum: SPESIF-2009, Huntsville, AL, USA, 24–26 February 2009; Robertson, G.A., Ed.; American Institute of Physics: College Park, MY, USA, 2009; Volume 1103, pp. 82–90. [Google Scholar]
  8. Vlassov, V.V.; Riehl, R.R. Modeling of a Loop Heat Pipe for Ground and Space Conditions. SAE Tech. Pap. Ser. 2005, 1. [Google Scholar] [CrossRef] [Green Version]
  9. Taamneh, Y. Thermal analysis of gas turbine disk integrated with rotating heat pipes. Case Stud. Therm. Eng. 2017, 10, 335–342. [Google Scholar] [CrossRef]
  10. Sandeep, M.; Abinay, A.; Jamaleswara Kumar, P. Analysis and fabrication of heat pipe and thermosyphon. Int. J. Mech. Eng. Technol. (IJMET) 2017, 8, 160–172. [Google Scholar]
  11. Naresh, Y.; Balaji, C. Experimental investigations of heat transfer from an internally finned two phase closed thermosyphon. Appl. Therm. Eng. 2017, 112, 1658–1666. [Google Scholar] [CrossRef]
  12. Hu, Y.; Huang, K.; Huang, J. A review of boiling heat transfer and heat pipes behaviour with self-rewetting fluids. Int. J. Heat Mass Transf. 2018, 121, 107–118. [Google Scholar] [CrossRef]
  13. Behi, H.; Ghanbarpour, M.; Behi, M. Investigation of PCM-assisted heat pipe for electronic cooling. Appl. Therm. Eng. 2017, 127, 1132–1142. [Google Scholar] [CrossRef]
  14. Kim, Y.; Shin, D.H.; Kim, J.S.; You, S.M.; Lee, J. Effect of sintered microporous coating at the evaporator on the thermal performance of a two-phase closed thermosyphon. Int. J. Heat Mass Transf. 2019, 131, 1064–1074. [Google Scholar] [CrossRef]
  15. Temimy, A.A.B.; Abdulrasool, A.A. Numerical Modelling and Experimental Verification of New Observations of the Two Phases Interaction in a Vertical and Inclined Closed Wickless Heat Pipe. J. Univ. Babylon Eng. Sci. 2019, 27, 345–362. [Google Scholar]
  16. Temimy, A.A.B.; Abdulrasool, A.A. Thermal performance enhancement of a vertical thermosyphon heat pipe by flow control of the two phases. J. Eng. Sustain. Dev. 2021, 25, 109–122. [Google Scholar] [CrossRef]
  17. Nair, R.; Balaji, C. Synergistic analysis of heat transfer characteristics of an internally finned two phase closed thermosyphon. Appl. Therm. Eng. 2016, 101, 720–729. [Google Scholar] [CrossRef]
  18. Solomon, A.B.; Daniel, V.A.; Ramachandran, K.; Pillai, B.C.; Singh, R.R.; Sharifpur, M.; Meyer, J.P. Performance enhancement of a two-phase closed thermosiphon with a thin porous copper coating. Int. Commun. Heat Mass Transf. 2017, 82, 9–19. [Google Scholar] [CrossRef]
  19. Fertahi, S.E.-D.; Bouhal, T.; Agrouaz, Y.; Kousksou, T.; El Rhafiki, T.; Zeraouli, Y. Performance optimization of a two-phase closed thermosyphon through CFD numerical simulations. Appl. Therm. Eng. 2018, 128, 551–563. [Google Scholar] [CrossRef]
  20. Alammar, A.A.; Al-Mousawi, F.N.; Al-Dadah, R.K.; Mahmoud, S.M.; Hood, R. Enhancing thermal performance of a two-phase closed thermosyphon with an internal surface roughness. J. Clean. Prod. 2018, 185, 128–136. [Google Scholar] [CrossRef]
  21. Solomon, A.B.; Roshan, R.; Vincent, W.; Karthikeyan, V.; Asirvatham, G. Heat transfer performance of an anodized two-phase closed thermosyphon with refrigerant as working fluid. Int. J. Heat Mass Transf. 2015, 82, 521–529. [Google Scholar] [CrossRef]
  22. Fadhl, B.; Wrobel, L.; Jouhara, H. CFD modelling of a two-phase closed thermosyphon charged with R134a and R404a. Appl. Therm. Eng. 2015, 78, 482–490. [Google Scholar] [CrossRef] [Green Version]
  23. Lips, S.; Sartre, V.; Lefevre, F.; Khandekar, S.; Bonjour, J. Overview of heat pipe studies during the period 2010–2015. Interfacial Phenom. Heat Transf. 2016, 4, 33–53. [Google Scholar] [CrossRef]
  24. Hung, Y.M.; Seng, Q. Effects of geometric design on thermal performance of star-groove micro-heat pipes. Int. J. Heat Mass Transf. 2011, 54, 1198–1209. [Google Scholar] [CrossRef]
  25. Reay, D.A.; Kew, P.A.; McGlen, R.J. Heat Pipe: Theory, Design and Applications, 6th ed.; Buterworth: Oxford, UK, 2014. [Google Scholar]
  26. Frank, P.; Incropera, D.P.; DeWitt, T.; Bergman, L.; Lavine, A.S. Fundamentals of Heat and Mass Transfer, 6th ed.; John Wiley & Sons: Hoboken, NJ, USA, 2006. [Google Scholar]
  27. ANSYS Fluent User Guide. 2020. Available online: http://www.ansys.com/Industries/Academic/Tools/Citations (accessed on 5 June 2021).
  28. Jouhara, H.; Fadhl, B.; Wrobel, L.C. Three-dimensional CFD simulation of geyser boiling in a two-phase closed thermosyphon. Int. J. Hydrogen Energy 2016, 41, 16463–16476. [Google Scholar] [CrossRef] [Green Version]
  29. Imura, H.; Sasaguchi, K.; Kozai, H.; Numata, S. Critical heat flux in a closed two-phase thermosyphon. Int. J. Heat Mass Transf. 1983, 26, 1181–1188. [Google Scholar] [CrossRef]
  30. Noie, S. Heat transfer characteristics of a two-phase closed thermosyphon. Appl. Therm. Eng. 2005, 25, 495–506. [Google Scholar] [CrossRef]
  31. Nemec, P.; Čaja, A.; Malcho, M. Mathematical model for heat transfer limitations of heat pipe. Math. Comput. Model. 2013, 57, 126–136. [Google Scholar] [CrossRef]
  32. Melnyk, R.; Nikolaenko, Y.; Alekseik, Y.S.; Kravets, V.Y. Heat transfer limitations of heat pipes for a cooling systems of electronic components. In Proceedings of the 2017 IEEE First Ukraine Conference on Electrical and Computer Engineering (UKRCON), Kyiv, Ukraine, 29 May–2 June 2017; pp. 692–695. [Google Scholar]
  33. Mahdavi, M.; Tiari, S.; De Schampheleire, S.; Qiu, S. Experimental study of the thermal characteristics of a heat pipe. Exp. Therm. Fluid Sci. 2018, 93, 292–304. [Google Scholar] [CrossRef]
  34. Ziapour, B.M.; Shaker, H. Heat transfer characteristics of a two-phase closed thermosyphon using different working fluids. Heat Mass Transf. 2010, 46, 307–314. [Google Scholar] [CrossRef]
  35. Ong, K.-S.; Lim, C. Performance of water filled thermosyphons between 30–150 °C. Front. Heat Pipes 2015, 6. [Google Scholar] [CrossRef] [Green Version]
Figure 1. (a) Schematic diagram of the test rig (THP without TP). (b) THP model geometry and dimensions (THP without TP).
Fluids 06 00231 g001
Figure 2. The evaporator heating system: (A) The evaporator section with the heaters. (B) Application of thermal clay between the heaters. (C) Application of thermal insulation glass wool and tape.
Fluids 06 00231 g002
Figure 3. (a) Schematic diagram of new design with (TP); and (b) the new design of the TPTHP (with TP).
Fluids 06 00231 g003
Figure 4. Thermocouple locations on the axis of both the THP and TPTHP.
Fluids 06 00231 g004
Figure 5. (I) Velocity vectors at longitudinal section of the vertical THP for operating conditions of (FR 50%, 100 W); (II) velocity vectors at longitudinal section of the vertical THP for operating conditions of (FR 55%, 100 W); (III) temperature distribution contours at the longitudinal section of the (A) THP ((FR 50% and 200 W) and (B) TPTHP (FR 50% and 200 W).
Fluids 06 00231 g005
Figure 6. The evolution of temperatures of transient heat transfer for the THP (filling ratio = 50%, inclination angle = 45° and input power = 200 W).
Fluids 06 00231 g006
Figure 7. Comparison of experimental transient temperatures evolution of the TPTHP and THP (filling ratio = 50%, inclination angle = 45°, and input power = 200 W).
Fluids 06 00231 g007
Figure 8. Temperature variation with length of the THP (FR = 50%, inclination angle = 45 °C).
Fluids 06 00231 g008
Figure 9. Temperature variation with length of the TPTHP (FR = 50%, inclination angle = 45 °C).
Fluids 06 00231 g009
Figure 10. Comparison of temperature variation with length of both the TPTHP and THP (FR = 50%, inclination angle = 45 °C).
Fluids 06 00231 g010
Figure 11. Thermal resistance variation with inclination angle for the TPTHP and THP (FR = 40%).
Fluids 06 00231 g011
Figure 12. The variation of thermal resistance with inclination angle for the TPTHP and THP (FR = 55%).
Fluids 06 00231 g012
Figure 13. The variation of thermal resistance with inclination angle for the TPTHP and THP (FR = 70%).
Fluids 06 00231 g013
Figure 14. The effect of the riser level on thermal resistance (central disc height = 250 mm, downcomer exit = 25 mm, FR = 50%, inclination angle = 90°).
Fluids 06 00231 g014
Figure 15. The effect of the central disk level on thermal resistance. (riser height = 550 mm, downcomer exit = 25 mm, FR = 50%, inclination angle = 90°).
Fluids 06 00231 g015
Figure 16. The effect of the downcomer level on thermal resistance. (riser height = 550 mm, downcomer exit = 25 mm, FR = 50%, inclination angle = 90°).
Fluids 06 00231 g016
Figure 17. The evaporator excess temperature for the optimum dimensions of TPTHP and THP.
Fluids 06 00231 g017
Figure 18. Variation of thermal resistance with input power for different inclination angles with and without TP (FR = 40%).
Fluids 06 00231 g018
Figure 19. Variation of thermal resistance with input power for different inclination angles with and without TP (FR = 55%).
Fluids 06 00231 g019
Figure 20. Variation of thermal resistance with input power for different inclination angles with and without TP (FR = 55%).
Fluids 06 00231 g020
Figure 21. Variation of thermal resistance from correlations with input power for different inclination angles with and without TP (FR = 40%, 55%, and 70%).
Fluids 06 00231 g021
Table 1. THP geometry and operating conditions.
(a) THP MaterialCopper
(b) Working fluidWater
(c) Heat Pipe OD/ID19.05 mm/17.4 mm
(d) Length600 mm (Evaporator: 250 mm, Adiabatic:150 mm, Condenser: 200 mm)
(e) Condenser water Jacket OD/ID50 mm/19.05 mm (length = 200 mm)
(f) power supply at the evaporator surface50, 75, 100, 150, 200 W
(g) Inclination angle15°, 30°, 45°, 60°, 75°, 90° from the horizontal
(h) Cooling water flow rate0.00005 m3/s
(i) Cooling water inlet temperature25 °C
(j) Filling ratio40% (23 mL), 50% (29.7 mL), 60% (35.7 mL), 70% (41.6 mL) (of evaporator volume)
Table 2. The initial conditions, boundary conditions and convergence criteria.
Cell zone conditions
  • (Divided into two zones)
  • Pressure: 4000 pa
  • Op. Temp.: 25 °C
  • Cooling Water
  • Pressure: 101,325 pa
  • Op. Temp.: 25 °C
  • Cooling Water inlet
  • Flowrate: 3 L/min
  • Temp.: 25 °C
Solution
  • Methods
  • Pressure-Velocity Coupling Scheme: Coupled
  • Gradient: Least Squares Cell Based
  • Pressure: SIMPLE
  • Momentum: Second Order Upwind
  • Volume Fraction: Compressive
  • Energy: Second Order Upwind
  • Transient Formulation: First Order Implicit
Monitor
  • Convergence
  • Convergence Criterion: Absolute
  • Energy: 1 × 10⁻⁶
  • Continuity: 1 × 10⁻³
  • x-velocity: 1 × 10⁻³
  • y-velocity: 1 × 10⁻³
  • z-velocity: 1 × 10⁻³
Publisher’s Note: MDPI stays neutral with regard to jurisdictional claims in published maps and institutional affiliations.

