Article

Klinkenberg-Corrected and Water Permeability Correlation for a Sarawak Carbonate Field

Department of Petroleum Engineering, Universiti Teknologi PETRONAS, Persiaran UTP, Seri Iskandar 32610, Perak, Malaysia
*
Author to whom correspondence should be addressed.
Fluids 2021, 6(10), 339; https://doi.org/10.3390/fluids6100339
Submission received: 15 July 2021 / Revised: 30 August 2021 / Accepted: 31 August 2021 / Published: 27 September 2021
(This article belongs to the Special Issue Multiphase Flow in Pipes with and without Porous Media)

Abstract

:
Klinkenberg-corrected permeability (k) or water permeability (kw) is an important input parameter for hydrocarbon reservoir simulation studies. The theoretical concept that a core sample’s k is comparable to its kw is flawed and has to be verified, since experimental evidence indicates that k and kw are clearly different. Thus, a series of gas and water permeability measurements were conducted on eight carbonate core plug samples from Sarawak, Malaysia to develop a correlation between both permeability values. The new k vs. kw correlation clearly proved the differences between both permeability values for all samples. The findings were in agreement with FESEM-EDX and total suspended solids (TSS) analysis, which proved the migration of fines and clay particles that blocked the pore throats, thus reducing kw values. The new k vs. kw correlation was validated using four different samples from the PETRONS-2 well using its k values and comparing them with the respective measured kw values. The new correlation will reduce the amount of time and cost needed to obtain absolute liquid permeability values but may be further improved by conducting permeability measurements on more samples from the PETRONS field, which will improve the accuracy of hydrocarbon reservoir simulation of the PETRONS field.

1. Introduction

Absolute liquid permeability value is an important parameter for conducting dynamic reservoir simulation for any oil and gas reservoir. Industrial practice is to use either Klinkenberg-corrected permeability or water permeability as an absolute liquid permeability value [1,2]. Theoretically, Klinkenberg-corrected permeability and water permeability of a sample should be similar; however, experimental work shows clear differences between Klinkenberg-corrected permeability and water permeability values.
Measured gas permeability is subjected to gas slippage effect, also known as Klinkenberg effect, which can result in overestimation of gas permeability value. This theory was first established by L. Klinkenberg et al. [3]. Later, M. Muskat et al. [4] observed significant differences in permeability values between air and water [5]. Thus, L. Klinkenberg [3] defined that Klinkenberg effect occurs when the mean free path of gas molecules in any porous media approaches the pore dimension. This phenomenon will lead to more frequent collision between gas molecules and the pore wall than the collisions between gas molecules, which reduces viscous drag, thus enhancing gas slip flow and increasing the gas permeability values [2,6,7,8]. As a result, gas permeability must be corrected to Klinkenberg-corrected permeability after applying infinite differential pore pressure [7]. Since at infinite differential pore pressure, gas flows as a liquid-like fluid, theoretically Klinkenberg-corrected permeability of a core sample must be similar to its water permeability value. This observation is supported by [5,7,9,10], which state that the permeability of a sample should be independent of its pore fluid. However, experimental results have shown that Klinkenberg-corrected permeability and its respective water permeability values show significant differences. These observations are in close agreement with previous studies [1,7,9,10,11,12,13,14,15,16,17,18]. Due to these discrepancies, significant amounts of time and cost have been spent on measuring both permeability values to obtain an absolute liquid permeability value. Thus, by developing a correlation between Klinkenberg-corrected permeability and water permeability for specific regions, the amount of time and cost spent on obtaining absolute liquid permeability values will be reduced by using the developed correlation.
Based on previous research, there are a wide range of factors influencing the water permeability value of core samples such as clay swelling, rehydration of unreacted minerals, dissolution/precipitation of matrix, fines migration and also water adhesion to the smallest pores of the matrix [7,9,14,19,20,21]. B. Kanimozhi et al. [22] reported that fines migration is becoming a serious problem in carbonate reservoirs and disturbing the well productivity of affected reservoirs. Although fine particles are usually observed in sandstone reservoirs, there are specific carbonate reservoirs that have reported the presence of fine particles. Thus, carbonate rocks are also susceptible to water permeability reduction caused by fine migration and plugging, reactive flows and geochemical reactions and alterations [23].
Similar studies [10,14,16,18] have argued that the inaccessibility of water to flow through micro-pores and micro-cracks compared to inert gases caused the difference between Klinkenberg-corrected and water permeability. The ability of inert gases to flow through the double network system (matrix + naturally induced fractures) will cause the gas to cover more area of the pore system to have a higher permeability value [10,16]. Water, in turn, will chemically react with clay particles in the core samples, which will form layers of clay-bound water film on the pore throat and micro-crack surfaces that will reduce the effective radius of these pore systems and cause inaccessibility of water to flow through the micro-pores and micro-cracks [10,18]. However, other researchers [14,16] have argued that the values of water permeability were still lower than Klinkenberg-corrected permeability of samples that contains less than 0.1% clay particles. M. Chen et al. [14] also stated that the difference between Klinkenberg-corrected and water permeability values of their samples were not due to clay–water reaction but rather it was due to the steady-state flow that formed thin water films around the grain matrix through fluid storage and mechanical coupling. Moreover, the presence of water films at high curvature contact points, inter-grain separations, and the grain surfaces were also proved. This observation is also supported by M. Heap et al. [16], which stated that the tortuous, kinked nature of the samples and the rough nature of the micro-cracks will allow adsorption of water, which will reduce water permeability values. It was also demonstrated that the adsorbed water molecules do not have to block the entire length of a micro-crack, but only a small part, for instance, a rough-walled section or at a tight bend that will hinder the flow of water and result in a water permeability reduction.
A number of studies have been conducted previously [1,7,9,10,11,12,13,14,15,16,17,18] regarding the relationship between Klinkenberg-corrected and water permeability values, however most of the studies were based on sandstone formations and also very few selective carbonate formations such as Shiuaba carbonate formation in Oman [1], Zelatowa dolomite formation in Poland [10] and selected unnamed carbonates [15]. The correlation established based on sandstone samples cannot be applied on carbonate formations due to the complexity and uncertainty of pore geometry that ranges from big and interconnected pore systems to micro pore structures that only contain intra granular pores or even irregular pore systems such as vugs and pore spaces created from grain dissolution [1,10,24].

Field Geological Background

PETRONS gas field is located offshore in Sarawak, Malaysia and contains prolific quantities of gas reserves. Based on the report of on the PETRONS-1 well [25], the depositional environment was interpreted to be predominantly shallow platform, back reef to reef flat below 1635.5 m (Middle of Core 3) with slight deepening up to Core 2 and Core 1. The relative abundance of coral fragments below 1635.5 m is taken to indicate general reef proximity. Abundant coral fragments may represent an original patch reef environment and describes the environment as broken reef or reef flat. Wackestones and packstones/wackestones with local red algal/foram rhodoliths represent a transition to back reef lagoonal environments. Clews et al. [25] reported that above 1635.5 m, the depositional environment becomes progressively deeper with increasing abundance of deep water forams and sporadic colonization by platy corals (top of Core 3 and Core 2). Based on [26], all six cores from PETRONS-1 consist entirely of limestone, mainly comprising algal foram packstones, wackestones and grainstones with locally common coral fragments more than 5 cm (floatstones). The limestone contains common argillaceous laminae in Core 2 and the top of Core 3 [26]. Additionally, the porosity types for PETRONS-1 cores are predominantly mouldic with lesser vuggy porosity and significant microporosity. Intergrannular porosity is significant in the sample from 1645.23 m, which consists of abundant fragments of neomorphosed coral. Porosity here is enhanced by dissolution and brecciation. Furthermore, it was reported that microporosity is significant in samples below 1635.5 m, giving a characteristics chalky texture to the limestone. Microporosity has probably been preserved at an early stage of diagenesis during early lithification or neomorphic aggradation of micrite. It is also important to note that microporosity provides interconnection of mouldic and vuggy pores on a microscopic scale. Although permeability is significantly reduced, microporosity may be effective for the transmission of gas.
Similarly, a report on PETRONS-2 cores [27] noted that the cores consist of limestone and are made up of either coral, algal or a combination of both, acting as building blocks within the carbonate buildup. Even though the carbonate buildup has undergone extensive diagenesis, the depositional environment still primarily controls the distribution of porous and tight carbonate reservoirs in the PETRONS field buildup. Limestone deposited in back reef and protected environments, as well as reworked fore reef talus and detritus, were preferentially converted to chalkified and mouldic/vuggy limestone due to early leaching and possibly mouldic-sucrosic dolomite (fresh water influence), forming porous zones. Both dolomitization and fresh water stabilization processes occurred mainly in the central part of the buildup and decreased with intensity towards the flanks. It was reported that limestone deposited in relatively deeper open marine off reef settings and carbonate banks that are enriched with non-carbonate impurities (argillaceous limestone) were subjected to porosity-destroying compaction processes, thus becoming tight zones. Periods of rapid sea-level transgression also augment the argillaceous enriching processes. Rim reefs, patch reef and main reef cores are also mainly tight due to early cementation of its rich carbonate ooze and lime mud. The apparent contrast in reservoir properties, mainly tied to sea level changes, form a layer-cake phenomenon as observed in wireline logs and supported by seismic data.
This study is focused on producing a relationship between Klinkenberg-corrected permeability against water permeability and to discuss factors that cause the differences between the permeability values using carbonate core samples from PETRONS-1 and PETRONS-2 wells (PETRONAS, Sarawak, Malaysia). The relationship established can be a baseline towards a better and more comprehensive correlation that can aid in determining the absolute water permeability value based on the respective Klinkenberg-corrected permeability values of core samples from the same region.

2. Methodology

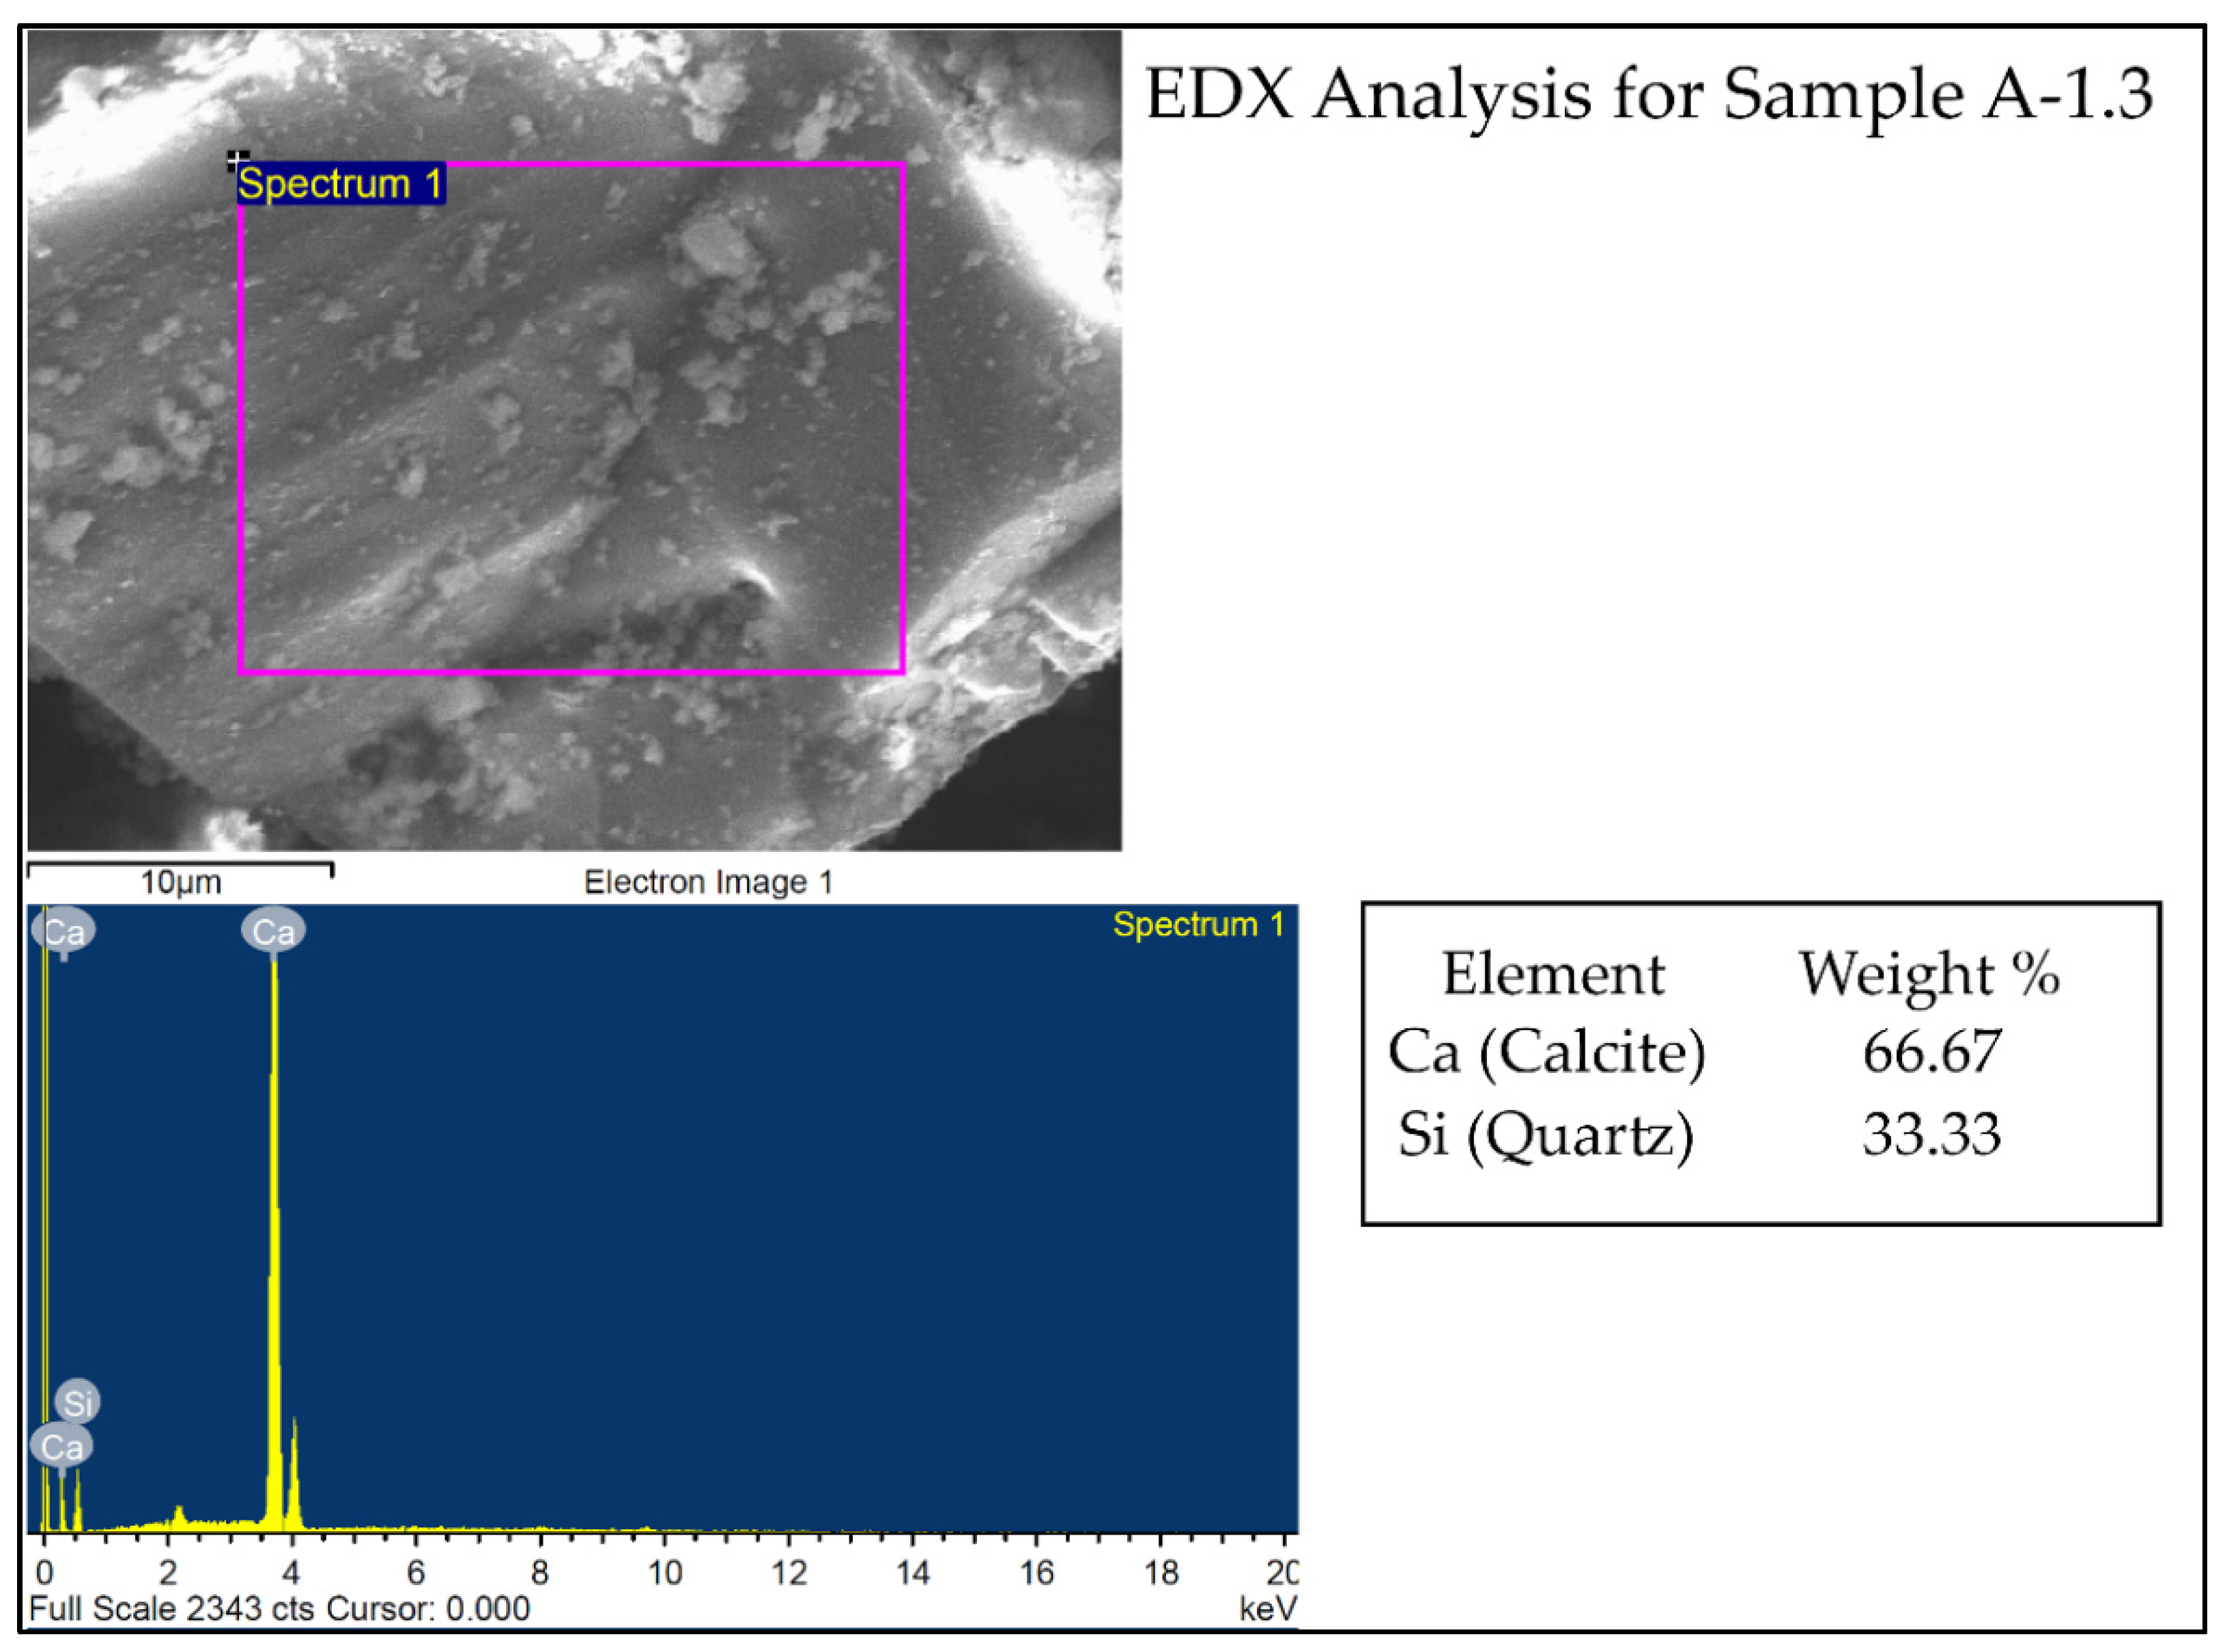
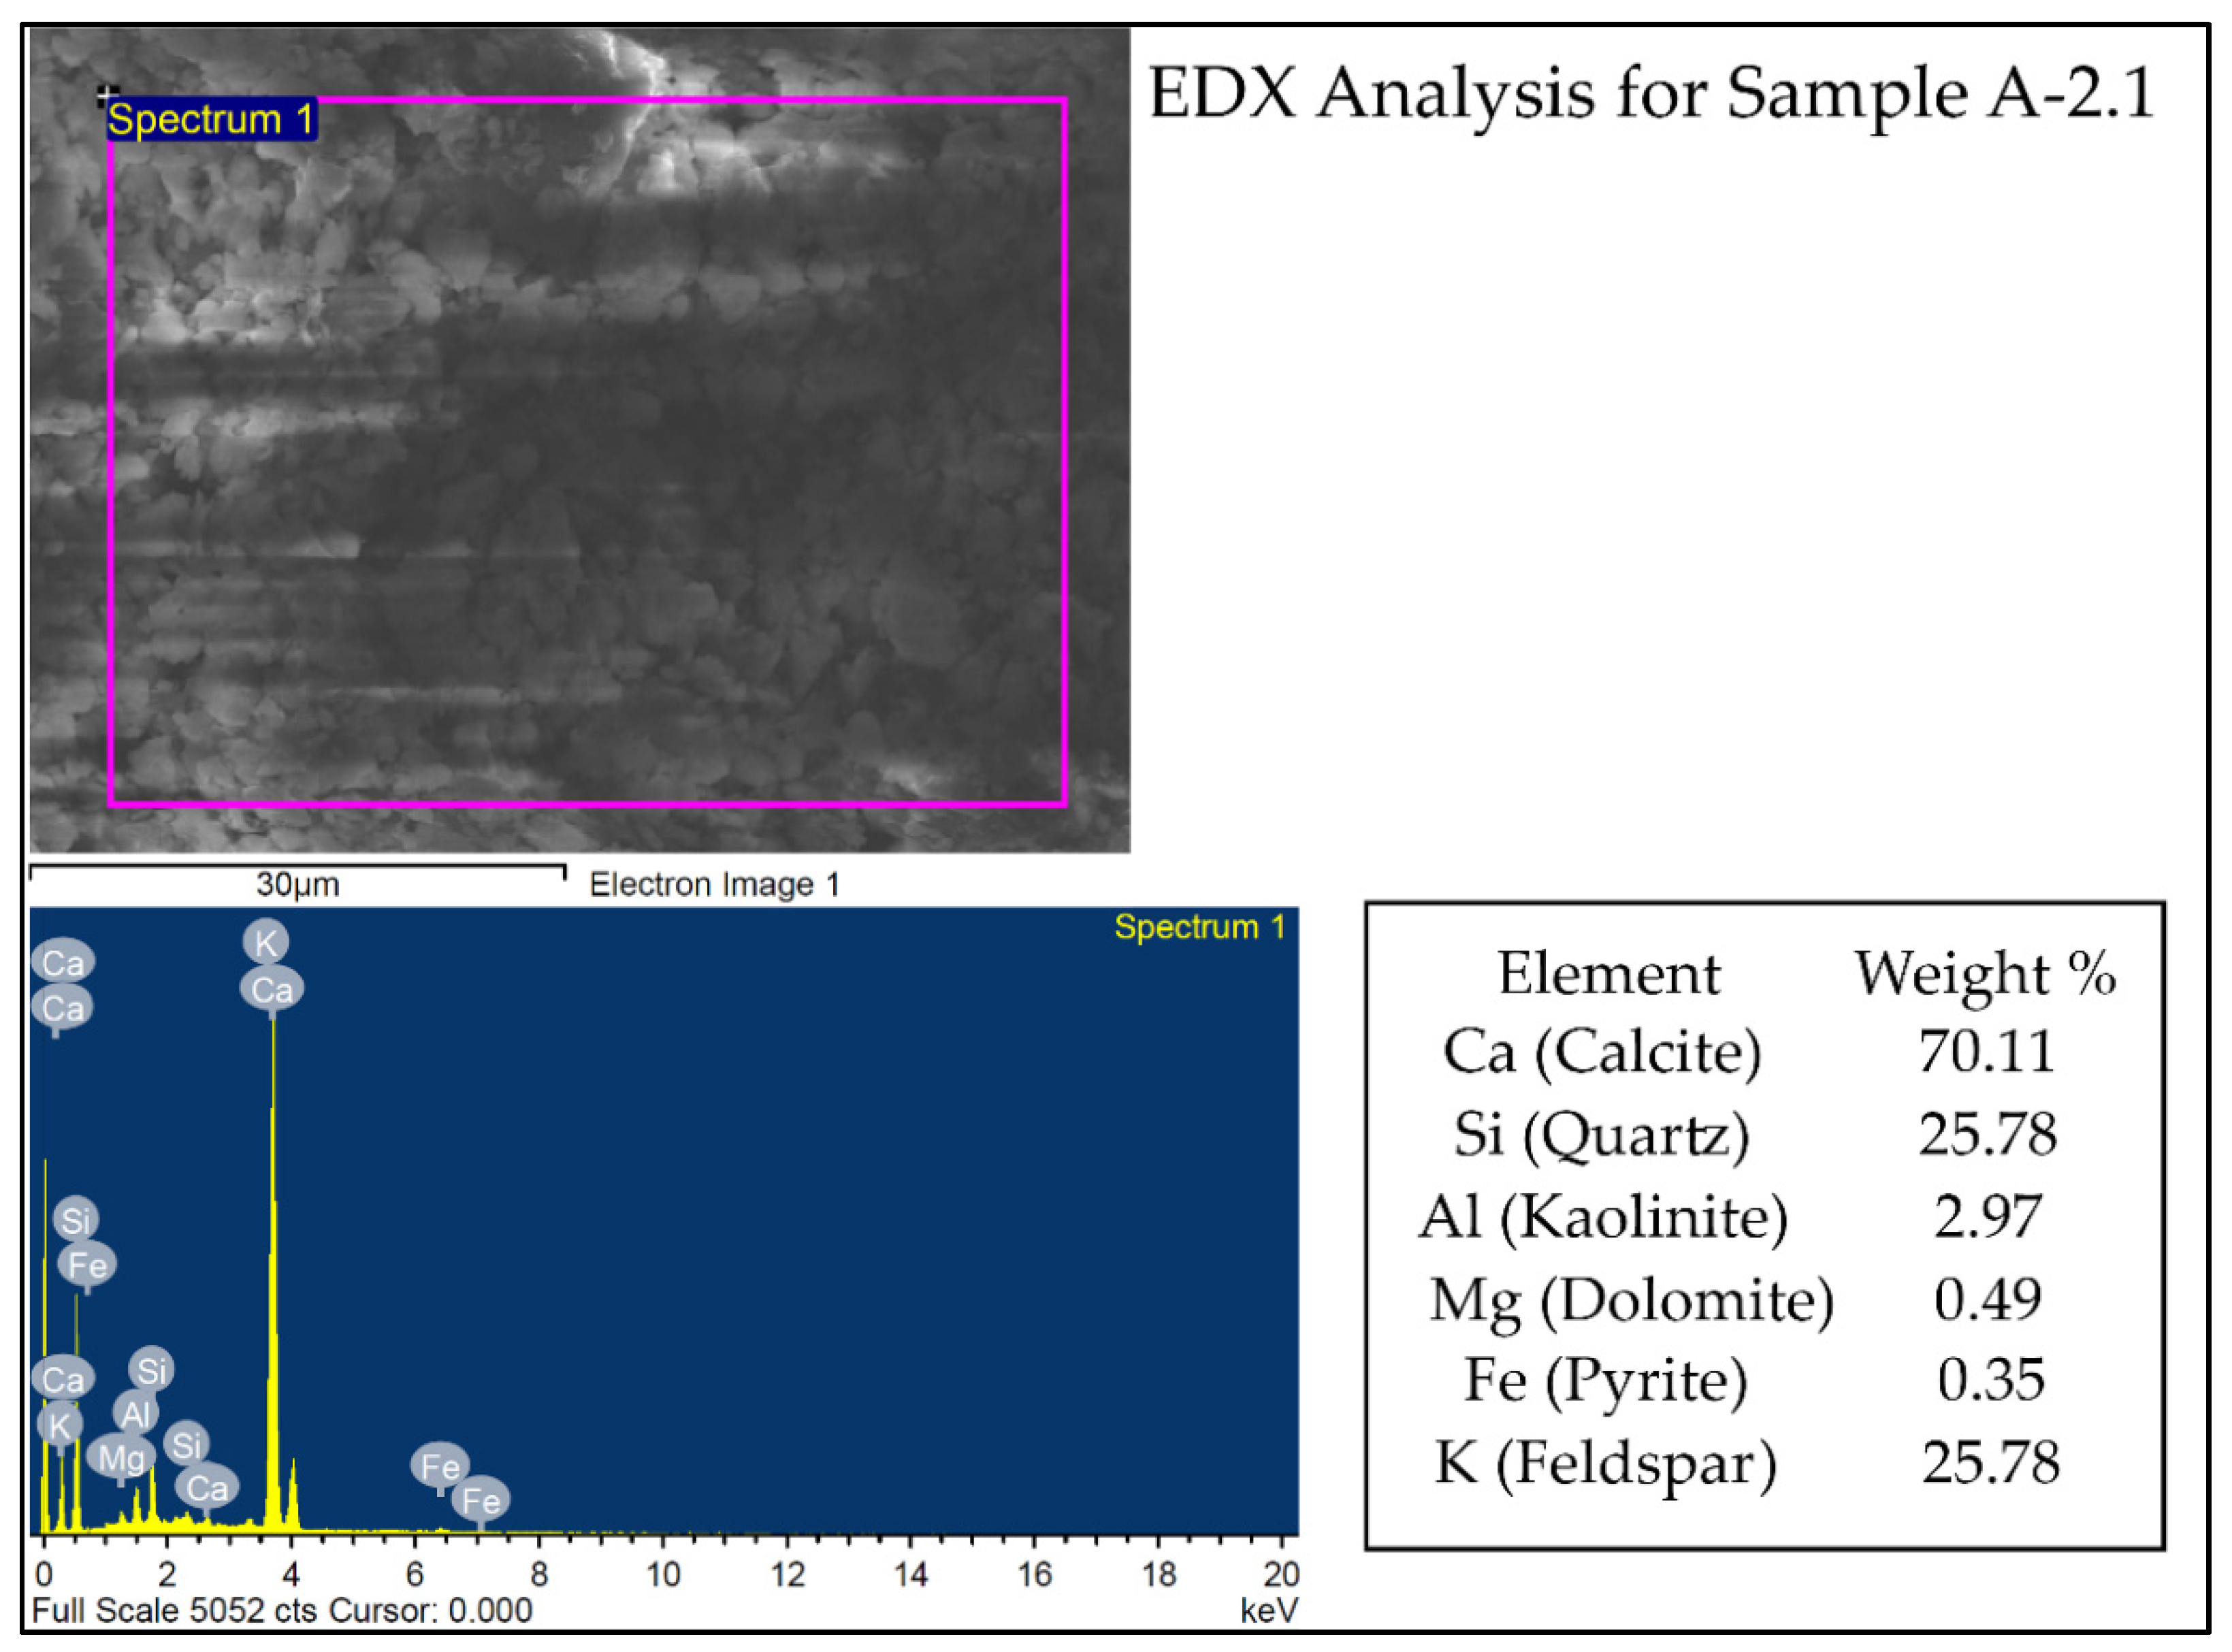
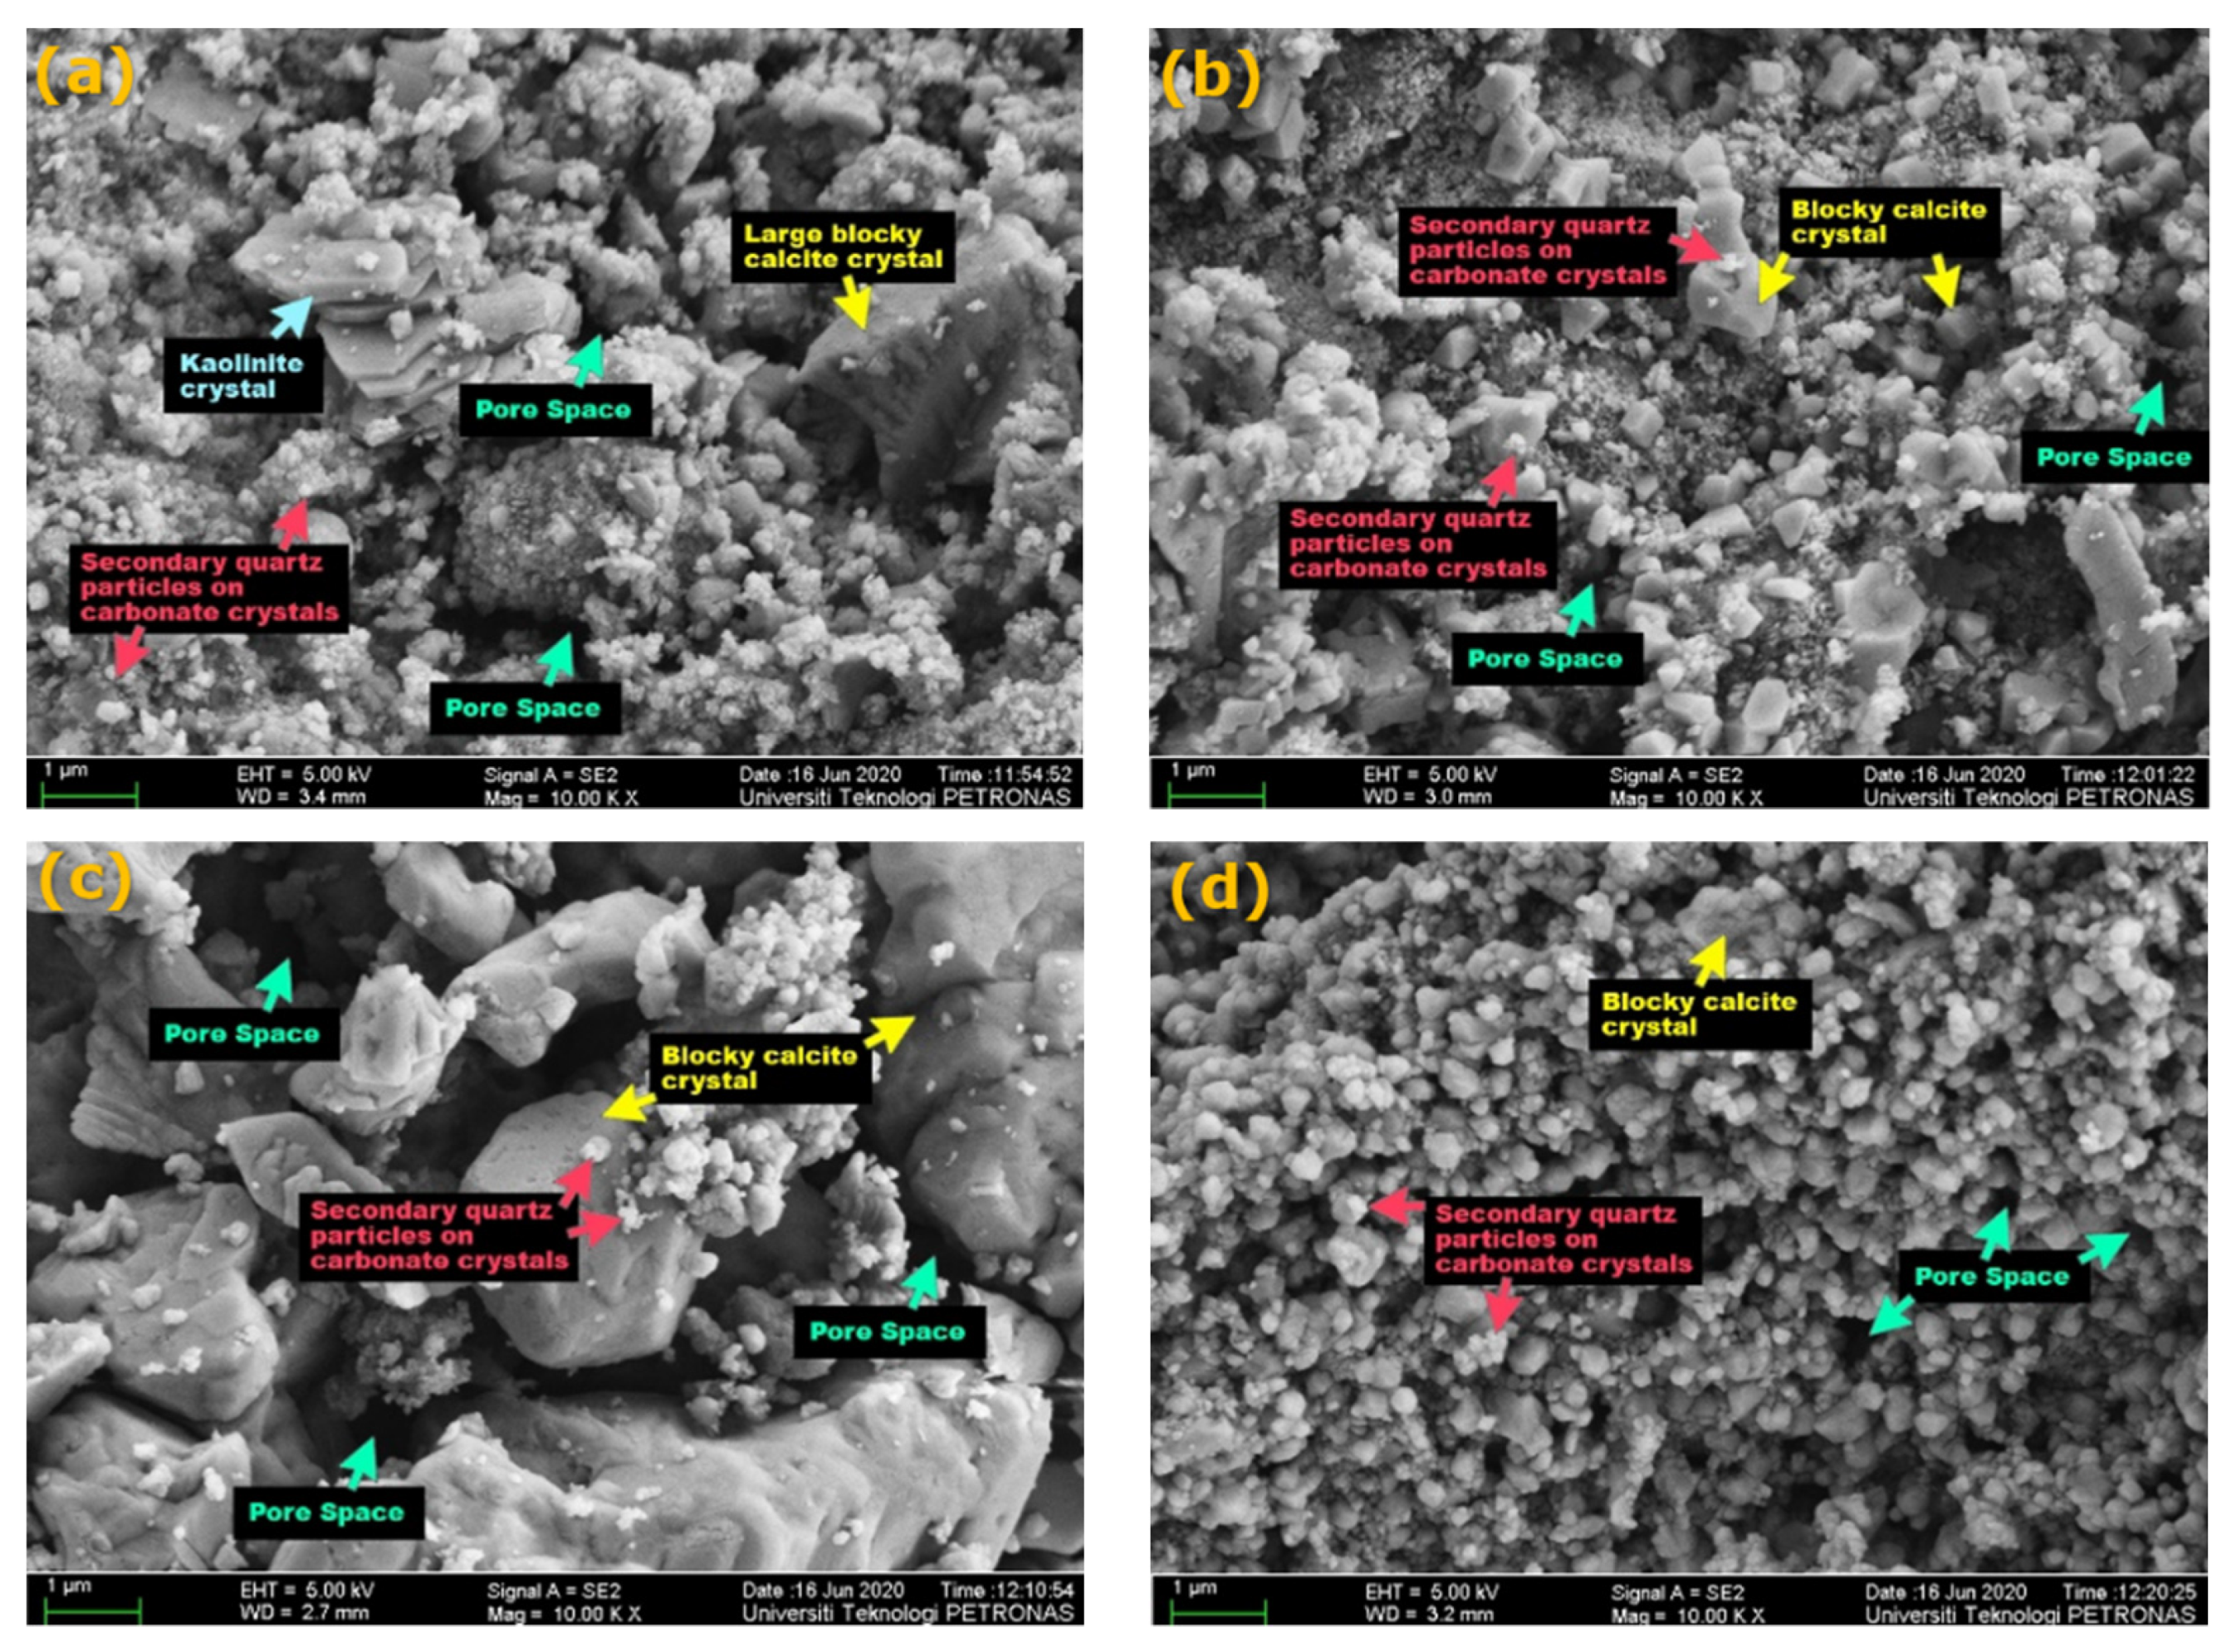
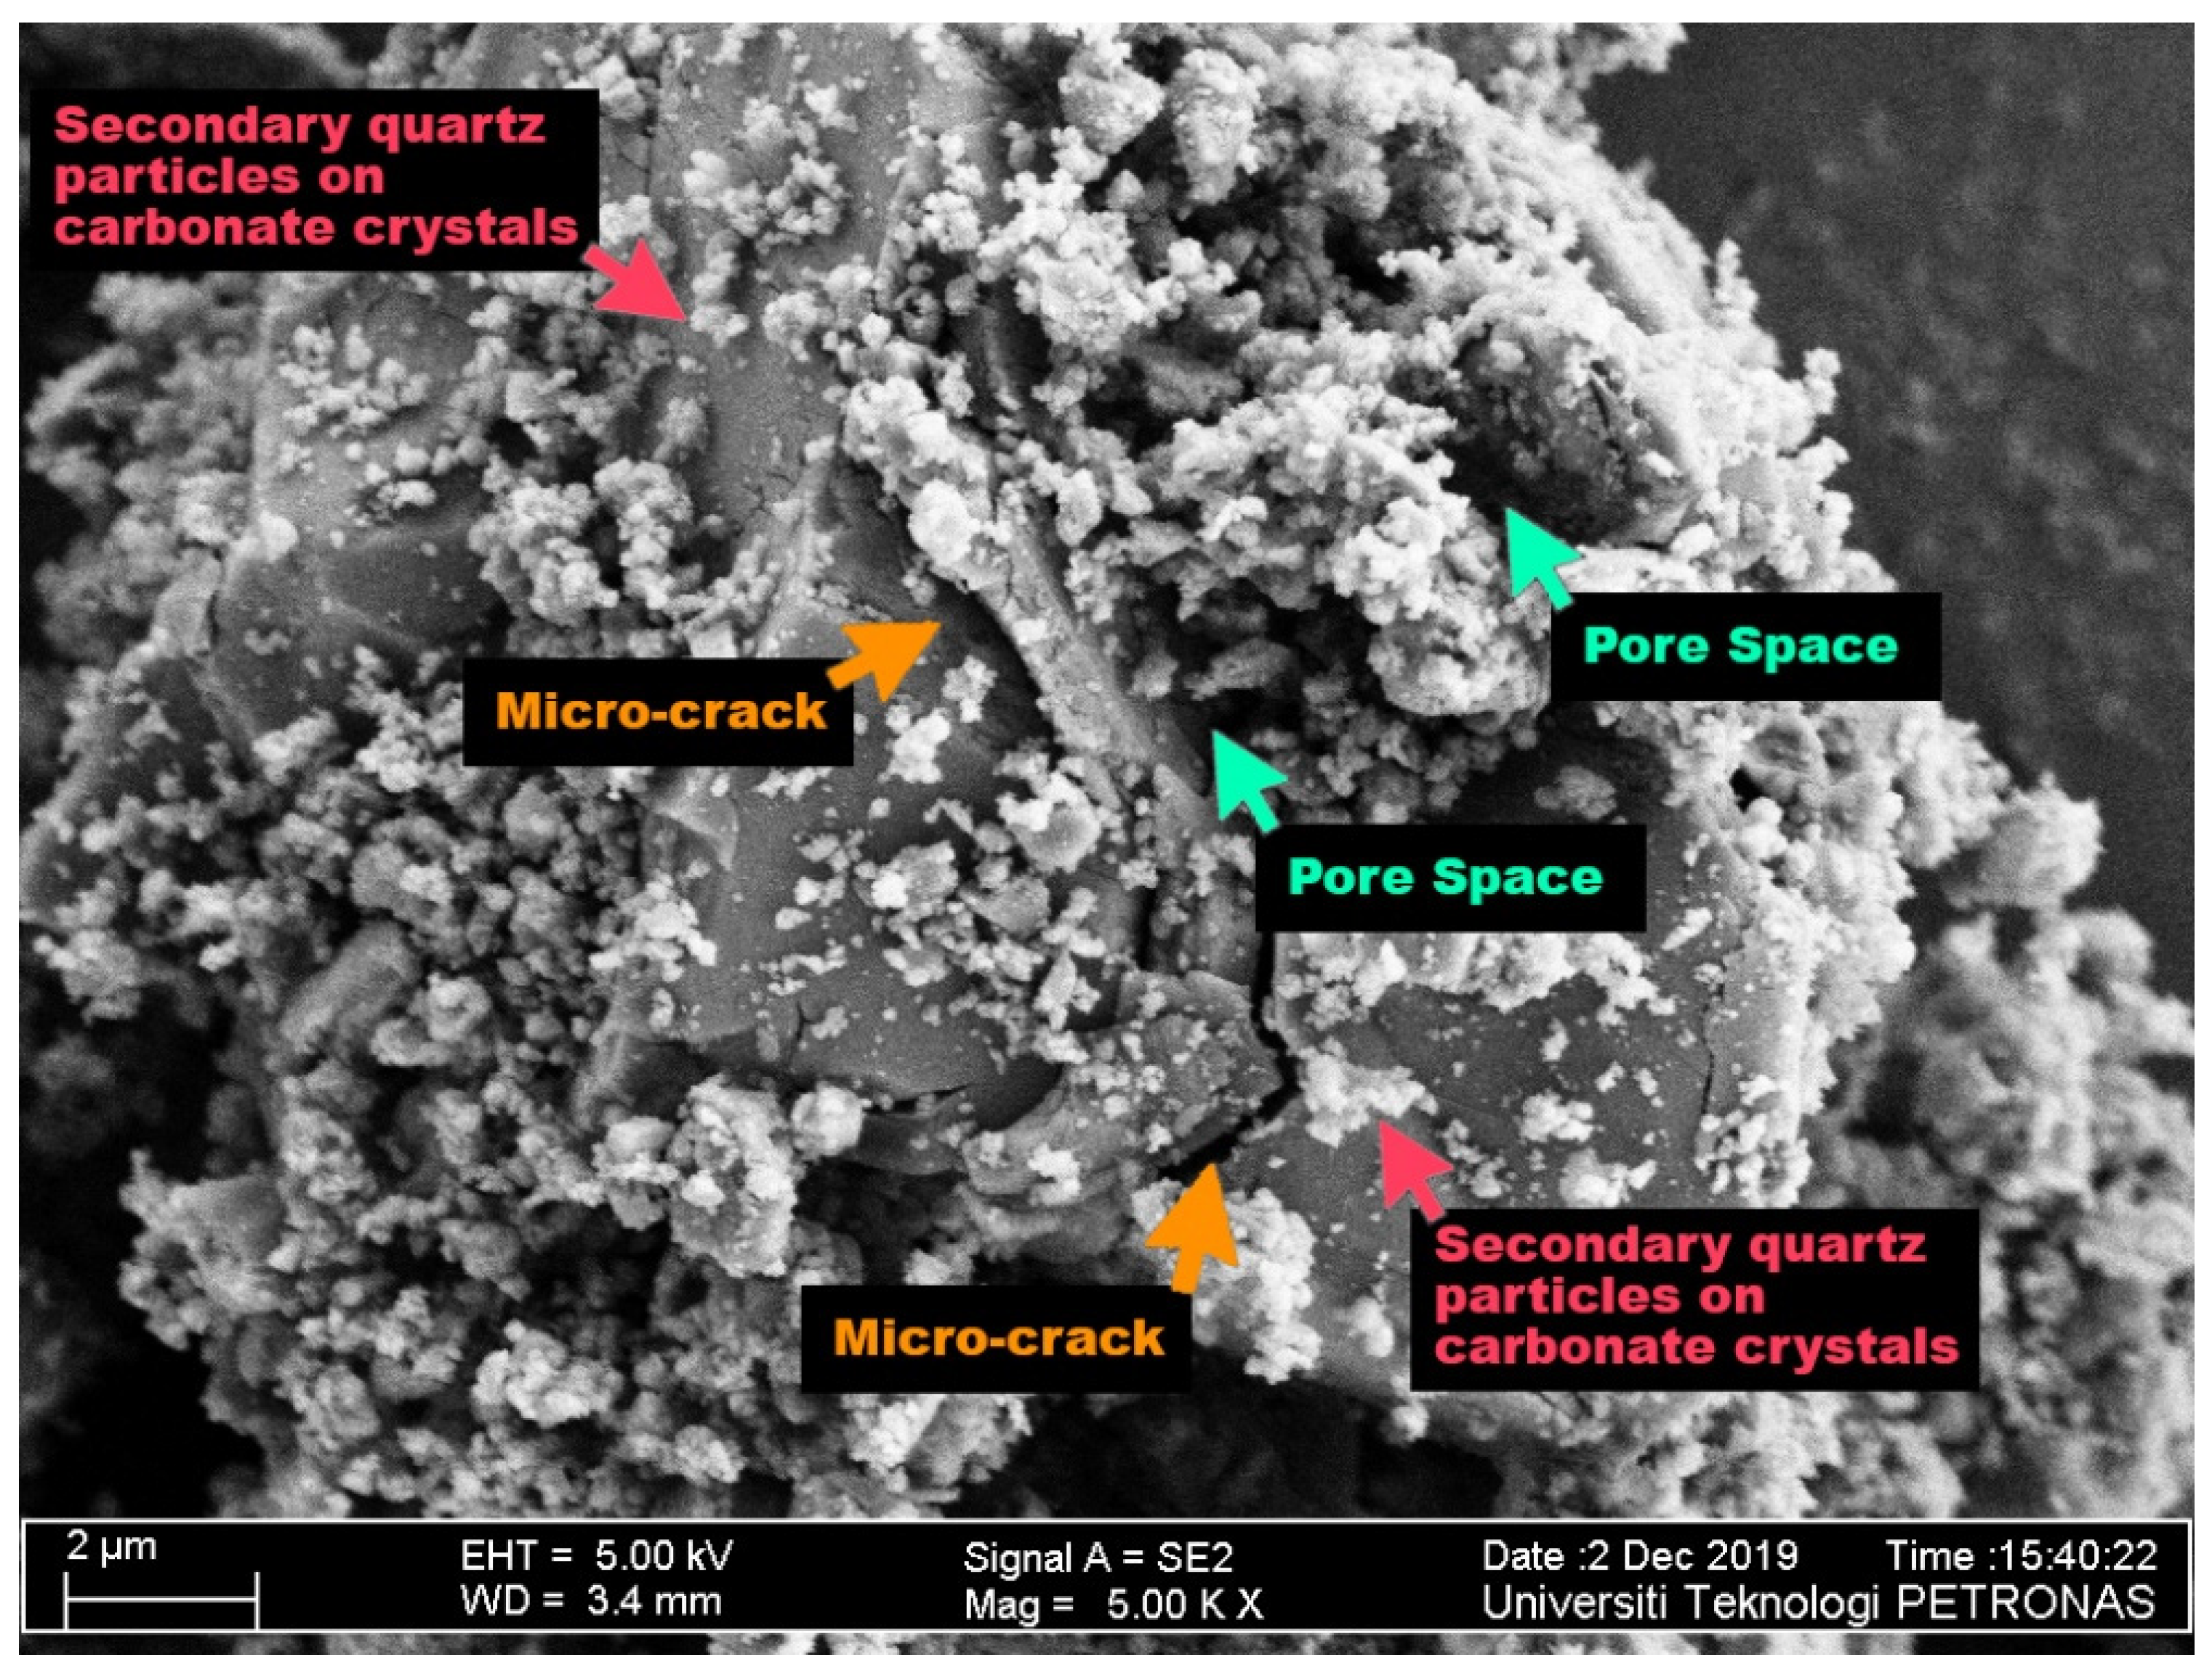
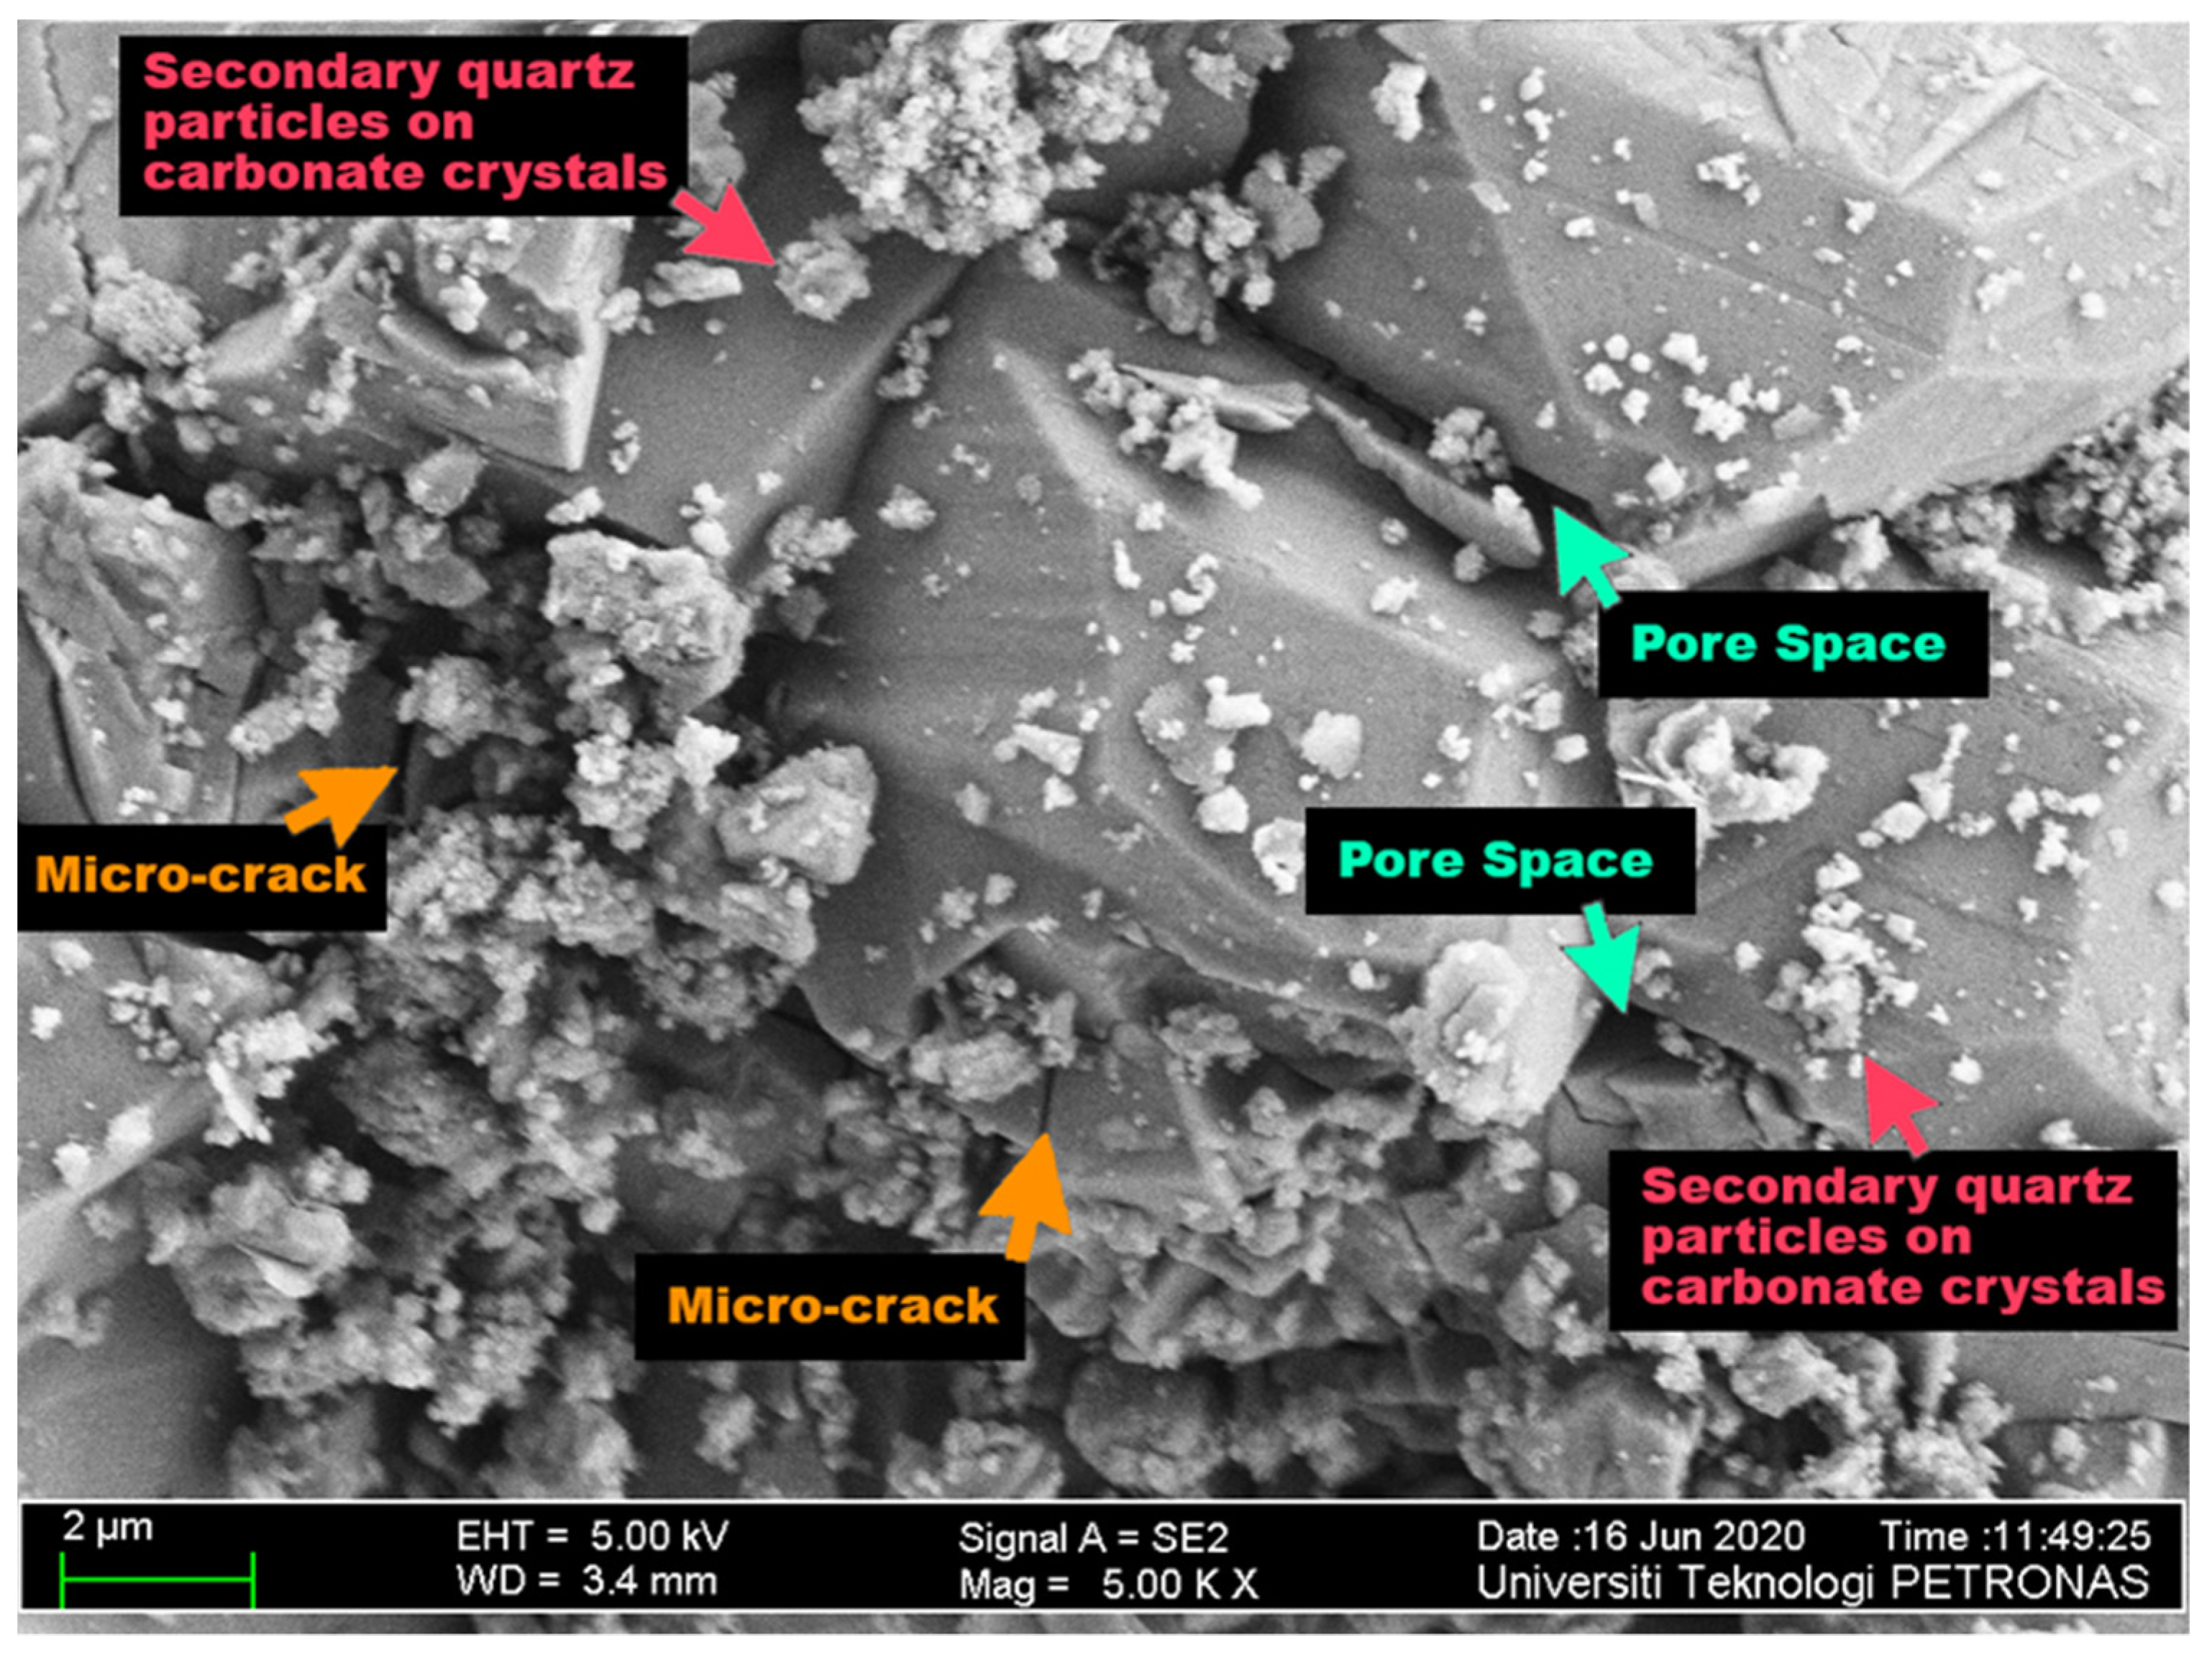
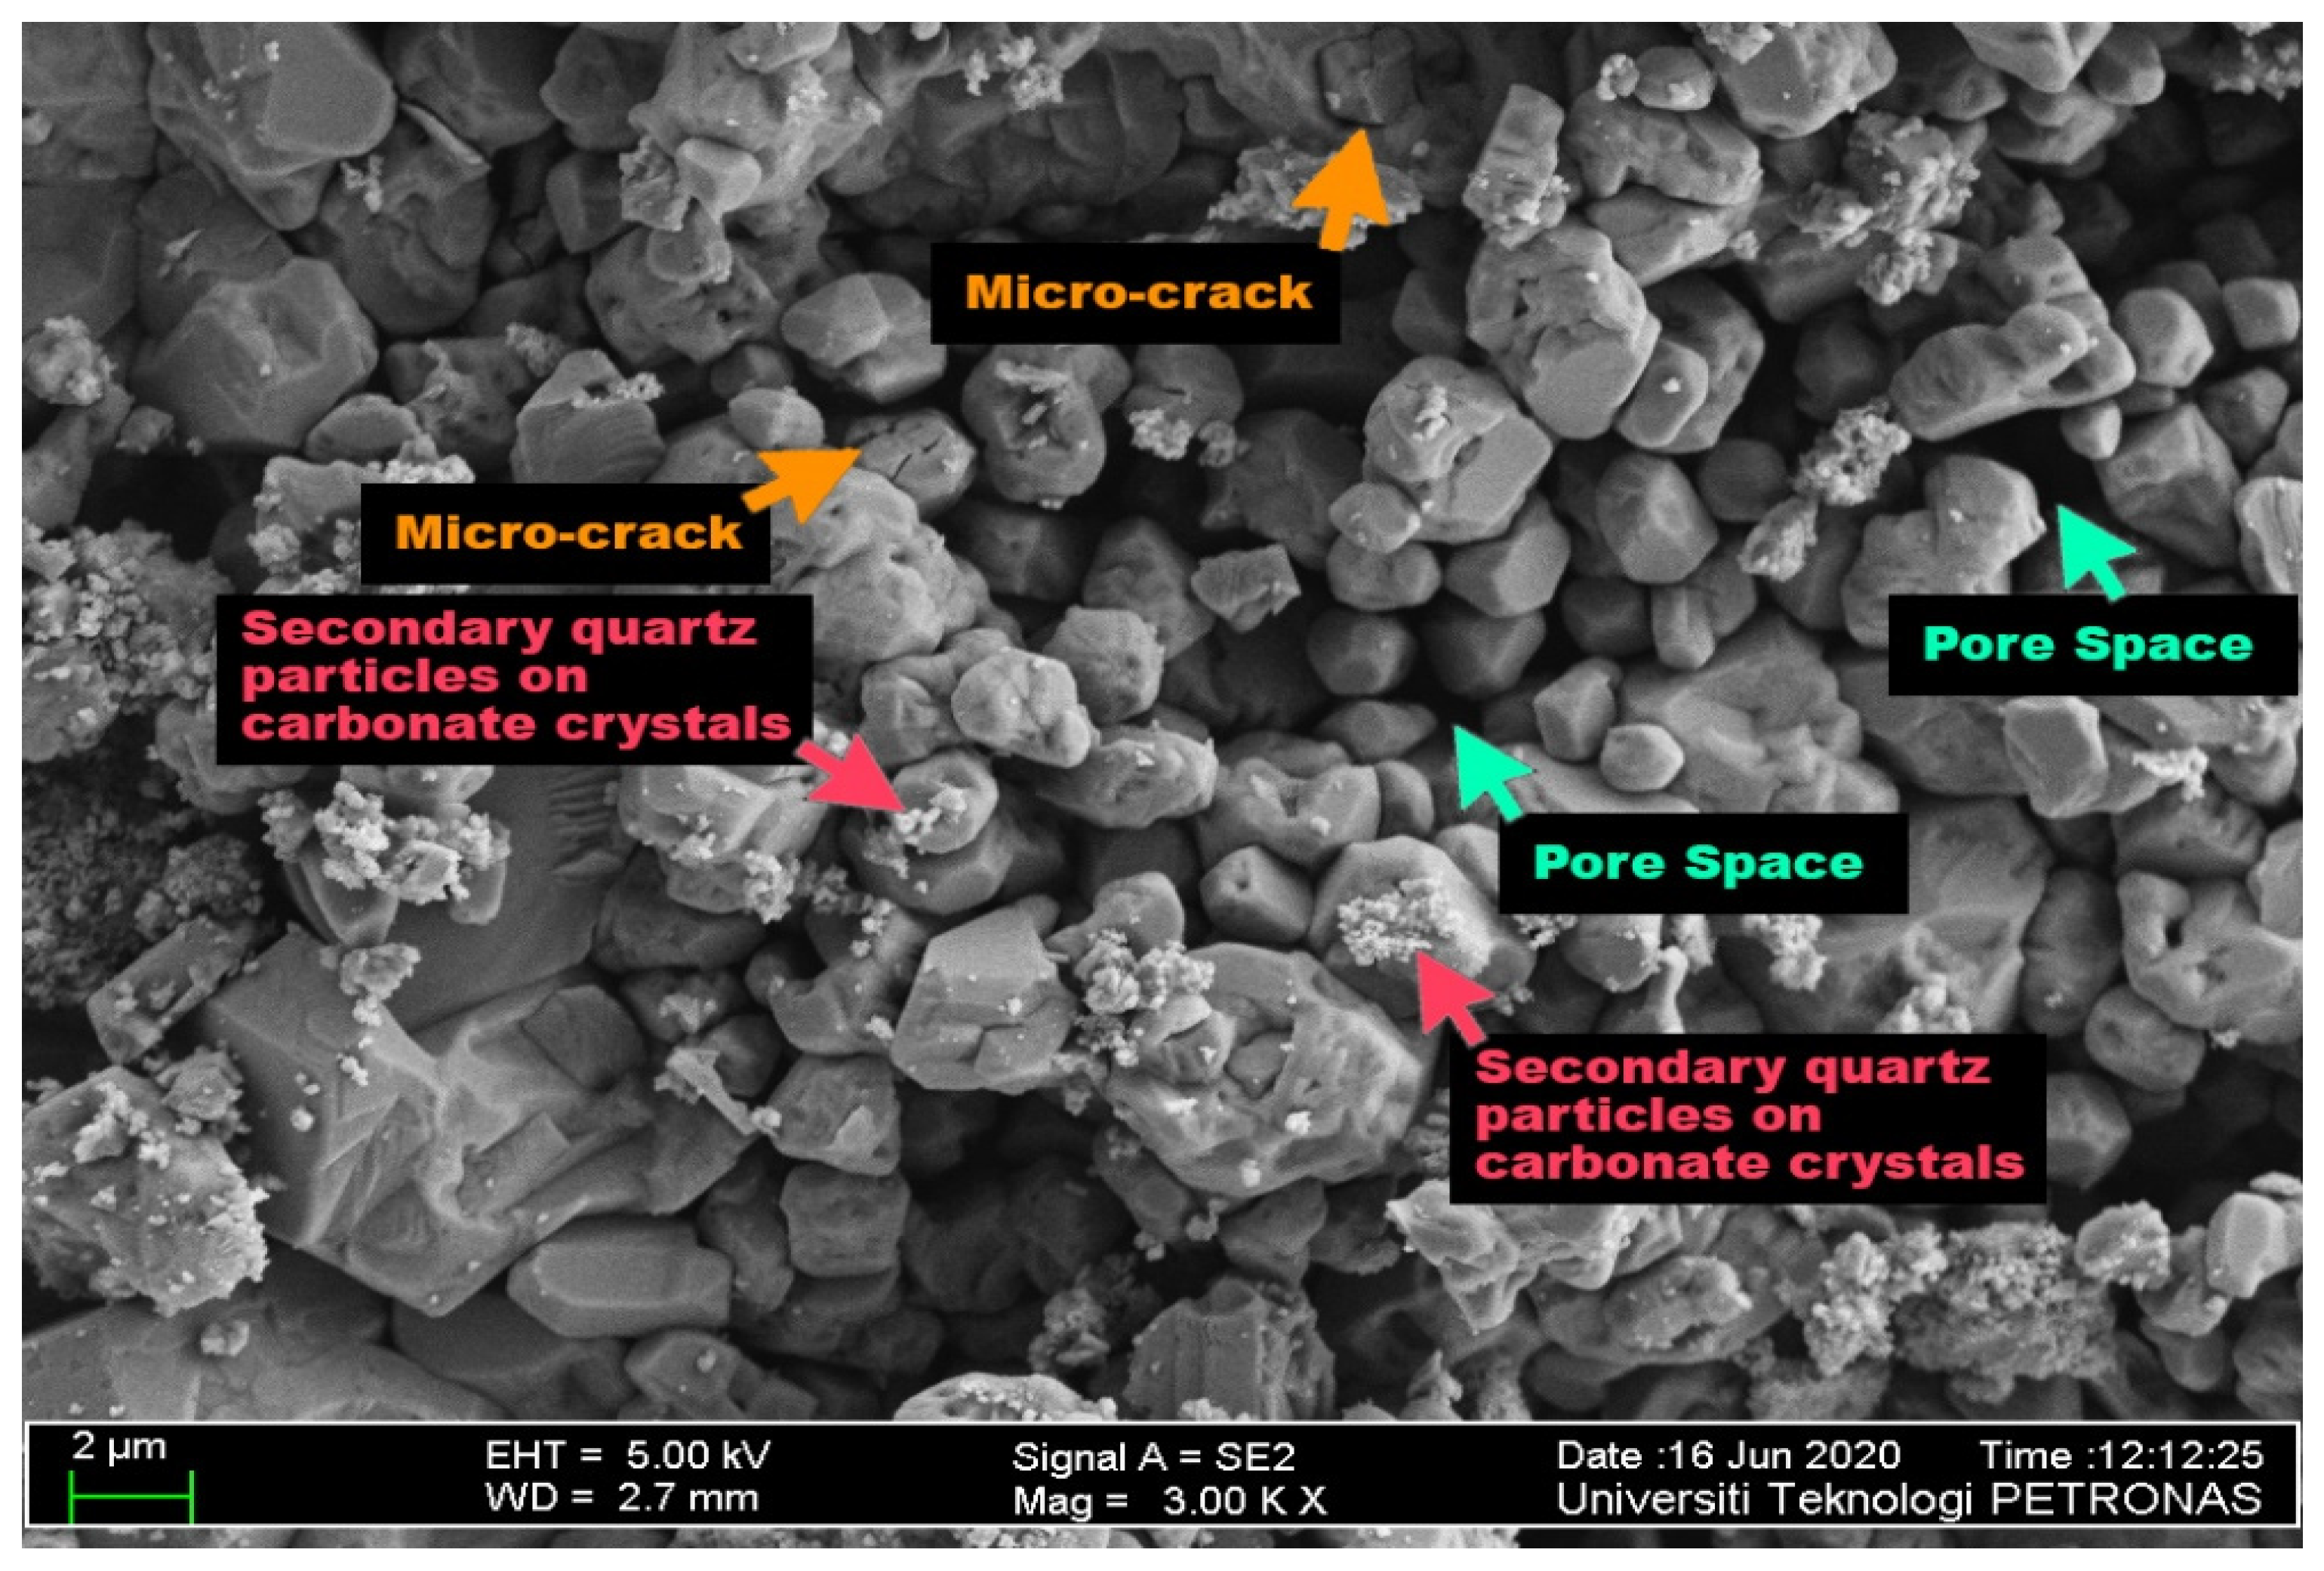
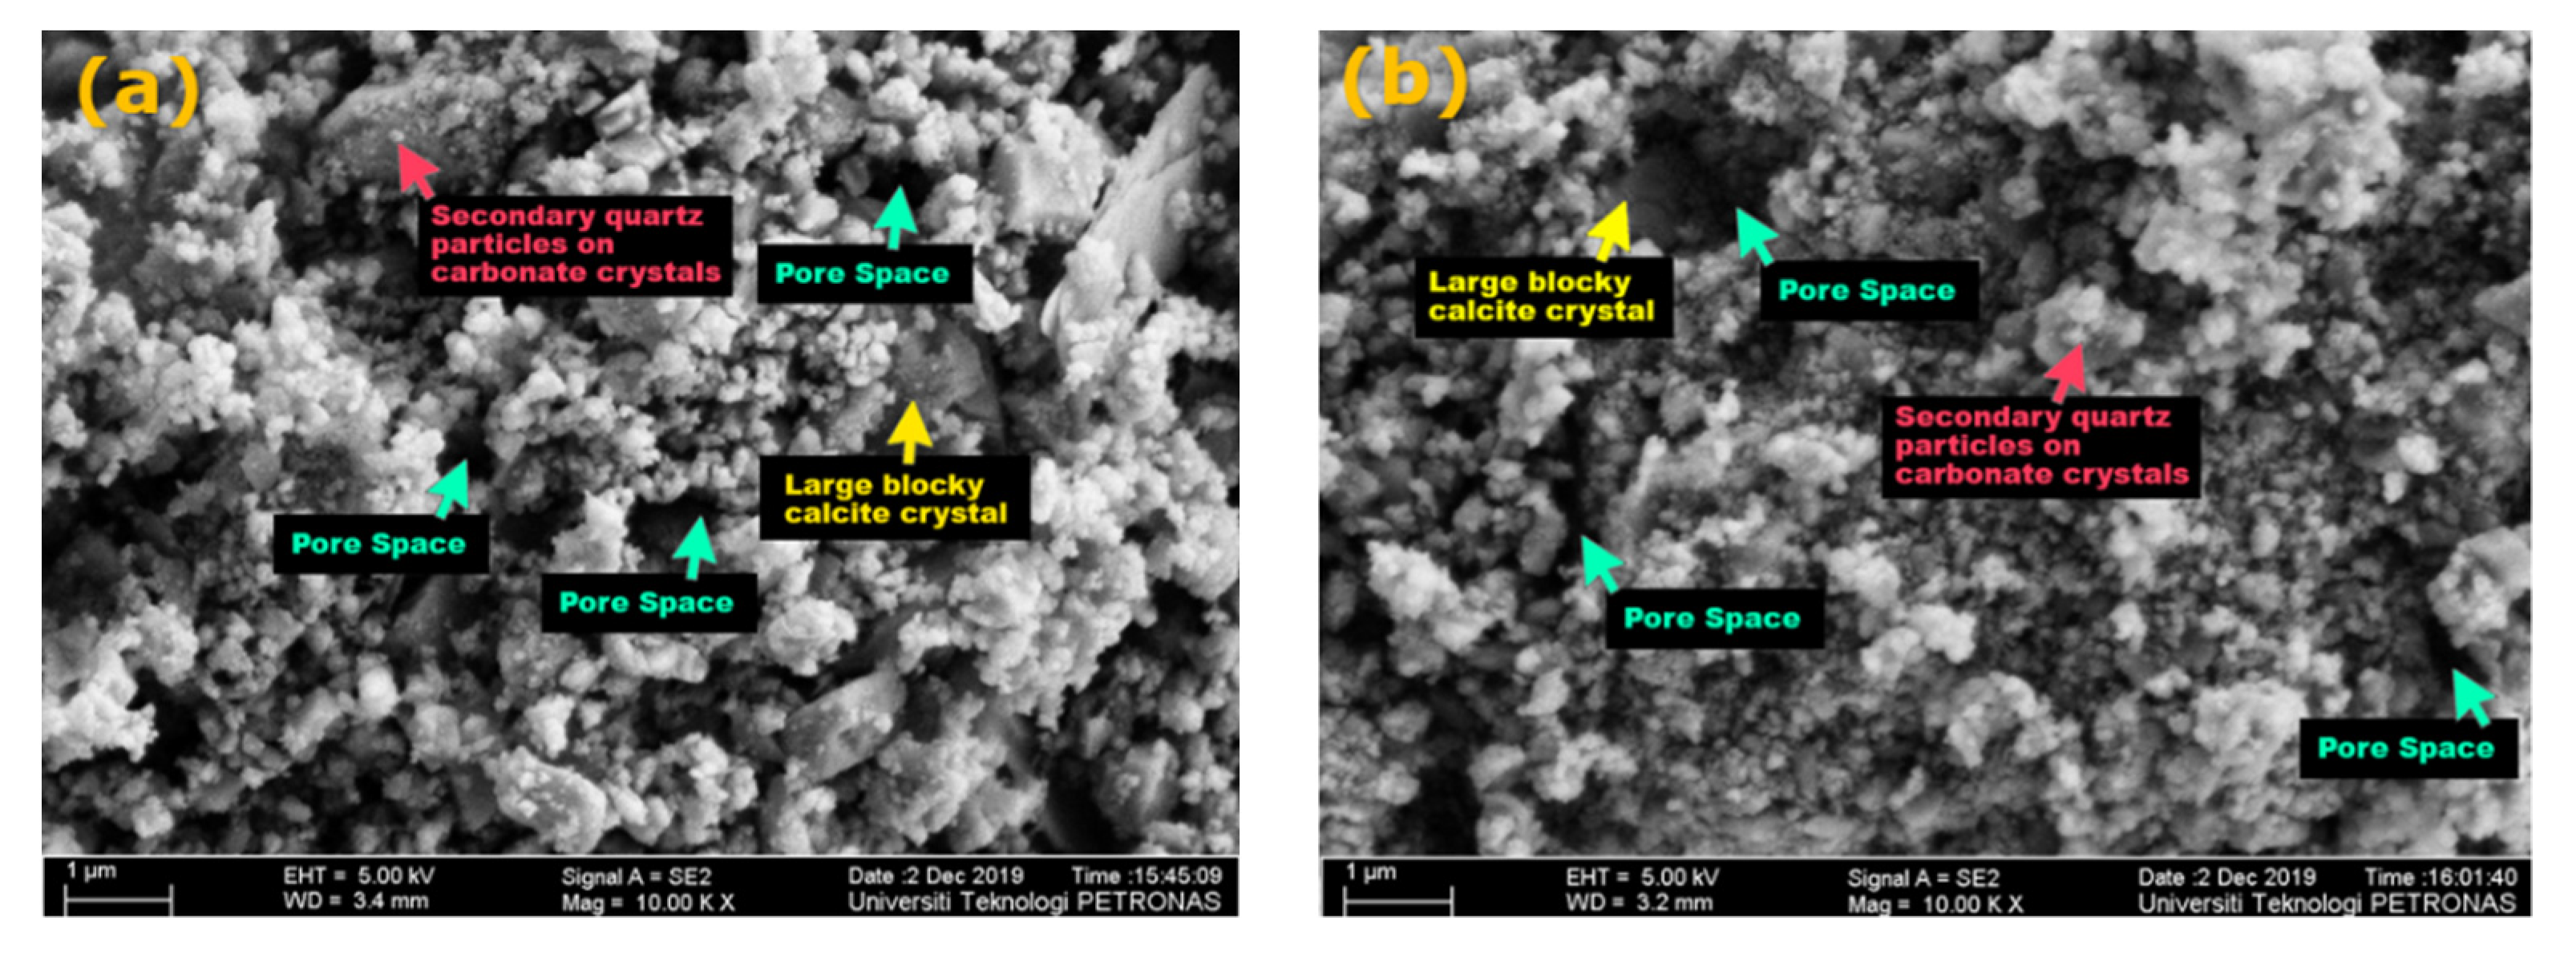
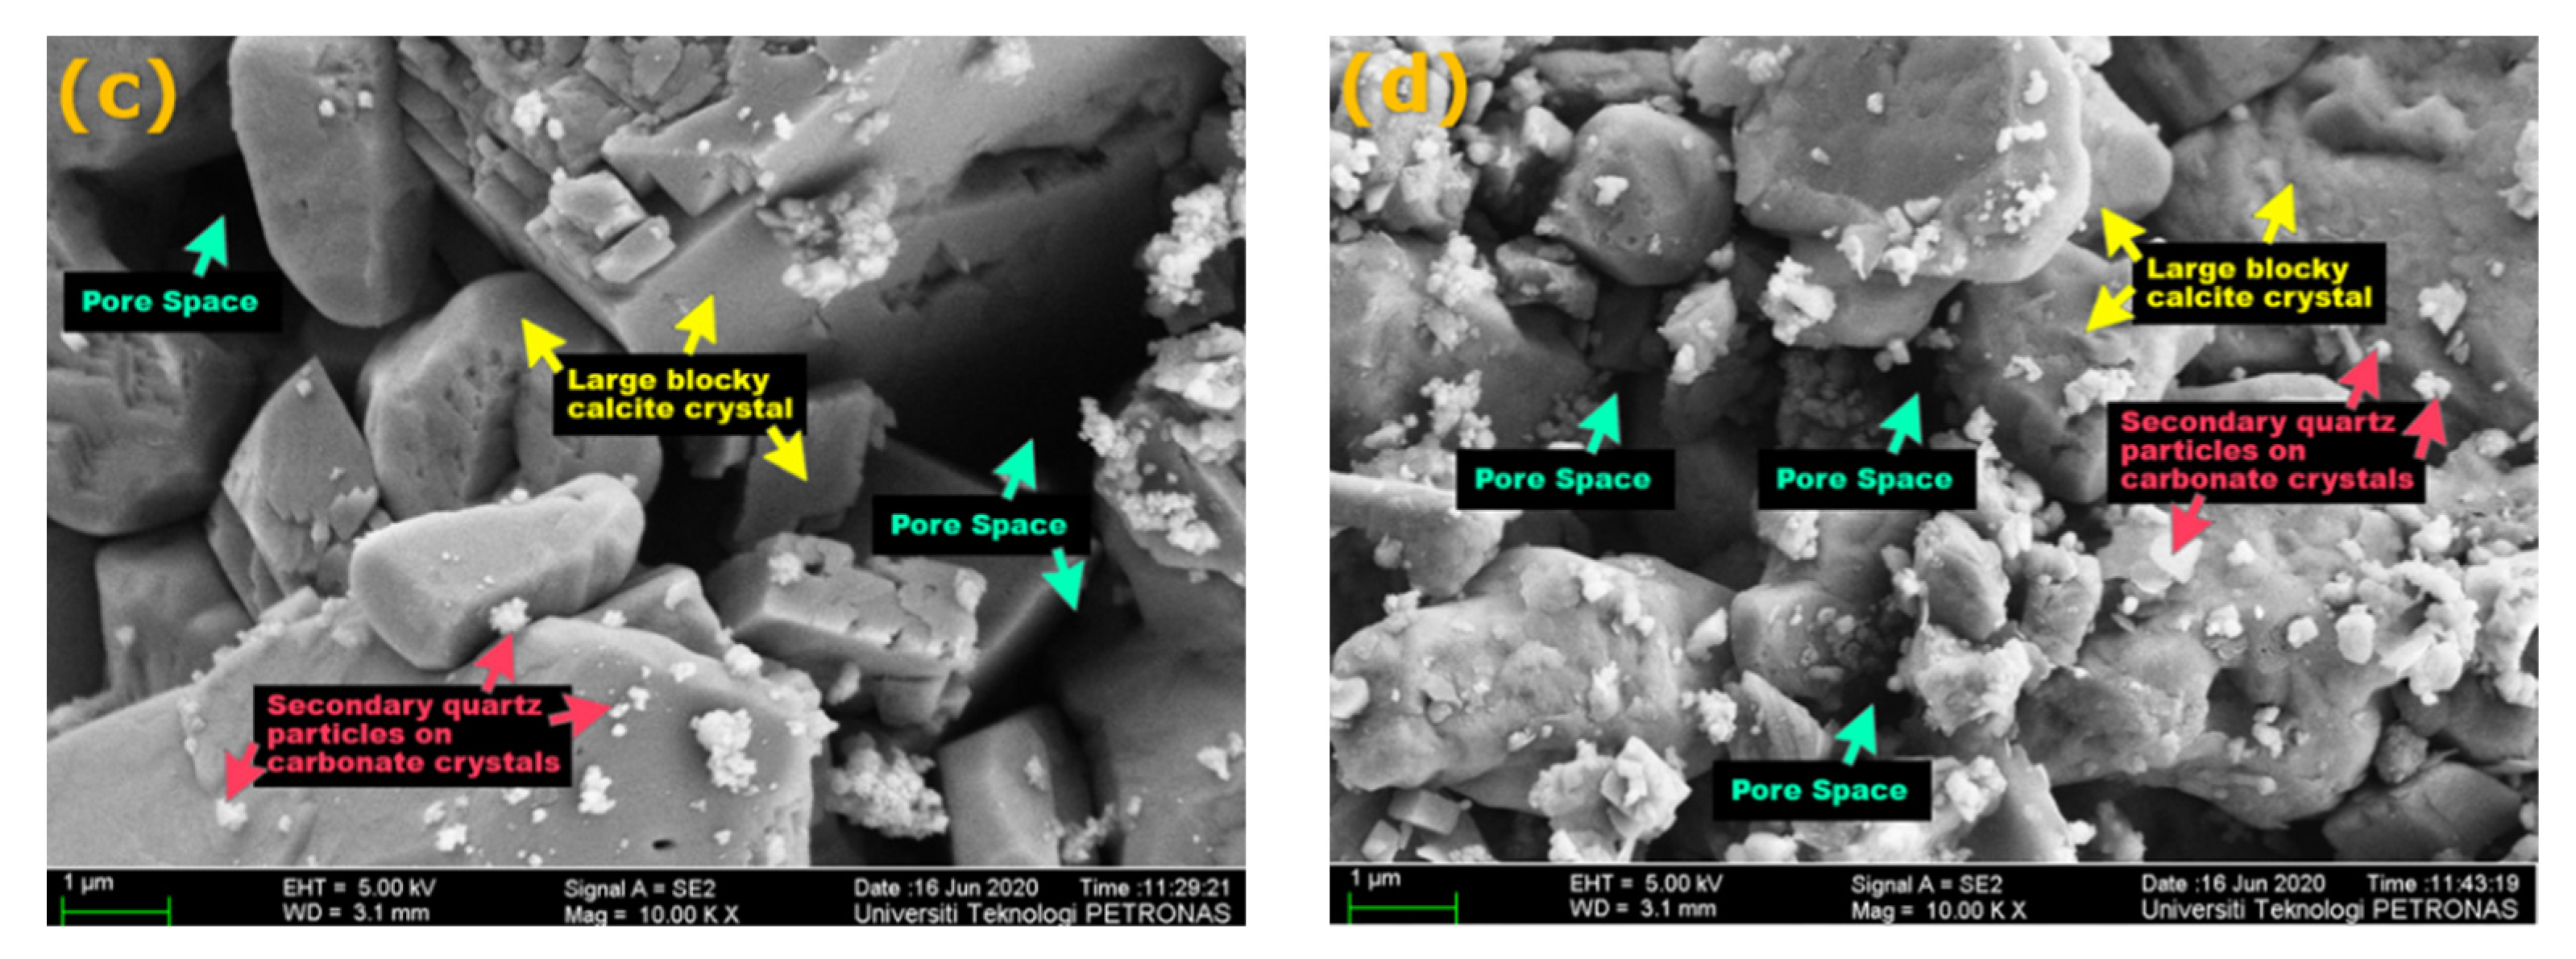
2.1. XRD & FESEM-EDX Analysis

X-ray Diffraction (XRD) analysis was conducted for phase identification and quantification of the crystalline structure using X’Pert Powder equipment (PAnalytical X’Pert Powder). The obtained data has been analyzed using X’Pert Highscore (Plus) software. Powders of the collected trimmed samples were prepared using Fritsch Mortar Grinder. The powdered samples were then placed on glass slides for XRD bulk analysis. Likewise, for field emission scanning electron microscopy (FESEM) analysis, ZEISS Supra-55 VP equipment was utilized to obtain high quality images of PETRONS samples at three magnification levels (1K×, 5K×, 10K×) with resolutions up to the 1 nm scale. Energy dispersive X-ray analysis was also conducted using ZEISS Supra-55 VP for elemental identification and quantitative compositional information of the samples. These analyses are important to study the factors affecting the flow of fluids in the porous media of the studied samples.

2.2. Klinkenberg-Corrected Permeability Measurement

Dried core plugs were placed into sleeved seal and moved to core holder. The core plug sample was exposed to confining pressure of 800 psi to eliminate bypass flow between the walls of the sample and the rubber sleeve during permeability tests. The upstream side of pore pressure was controlled by the regulator, and the fluid that flows out from the downstream of a specimen was released to atmospheric pressure, which was assumed to be a constant of 14.7 psi. The experiment was conducted using nitrogen gas at room temperature (27 °C). The equipment does not provide the pressure differential output, rather giving the finalized output of gas permeability, Klinkenberg-corrected permeability and porosity values of the tested samples.

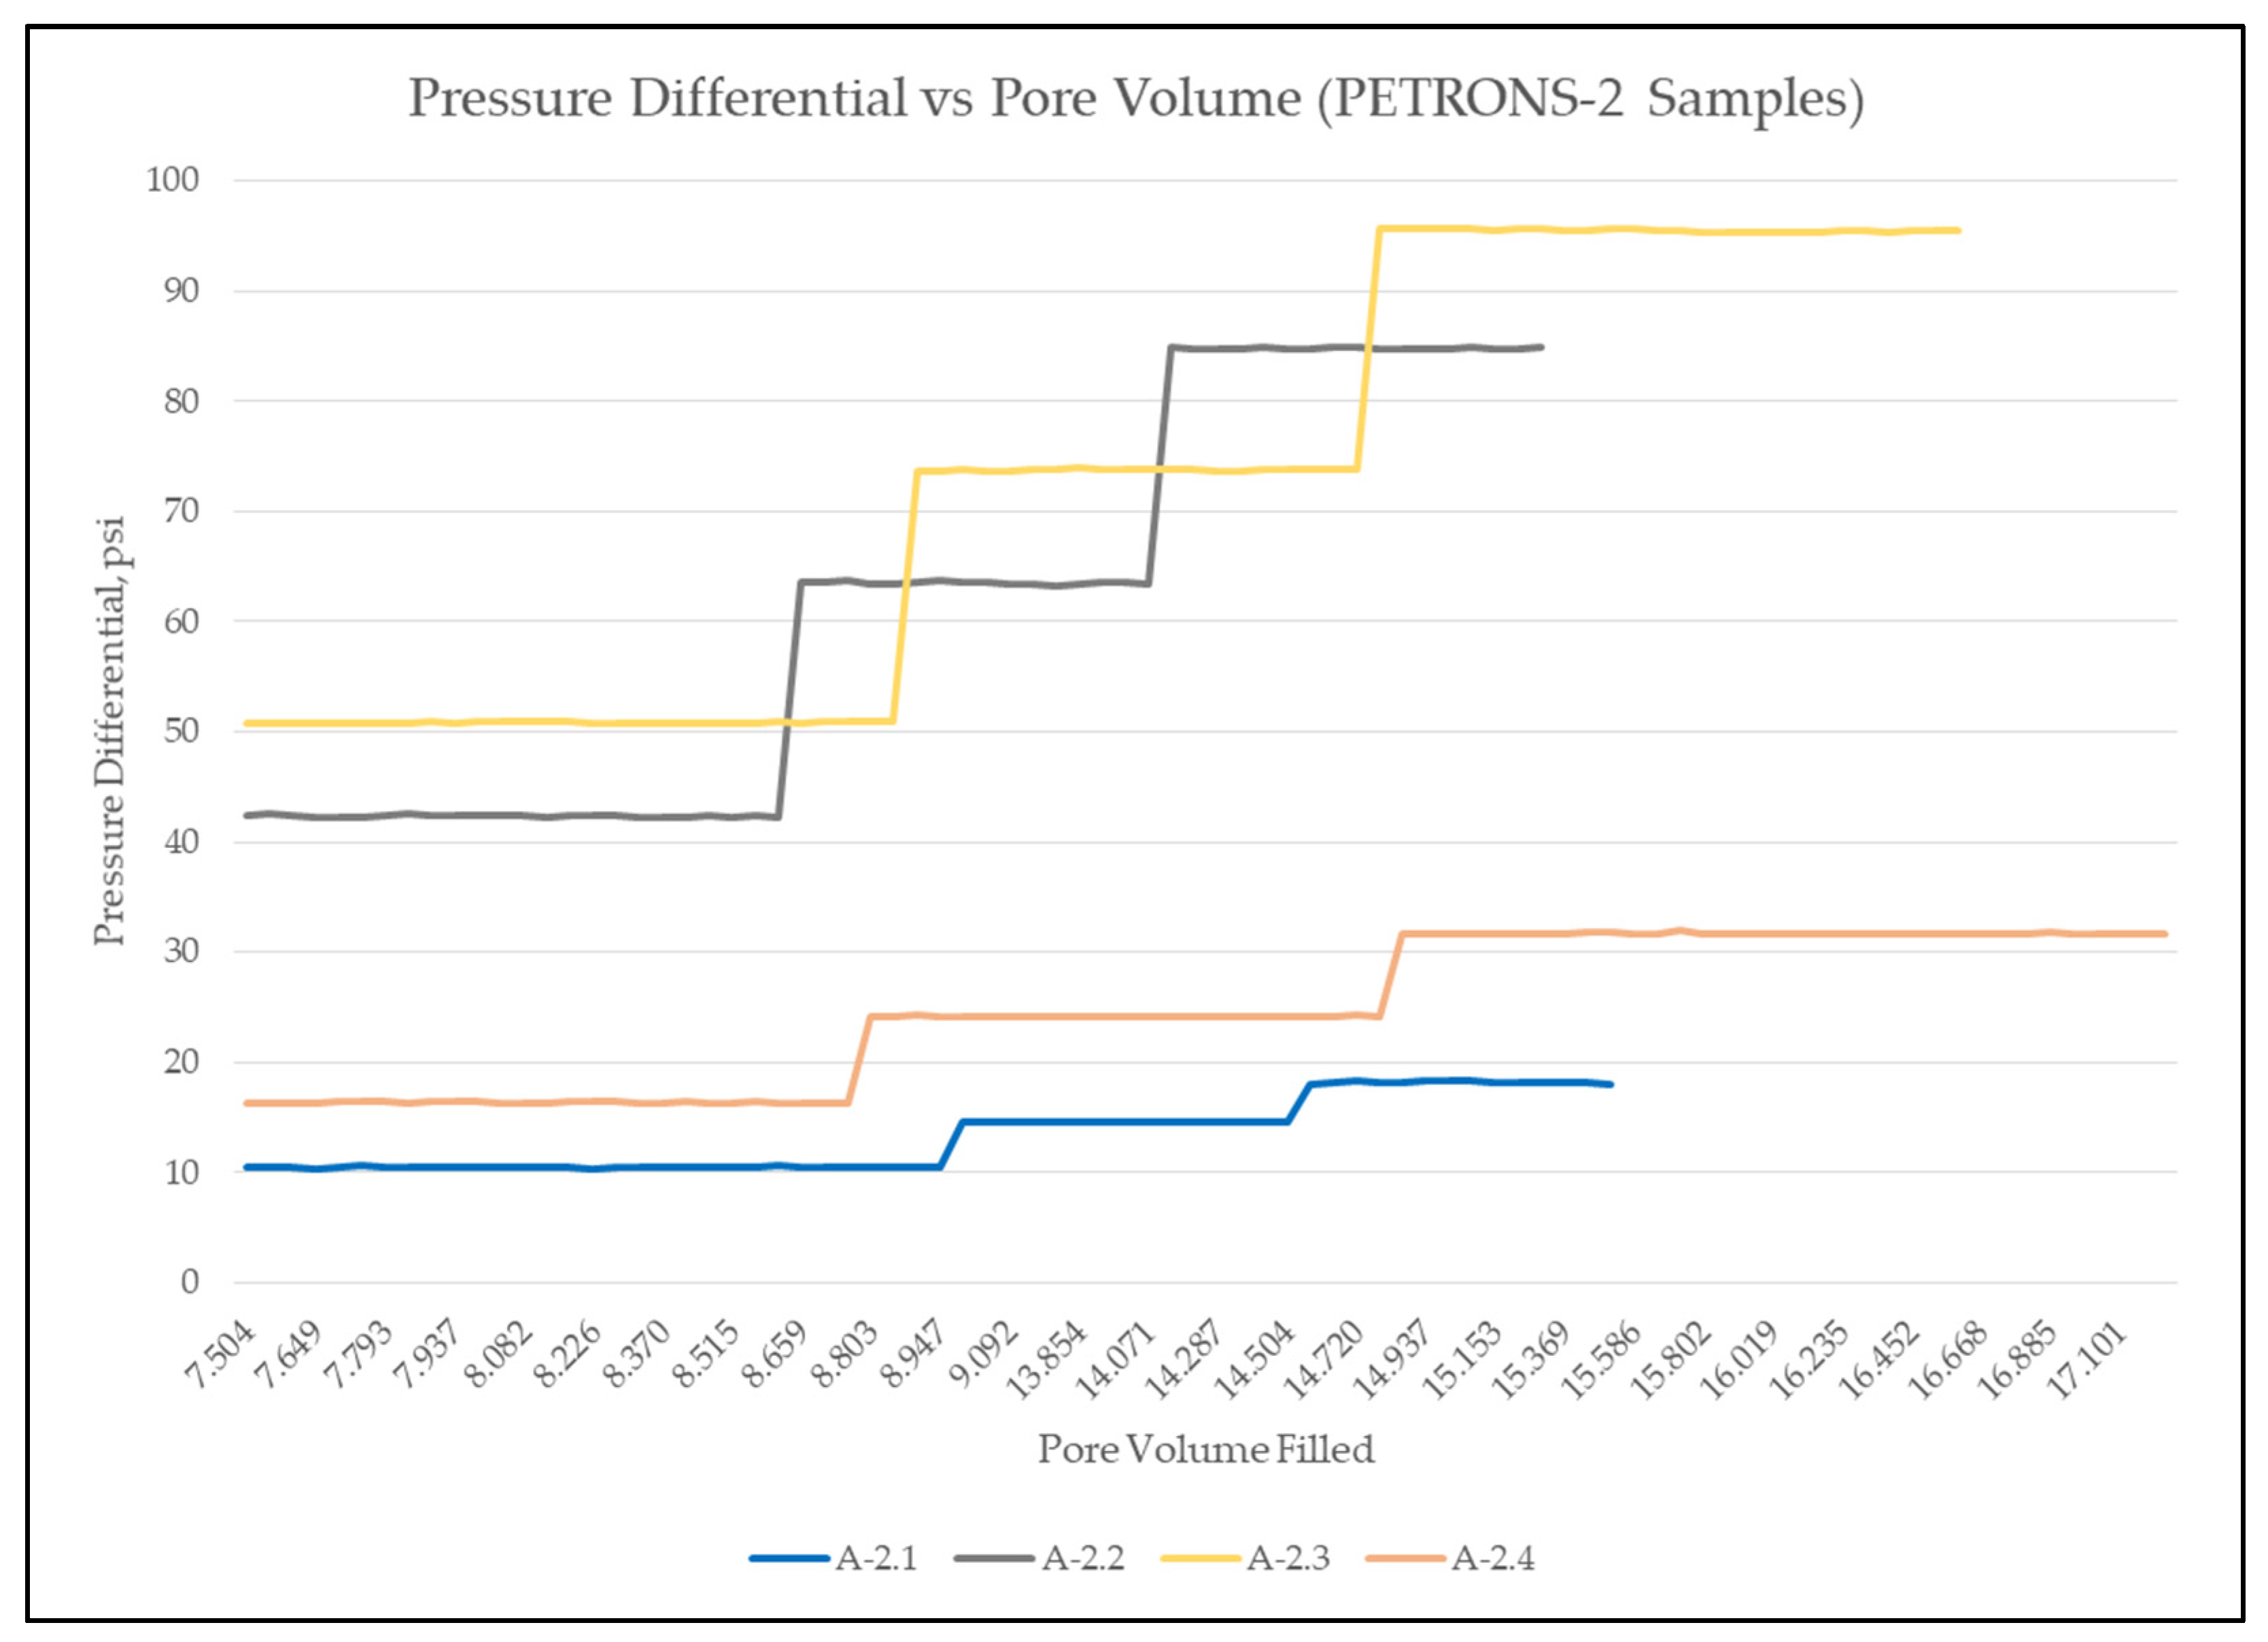
2.3. Water Permeability Measurement

For water permeability determination, the following steps were followed.
  • Brine Preparation;
  • Core Sample Preparation;
  • Vacuum Saturation of the Core Plugs;
  • Core Flood Equipment Preparation;
  • Water Flooding.
The experiment is conducted at 800 psi net confining stress. The pressure differential data were recorded along the injection until a stable trend was obtained. The pressure differential data and respective flow rate values were used to calculate the water permeability of each core sample.

2.3.1. Brine Preparation

The brine composition was obtained from reports provided by Malaysia Petroleum Management (MPM). PETRONS-1 brine comprises 80% sodium chloride and 20% potassium chloride with 23,000 ppm concentration. As for PETRONS-2, the brine comprises of NaCl at 27,235 ppm salinity since NaCl is the major constituent of the brine. Brine preparation steps were as follows:
  • Brine Preparation;
    • A beaker was filled with a required amount of distilled water for preparing brine.
    • The distilled water was degassed using a vacuum pump while stirring the distilled water using a magnetic stirrer (1 h).
  • Mixing of Salt;
    • After removing from degasification process, the distilled water was stirred using magnetic stirrer while adding the salts required one at a time.
    • Before adding the salt, the required amount of salt was weighted according to the specific composition for a specific field.
    • Each salt was added little by little and we waited until each salt was totally dissolved before adding the next salt. This step was repeated for all the salts.
  • Filtering and Degasification of Brine;
    • After acquiring the specified volume of brine, the brine was filtered (using filter assembly) with the help of a vacuum pump.
    • After filtering the brine, the brine was degassed to remove any gas present in the brine using the same step as (1).

2.3.2. Core Sample Preparation

First, the length and diameter of the samples were measured using a digital caliper while the dry weight was measured using the electronic balance. Since the core samples are carbonate samples and are reactive with water and can induce dissolution of the sample, it was decided that the sample should be wrapped with lead to maintain the integrity of the sample. Lead was used to wrap around the sample and mesh was on the top and bottom surfaces to prevent any flow of fines into the lines of the core flooding equipment. After the core is wrapped with lead and mesh, a 200 psi confining pressure was applied around the sample to ensure that the lead completely wrapped the sample without any gas trapped between the sample and the lead. After the confining pressure is applied, the samples were weighed and recorded again to account for the weight of the lead and mesh along with the weight of the sample. After the core samples were prepared, the samples were saturated with the synthetic brine prepared before conducting the water permeability measurement.

2.3.3. Core Sample Vacuum Saturation

For vacuum saturation of core samples, the core sample was placed in a beaker filled with synthetic brine prepared earlier. The beaker was placed in a desiccator that was connected to a vacuum pump. After turning on the vacuum pump, the vacuum saturation process was continued until no gas bubbles were observed emanating from the brine. This process took approximately 1–3 h to complete depending on the size of the sample. The core samples were kept submerged in the synthetic brine after saturation process in order to confirm that the pore spaces of the sample were not exposed to the open air.
Next the samples were weighed again to account for the weight of the brine that had filled the pore spaces of the sample. The weight was measured three times and an average value was recorded as the wet weight. Before measuring the weight of the sample, the surface of the samples was wiped gently to remove water droplets surrounding the outer surface of the sample. The sample was immediately immersed back into the brine-filled beaker until the experiment’s next stage.

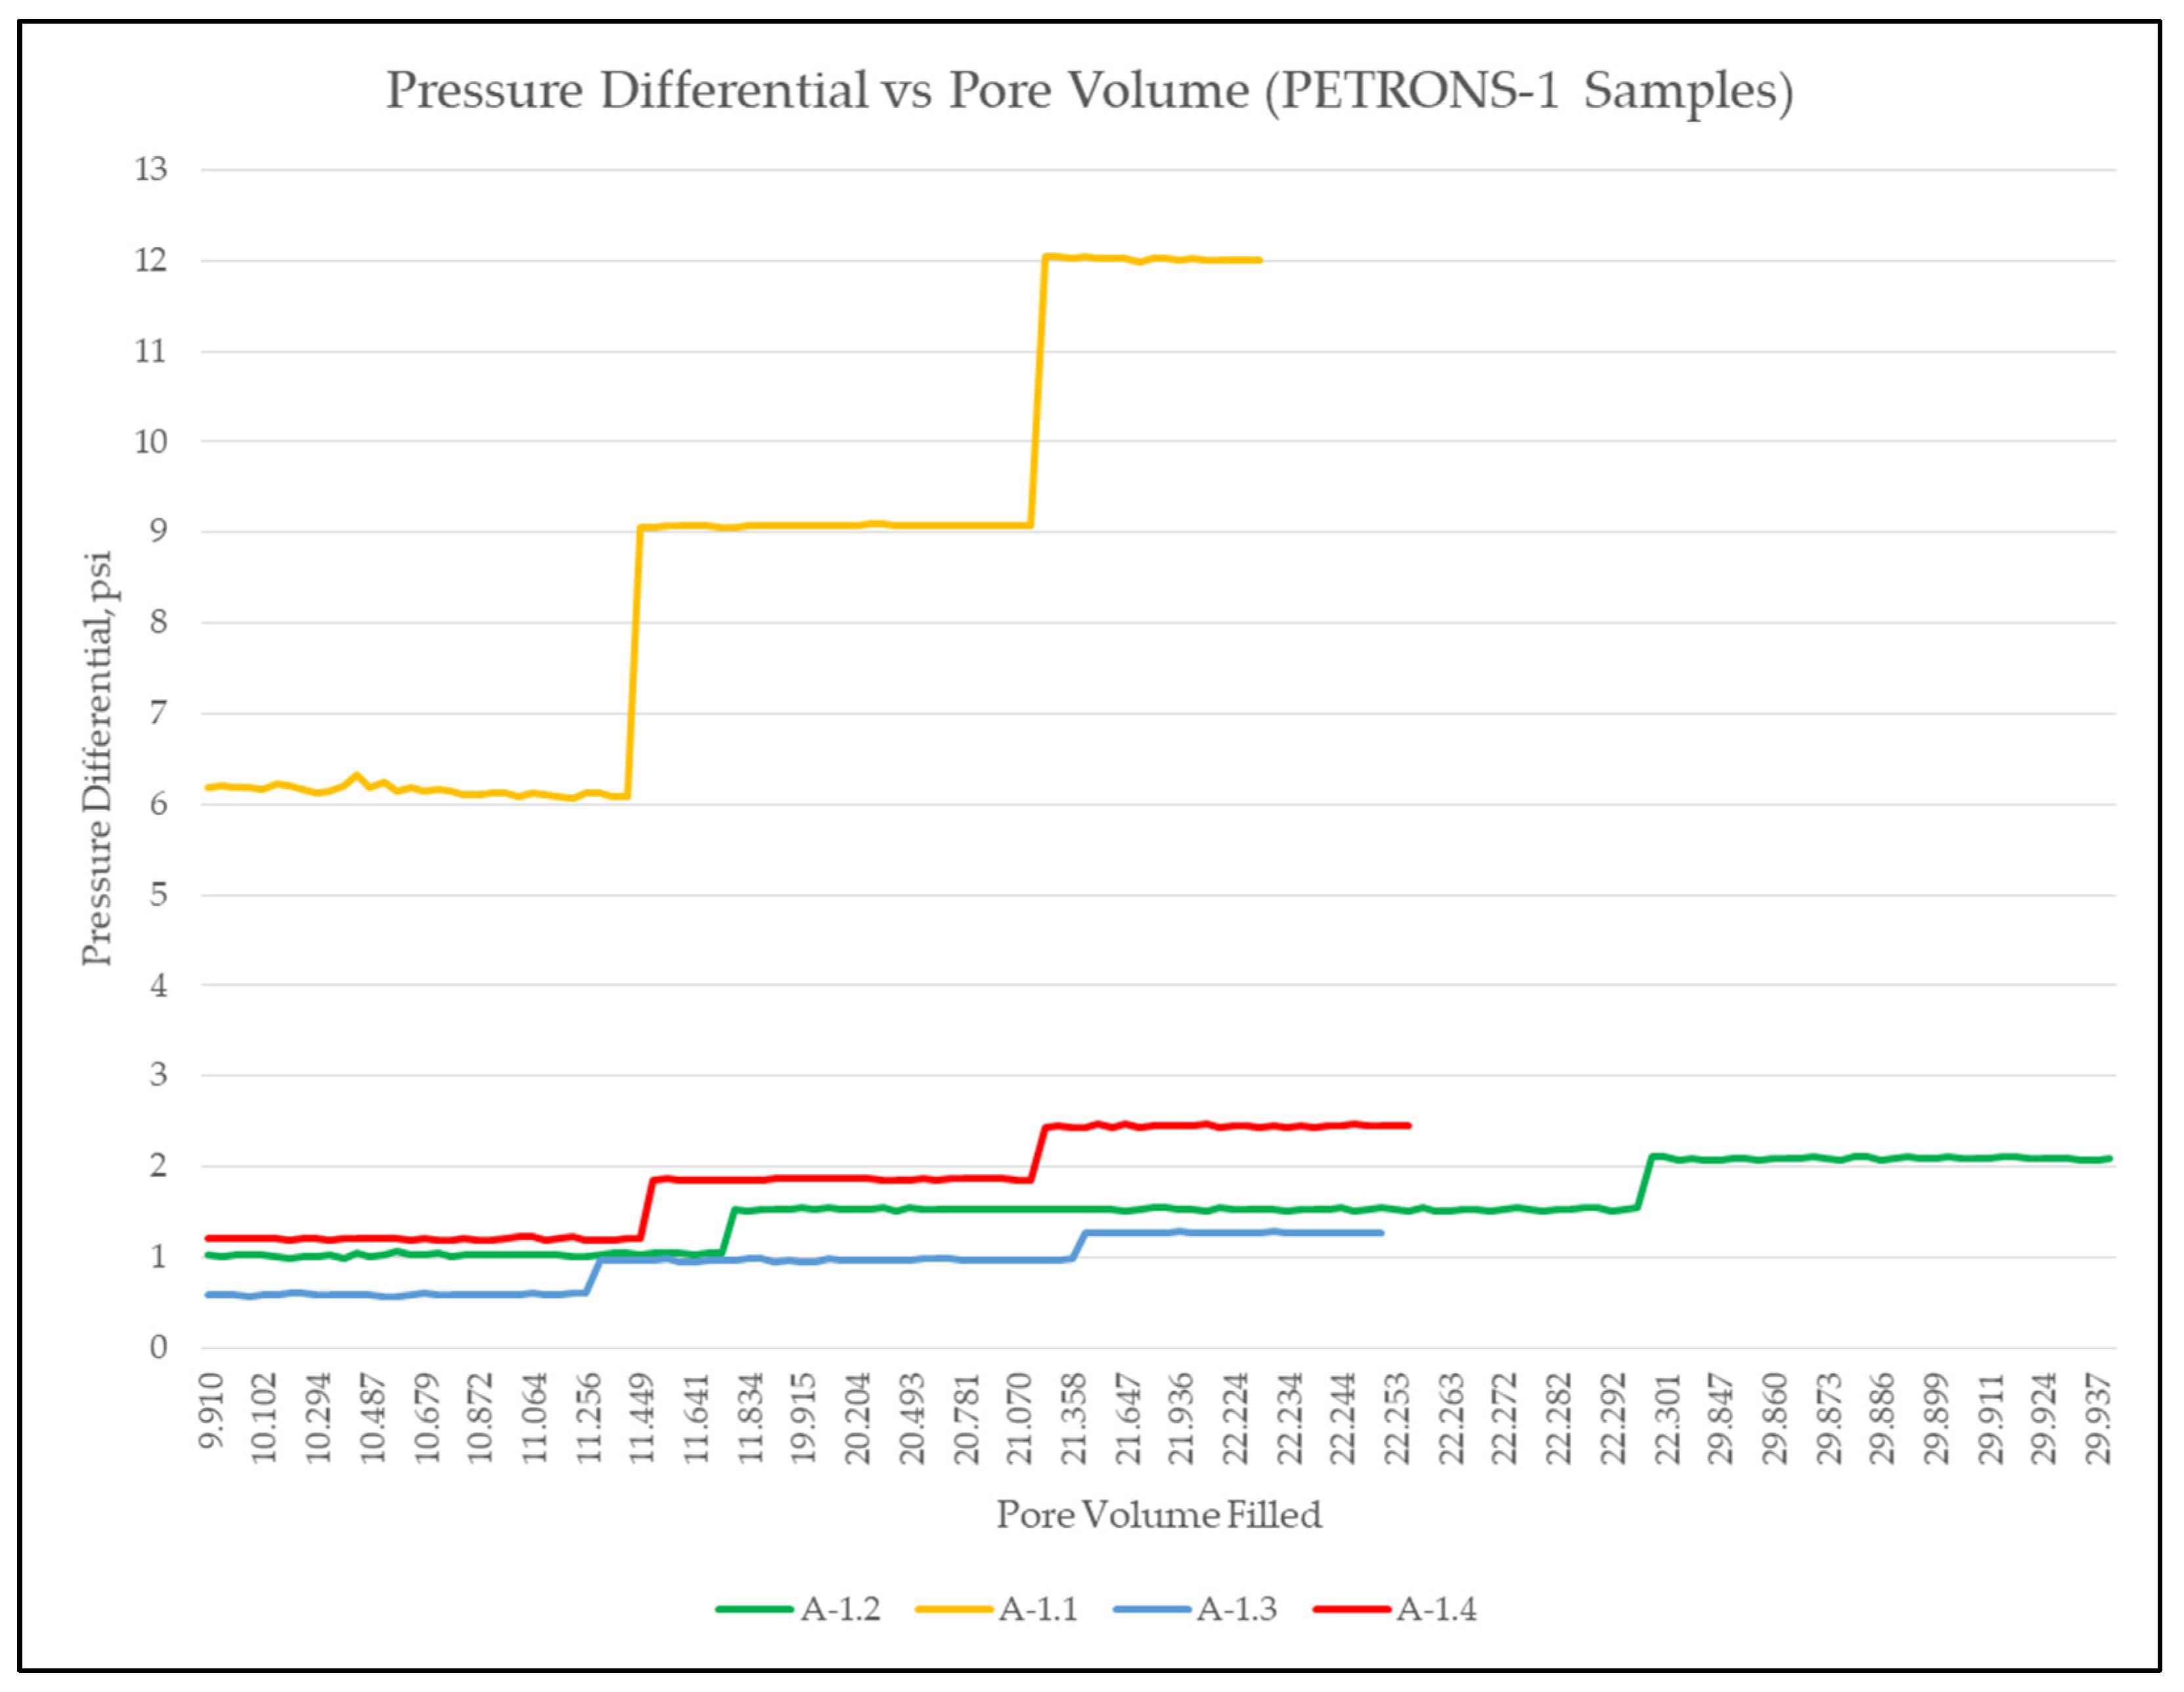
2.3.4. Water Flooding

After setting up the core plug in the core holder safely and building up the confining pressure to 800 psi, the confining pressure valve was locked, then the system line from one end to the other end was flushed using brine without passing through the core sample. This particular step is important to flush the line for any gas or contaminants trapped in the line that may interfere with the pressure differential measurements. After completing the flushing process, and the system line was clear from any trapped gas or contaminants, the water injection process was begun. Due to the concept of gravity, the brine was injected from the top of the core so that the brine can flow from the top to the bottom of the core.
In order to obtain a more representative value of permeability, the core sample was exposed to three different brine injection rates (1.0 cc/min, 1.5 cc/min and 2.0 cc/min). For all the injection rates, the brine was injected until a stable pressure differential trend was obtained.

3. Results

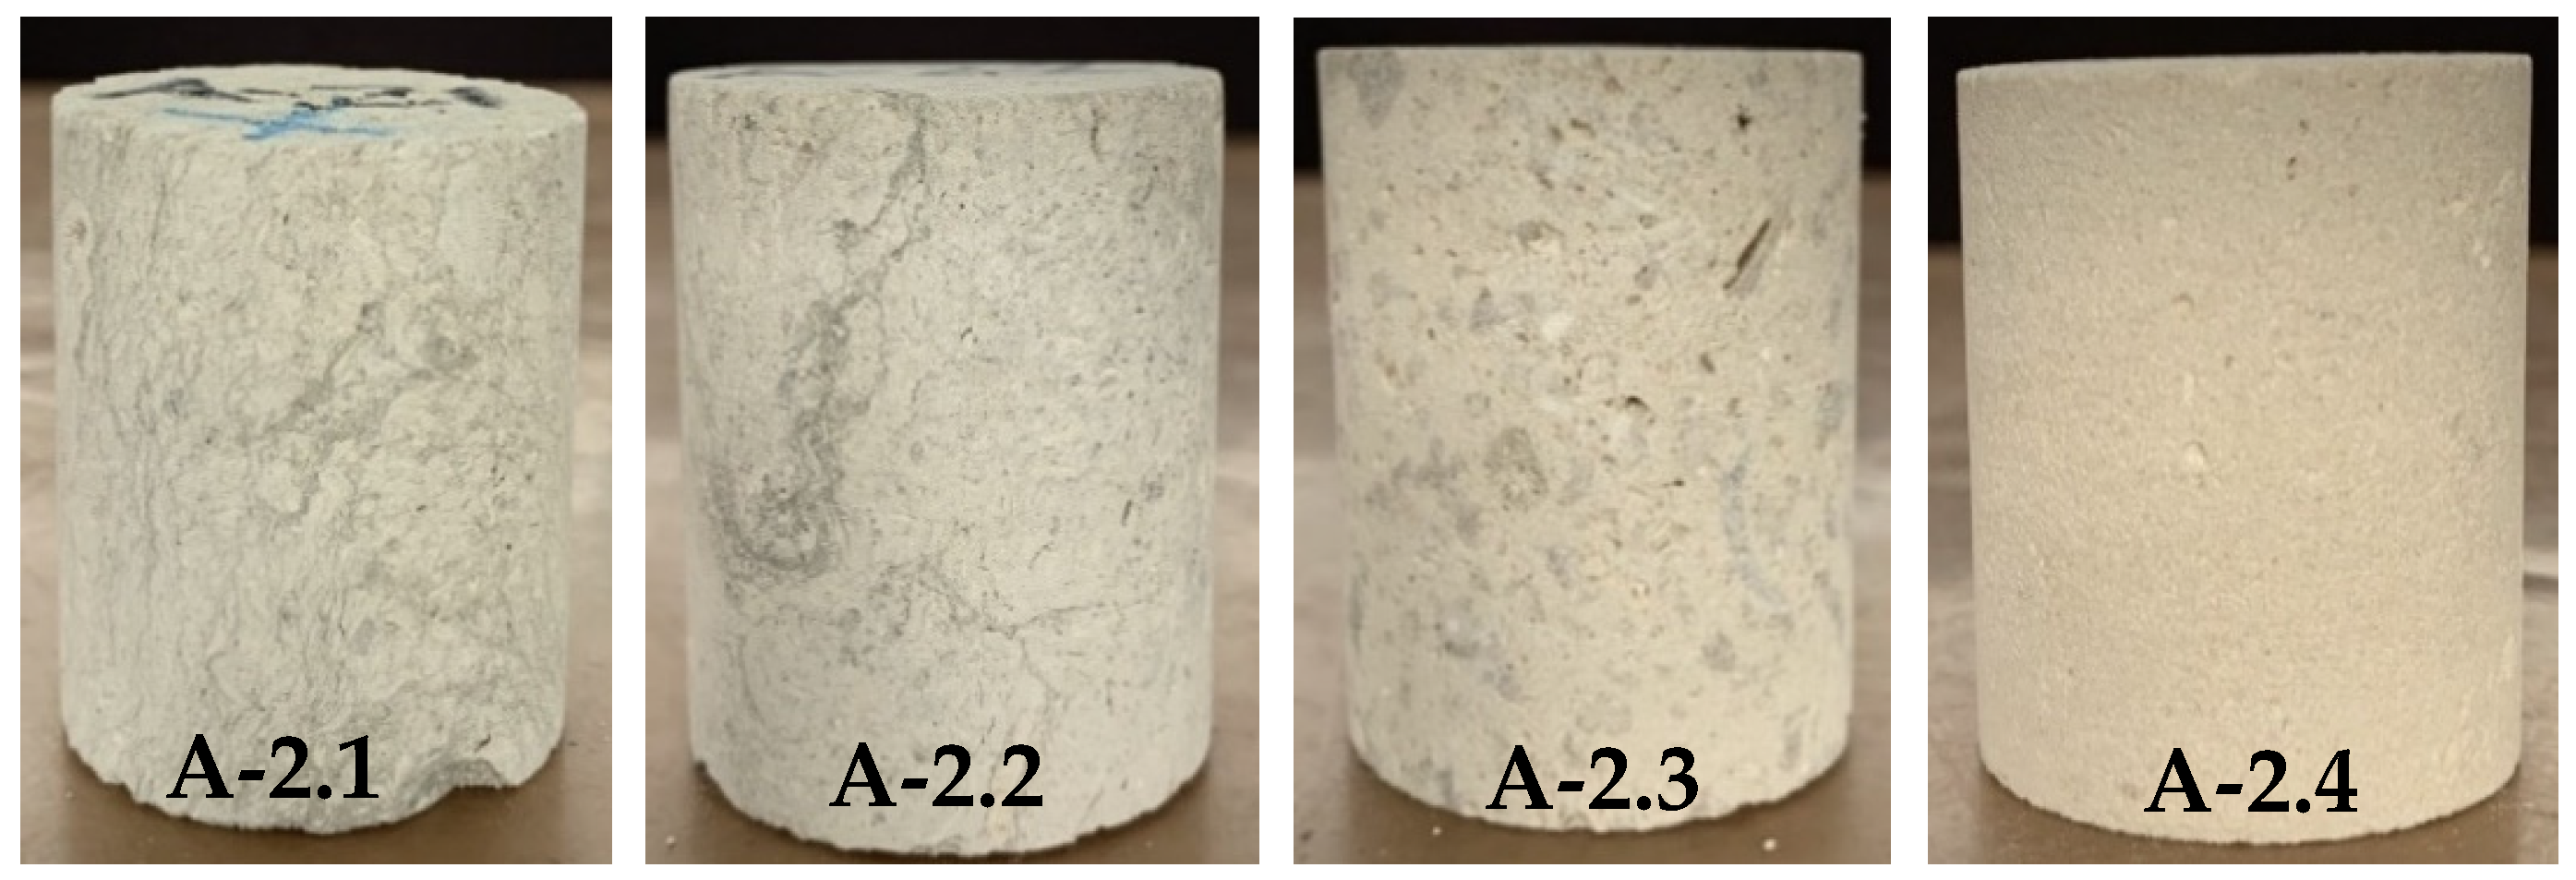
3.1. Core Samples Background

The required core samples were obtained from PETRONAS Geo-Sample Center (PGSC). The core samples were selected randomly across all depths to have representations across all depths. A total of eight core samples were selected from two wells, namely PETRONS-1 and PETRONS-2 from PETRONS carbonate field as shown in Figure 1 and Figure 2 and Table 1 below.
Based on Table 2, the major lithofacies of the four PETRONS-1 (A-1.1, A-1.2, A-1.3, A-1.4) and two PETRONS-2 (A-2.3, A-2.4) samples are categorized as mouldic–chalikified limestone and mouldic limestone, which has very good reservoir quality and is characterized by a whitish to yellowish color that can be seen in Figure 1 and Figure 2. The samples are generally homogeneous and have a very fine- to medium-grained matrix and are dominated by algae or/and coral fragments with an abundance of foraminifers that have been partially or completely leached. On the other hand, there are 2 PETRONS-2 samples that are categorized as argillaceous limestone. This lithofacies is characterized by light gray to dark bluish color due to its high argillaceous or clay content, which can be seen on sample A-2.1 and A-2.2 pictures in Figure 2. The argillaceous component varies between 1–20%, depending on the prevalent depositional environment. Algae mainly dominate these facies, and occasionally by platy and massive coral fragments. The nature and composition of this lithofacies indicates a reduction in carbonate sedimentation rates and was deposited in deeper parts of the back reef, fore reef or off reef in deeper open marine environments of water depths up to 60 m. They were subjected to porosity-destroying compactional processes, characterized by extensive closely-spaced stylolites and dissolution seams, resulting in poor reservoir development [27].

3.2. FESEM and EDX Analaysis

Energy-dispersive X-ray (EDX) analyses are shown in Figure 3, Figure 4 and Figure 5. The elements presented in the EDX analysis represent a specific mineral as described in the final FESEM-EDX report. The figures clearly show that the PETRONS samples are limestone since there is more than 50 wt% calcite minerals present in the samples. There is also significant presence of quartz minerals present in all samples. Samples A-2.1 and A-2.4 reports the presence of clay minerals such as kaolinite. Even though the amount of clay minerals present in the samples are significantly low, however the problems of fines migration due to interaction of clay minerals with water cannot be ruled out.
Figure 6, Figure 7, Figure 8 and Figure 9 shows the FESEM images. It can clearly be seen that the substantial amount of fine secondary quartz particles are attached to calcite particles, which are highly susceptible to fines migration problem during water permeability measurement. It can also be observed that there are an abundance of micro-pores and micro-cracks less than 2 µm present, which can hinder the flow of water through the micro-pores and micro-cracks, resulting in a reduction in water permeability values. Due to the effectiveness of gas at passing through the micro-pores, it can cause differences between the Klinkenberg-corrected and water permeability values of these samples.
Based on Figure 6 and Figure 8, large blocky calcite particles can be observed which were not affected by dissolution as the calcite particles contain sharp edges. Irregular surface and sharp-edged indentations are possible impressions from an adjoining wall of micrite. As stated earlier, Figure 6 shows good micro-porosity within micrite. However, in Figure 8, the blocky calcite particles are closely packed together showing characteristics of tight argillaceous limestone as described in Table 2 suggesting a low permeability sample. Samples A-1.3 and A-2.3 show more rounded edges showing signs of dissolution. The samples also show good micritic micro-porosity as stated earlier.

3.3. Klinkenberg-Corrected Permeability Measurement

Table 3 shows the findings of porosity and Klinkenberg-corrected permeability for the eight core plug samples.
Klinkenberg-corrected permeability for all eight samples are lower than gas permeability. These observations for the eight core samples shows that gas slippage did occur in the core plug samples during gas permeability measurements. The observed difference between gas permeability and Klinkenberg-corrected permeability are in the range of 4–16%. Furthermore, it is also observed that the lower the permeability of the sample, the higher the difference between gas and Klinkenberg-corrected permeability, which also means that the relationship between permeability and Klinkenberg constant is inversely proportional. This observation is in agreement with the conclusion from Jones (1972), which stated that Klinkenberg constant, b, reduces as intrinsic permeability, k, increases.

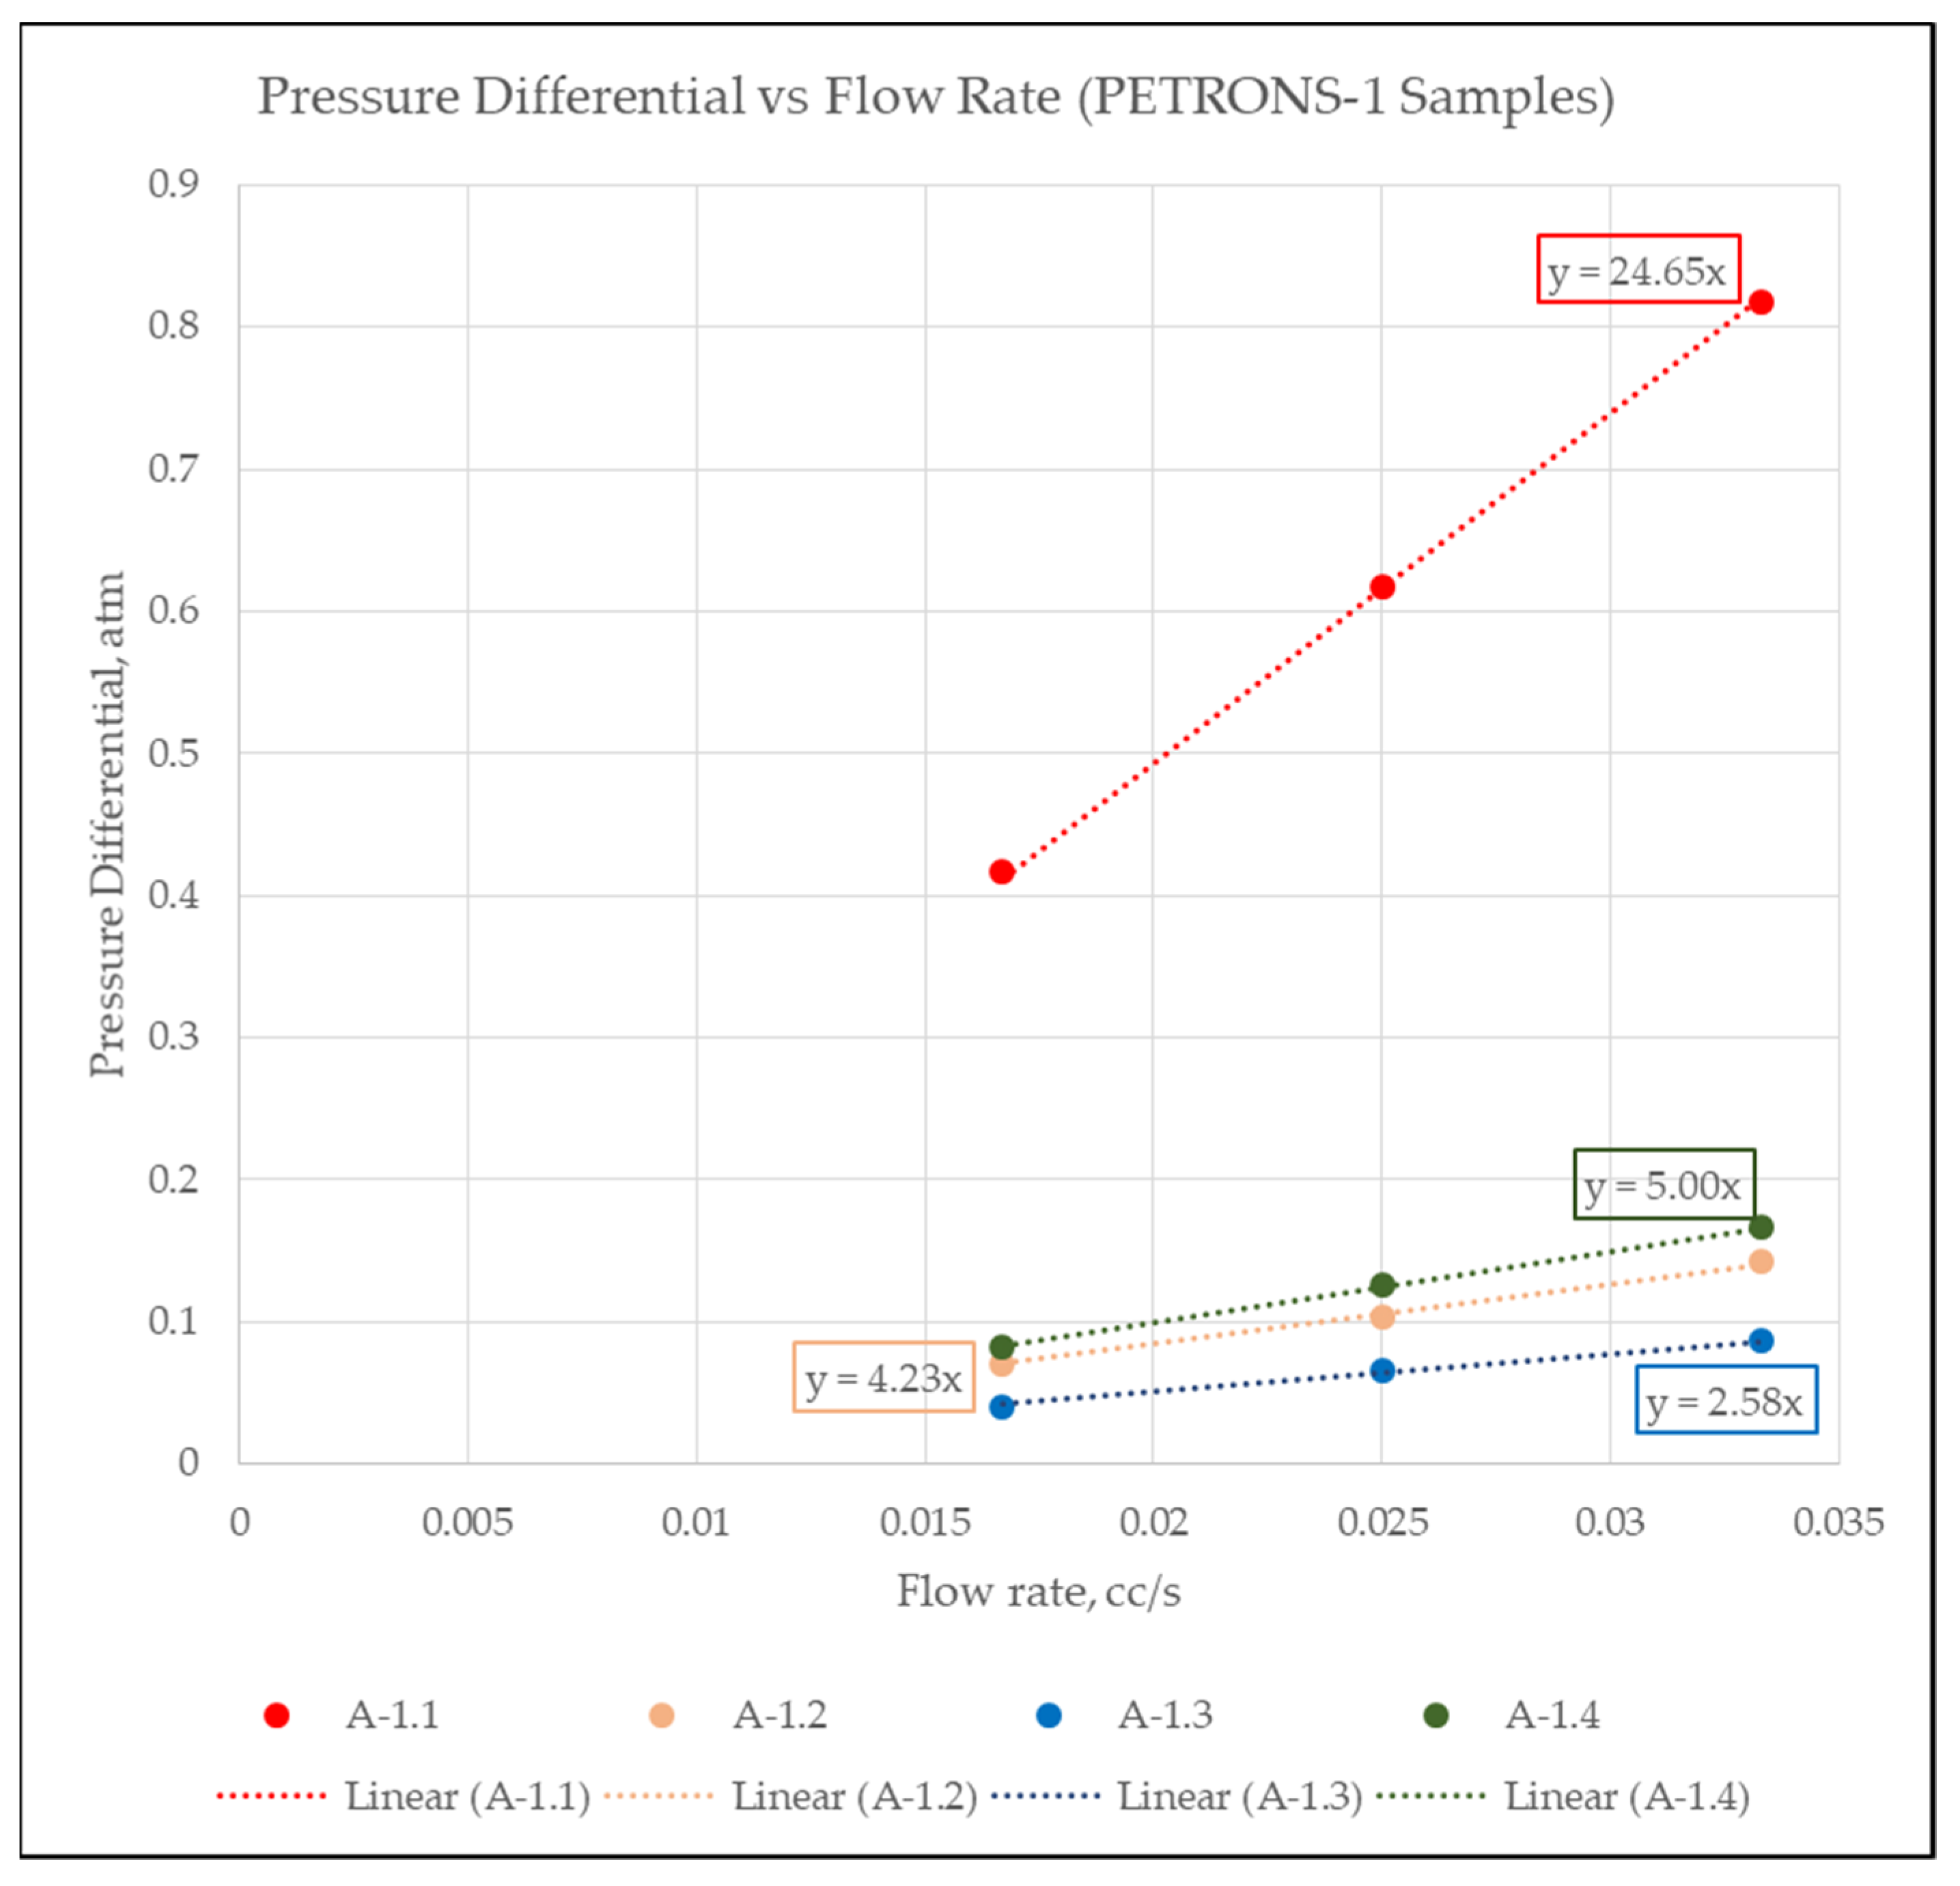
3.4. Water Permeability Results

All eight core samples were saturated with synthetic brine and weighed again to determine the pore volume of the core samples. After determining the weight of the core samples after being fully saturated with brine (WW), the weight of the lead and mesh used to wrap the core samples (WLM), the dry weight of core samples (DW) and the density of synthetic brine, the pore volume was calculated as shown in Equation (1):
Pore   Volume = ( WW WLM ) DW Density   of   synthetic   brine
Figure 10 and Figure 11 below illustrate the pressure differential plot against the pore volume of core samples filled with synthetic brine. The pore volume filled values were calculated by dividing the volume of brine injected at a specific point of time in cm3 by the volume of one pore volume of the core sample in cm3 as shown in Table 4. Thus, the pore volume filled at each time period of 30 s was calculated and used to plot these graphs. These figures show the stabilized pressure differential section of the injection routine at 1.0 cc/min, 1.5 cc/min, and 2.0 cc/min. The buildup section of the injection routine has been trimmed to reduce the length of the graphs.
Water permeability values of the core samples were calculated using Darcy’s equation as shown in Equation (2). Since brine was injected at three different flow rates for each sample, stable pressure differential values at each flow rate were recorded as shown in Table 5. It can be observed in Figure 12 and Figure 13 and Table 5 that as brine flow rate was increased, the average pressure differential value also increases. This is consistent with the principles of Darcy’s equation as shown in Equation (2), where brine flow rate, Q, is directly proportional to the pressure differential, ∆P.
k = Q µ L Δ PA
where:
  • k = liquid permeability, Darcies
  • Q = flow rate, cc/s
  • ∆P = pressure differential, atm
  • A = surface area, cm2
  • µ = viscosity, cp
  • L = length, cm
Table 5. Stabilized pressure differential values at each flow rate for all eight core samples.
Sample NumberBrine Flow Rate (cc/s)∆P (atm)Sample NumberBrine Flow Rate (cc/s)∆P (atm)
A-1.10.0170.417A-2.10.0170.707
0.0250.6180.0250.990
0.0330.8180.0331.240
A-1.20.0170.071A-2.20.0172.882
0.0250.1040.0254.332
0.0330.1420.0335.775
A-1.30.0170.040A-2.30.0173.456
0.0250.0660.0255.020
0.0330.0870.0336.502
A-1.40.0170.082A-2.40.0171.113
0.0250.1260.0251.645
0.0330.1660.0332.158
Referring to Equation (2), the value of area, A; viscosity, μ; and length, L are all constant across the experiment for each individual sample. The values of A, μ, L are as follows, A = 11.406 cm2, viscosity of brine, μ = 1 cp and the length of the core plug samples are according to the values in Table 1. Values of flow rate and its respective values of pressure differential for each sample were plotted on a Cartesian plane to find the average value of (∆P/Q) from the slope of the graph as shown in Figure 12 and Figure 13. Table 6 below shows the water permeability values of all eight core plug samples after the calculation based on Darcy’s equation.
Figure 12. Graph of pressure differential against brine flow rate for PETRONS-1 samples.
Fluids 06 00339 g012
Figure 13. Graph of pressure differential against brine flow rate for PETRONS-2 samples.
Fluids 06 00339 g013

4. Discussions

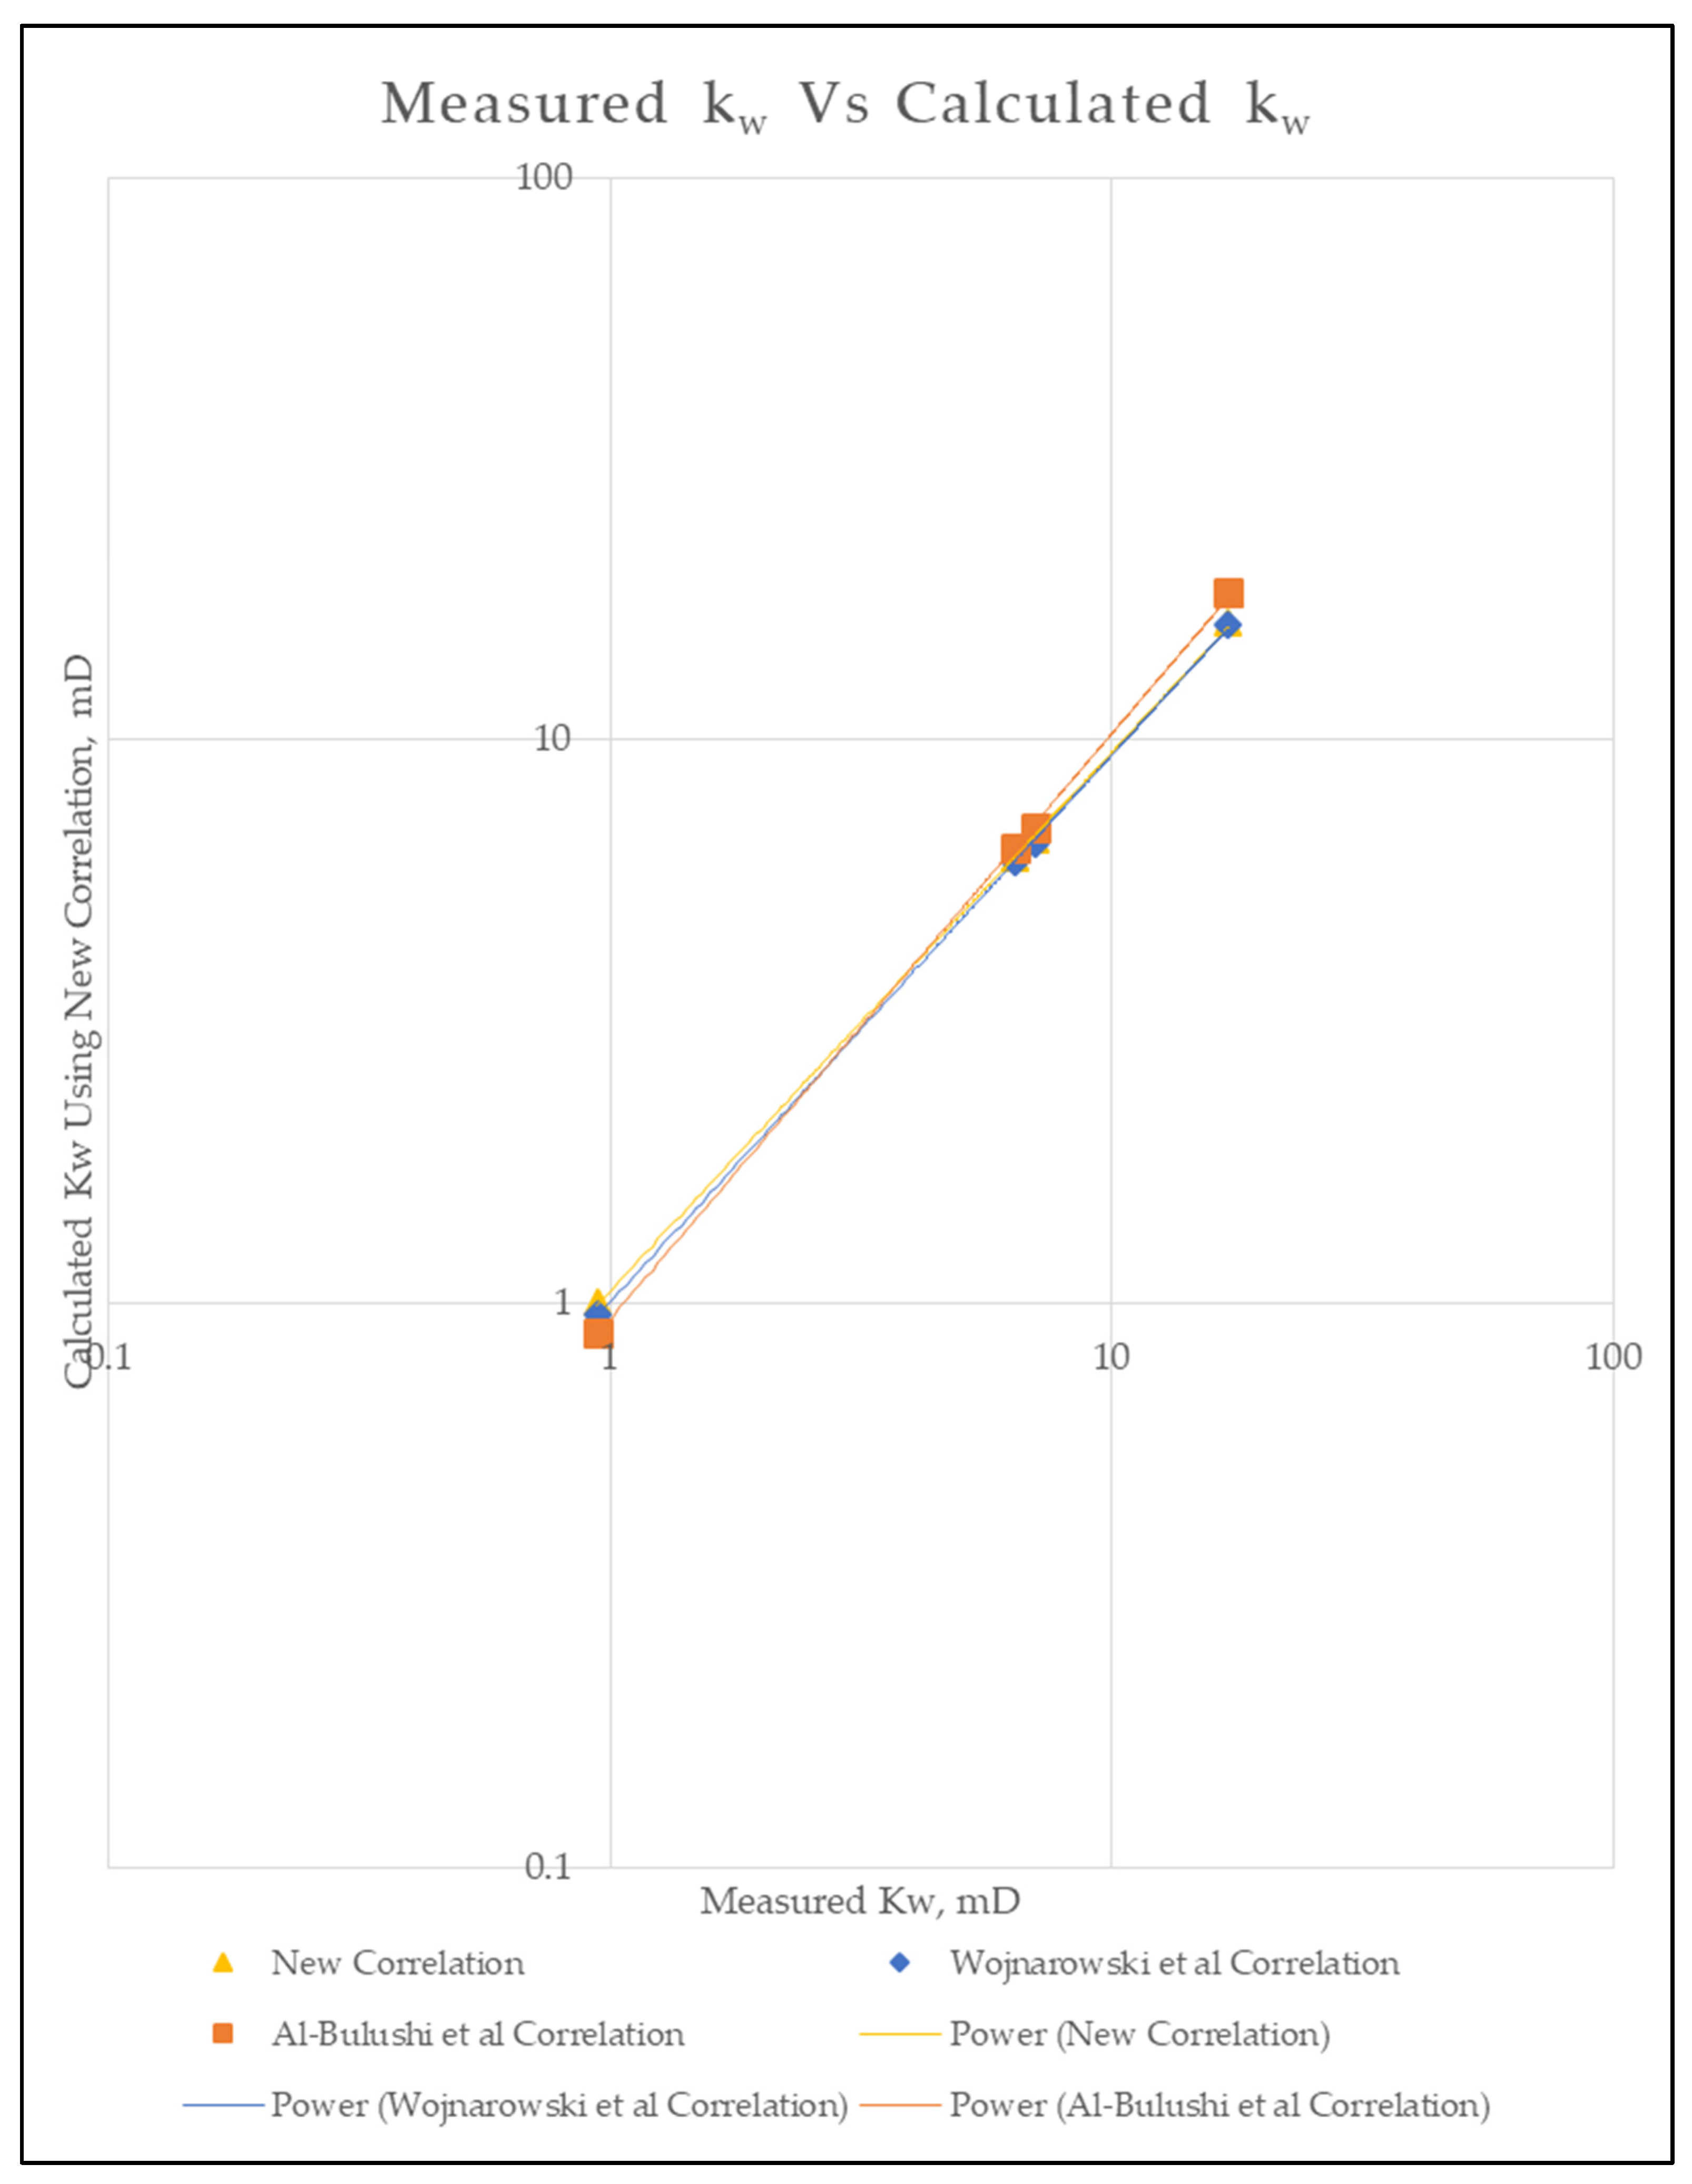
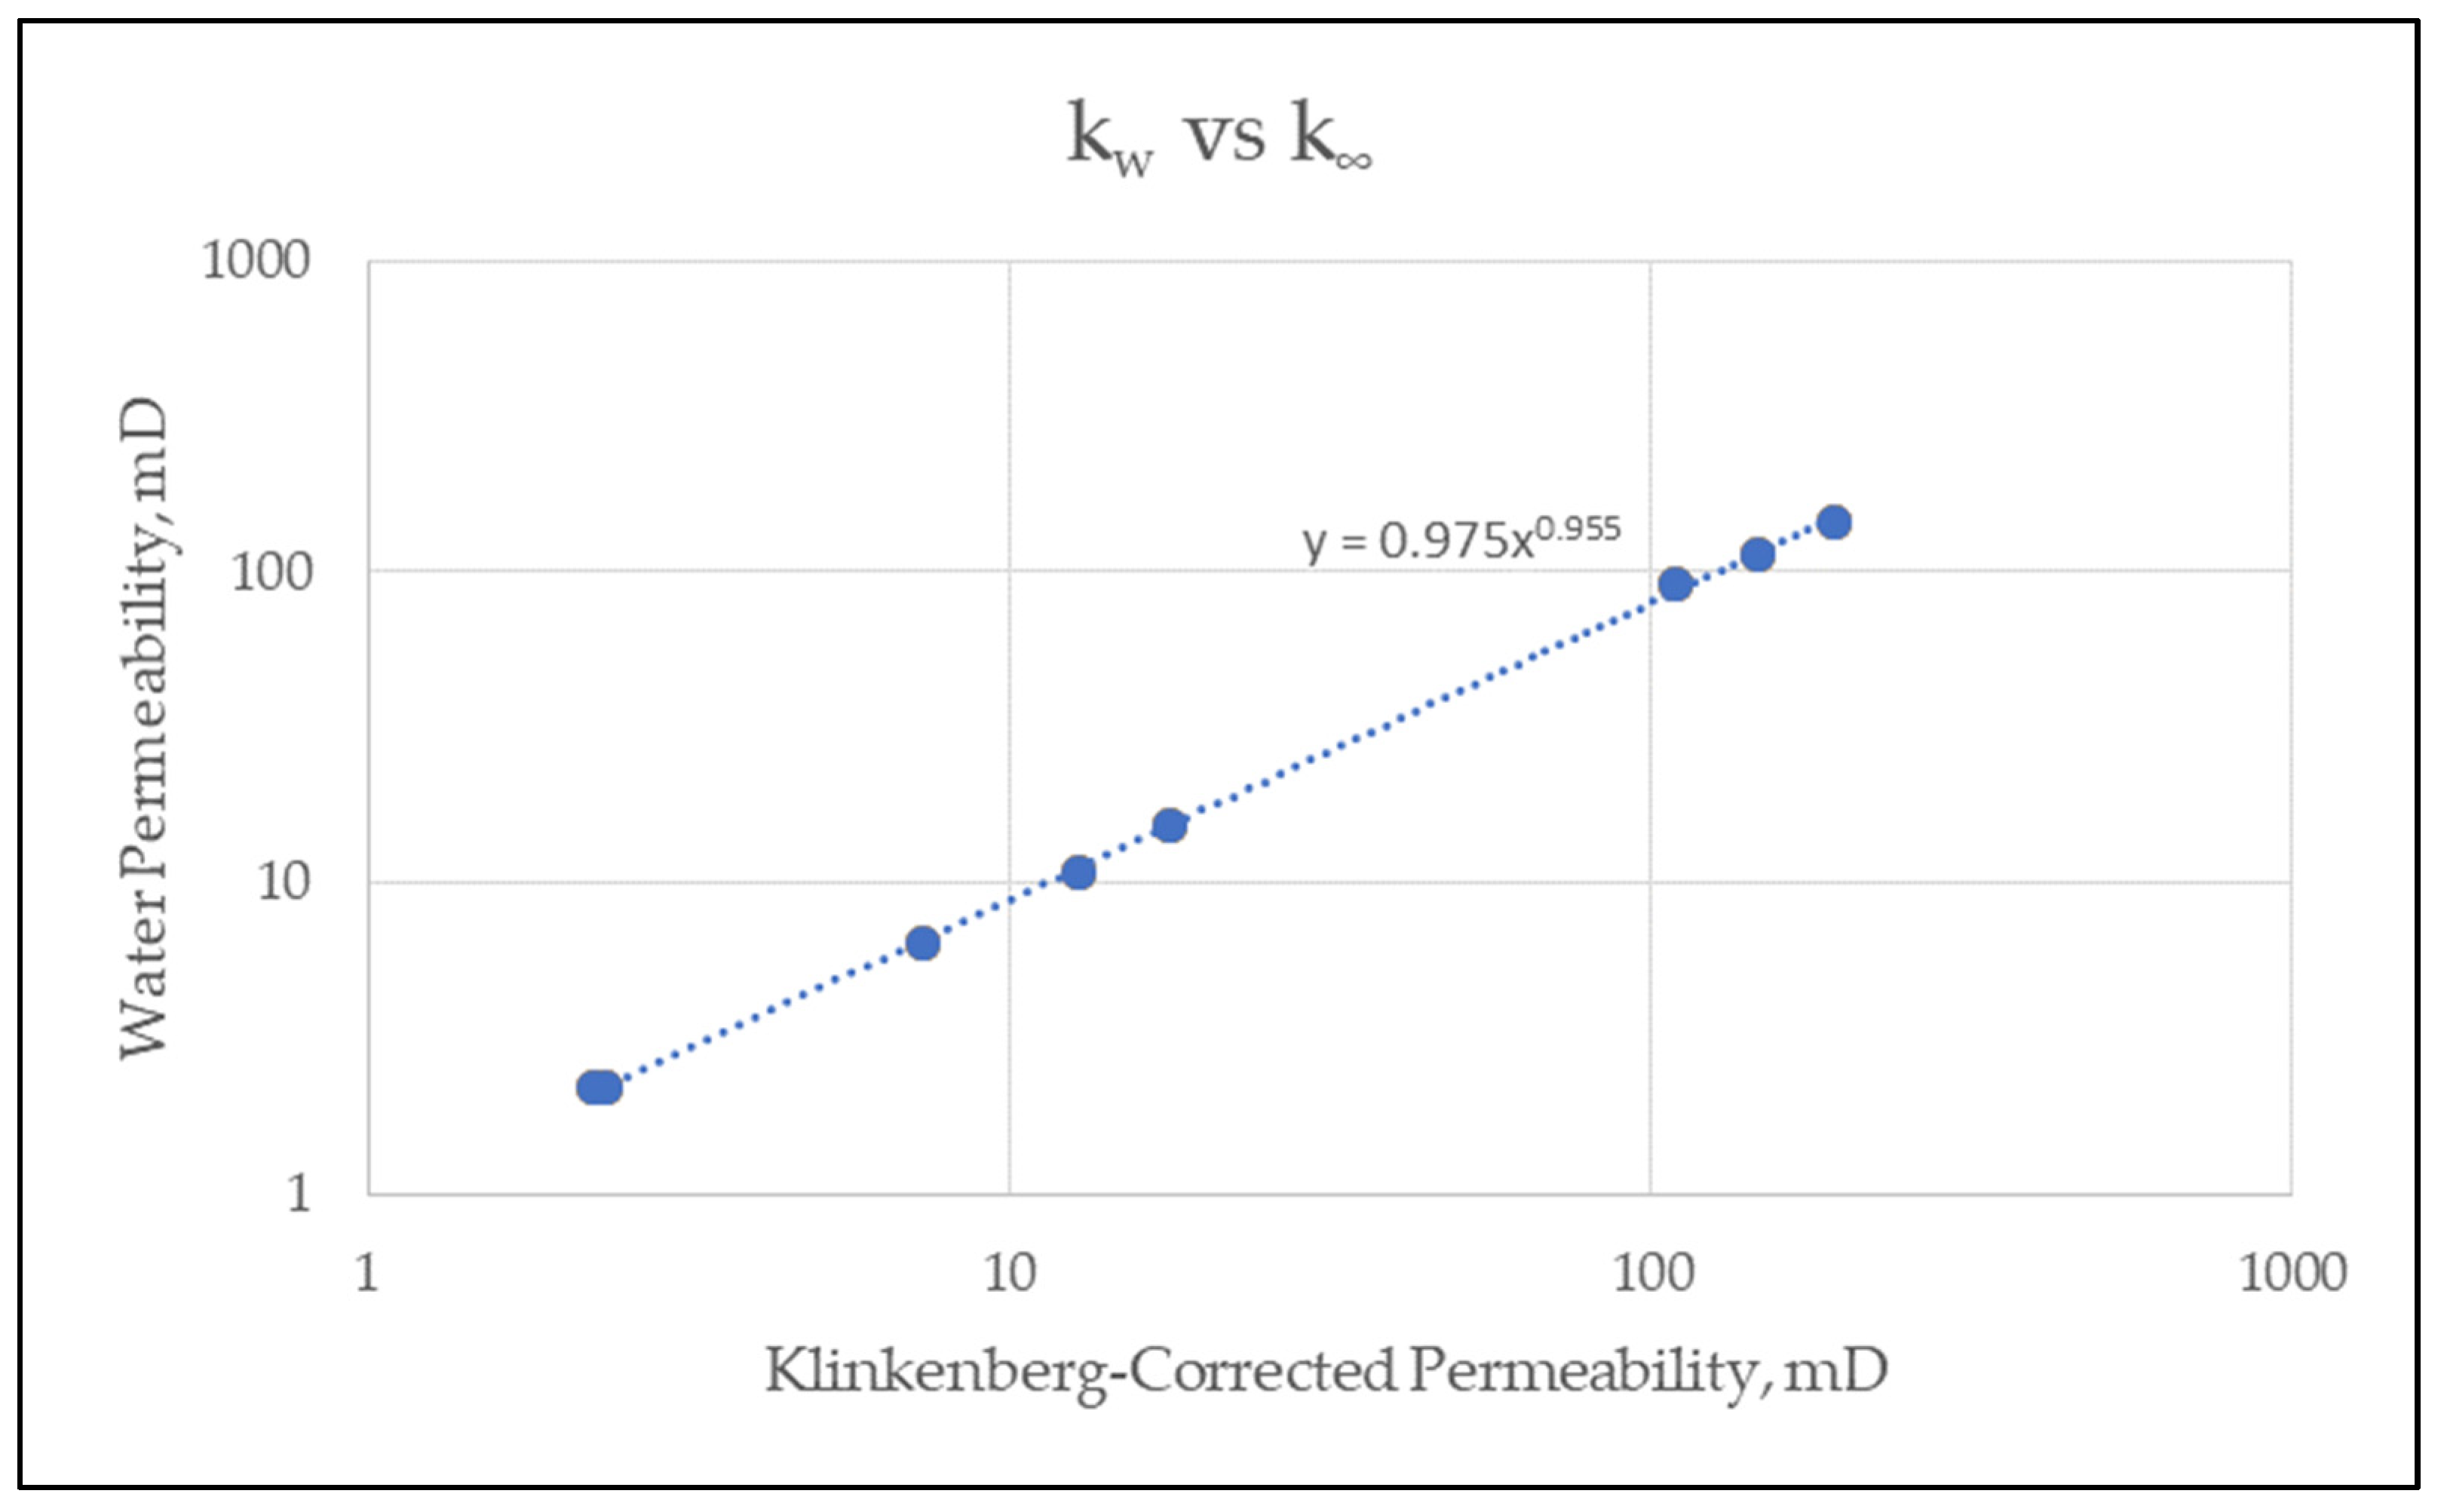
4.1. Correlation between Klinkenberg-Corrected Permeability and Water Permeability

Table 7 below shows the comparison between Klinkenberg-corrected and water permeability values for all eight core samples and the percentage difference between Klinkenberg-corrected and water permeability are observed to be in the range of 2–32%. Based on Figure 14, it is also observed that the higher the permeability of the sample, the higher the difference between Klinkenberg-corrected and water permeability.
Power regression was applied to obtain Equation (3), representing the correlation between Klinkenberg-corrected and water permeability values of PETRONS samples where the R2 = 0.9997.
k w = 0.975 k 0.955
The correlation given in Equation (3) describes the relationship between Klinkenberg-corrected permeability and water permeability of PETRONS core samples based on experimental results conducted on eight core plug samples. However, there are uncertainties associated with the number of samples used to develop the correlation. Thus, the robustness of the correlation was tested by using the permeability results from four PETRONS-2 core samples. The Klinkenberg-corrected and water permeability of the samples were measured in [28] during the borehole stability and compaction study on PETRONS-2 core samples. Water permeability values of the four core samples were calculated using the new correlation, a correlation by Wojnarowski et al. [10] and a correlation by Al-Bulushi et al. [1], based on their respective measured Klinkenberg-corrected permeabilities and the percentage difference from the measured water. Table 8 shows the values of measured and calculated water permeability of the four PETRONS-2 core samples.
Based on the values in Table 8 and the graph in Figure 15 the observed differences between the measured and calculated water permeability are in the range of 4.5–6.2% using the new correlation, 1.3–7.2% using the correlation from [10] and 0.6–6.6% using the correlation from [1], which shows that the percentage differences between measured kw and calculated kw using all three correlations are in a similar range. The observed differences may be because of different methods of measuring the water permeability. Since the number of samples used to develop the new correlation certainly does not fully represent the permeability characteristics of the PETRONS field, this correlation can certainly be a baseline towards developing a more representative and accurate correlation by including permeability values of more samples from the PETRONS field into the new correlation.

4.2. Factors Affecting Variations in Permeability Values

4.2.1. Effect of Fines Migration

The TSS results given in Table 9 shows the increment of fines present in the effluent after water permeability measurement in all studied samples. As stated earlier, this observation indicates that during water permeability measurement, fine particles and clay particles, especially kaolinite, detach from their original positions and migrate through the pore structure of the core plug samples. This observation certainly confirms the migration of fine and clay particles during water permeability measurement resulting in blocking of pore channels and becoming a factor for the reduction of water permeability values. Thus, one of the factors for the differences between Klinkenberg-corrected and water permeability values for PETRONS samples can be deduced due to fines and clay particles migration during water permeability measurement. The effect of micro-pores resulting in inaccessibility of water through the micro-pores will be discussed in the next sub-section.

4.2.2. Effect of Micro-Pores

References [25,27] reported visible porosity of up to 30%, which mainly consists of micro-pores in the pore structures of both PETRONS-1 and PETRONS-2 core samples. PETRONS-1 samples below the depth of 1635.5 m reported significant micro-pores that were probably preserved at an early stage of diagenesis. It was also reported that the micro-pores present in PETRONS-1 samples provided interconnection between mouldic and vuggy pores on a microscopic level, which will be very effective for the transmission of gas. Ali et al. [27] reported a high number of micro-pores together with less significantly present vuggy and moldic pores in PETRONS-2 core samples based on their thin section petrographic study on 80 selected PETRONS-2 samples. Figure 16 and Figure 17 show FESEM images of PETRONS-1 and PETRONS-2 core samples that clearly shows the presence of micro-pores within 1 µm thick between crystals of micrite in PETRONS-1 and PETRONS-2 samples, respectively, which will be effective for the flow of gases but inaccessible to water as reported in [25,27]. This observation is also supported by Wojnarowski et al. [10], who demonstrated that gas flows through a dual-network system (matrix + naturally induced fractures) so that the gas will cover more areas of the pore structure compared to water.
Furthermore, the adsorption of water on the surfaces of micro-pores due to its high surface tension and capillary forces reduces its effective radius and hinders water flow through the micro-pores present in the samples, which are only accessible to inert gases. Thus, clearly gas permeability of PETRONS-1 and PETRONS-2 samples will be higher even after Klinkenberg-correction when compared to water permeability because of inaccessibility of water particles to flow through the micro-pores present in PETRONS-1 and PETRONS-2 samples. In conclusion, the combination of the fines migration problem and the effect of micro-pores on the flow of water contribute as factors to the differences between Klinkenberg-corrected and water permeability in PETRONS-1 and PETRONS-2 samples.

5. Conclusions

Klinkenberg-corrected and water permeability values were measured using PETRONS-1 and PETRONS-2 core plug samples to study the differences between both permeability values and their factors. Klinkenberg-corrected permeability values were obtained from correcting the gas permeability values for slippage effect, while water permeability values were obtained using the unsteady-state core flooding method. FESEM-EDX analysis was conducted to examine the factors behind the difference between Klinkenberg-corrected permeability and water permeability. Water permeability values of PETRONS samples are lower than Klinkenberg-corrected permeability values in the range of 2–32% due to the inability of water to flow through micro-pores blocked by capillary forces. Furthermore, the migration of fines during water permeability measurement, which may block any pore throats and may also contribute to the reduction in water permeability values, thus contributing to the difference between both permeability values. Thus, a new k vs. kw correlation specifically for the PETRONS field was developed based on the experimental work conducted on eight core plug samples in the permeability range of 2–192 mD. The range of permeability values show the heterogenous nature of PETRONS field. This correlation could be useful for determining the absolute liquid permeability values from its Klinkenberg-corrected permeability value to be used for reservoir dynamic modelling PETRONS field. This method can reduce the cost and time needed to obtain more accurate absolute liquid permeability values. This approach can allow engineers to be able to conduct reliable long term production analyses and financial evaluations. However, more samples from PETRONS fields need to be included in the correlation, especially mid-range permeability samples to obtain a more inclusive and comprehensive correlation for PETRONS fields.

Author Contributions

Conceptualization, I.A. (Izzat Ahmad); Methodology, I.A. (Izzat Ahmad); Designing and Performing Experiments I.A. (Izzat Ahmad); Formal Analysis, I.A. (Izzat Ahmad); Investigation, I.A. (Izzat Ahmad); Data Curation, I.A. (Izzat Ahmad); Writing—Original Draft Preparation, I.A. (Izzat Ahmad), M.A.; Writing—Review & Editing, I.A. (Izzat Ahmad), M.A., I.A. (Imtiaz Ali); Visualization, I.A. (Izzat Ahmad); Supervision, M.A.; Project Coordination, I.A. (Izzat Ahmad); Project Administration, M.A.; Funding Acquisition, M.A. All authors have read and agreed to the published version of the manuscript.

Funding

This research was funded by Yayasan Universiti Teknologi PETRONAS, grant number 015LC0-085. The APC was funded by Yayasan Universiti Teknologi PETRONAS.

Acknowledgments

The authors would like to express their utmost gratitude to Yayasan Universiti Teknologi PETRONAS (Grant Number: 015LC0-085) for providing the generous funding to complete all experimental work throughout the MSc period. The author would also like to thank Malaysian Petroleum Management (MPM), PETRONAS Geo-Sample Center (PGSC) and Yasir Bashir from the Geoscience department, UTP, for their immense cooperation towards providing the samples, data, and support needed for this research.

Conflicts of Interest

The authors declare no conflict of interest. The funders had no role in the design of the study; in the collection, analyses, or interpretation of data; in the writing of the manuscript; or in the decision to publish the results.

References

  1. Al-Bulushi, I.R.; Al-Maamari, R.S.; Wilson, O.B. Brine versus Klinkenberg corrected gas permeability correlation for Shuaiba carbonate formation. J. Pet. Sci. Eng. 2012, 92, 24–29. [Google Scholar] [CrossRef]
  2. Al-Jabri, R.A.; Al-Maamari, R.S.; Wilson, O.B. Klinkenberg-corrected gas permeability correlation for Shuaiba carbonate formation. J. Pet. Sci. Eng. 2015, 131, 172–176. [Google Scholar] [CrossRef]
  3. Klinkenberg, L. The permeability of porous media to liquids and gases. In Drilling and Production Practice; American Petroleum Institute: Washington, DC, USA, 1941. [Google Scholar]
  4. Muskat, M. The flow of homogeneous fluids through porous media. Soil Sci. 1938, 46, 169. [Google Scholar] [CrossRef]
  5. McPhee, C.A.; Arthur, K.G. Klinkenberg permeability measurements: Problems and practical solutions. In Advances in Core Evaluation II: Reservoir Appraisal: Reviewed Proceedings; CRC Press: Boca Raton, FL, USA, 1991; pp. 371–392. [Google Scholar]
  6. Firouzi, M.; Alnoaimi, K.; Kovscek, A.; Wilcox, J. Klinkenberg effect on predicting and measuring helium permeability in gas shales. Int. J. Coal Geol. 2014, 123, 62–68. [Google Scholar] [CrossRef]
  7. Tanikawa, W.; Shimamoto, T. Klinkenberg effect for gas permeability and its comparison to water permeability for porous sedimentary rocks. Hydrol. Earth Syst. Sci. Discuss. 2006, 3, 1315–1338. [Google Scholar]
  8. Wu, Y.-S.; Pruess, K. Gas flow in porous media with Klinkenberg effects. Transp. Porous Media 1998, 32, 117–137. [Google Scholar] [CrossRef]
  9. Tanikawa, W.; Shimamoto, T. Comparison of Klinkenberg-corrected gas permeability and water permeability in sedimentary rocks. Int. J. Rock Mech. Min. Sci. 2009, 46, 229–238. [Google Scholar] [CrossRef] [Green Version]
  10. Wojnarowski, P.; Czarnota, R.; Janiga, D.; Stopa, J. Novel liquid-gas corrected permeability correlation for dolomite formation. Int. J. Rock Mech. Min. Sci. 2018, 112, 11–15. [Google Scholar] [CrossRef]
  11. Al-Muthana, A.S.; Ma, S.; Okasha, T. Best Practices in Conventional Core Analysis—A Laboratory Investigation. In Proceedings of the SPE Saudi Arabia Section Technical Symposium, Al-Khobar, Saudi Arabia, 10–12 May 2008. [Google Scholar]
  12. Bhandari, A.; Flemings, P.; Ramiro-Ramirez, S.; Hofmann, R.; Polito, P. Gas and liquid permeability measurements in Wolfcamp samples. Fuel 2018, 236, 11. [Google Scholar] [CrossRef]
  13. Bloomfield, J.; Williams, A. An empirical liquid permeability—Gas permeability correlation for use in aquifer properties studies. Q. J. Eng. Geol. Hydrogeol. 1995, 28, S143–S150. [Google Scholar] [CrossRef]
  14. Chen, M.; Li, M.; Wang, Y.; Zhao, J.-Z.; Xiao, W.-L. The permeability of fontainebleau sandstone to gases and liquids. Pet. Sci. Technol. 2016, 34, 845–852. [Google Scholar] [CrossRef]
  15. Gupta, S.P.; Pugh, V.J.; Thomas, D.C. Correlations of Liquid and Air Permeabilities for Use in Reservoir Engineering Studies. Log Anal. 1991, 32, 493–497. [Google Scholar]
  16. Heap, M.; Reuschlé, T.; Farquharson, J.; Baud, P. Permeability of volcanic rocks to gas and water. J. Volcanol. Geotherm. Res. 2018, 354, 29–38. [Google Scholar] [CrossRef]
  17. Macary, S.M. Conversion of Air Permeability to Liquid Permeabilities Extracts Huge Source of Information for Reservoir Studies. In Proceedings of the Middle East Oil Show and Conference, Manama, Bahrain, 20–23 February 1999. [Google Scholar]
  18. Mahesar, A.; Memon, K.R.; Tunio, A. Comparison of Klinkenberg-Corrected Gas and Liquid Permeability in Kirthar Fold Belt Tight Gas Sands. Mehran Univ. Res. J. Eng. Technol. 2017, 36, 957–964. [Google Scholar] [CrossRef] [Green Version]
  19. Loosveldt, H.; Lafhaj, Z.; Skoczylas, F. Experimental study of gas and liquid permeability of a mortar. Cem. Concr. Res. 2002, 32, 1357–1363. [Google Scholar] [CrossRef]
  20. Osman, A.M.; Halim, N.H.; Alwi, N.; Sedaralit, M.F.; Ibrahim, J.M.; Hamid, P.A.; Ohen, H.A. Investigation of Fine Migration, Clay Swelling and Injectivity problem during FAWAG Study in West Malaysia Oil Field. In Proceedings of the International Petroleum Technology Conference, Kuala Lumpur, Malaysia, 10–12 December 2014. [Google Scholar]
  21. Priisholm, S.; Nielsen, B.; Haslund, O. Fines migration, blocking, and clay swelling of potential geothermal sandstone reservoirs, Denmark. SPE Form. Eval. 1987, 2, 168–178. [Google Scholar] [CrossRef]
  22. Kanimozhi, B.; Thamizhmani, V.; Pranesh, V.; Senthil, S.; Selvakumar, T.A. Kaolinite fines colloidal flow in high temperature porous carbonate media during saline water injection. J. Pet. Sci. Eng. 2019, 175, 775–784. [Google Scholar] [CrossRef]
  23. Qajar, J.; Francois, N.; Arns, C.H. Micro-tomographic characterization of dissolution-induced local porosity changes including fines migration in carbonate rock. In Proceedings of the SPE EOR Conference at Oil and Gas West Asia, Muscat, Oman, 16–18 April 2012. [Google Scholar]
  24. Uli, D.A.; Mithani, A.H.; Ali, K.; Abu Mansur, R.B.; Masoudi, R.; Tewari, R.D.; Jirim, S.; Harith, Z.Z.T.; Mohammad, M.H.H.; Kanesan, T.; et al. Integrated Carbonate Field Management Using Forward Stratigraphic Modelling Approach: Case Study of a Field in Central Luconia. In Proceedings of the Asia Pacific Oil & Gas Conference and Exhibition, Jakarta, Indonesia, 17–19 October 2017. [Google Scholar]
  25. Clews, P.J.; Soo, D.; Veeriah, T. Final Report of Petrographic Study—PETRONS-1; Occidental Petroleum Malaysia LTD: Kuala Lumpur, Malaysia, 1993. [Google Scholar]
  26. Ngah, T.B.T. Geological Evaluation—PETRONS-2; PETRONAS Carigali Sdn Bhd: Kuala Lumpur, Malaysia, 1993. [Google Scholar]
  27. Ali, M.Y.; Aqrawi, A.; Ahmad, Z. An Integrated Sedimentological Study of PETRONS-2 Well; PETRONAS Carigali Sdn Bhd: Kuala Lumpur, Malaysia, 1997. [Google Scholar]
  28. Singh, S.P. Borehole Stability, Compaction, and Petrophysical Evaluation of the PETRONS-2 Well; PETRONAS Carigali Sdn Bhd: Kuala Lumpur, Malaysia, 1997. [Google Scholar]
Figure 1. PETRONS-1 core plug samples.
Fluids 06 00339 g001
Figure 2. PETRONS-2 core plug samples.
Fluids 06 00339 g002
Figure 3. EDX analysis of sample A-1.3.
Fluids 06 00339 g003
Figure 4. EDX analysis of sample A-2.1.
Fluids 06 00339 g004
Figure 5. EDX analysis of sample A-2.4.
Fluids 06 00339 g005
Figure 6. FESEM image of sample A-1.1 before permeability measurement.
Fluids 06 00339 g006
Figure 7. FESEM image of sample A-1.3 before permeability measurement.
Fluids 06 00339 g007
Figure 8. FESEM image of sample A-2.1 before permeability measurement.
Fluids 06 00339 g008
Figure 9. FESEM image of sample A-2.3 before permeability measurement.
Fluids 06 00339 g009
Figure 10. Graph of pressure differential against pore volume filled for PETRONS-1 samples.
Fluids 06 00339 g010
Figure 11. Graph of pressure differential against pore volume filled for PETRONS-2 samples.
Fluids 06 00339 g011
Figure 14. Graph of kw against k of eight PETRONS core samples.
Fluids 06 00339 g014
Figure 15. Graph of comparison between measured kw vs. calculated kw of PETRONS-2 core samples using different correlations.
Fluids 06 00339 g015
Figure 16. FESEM image showing the presence of micro-pores of sample (a) A-1.1, (b) A-1.2, (c) A-1.3 and (d) A-1.4.
Fluids 06 00339 g016aFluids 06 00339 g016b
Figure 17. FESEM image showing the presence of micro-pores of sample (a) A-2.1, (b) A-2.2, (c) A-2.3 and (d) A-2.4.
Fluids 06 00339 g017
Table 1. Core plug samples from PETRONS-1 and PETRONS-2 wells used in the current study.
Well NameSample NumberDepth (m)Dry Weight (g)Diameter (in)Length (in)
PETRONS-1 A-1.11636.5599.381.51.68
PETRONS-1A-1.21641.55109.891.52.17
PETRONS-1A-1.31688.7482.911.51.69
PETRONS-1A-1.41694.87113.451.52.04
PETRONS-2A-2.11654.80118.451.51.86
PETRONS-2A-2.21655.70115.171.51.70
PETRONS-2A-2.31696.24115.381.51.97
PETRONS-2A-2.41730.53114.251.51.89
Table 2. Lithosfacies and microfacies of PETRONS-1 and PETRONS-2 core samples.
Sample NumberDepth (m)Core LithofaciesCore Microfacies
A-1.11636.55MouldicForaminiferal Algal Coral Packstone/Floatstone
A-1.21641.55Mouldic–ChalkifiedForaminiferal Algal Coral Packstone/Floatstone
A-1.31688.74Mouldic–ChalkifiedForaminiferal Algal Packstone/Wackestone/Floatstone
A-1.41694.87Mouldic–ChalkifiedForaminiferal Wackstone/Packstone
A-2.11654.80ArgillaceousForaminiferal Algal Wackestone
A-2.21655.70ArgillaceousLarger Foraminiferal Wackestone/Packstone
A-2.31696.24Mouldic–ChalkifiedBioclastic Packstone/Grainstone
A-2.41730.53MouldicBioclastic Grainstone
Table 3. Porosity and Klinkenberg-corrected permeability results of PETRONS-1 and PETRONS-2 core samples.
Sample Numberkg (mD)k (mD)b (psi)
A-1.120.06317.7445.482
A-1.2153.501146.3142.062
A-1.3201.448192.6161.915
A-1.4118.591109.0213.689
A-2.114.59712.8145.847
A-2.22.7962.3428.152
A-2.32.7072.2618.274
A-2.48.4707.3506.408
Table 4. Values of WW, WLM, DW and pore volume of PETRONS core plug samples.
Sample NumberWet Weight with Wrapping (gm)Weight of Lead & Mesh (gm)Wet Weight (gm)Dry Weight (gm)Pore Volume (cm3)
A-1.1115.8134.925110.88899.38411.504
A-1.2136.3405.507130.833109.89220.941
A-1.3105.4404.889100.55182.91017.641
A-1.4134.2635.390128.873113.45215.421
A-2.1132.9805.127127.853118.4519.402
A-2.2126.5004.927121.573115.1656.408
A-2.3132.0305.333126.697115.37511.322
A-2.4129.7605.115124.645114.25110.394
Table 6. Water permeability values of all eight core plug samples.
Sample NumberAverage dP/Q (atm/cc/s)kw (mD)
A-1.124.65415.185
A-1.24.2326114.138
A-1.32.584145.563
A-1.45.00090.665
A-2.138.67510.723
A-2.2173.2602.186
A-2.3198.592.212
A-2.465.3726.424
Table 7. Klinkenberg-corrected permeability and water permeability values of PETRONS core samples.
Sample Numberk (mD)kw (mD)
A-1.117.74415.185
A-1.2146.314114.138
A-1.3192.616145.563
A-1.4109.02190.665
A-2.112.81410.723
A-2.22.3422.186
A-2.32.2612.212
A-2.47.3506.424
Table 8. Comparison between measured kw from published report and calculated kw from the new correlation, correlation from [10] and correlation from [1].
Calculation Using New Developed Correlation
Sample NumberMeasured k (mD)Measured kw (mD)Calculated kw (mD)Percentage
Difference
1P1.0280.9431.0016.158
2P18.7717.0516.0625.795
3P6.8656.4346.1434.515
4P7.477.066.6605.668
Calculation Using Correlation from [10]
Sample NumberMeasured k (mD)Measured kw (mD)Calculated kw (mD)Percentage
Difference
1P1.0280.9430.9551.312
2P18.7717.0516.0256.009
3P6.8656.4346.0366.188
4P7.477.066.5527.201
Calculation Using Correlation by [1]
Sample NumberMeasured k (mD)Measured kw (mD)Calculated kw (mD)Percentage
Difference
1P1.0280.9430.8895.711
2P18.7717.0518.1826.640
3P6.8656.4346.3940.619
4P7.477.066.9811.124
Table 9. Comparison of total suspended solids (TSS) on PETRONS brine & water permeability effluent of PETRONS samples.
SampleTSS (mg/L)SampleTSS (mg/L)
A-1 Brine2A-2 Brine10
A-1.17A-2.122
A-1.26A-2.214
A-1.312A-2.337
A-1.414A-2.426
Publisher’s Note: MDPI stays neutral with regard to jurisdictional claims in published maps and institutional affiliations.

